Article

TNFR1 and TNFR2 Expression and Induction on Human Treg Cells from Type 1 Diabetic Subjects

Immunobiology Laboratories, Massachusetts General Hospital and Harvard Medical School, Building 149, 13th Street, Rm 3502, Boston, MA 02129, USA
*
Author to whom correspondence should be addressed.
Antibodies 2015, 4(1), 34-47; https://doi.org/10.3390/antib4010034
Submission received: 21 January 2015 / Revised: 12 February 2015 / Accepted: 26 February 2015 / Published: 3 March 2015
(This article belongs to the Special Issue TNF in the Regulation of Immune Cells)

Abstract

:
Several autoimmune diseases are marked by a deficiency of soluble tumor necrosis factor (TNF). The TNF deficiency is caused in at least one autoimmune disease, multiple sclerosis, by an overabundance of TNF receptor 1 (TNFR1). Excess TNFR1 binds and inactivates TNF and this leaves less TNF bioavailable. This study sought to determine if expression of fresh or IL2-stimulated TNF receptors on Tregs cells, an important immunoregulatory cell involved in autoimmunity, is altered in type I diabetes. Standard fluorescence analysis was used to examine the levels of TNFR1 and TNFR2 on human Tregs in patients with type I diabetes (T1D) or controls. Fresh Tregs from T1D compared to control Tregs had identical levels of TNFR1. In marked contrast, Type 1 diabetic patients Treg cells had statistically elevated levels of TNFR2 compared to controls. Tregs stimulated with IL2 from both T1D and controls showed marked increase of TNFR2 expression in a dose-response manner, but the dose response increase in TNFR2 was significantly higher for T1D Treg cells. No IL2 dose-response was present for TNFR1 on either T1D or control Tregs exposed to IL2. A large study of serum for secreted levels of TNFR2 also revealed elevated circulating levels consistent with the elevated surface expression on Tregs. These findings suggest that abnormal regulation of TNFR2 expression with elevated cellular and secreted levels of TNFR2 is a characteristic of Type 1 diabetes. It is possible that the relative deficiency of TNF in type I diabetes, in contrast to multiple sclerosis, is caused by excess expression of TNFR such as TNFR2, a binding structure for inactivating TNF.

1. Introduction

Tumor necrosis factor (TNF) is the signature protein for the innate immune response. In response to microorganism invasion, the mammalian host immediately secretes TNF to kill or inactivate the microorganism. In addition to infection control, TNF, in the host, is also important for many beneficial immune effects. TNF is obligatory for survival of regulatory T cells (Tregs) and is able to kill autoreactive T cells (in the periphery) [1]. Deficiencies of TNF may drive diverse autoimmune diseases [2,3].

1.1. Supporting Evidence That TNF is Deficient in Many Autoimmune Diseases

Multiple autoimmune diseases are associated with too little TNF, most dramatically demonstrated by disease worsening with anti-TNF drug therapy. Evidence has accumulated from clinical trials that anti-TNF therapies can, under certain circumstances, promote rather than quell certain forms of autoimmunity. The evidence is strongest for multiple sclerosis (MS), with studies showing that anti-TNF therapies exacerbate its course. An early phase I safety trial of two patients revealed that one anti-TNF therapy transiently increased demyelinating lesions in the central nervous system (CNS) and immune activation in the cerebrospinal fluid (CSF) [4]. A double-blind, placebo-controlled phase II safety trial of 168 patients with MS found no benefit with another anti-TNF drug candidate and also found more frequent and earlier exacerbations. The annualized exacerbation rate was up to 50% greater in treated versus placebo patients [5]. MS and/or new onset demyelinating disease are also adverse events with the anti-TNF agent infliximab therapy in colitis and Crohn’s disease [6,7]. Infliximab therapy in 125 Crohn’s patients results, after 24 months, in a high cumulative incidence (57%) of patients developing antinuclear antibodies, two patients developing drug-induced lupus and one patient developing autoimmune hemolytic anemia [8]. In rheumatoid arthritis, therapy with TNF antagonists in all therapeutic forms is associated with relatively common and detectable autoimmune adverse events, including demyelinating disease, confirmed forms of MS, autoimmune hemolytic anemia, type 1 diabetes, a lupus-like syndrome, and cutaneous lupus rashes. Further, 11%–57% of patients develop new or elevated antinuclear antibodies, usually within 1 year of therapy initiation [8,9,10,11,12,13,14,15]. Approximately 7%–15% of patients develop new antibodies against double-stranded DNA [12,13].
Recently, a case of type I diabetes was reported in a 7-year old girl undergoing treatment for juvenile rheumatoid arthritis with a TNF antagonist [16]. The induction of new onset autoimmunity or the occasional worsening of autoimmunity is an apparent class effect of anti-TNF therapy and is not unique to any given TNF antagonist.

1.2. What Could Be The Reason for Low TNF in Autoimmunity?

Functionally low TNF activity or bioavailability might result from gene polymorphisms reducing TNF expression or disrupting its production. Low TNF activity also might result from excess production of soluble TNF receptors. Soluble TNF receptors can bind to and inactivate TNF, effectively lowering TNF levels available to bind to membrane-bound receptors, which is a necessary step for activating intracellular signaling pathways. Higher levels of circulating TNF receptors are found in association with lupus activity [17,18]. Higher levels of soluble TNF receptors have also been found in sera and synovial fluids of patients with rheumatoid arthritis [19]. One study reported that because soluble TNF receptors were much higher in lupus than RA patients, the relative TNF deficiency might be predicted to be more severe with lupus [18].
In MS, a unique TNFR1 polymorphism is observed and this allele is associated with susceptibility [20,21]. The function of the new polymorphism is to produce a new TNFR1 variant that is secreted and binds TNF [22]. In MS patients, early in the disease, excess TNF receptor shedding has been found in the blood suggesting lower bioavailability of TNF.
For type 1 diabetes, it is not known if too much soluble or membrane-bound, the normal precursor to soluble TNFR1 or TNFR2 is associated with the disease etiology. Dysregulation of TNF receptors is envisioned to be specific to one receptor only, like the MS findings.

1.3. Value of Tregs for the Prevention of Autoimmunity

Regulatory T cells, also known as Tregs, express Foxp3, an intracellular transcription factor that is an identifier of this unique cell population with surface CD4 expression and high levels of CD25 (the IL2 receptor) [23]. It is well established that having sufficient numbers, as well as functional, Tregs is essential for immune tolerance and the prevention of autoimmunity. Indeed early research identified human and murine models with FOXP3 gene mutations causing fatal autoimmune diseases and allergies [24,25].
Identifying better markers for Tregs, especially human Tregs, has been a challenge for the research community. It would indeed be worthwhile to identify Tregs by more cell surface receptors, especially to identify Tregs with the most potent function as suppressive cells. TNFR2, unlike the ubiquitous TNFR1 receptor, prominently identifies very potent and very functionally suppressive Tregs. Furthermore, TNFR2 expression on Tregs is 10-100x higher than TNFR1 expression [26,27]. It has recently been shown that CD4+CD25+ Tregs not only express but also shed large amounts of TNFR2. This shedding and increased expression of TNFR2 is associated with the Tregs ability to inhibit the action of TNF both in vitro and in vivo. As proposed by many increased expression and shedding of TNFR2 represents a novel mechanism by which Tregs can reduce the biological action of free soluble TNF [28]. This could lead instead to the TNFR2 complex with bound TNF, a complex that is the natural ligand for Treg expansion and immune suppression. It should be acknowledged that a confusing literature still exists on the role of TNF inducing or suppressing Tregs and some of this confusion may be due to differential signaling of TNF through the two distinct receptors TNFR1 versus TNFR2 [29,30].
Type 1 diabetes is an autoimmune disease marked by a functional paucity of TNF for autoreactive T cell selection and Treg survival [1,26]. Too many TNF receptors of either subtype under basal or stimulated conditions could be causing the lowered TNF levels. The purpose of this study is to use standard florescence analysis methods to examine human Tregs for the expression of TNF receptors, both in the setting of diabetic autoimmune disease compared to controls and also in stimulated conditions with IL2 exposures.

2. Results and Discussion

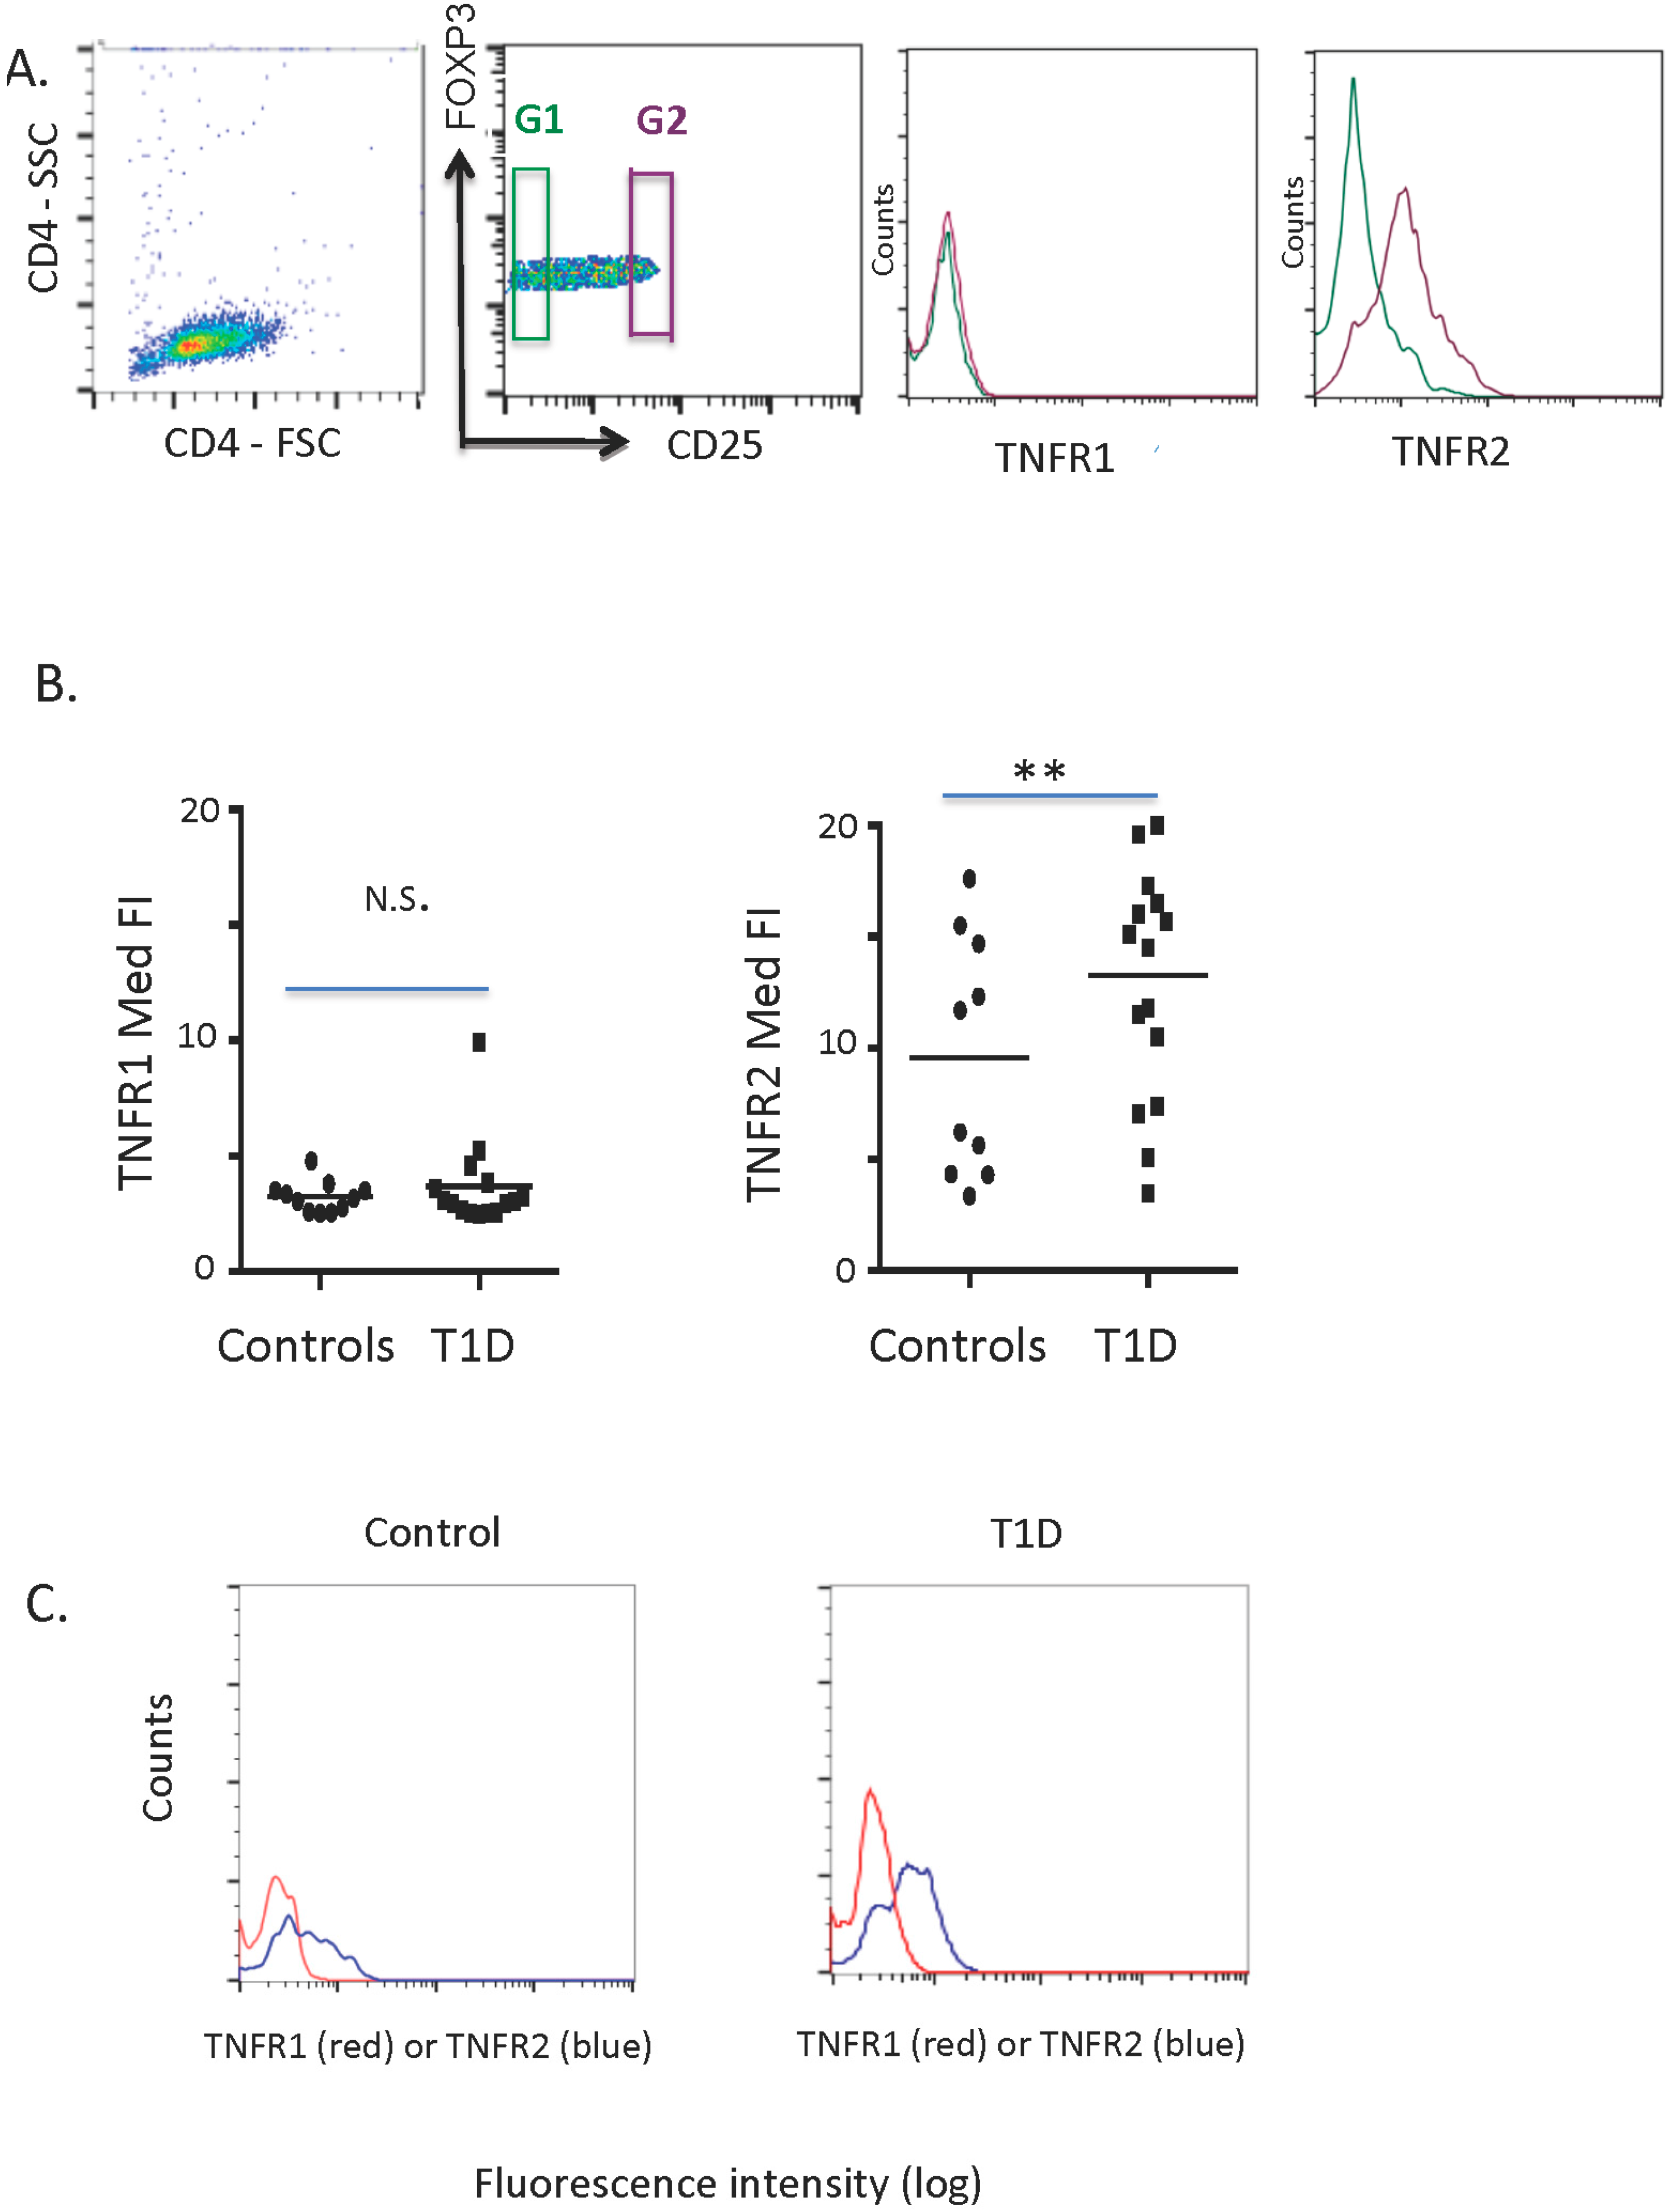
2.1. TNFR1 and TNFR2 Expression on Normal and Diabetic Subject Treg Cells

On staining of freshly isolated CD4 T cells for TNFR1 and TNFR2 expression, we confirmed previous murine and human studies reporting marked elevation in levels of TNFR2 on Tregs compared to modest levels of TNFR1 (Gate G2, Figure 1A) [26]. In contrast to the differential expression of TNFR2 and TNFR1 on Tregs, the staining of TNFR1 and TNFR2 on CD4-only T cells showed equivalent expression (Gate G1, Figure 1A).
We next looked at freshly isolated Tregs from diabetic and control subjects for unstimulated basal levels of TNFR1 and TNFR2. Levels of TNFR1 and TNFR2 were quantified by examining the median fluorescence intensity (Figure 1B). Type 1 diabetic subject Treg cells had statistically elevated levels of TNFR2 (p = 0.02; n = 18 T1D, n = 10 controls), but normal levels of TNFR1 (p = 0.95 n = 15 T1D, n = 11 controls). Individual curves of TNFR1 and TNFR2 from a control subject (Figure 1C, left) compared to a diabetic subject (Figure 1C, right) show the data as cell counts versus fluorescence intensity.

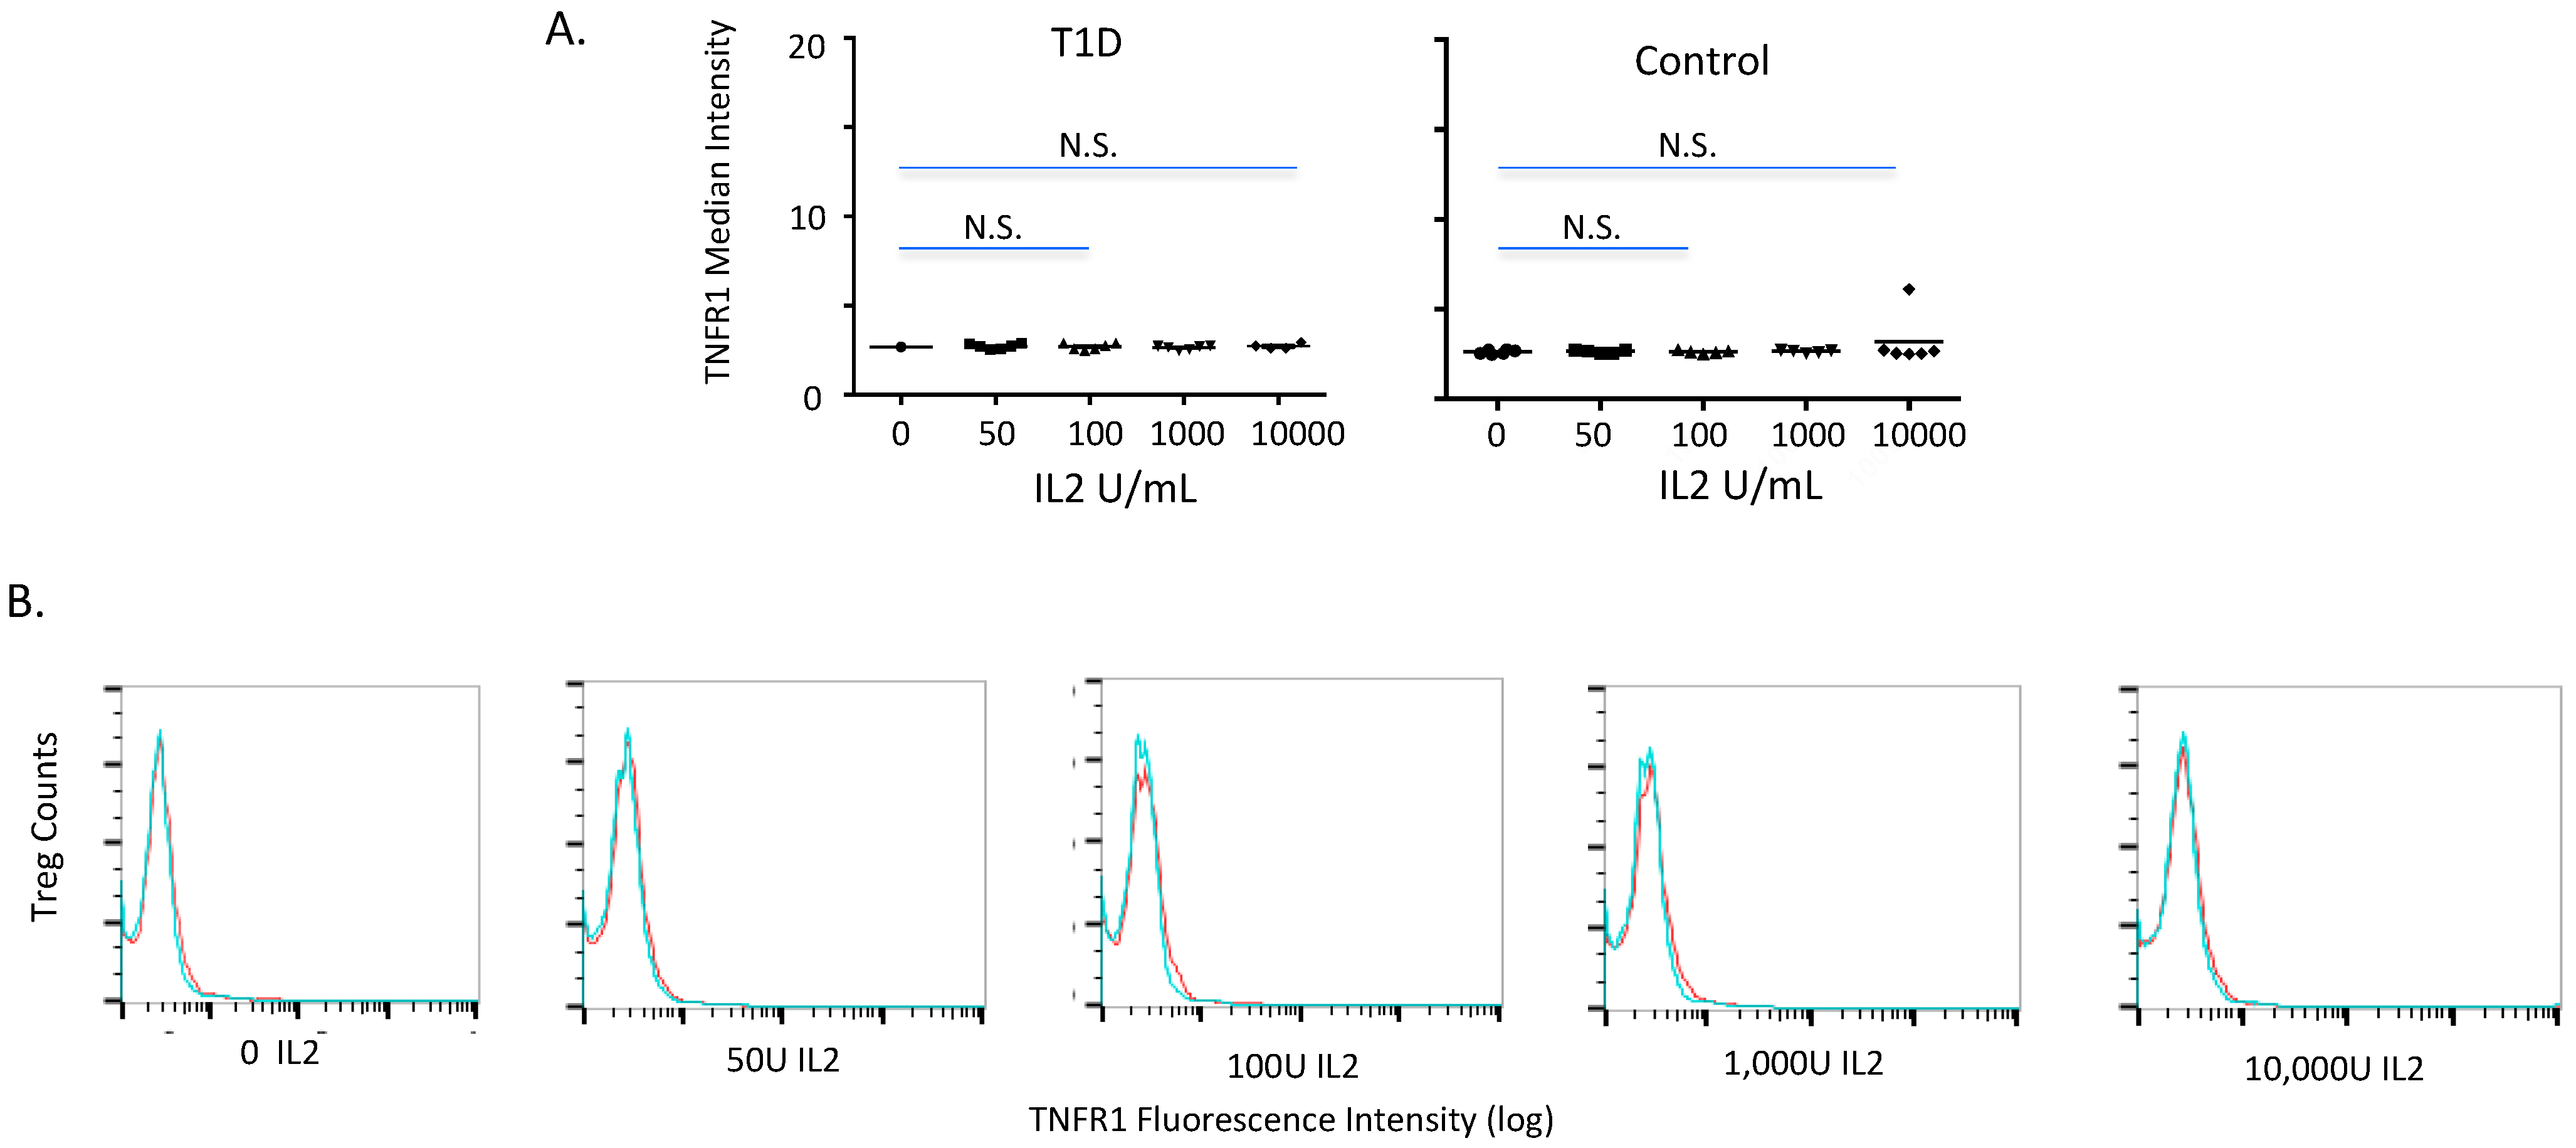
2.2. TNFR1 Expression on Normal and Diabetic Subject Treg Cells after IL2 Exposures

IL2 is important for Treg induction and maintenance in mice and humans [26,31]. To gain an appreciation of the IL2 response on diabetic and control Tregs, we cultured freshly isolated T lymphocytes with IL2 for 24 h at a dose of 0 to 10,000 Units/mL and stained the cells for Tregs and TNFR1 expression (Figure 2A). These IL2-treated CD4 T cells were compared, i.e., 6 normal control samples to 6 type 1 diabetic samples. We found no induction of Tregs, assessed by inducible FoxP3 and CD25hi expression, and we observed both in diabetic and control subjects no induction of the TNFR1 median fluorescence intensity (Figure 2A, p = NS). After IL2 exposures we found no difference in the Treg counts after 24 h in the numbers of TNFR1-expressing Tregs in controls nor type 1 diabetic patients (Figure 2B,C). Therefore with IL2 exposures the density of TNFR1 on human Tregs was not altered and this was the same trend observed in diabetic and control subjects.

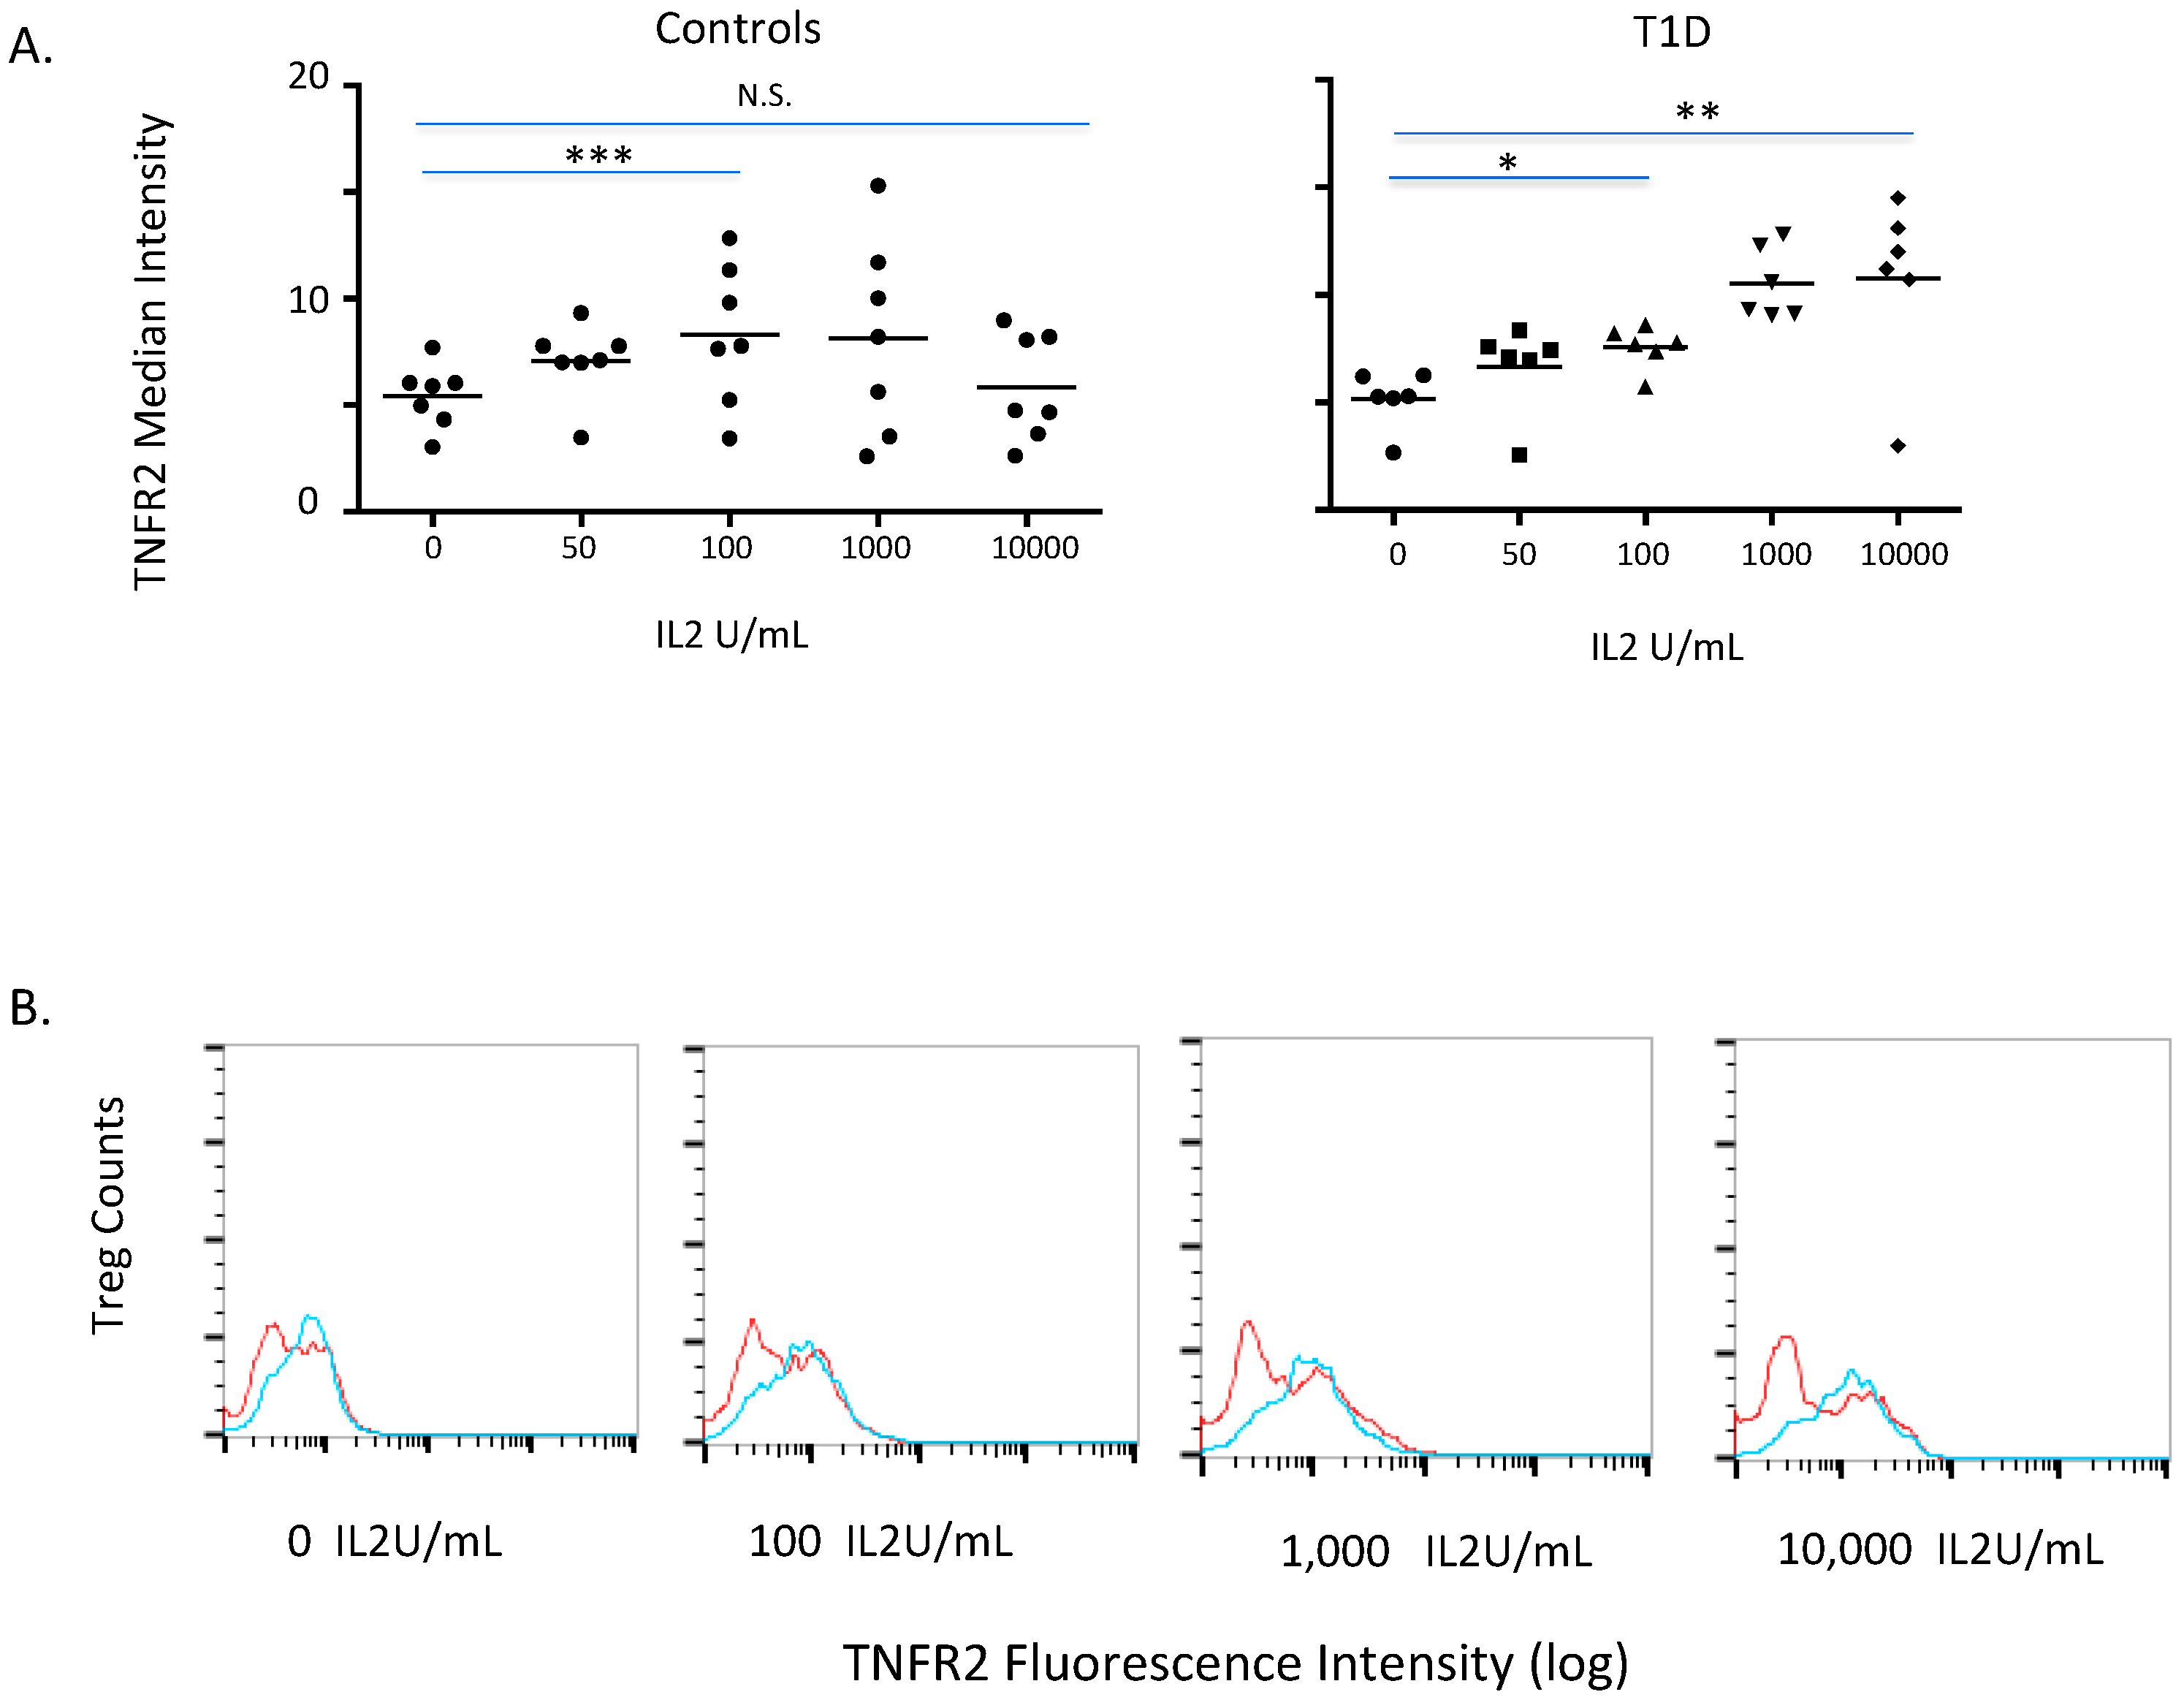
2.3. TNFR2 Expression on Normal and Diabetic Subject Treg Cells after IL2 Exposures

We next explored the relationship of IL2 exposures to TNFR2 induction of human Tregs from both diabetic (n = 6) and control (N = 7) subjects. As Figure 3A shows, both in diabetic and control CD4 T cells, IL2-induced TNFR2 in a dose-response manner. In this case there were differences between the diabetic and control subjects. The diabetic Tregs continued to express progressively higher levels of TNFR2 with higher concentrations of IL2 (p = 0.013 compared to 100 units IL2/mL; p = 0.02 compared to 10,000 units IL2/mL). For control Tregs, the induction of TNFR2 rapidly rose from 0 to 100 units of IL2/mL but was a flat dose-response for TNFR2 induction with higher levels of IL2 (p = 0.02; p = 0.72). The data was also studied in relation to total Treg counts (Figure 3B). The data showed no more TNFR2-expressing Tregs (a characteristic set of diabetic and control curves are represented in Figure 3C). The IL2 TNFR2-inducing effect was selective for TNFR2 receptor/cell. This is also shown graphically in Supplemental Figure 1 for one diabetic and one control subject with a full dose-response to IL2 with overlapping curves.
Figure 1. The study of freshly isolated human CD4 T cells for Treg identification and the expression of TNFR1 versus TNFR2 in a comparison of type 1 diabetic (T1D) versus control subjects. (A) Freshly isolated normal human CD4 T cells show that TNFR2 is preferentially and highly expressed on CD4CD25hi T cells (G2 versus G1 gate) in normal controls. In contrast, TNFR1 is expressed in low amounts on CD4CD25hi (G2 gate) or on CD4CD25low (G1 gate) T cells. (B) The median fluorescence intensity (Med FI) of TNFR1 and TNFR2 on freshly isolated CD4 T cells, a comparison of TNFR1 of type 1 diabetic (n = 15) to control (n = 11) subjects, p = 0.95, left. A comparison of TNFR2 of type 1 diabetic (n = 18) to control (n = 10) subjects, ** p = 0.02, right. (C) TNFR1 staining curves (red) compared to TNFR2 curves (blue) of freshly isolated control Tregs (left, n = 1) compared to freshly isolated type 1 diabetic Tregs (right, n = 1). These are representative histograms.
Antibodies 04 00034 g001
Figure 2. Treatment of freshly isolated human Tregs with escalating IL2 doses (24 h) to study the possible induction of TNFR1 in a comparison of type 1 diabetic (T1D) versus control subjects. (A) The median fluorescence intensity of TNFR1 on isolated CD4 T cells stained for Treg; a dose comparison for TNFR1 of type 1 diabetic (n = 6) to control (n = 6) subjects with IL2. No induction of TNFR1 occurs with escalating IL2 doses in either the diabetic or the control Treg cells. (B) IL2 dose response of TNFR1 induction on curves of Treg cells of a single type 1 diabetic (blue) compared to a single control (red) at each IL2 dose from 0–10,000 U/mL for 24 h. This data assessed the total number of Treg cells expressing TNFR1 with and without IL2. Neither the diabetic nor the control subject Treg cells expressed more TNFR1 with IL2 exposures.
Antibodies 04 00034 g002

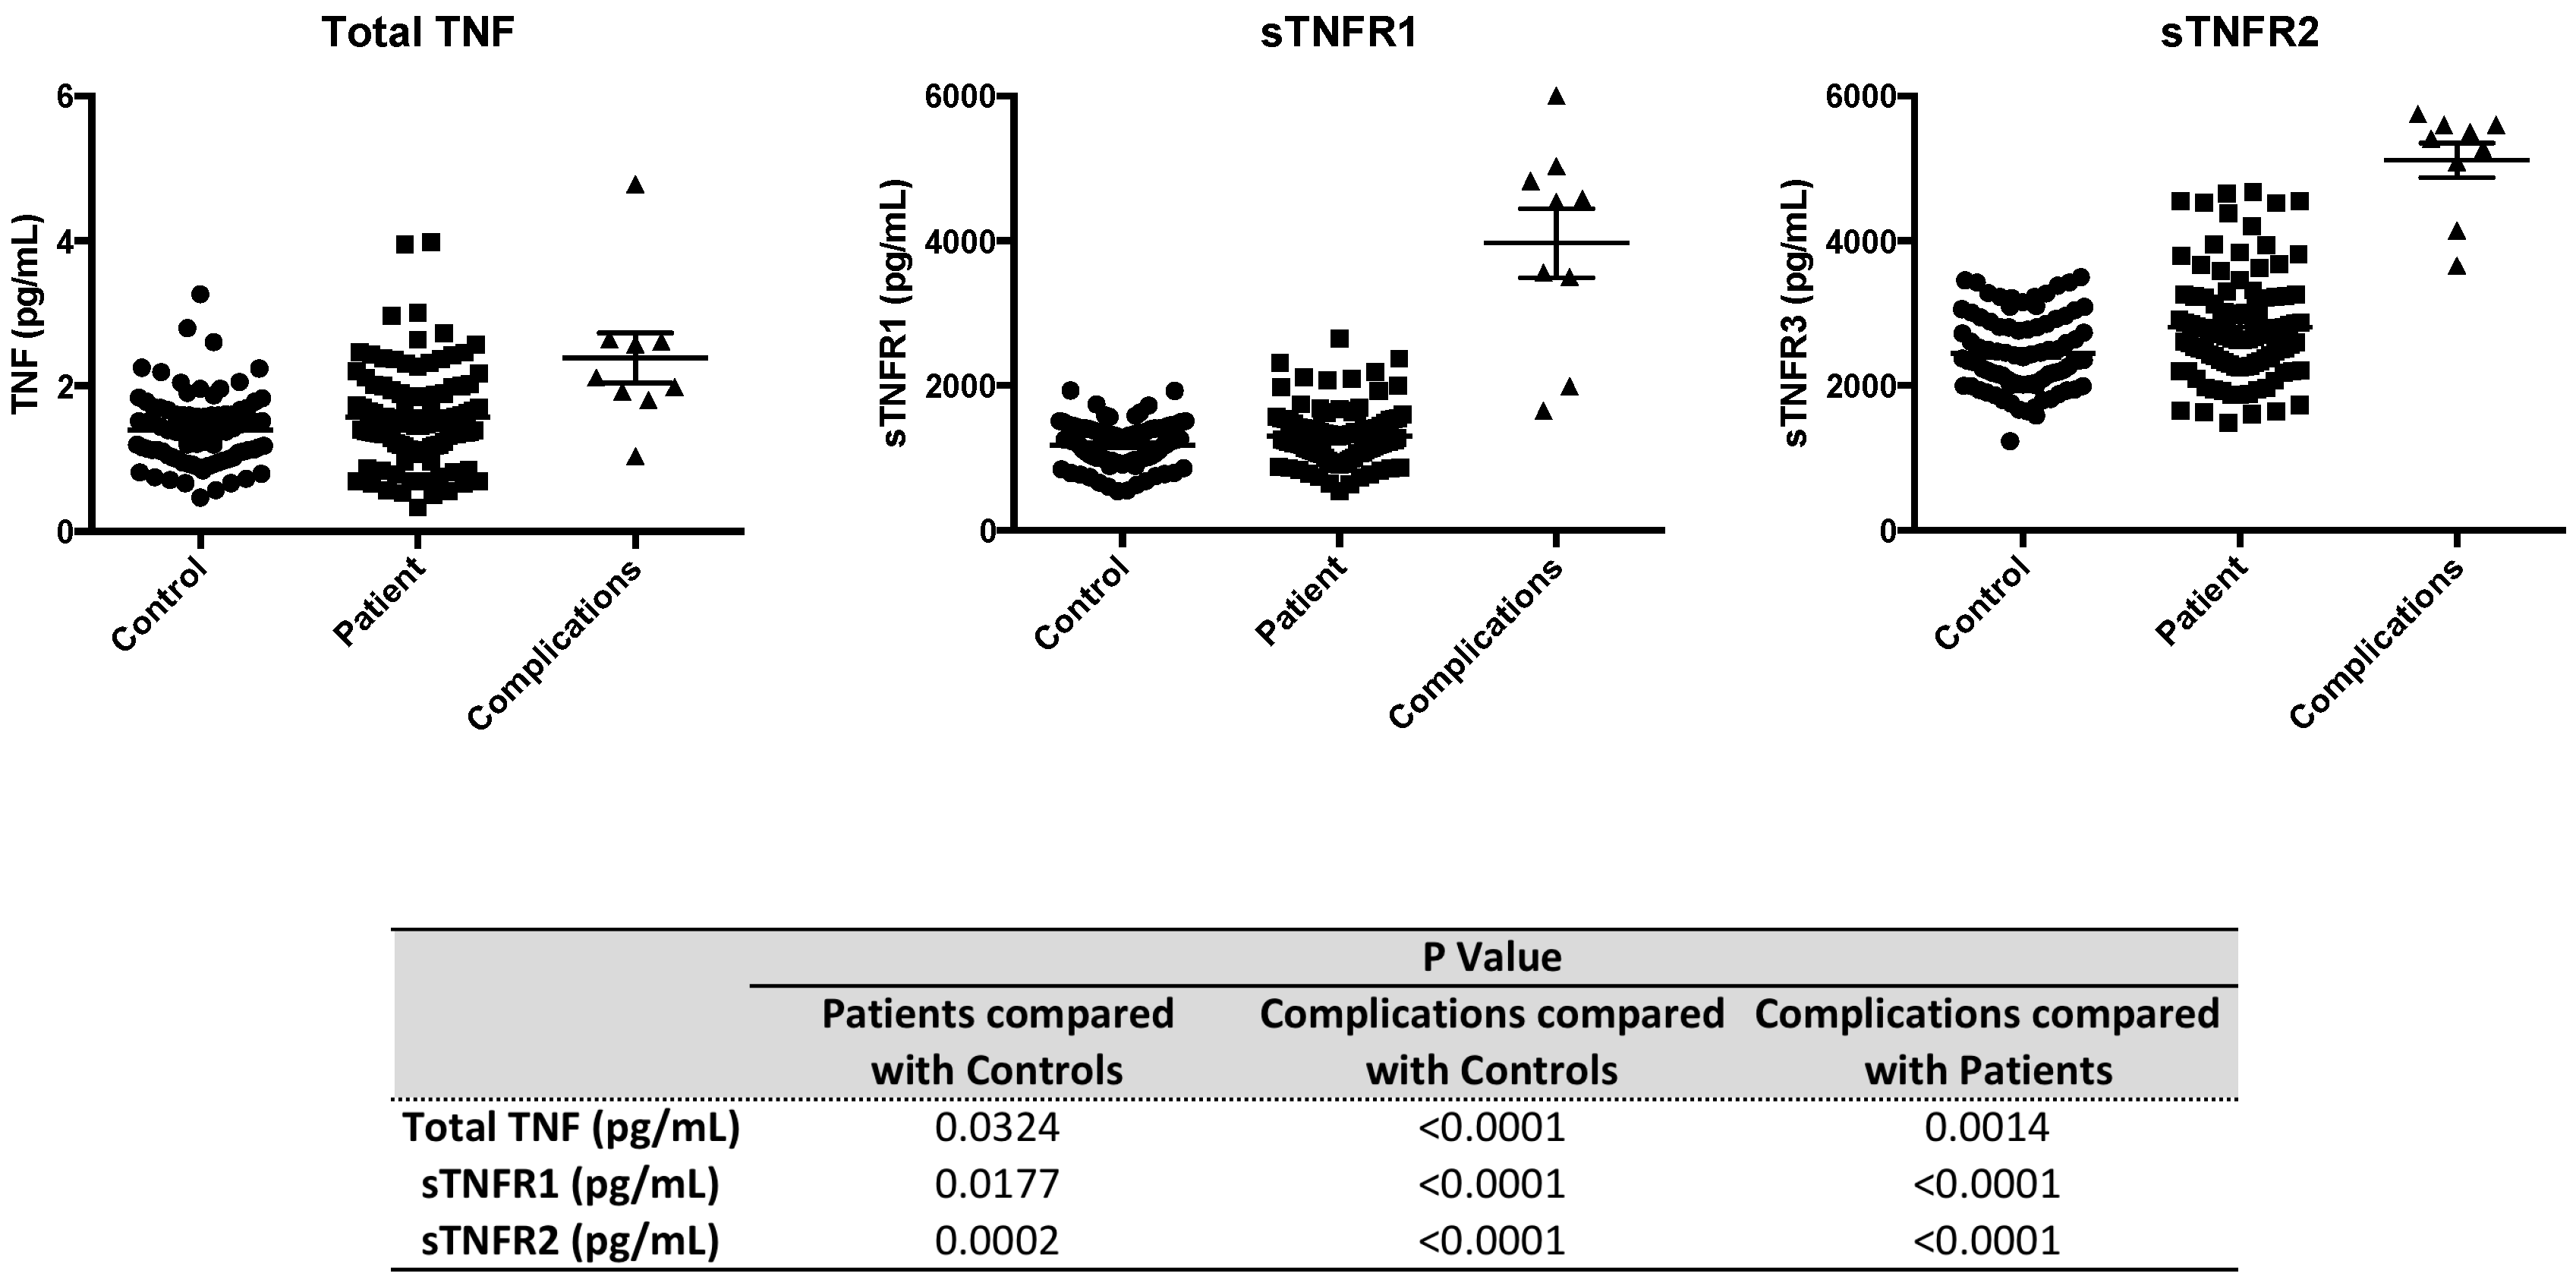
2.4. Serum Levels of sTNFR2 are Significantly Elevated in Type 1 Diabetic Subjects

The specific evaluation of serum levels of TNFR1 and TNFR2 receptors requires careful patient and control selection since non-specific elevations in many soluble protein receptors can occur with early renal failure. Renal insufficiency and failure are a complication of long standing type 1 diabetes. Therefore this study of serum TNFR1 and TNFR2 levels recruited type 1 diabetic subjects who were screened and were without any renal insufficiencies (n = 63), a sampling of type 1 diabetics with known renal failure (n = 6) and healthy controls (n = 63) (Table 1B). The data of serum levels is presented in Figure 4. The data shows type 1 diabetic subjects had a mean level of TNFR1 of 1305 +/− 50 and controls had a mean level of TNFR1 of 1181 +/− 39 (p = 0.0177). As known in the literature, type 1 diabetic subjects with renal failure had very high levels of TNFR1 (4071 +/− 661), a complication of poor renal clearance and not from over production of secreted receptors.
Figure 3. Induction of TNFR2 on Tregs with escalating IL2 exposures in a dose study of 24 h exposures in a comparison of type 1 diabetic (T1D) versus control subject. (A) The TNFR2 median fluorescence intensity on isolated Treg; a dose comparison for TNFR2 induction of type 1 diabetic (n = 6) to control (n = 7) subject. For T1D a comparison of no IL2 compared to 100 IL2 U/mL is statistically significant (*, p = 0.01); for a T1D a comparison of no IL2 compared to 10,000 IL2 U/mL is statistically significant (**, p = 0.02). For controls a comparison of no IL2 compared to 100 IL2 U/mL is statistically significant (***, p = 0.02); for controls comparing no IL2 compared to 10,000 IL2 U/mL is not statistically (N.S.) significant (p = 0.72). The other statistical comparisons were T1D 0 compared to 50 U/mL was a p value of 0.17, for 0 compared to 100 U/mL IL2 was 0.01, for 0 compared to 1,000 U/mL IL2 was 0.00 and for 0 compared to 10,000 U/mL was 0.02. The other statistical comparisons were Controls 0 compared to 50 U/mL was a p value of 0.00, for 0 compared to 100 U/mL IL2 was 0.02, for 0 compared to 1,000 U/mL IL2 was 0.19 and for 0 compared to 10,000 U/mL was 0.72. (B) Cell counts of Treg cells expressing TNFR2 with IL2 induction. The IL2-induced dose-response of TNFR2 curves of Tregs of a representative type 1 diabetic (blue) compared to representative control (red) subjects.
Antibodies 04 00034 g003
Table 1. Characteristics of study subjects with type 1 diabetes compared to control subjects.
A.Study Subjects
Type 1 DiabeticsControls
N = 15N = 12
Age (yrs)36 ± 546 ± 8
Gender (M/F)7/86/6
Duration (yr)20 ± 4--
Age of Onset (yr)12 ± 5--
B. Study Subjects
ControlsType 1 DiabeticsComplications
N = 63N = 63N = 6
Age (yrs)43 ± 1336 ± 248 ± 5
Gender (M/F)30/3329/343/3
Duration (yrs)--17 ± 234 ± 4
Age of Onset (yrs)--25 ± 220 ± 4
Figure 4. Serum levels of TNF, sTNFR1 and sTNFR2 were measured in the serum of control subjects (n = 63), subjects with type 1 diabetes but without renal disease (n = 63) and type 1 diabetics with renal insufficiencies (n = 6).
Antibodies 04 00034 g004
The examination of the serum from healthy type 1 diabetic subjects to normal controls revealed a mean level of sTNFR2 of 2808 +/− 94 and a mean level of sTNFR2 of 2443 +/− in controls. This data was statistically significant (p = 0.0002). This data was also consistent with high unstimulated and stimulated levels of TNFR2 on diabetic subject Tregs that would be expected to also result in high-secreted levels of TNFR2. As was the case for TNFR1, type 1 diabetic subjects with renal failure, have very high levels of TNFR2 due to poor renal clearance and this was again observed in this study.

3. Experimental Section

3.1. Human Subjects and Fresh Blood Procedures

Whole patient blood was drawn from patients with type 1 diabetes and control volunteers with full institutional approval and informed consent (MGH/Partners Protocol #2001P001379).
The clinical characteristics of both the type 1 diabetic and control subjects used in this study are presented in Table 1. Table 1A represents the subjects in Figure 1, Figure 2 and Figure 3; Table 1B represents the subjects in Figure 4. All control subjects neither had an autoimmune disease nor a family history of autoimmune diseases. All blood used in these experiments was fresh and processed on the same day as drawn. The blood was drawn into a BD VacutainerTM tubes (BD, Franklin Lakes, NJ, USA). containing EDTA.

3.2. Blood Preparation and CD4+ T Cell Isolations

All CD4+ cells were isolated using Dynal magnetic beads methods (Product Nos 113–33D, Invitrogen). Blood and beads were both washed and suspended in Hanks Balanced Salt Solution (HBSS) supplemented with 2% fetal bovine serum. 16 µL of fresh blood was added to a 50 mL conical tube. The blood in the conical flasks was washed twice. 600 µL of beads were used for 48 µL of fresh blood (100 µL beads per 8 µL blood). 200 µL beads were added to each 15 mL conical tube. The beads in the conical tubes were washed twice with 8 mL of washing buffer. During the wash the 15 mL conical tubes were placed in a magnet for 1 min and then the supernatant was aspirated. After washing the beads, they were resuspended in 600 µL washing buffer per 15 mL conical flask. After being washed, the blood from each 50 mL conical flask was added to one set of the 600 µL resuspended beads and incubated at 4 °C for 20 min with gentle tilting rotation. The 15 mL conical tubes containing the blood and beads were then placed in a magnet for 2 min and the supernatant was discarded. The tubes were removed, 8 mL of washing buffer was added to each 15 mL conical tube and then pipetted up and down vigorously. The suspensions were then added to fresh 15 mL conical tubes. This process was repeated 3 times to obtain a high purity of CD4+ cells (97% or more purity). The cell pellets in each 15 mL conical tube were then resuspended in 1 mL washing buffer. 80 µL of DETACHaBEAD was added to each cell pellet. The cell pellets and DETACHaBEAD were incubated for 1 h at room temperature with gentle mixing. The tubes were placed in the magnet for 1 min and the supernatant was transferred to a fresh 15 mL conical tube. This step was repeated twice. The cell suspensions from the different 15 mL conical tubes were combined in one 15 mL conical tube. 10 µL of the cell suspension was pipetted onto a hemocytometer and counted.

3.3. TNFR2, Foxp3 and CD25 Density and Cell Numbers on Human T Regulatory Cells

After isolation the CD4+ T-cells were suspended in HBSS+2%FBS to obtain a concentration of 1 × 10⁶ CD4+ cells per 50 µL. Cells were centrifuged at 900–1000 rpm 3 for 5 min at 4 °C (these settings were used throughout the experiment). The supernatant was discarded using a 200 µL tip at the end of a serological suction pipette. To stain the CD4+ cells the Biolegend Foxp3 Alexa 488 Kit was used. The method suggested by Biolegend was altered for this experiment as testing showed a better Alexa 488 staining quality. This quality difference was expressed via a higher fluorescence in the altered method. The cells were resuspended in 100 µL of HBSS+2%FBS and 10 µL of anti-human TNFR2 conjugated allophycocyanin (Product Nos FAB226A, R&D) and 20 µL anti CD-25 PE. Cell suspension was pipetted up and down gently and then incubated in the dark for 20 min. After incubation the cells were washed with 1 mL HBSS+2% FBS and then centrifuged. The supernatant was discarded and 1 mL of Foxp3 Perm Buffer was added. Foxp3 Perm Buffer was created by adding 1.5 mL FoxP3 Perm (10× Concentrated) to 13.5 mL PBS (1× concentrated). Cells and Foxp3 Perm Buffer were incubated in the dark for 15 min. The supernatant was discarded after incubation and 1 mL of HBSS+2% FBS were added. 100 µL of FoxP3 Alexa488 Fix/Perm Buffer and 5 µL of Alexa488 were added to the cells. FoxP3 Perm/Fix Buffer was created by adding 9 mL PBS (1× concentrated) to 3 mL (FoxP3 Fix/Perm Buffer). After incubation the cells were centrifuged and 1 mL of HBSS+2% FBS was added. Cells were centrifuged and 250 µL of HBSS+2%FBS were added. Cells were analyzed using Becton Dickinson FACSCalibur and the CellQuest acquisition program. The FACSCalibur was set to a total cell count number of 10,000 events. The channels were set to CD25-PE, Foxp3 Alexa488, TNFR1/TNFR2-APC. The results were analyzed with gating on CD4+ cells to eliminate any debris that could affect the results.
The same method used for the TNFR2, Foxp3 and CD25 staining was also used to stain TNFR1 on the T-regulatory cells. The only difference being that 10 µL of TNFR1 conjugated allophycocyanin (Product Nos. FAB225A, R&D) was used.

3.4. Induction Experiments with IL2 to Assess Changes in TNFR1 or TNFR2 Expression on Tregs

After analyzing the levels of TNFR1/TNFR2 on the freshly isolated CD4+ cells, the remaining isolated CD4+ cells were suspended in RPMI (1×) with 10% FBS (sterile) and 1% pen-strep to obtain a concentration of 1 × 10⁶ CD4+ cells per 50 µL. The samples were divided into 5 × 50 µL batches. The first 50 µL of the isolated CD4+ cells were then added to a well in the 96-well round bottom plate. To the other 50 µL solutions of CD4+ cells, IL2 (Stock 10,000 U/mL Ref. I7908 Sigma-Aldrich) in a concentration of 50 U/mL, 100 U/mL, 1000 U/mL, 10 000 U/mL was added. Of each solution 50 µL of CD4+ cells and IL2 were added to a well of the 96-well round bottom plate after being vortexed at approximately 1000–1200 rpm for 2 s. Cells in 96-well row were incubated for 24 h at 37 °C 5% CO2 with a cover but no slip.
100 µL of cells were collected from each well of the 96-well plate and put into a 15 mL conical tube. They were centrifuged at speed 3 for 5 min at 4 °C (these setting were used throughout the experiment). The supernatant was discarded using a 200 µL tip at the end of a serological suction pipette. To stain the CD4+ cells the Biolegend Foxp3 Alexa 488 Kit was used. The same method used for staining the freshly isolated CD4+ cells with the Biolegend Foxp3 Alexa488 kit was also used in this experiment. The cells were stained for TNFR1/TNFR2 after the 24 h also using the same staining technique as used with the freshly isolated CD4+ cells. Becton Dickinson FACSCalibur and the CellQuest acquisition programs were used. The cell count was set to a total of 10,000 events counted and the same channels were used. The same analysis technique was also used in this experiment.

3.5. Measurement of Serum TNFR1, Serum TNFR2 and TNF Levels in Human Serum

Serum was prepared from red top tube and removed from the tube top after the blood tube was centrifuged at 400 g for 15 min at 20 °C. The collected serum was frozen into cryovials stored at −70 °C. TNFα, sTNFR1, and sTNFR2 were detected by standard sandwich ELISA with a HRP/TMB read-out (R&D Systems, Minneapolis, MN, USA). The human serum was diluted 20-fold for sTNFR2 detection, 10-fold for sTNFR1 detection. No dilutions were necessary for TNFα detection in either tissue culture supernatants, or human serum. Manufacturers instructions were followed. The optical density was then determined at 450 nm by a spectrometer (Spectramax 190) and values compared to a standard curve to determine unknown concentration.

3.6. Statistical and Analysis Methods

After data acquisition, the data (flow .fcs files) was imported into Flowjo Software (ver 10.0.7r2 for Mac OS X) for analysis (Flowjo, LLC, 385 Williamson Way, Ashland, CA, USA). First, cells were gated using polygate on CD25 fluorescence intensity along the x-axis and FoxP3 fluorescence intensity on the y-axis. The polygates used were set to include the CD4+ cluster. A series of quadrant gates were used to divide the selected cell population using a two-dimensional dot plot with the x-axis being CD25 and the y-axis being FoxP3. We selected either the lowest quartile or highest quartile (quarter) of cell fluorescence intensity from the 2-D (x-axis) plot of CD25 versus FoxP3 (y-axis) to obtain the median fluorescence intensity value for the cell distribution of interest in each of the quartiles. The Flowjo software was then used to determine the median fluorescence intensity of the Treg histograms generated from the cell populations in the lowest and highest quartiles selected.
The calculated median fluorescence intensity values were imported (or manually entered) into Prism Software (Prism 6 (Ver 6.0c) for Max OS X, GraphPad Software, Inc., 7825 Fay Avenue, Suite 230, La Jolla, CA, USA). Then subsequent P-values on relevant data sets were determined using Prism Software’s analysis feature to compute the correlation value between column pairs corresponding to the IL2 dosing concentrations using a Pearson correlation coefficient calculation, a two-tailed calculation and a 95% confidence interval.

4. Conclusions

Some forms of human autoimmunity, including type 1 diabetes, are characterized by a paucity of functional TNF, an important cytokine for both Treg survival and proper negative selection of autoreactive CD8 T cells. It is also known for some autoimmune diseases, like multiple sclerosis, dysregulation of TNF receptors, such as TNFR1 over-secretion, contributes to low levels of biologically active TNF [22,32].
In this study we explore Treg cells from type 1 diabetic compared to control subjects for TNFR1 and TNFR2 expression. We found that fresh Tregs of type 1 diabetic subjects at baseline have higher levels of TNFR2 receptors compared to controls. Furthermore, with IL2 dose-response experiments, the surface levels of TNFR2 keep increasing in type 1 diabetic subjects to higher and higher levels. In contrast, dose-responses of TNFR2-expressing Tregs to IL2 in normal subjects show a flattening of TNFR2 induction. For both diabetic and control Tregs, IL2 stimulation does not change baseline levels of the TNFR1 receptor, and TNFR1 receptors are not induced with this cytokine. It is known that induction of TNFR2 and the subsequent shedding of TNFR2 inhibit the action of TNF [28]. The abnormal basal high levels of TNFR2 in type 1 diabetic subjects and even higher induced levels of TNFR2 surface receptors to IL2 exposure suggest excessive TNFR2 binding could be responsible for lower TNF activity. The abnormally elevated TNFR2 response to inflammation in Tregs suggests one mechanism whereby a deficiency of TNF could be causal to the immune imbalance in this disease.

Supplementary Materials

Supplementary materials can be accessed at: https://www.mdpi.com/2073-4468/4/1/34/s1.

Acknowledgments

We thank Dr. Miriam Davis, of the Immunobiology Lab of the Massachusetts General Hospital, for her critical critique of this paper and Ms. Lynne Murphy for her talents in manuscript preparation.

Author Contributions

Melanie Heinrich conducted the majority of the experiments in this paper for her thesis work and wrote the first draft of the paper, Douglas Burger was Melanie’s direct supervisor and helped her to perform the flow cytometry, learn the many new methods and process the data, Limei Wang, Peter Reinhold and George Tahhan either performed or analyzed the experiments in Table 1B and Figure 4. Menghan Zhao, Elise Hsu, Sarah Warden and Danielle Baum coordinate all clinical activities related to patient recruitment, interviewing, visits and scheduling for the study as well as tabulating the clinical traits of the submects. Denise L Faustman designed and conceived the study, supervised the study and wrote the paper.

Conflicts of Interest

The authors declare no conflicts of interest.

References

  1. Ban, L.; Zhang, J.; Wang, L.; Kuhtreiber, W.; Burger, D.; Faustman, D.L. Selective death of autoreactive T cells in human diabetes by TNF or TNF receptor 2 agonism. Proc. Natl. Acad. Sci. USA 2008, 105, 13644–13649. [Google Scholar] [CrossRef] [PubMed]
  2. Faustman, D.L.; Davis, M. TNF Receptor 2 and Disease: Autoimmunity and Regenerative Medicine. Front. Immunol. 2013, 4, 478. [Google Scholar] [CrossRef] [PubMed]
  3. Kodama, S.; Davis, M.; Faustman, D.L. The therapeutic potential of tumor necrosis factor for autoimmune disease: A mechanistically based hypothesis. Cell Mol. Life Sci. 2005, 62, 1850–1862. [Google Scholar] [CrossRef] [PubMed]
  4. van Oosten, B.W.; Barkhof, F.; Truyen, L.; Boringa, J.B.; Bertelsmann, F.W.; von Blomberg, B.M.; Woody, J.N.; Hartung, H.P.; Polman, C.H. Increased MRI activity and immune activation in two multiple sclerosis patients treated with the monoclonal anti-tumor necrosis factor antibody cA2. Neurology 1996, 47, 1531–1534. [Google Scholar]
  5. The Lenercept Multiple Sclerosis Study Group and The University of British Columbia MS/MRI Analysis Group. TNF neutralization in MS: Results of a randomized, placebo-controlled multicenter study. Neurology 1999, 53, 457–465. [Google Scholar]
  6. Enayati, P.J.; Papadakis, K.A. Association of Anti-tumor Necrosis Factor Therapy with the Development of Multiple Sclerosis. J. Clin. Gastroenterol. 2005, 39, 303–306. [Google Scholar] [CrossRef] [PubMed]
  7. Thomas, C.W., Jr.; Weinshenker, B.G.; Sandborn, W.J. Demyelination during anti-tumor necrosis factor alpha therapy with infliximab for Crohn's disease. Inflamm. Bowel Dis. 2004, 10, 28–31. [Google Scholar] [CrossRef] [PubMed]
  8. Vermeire, S.; Noman, M.; Van Assche, G.; Baert, F.; Van Steen, K.; Esters, N.; Joossens, S.; Bossuyt, X.; Rutgeerts, P. Autoimmunity associated with anti-tumor necrosis factor alpha treatment in Crohn's disease: A prospective cohort study. Gastroenterology 2003, 125, 32–39. [Google Scholar] [CrossRef] [PubMed]
  9. Klinkhoff, A. Biological agents for rheumatoid arthritis: Targeting both physical function and structural damage. Drugs 2004, 64, 1267–1283. [Google Scholar] [CrossRef] [PubMed]
  10. Feldmann, M.; Brennan, F.M.; Maini, R.N. Role of cytokines in rheumatoid arthritis. Annu. Rev. Immunol. 1996, 14, 397–440. [Google Scholar] [CrossRef] [PubMed]
  11. Food and Drug Administration (FDA). Update on the TNF-alpha blocking agents. Available online: http://www.fda.gov/ohrms/dockets/ac/03/briefing/3930B1_01_B-TNF.briefing.pdf (accessed on 1 August 2009).
  12. Lipsky, P.E.; van der Heijde, D.M.; St Clair, E.W.; Furst, D.E.; Breedveld, F.C.; Kalden, J.R.; Smolen, J.S.; Weisman, M.; Emery, P.; et al. Infliximab and methotrexate in the treatment of rheumatoid arthritis. Anti-Tumor Necrosis Factor Trial in Rheumatoid Arthritis with Concomitant Therapy Study Group. N. Engl. J. Med. 2000, 343, 1594–1602. [Google Scholar] [CrossRef]
  13. Moreland, L.W.; Schiff, M.H.; Baumgartner, S.W.; Tindall, E.A.; Fleischmann, R.M.; Bulpitt, K.J.; Weaver, A.L.; Keystone, E.C.; Furst, D.E.; Mease, P.J.; et al. Etanercept therapy in rheumatoid arthritis. A randomized, controlled trial. Ann. Intern. Med. 1999, 130, 478–486. [Google Scholar] [CrossRef]
  14. Bleumink, G.S.; ter Borg, E.J.; Ramselaar, C.G.; Ch Stricker, B.H. Etanercept-induced subacute cutaneous lupus erythematosus. Rheumatology (Oxford) 2001, 40, 1317–1319. [Google Scholar] [CrossRef]
  15. Cairns, A.P.; Duncan, M.K.; Hinder, A.E.; Taggart, A.J. New onset systemic lupus erythematosus in a patient receiving etanercept for rheumatoid arthritis. Ann. Rheum. Dis. 2002, 61, 1031–1032. [Google Scholar] [CrossRef] [PubMed]
  16. Bloom, B.J. Development of diabetes mellitus during etanercept therapy in a child with systemic-onset juvenile rheumatoid arthritis. Arthritis Rheum. 2000, 43, 2606–2308. [Google Scholar] [CrossRef] [PubMed]
  17. Aderka, D.; Wysenbeek, A.; Engelmann, H.; Cope, A.P.; Brennan, F.; Molad, Y.; Hornik, V.; Levo, Y.; Maini, R.N.; Feldmann, M.; et al. Correlation between serum levels of soluble tumor necrosis factor receptor and disease activity in systemic lupus erythematosus. Arthritis Rheum. 1993, 36, 1111–1120. [Google Scholar] [CrossRef]
  18. Gabay, C.; Cakir, N.; Moral, F.; Roux-Lombard, P.; Meyer, O.; Dayer, J.M.; Vischer, T.; Yazici, H.; Guerne, P.A. Circulating levels of tumor necrosis factor soluble receptors in systemic lupus erythematosus are significantly higher than in other rheumatic diseases and correlate with disease activity. J. Rheumatol. 1997, 24, 303–308. [Google Scholar] [PubMed]
  19. Cope, A.P.; Aderka, D.; Doherty, M.; Engelmann, H.; Gibbons, D.; Jones, A.C.; Brennan, F.M.; Maini, R.N.; Wallach, D.; Feldmann, M. Increased levels of soluble tumor necrosis factor receptors in the sera and synovial fluid of patients with rheumatic diseases. Arthritis Rheum. 1992, 35, 1160–1169. [Google Scholar] [CrossRef] [PubMed]
  20. De Jager, P.L.; Jia, X.; Wang, J.; de Bakker, P.I.; Ottoboni, L.; Aggarwal, N.T.; Piccio, L.; Raychaudhuri, S.; Tran, D.; Aubin, C.; et al. Meta-analysis of genome scans and replication identify CD6, IRF8 and TNFRSF1A as new multiple sclerosis susceptibility loci. Nat. Genet. 2009, 41, 776–782. [Google Scholar] [CrossRef]
  21. International Multiple Sclerosis Genetics Consortium. The genetic association of variants in CD6, TNFRSF1A and IRF8 to multiple sclerosis: A multicenter case-control study. PLoS One 2011, 6, e18813. [Google Scholar]
  22. Gregory, A.P.; Dendrou, C.A.; Attfield, K.E.; Haghikia, A.; Xifara, D.K.; Butter, F.; Poschmann, G.; Kaur, G.; Lambert, L.; Leach, O.A.; et al. TNF receptor 1 genetic risk mirrors outcome of anti-TNF therapy in multiple sclerosis. Nature 2012, 488, 508–511. [Google Scholar] [CrossRef]
  23. Sakaguchi, S.; Sakaguchi, N.; Asano, M.; Itoh, M.; Toda, M. Immunologic self-tolerance maintained by activated T cells expressing IL-2 receptor alpha-chains (CD25). Breakdown of a single mechanism of self-tolerance causes various autoimmune diseases. J. Immunol. 1995, 155, 1151–1164. [Google Scholar] [PubMed]
  24. Sakaguchi, S.; Yamaguchi, T.; Nomura, T.; Ono, M. Regulatory T cells and immune tolerance. Cell 2008, 133, 775–787. [Google Scholar] [CrossRef] [PubMed]
  25. Sakaguchi, S.; Wing, K.; Miyara, M. Regulatory T cells—A brief history and perspective. Eur. J. Immunol. 2007, 37 (Suppl. 1), S116–S123. [Google Scholar] [CrossRef]
  26. Okubo, Y.; Mera, T.; Wang, L.; Faustman, D.L. Homogeneous expansion of human T-regulatory cells via tumor necrosis factor receptor 2. Sci. Rep. 2013, 3, 3153. [Google Scholar] [CrossRef] [PubMed]
  27. Annunziato, F.; Cosmi, L.; Liotta, F.; Lazzeri, E.; Manetti, R.; Vanini, V.; Romagnani, P.; Maggi, E.; Romagnani, S. Phenotype, localization, and mechanism of suppression of CD4(+)CD25(+) human thymocytes. J. Exp. Med. 2002, 196, 379–387. [Google Scholar] [CrossRef] [PubMed]
  28. van Mierlo, G.J.; Scherer, H.U.; Hameetman, M.; Morgan, M.E.; Flierman, R.; Huizinga, T.W.; Toes, R.E. Cutting edge: TNFR-shedding by CD4+CD25+ regulatory T cells inhibits the induction of inflammatory mediators. J. Immunol. 2008, 180, 2747–2751. [Google Scholar] [CrossRef] [PubMed]
  29. Ehrenstein, M.R.; Evans, J.G.; Singh, A.; Moore, S.; Warnes, G.; Isenberg, D.A.; Mauri, C. Compromised function of regulatroy T cells in rheuymatoid arthritis and reversal by anti-TNF therapy. J. Exp. Med. 2004, 200, 277–285. [Google Scholar] [CrossRef] [PubMed]
  30. Ricciardelli, I.; Lindley, K.J.; Londei, M.; Quaratino, S. Anti-TNF therapy increases the nubmer of Foxp3 regulatory T cells in chuildren affected by Crohn's disease. Immunology 2008, 125, 178–183. [Google Scholar] [CrossRef] [PubMed]
  31. Ochs, H.D.; Gambineri, E.; Torgerson, T.R. IPEX, FOXP3 and regulatory T-cells: A model for autoimmunity. Immunol. Res. 2007, 38, 112–121. [Google Scholar] [CrossRef] [PubMed]
  32. Ottoboni, L.; Frohlich, I.Y.; Lee, M.; Healy, B.C.; Keenan, B.T.; Xia, Z.; Chitnis, T.; Guttmann, C.R.; Khoury, S.J.; Weiner, H.L.; et al. Clinical relevance and functional consequences of the TNFRSF1A multiple sclerosis locus. Neurology 2013, 81, 1891–1899. [Google Scholar] [CrossRef]

