Mechanical Behavior of Double-Arch Tunnels under the Effect of Voids on the Top of the Middle Wall


1
Key Laboratory of Urban Underground Engineering of Ministry of Education, Beijing Jiaotong University, Beijing 100044, China
2
School of Civil Engineering, Beijing Jiaotong University, Beijing 100044, China
*
Author to whom correspondence should be addressed.
Symmetry 2018, 10(12), 703; https://doi.org/10.3390/sym10120703
Submission received: 18 October 2018
/
Revised: 15 November 2018
/
Accepted: 15 November 2018
/
Published: 3 December 2018
Abstract
:Voids behind linings may affect the safety and performance of structures. In this paper, the applicability of the extended finite element method for simulating crack propagation was verified firstly through comparisons between numerical simulations and model tests. Moreover, the mechanical behavior of double-arch tunnels under effects of voids on the top of the middle wall was investigated numerically. Two factors, including void size and tunnel shape, were mainly investigated. The main results obtained were explored including internal forces, deformation and fracturing of the liner. The results showed that voids produced adverse effects on the liner. Internal forces on the liner experienced significant changes and the deformation of the liner increased. Besides, larger crack depth was observed at the crown and the connection between the spandrel and middle wall, indicating a significant decrease in bearing capacity of the structure compared with tunnels without voids.
1. Introduction
Owing to construction, materials and geological factors, most existing tunnels are suffering from lining disease, such as cracking and leaking water. Research indicates that there is an important role for voids in the deterioration of the liner as they affect the interplay between surrounding rocks and linings adversely—especially the voids with a large length. Compared with a single tunnel, the voids behind linings have much greater effects on double-arch tunnels and the impact mechanism is much more complicated.
In view of the fact that voids commonly exist behind the liner and can cause negative consequences, related research is being carried out by theoretical analyses, numerical simulations and experiments. For theoretical analysis, two-dimensional (2D) elastic solutions for a deep circular tunnel with a void behind the liner were presented by Yasuda et al. [1]. The results showed that the voids caused the stress state of linings to change from axial force to bending moment. In addition, numerical analysis is an efficient analytical method and widely employed to investigate the deformation and stress distribution of liners. Meguid and Dang [2] assessed the effects of voids on the internal forces through a series of simplified elastic–plastic finite element method (FEM) analyses, in which the flexibility ratio, coefficient of earth pressure at rest and void size were considered. Meguid and Kamel [3] evaluated the three-dimensional (3D) effects of voids on an existing sewer pipe through elastic–plastic finite element analyses. Wang et al. [4] presented a better understanding of the stress redistribution and the changes of internal forces under the effects of voids numerically. Huang et al. [5] studied the propagation and distribution laws, appearances and cracking mechanisms of cracks using the extended finite element method. Yan et al. [6] studied cracking and failure characteristics of the segmental lining structure of an underwater shield tunnel upon a derailed high-speed train impact by the extended finite element method. Furthermore, the model test is another effective method to study the mechanical behavior of liners. Leung and Meguid [7] conducted a series of experiments to examine the effects of contact loss on earth pressure distribution on the lining. The results showed that there were significant changes in earth pressure in the close vicinity of the area that had experienced the contact loss. Lei et al. [8] analyzed the failure mechanism of linings and surrounding rocks on shallow buried tunnels under unsymmetrical loading through an experimental program.
As for the research about double-arch tunnels, Lai et al. [9] conducted an overall detection of the liner crack, tunnel seepage, and liner void to evaluate the actual operational state of a double-arch tunnel. Li et al. [10] studied the rock mass mechanical behavior of a large-span double-arch tunnel through the combination of model tests and numerical simulations. Zhang et al. [11] simulated a case of landslide induced by excavating a large-span multi-arch tunnel, in which a fictitious material was employed to model the construction deficiency of voids. Zhang et al. [12] analyzed damages of a multi-arch tunnel subjected to asymmetry pressure and buried at shallow depth by field investigation and numerical analysis.
However, most of the present research about the issue only study a single tunnel; it is not known that how voids affect the mechanical behavior of liners in double-arch tunnels. In addition, voids occur typically on the top of the middle wall in double-arch tunnels. Therefore, this paper intends to analyze the effects of voids on the top of the middle wall through the combination of numerical simulations and model tests. Limited to test equipment, computing power and other factors, this work presents a series of 2D elastic–plastic simulations and model tests. The simplification is reasonable for voids with a large length.
2. Feasibility Study of the Extended Finite Element Method for Simulating Crack Propagation
A model test and numerical simulation were carried out respectively to investigate the mechanical behavior of asymmetrical double-arch tunnels under the effects of voids. Results obtained from two methods were compared to verify the applicability of the extended finite element method for simulating crack propagation.
2.1. Physical Model Test
2.1.1. Model Test Apparatus
The model test system consisted of the structural load frame and the loading system. Figure 1 shows the photo of the model test apparatus. The physical model test was conducted in the structural load frame with dimensions of 3.0 m × 0.3 m × 1.62 m (length × width × height), which was made of Plexiglas plates and a steel frame. A set of stiffening bars was designed to increase its stiffness and restrain the ground strain out-of-plane direction considering the factors of safety. Moreover, polytetrafluoroethylene (PTFE) films were attached on the inside of the load frame to reduce the friction between the steel plane and the ground. The loading system consisted of hydraulic jacks, rigid metallic plates and pressure sensors. Loading was achieved through a battery of hydraulic jacks that can provide a maximum load of 300 kN acting on a rigid metallic distribution plate. In addition, the void was formed by a pre-buried dunnage air bag with dimensions of 0.25 m × 0.06 m × 0.05 m (length × width × height). A void with a height of two meters in prototype was investigated in the model test; it clearly highlighted the effect of voids on linings.
2.1.2. Model Test Materials
Considering the test conditions, the similarity ratio of geometry size was CL = 40. The other similarity ratios can be obtained according to similar theories, as listed in Table 1.
A new similar material was developed to simulate the rock mass in the present research, which was a mixture of barite powder, sand and Vaseline. Furthermore, a mixture of water and plaster with a mixing ratio of 1.1:1 was used to simulate the liner and the tensile strength of the similar material was 0.049 MPa. The other mechanical parameters of the model and prototype materials are shown in Table 2. It should be noted that density similarity for the lining was not strictly consistent with the similarity theory and the accuracy of the results was consequently reduced. However, the density of the lining was a minor factor and the influence on the results was negligible.
The cross-section of the double-arch tunnel used as a prototype is depicted in Figure 2. The span of the double-arch tunnel was 29.41 m; the left tunnel was a three-lane highway tunnel with a span of 15.25 m and a height of 11.12 m, and the right tunnel was a two-lane tunnel. The support consisted of a primary support of 0.3 m thick and a secondary support of 0.6 m thick, and was considered as a whole.
2.1.3. Test Monitoring
In the present research, the internal forces of the liner, structural deformation and the failure process were monitored respectively. The internal forces were calculated through the tested strains. Fifteen pairs of strain gauges were arranged to monitor the strain changes during the loading process. As for the deformation of structure, the deformation measurements system comprised of miniature extensometers and a collection device was employed to monitor the radial deformation of the lining. Of the six monitoring points in each tunnel, three were near the crown, two were at the sidewall and the middle wall, and the other one was at the inverted arch. For the failure process, the crack propagation patterns of the lining were saved by photos. The distribution of the miniature extensometers and strain gauges is depicted in Figure 3.
2.1.4. Test Procedures
The model test mainly consisted of three steps. The first step was model construction. In this step, the model material was filled into the load frame and compacted carefully by a roller layer by layer until the standard density was reached. Then, the model tunnel was embedded carefully when the height of the material filled in the load frame reached the specified value. The second step was the installation of measurement instruments. The third step was the loading process. In this step, uniform load up to 0.15 MPa was applied gradually on the top of the model by hydraulic jacks, which was equal to 6 MPa in the prototype. The loading process was divided into 15 steps, and the load increment for each step was 0.01 MPa (0.4 MPa in the prototype). The next load step would not be applied until a stable state was reached. In order to be compared with the numerical results, the test data was multiplied by the similarity ratio.
2.2. Numerical Analysis
2.2.1. Numerical Model
The dimensions of the numerical models were set to 120 m × 47.23 m (length × height), corresponding to that the physical model was magnified 40 times (the similarity ratio) to the prototype size, as shown in Figure 4.
2.2.2. Model Details
In the 2D numerical simulation, the Abaqus v6.14-1 (Dassault Systèmes, Providence, RI, USA) [13] software was used, and the extended finite element method approach was adopted to simulate cracking behavior of the liner. Both the linings and surrounding rocks were mainly discretized by the four-node plane strain quadrilateral elements available in the Abaqus library. The meshing was dense in the void and tunnel area, and the approximate element size was taken as 0.25 m. On the contrary, the meshing was thick away from the void area. The element size has important effects on the computing accuracy and time consumption. Cracking processes, including cracking load and crack depth, will be affected greatly if the element size is too large. Considering the accuracy and the severe convergence difficulty caused by stiffness degradation and interaction, the element size of the linings was taken as 0.55 m, which was larger than that of soil.
The rock mass was assumed as continua with elastic–plastic Mohr–Coulomb constitutive relations. The lining was modeled on the basis of the damage mechanics model of materials. The fracture energies for the crack damage of the lining, GIf, GIIf and GIIIf, were all 80 N/m [5]. The maximum principal stress criterion was used for the emergence and propagation of cracks and the tensile strength of concrete was 2.01 MPa. In addition, the ultimate compressive strain was 0.0033 according to the Chinese Code for Design of Concrete Structures [14]. The other parameters adopted for the numerical model are listed in Table 2 respectively.
Furthermore, the surface-to-surface contact between linings and surrounding rocks was adopted to obtain the normal contact pressure acting on the linings, in which penalty stiffness defined with an exponential law was applied normally, and coulomb friction (μ = 0.8) was applied tangentially [6]. Additionally, the horizontal displacement of the vertical boundary was restrained while the bottom of the model was restrained in the vertical direction.
The analysis was completed in three steps. The geostatic procedure was used as the first step to establish the initial geostatic stress field, during which the displacement boundary and gravity were imposed. This was followed by tunnel excavation and the activation of linings, and the void was introduced at the same time. The third step was to apply uniform load on the top of the model to observe the failure patterns and deformation of the linings. The uniform load applied on the model increased from 0 MPa to 6 MPa linearly. In the numerical simulation analysis, was the convergence criterion for the ratio of the largest residual to the corresponding average flux norm, and was set to 5 × 10⁻³ by default.
2.2.3. Simulation of Voids
In the present research, fan-shaped zones were predefined on the top of the middle wall and the element removal technique was used to simulate the effects of voids. Specified elements in the predefined zones were removed from the model during analysis, and the effects of the removed region on the rest of the model were completely absent at the end of the removal step.
2.3. Comparisons between Model Test and Numerical Simulation
2.3.1. Internal Forces of the Liner
Considering that large strains on the liner would cause the strain gauges to separate from the lining, the tested strains obtained when loading to 0.4 MPa (first step) were analyzed. Internal forces can be calculated using the method in Munro et al. [3,15,16] as follows:
where 1/ρ is the change in lining curvature; ε1 and ε2 are the inner and outer circumferential strains, respectively; and t is the lining thickness. The moment can be calculated as follows:
where M is the bending moment of the liner; Ep is the concrete modulus; Ip is the second moment of area of the lining cross section; and σ1 and σ2 are the inner and outer circumferential stress, respectively. Furthermore, the axial forces can be calculated as follows:
where N is the axial force of the liner.
1/ρ = (ε1 − ε2)/t,
M = EpIp/ρ = (σ1 − σ2) Ip/t,
N = Ep(ε1 + ε2)t/2 = (σ1 + σ2) t/2,
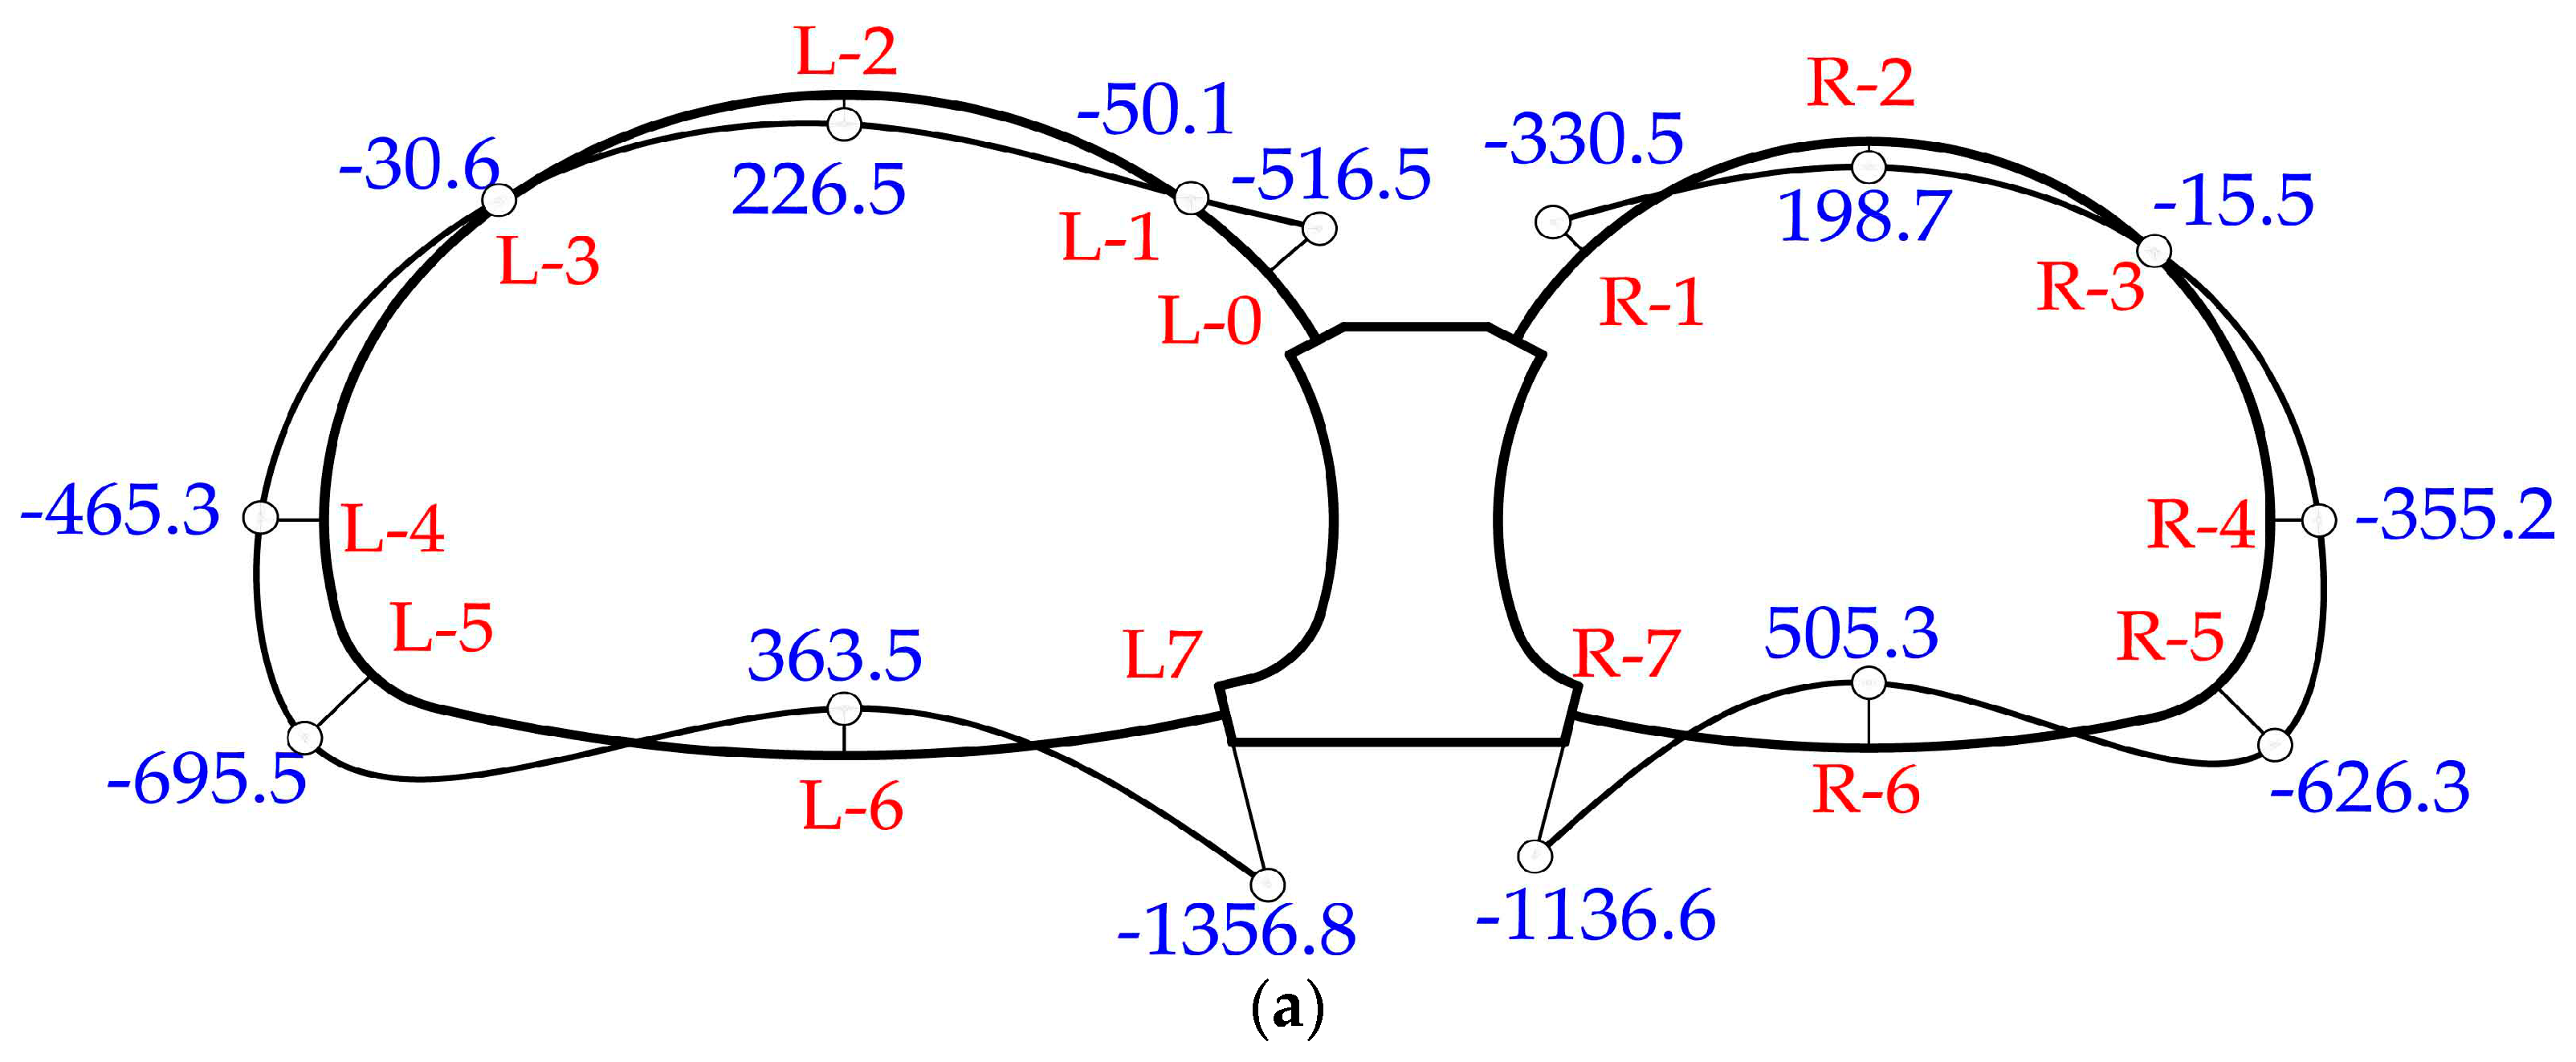
Figure 5 shows the distribution of internal forces obtained in the model test. In the left tunnel with a larger diameter, positive bending moments (bending inwards) were observed at the crown and the invert, which indicated the internal faces were working under tension. The maximum positive bending moment occurred at the invert. Instead, negative bending moments were observed at the spandrel, sidewall and the arch foot. The bottom of the middle wall had the maximum negative bending moment. As for the axial forces, the value at the invert was generally smaller than that of the crown and sidewall. Similar behavior was found in the right tunnel.
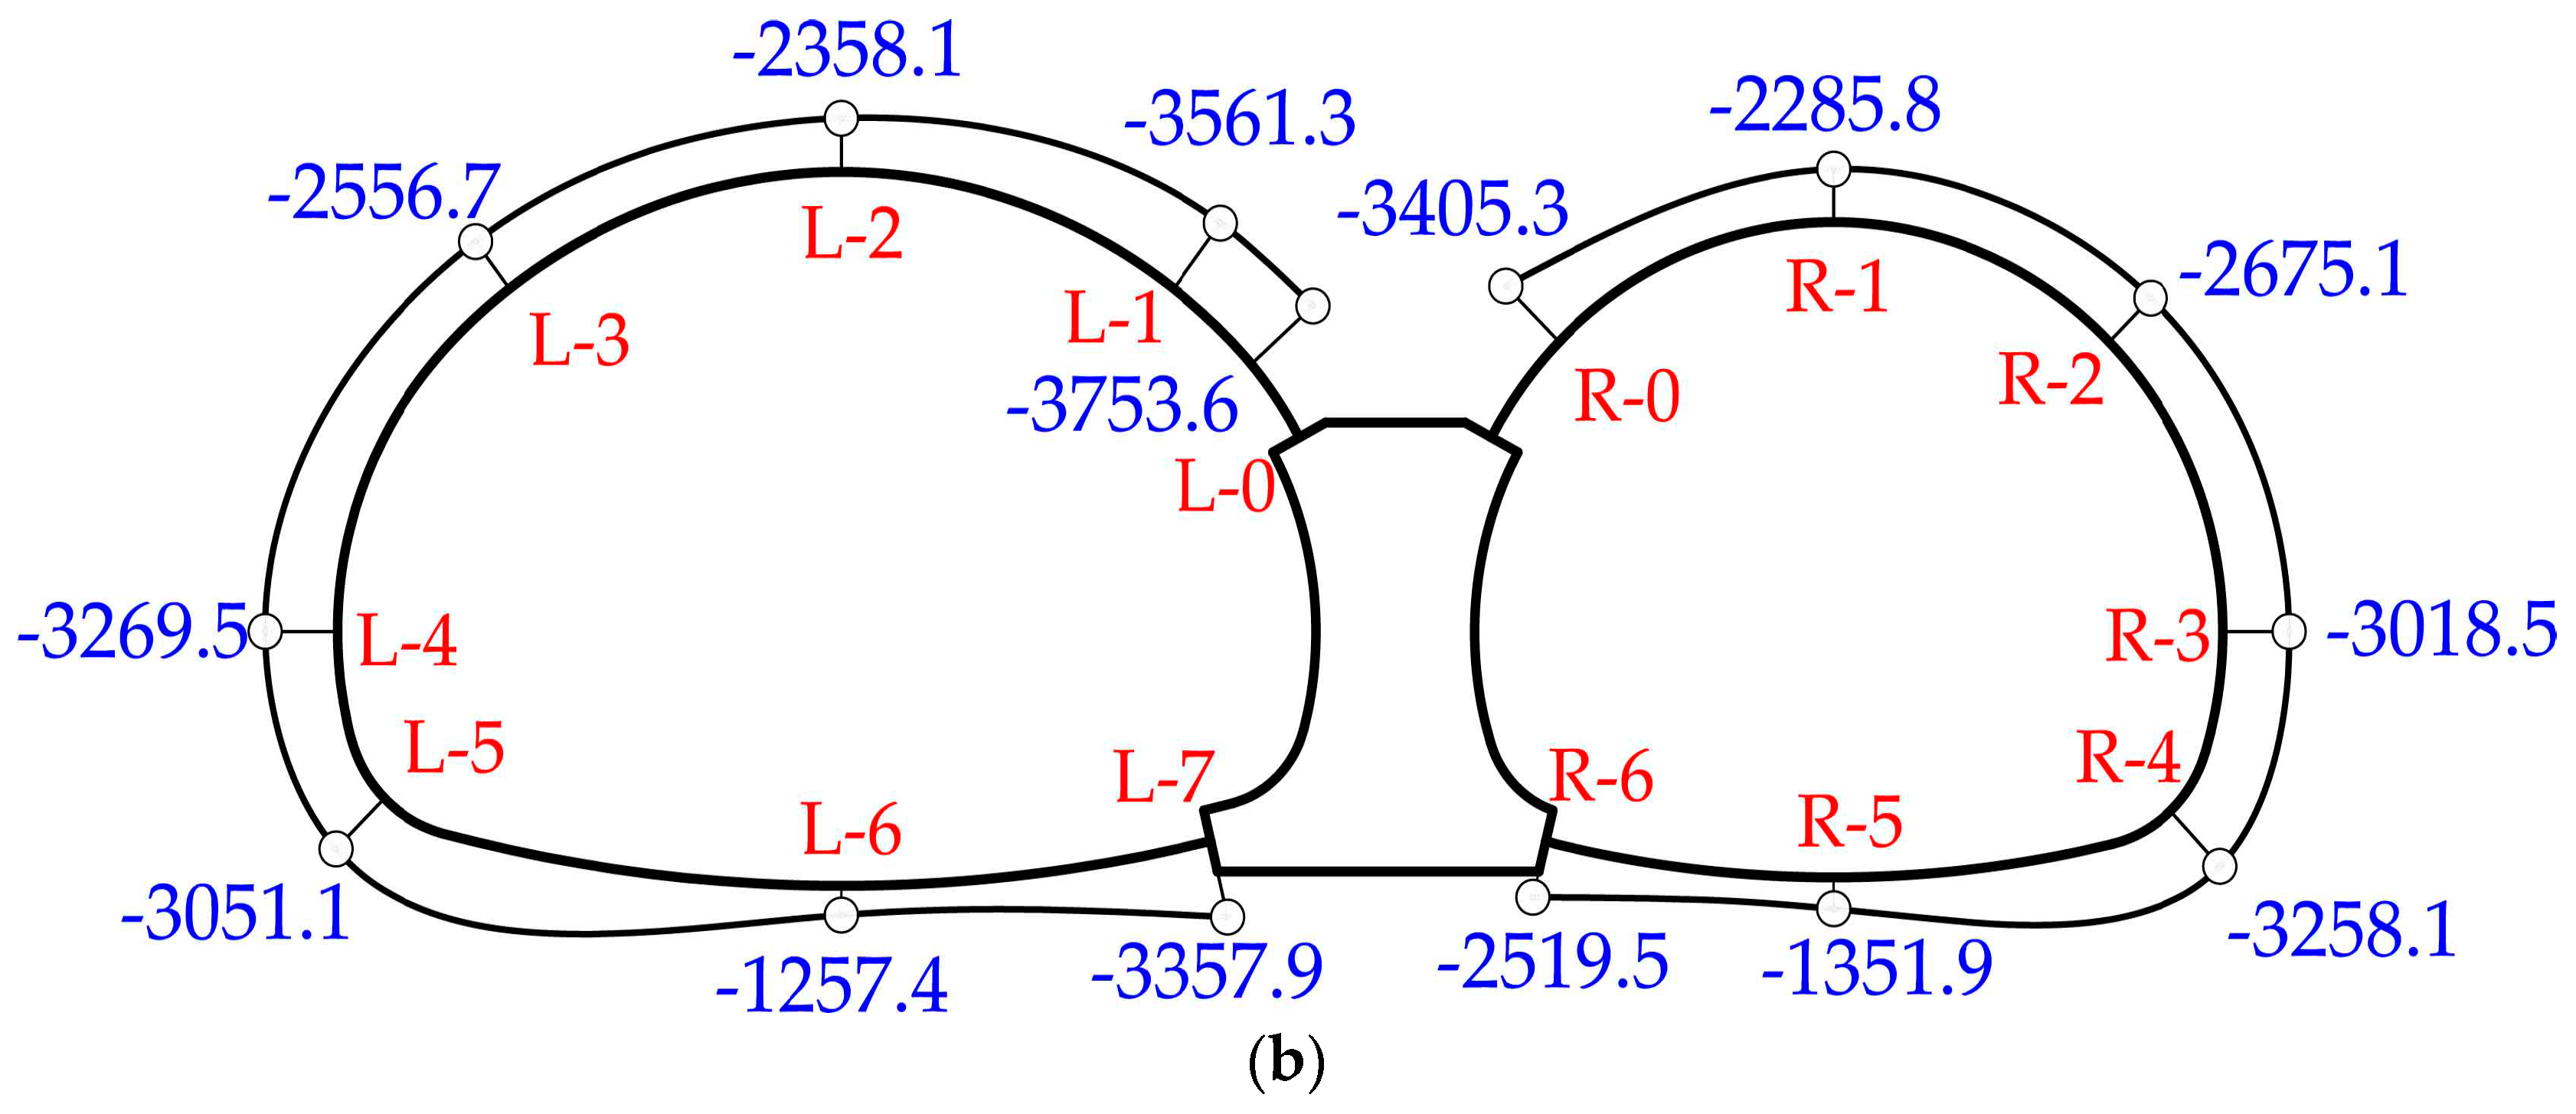
Internal forces for numerical simulation when loading to 0.4 MPa have been calculated using the method in Munro et al. [3,15,16], as shown in Figure 6. During the loading from 0 MPa to 0.4 MPa, the internal and external stress of the lining increased linearly with respect to the load. As shown in Figure 6, the distribution of internal forces was basically consistent with the results of the model test.
2.3.2. Deformation of the Liner
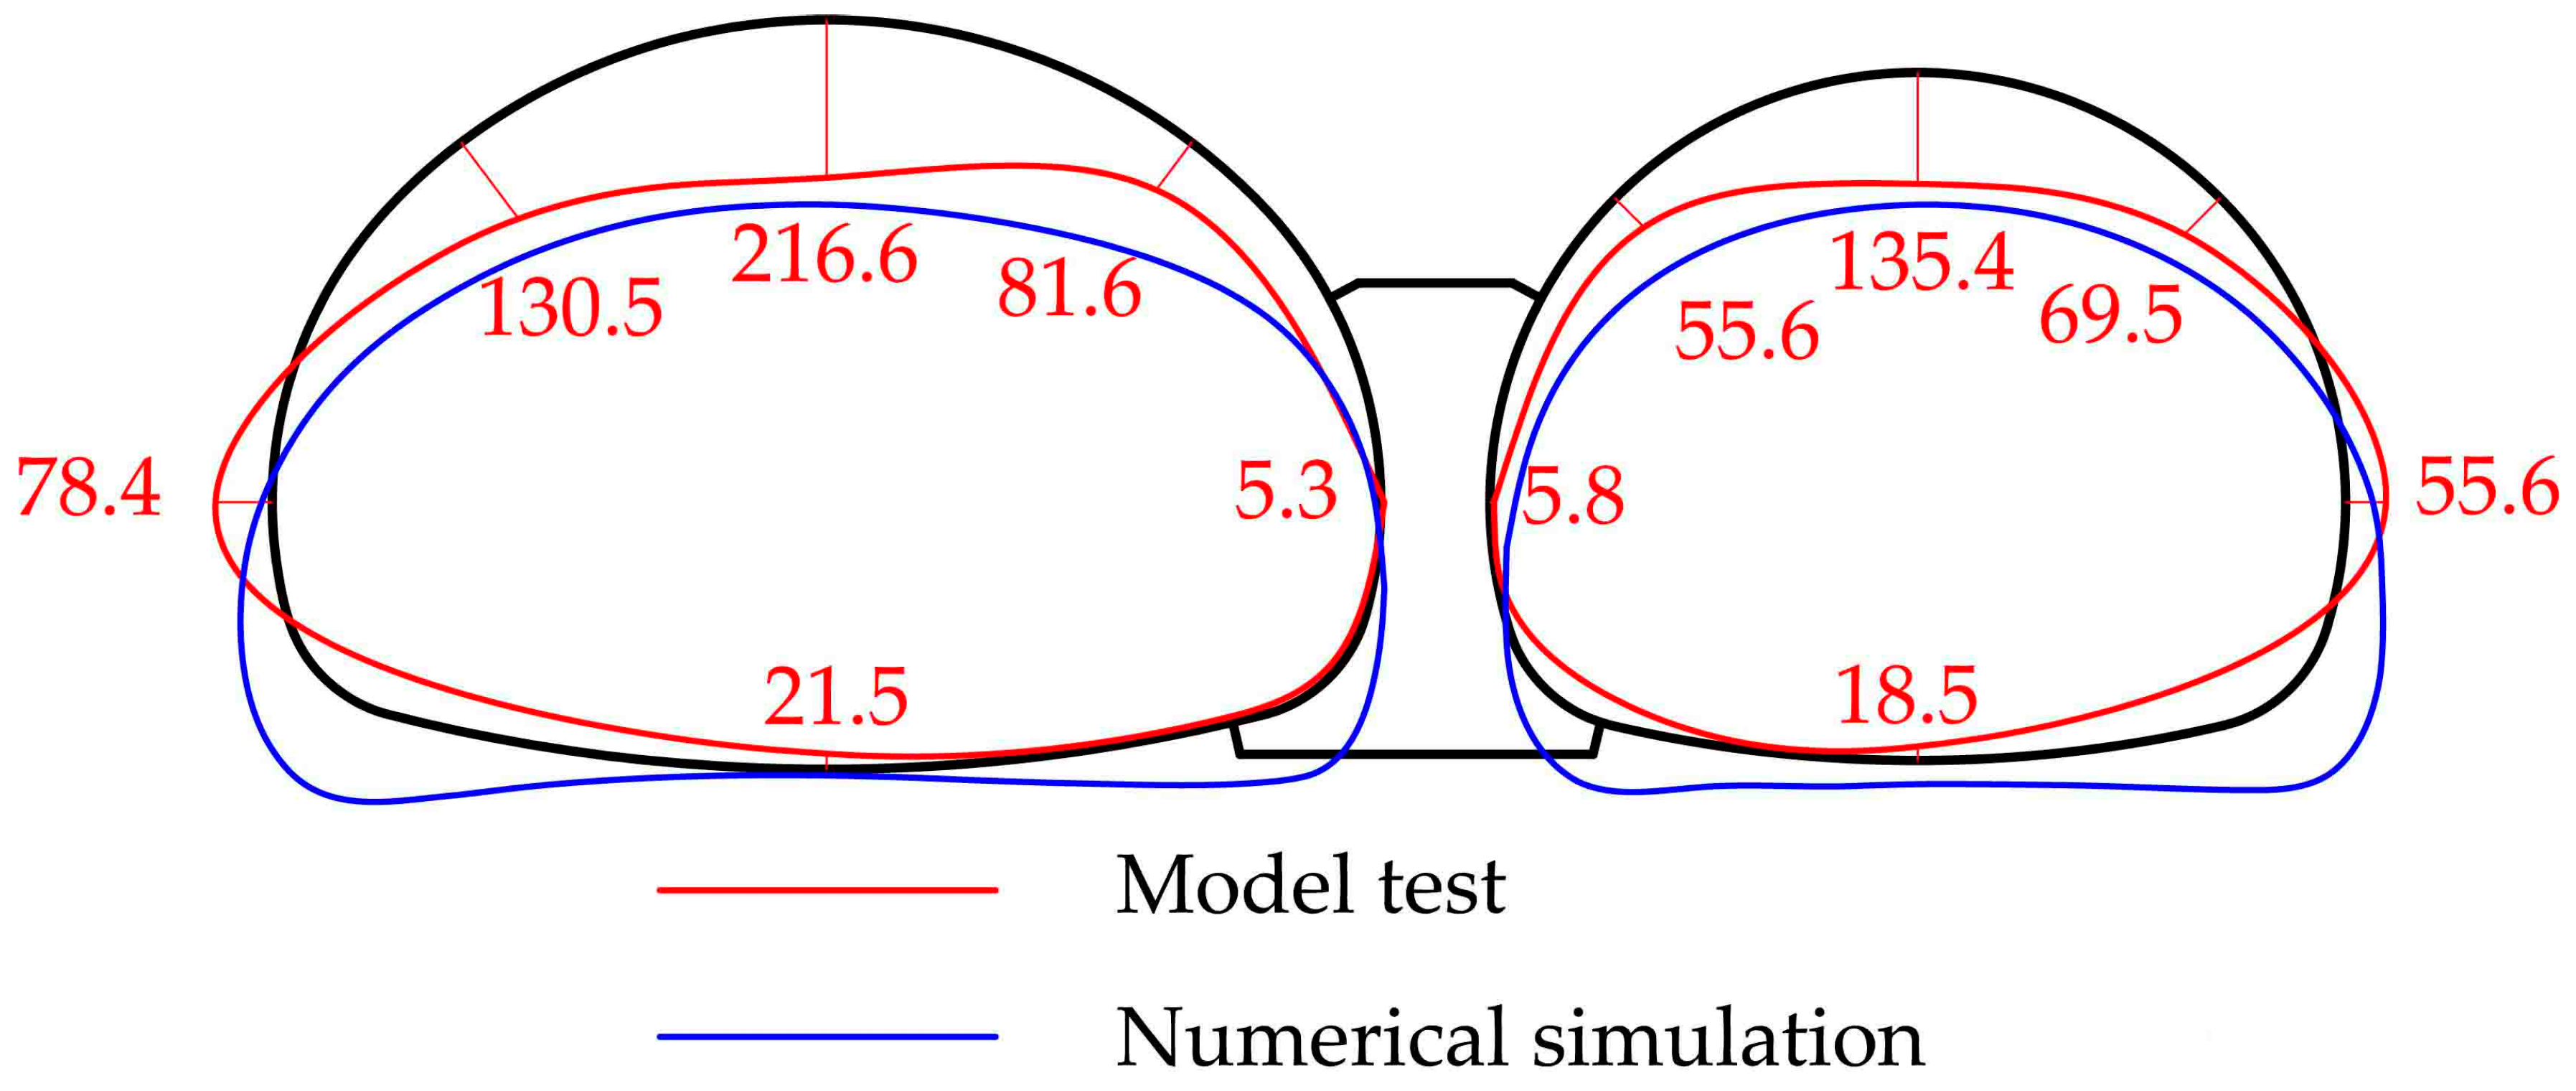
Figure 7 illustrates the overall deformation of the liner with a void on the top of the middle wall. The numbers in the figure represent the radial deformation of the liner obtained in the model test. It can be seen that the overall deformation was basically symmetric as both tunnels deformed outward horizontally and inward vertically. However, left tunnel deformed more seriously compared to the right tunnel. The maximum displacement appeared at the vault of the left tunnel. For contrast, the deformation obtained in the numerical simulation is also depicted in Figure 7. There was a good agreement between the experimental results and the simulation results.
2.3.3. Failure Patterns of the Liner
Figure 8 records the photographs of the cracks observed in the front surface of the lining during the loading process. The micro-cracks initiated at the bottom of the middle wall. When the overload increased to 0.4 MPa, the crack propagated quickly. Almost at the same time, the inverted arch of both tunnels cracked (Figure 8a,b). With the increase of overload, the liner deformed outward at the sidewall and inward at the crown. Thus, the inside of the crown and the outside of the sidewall were working under tension. As the overload increased to 2.0 MPa, cracking conditions were reached at the sidewall and crown of the left tunnel (Figure 8c,d). Meanwhile, a flexural crack was also observed at the crown of the right tunnel (Figure 8e). As the overload increased from 2.4 MPa to 2.8 MPa, the existing cracks propagated further. Cracks at the bottom of the middle wall almost ran through the width of the liner and the concrete inside detached. Moreover, a second crack was observed at the invert arch for both tunnels. When loading to 3.2 MPa, crack occurred at the external face of the arch foot in the right tunnel (Figure 8f). When the overload increased from 4.4 MPa to 4.8 MPa, the liner deformed outward without any restraint at the spandrel near the void, which led to cracks outside and concrete flakes at the internal surface (Figure 8g,h). Additionally, the left tunnel with a larger diameter experienced much more severe damage than the right one.
The failure mode of the liner is illustrated by Figure 9 on the basis of the testing results. Herein, the numbers stand for the emergence sequence of the cracks. A total of 13 cracks were recorded and mainly distributed on the internal surface of the crown, inverted arch and the external surface of the sidewall, the arch foot, and the connection between the spandrel and middle wall. Most of the cracks presented a “Λ” shape, and the crack opening displacement gradually decreased along the direction of propagation. Visible cracks occurred firstly at the bottom of the middle wall and these were more active. In addition, cracks at the inverted arch of both tunnels also grew quickly and almost ran through the width of the liner. As for the connection between the spandrel and the middle wall, concrete flaked and detached on the inside of the liner. While the crack mouth opening was small, a slight fault dislocation in the lining may be formed.
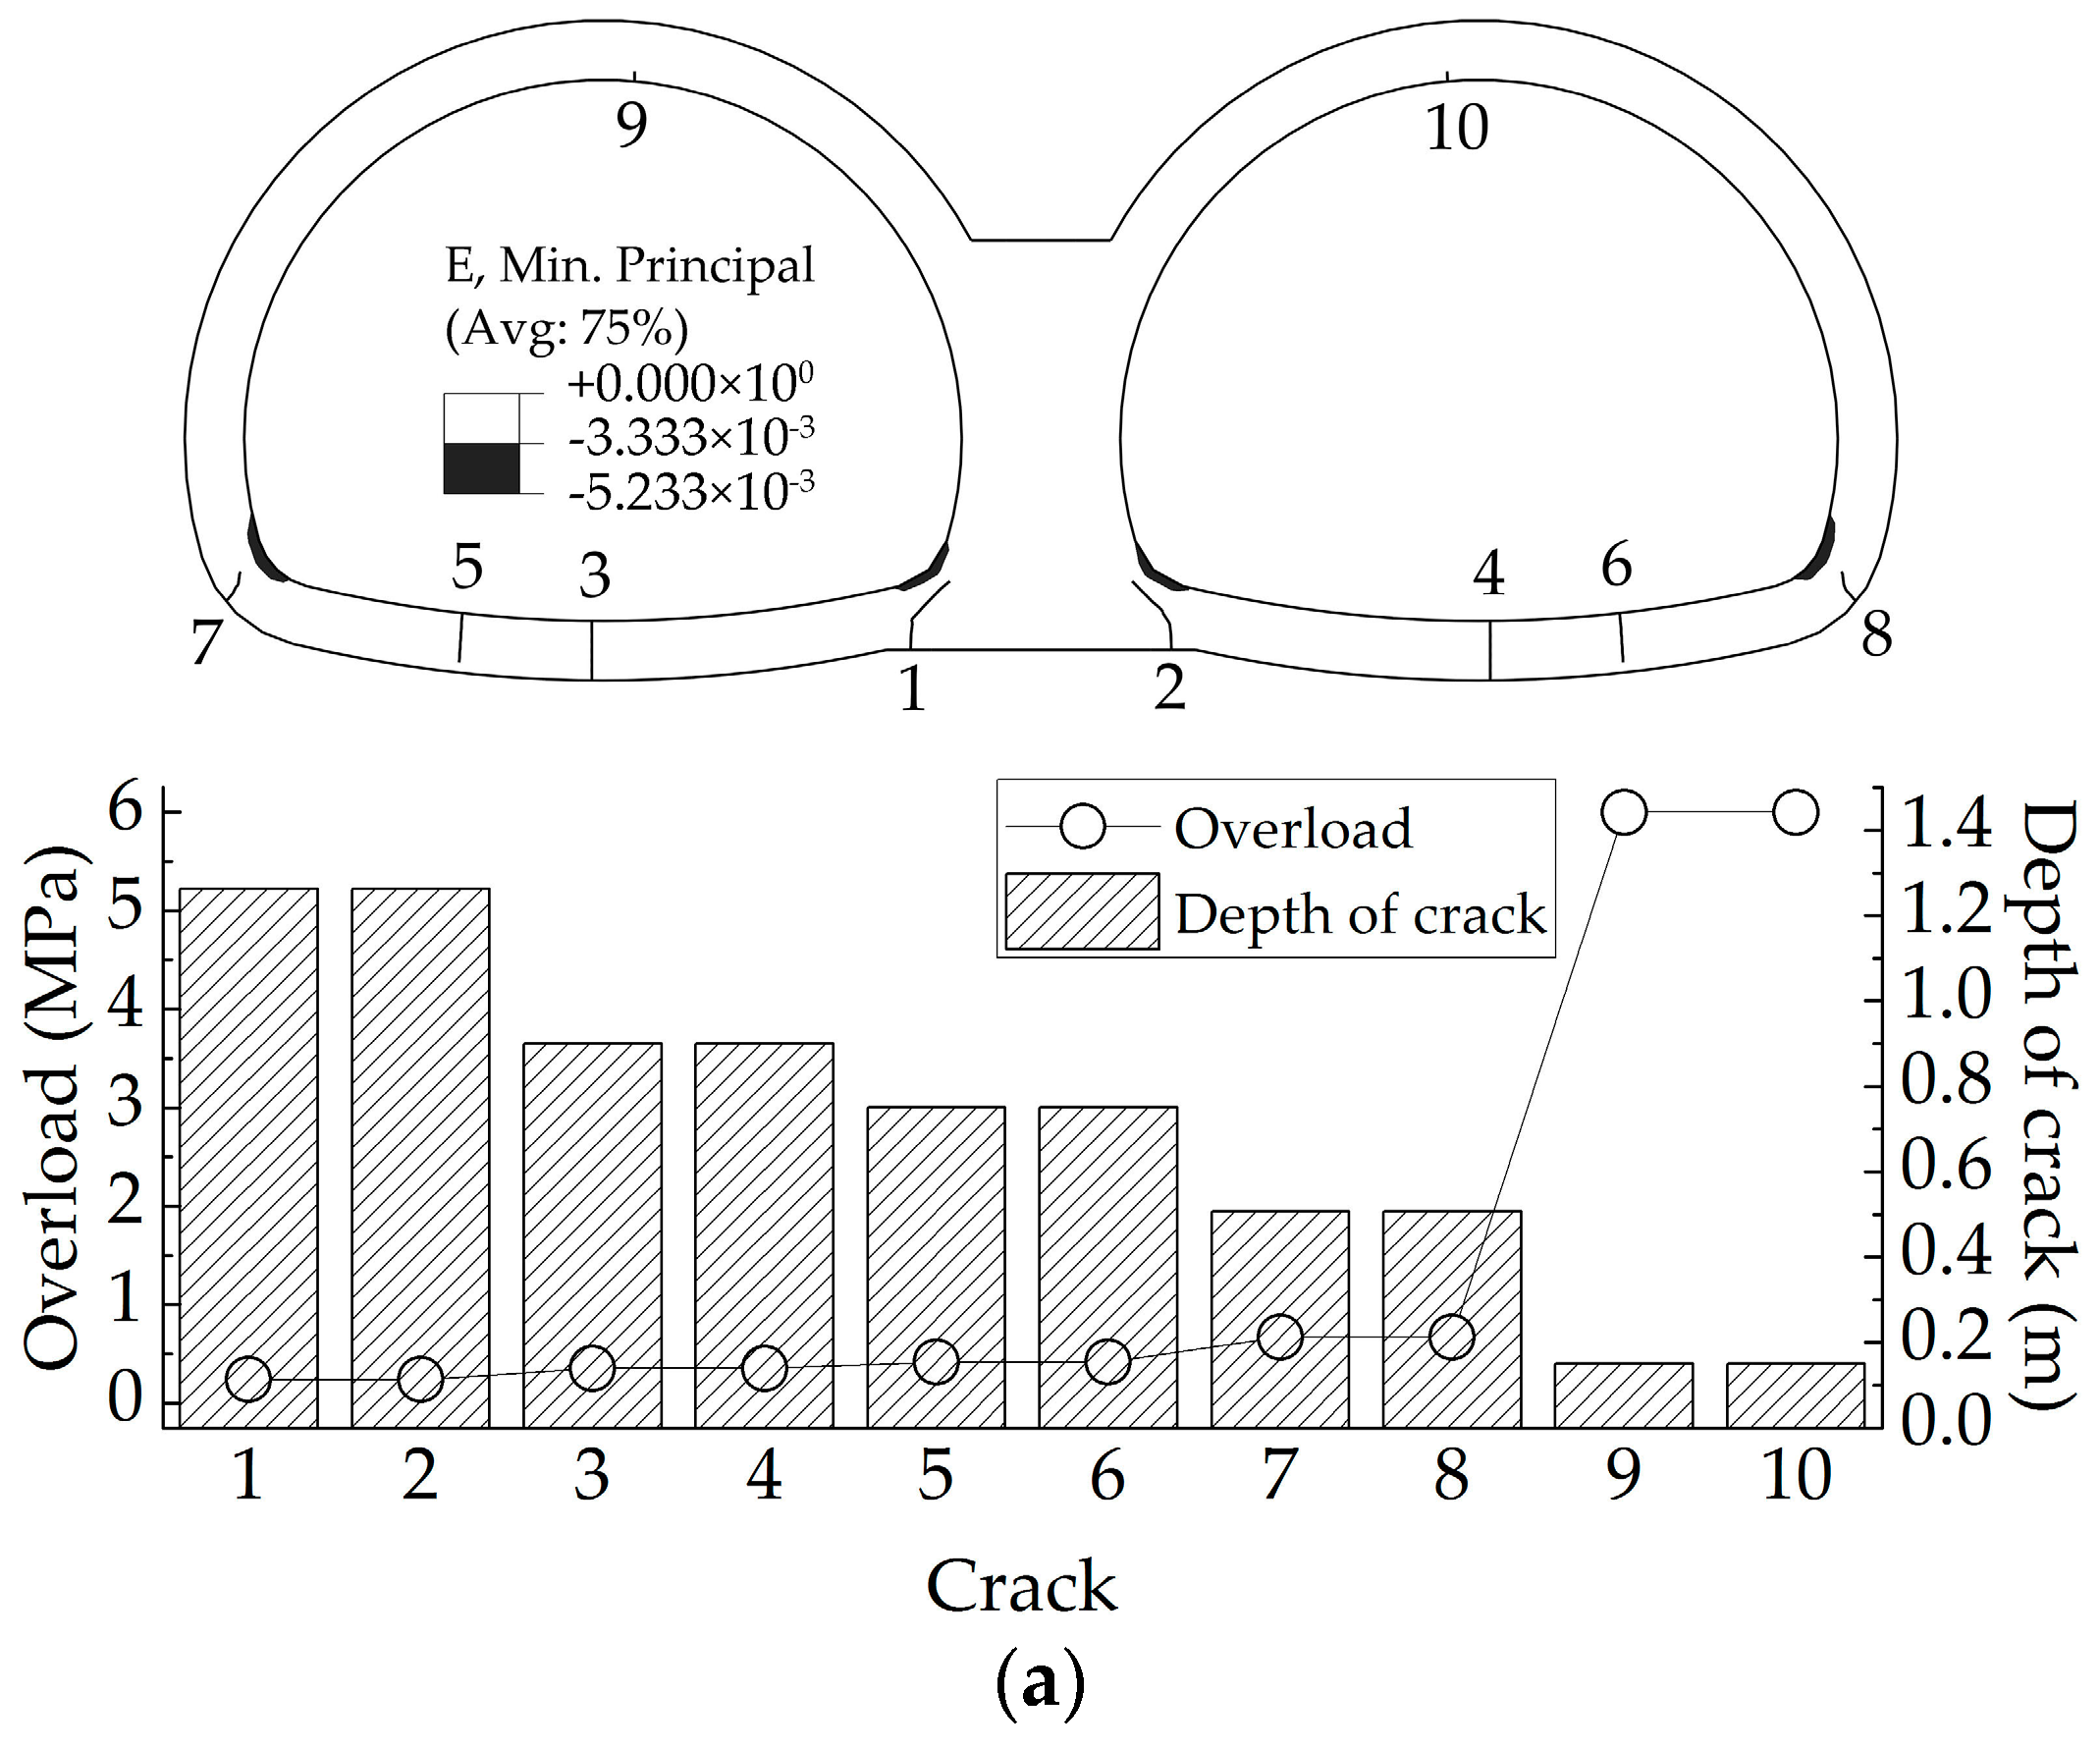
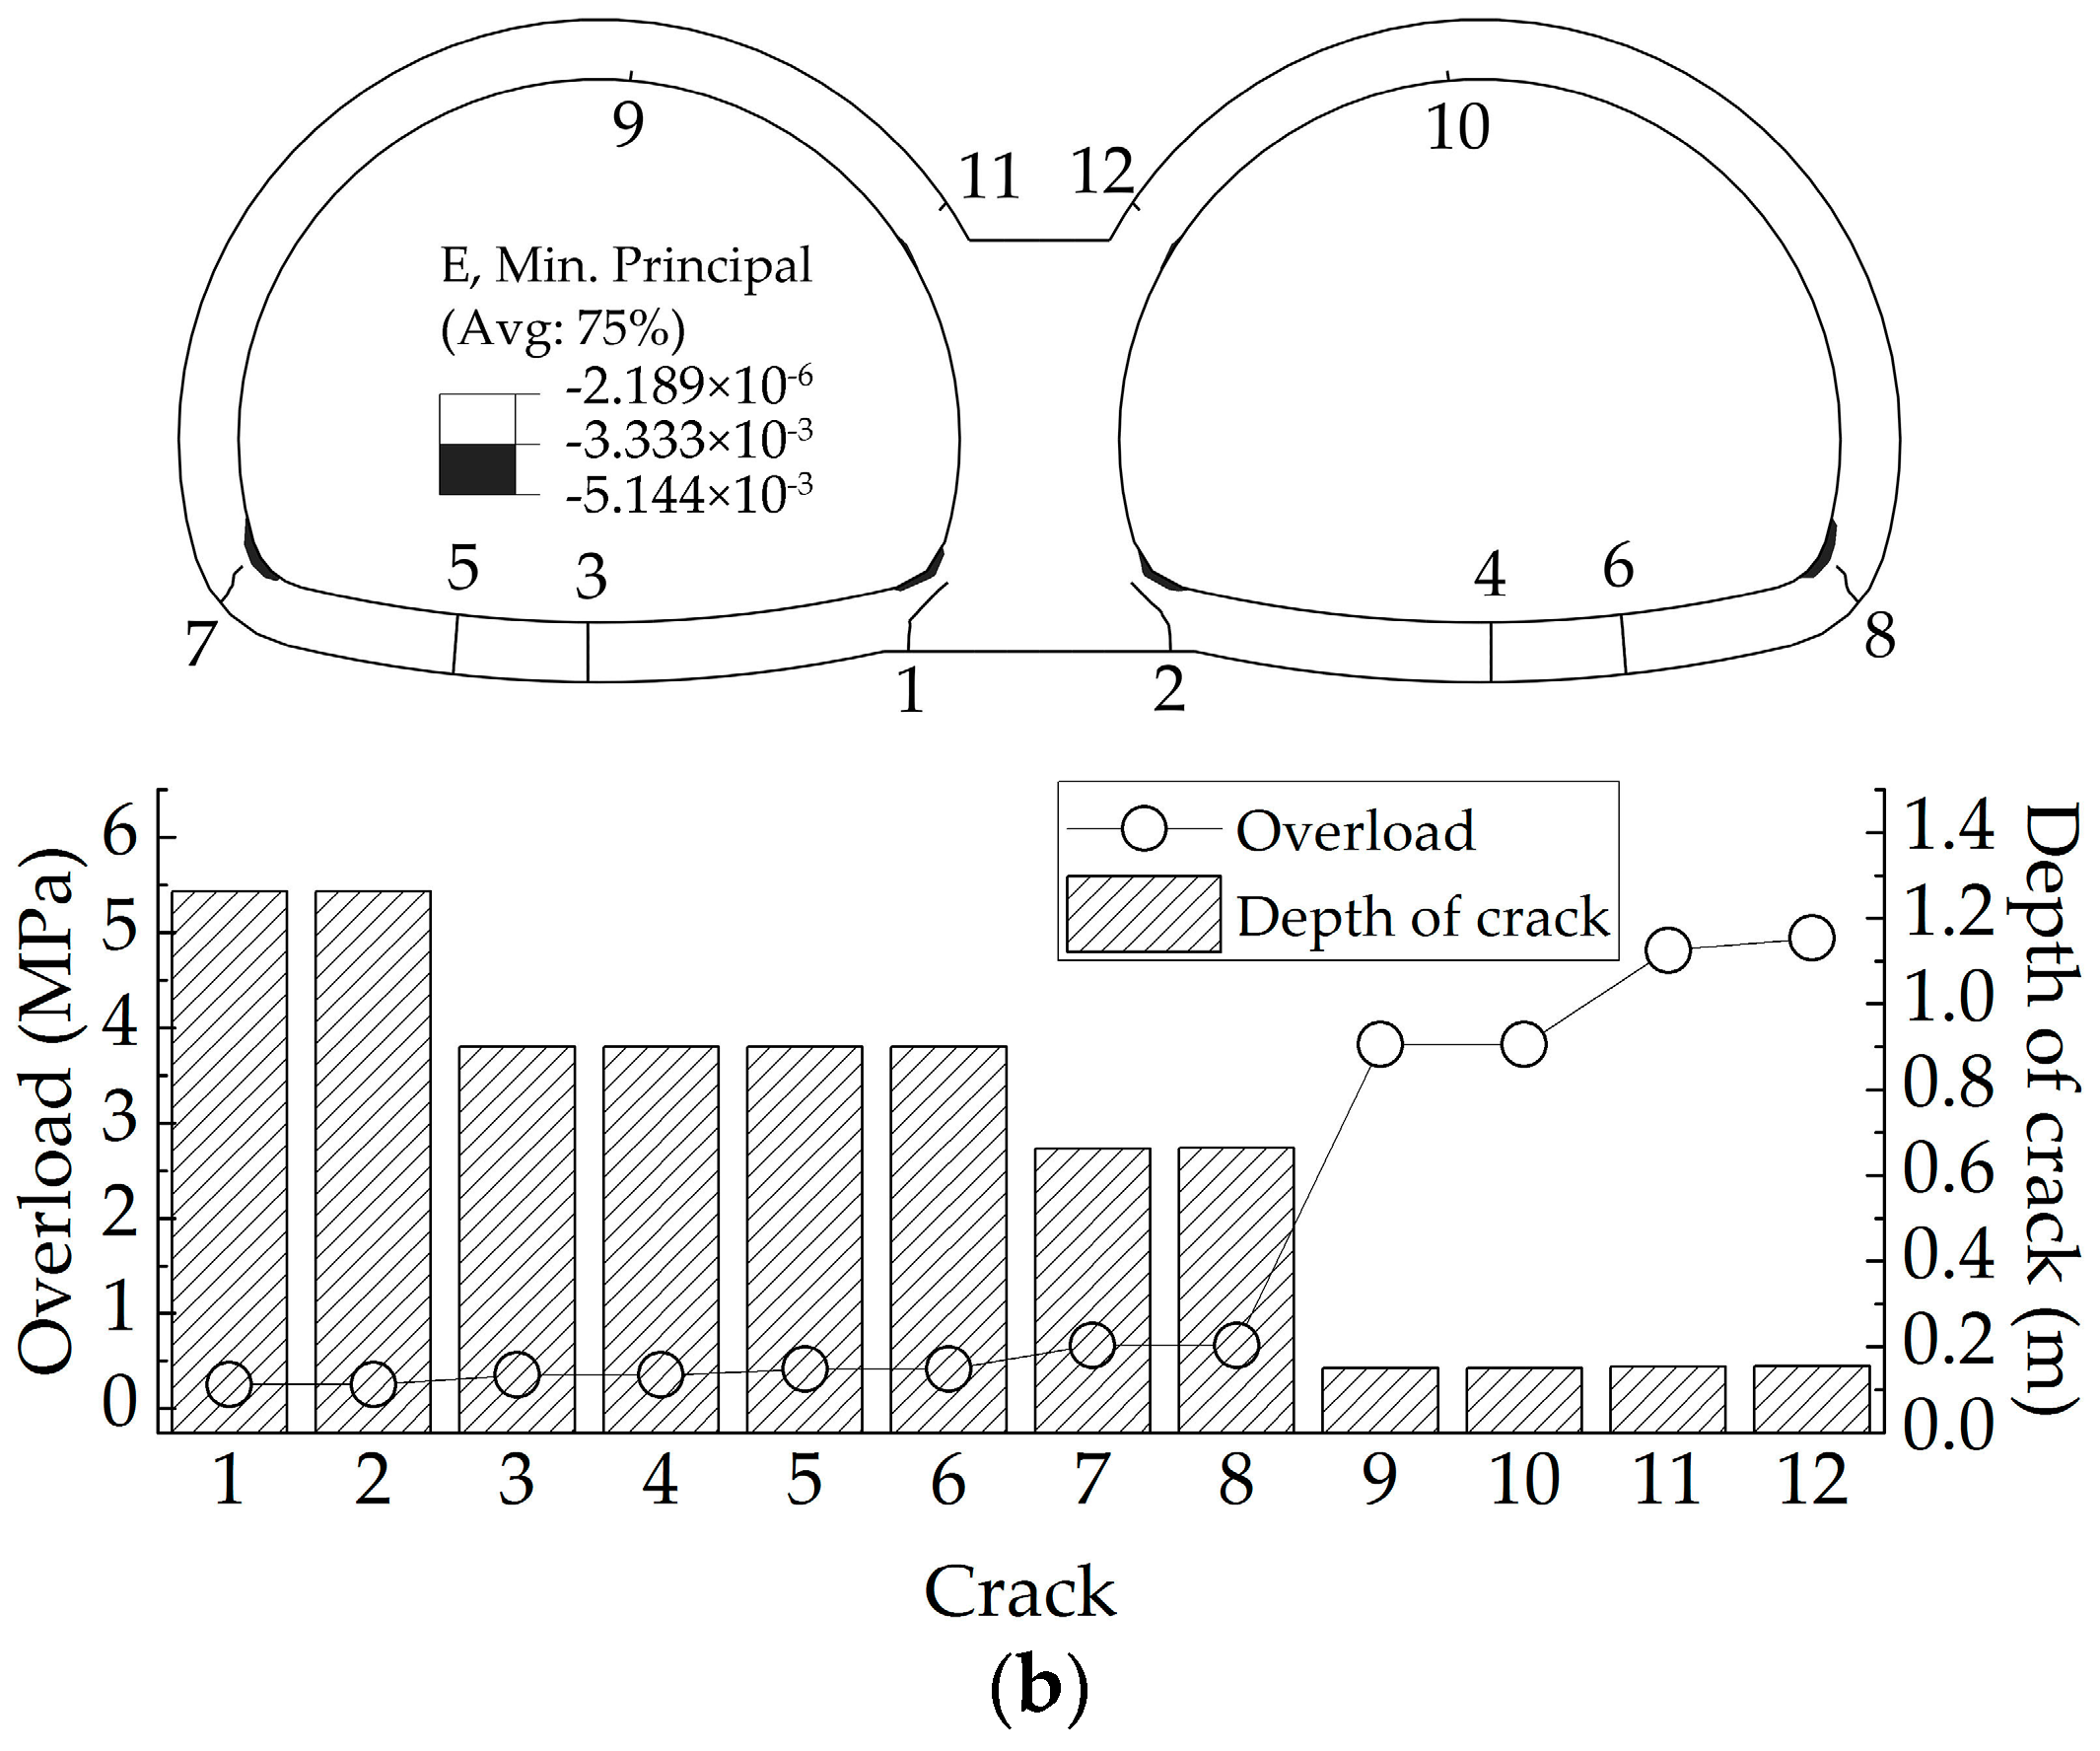
Crack propagation patterns obtained from the numerical analysis are presented in Figure 10, in which the depth of cracks and cracking load are also presented to analyze the degree of cracking. The shaded areas in the figure represent concrete compression failure zones determined by the compressive strain, and the numbers stand for the emergence sequence of the cracks.
As described, the crack patterns in the numerical simulation showed a good agreement with those in the model test, except for the cracking load. A possible reason for the difference between the model test and the numerical simulation may lay in the fact that the load increment for every step in the model test was too large, so we cannot obtain the necessary information, such as the accurate cracking load. Thus, it was reasonable to conclude that the numerical simulation reproduced the model test well, and can be used to further analyze the effect of voids on double-arch tunnels.
3. Effects of the Void on the Top of the Middle Wall on Double-Arch Tunnels
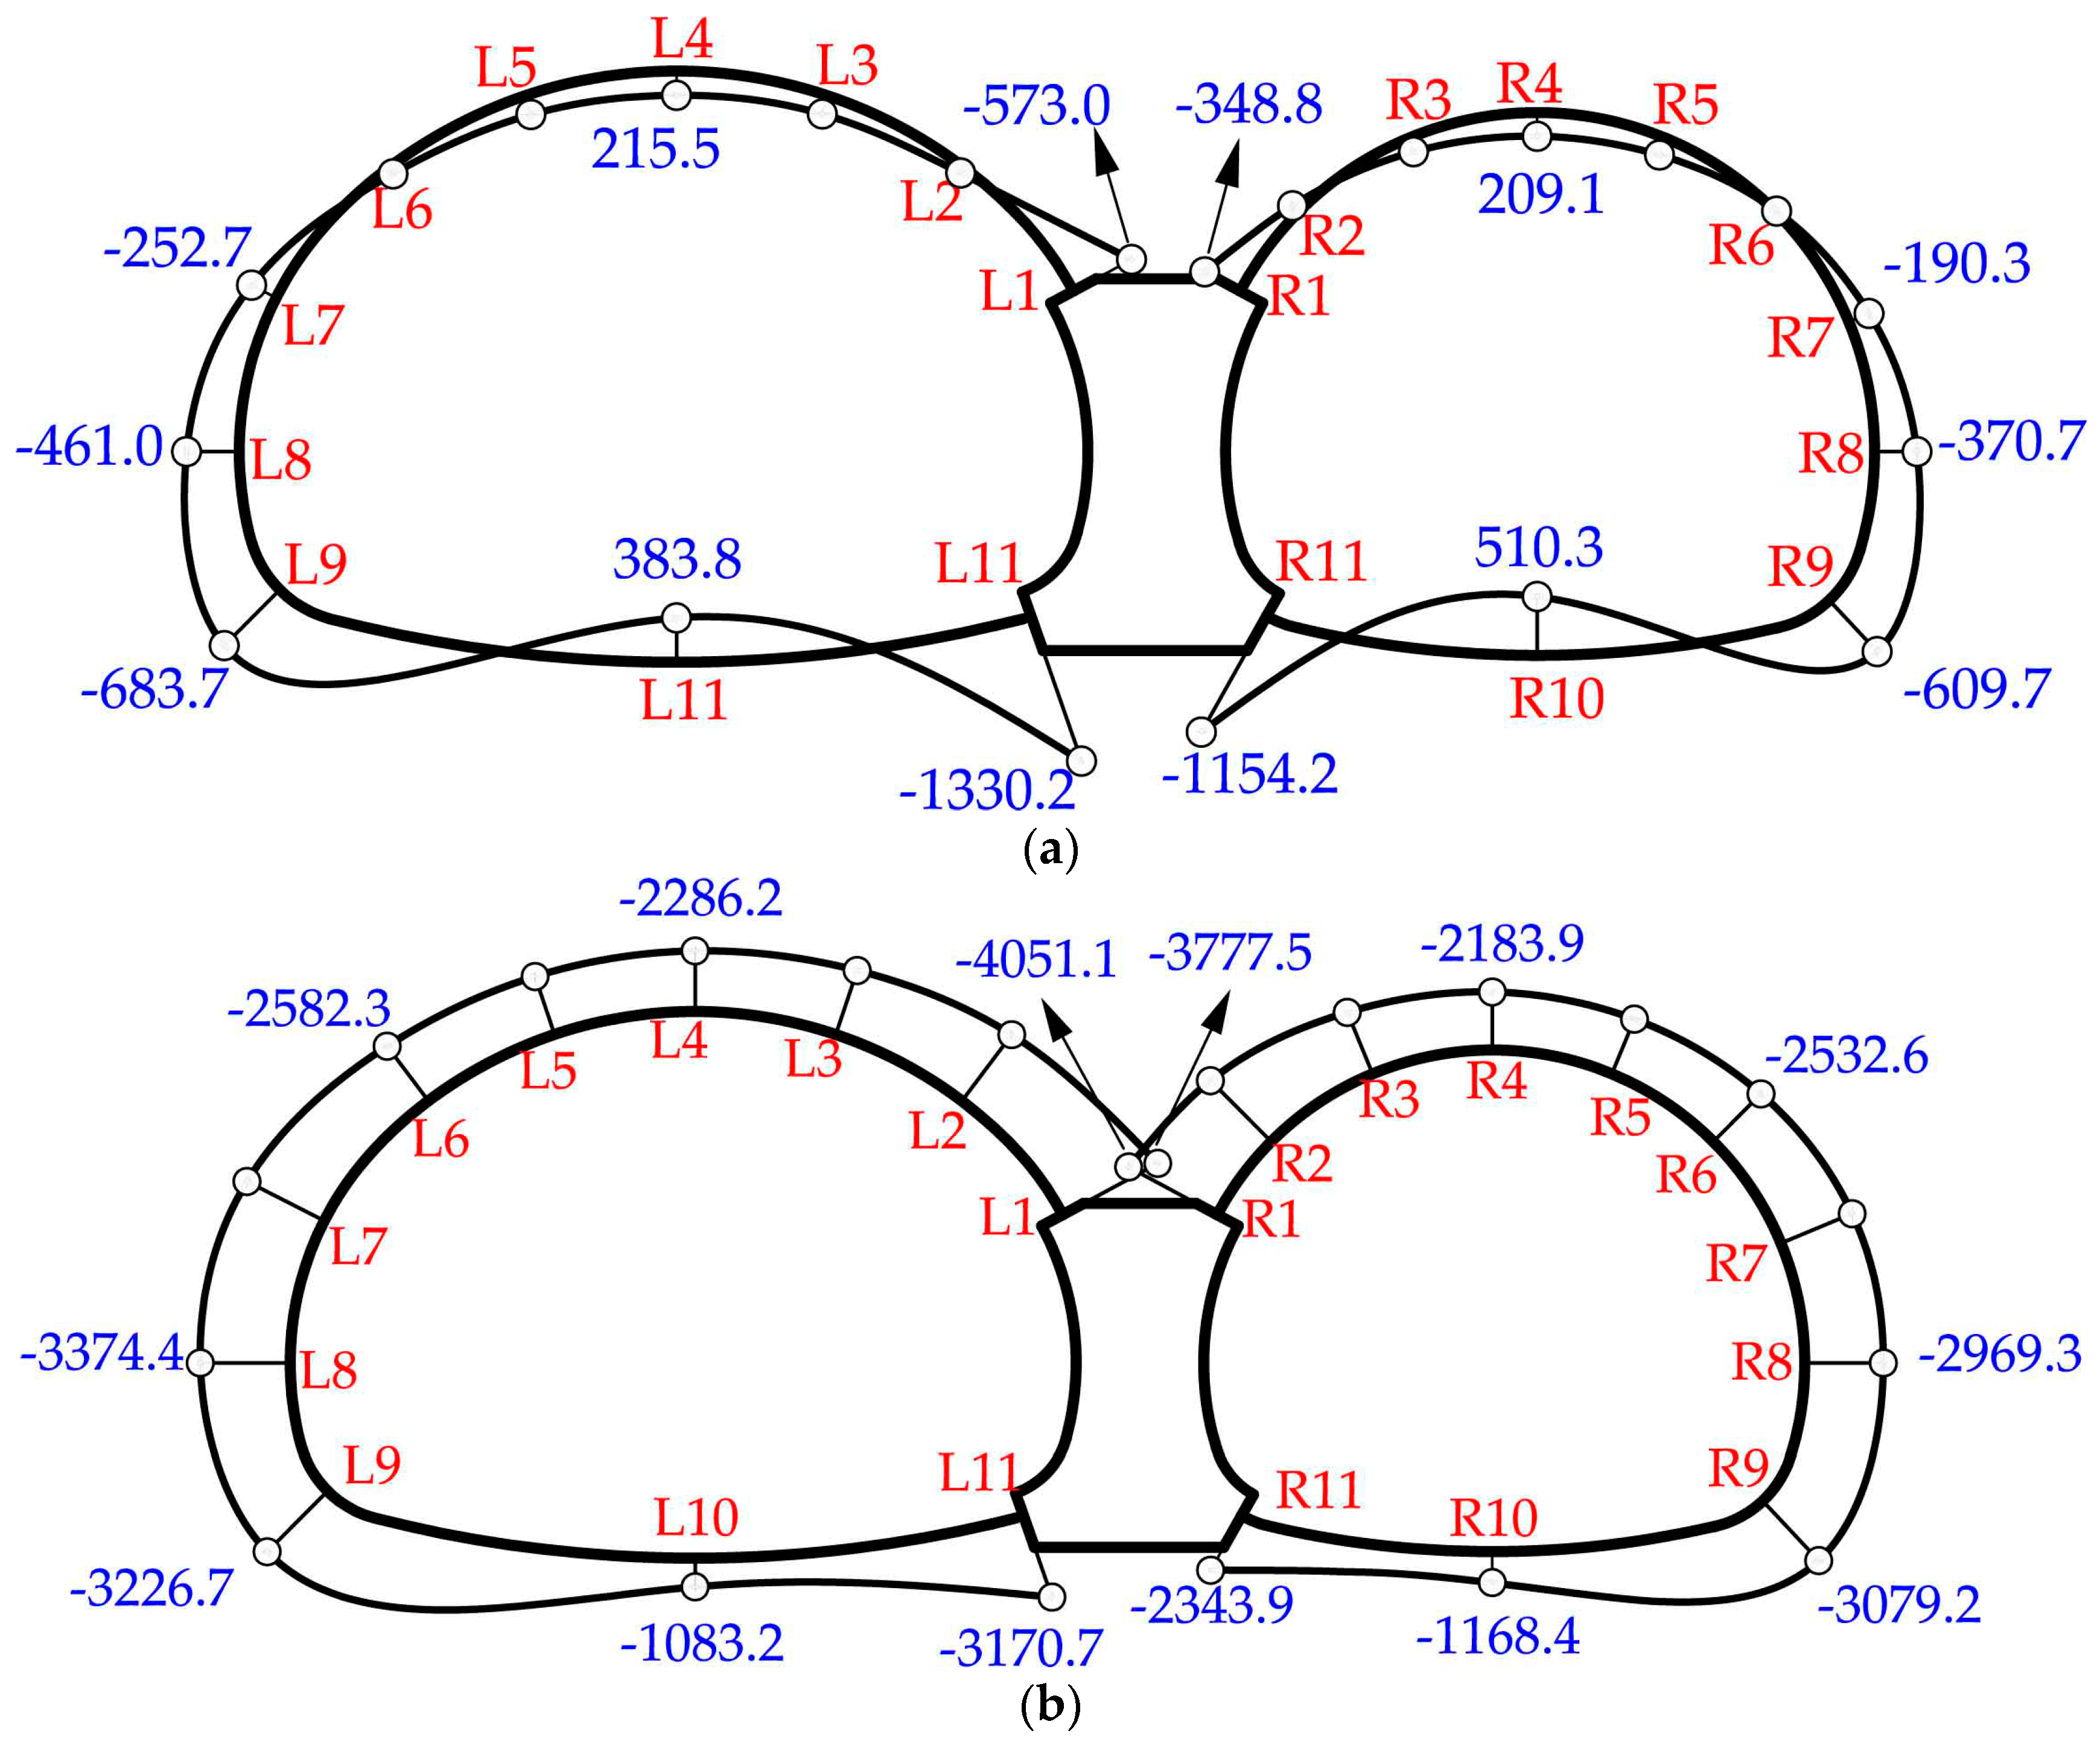
A total of five numerical simulations were carried out to investigate the effects of voids on double-arch tunnels from the following two aspects: (1) void size; (2) tunnel shape. Cross sections considered in this paper are shown in Figure 11. The size of the voids was varied in terms of height, as seen in Table 3. The other properties were the same as those in the previous case.
3.1. Effects of Void Height
The effects of void height were analyzed by comparing the results of the no void case and cases with different sized voids on the top of the middle wall. Furthermore, all the analyses were focused on asymmetrical double-arch tunnels (CS1).
3.1.1. Effects of Void Height on Internal Forces
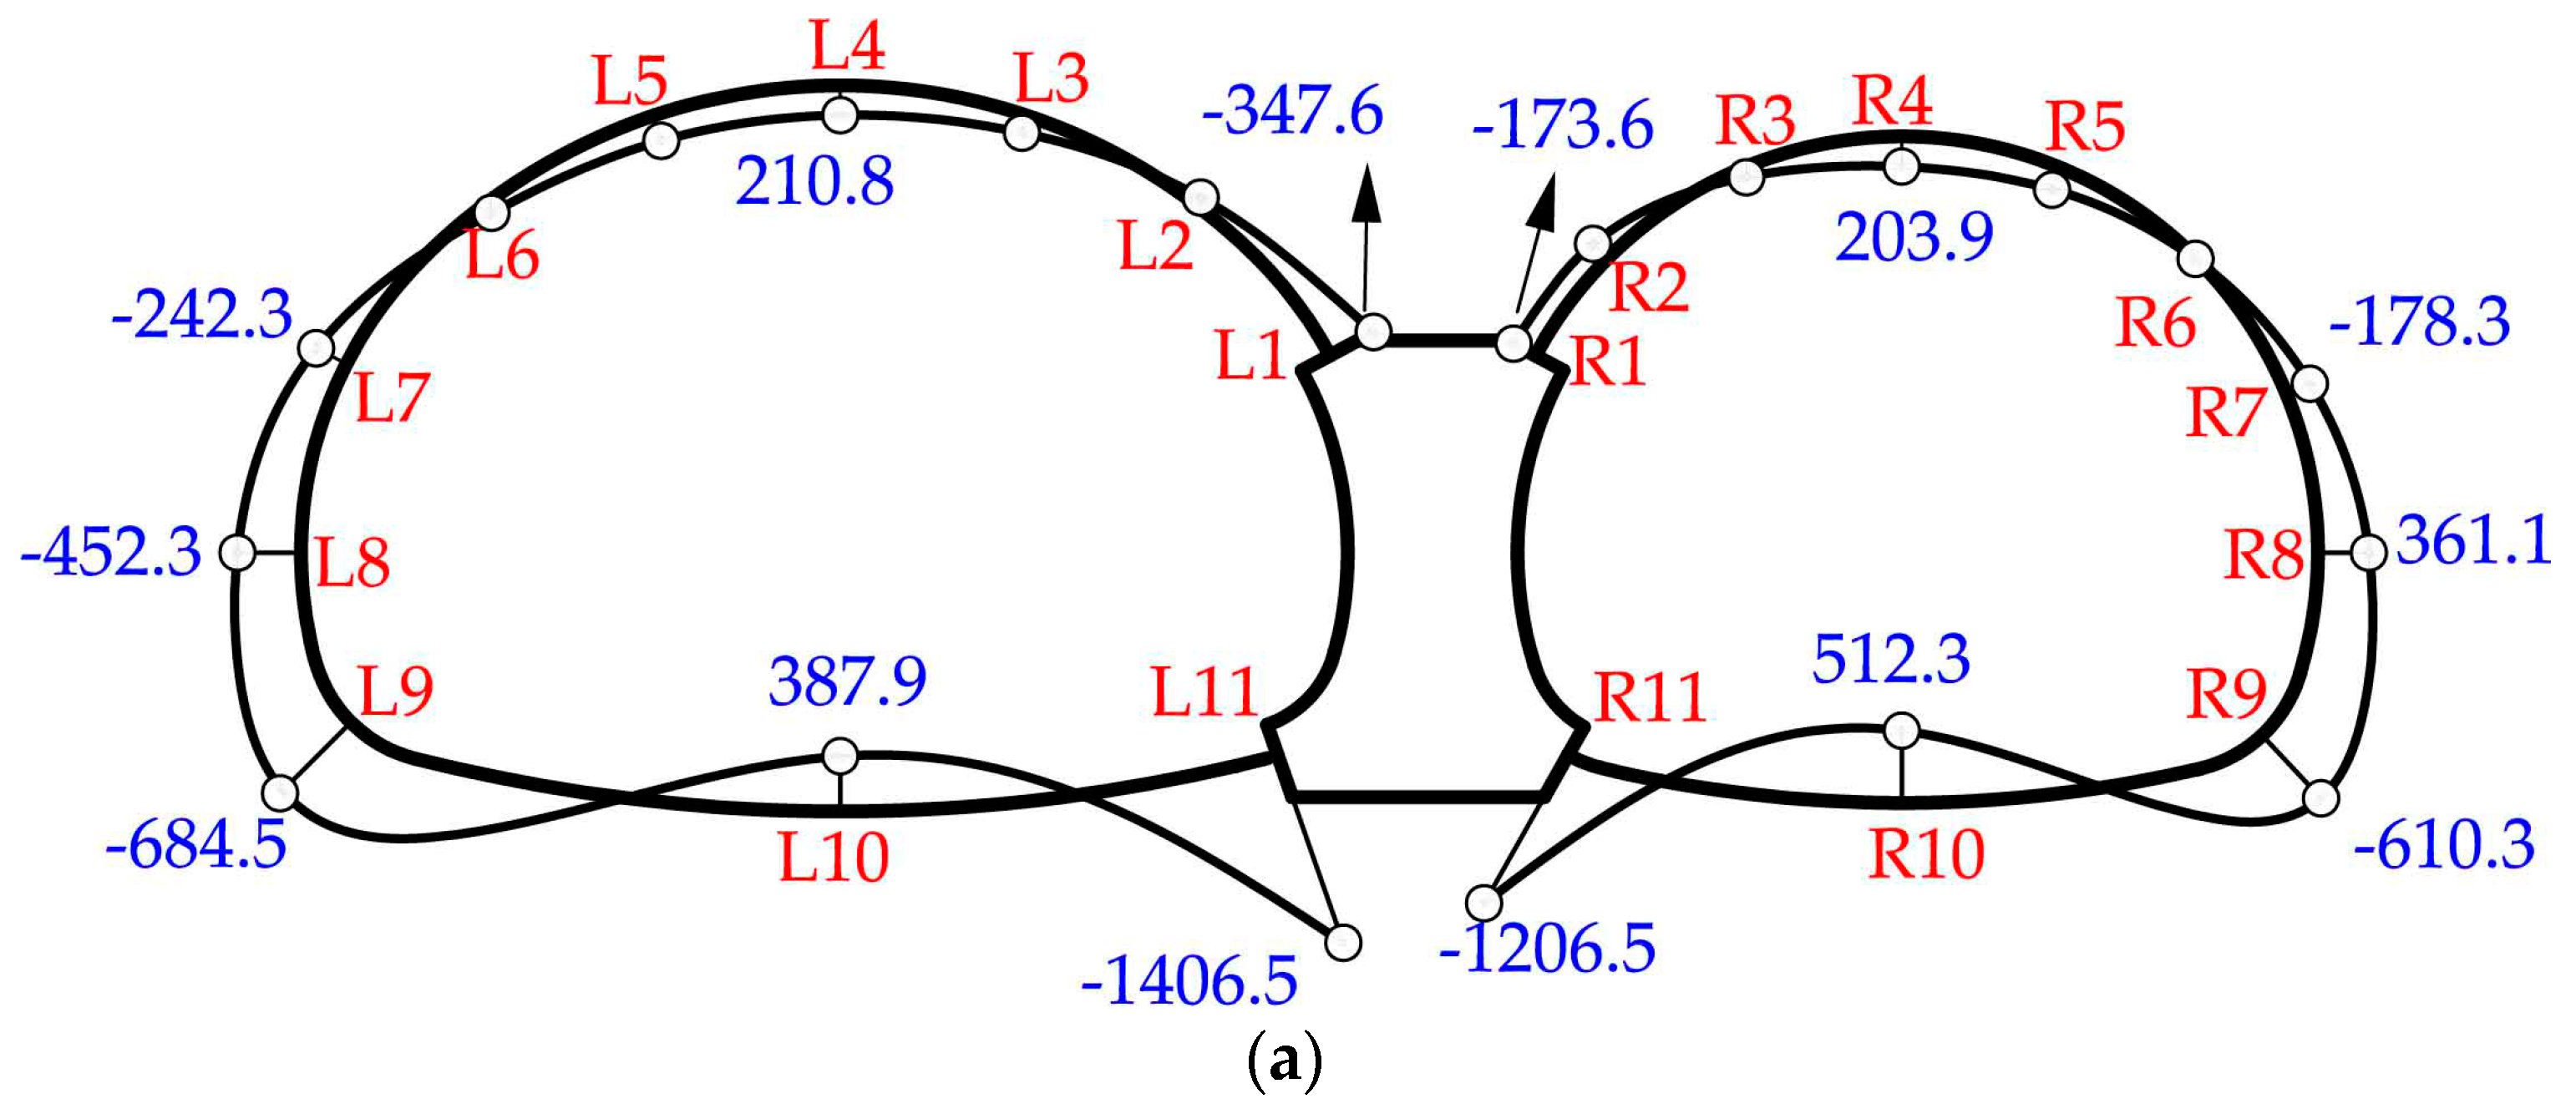
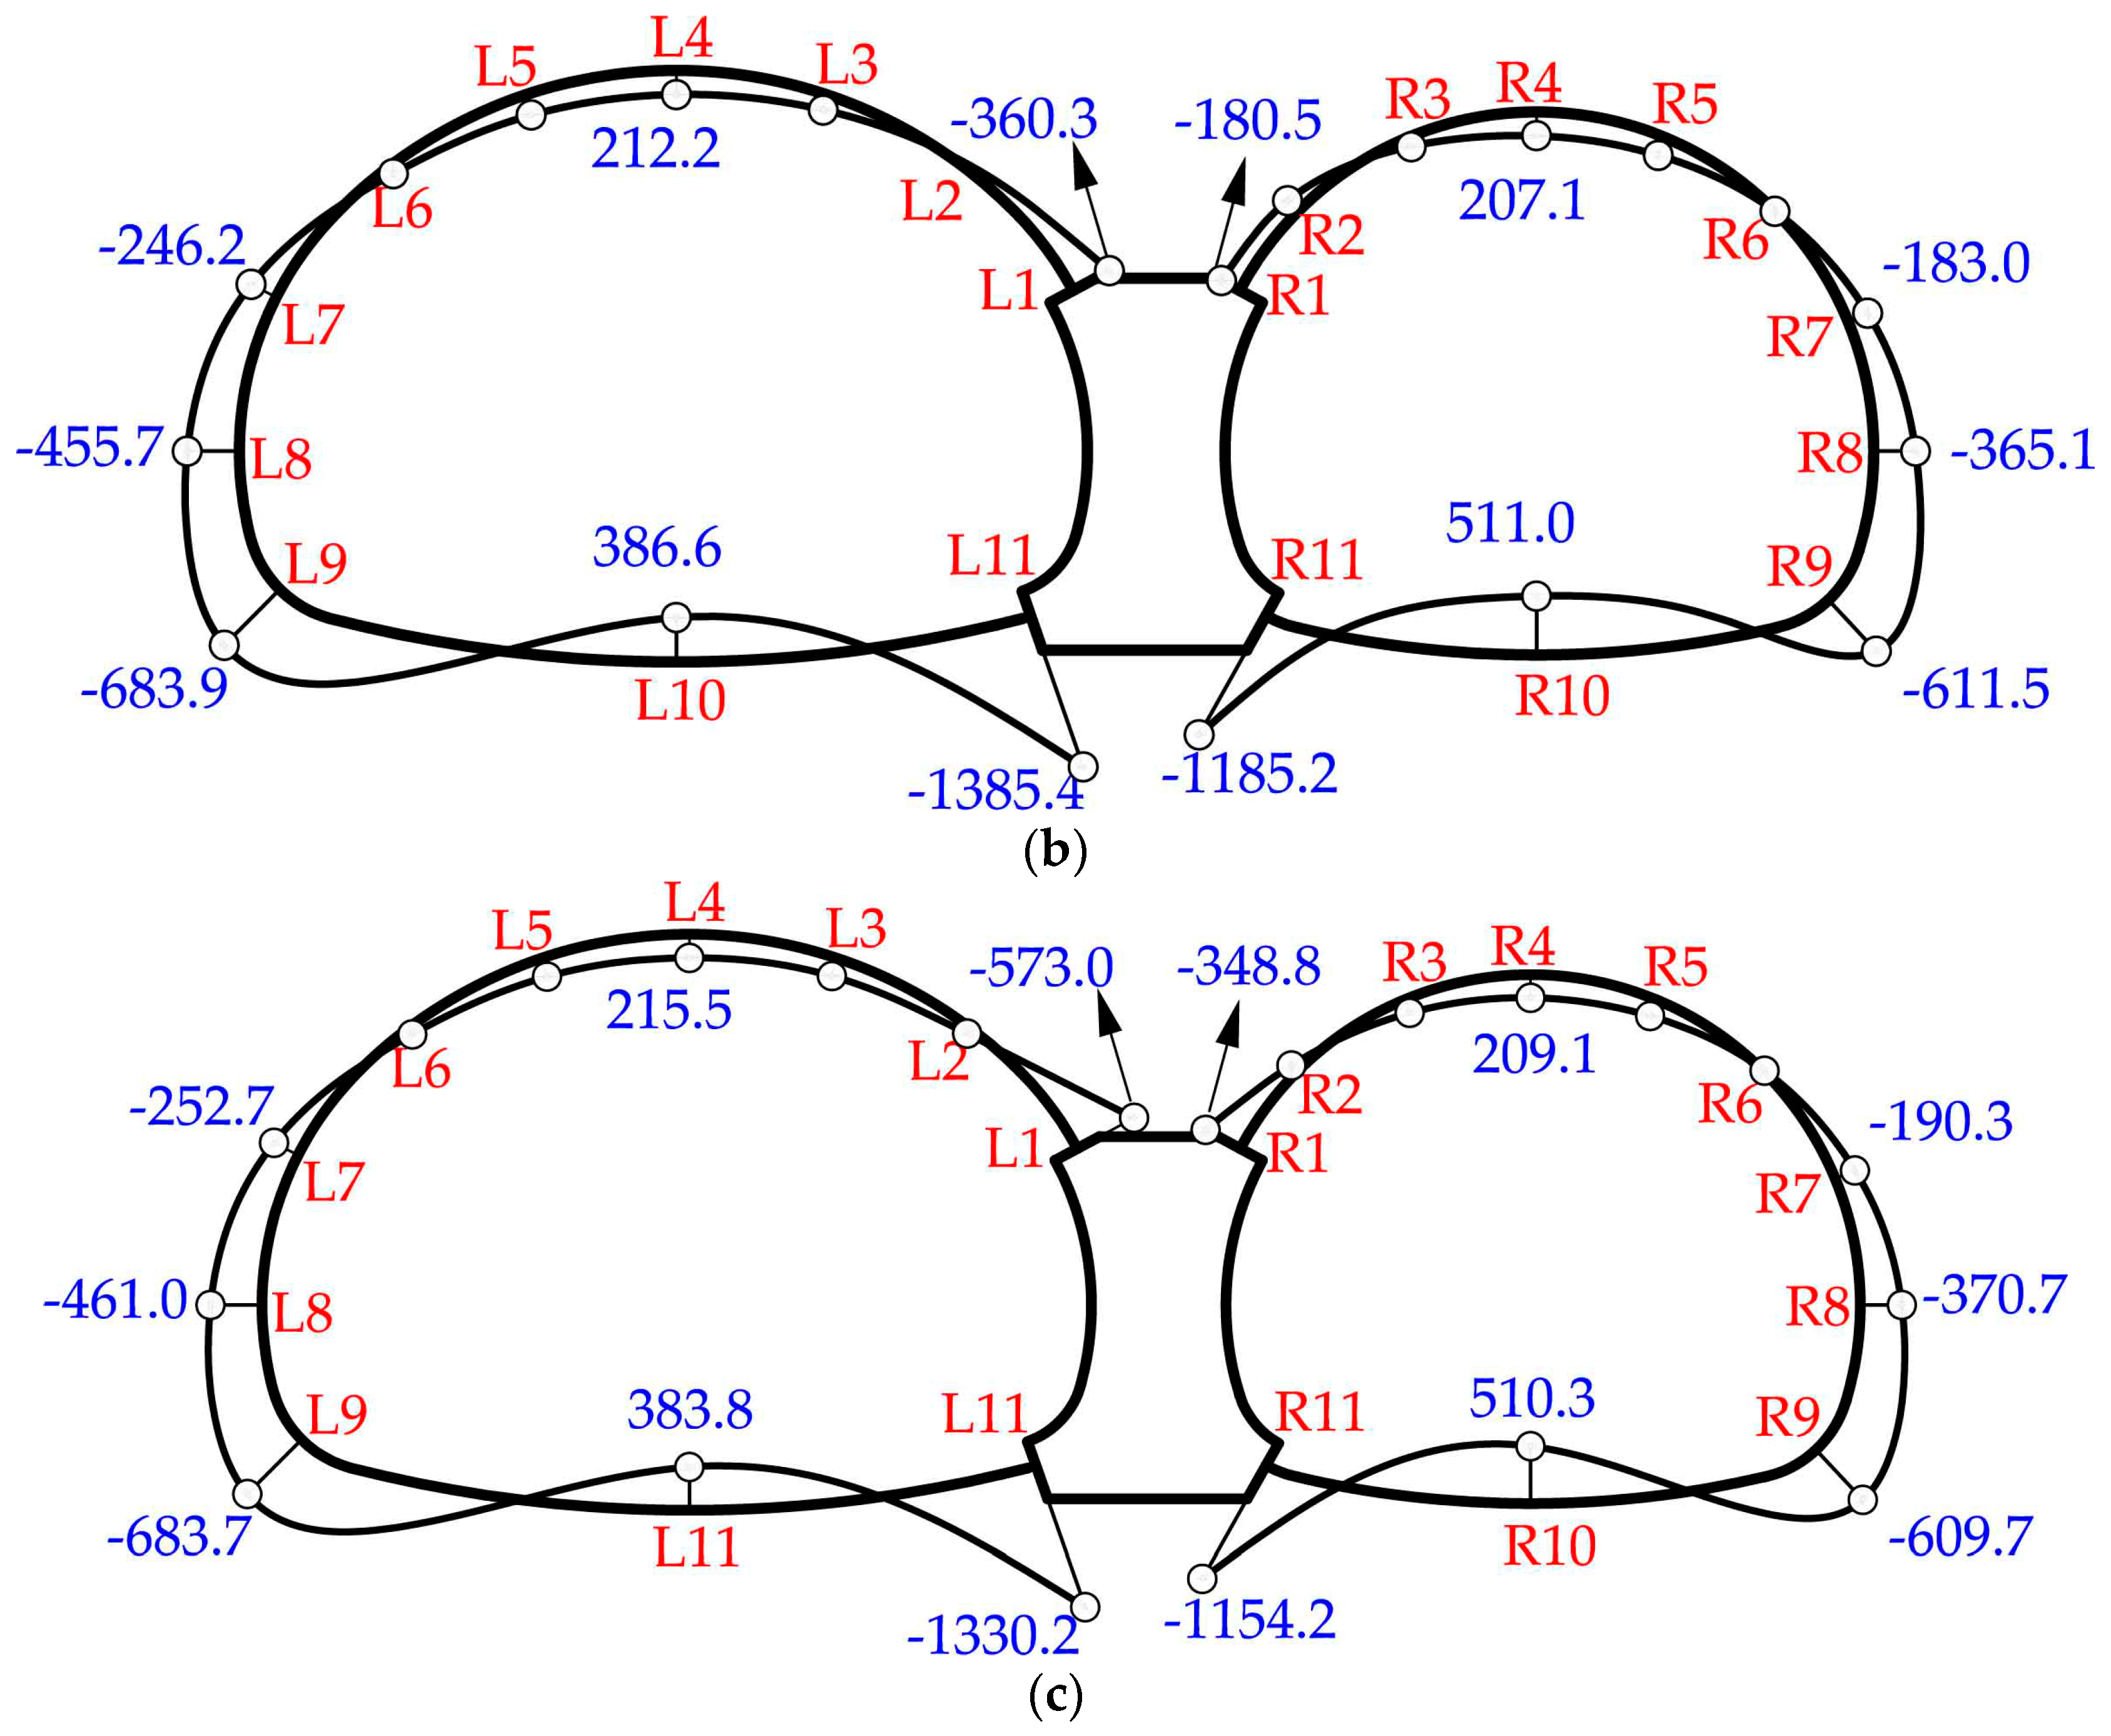
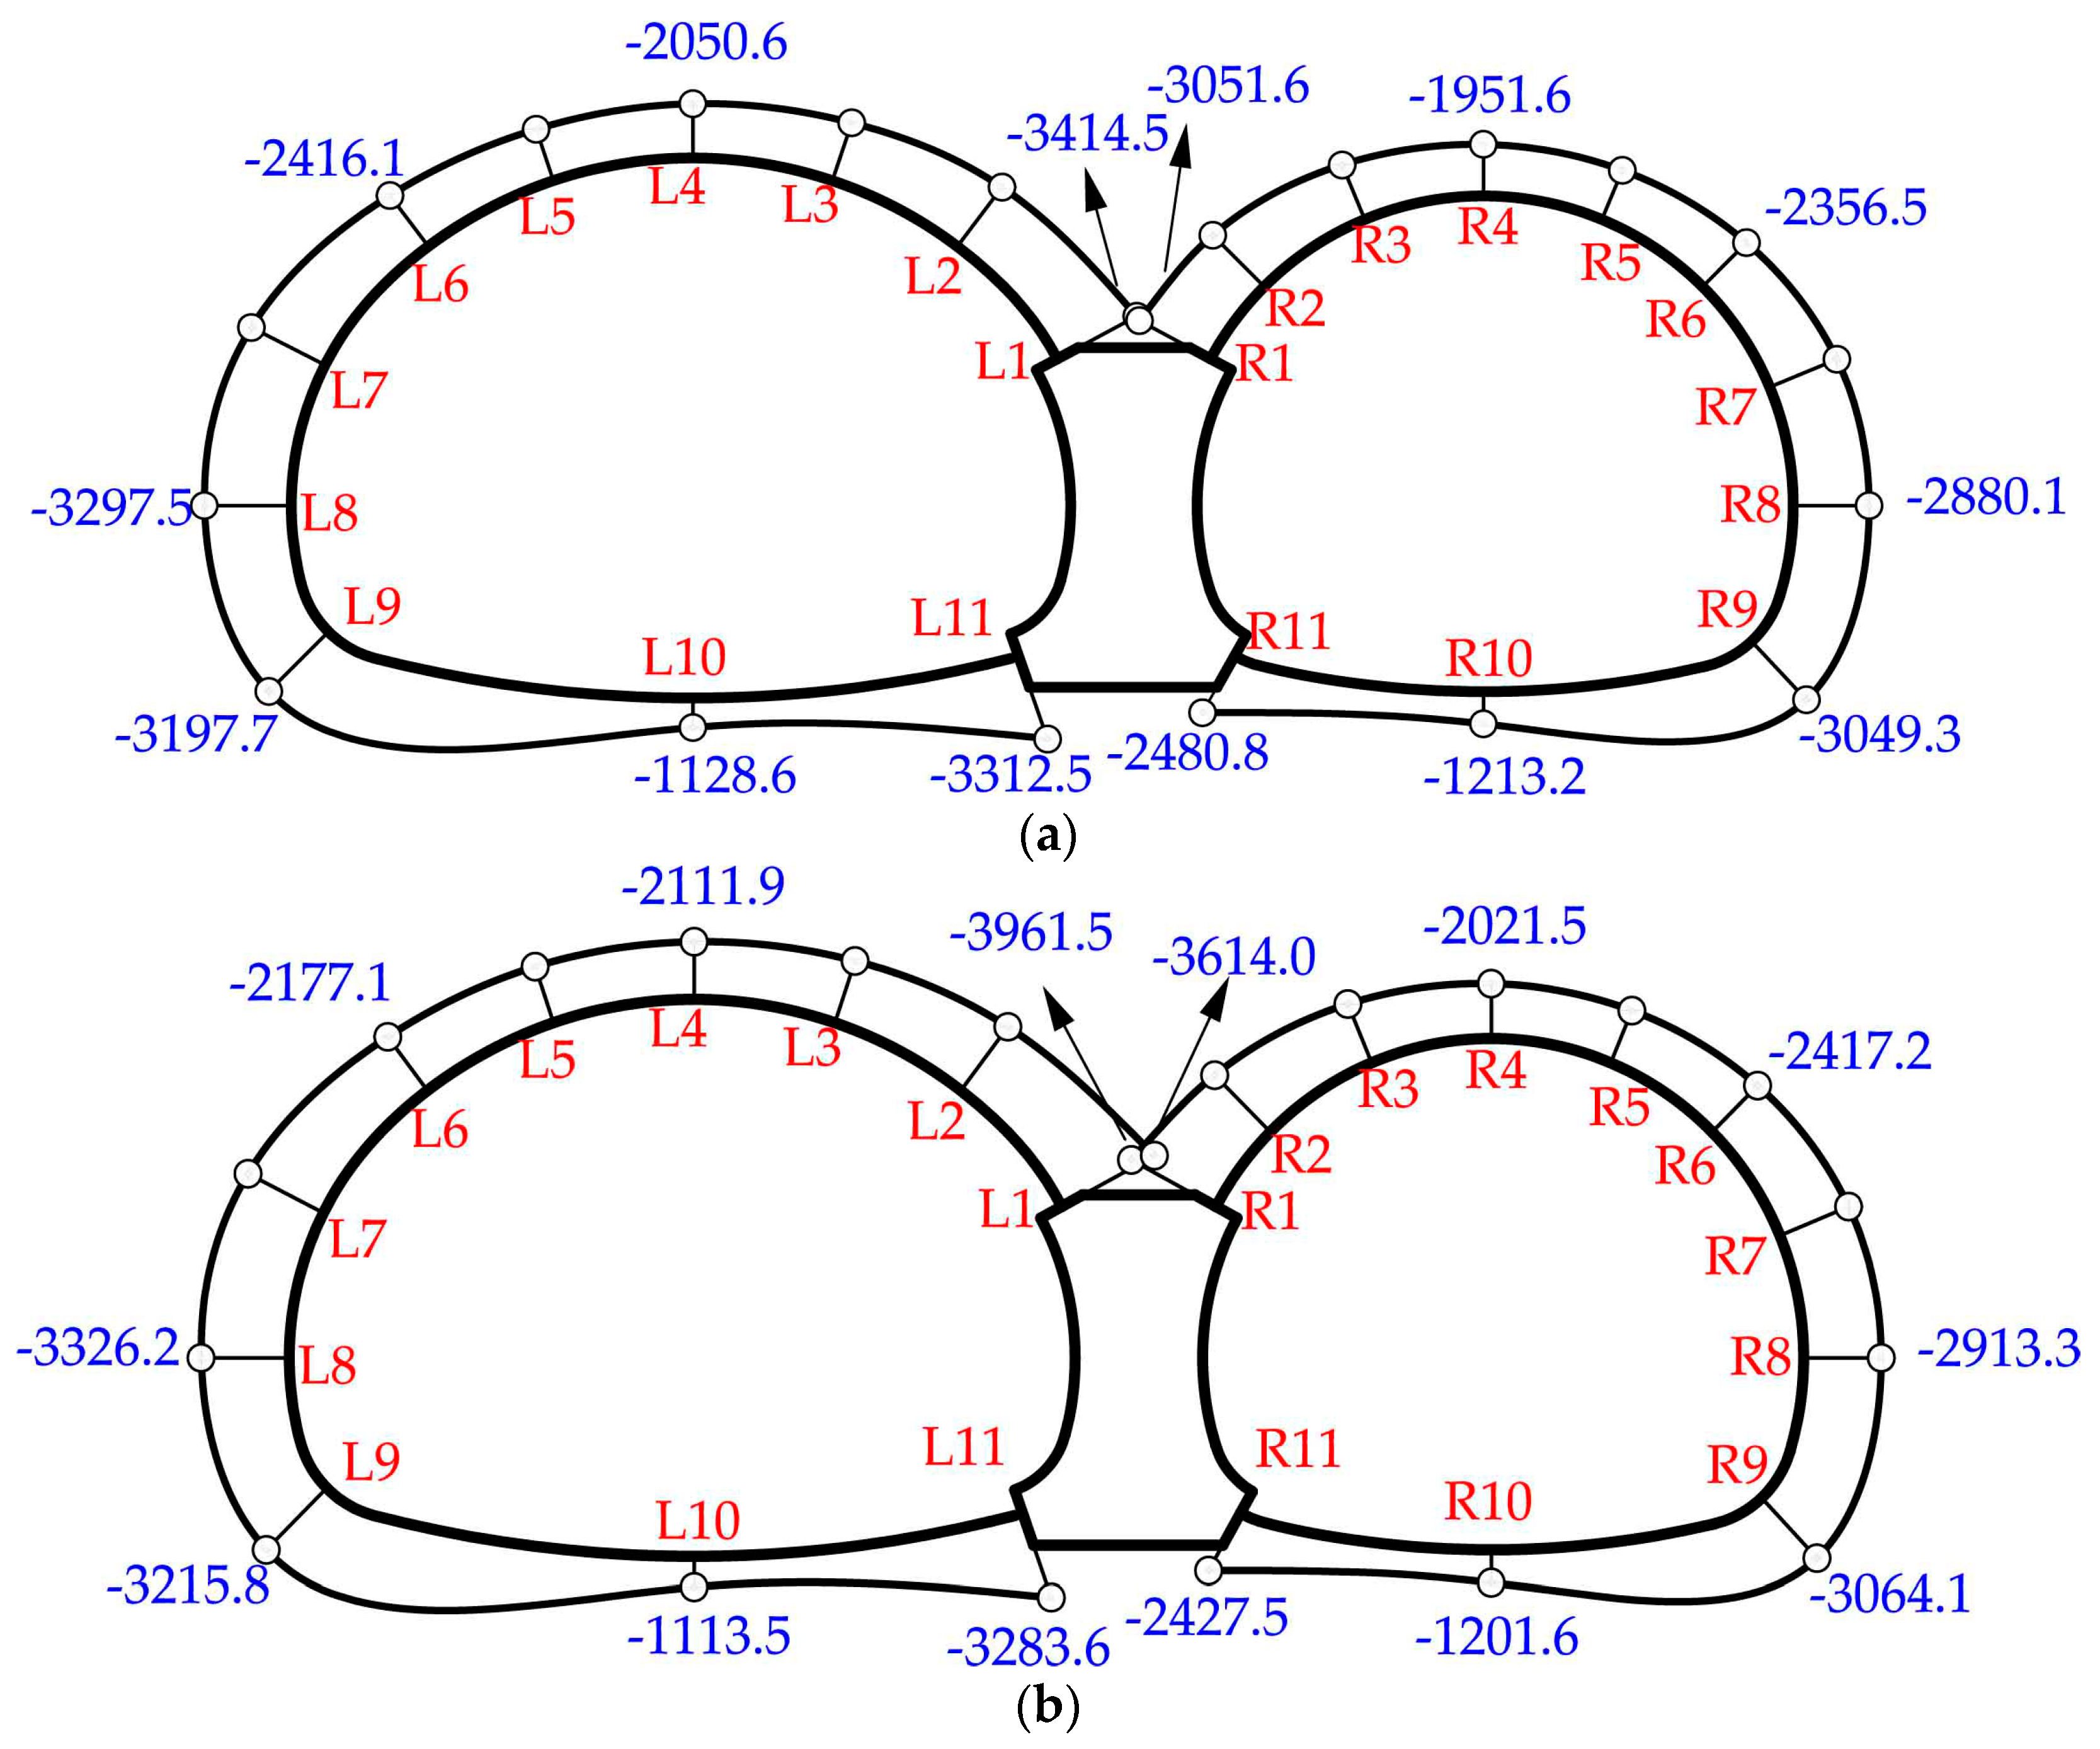
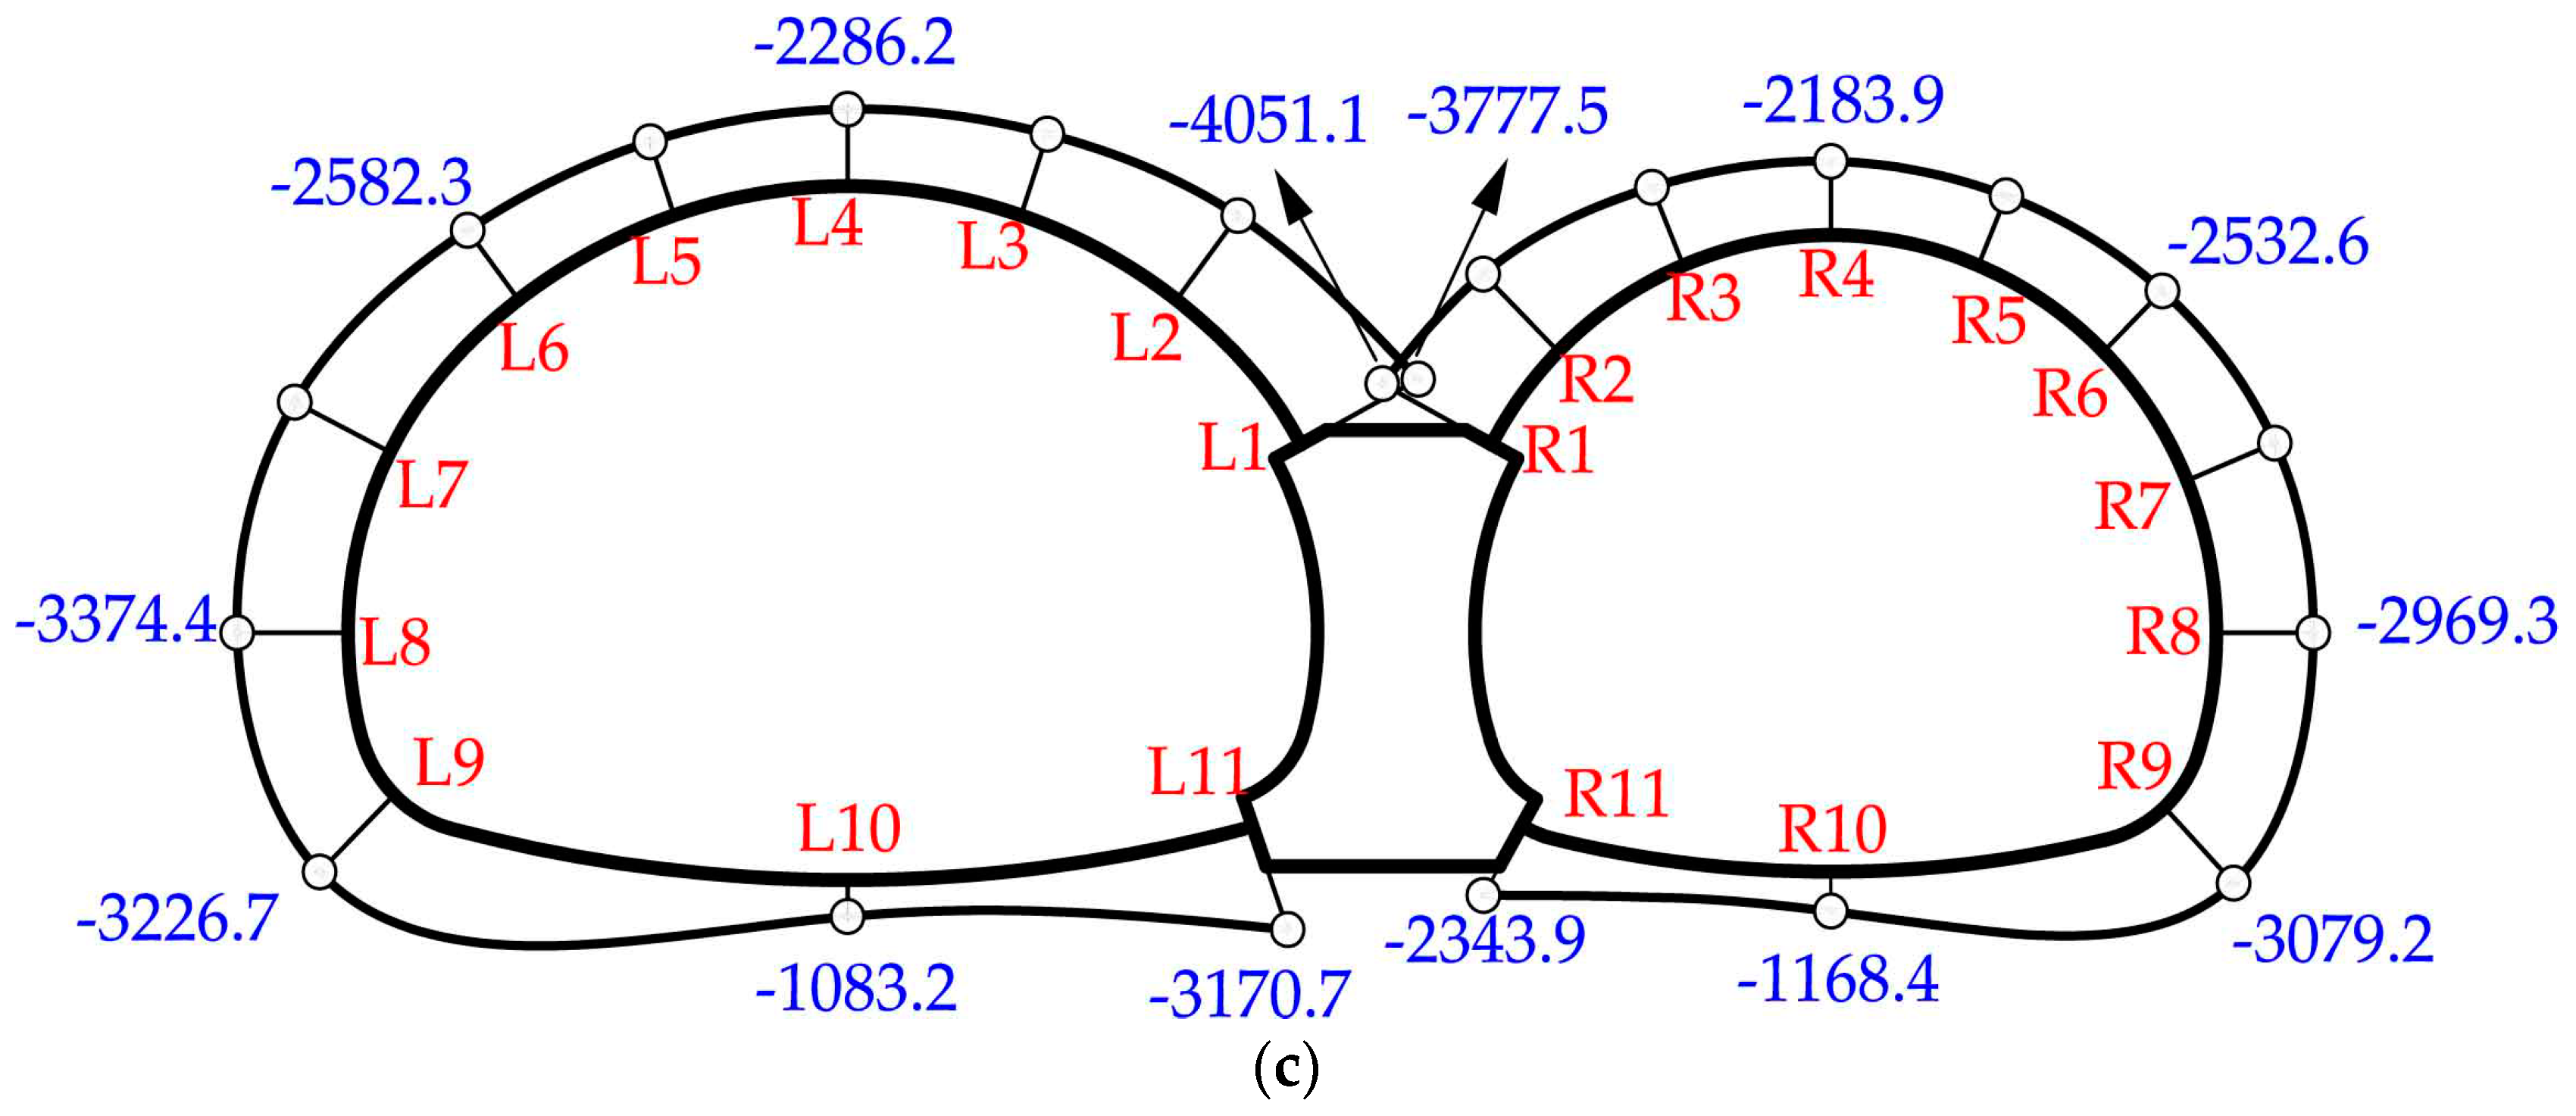
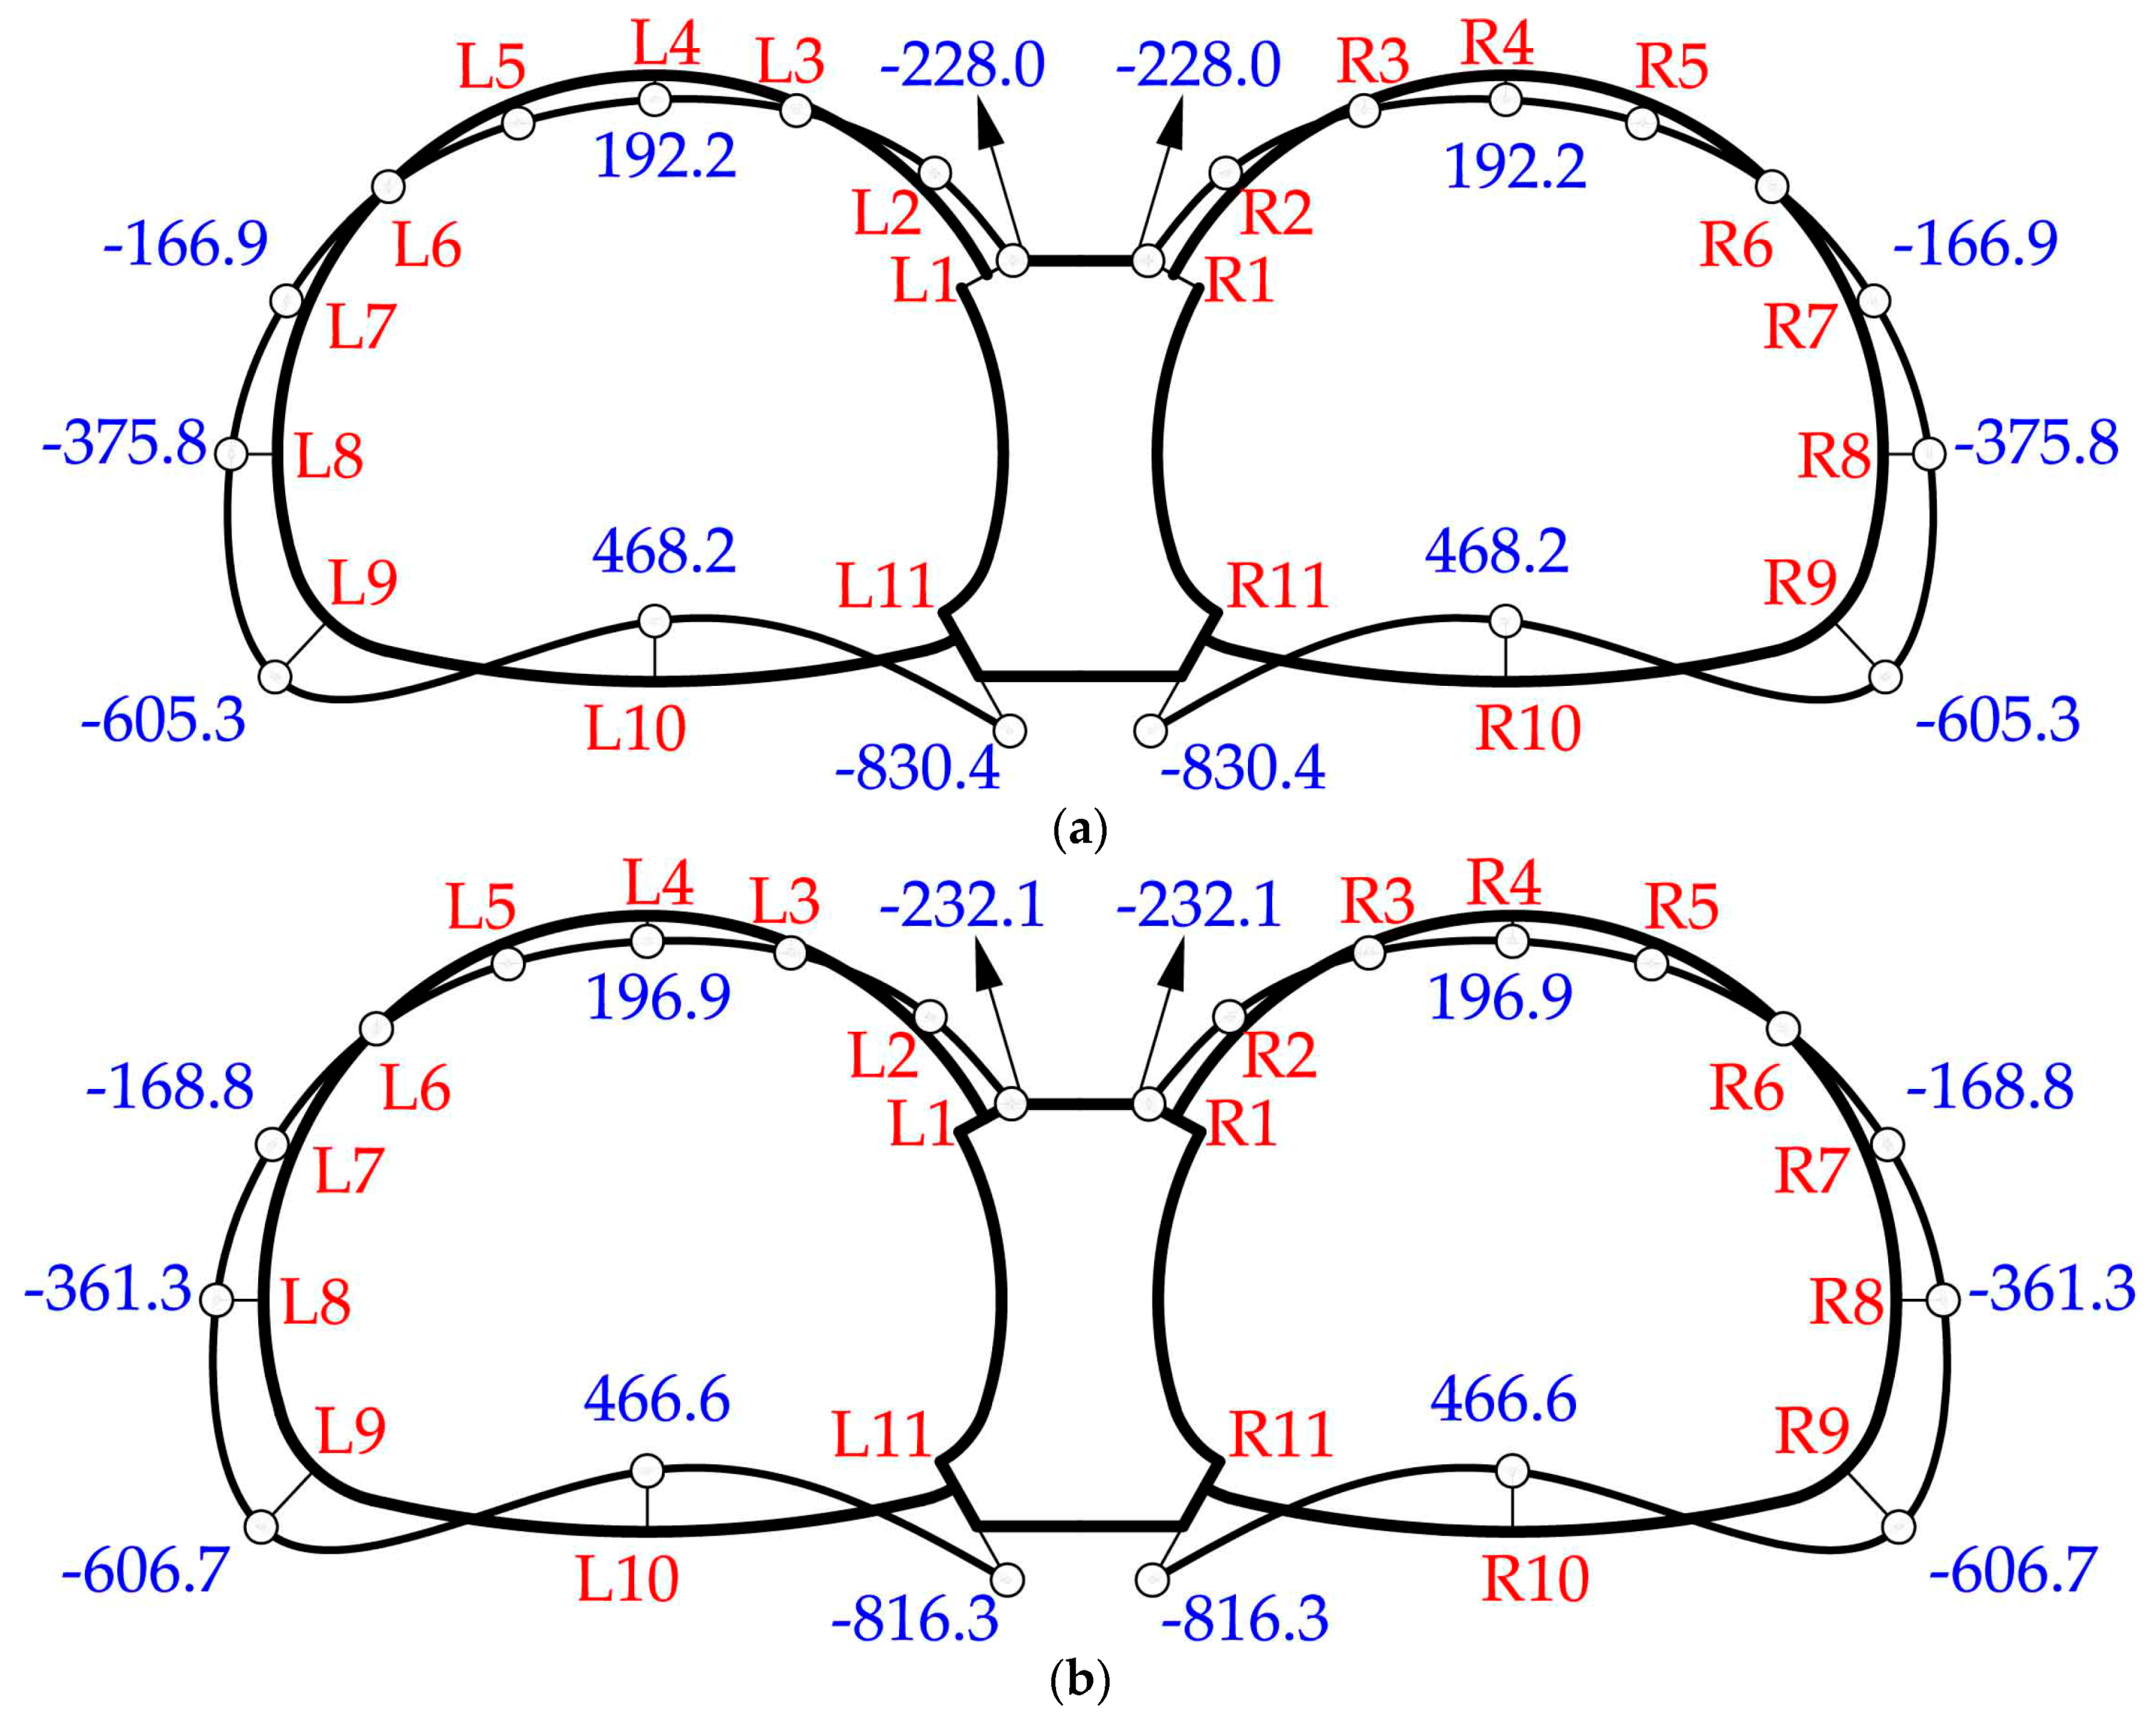
As shown in Figure 12 and Figure 13, the internal forces distribution of all three tests showed similar displays. When there is no void, the bending moment and axial force distributions are shown in Figure 12a and Figure 13a, respectively. For the left tunnel with a larger diameter, the maximum negative bending moment (bending outwards) appeared at the bottom of the middle wall, then at the arch foot and the sidewall, and finally at the connection between the spandrel and the middle wall. The inverted arch had the maximum positive bending moment (bending inwards), followed by the crown. Similar behavior was found in the right tunnel. As for the axial force, the maximum occurred at the connection between the spandrel and the middle wall, while the value at the invert was relatively small.
When there was a void on the top of the middle wall, the internal forces of the liner changed significantly. Growth in bending moments was seen at the crown, spandrel and sidewall, coupled with a decrease at the arch foot, invert and the bottom of the middle wall. The largest increase occurred at the connection between the spandrel and the middle wall. Furthermore, the distribution of axial forces in the three tests was roughly the same. The maximum axial force always formed at the connection between the spandrel and the middle wall, while the minimum formed at the invert. Compared with the case without voids, the axial forces showed an increase at the crown, spandrel and sidewall and a decrease at the invert and arch foot. Internal forces at the connection between the spandrel and the middle wall (#L1, #R1) were quite sensitive to the increase in void height.
3.1.2. Effects of Void Height on the Deformation of the Liner
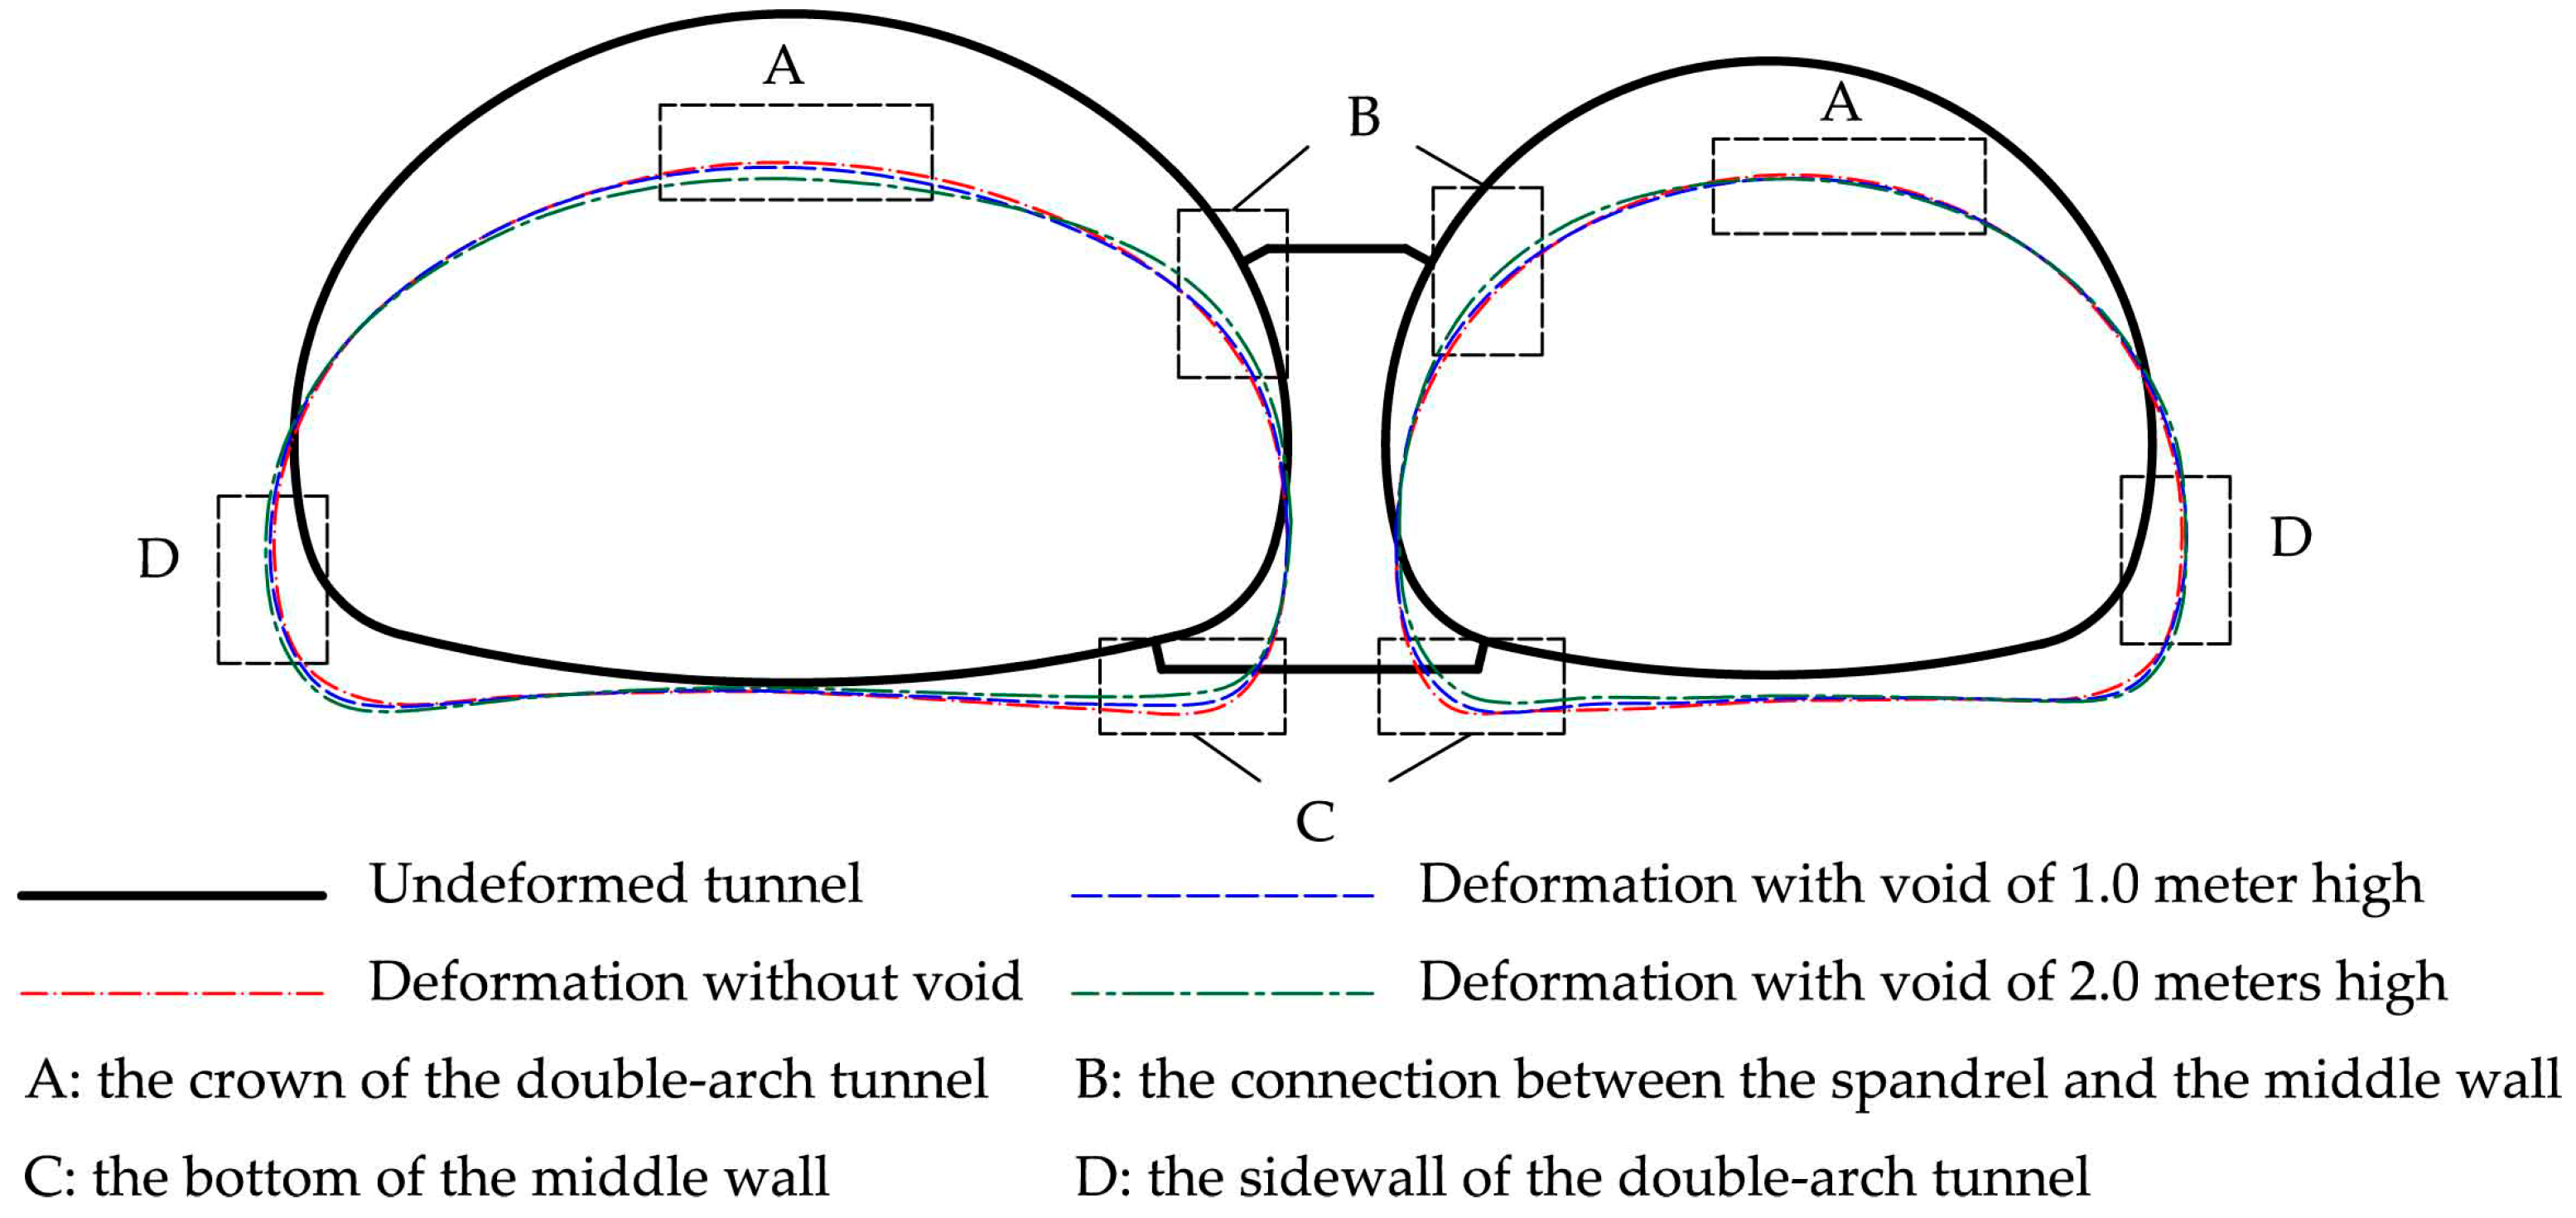
The deformation of the liner at the end state was extracted to further investigate the impact mechanism of voids on double-arch tunnels. As shown in Figure 14, the deformation was exaggerated 10-fold to describe the trend of deformation intuitively. It can be observed that they were similar plots as the tunnels all deformed outward horizontally and inward vertically. So, the inner face of the crown, the inverted arch and the outer face of the sidewall were working under tension. The cracking condition was reached when the tensile stress exceeded the critical stress.
When there was a void on the top of the middle wall, larger settlements were observed at the crown of the two tunnels, which would result in a significant increase in tensile stress at the inner face, as shown in the rectangular area A marked with black-dotted lines in Figure 14. Meanwhile, the displacements at the inverted arch had no obvious change. As for the connection between the spandrel and the middle wall (area B), inward deformation decreased compared with the case without voids, resulting in the outer face of the lining suffering from compression tension. Settlements of the middle wall (area C) were also smaller than the case without voids. Furthermore, there was an increase in the outward deformation of the two sidewalls (area D).
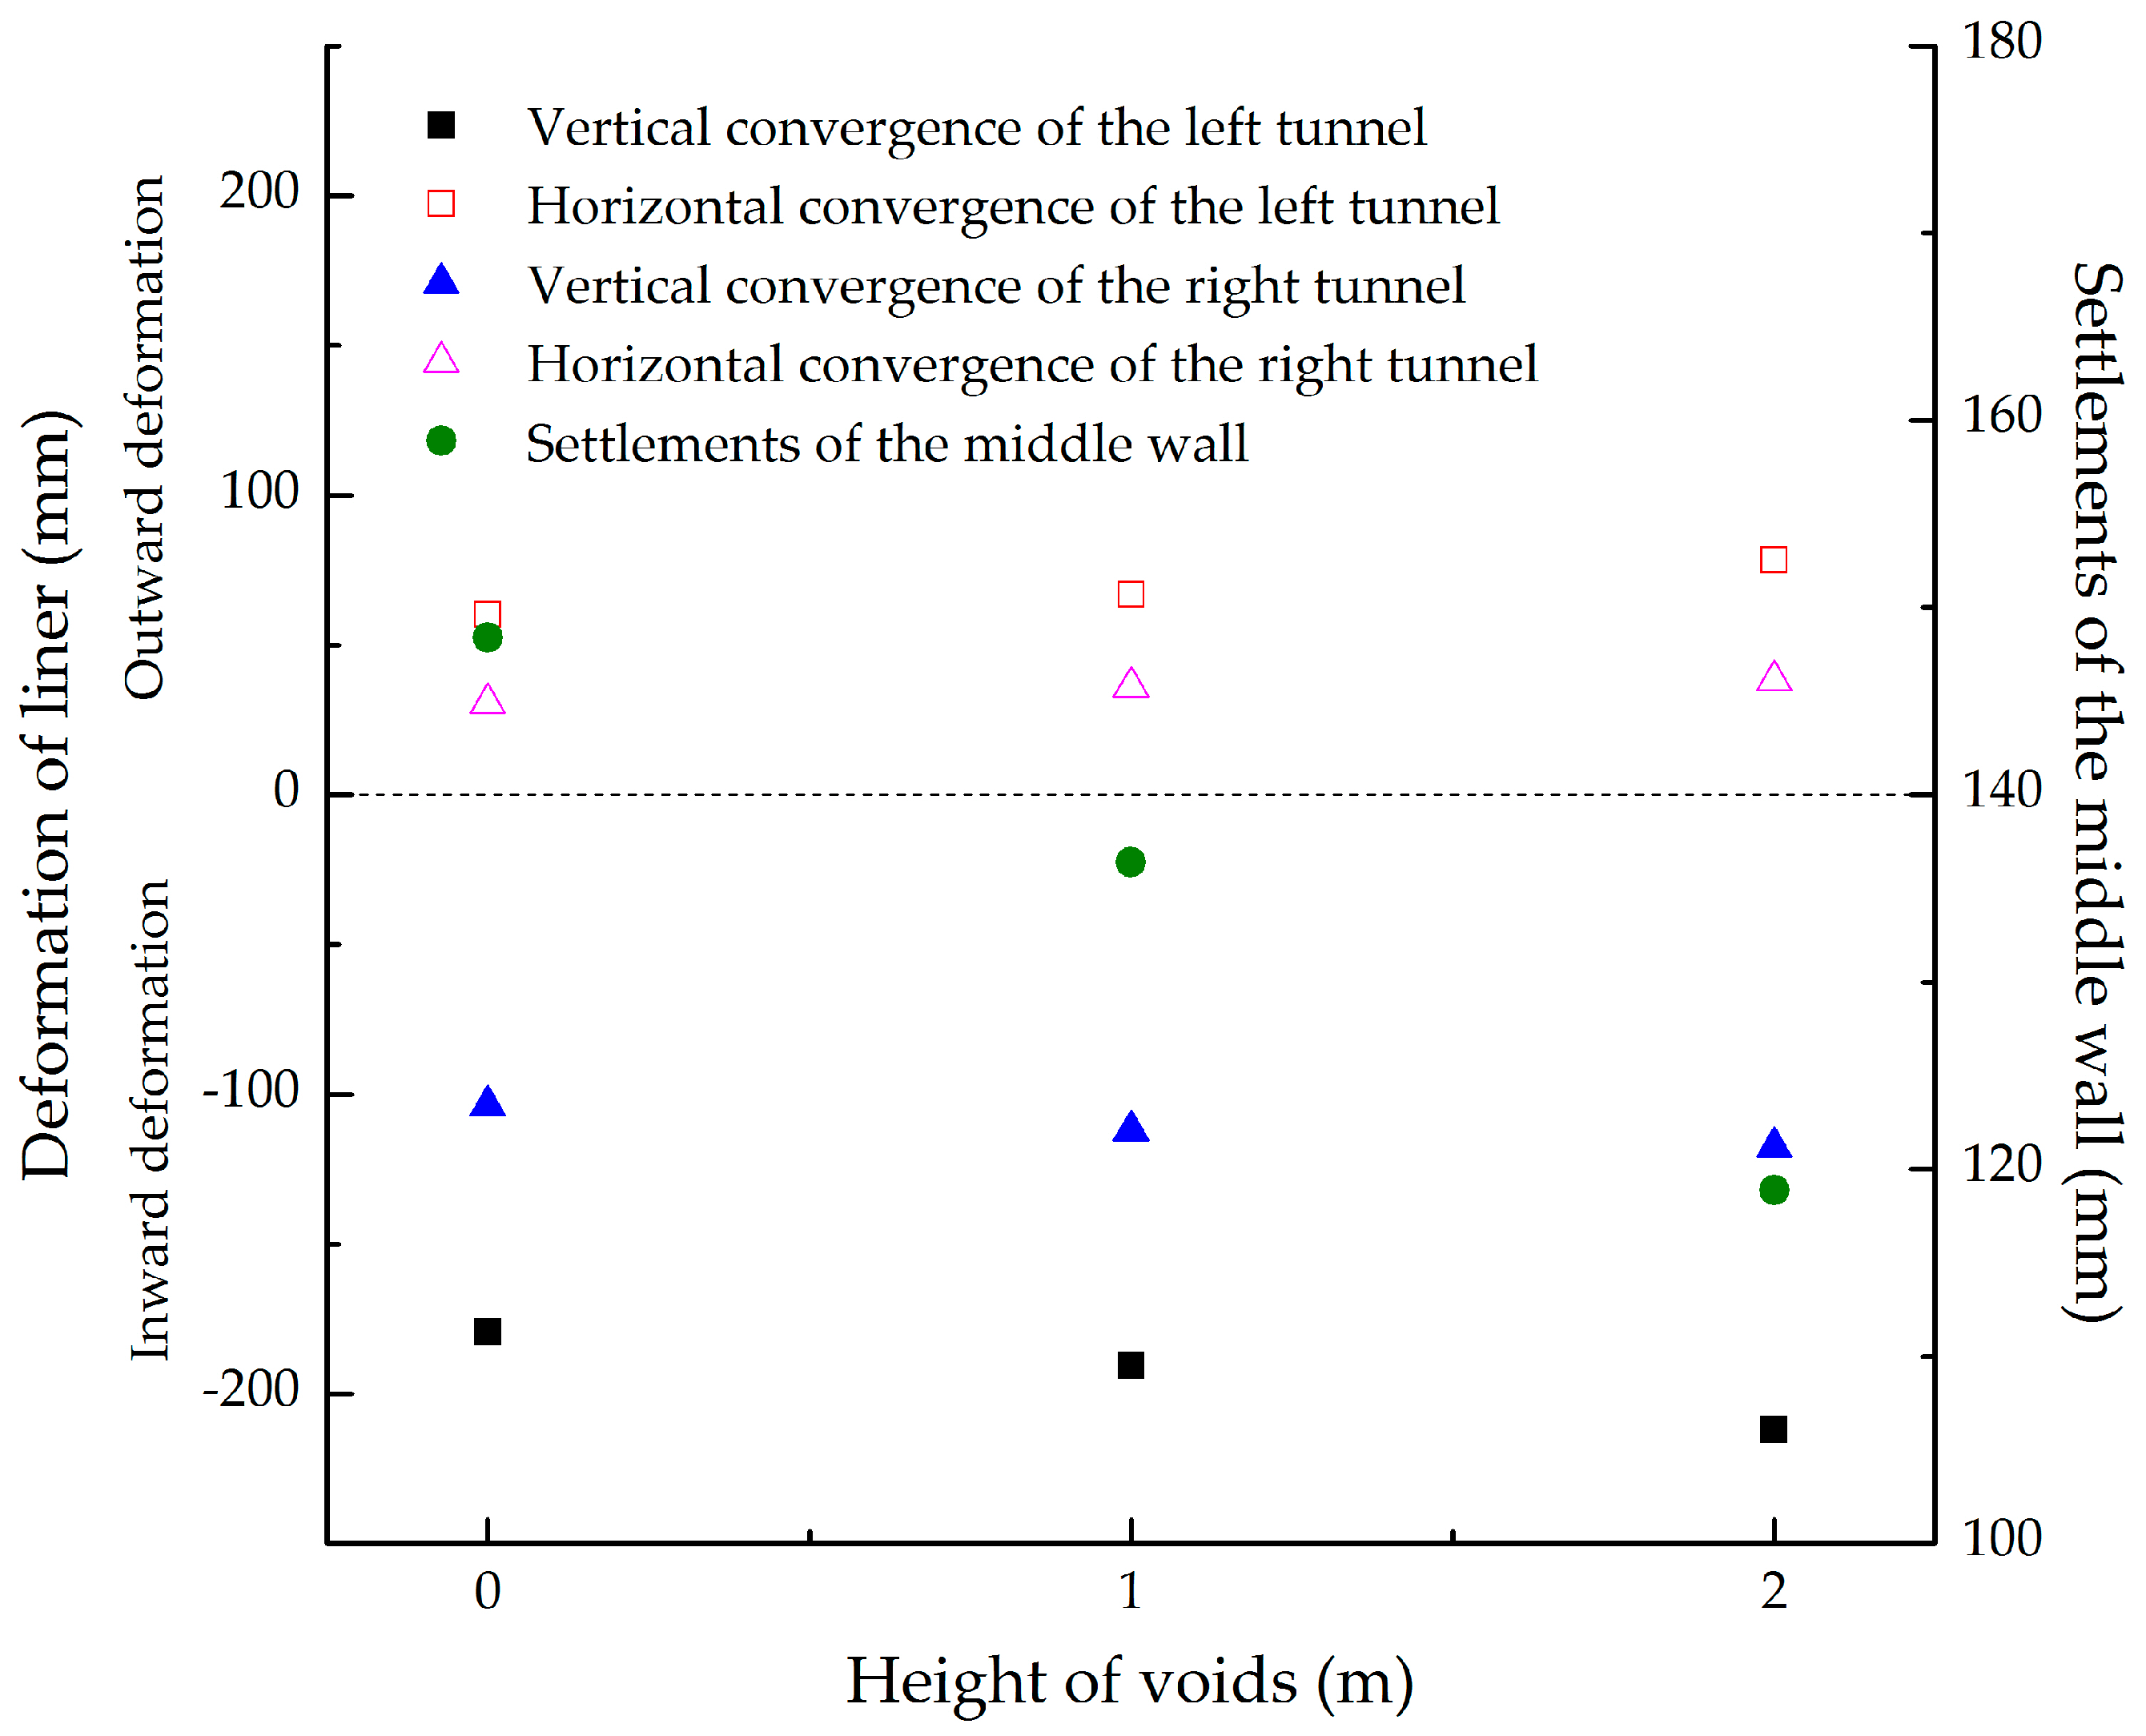
Figure 15 summarizes the relationship between the liner deformation and the height of the void. The deformation of the left tunnel was larger than that of the right one. The void height was a key factor affecting the structural deformation. As seen in Figure 15, a larger void height indicated larger outward deformation in the horizontal direction and inward deformation in the vertical direction. Thus, a flatter oval was formed, and the damage of the structure was more serious. Meanwhile, settlements of the middle wall decreased with the increase of void height. It can be concluded that the voids on the top of the middle wall helped to increase the deformation of both tunnels and decrease the settlements of the middle wall.
Owing to the structure’s asymmetry, the void on the top of the middle wall had different effects on the two tunnels. When the void height increased to 2.0 m (Test CS1-3), the convergence deformation of the right tunnel increased by 11.69% and 19.75% in the vertical and horizontal directions respectively compared with Test CS1-1. The growth in the left tunnel was stronger, with 15.28% deformation vertically and 23.11% horizontally. It can be concluded that the voids had more effect on the left tunnel with a larger diameter than the right tunnel with a smaller diameter.
3.1.3. Effects of Void Height on Failure Patterns
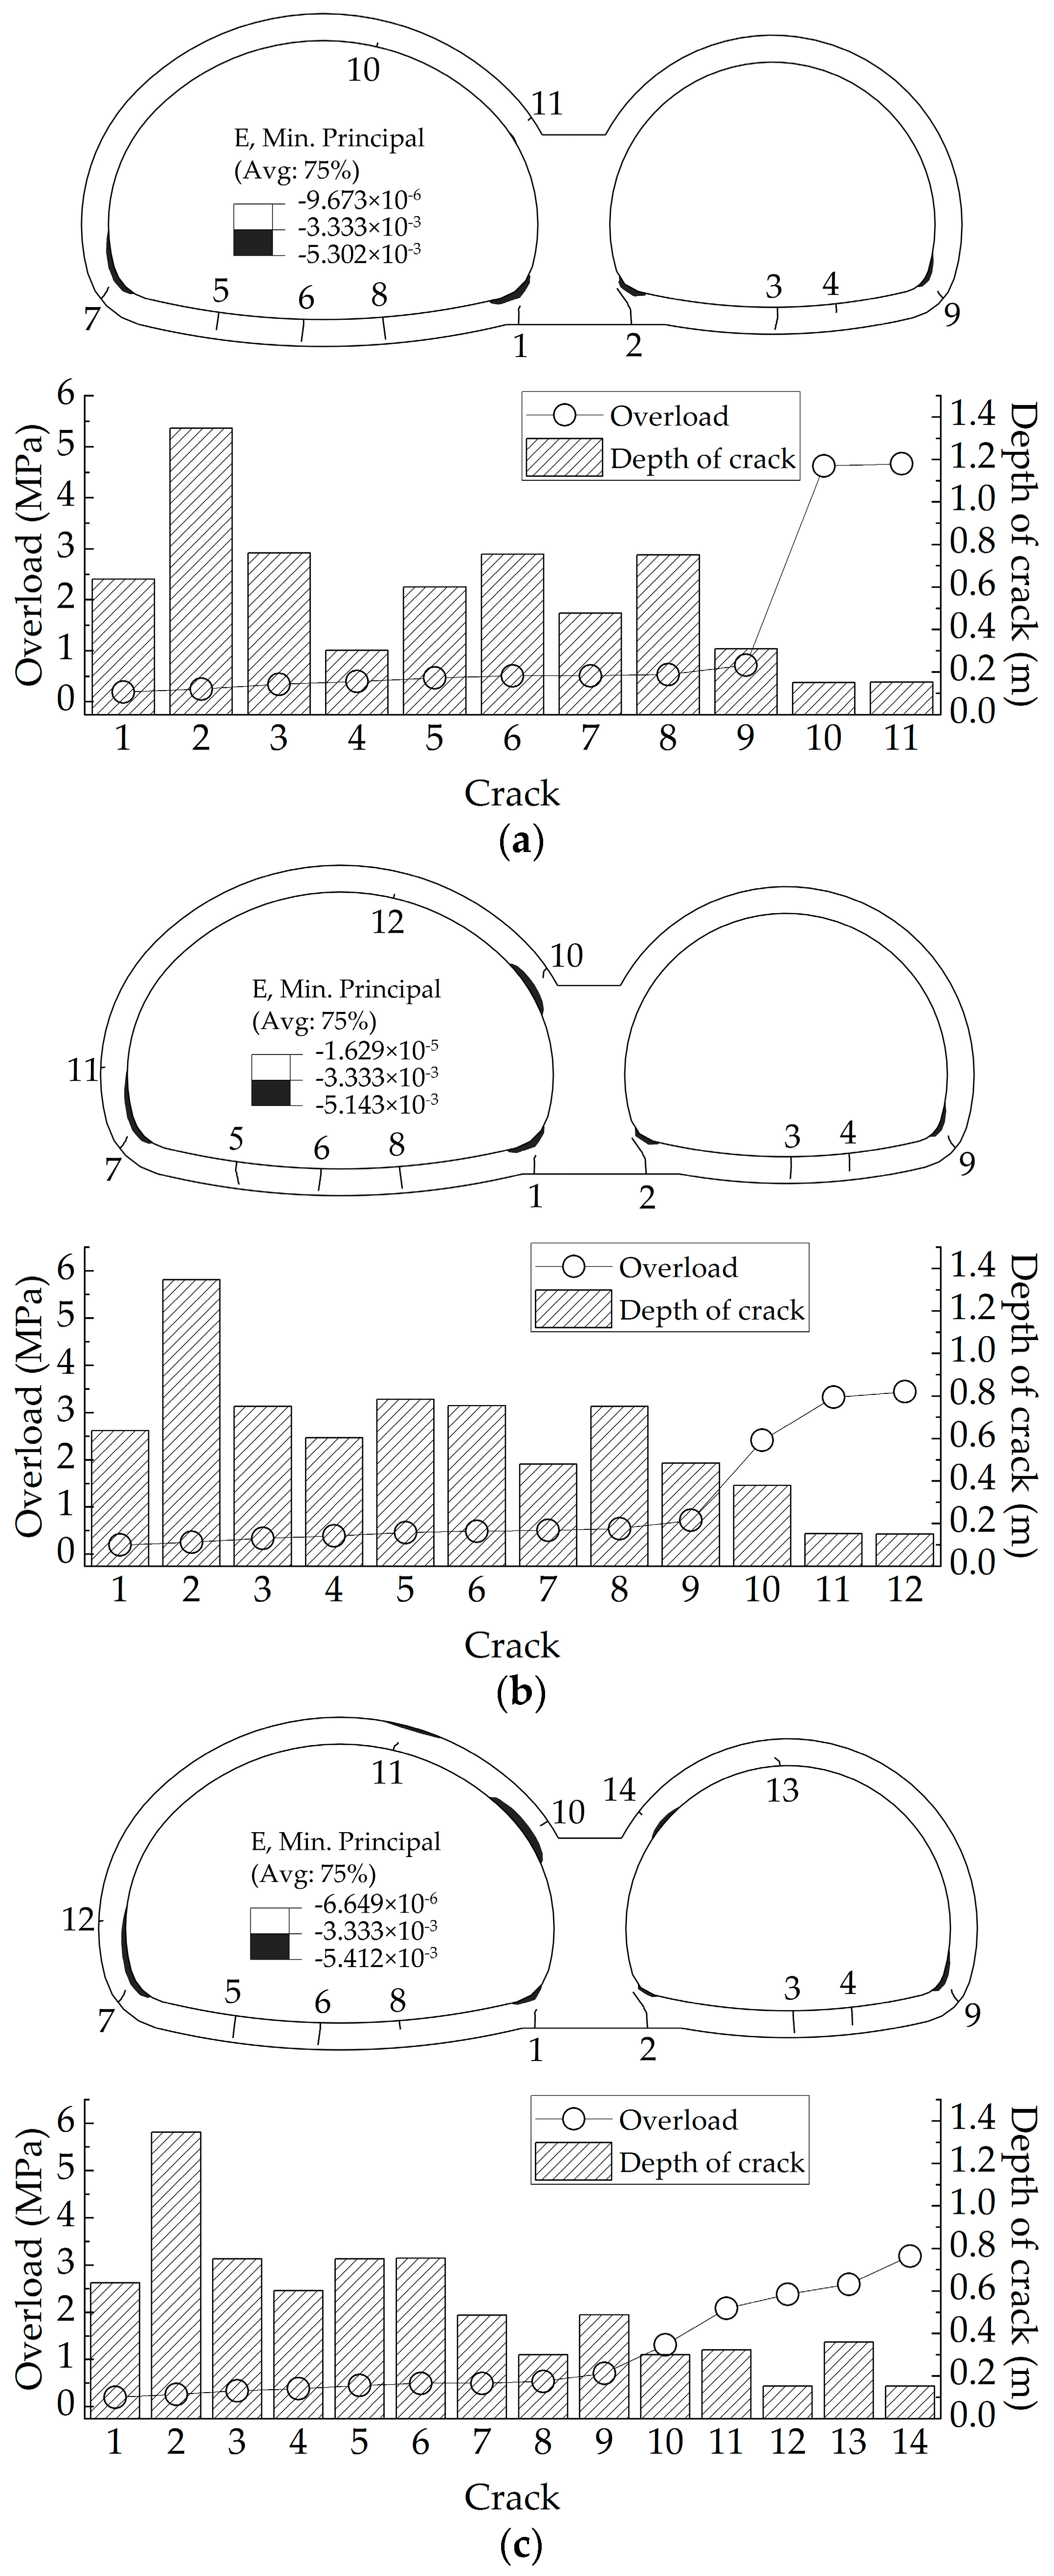
As seen in Figure 16, it was reasonable to conclude that the left tunnel with a larger diameter experienced much more severe damage according to the number of cracks and the area of the compression failure zone.
In the case of no void (Test CS1-1), cracks began at the bottom of the middle wall, then at the inner of the inverted arch, outside of the arch foot and finally at the crown of the left tunnel. Compression failure of the concrete occurred at the inner surface of the arch foot and the bottom of the middle wall. Apparently, the bottom of the middle wall suffered the greatest damage and was the key vulnerability of the structure, which was also consistent with the bending moment distribution.
When there was a void on the top of the middle wall, much more severe failure was observed at the crown and the connection between the spandrel and the middle wall. A larger number of cracks were found because of the larger vertical convergence. The area of the compressive failure zone increased. It can be concluded that the voids on the top of the middle wall were unfavorable to the crown and the connection between the spandrel and the middle wall. Furthermore, the area of compressive failure zone at the bottom of the middle wall decreased, which fitted well with the obtained changes in internal forces and liner deformation. In addition, the larger the height of the void, the more severe the defects it caused. When the height of void increased to 2.0 m, a significant increase in crack depth was observed at the crown and the spandrel connected to the middle wall, which meant that the void led to a significant reduction in structural security and bearing capacity.
3.2. Effects of Tunnel Shape
The effect of tunnel shape was investigated by conducting a parametric analysis using a void height of one meter and different cross sections.
3.2.1. Effects of Tunnel Shape on Internal Forces
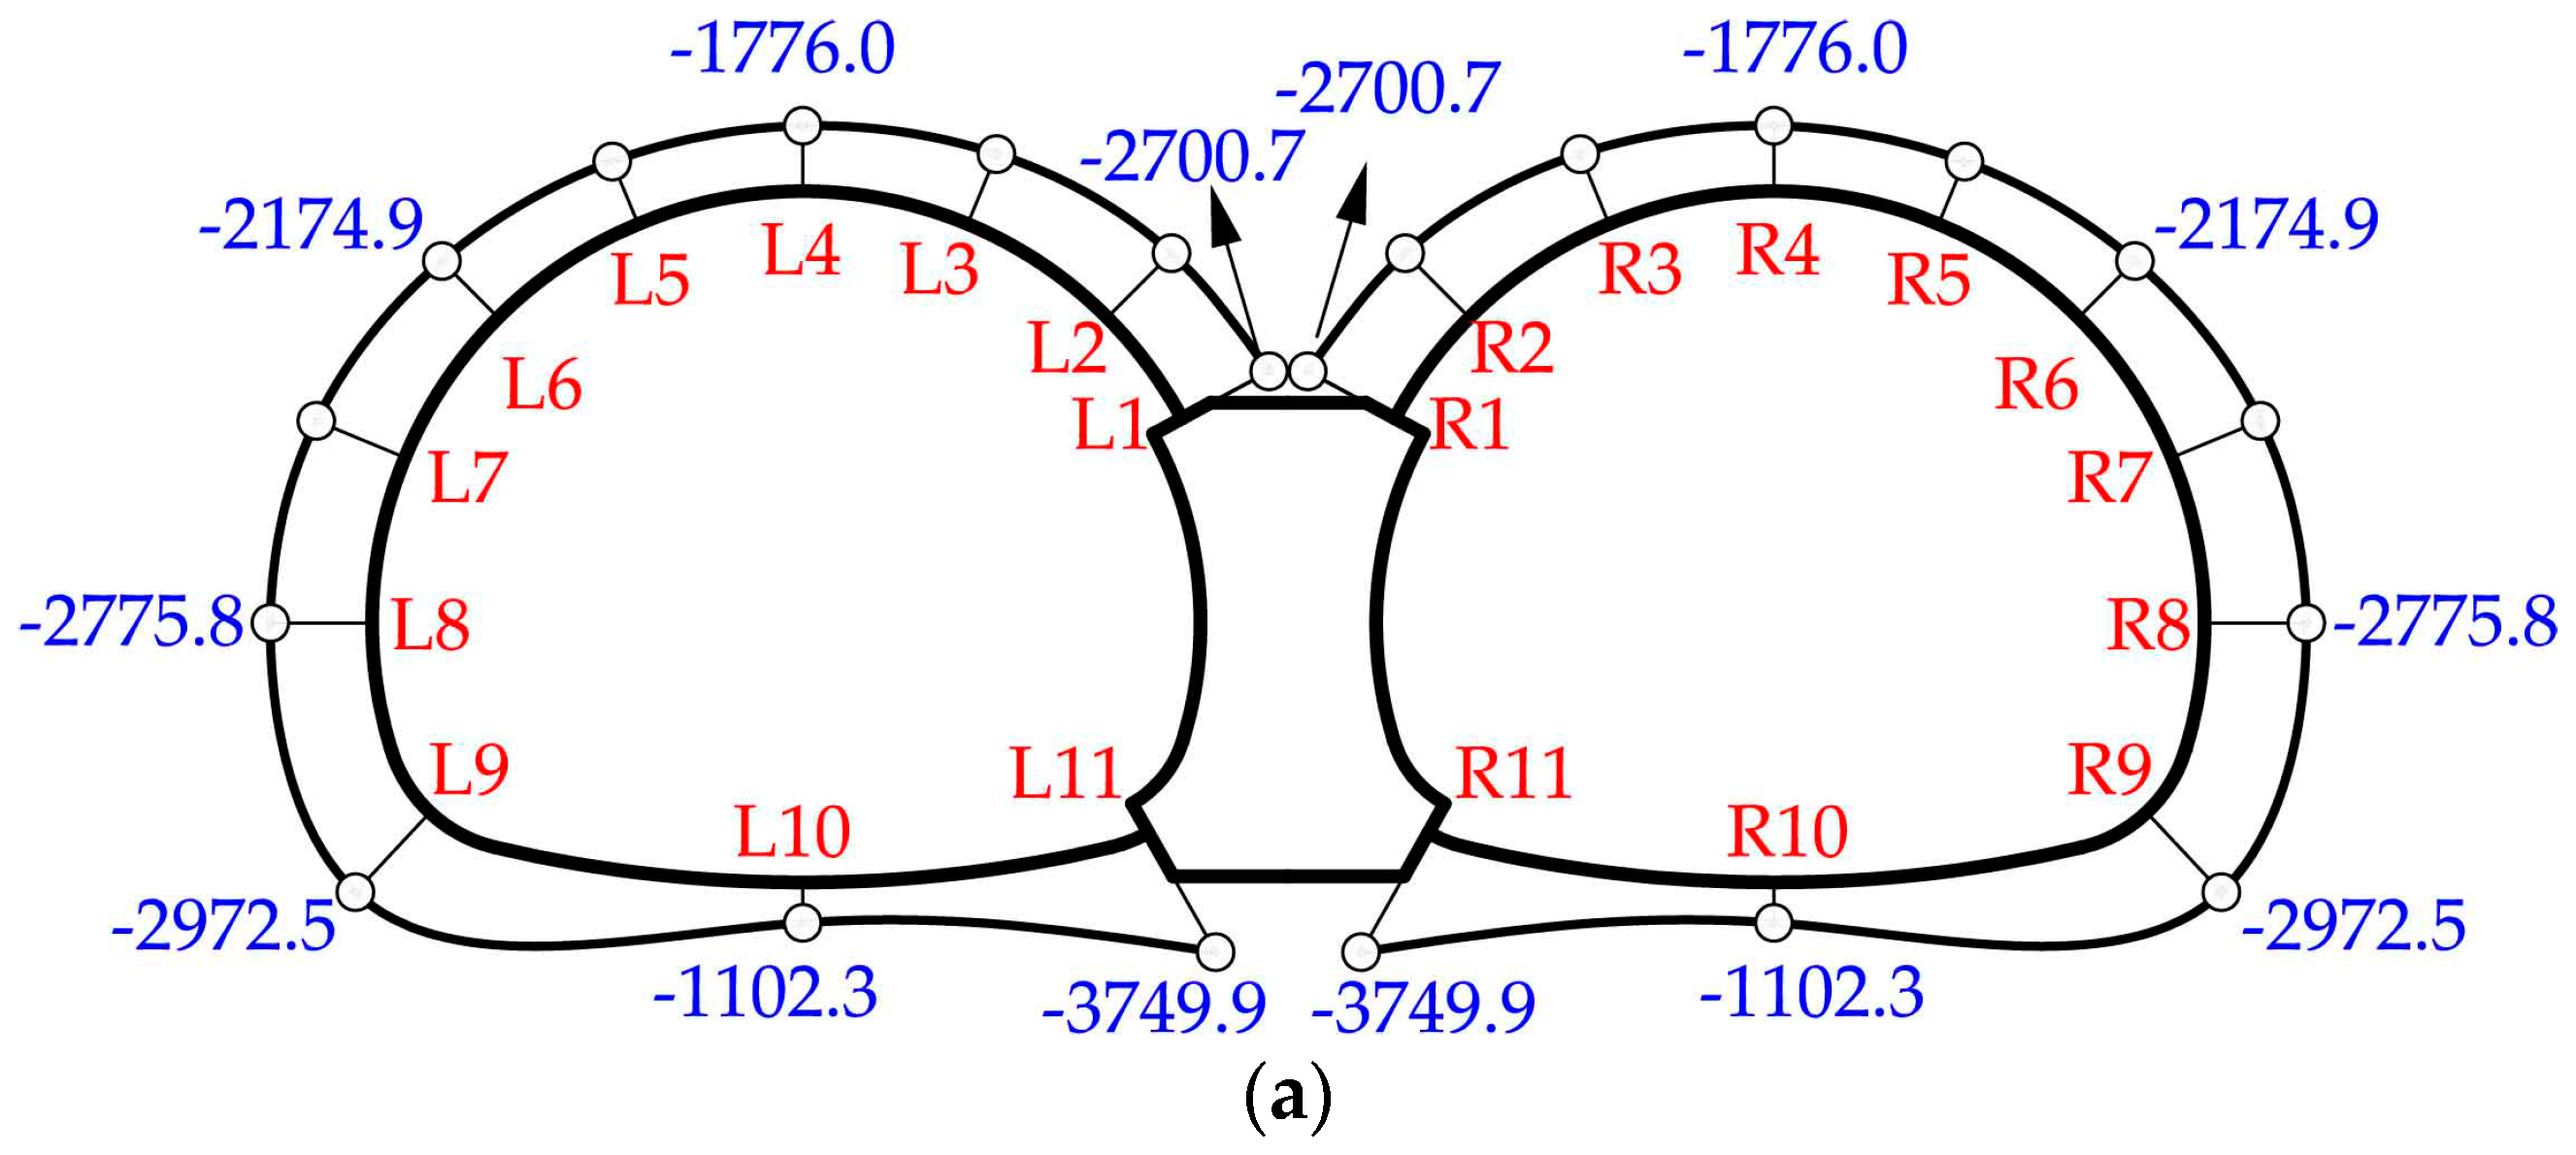
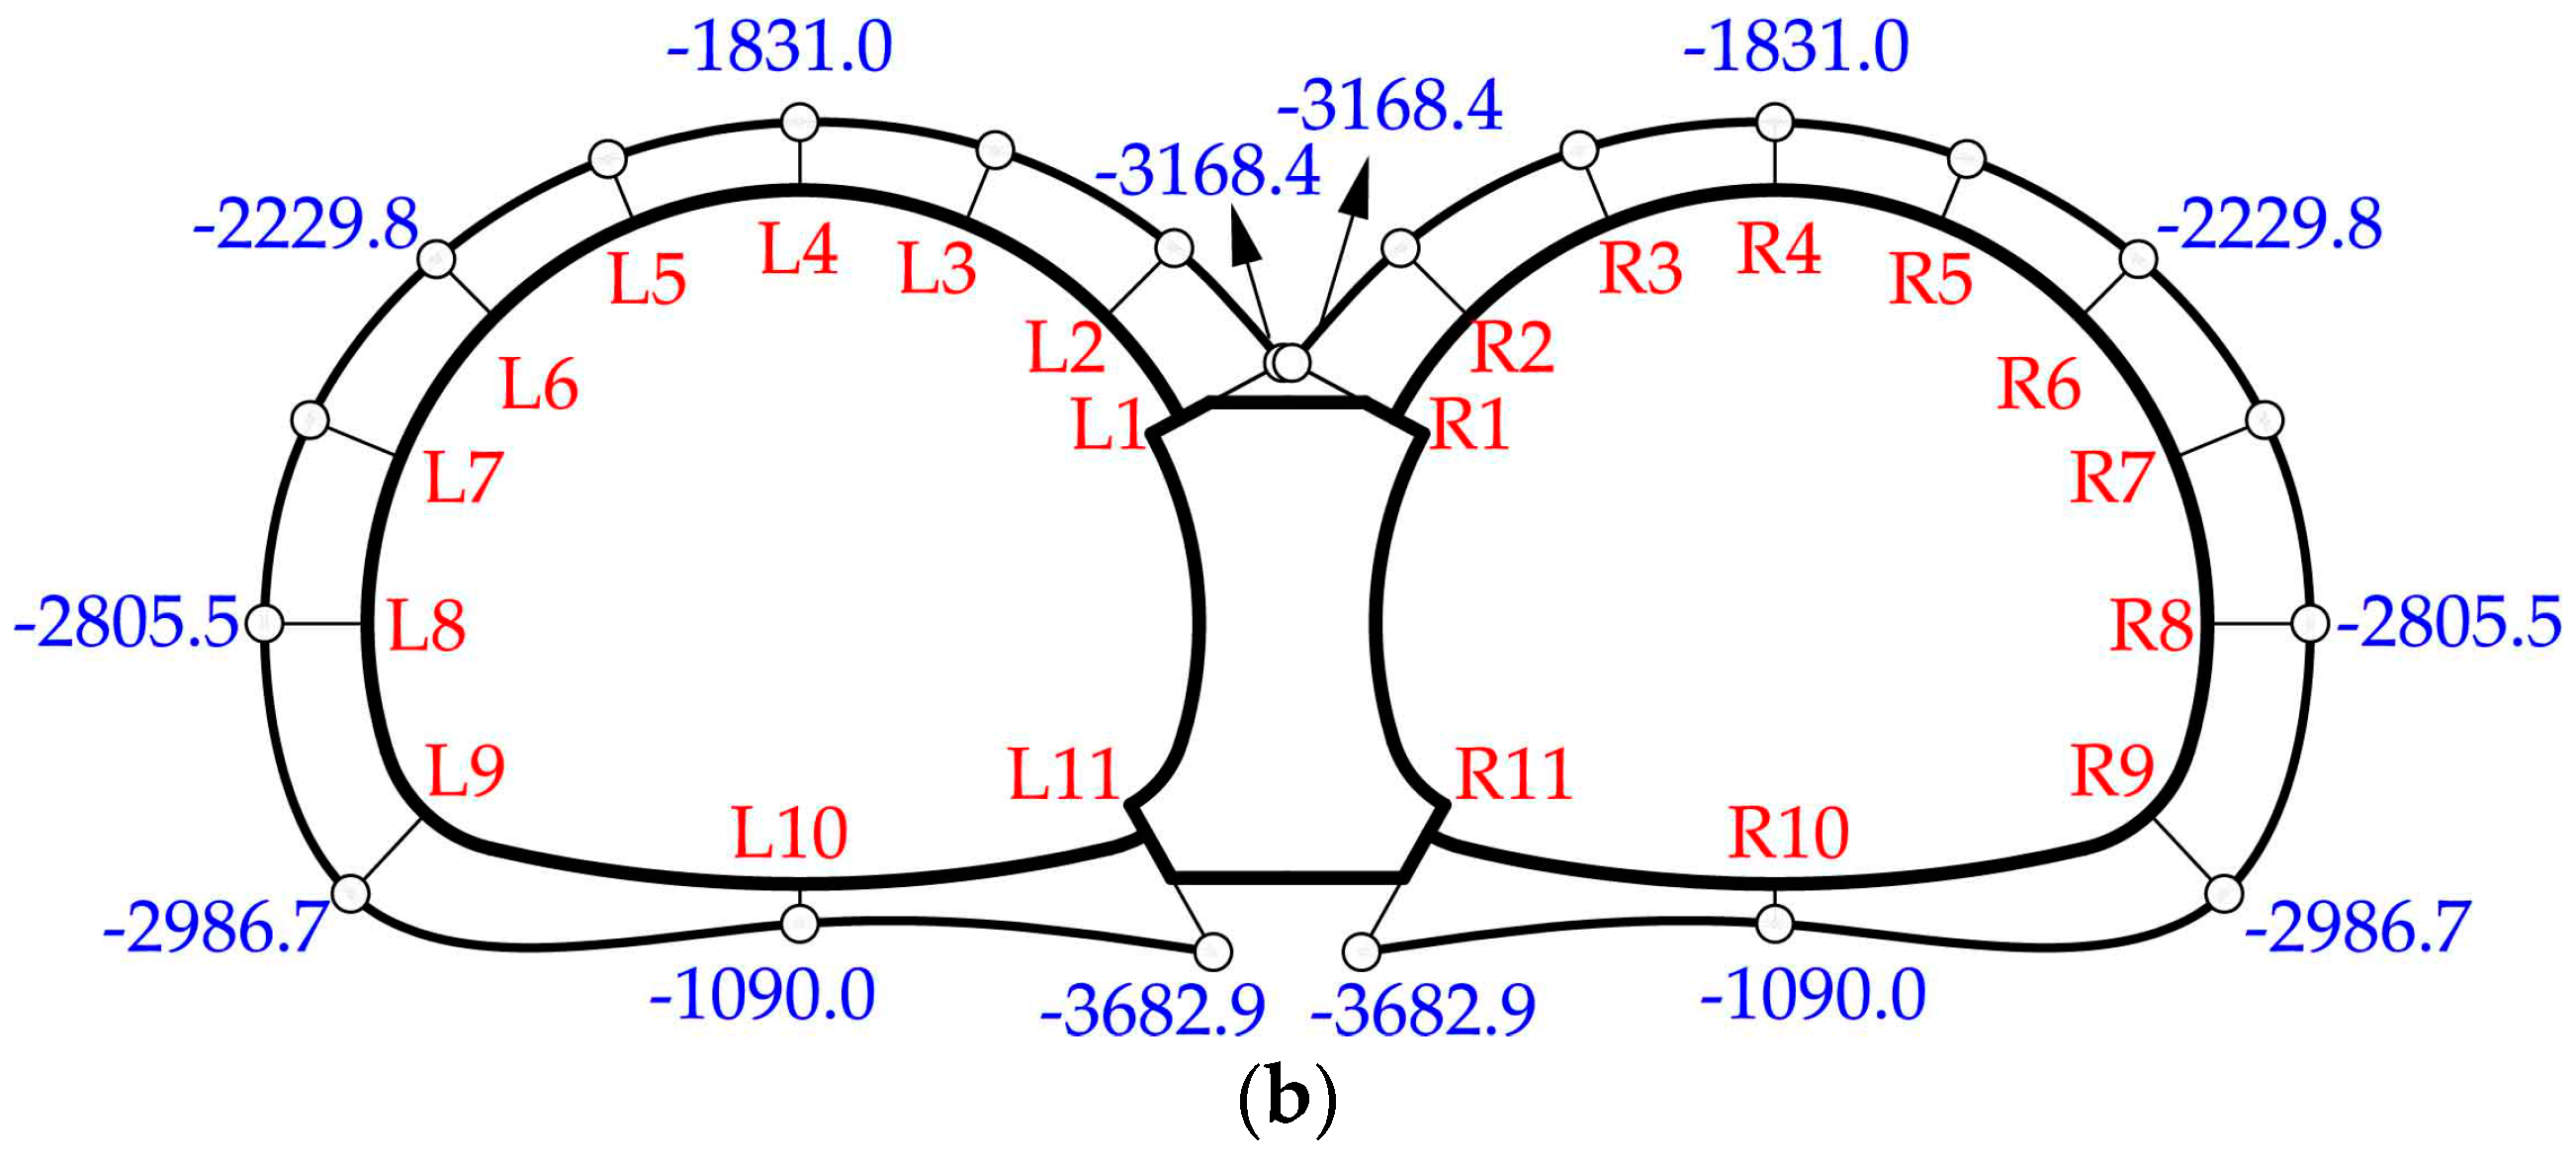
Figure 17 and Figure 18 show the internal force distribution of symmetrical double-arch tunnels (CS2). When there was no void, the distribution of bending moments and axial forces is shown in Figure 17a and Figure 18a, respectively. Obviously, the bending moments and axial forces were distributed symmetrically. The bottom of the middle wall had the maximum negative bending moment, followed by the arch foot and the sidewall. The maximum positive bending moment appeared at the invert. As for the axial force, the maximum occurred at the connection between the spandrel and the middle wall, while the value at the invert was relatively small.
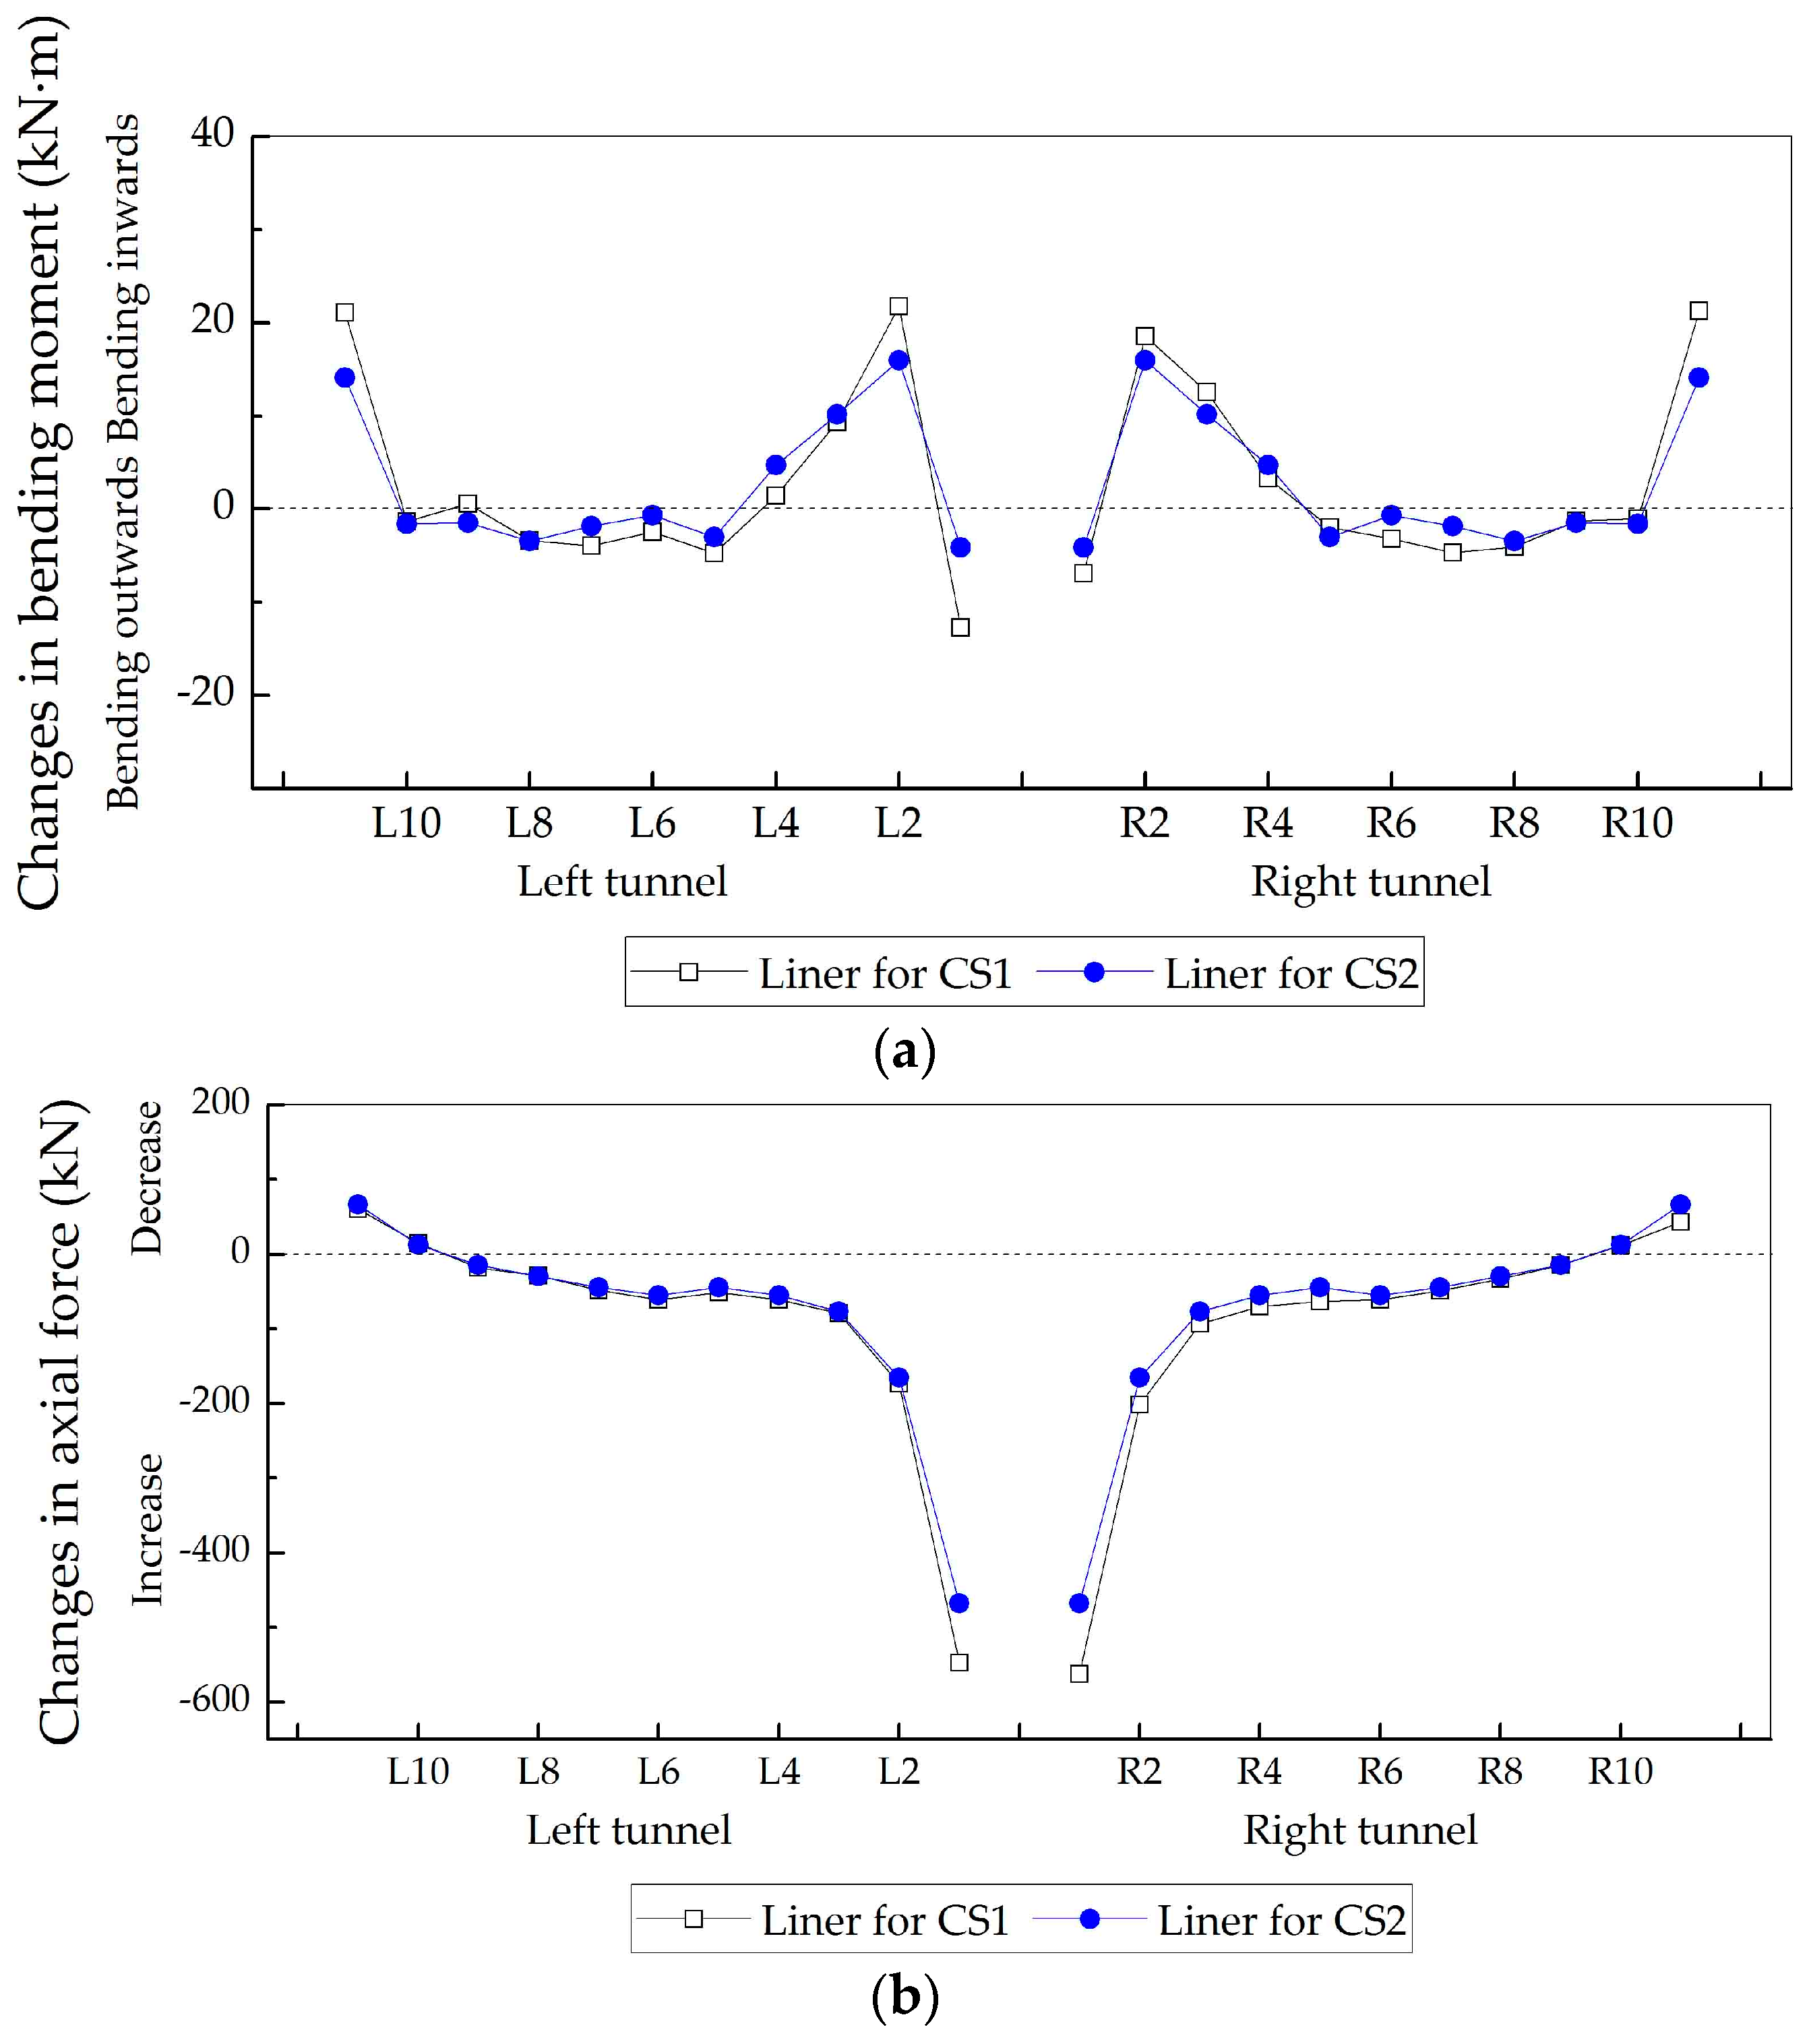
Changes in internal forces induced by the void in CS2 were similar to those in CS1 (already discussed). As shown in Figure 19a, the spandrel connected to the middle wall, the crown and the bottom of the middle wall all experienced a large change in bending moment. Besides, axial forces of the liner increased except at the bottom of the middle wall and the invert (Figure 19b). The largest increase occurred at the connection between the spandrel and the middle wall. Clearly, the internal force changes in symmetrical double-arch tunnels were distributed symmetrically.
3.2.2. Effects of Tunnel Shape on the Deformation of the Liner
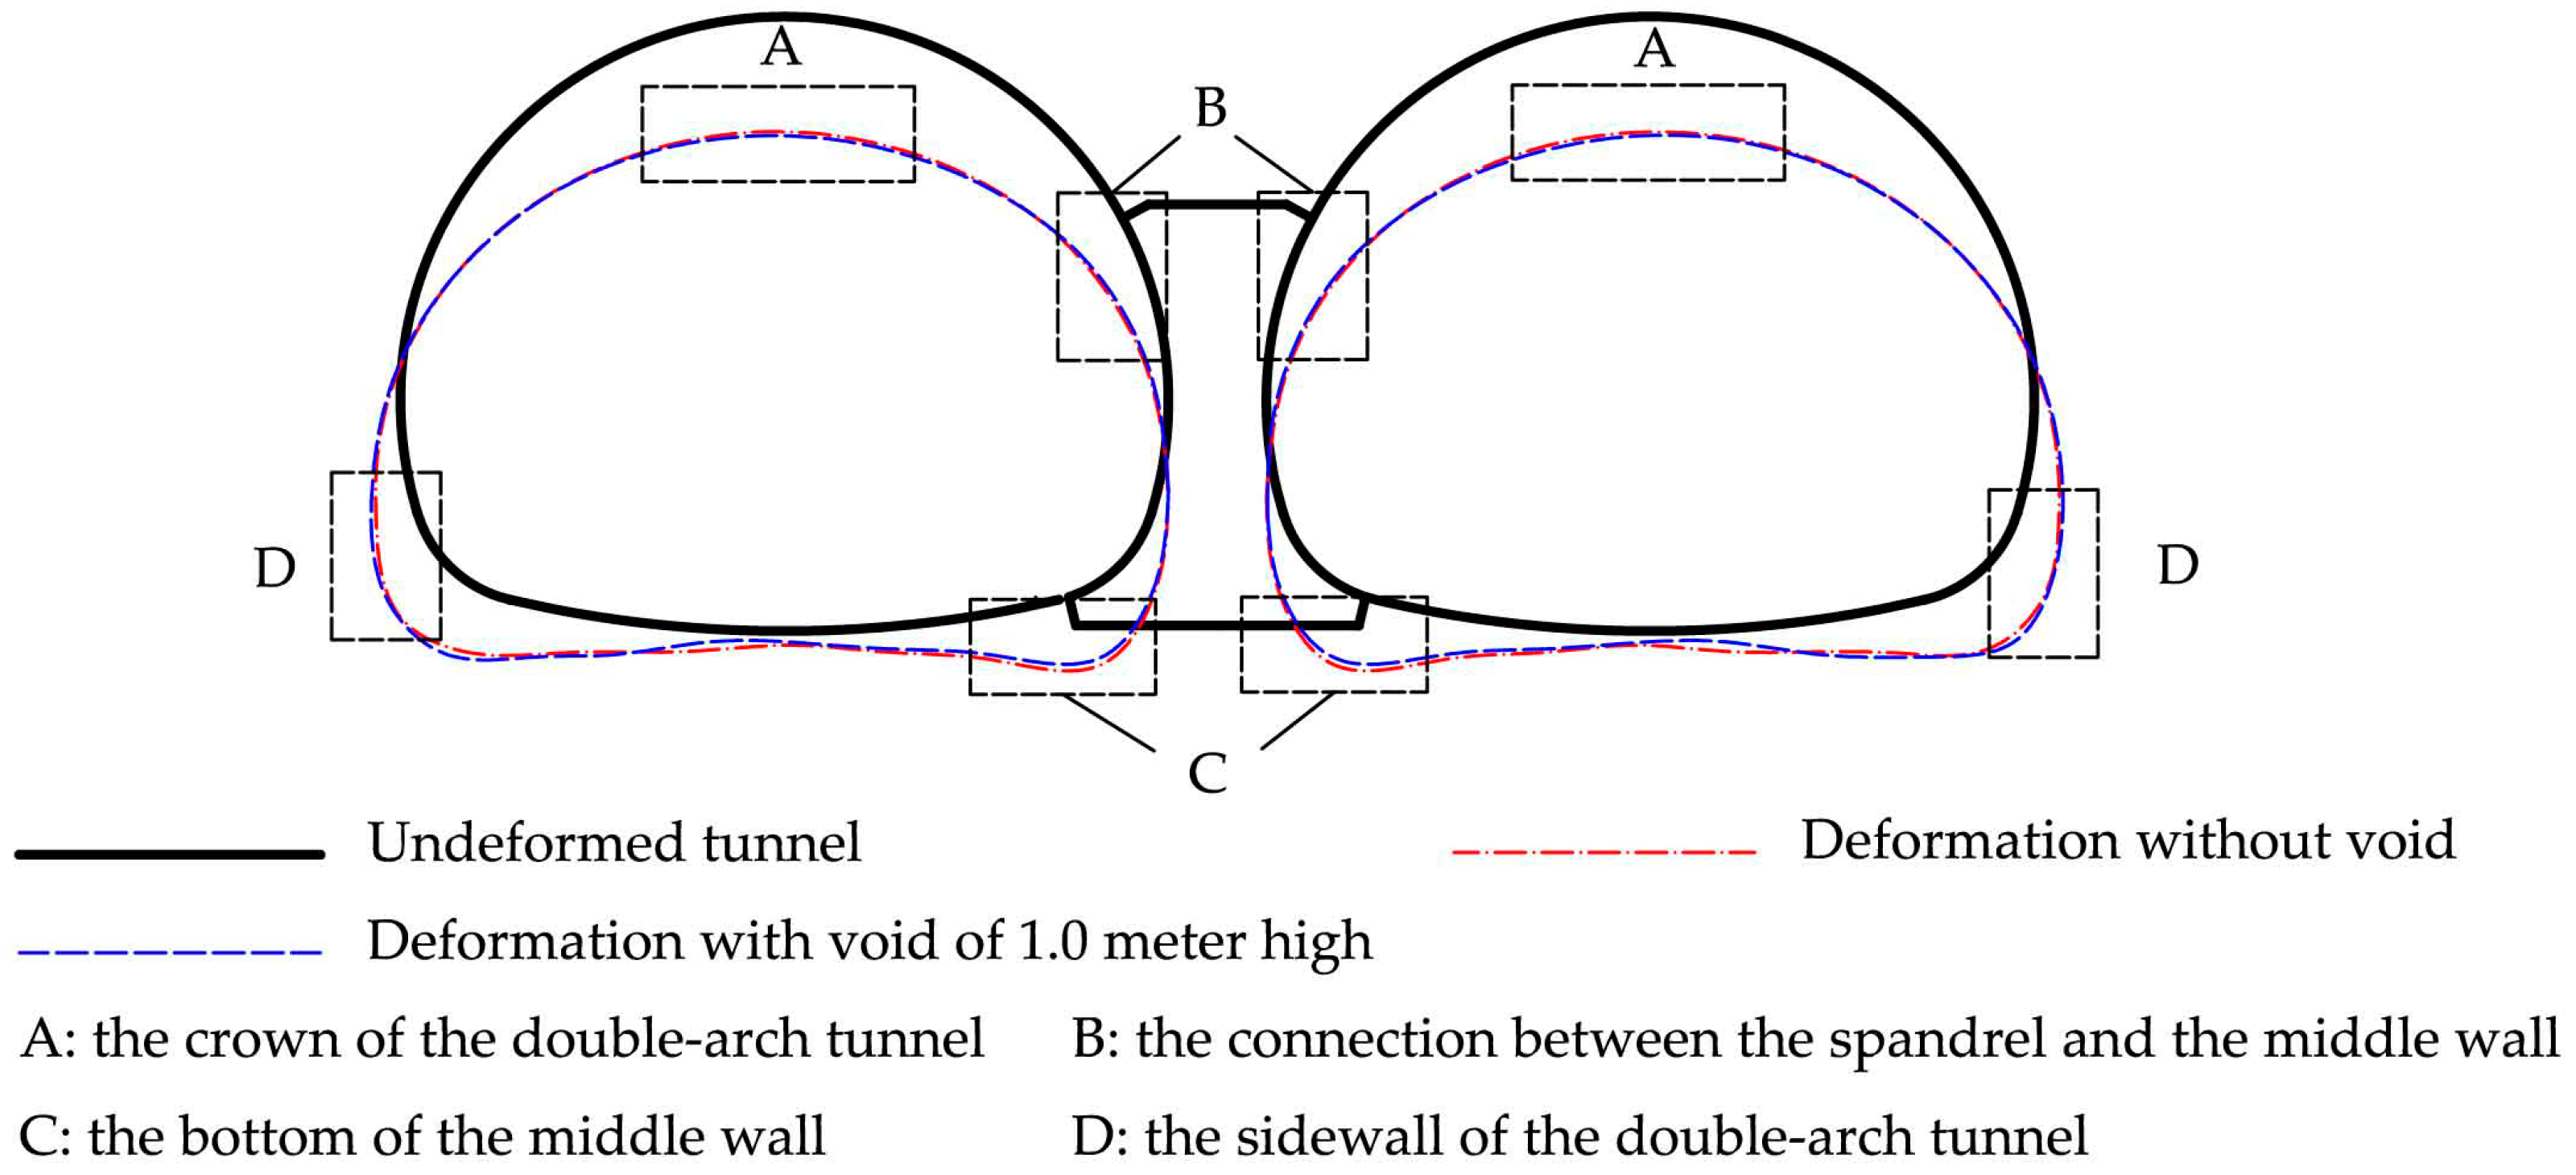
Figure 20 shows the deformation of symmetrical double-arch tunnels. Similar to CS1, vault settlement in both tunnels increased when there was a 1 m high void on the top of the middle wall. Furthermore, the void also caused a larger outward deformation at the sidewall and smaller settlements at the bottom of the middle wall. Apparently, changes were distributed symmetrically.
3.2.3. Effects of Tunnel Shape on the Failure Patterns of the Liner
As shown in Figure 21, cracks and the concrete compression failure zone were distributed symmetrically. When there was no void, cracks occurred firstly at the bottom of the middle wall, followed by the invert and the arch foot and finally at the crown. Besides, compression failure of the concrete occurred at the inner surface of the arch foot and the bottom of the middle wall. As shown in Figure 21b, voids on the top of the middle wall caused more damage at the connection between the spandrel and the middle wall.
In conclusion, voids behind linings may reduce the performance of structures and cause serious damage to linings. Restoration measures should be taken in time. Grouting is a better method to dispose of voids behind liners, and the grouting pressure should be controlled carefully to protect structures. For voids that have resulted from erosion, the erosion of groundwater will increase the size of the void continuously and cause leakage into the tunnel. It is also necessary to control and lower the groundwater level by implementing drainage measures.
4. Conclusions
The applicability of the extended finite element method for simulating crack propagation was verified through the comparisons between numerical simulations and model tests. Moreover, internal forces, liner deformation and failure patterns of double-arch tunnels under the effects of voids on the top of the middle wall were investigated numerically. Some conclusions can be draw as follows:
- (1)
- The bottom of the middle wall suffered the greatest damage and was the key vulnerability of the structure. Cracks occurred firstly at the bottom of the middle wall whether or not the void existed, which was also consistent with the bending moment distribution.
- (2)
- Internal forces of the liner in double-arch tunnels were affected greatly by the void on the top of the middle wall. The largest changes occurred at the connection between the spandrel and the middle wall. In addition, voids on the top of the middle wall led to a larger deformation and helped to reduce the settlement of the middle wall. Furthermore, more cracks and larger concrete compression failure zones were found at the connection between the spandrel and the middle wall compared with the tunnel without voids.
- (3)
- Void height and the diameter of tunnels were key factors to determine the effects of voids on double-arch tunnels. The larger the void height, the greater the effects the void led to. Furthermore, the larger diameter tunnel in asymmetrical double-arch tunnels was more sensitive to void height changes and suffered more serious effects of the void than the smaller one.
- (4)
- Tunnel shape also played a significant role to determine the effects of voids. Unlike the asymmetrical double-arch tunnels, changes in internal forces and deformation in symmetrical double-arch tunnels were distributed symmetrically.
Author Contributions
B.M., X.Z., C.Z., Y.G. and T.Y. contributed equally to this work.
Funding
This research was funded by Beijing Municipal Natural Science Foundation of China (No. 8172037) and Fundamental Research Funds for the Central Universities of China (No. 2017YJS146).
Acknowledgments
The authors are deeply thankful to the reviewers and editor for their valuable suggestions to improve the quality of the paper.
Conflicts of Interest
The authors declare no conflict of interest.
References
- Yasuda, N.; Tsukada, K.; Asakura, T. Elastic solutions for circular tunnel with void behind lining. Tunn. Undergr. Space Technol. 2017, 70, 274–285. [Google Scholar] [CrossRef]
- Meguid, M.A.; Dang, H.K. The effect of erosion voids on existing tunnel linings. Tunn. Undergr. Space Technol. 2009, 24, 278–286. [Google Scholar] [CrossRef]
- Meguid, M.A.; Kamel, S. A three-dimensional analysis of the effects of erosion voids on rigid pipes. Tunn. Undergr. Space Technol. 2014, 43, 276–289. [Google Scholar] [CrossRef]
- Wang, J.; Huang, H.; Xie, X.; Bobet, A. Void-induced liner deformation and stress redistribution. Tunn. Undergr. Space Technol. 2014, 40, 263–276. [Google Scholar] [CrossRef]
- Huang, H.W.; Liu, D.J.; Xue, Y.D.; Wang, P.R.; Liu, Y. Numerical analysis of cracking of tunnel linings based on extended finite element. Chin. J. Geotech. Eng. 2013, 35, 266–275. (In Chinese) [Google Scholar]
- Yan, Q.; Xu, Y.; Zhang, W.; Geng, P.; Yang, W. Numerical analysis of the cracking and failure behaviors of segmental lining structure of an underwater shield tunnel subjected to a derailed high-speed train impact. Tunn. Undergr. Space Technol. 2018, 72, 41–54. [Google Scholar] [CrossRef]
- Leung, C.; Meguid, M.A. An experimental study of the effect of local contact loss on the earth pressure distribution on existing tunnel linings. Tunn. Undergr. Space Technol. 2011, 26, 139–145. [Google Scholar] [CrossRef]
- Lei, M.; Peng, L.; Shi, C. Model test to investigate the failure mechanisms and lining stress characteristics of shallow buried tunnels under unsymmetrical loading. Tunn. Undergr. Space Technol. 2015, 46, 64–75. [Google Scholar] [CrossRef]
- Lai, J.; Qiu, J.; Fan, H.; Chen, J.; Hu, Z.; Zhang, Q.; Wang, J. Structural Safety Assessment of Existing Multiarch Tunnel: A Case Study. Adv. Mater. Sci. Eng. 2017, 2017. [Google Scholar] [CrossRef]
- Li, S.; Yuan, C.; Feng, X.; Li, S. Mechanical behaviour of a large-span double-arch tunnel. KSCE J. Civ. Eng. 2016, 20, 2737–2745. [Google Scholar] [CrossRef]
- Zhang, Y.; Yang, J.; Yang, F. Field investigation and numerical analysis of landslide induced by tunneling. Eng. Fail. Anal. 2015, 47, 25–33. [Google Scholar] [CrossRef]
- Zhang, Y.; Shi, Y.; Zhao, Y.; Fu, L.; Yang, J. Determining the Cause of Damages in a Multiarch Tunnel Structure through Field Investigation and Numerical Analysis. J. Perform. Constr. Facil. 2017, 31. [Google Scholar] [CrossRef]
- ABAQUS. Abaqus v6.14 Documentation; Dassault Systèmes: Providence, RI, USA, 2015. [Google Scholar]
- Ministry of Housing and Urban-Rural Development of the People’s Republic of China. GB 50010-2010, Code for Design of Concrete Structures; China Architecture & Building Press: Beijing, China, 2015. (In Chinese)
- Munro, S.M.; Moore, I.D.; Brachman, R.W.I. Laboratory testing to examine deformations and moments in fiber-reinforced cement pipe. J. Geotech. Geoenviron. Eng. 2009, 135, 1722–1731. [Google Scholar] [CrossRef]
- Fang, Y.; Guo, J.; Grasmick, J.; Mooney, M. The effect of external water pressure on the liner behavior of large cross-section tunnels. Tunn. Undergr. Space Technol. 2016, 60, 80–95. [Google Scholar] [CrossRef]
Figure 1.
Model test apparatus.

Figure 2.
The cross section of the asymmetrical double-arch tunnel (unit: m).

Figure 3.
Layout of measurement instruments.

Figure 4.
Finite element model for model test.

Figure 5.
Distribution of internal forces for model test: (a) bending moments distribution (kN·m); (b) axial forces distribution (kN).
Figure 5.
Distribution of internal forces for model test: (a) bending moments distribution (kN·m); (b) axial forces distribution (kN).


Figure 6.
Distribution of internal forces for numerical simulation: (a) bending moments distribution (kN·m); (b) axial forces distribution (kN).
Figure 6.
Distribution of internal forces for numerical simulation: (a) bending moments distribution (kN·m); (b) axial forces distribution (kN).

Figure 7.
Deformation of the liner when loading to 6.0 MPa (mm).

Figure 8.
Photographs of the cracks during the loading process: (a) the inverted arch of the left tunnel; (b) the inverted arch of the right tunnel; (c) the sidewall of the left tunnel; (d) the crown of the left tunnel; (e) the crown of the right tunnel; (f) the arch foot of the right tunnel; (g) the right spandrel of the left tunnel; (h) the connection between the spandrel and the middle wall.


Figure 9.
Failure patterns of the liner for the model test.

Figure 10.
Failure patterns of the liner for numerical simulation.

Figure 11.
The cross section of the double-arch tunnels (unit: m): (a) CS1: asymmetrical double-arch tunnel; (b) CS2: symmetrical double-arch tunnel.
Figure 11.
The cross section of the double-arch tunnels (unit: m): (a) CS1: asymmetrical double-arch tunnel; (b) CS2: symmetrical double-arch tunnel.

Figure 12.
Bending moments distribution (kN·m): (a) Test CS1-1: tunnel without voids; (b) Test CS1-2: tunnel with a void of 1.0 m height; (c) Test CS1-3: tunnel with a void of 2.0 m height.
Figure 12.
Bending moments distribution (kN·m): (a) Test CS1-1: tunnel without voids; (b) Test CS1-2: tunnel with a void of 1.0 m height; (c) Test CS1-3: tunnel with a void of 2.0 m height.


Figure 13.
Axial forces distribution (kN): (a) Test CS1-1: tunnel without voids; (b) Test CS1-2: tunnel with a void of 1.0 m height; (c) Test CS1-3: tunnel with a void of 2.0 m height.
Figure 13.
Axial forces distribution (kN): (a) Test CS1-1: tunnel without voids; (b) Test CS1-2: tunnel with a void of 1.0 m height; (c) Test CS1-3: tunnel with a void of 2.0 m height.


Figure 14.
Deformation of liner.

Figure 15.
Summary of convergence deformation.

Figure 16.
Failure patterns of liner: (a) Test CS1-1: tunnel without voids; (b) Test CS1-2: tunnel with a void of 1.0 m height; (c) Test CS1-3: tunnel with a void of 2.0 m height.
Figure 16.
Failure patterns of liner: (a) Test CS1-1: tunnel without voids; (b) Test CS1-2: tunnel with a void of 1.0 m height; (c) Test CS1-3: tunnel with a void of 2.0 m height.

Figure 17.
Bending moments distribution (kN): (a) Test CS2-1: tunnel without voids; (b) Test CS2-2: tunnel with a void of 1.0 m height.
Figure 17.
Bending moments distribution (kN): (a) Test CS2-1: tunnel without voids; (b) Test CS2-2: tunnel with a void of 1.0 m height.

Figure 18.
Axial forces distribution (kN): (a) Test CS2-1: tunnel without voids; (b) Test CS2-2: tunnel with a void of 1.0 m height.
Figure 18.
Axial forces distribution (kN): (a) Test CS2-1: tunnel without voids; (b) Test CS2-2: tunnel with a void of 1.0 m height.


Figure 19.
Internal force changes induced by voids: (a) changes in bending moment; (b) changes in axial force.
Figure 19.
Internal force changes induced by voids: (a) changes in bending moment; (b) changes in axial force.

Figure 20.
Deformation of liner when loading to 6.0 MPa (mm).

Figure 21.
Failure patterns of liner: (a) Test CS2-1: tunnel without voids; (b) Test CS2-2: tunnel with a void of 1.0 m height.
Figure 21.
Failure patterns of liner: (a) Test CS2-1: tunnel without voids; (b) Test CS2-2: tunnel with a void of 1.0 m height.


Table 1.
Similarity ratios adopted in the model test.
| Parameters | Similarity Ratios |
|---|---|
| Over load | 40 |
| Geometry | 40 |
| Unit weight | 1 |
| Elastic modulus | 40 |
| Poisson’s ratio | 1 |
| Cohesion | 40 |
| Friction angle | 1 |
Table 2.
Mechanical parameters of model and prototype materials.
| Materials | Unit Weight (kN/m3) | Elastic Modulus (GPa) | Poisson’s Ratio | Cohesion (kPa) | Friction Angle (°) |
|---|---|---|---|---|---|
| Rock mass—M 1 | 18 | 0.021 | 0.32 | 4.6 | 22 |
| Rock mass—P 2 | 18 | 0.85 | 0.32 | 180 | 22 |
| Liner—M | 8.4 | 0.723 | 0.20 | — | — |
| Liner—P | 25 | 30 | 0.20 | — | — |
1 M represents model test. 2 P represents prototype.
Table 3.
Summary of numerical simulations.
| Liner for CS1 | Liner for CS2 | ||
|---|---|---|---|
| Test Number | Height of Voids | Test Number | Height of Voids |
| CS1-1 | None | CS2-1 | None |
| CS1-2 | 1.0 m | CS2-2 | 1.0 m |
| CS1-3 | 2.0 m | ||
© 2018 by the authors. Licensee MDPI, Basel, Switzerland. This article is an open access article distributed under the terms and conditions of the Creative Commons Attribution (CC BY) license (http://creativecommons.org/licenses/by/4.0/).
Share and Cite
MDPI and ACS Style
Min, B.; Zhang, X.; Zhang, C.; Gong, Y.; Yuan, T. Mechanical Behavior of Double-Arch Tunnels under the Effect of Voids on the Top of the Middle Wall. Symmetry 2018, 10, 703. https://doi.org/10.3390/sym10120703
AMA Style
Min B, Zhang X, Zhang C, Gong Y, Yuan T. Mechanical Behavior of Double-Arch Tunnels under the Effect of Voids on the Top of the Middle Wall. Symmetry. 2018; 10(12):703. https://doi.org/10.3390/sym10120703
Chicago/Turabian StyleMin, Bo, Xu Zhang, Chengping Zhang, Yanping Gong, and Tengfei Yuan. 2018. "Mechanical Behavior of Double-Arch Tunnels under the Effect of Voids on the Top of the Middle Wall" Symmetry 10, no. 12: 703. https://doi.org/10.3390/sym10120703
Note that from the first issue of 2016, this journal uses article numbers instead of page numbers. See further details here.