Article

Dense Fully Convolutional Segmentation of the Optic Disc and Cup in Colour Fundus for Glaucoma Diagnosis

1
Department of Electrical Engineering and Electronics, University of Liverpool, Liverpool L69 3GJ, UK
2
Department of Computer and Software Engineering, University of Diyala, 32010 Baqubah, Iraq
3
Department of Eye and Vision Science, Institute of Ageing and Chronic Disease, University of Liverpool, 6 West Derby Street, Liverpool L7 8TX, UK
*
Author to whom correspondence should be addressed.
These authors contributed equally to this work.
Symmetry 2018, 10(4), 87; https://doi.org/10.3390/sym10040087
Submission received: 11 February 2018 / Revised: 8 March 2018 / Accepted: 28 March 2018 / Published: 30 March 2018
(This article belongs to the Special Issue Advances in Medical Image Segmentation)

Abstract

:
Glaucoma is a group of eye diseases which can cause vision loss by damaging the optic nerve. Early glaucoma detection is key to preventing vision loss yet there is a lack of noticeable early symptoms. Colour fundus photography allows the optic disc (OD) to be examined to diagnose glaucoma. Typically, this is done by measuring the vertical cup-to-disc ratio (CDR); however, glaucoma is characterised by thinning of the rim asymmetrically in the inferior-superior-temporal-nasal regions in increasing order. Automatic delineation of the OD features has potential to improve glaucoma management by allowing for this asymmetry to be considered in the measurements. Here, we propose a new deep-learning-based method to segment the OD and optic cup (OC). The core of the proposed method is DenseNet with a fully-convolutional network, whose symmetric U-shaped architecture allows pixel-wise classification. The predicted OD and OC boundaries are then used to estimate the CDR on two axes for glaucoma diagnosis. We assess the proposed method’s performance using a large retinal colour fundus dataset, outperforming state-of-the-art segmentation methods. Furthermore, we generalise our method to segment four fundus datasets from different devices without further training, outperforming the state-of-the-art on two and achieving comparable results on the remaining two.

1. Introduction

Glaucoma is the collective name of a group of eye conditions that results in damage to the optic nerve at the back of the eye, which can cause vision loss. Glaucoma is one of the commonest causes of blindness and is estimated to affect around 80 million people worldwide by 2020 [
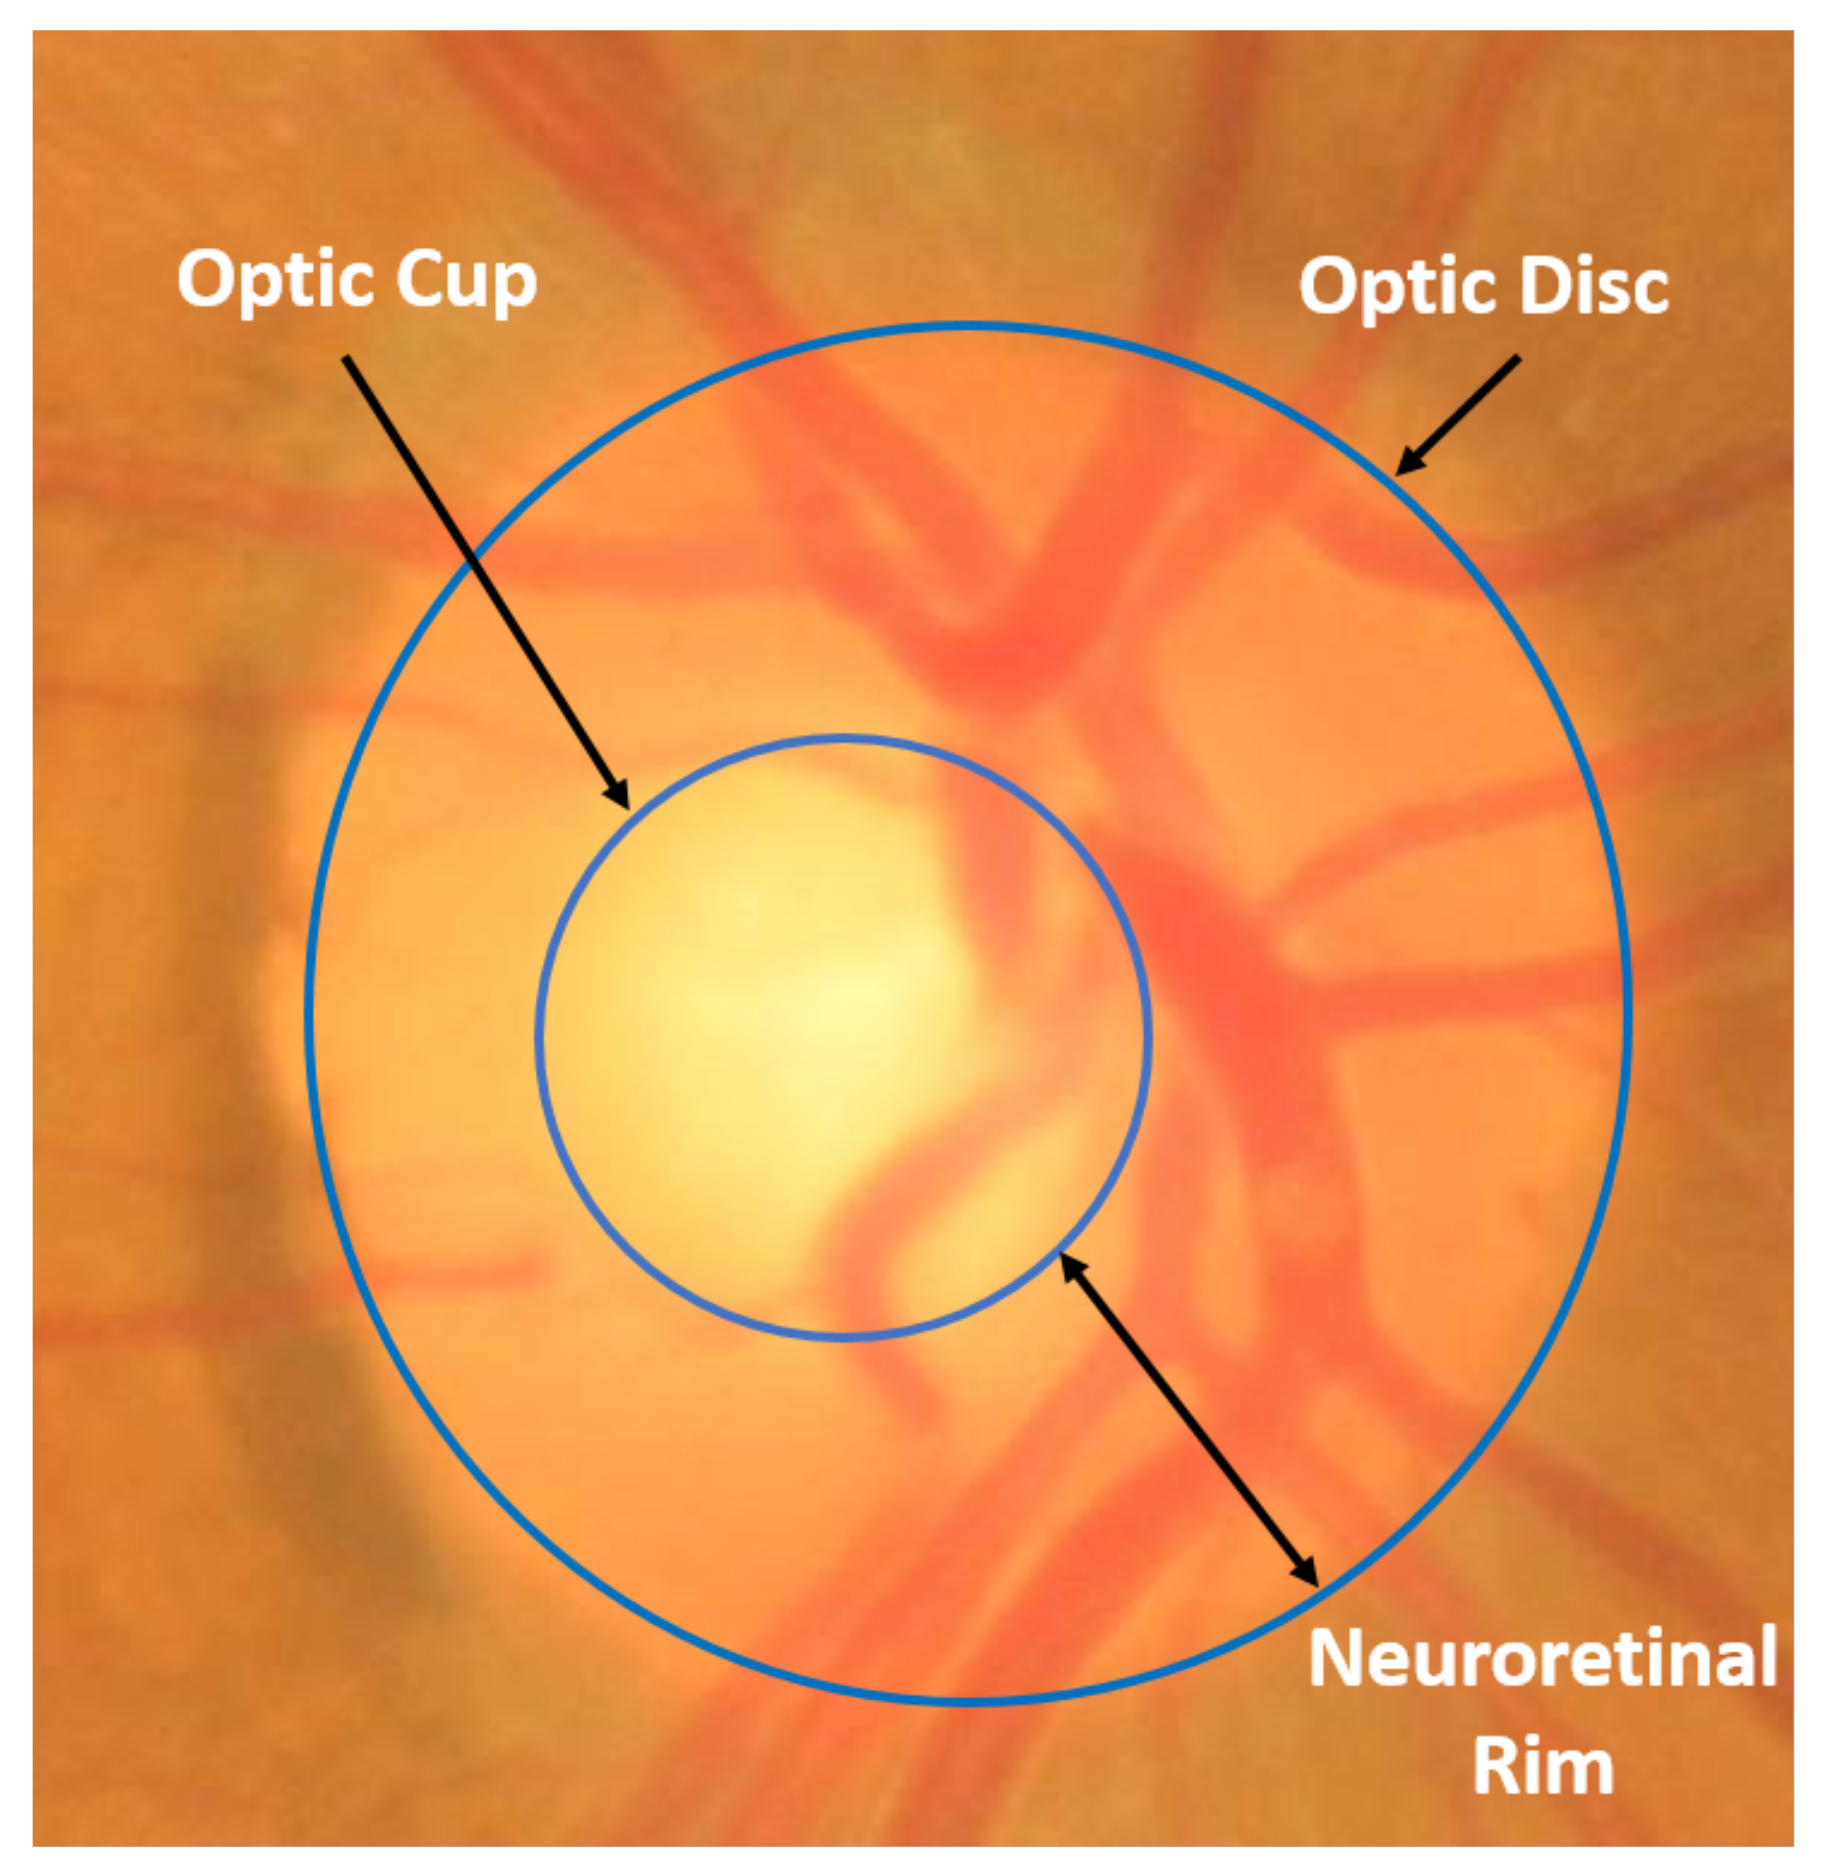
1]. Glaucoma is known as the “silent thief of vision” since, in the early phases of the disease, patients do not have any noticeable pain or symptoms of vision loss. It is only when the disease progresses to a significant loss of peripheral vision that the symptoms potentially leading to total blindness may be noticed. Early detection and timely management of glaucoma is key to helping prevent patients from suffering vision loss. There are many risk factors associated with glaucoma amongst which hypertensive intra ocular pressure (IOP) is the most accepted. It is believed that IOP can cause irreversible damage to the optic nerve head, or optic disc (OD). Since the cornea is transparent, the optic disc can be imaged by several optical imaging techniques, including colour fundus photography. In two dimensional (2D) colour fundus images, the OD can be divided into two regions as shown in Figure 1: a peripheral zone called the neuroretinal rim and a central white region called the optic cup (OC). The ratio of the size (e.g., vertical height) of the OC to the OD, known as CDR, is often used as an indicator for the diagnosis of glaucoma [2]. Accurate segmentation of the OD and OC is essential for useful CDR measurement. However, manual delineation of the OD and OC boundaries in fundus images by human experts is a highly subjective and time consuming process, which is impractical for use in busy clinics. On the other hand, automated segmentation approaches using computers are attractive as they can be more objective and much faster then a human grader. Many different approaches to segmenting of the OD and/or OC in fundus images have been proposed in the literature. The existing methods for automated OD and OC segmentation in fundus images can be broadly classified into three main categories: shape-based template matching [3,4,5,6,7,8,9], active contours and deformable based models [10,11,12,13,14,15,16,17,18], and more recently, machine and deep learning methods [19,20,21,22,23,24,25,26,27,28,29,30,31,32,33,34,35]. We give a brief overview of the existing methods below.
(a) Shape-based and template matching models: These methods model the OD as a circular or elliptical object and try to fit a circle using the Hough transform [4,5,8,9], an ellipse [3,6] or a rounded curve using a sliding band filter [7]. These approaches typically feature in the earlier work in optic disc and cup segmentation. In general, these shape-based modelling approaches to OD and OC segmentation are not robust enough due to intensity inhomogeneity, varying image colour, changes in disc shape by lesions such as exudates present in abnormal images, and the presence of blood vessels inside and around the OD region.
(b) Active contours and deformable based models: These methods have been widely applied for the segmentation of the OD and OC [10,11,12,13,14,15,16,17,18]. Active contours approaches are deformable models which convert the segmentation problem into an energy minimisation problem where different energies are derived to reflect features in the image such as intensity, texture and boundary smoothness. Active contour models are often formulated as non-linear non-convex minimisation problems, thus may not achieve the global minima due to the presence of noise and anomalies. In order to achieve good results in a short time, they require a good initialisation of the OD and OC contour provided either manually or automatically, which suggests their performance is dependent on the initialisation.
(c) Machine- and deep-learning methods: Machine learning, and in particular more recent deep learning based methods have shown promising results for OD and OC segmentation [19,20,21,22,23,24,25,26,27,28,29,30,31,32,33,34,35]. The machine learning based approaches [19,20,21,22,23,24,25,26,27] highly depend on the type of extracted features which might be representative of a particular dataset but not of others. Also, extracting the features manually by hand is a tedious task and takes a considerable amount of time. Nowadays, deep learning approaches represented by convolutional neural networks (CNNs) are an active research topic. Such networks can learn to extract highly complex features from the input data automatically [28,29,30,31,32,33,34,35]. Lim et al. [28] applied CNNs to feature-exaggerated inputs emphasizing disc pallor without blood vessel hindering to segment both the OD and OC. In [29], Maninis et al. used fully-convolutional neural network [36] based on VGG-16 net [37] for the optic disc segmentation task. For optic cup segmentation, Guo et al. [30] used large pixel patch based CNNs where the segmentation was achieved by classification of each pixel patch and post-processing. In [31], a modified version of the U-Net convolutional network [38] was presented by Sevastopolsky for automatic optic disc and cup segmentation. Furthermore, Shankaranarayana et al. [32] proposed a joint optic disc and cup segmentation scheme using fully convolutional and adversarial networks. Moreover, a framework consisting of ensemble learning based CNNs as well as entropy sampling was presented in [33] by Zilly et al. for optic cup and disc segmentation. In addition to that, Hong Tan et al. [34] proposed a single CNN with seven layers to segment the OD by classifying every pixel in the image. Most recently, Fu et al. [35] used a polar transformation with the multi-label deep learning concept by proposing a deep learning architecture, named M-Net, to segment the OD and OC simultaneously. In general, these recent deep learning methods performed well on the basis that they were trained and tested on the same dataset. They might be incapable of achieving robustness and accuracy enough for evaluating the optic disc and cup in clinical practice as there are different type of variations such as population, camera, operators, disease, and image. These concerns of their generalisation ability should be studied thoroughly.
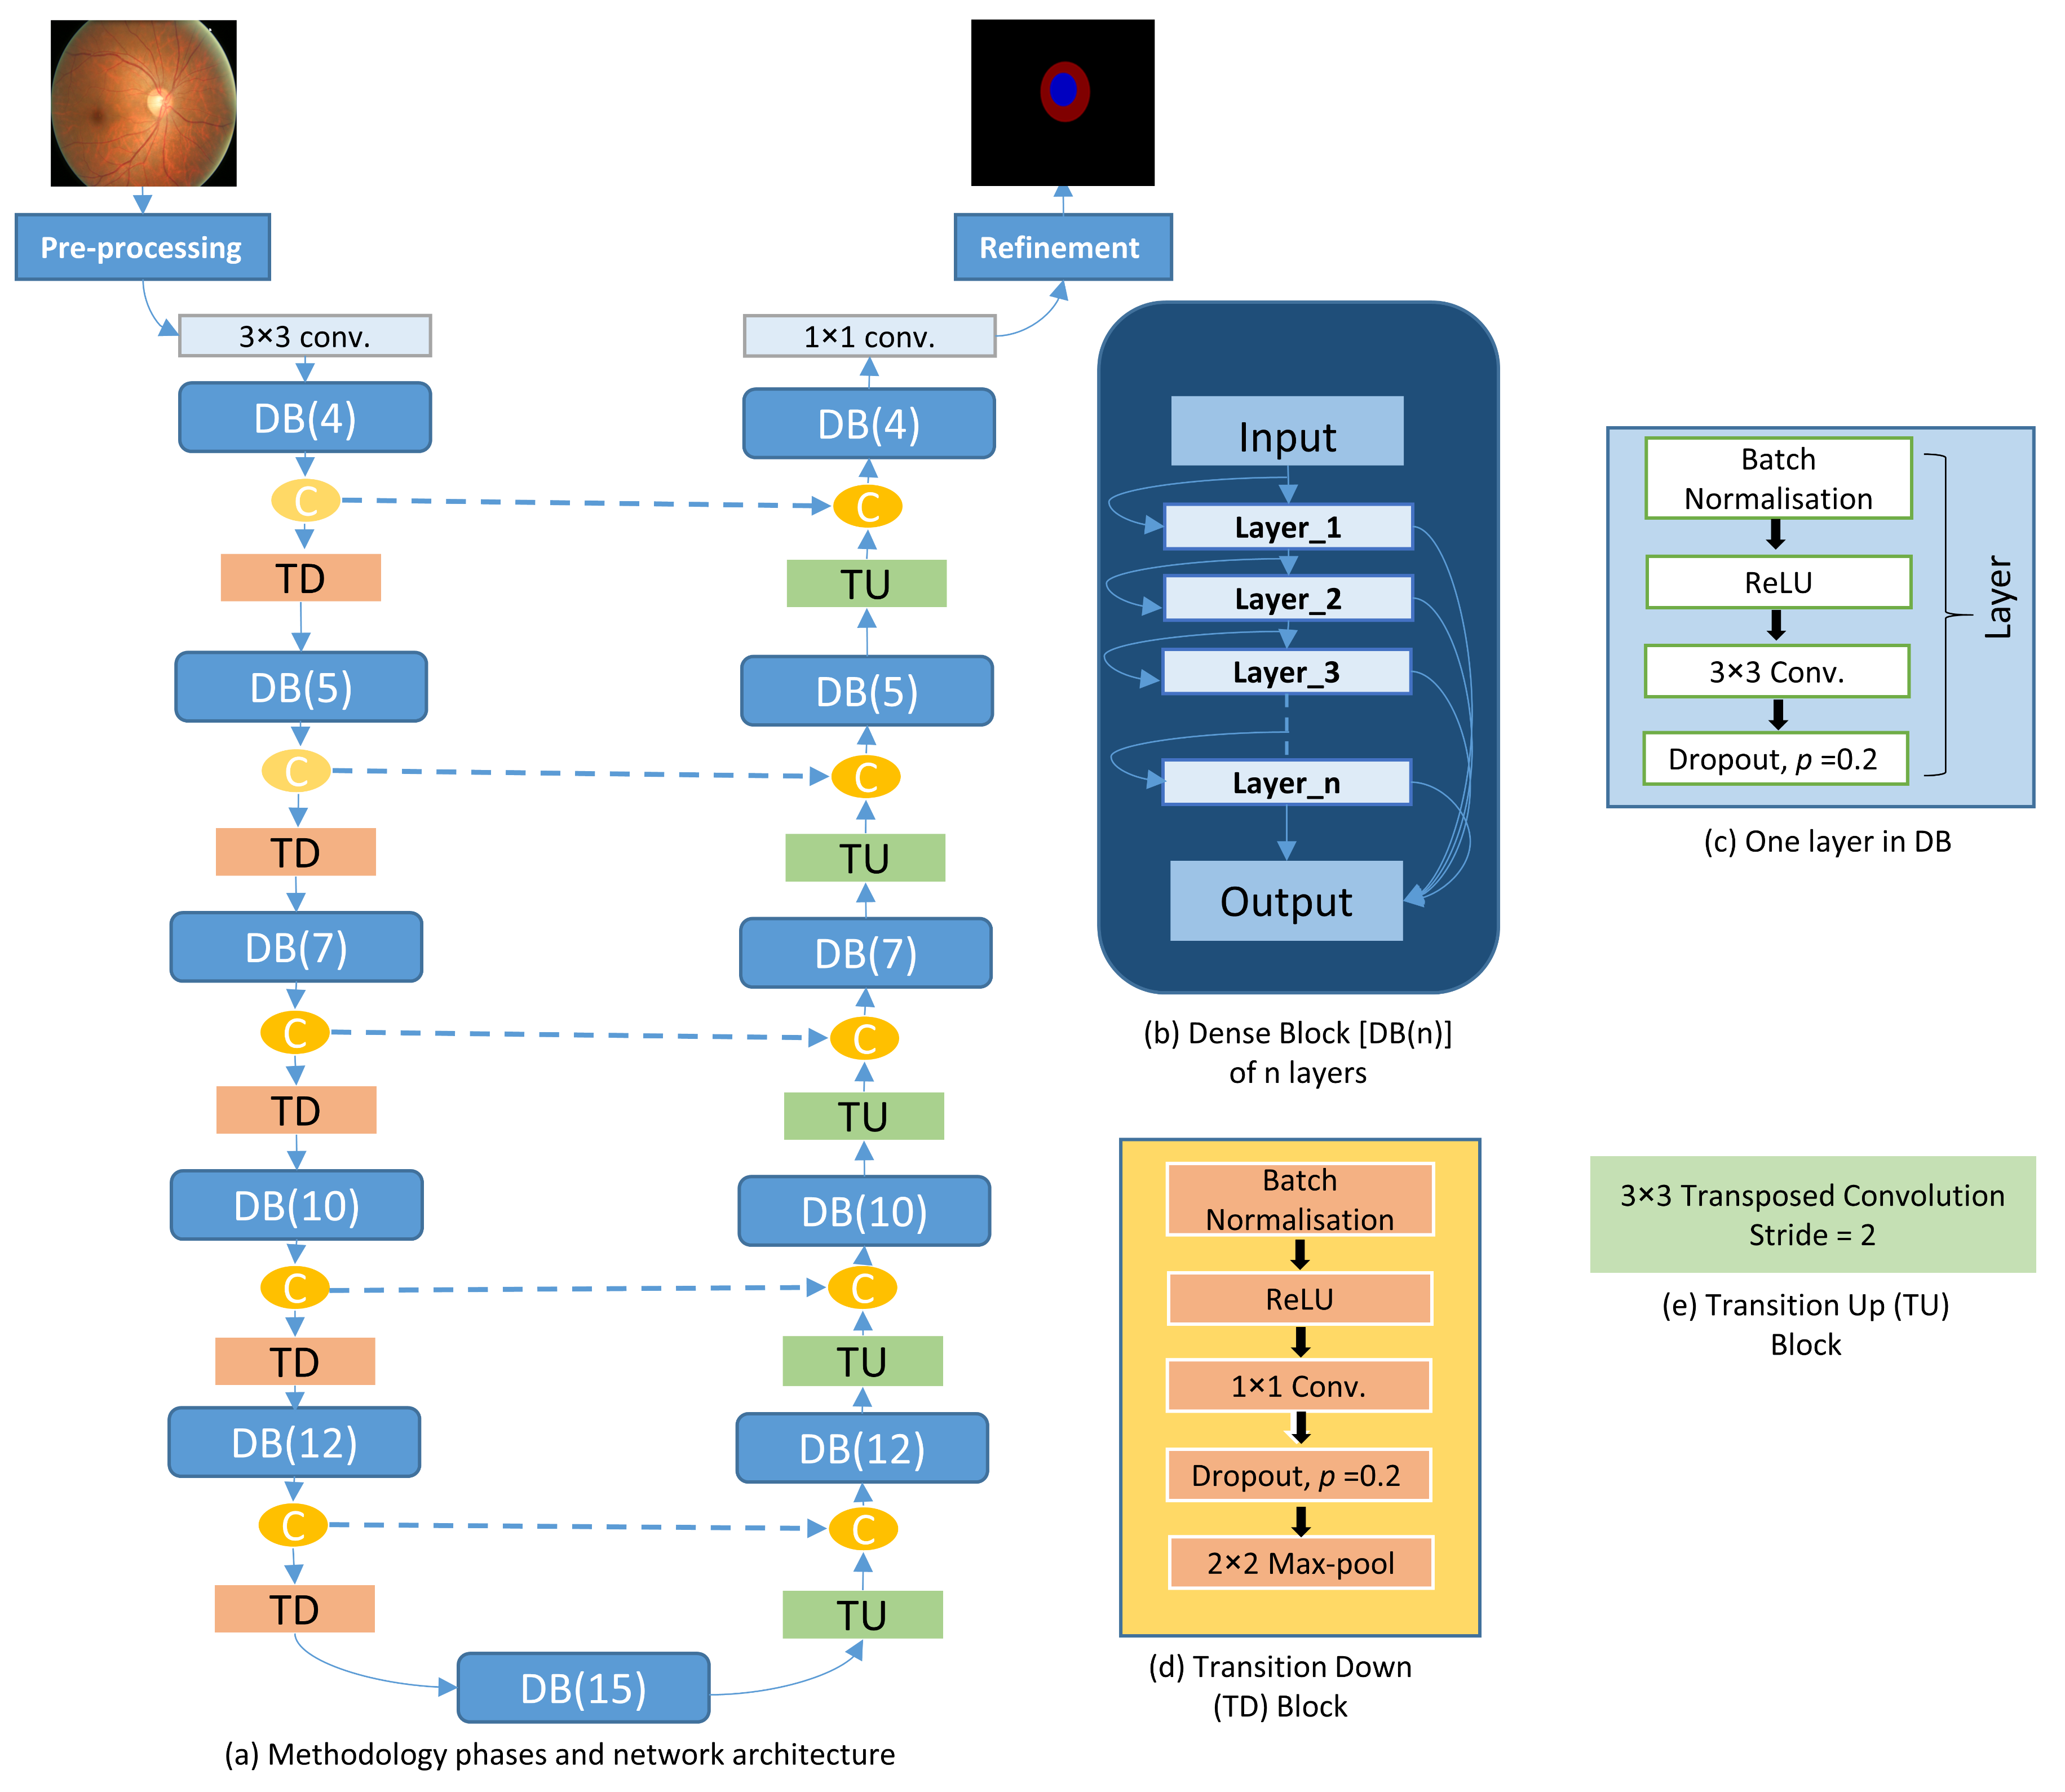
Given the inherent and unsolved challenges encountered in the segmentation of the OD and OC in the aforementioned methods, we propose a new deep learning based method to segment the OD and OC. The proposed method utilises DenseNet incorporated with fully convolutional network (FCN). The FC-DenseNet, which was originally developed for semantic segmentation [39], is adapted and used for the automatic segmentation of the OD and OC. The contributions of this paper are as follows
  • We propose a new strategy of using FC-DenseNet for simultaneous semantic segmentation of the cup and disc in fundus images. This deep network, which encourages feature re-use and reduces the number of parameters needed allows improved segmentation, particularly of the OC.
  • We determine the optic disc diameter (ODD) and use this to crop the images to 2ODD and rescale. This reduces the image to the region of interest automatically, which reduces computation time without requiring excessive reduction of the image resolution. In turn, this enables us to obtain more accurate segmentations of the optic disc and cup which can be used for diagnosis.
  • We show that this approach achieves state of the art results on a large dataset, outperforming the previous methods. We also demonstrate the effectiveness of this method on other datasets without the need of re-training the model using images from those datasets.
  • We carried out a most comprehensive study involving five publically available datasets. This allows for evaluation with images from many different devices and conditions, and from patients of different ethnicities in comparison with previous work and to demonstrate the robustness of our method.
The rest of this paper is organised as follows. In Section 2, the five datasets used in this study as well as the proposed method and associated experiments are described. The obtained results are presented in Section 3 and discussed in Section 4. Finally, Section 5 concludes the paper.

2. Materials and Methods

2.1. Image Datasets

In our experiments, we use five publicly available datasets of colour retinal fundus images: ORIGA [40], DRIONS-DB [41], Drishti-GS [42], ONHSD [10], and RIM-ONE [43]. The ORIGA dataset [40] comprises 650 fundus images with resolution of 3072 × 2048 pixels including 482 normal eyes and 168 glaucomatous eyes. The DRIONS-DB dataset [41] consists of 110 fundus images with resolution of 600 × 400 pixels. The Drishti-GS dataset [42] contains 101 fundus images centred on the OD with a Field-Of-View (FOV) of 30-degrees and resolution of 2896 × 1944 pixels. The ONHSD dataset [10] comprises of 99 fundus images captured using a Canon CR6 45MNf fundus camera from 50 patients. The images have a FOV of 45-degrees and resolution of 640 × 480 pixels. The RIM-ONE dataset [43] comprises 169 fundus images taken using a Nidek AFC-210 fundus camera with a body of a Canon EOS 5D Mark II of 21.1 megapixels with resolution of 2144 × 1424 pixels. The ORIGA, Drishti-GS, and RIM-ONE datasets are provided with the OD and OC ground truth while DRIONS-DB and ONHSD are only provided with the OD ground truth.

2.2. Methods

For the OD and OC segmentation task, our proposed deep learning based approach shown in Figure 2 comprises three main steps: (i) Pre-processing: the image data is prepared for training with different pre-processing schemes considering the green channel only from colour (red-green-blue [RGB]) images since the other colour channels contain less useful information and the green channel was found to have less variability across the datasets than the colour image as a whole. We also extract and crop the region of interest (ROI) represented by the OD region; (ii) Designing and learning: FC-DenseNet architecture [39] is adapted and used to fulfil the pixel-wise classification of images; and finally (iii) Refinement: to obtain the final segmentations by correcting the misclassified pixels located outise the OD and OC areas.
Pre-processing: First, RGB images without considering any pre-processing scheme (referred to as ’Without’ through the text) are used. We do pre-processing on Origa data so that the network will generalise better to other datasets which are not used for training and never seen by the network during the learning. One of the considerations for colour information is achieved by training and testing the network using only green channel (’G’). Further, the region of interest represented by the OD area within two optic disc diameter (2ODD), has been cropped from green channel (’G + C’) and used for the network training.
Designing and Learning: A FC-DenseNet network adapts the classification network DenseNet [44] to a fully-convolutional neural network (FCN) [36] for segmentation. A fully convolutional network is an end-to-end learnable network where the decision-making layers of the network are convolutional filters instead of fully connected layers. This adaptation on the top layers reduces the loss of spatial information caused by fully connected layers as a result of the connectivity of the output neurons of the fully connected layers to all input neurons. The key feature of DenseNet is its ability to further exploit the extracted features reuse and strengthening feature propagation by making a direct connection between each layer to every other layer. The FC-DenseNet network is composed of three main blocks: dense, transition down, and transition up. The Dense block (DB) consists of a batch normalisation layer, followed by rectified linear unit as an activation function, a 3 × 3 convolution layer, and dropout layer with a dropping rate of 0.2. A transition down (TD) block is composed of batch normalisation layer, followed by rectified linear unit as an activation function, 3 × 3 convolution layer, dropout layer with a dropping rate of 0.2, and 2 × 2 Max pooling layer. A transition Up (TU) block contains 3 × 3 transposed convolution layer. Note that batch normalisation can reduce overfitting and dropout has a similar effect. Depending on the level of overfitting, the network may require one, both, or even neither of these. We have found that our network performs better on this problem with including both dropout and batch normalisation.
The architecture of the network used in our experiments (shown in Figure 2) is built from one 3 × 3 convolution layer on the input, followed by five dense blocks each consisting of 4, 5, 7, 10, and 12 layers respectively where each dense block followed by transition down block, one dense block with 15 layers in the last layer of the down-sampling path (bottleneck), five transition up blocks each followed by dense block consisting of 12, 10, 7, 5, and 4 layers respectively, and a 1 × 1 convolution followed by a non-linearity represented by Softmax function. RMSprop [45], an optimisation algorithm based on stochastic gradient descent, is used for network training with a learning rate of 10 - 3 within 120 epochs with early-stop condition of 30 epochs. To increase the number of images artificially, the images are augmented with vertical flips and random crops. The weights of the network have been initialised using HeUniform [46] and cross-entropy is used as a loss function. Once the network is trained, test stage can be achieved using the trained model to segment the images in the test set.
Refinement: To convert the real values resulted from the final layers of fully convolutional DenseNet into a vector of probabilities (i.e., generating the probability maps for the image pixels), the Softmax function is used by squashing the outputs to be between 0 and 1. Here, the OD and OC segmentation problem are formulated as a three class classification task: class 0 as background, class 1 as OC, and class 2 as OD. Thus, the predicted class label of image pixels can be further refined by correcting the misclassified pixels in the background. This can be achieved by finding the area of all connected objects in the predicted images. The object of maximum area is retained by considering it as the OD/OC region and classifying any other small objects as background class label (’G + C + PP’).

3. Results

All experiments were run on an HP Z440 Workstation with Intel Xeon E5-1620, 16GB RAM and an NVidia Titan X GPU which was used to train the CNN. We split the Origa dataset into 70% for training (10% of training data is randomly utilised for validation) and 30% for independent test set. The resolution of images is resized into 256 × 256 . The performance of the proposed method for segmenting the OD and OC when compared with the ground truth was evaluated using many evaluation metrics such as Dice coefficient (F-Measurement), Jaccard (overlapping), accuracy, sensitivity, and specificity which can be defined as follows:
D i c e ( D C ) = 2 × t p 2 × t p + f p + f n
J a c c a r d ( J c ) = t p t p + f p + f n
A c c u a c r y ( A c c ) = t p + t n t p + t n + f p + f n
S e n s i t i v i t y ( S E N ) = t p t p + f n
S p e c i f i c i t y ( S P C ) = t n t n + f p
where t p , f p , t n and f n refer to true positive, false positive, true negative, and false negative, respectively.
To assess the performance of proposed system, two evaluation scenarios are considered. First, study the performance of the system by training and testing the model on the same dataset (Origa). Second, study the performance of the system by training the model on a dataset (Origa) and testing it on other four independent datasets including DRIONS-DB, Drishti-GS, ONHSD, and RIM-ONE. Table 1, Table 2, Table 3 and Table 4 show the performance of the model trained and tested on the Origa for the OD, OC, joint OD-OC segmentation, respectively. It achieves Dice score (F-measurement), Jaccard score (overlap), accuracy, sensitivity, and specificity of 0.8723, 0.7788, 0.9986, 0.8768, and 0.9994, respectively for the OC segmentation and 0.964, 0.9311, 0.9989, 0.9696, and 0.9994 for the OD segmentation. The performance of segmenting rim area located between the OD and OC contours is also calculated. It achieves Dice score (F-measurement), Jaccard score (overlap), accuracy, sensitivity, and specificity of 0.8764, 0.7849, 0.9975, 0.9028, and 0.9985 on the Origa.
For Glaucoma diagnosis, CDR is typically calculated along the vertical line passing through the optic cup centre (superior-inferior) and then a suitable ratio threshold may be defined. Varying the thresholds and comparing with the expert’s glaucoma diagnosis, we achieve an area under the receiving operator curve (AUROC) of 0.7443 based on our segmentations which is very close to the 0.786 achieved using the ground truth segmentations. Since this limits us to considering only a few points on the optic disc, we extend this to incorporate the horizontal CDR (nasal-temporal). That is, we take the average CDR vertically and horizontally and consider thresholds. We thus achieve an AUROC of 0.7776 which is considerably higher than using only the vertical CDR and closer to the AUROC of 0.7717 achieved by using the expert’s annotation.
Table 5 and Table 6 present the results of proposed system which is trained on the Origa dataset and assessed on the DRIONS-DB and ONHSD datasets, respectively. In these two datasets, only the optic disc segmentation performance are reported because the ground truth of the OC is not provided. The best results have been obtained by considering the cropped green channel along with refinement (G+C+PP) achieving Dice score (F-measurement), Jaccard score (overlap), accuracy, sensitivity, and specificity of 0.9415, 0.8912, 0.9966, 0.9232, and 0.999, respectively, on the DRIONS-DB dataset and 0.9556, 0.9155, 0.999, 0.9376, and, 0.9997 respectively on the ONHSD dataset. Further, the network trained on the Origa is tested on the Drishti-GS and RIM-ONE datasets achieved the results reported in Table 7 and Table 8, respectively. Also, the best obtained results on these datasets are achieved using the cropped green channel images (G+C+PP). 
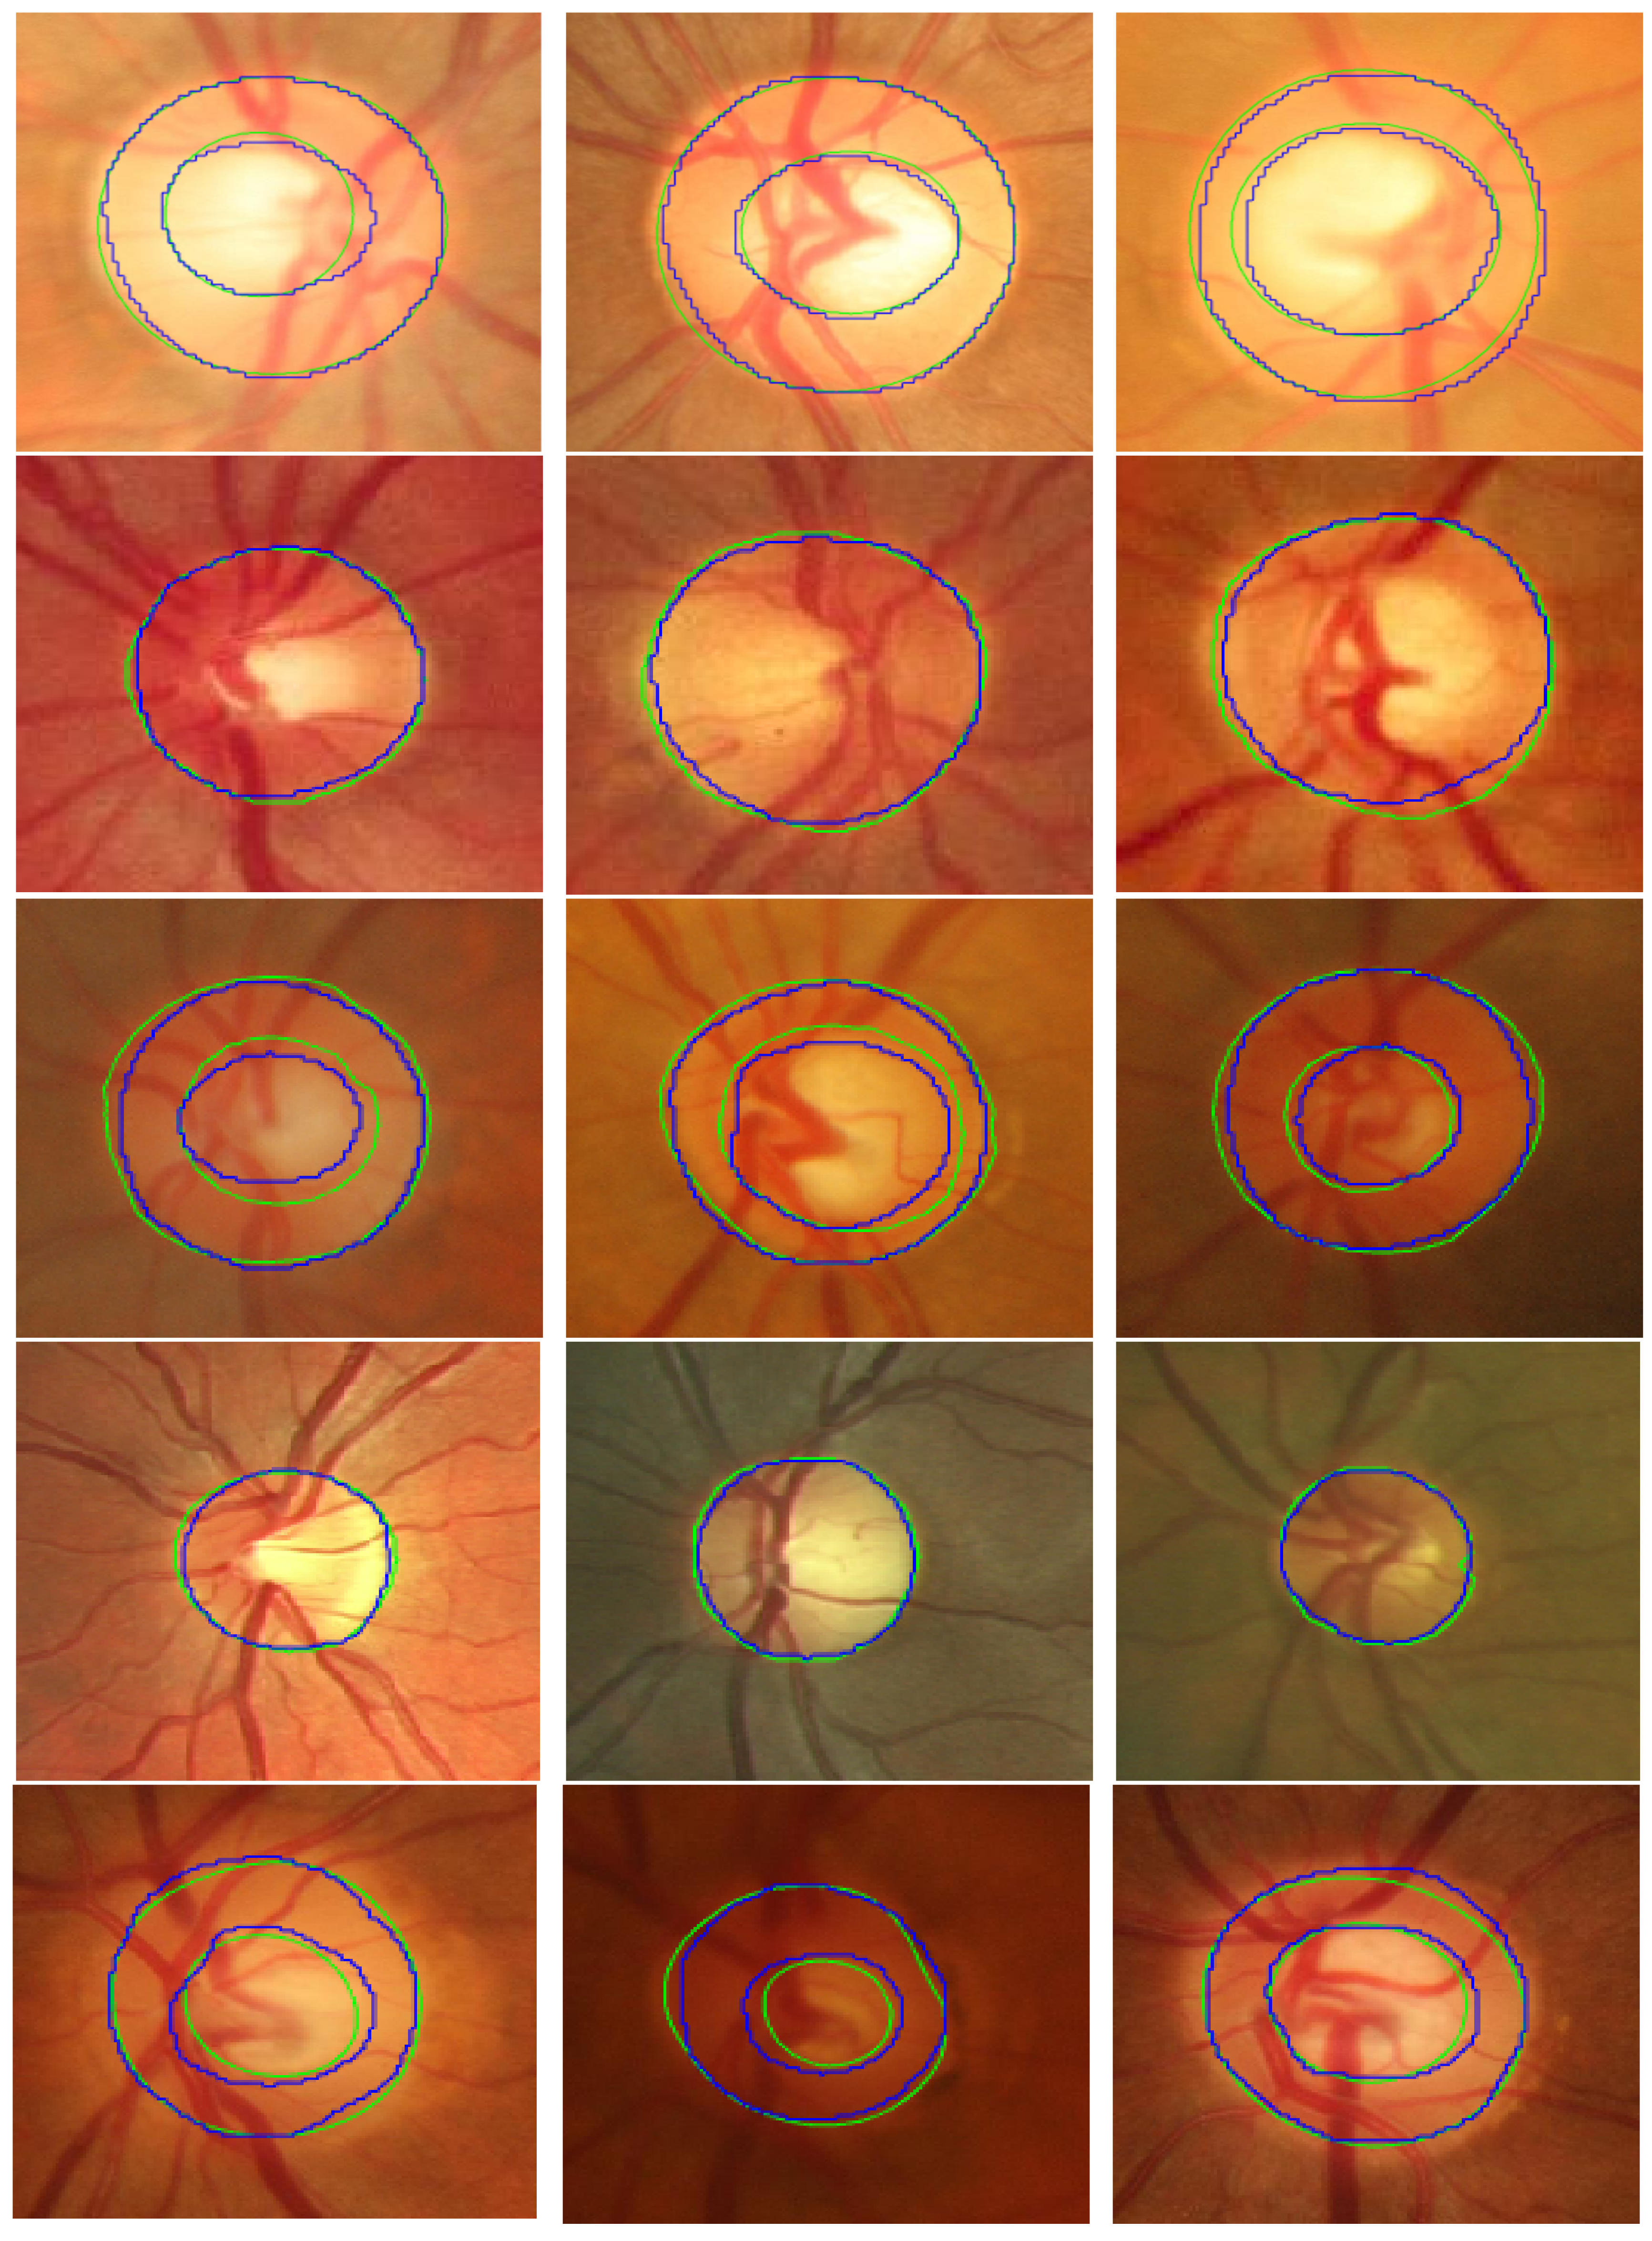
Figure 3 shows examples of the OD and OC segmentation results on fundus image from the five datasets.

4. Discussion

A novel approach based on a fully convolutional Dense network has been proposed for the joint simultaneous segmentation of the OD and OC in colour fundus images. The proposed method achieves the segmentation by extracting complex data representations from retinal images without the need of human intervention. It has been demonstrated that the performance of our proposed generalised system can outperform or achieve comparable results with competing approaches. These findings also reflect the efficiency and usefulness of FC-DenseNet for the OD and OC segmentation.
Moreover, we have demonstrated that the performance appears to be invariant to variations such as population, camera, operators, disease, and image. This is achieved by the following strategies. First, the pre-processing step was used to reduce variations such as population, camera, operators, disease, and image. Second, the DenseNet approach adopted appears to have excellent generalisation capability due to its ability to learn deeper features. Third, we have performed comprehensive evaluations by subjecting the model to five different datasets that gives reasonable diversity. In particular, we only trained the model on one dataset and applied to the other 4 datsets without further training for refinement, the results showed that our approach convincingly perform robust and accurate segmentation on ‘unseen’ images from other datasets.
In terms of comparing our proposed method to the existing methods in the literature, Table 1, Table 2, Table 3 and Table 4, Table 9, Table 10, Table 11 and Table 12 present the comparison in terms of Dice score (F-measurement), Jaccard score (overlap), accuracy, sensitivity, and specificity measurements. Table 1 presents the comparison of the model trained and tested on the Origa with the existing methods proposed for the OD segmentation. The comparison with 15 methods shows that our method outperforms almost all of them. Wong et al. [20] reported segmentation overlap of 0.9398 which is slightly better than 0.9334 obtained by our proposed system. However, their method only segments the OD region and they used features extracted manually which might be applicable to the dataset they have used but not to other datasets. For the OC region, our proposed method achieves the best results comparing to other existing methods as shown in Table 2. For joint OD and OC segmentation results shown in Table 3, our method also outperforms the proposed methods in the literature.
Table 9 and Table 10 present the comparison of our system trained on Origa and tested on the Drishti-GS and RIM-ONE datasets respectively with the methods were trained and tested on those datasets. The results of our method on Drishti-GS outperform the results reported by Nawaldgi [58] and Oktoeberza et al. [59]. Sedai et al. [27] and Zilly et al. [33] report Dice and overlap scores slightly better than ours in segmenting the OC and OD regions. However, they used the same dataset (Drishti-GS) for training and testing their system while our system is trained on the Origa images only and tested on the Drishti-GS which make it more generalisable. Furthermore, Guo et al. [30] and Sevastopolsky [31] used the same dataset (Drishti-GS) for training and testing, and segmented the OD region only. For the RIM-ONE dataset, we compared our method with three methods as shown in Table 10. Similarly, these methods were tested on the same dataset used in the learning process which makes the efficacy of their system performance doubtful on other datasets. Our performance with RIM-ONE is lower than that of Drishti-GS and competing methods which suggests that more adaptive generalisation technique may be needed for this one set. However, we have achieved better that the state-of-the-art and all competing methods on the remaining datasets. Table 4, Table 11 and Table 12 show that our system trained only on Origa gives the best results compared to others on Origa, DRIONS-DB, and ONHSD datasets, respectively.
For the rim region segmentation, our system achieved an overlap of 0.7708 and balanced accuracy; which can be obtained by calculating the mean of achieved sensitivity and specificity; of 0.93 on Origa dataset. The most recent published paper for the OD and OC segmentation [35] reported rim segmentation overlap of 0.767 and balanced accuracy of 0.941 on the Origa. Their reported results are very close to ours although they’ve used a different scheme of data splitting for training and testing. Other existing methods in the literature have not reported rim region segmentation performance.
Furthermore, AUROC curve performance shows excellent agreement between grading done by ophthalmologist and the proposed system for glaucoma diagnosis. Combining the vertical cup to disc ratio with horizontal cup to disc ratio significantly improves the automated grading results and suggests that these diagnosis results could be further improved by using complete profile of the OD.
On the other hand, it should be mentioned here that the proposed method still has some limitations including: (i) the use of the OD centre in the preprocessing stage is based on calculating it from the ground truth data; (ii) despite of the short testing time (<0.5 s), the training time has been a relatively long (≈15 h) and; (iii) the size of training set used in this work is limited to 455 images only which is a relatively small. However, these limitations can be overcome through (i) using an automated localisation of the OD centre location as suggested by the authors in [60]; (ii) using a more efficient competing resources than that used in this study; and (iii) using a larger-size training set as more annotated data becomes available.

5. Conclusions

A new deep learning based approach to segment the OD and OC in retinal fundus images by leveraging the combination of fully convolutional network and DenseNet has been presented. The FC-DenseNet was trained only on one dataset and evaluated on images provided from four other datasets which were captured by different imaging modalities and under various circumstances. It was shown by extensive experimental evaluations as well as comparisons with the existing methods that our proposed segmentation method outperforms most of state of the art methods for the simultaneous segmentation of the OC and OD. The obtained results show high quality segmentation results, demonstrating the effectiveness of the FC-DenseNet in optic disc/cup segmentation and consequently in glaucoma diagnosis. That suggests its application to various problems in medical images like vessel and lesion segmentation.

Acknowledgments

Baidaa Al-Bander was financially supported by the Higher Committee for Education Development in Iraq (Grant No. 182).

Author Contributions

Baidaa Al-Bander and Bryan M. Williams conceived, designed, performed the experiments, and wrote the paper; Yalin Zheng and Waleed Al-Nuaimy ran the project; Majid A. Al-Taee and Harry Pratt contributed to the paper writing/editing.

Conflicts of Interest

The authors declare no conflict of interest.

References

  1. Quigley, H.A.; Broman, A.T. The number of people with glaucoma worldwide in 2010 and 2020. Br. J. Ophthalmol. 2006, 90, 262–267. [Google Scholar] [CrossRef] [PubMed]
  2. Damms, T.; Dannheim, F. Sensitivity and specificity of optic disc parameters in chronic glaucoma. Investig. Ophthalmol. Vis. Sci. 1993, 34, 2246–2250. [Google Scholar]
  3. Pallawala, P.; Hsu, W.; Lee, M.L.; Eong, K.G.A. Automated optic disc localization and contour detection using ellipse fitting and wavelet transform. In Proceedings of the European Conference on Computer Vision, Prague, Czech Republic, 11–14 May 2004; Springer: Berlin, Heidelberg, Germany, 2004; pp. 139–151. [Google Scholar]
  4. Zhu, X.; Rangayyan, R.M. Detection of the optic disc in images of the retina using the Hough transform. In Proceedings of the 30th Annual International Conference of the IEEE Engineering in Medicine and Biology Society (EMBS 2008), Vancouver, BC, Canada, 20–25 August 2008; IEEE: New York, NY, USA, 2008; pp. 3546–3549. [Google Scholar]
  5. Aquino, A.; Gegúndez-Arias, M.E.; Marín, D. Detecting the optic disc boundary in digital fundus images using morphological, edge detection, and feature extraction techniques. IEEE Trans. Med. Imaging 2010, 29, 1860–1869. [Google Scholar] [CrossRef] [PubMed]
  6. Giachetti, A.; Ballerini, L.; Trucco, E. Accurate and reliable segmentation of the optic disc in digital fundus images. J. Med. Imaging 2014, 1, 024001. [Google Scholar] [CrossRef] [PubMed] [Green Version]
  7. Dashtbozorg, B.; Mendonça, A.M.; Campilho, A. Optic disc segmentation using the sliding band filter. Comput. Biol. Med. 2015, 56, 1–12. [Google Scholar] [CrossRef] [PubMed]
  8. Almazroa, A.; Alodhayb, S.; Raahemifar, K.; Lakshminarayanan, V. Optic cup segmentation: Type-II fuzzy thresholding approach and blood vessel extraction. Clin. Ophthalmol. 2017, 11, 841. [Google Scholar] [CrossRef] [PubMed]
  9. Sigut, J.; Nunez, O.; Fumero, F.; Gonzalez, M.; Arnay, R. Contrast based circular approximation for accurate and robust optic disc segmentation in retinal images. PeerJ 2017, 5, e3763. [Google Scholar] [CrossRef] [PubMed]
  10. Lowell, J.; Hunter, A.; Steel, D.; Basu, A.; Ryder, R.; Fletcher, E.; Kennedy, L. Optic nerve head segmentation. IEEE Trans. Med. Imaging 2004, 23, 256–264. [Google Scholar] [CrossRef] [PubMed]
  11. Xu, J.; Chutatape, O.; Sung, E.; Zheng, C.; Kuan, P.C.T. Optic disk feature extraction via modified deformable model technique for glaucoma analysis. Pattern Recognit. 2007, 40, 2063–2076. [Google Scholar] [CrossRef]
  12. Hussain, A.R. Optic nerve head segmentation using genetic active contours. In Proceedings of the International Conference on Computer and Communication Engineering (ICCCE 2008), Kuala Lumpur, Malaysia, 13–15 May 2008; IEEE: New York, NY, USA, 2008; pp. 783–787. [Google Scholar]
  13. Joshi, G.D.; Sivaswamy, J.; Krishnadas, S. Optic disk and cup segmentation from monocular color retinal images for glaucoma assessment. IEEE Trans. Med. Imaging 2011, 30, 1192–1205. [Google Scholar] [CrossRef] [PubMed]
  14. Yu, H.; Barriga, E.S.; Agurto, C.; Echegaray, S.; Pattichis, M.S.; Bauman, W.; Soliz, P. Fast localization and segmentation of optic disk in retinal images using directional matched filtering and level sets. IEEE Trans. Inf. Technol. Biomed. 2012, 16, 644–657. [Google Scholar] [CrossRef] [PubMed]
  15. Zheng, Y.; Stambolian, D.; O’Brien, J.; Gee, J.C. Optic disc and cup segmentation from color fundus photograph using graph cut with priors. In Proceedings of the International Conference on Medical Image Computing and Computer-Assisted Intervention, Nagoya, Japan, 22–26 September 2013; Springer: Berlin, Heidelberg, Germany, 2013; pp. 75–82. [Google Scholar]
  16. Mary, M.C.V.S.; Rajsingh, E.B.; Jacob, J.K.K.; Anandhi, D.; Amato, U.; Selvan, S.E. An empirical study on optic disc segmentation using an active contour model. Biomed. Signal Process. Control 2015, 18, 19–29. [Google Scholar] [CrossRef]
  17. Mittapalli, P.S.; Kande, G.B. Segmentation of optic disk and optic cup from digital fundus images for the assessment of glaucoma. Biomed. Signal Process. Control 2016, 24, 34–46. [Google Scholar] [CrossRef]
  18. Arnay, R.; Fumero, F.; Sigut, J. Ant colony optimization-based method for optic cup segmentation in retinal images. Appl. Soft Comput. 2017, 52, 409–417. [Google Scholar] [CrossRef]
  19. Abramoff, M.D.; Alward, W.L.; Greenlee, E.C.; Shuba, L.; Kim, C.Y.; Fingert, J.H.; Kwon, Y.H. Automated segmentation of the optic disc from stereo color photographs using physiologically plausible features. Investig. Ophthalmol. Vis. Sci. 2007, 48, 1665–1673. [Google Scholar] [CrossRef] [PubMed]
  20. Wong, D.W.K.; Liu, J.; Tan, N.M.; Yin, F.; Lee, B.H.; Wong, T.Y. Learning-based approach for the automatic detection of the optic disc in digital retinal fundus photographs. In Proceedings of the 2010 Annual International Conference of the IEEE Engineering in Medicine and Biology Society (EMBC), Buenos Aires, Argentina, 31 August–4 September 2010; IEEE: New York, NY, USA, 2010; pp. 5355–5358. [Google Scholar]
  21. Cheng, J.; Liu, J.; Xu, Y.; Yin, F.; Wong, D.W.K.; Tan, N.M.; Tao, D.; Cheng, C.Y.; Aung, T.; Wong, T.Y. Superpixel classification based optic disc and optic cup segmentation for glaucoma screening. IEEE Trans. Med. Imaging 2013, 32, 1019–1032. [Google Scholar] [CrossRef] [PubMed]
  22. Xu, Y.; Duan, L.; Lin, S.; Chen, X.; Wong, D.W.K.; Wong, T.Y.; Liu, J. Optic cup segmentation for glaucoma detection using low-rank superpixel representation. In Proceedings of the International Conference on Medical Image Computing and Computer-Assisted Intervention, Boston, MA, USA, 14–18 September 2014; Springer: Cham, Switzerland, 2014; pp. 788–795. [Google Scholar]
  23. Tan, N.M.; Xu, Y.; Goh, W.B.; Liu, J. Robust multi-scale superpixel classification for optic cup localization. Comput. Med. Imaging Graph. 2015, 40, 182–193. [Google Scholar] [CrossRef] [PubMed]
  24. Roychowdhury, S.; Koozekanani, D.D.; Kuchinka, S.N.; Parhi, K.K. Optic disc boundary and vessel origin segmentation of fundus images. IEEE J. Biomed. Health Inform. 2016, 20, 1562–1574. [Google Scholar] [CrossRef] [PubMed]
  25. Akyol, K.; Şen, B.; Bayır, Ş. Automatic detection of optic disc in retinal image by using keypoint detection, texture analysis, and visual dictionary techniques. Comput. Math. Methods Med. 2016, 2016, 6814791. [Google Scholar] [CrossRef] [PubMed]
  26. Girard, F.; Kavalec, C.; Grenier, S.; Tahar, H.B.; Cheriet, F. Simultaneous macula detection and optic disc boundary segmentation in retinal fundus images. In Medical Imaging: Image Processing; International Society for Optics and Photonics: Washington, DC, USA, 2016; p. 97841F. [Google Scholar]
  27. Sedai, S.; Roy, P.K.; Mahapatra, D.; Garnavi, R. Segmentation of optic disc and optic cup in retinal fundus images using shape regression. In Proceedings of the 2016 IEEE 38th Annual International Conference of the Engineering in Medicine and Biology Society (EMBC), Orlando, FL, USA, 16–20 August 2016; IEEE: New York, NY, USA, 2016; pp. 3260–3264. [Google Scholar]
  28. Lim, G.; Cheng, Y.; Hsu, W.; Lee, M.L. Integrated optic disc and cup segmentation with deep learning. In Proceedings of the 2015 IEEE 27th International Conference on Tools with Artificial Intelligence (ICTAI), Vietri sul Mare, Italy, 9–11 November 2015; IEEE: New York, NY, USA, 2015; pp. 162–169. [Google Scholar]
  29. Maninis, K.K.; Pont-Tuset, J.; Arbeláez, P.; Van Gool, L. Deep retinal image understanding. In Proceedings of the International Conference on Medical Image Computing and Computer-Assisted Intervention, Istanbul, Turkey, 17–21 October 2016; Springer: Cham, Switzerland, 2016; pp. 140–148. [Google Scholar]
  30. Guo, Y.; Zou, B.; Chen, Z.; He, Q.; Liu, Q.; Zhao, R. Optic cup segmentation using large pixel patch based CNNs. In Proceedings of the Ophthalmic Medical Image Analysis Third International Workshop (OMIA 2016), Athens, Greece, 21 October 2016. [Google Scholar]
  31. Sevastopolsky, A. Optic disc and cup segmentation methods for glaucoma detection with modification of U-Net convolutional neural network. arXiv, 2017; arXiv:1704.00979. [Google Scholar]
  32. Shankaranarayana, S.M.; Ram, K.; Mitra, K.; Sivaprakasam, M. Joint optic disc and cup segmentation using fully convolutional and adversarial networks. In Fetal, Infant and Ophthalmic Medical Image Analysis; Springer: Cham, Switzerland, 2017; pp. 168–176. [Google Scholar]
  33. Zilly, J.; Buhmann, J.M.; Mahapatra, D. Glaucoma detection using entropy sampling and ensemble learning for automatic optic cup and disc segmentation. Comput. Med. Imaging Graph. 2017, 55, 28–41. [Google Scholar] [CrossRef] [PubMed]
  34. Tan, J.H.; Acharya, U.R.; Bhandary, S.V.; Chua, K.C.; Sivaprasad, S. Segmentation of optic disc, fovea and retinal vasculature using a single convolutional neural network. J. Comput. Sci. 2017, 20, 70–79. [Google Scholar] [CrossRef]
  35. Fu, H.; Cheng, J.; Xu, Y.; Wong, D.W.K.; Liu, J.; Cao, X. Joint optic disc and cup segmentation based on multi-label deep network and polar transformation. arXiv, 2018; arXiv:1801.00926. [Google Scholar]
  36. Long, J.; Shelhamer, E.; Darrell, T. Fully convolutional networks for semantic segmentation. In Proceedings of the IEEE Conference on Computer Vision and Pattern Recognition, Boston, MA, USA, 7–12 June 2015; pp. 3431–3440. [Google Scholar]
  37. Simonyan, K.; Zisserman, A. Very deep convolutional networks for large-scale image recognition. arXiv, 2014; arXiv:1409.1556. [Google Scholar]
  38. Ronneberger, O.; Fischer, P.; Brox, T. U-net: Convolutional networks for biomedical image segmentation. In Proceedings of the International Conference on Medical Image Computing and Computer-Assisted Intervention, Munich, Germany, 5–9 October 2015; Springer: Cham, Switzerland, 2015; pp. 234–241. [Google Scholar]
  39. Jégou, S.; Drozdzal, M.; Vazquez, D.; Romero, A.; Bengio, Y. The one hundred layers tiramisu: Fully convolutional densenets for semantic segmentation. In Proceedings of the 2017 IEEE Conference on Computer Vision and Pattern Recognition Workshops (CVPRW), Honolulu, HI, USA, 21–26 July 2017; IEEE: New York, NY, USA, 2017; pp. 1175–1183. [Google Scholar]
  40. Zhang, Z.; Yin, F.S.; Liu, J.; Wong, W.K.; Tan, N.M.; Lee, B.H.; Cheng, J.; Wong, T.Y. Origa-light: An online retinal fundus image database for glaucoma analysis and research. In Proceedings of the 2010 Annual International Conference of the IEEE Engineering in Medicine and Biology Society (EMBC), Buenos Aires, Argentina, 31 August–4 September 2010; IEEE: New York, NY, USA, 2010; pp. 3065–3068. [Google Scholar]
  41. Carmona, E.J.; Rincón, M.; García-Feijoó, J.; Martínez-de-la Casa, J.M. Identification of the optic nerve head with genetic algorithms. Artif. Intell. Med. 2008, 43, 243–259. [Google Scholar] [CrossRef] [PubMed]
  42. Sivaswamy, J.; Krishnadas, S.; Joshi, G.D.; Jain, M.; Tabish, A.U.S. Drishti-gs: Retinal image dataset for optic nerve head (onh) segmentation. In Proceedings of the 2014 IEEE 11th International Symposium on Biomedical Imaging (ISBI), Beijing, China, 29 April–2 May 2014; IEEE: New York, NY, USA, 2014; pp. 53–56. [Google Scholar]
  43. Fumero, F.; Alayón, S.; Sanchez, J.; Sigut, J.; Gonzalez-Hernandez, M. RIM-ONE: An open retinal image database for optic nerve evaluation. In Proceedings of the 2011 24th International Symposium on Computer-Based Medical Systems (CBMS), Bristol, UK, 27–30 June 2011; IEEE: New York, NY, USA, 2011; pp. 1–6. [Google Scholar]
  44. Huang, G.; Liu, Z.; Weinberger, K.Q.; van der Maaten, L. Densely connected convolutional networks. arXiv, 2016; arXiv:1608.06993. [Google Scholar]
  45. Hinton, G.; Srivastava, N.; Swersky, K. Lecture 6a Overview of Mini–Batch Gradient Descent. Coursera Lecture Slides. 2012. Available online: https://class.coursera.org/neuralnets-2012-001/lecture (accessed on 2 October 2017).
  46. He, K.; Zhang, X.; Ren, S.; Sun, J. Delving deep into rectifiers: Surpassing human-level performance on imagenet classification. In Proceedings of the IEEE International Conference on Computer Vision, Santiago, Chile, 7–13 December 2015; pp. 1026–1034. [Google Scholar]
  47. Mookiah, M.R.K.; Acharya, U.R.; Chua, C.K.; Min, L.C.; Ng, E.Y.K.; Mushrif, M.M.; Laude, A. Automated detection of optic disk in retinal fundus images using intuitionistic fuzzy histon segmentation. Proc. Inst. Mech. Eng. Part H J. Eng. Med. 2013, 227, 37–49. [Google Scholar] [CrossRef] [PubMed]
  48. Basit, A.; Fraz, M.M. Optic disc detection and boundary extraction in retinal images. Appl. Opt. 2015, 54, 3440–3447. [Google Scholar] [CrossRef] [PubMed]
  49. Wang, C.; Kaba, D. Level set segmentation of optic discs from retinal images. J. Med. Bioeng. 2015, 4, 213–220. [Google Scholar] [CrossRef]
  50. Hamednejad, G.; Pourghassem, H. Retinal optic disk segmentation and analysis in fundus images using DBSCAN clustering algorithm. In Proceedings of the 2016 23rd Iranian Conference on Biomedical Engineering and 2016 1st International Iranian Conference on Biomedical Engineering (ICBME), Tehran, Iran, 24–25 November 2016; IEEE: New York, NY, USA, 2016; pp. 122–127. [Google Scholar]
  51. Abdullah, M.; Fraz, M.M.; Barman, S.A. Localization and segmentation of optic disc in retinal images using circular Hough transform and grow-cut algorithm. PeerJ 2016, 4, e2003. [Google Scholar] [CrossRef] [PubMed]
  52. Zahoor, M.N.; Fraz, M.M. Fast optic disc segmentation in retina using polar transform. IEEE Access 2017, 5, 12293–12300. [Google Scholar] [CrossRef]
  53. Hatanaka, Y.; Nagahata, Y.; Muramatsu, C.; Okumura, S.; Ogohara, K.; Sawada, A.; Ishida, K.; Yamamoto, T.; Fujita, H. Improved automated optic cup segmentation based on detection of blood vessel bends in retinal fundus images. In Proceedings of the 2014 36th Annual International Conference of the IEEE Engineering in Medicine and Biology Society (EMBC), Chicago, IL, USA, 26–30 August 2014; IEEE: New York, NY, USA, 2014; pp. 126–129. [Google Scholar]
  54. Noor, N.; Khalid, N.; Ariff, N. Optic cup and disc color channel multi-thresholding segmentation. In Proceedings of the 2013 IEEE International Conference on Control System, Computing and Engineering (ICCSCE), Mindeb, Malaysia, 29 November–1 December 2013; IEEE: New York, NY, USA, 2013; pp. 530–534. [Google Scholar]
  55. Khalid, N.E.A.; Noor, N.M.; Ariff, N.M. Fuzzy c-means (FCM) for optic cup and disc segmentation with morphological operation. Procedia Comput. Sci. 2014, 42, 255–262. [Google Scholar] [CrossRef]
  56. Yin, F.; Liu, J.; Wong, D.W.; Tan, N.M.; Cheng, J.; Cheng, C.Y.; Tham, Y.C.; Wong, T.Y. Sector-based optic cup segmentation with intensity and blood vessel priors. In Proceedings of the 2012 Annual International Conference of the IEEE Engineering in Medicine and Biology Society (EMBC), San Diego, CA, USA, 28 August–1 September 2012; IEEE: New York, NY, USA, 2012; pp. 1454–1457. [Google Scholar]
  57. Yin, F.; Liu, J.; Wong, D.W.K.; Tan, N.M.; Cheung, C.; Baskaran, M.; Aung, T.; Wong, T.Y. Automated segmentation of optic disc and optic cup in fundus images for glaucoma diagnosis. In Proceedings of the 2012 25th International Symposium on Computer-based Medical Systems (CBMS), Rome, Italy, 20–22 June 2012; IEEE: New York, NY, USA, 2012; pp. 1–6. [Google Scholar]
  58. Nawaldgi, S.; Lalitha, Y. A Novel Combined Color Channel and ISNT Rule Based Automatic Glaucoma Detection from Color Fundus Images. Indian J. Sci. Technol. 2017, 10. [Google Scholar] [CrossRef]
  59. Oktoeberza, K.W.; Nugroho, H.A.; Adji, T.B. Optic disc segmentation based on red channel retinal fundus images. In Proceedings of the International Conference on Soft Computing, Intelligence Systems, and Information Technology, Bali, Indonesia, 11–14 March 2015; Springer: Berlin, Heidelberg, Germany, 2015; pp. 348–359. [Google Scholar]
  60. Al-Bander, B.; Al-Nuaimy, W.; Williams, B.M.; Zheng, Y. Multiscale sequential convolutional neural networks for simultaneous detection of fovea and optic disc. Biomed. Signal Process. Control 2018, 40, 91–101. [Google Scholar] [CrossRef]
Figure 1. An example fundus image showing the optic disc and cup with their boundary contours shown in blue.
Symmetry 10 00087 g001
Figure 2. Block diagram of the proposed optic disc and cup segmentation system. (a) Methodology and fully convolutional DenseNet architecture; (b) Dense Blocks (DB); (c) One layer in DB; (d) Transition Down block (TD); (e) Transition Up block (TU). The circle (C) refers to concatenation process. Note, red and blue represent the cropped rim and OC respectively in the segmentation.
Symmetry 10 00087 g002
Figure 3. Examples of joint OD-OC segmentation results. From the first row to the fifth row, the examples are from the Origa, DRIONS-DB, Drishti-GS, ONHSD, and RIM-ONE respectively. The green contour refers to the ground truth provided with the images while the blue one indicates the results of our proposed method. The DRIONS-DB and ONHSD show the contour of OD only because the ground truth for OC is not provided.
Symmetry 10 00087 g003
Table 1. Comparison with the existing methods in the literature for only OD segmentation on different datasets.
AuthorMethodOptic DiscDataset
DC(F)JC(O)AccSENSPC
Wong et al. [20]Support vector machine based classification mechanism-0.93980.99--SiMES
Yu et al. [14]Directional matched filtering and level sets-0.844---Messidor
Mookiah et al. [47]Attanassov intuitionistic fuzzy histon (A-IFSH) based method0.92-0.9340.91-Private
Giachetti et al. [6]Iteratively refined model based on contour search constrained by vessel density-0.861---MESSIDOR
Dashtbozorg et al. [7]Sliding band filter-0.8900, 0.8500---MESSIDOR, INSPIRE-AVR
Basit and Fraz [48]Morphological operations, smoothing filters, 3*and the marker controlled watershed transform-0.7096, 0.4561, 0.5469, 0.6188---Shifa, 3*CHASE-DB1, 3*DIARETDB1, DRIVE
Wang et al. [49]Level set method-0.8817, 0.8816, 0.8906-0.9258, 0.9324, 0.94650.9926, 0.9894, 0.9889DRIVE, DIARETDB1, DIARETDB0
Hamednejad et al. [50]DBSCAN clustering algorithm--0.78180.740.84DRIVE
Roychowdhury et al. [24]Region-based features and supervised classification-0.8067, 0.8022, 0.7761, 0.8082, 0.8373, 0.72860.991, 0.9963, 0.9956, 0.9914, 0.9956, 0.98540.878, 0.8815, 0.8660, 0.8962, 0.9043, 0.8380-DRIVE, DIARETDB1, DIARETDB0, CHASE-DB1, MESSIDOR, STARE
Girard et al. [26]Local K-means clustering-0.9---MESSIDOR
Akyol et al. [25]Keypoint detection, texture analysis, and visual dictionary--0.9438, 0.9500, 0.9000--DIARETDB1, DRIVE, ROC
Abdullah et al. [51]Circular Hough transform and grow-cut algorithm-0.7860, 0.8512, 0.8323, 0.8793, 0.8610---DRIVE, DIARETDB1, CHASE-DB1, MESSIDOR, Private
Hong Tan et al. [34]7-Layer CNN---0.87900.9927DRIVE
Zahoor et al. [52]Polar transform-0.8740, 0.8440, 0.7560---DIARETDB1, MESSIDOR, DRIVE
Sigut et al. [9]Contrast based circular approximation-0.8900---MESSIDOR
ProposedFully convolutional DenseNet0.96530.93340.99890.96090.9995ORIGA
Table 2. Comparison with the existing methods in the literature for only OC segmentation on different datasets.
AuthorMethodOptic CupDataset
DC(F)JC(O)AccSENSPC
Hatanaka et al. [53]Detection of blood vessel bends and features determined from the density gradient---0.62501Private
Almazroa et al. [8]Thresholding using type-II Fuzzy method--0.7610, 0.7240, 0.8150--Bin Rushed, Magrabi, MESSIDOR
ProposedFully convolutional DenseNet0.86590.76880.99850.91950.9991ORIGA
Table 3. Comparison with the existing methods in the literature for joint OC and OD segmentation on different datasets.
AuthorMethodOptic CupOptic DiscDataset
DC(F)JC(O)AccSENSPCDC(F)JC(O)AccSENSPC
Noor et al. [54]Colour multi-thresholding segmentation0.51-0.67250.34550.99950.59-0.70900.42001DRIVE
Khalid et al. [55]Fuzzy c-Means (FCM) and morphological operations--0.90260.80630.9989--0.9370.87640.9975DRIVE
ProposedFully convolutional DenseNet0.86590.76880.99850.91950.99910.96530.93340.99890.96090.9995ORIGA
Table 4. Results of the proposed method for OD and OC segmentation on Origa dataset compared with the existing methods in the literature. DL refers to deep learning based approach.
AuthorMethodOptic CupOptic Disc
DC(F)JC(O)DC(F)JC(O)
Yin et al. [56]Sector based and intensity with shape constraints0.83---
Yin et al. [57]Statistical model0.81--0.92
Xu et al. [22]Low-rank superpixel representation-0.744--
Tan et al. [23]multi-scale superpixel classification-0.752--
Fu et al. [35]multi-label deep learning and Polar transformation (DL)-0.77-0.929
ProposedFully convolutional DenseNet0.86590.76880.96530.9334
Table 5. The optic disc segmentation performance on the DRIONS-DB dataset considering different data processing schemes. The network is trained on the Origa dataset only.
ModelOptic Disc
DC(F)JC(O)AccSENSPC
Without0.628550.477150.984150.48430.99955
G0.81310.698250.990550.733550.99845
G+C0.90910.84030.994250.92320.9965
G+C+PP0.94150.89120.99660.92320.999
Table 6. The optic disc segmentation performance on the ONHSD dataset considering different data processing schemes. The network is trained on the Origa dataset only.
ModelOptic Disc
DC(F)JC(O)AccSENSPC
Without0.66710.52040.99350.56460.9988
G0.8780.79240.99690.94280.9975
G+C0.93920.88770.99860.93760.9993
G+C+PP0.95560.91550.9990.93760.9997
Table 7. The optic disc, cup, and rim segmentation performance on the Drishti-GS dataset considering different data processing schemes. The network is trained on the Origa dataset only.
ModelOptic CupOptic DiscRim
DC(F)JC(O)AccSENSPCDC(F)JC(O)AccSENSPCDC(F)JC(O)AccSENSPC
Without0.67650.53380.9910.58870.99890.7190.5770.9860.58180.99970.35830.23090.98640.28410.9965
G0.76460.62590.99330.66760.99940.8510.74870.99160.76950.9990.5090.35570.9870.50950.9939
G+C0.80450.67930.99390.74130.99860.92910.8710.99540.92680.99760.70330.56010.99120.79960.9938
G+C+PP0.82820.71130.99480.74130.99950.9490.90420.99690.92680.99920.71560.57430.99180.79960.9945
Table 8. The optic disc, cup, and rim segmentation performance on the RIM-ONE dataset considering different data processing schemes. The network is trained on the Origa dataset only.
ModelOptic CupOptic DiscRim
DC(F)JC(O)AccSENSPCDC(F)JC(O)AccSENSPCDC(F)JC(O)AccSENSPC
Without0.25840.16570.980.26880.98860.42040.28330.96290.29840.99240.18690.10880.97150.11660.9983
G0.50110.36270.98720.66350.99110.67990.53640.9780.59790.99460.39690.25780.97410.30410.9951
G+C0.60960.47090.98880.90520.99040.84550.74230.98640.8740.99150.71080.56660.98440.65910.9946
G+C+PP0.69030.55670.99280.90520.99440.90360.82890.99220.87370.99760.73410.59420.98630.65850.9966
Table 9. Results of the proposed method for OD and OC segmentation on Drishti-GS dataset compared with the existing methods in the literature. DL refers to deep learning based approach.
AuthorMethodOptic CupOptic Disc
DC(F)JC(O)AccDC(F)JC(O)Acc
Sedai et al. [27]Coupled shape regression model0.86--0.95--
Sevastopolsky [31]Modified U-Net CNN (DL)0.850.75----
Guo et al. [30]Large pixel patch based CNN (DL)0.93730.8775----
Nawaldgi et al. [58]Colour channel and ISNT rule--0.97--0.99
Zilly et al. [33]Ensemble learning based CNN (DL)0.8710.85-0.9730.914-
Oktoeberza et al. [59]Red channel information-----0.9454
ProposedFully convolutional DenseNet0.82820.71130.99480.9490.90420.9969
Table 10. Results of the proposed method for OD and OC segmentation on RIM-ONE dataset compared with the existing methods in the literature. DL refers to deep learning based approach.
AuthorMethodOptic CupOptic Disc
DC(F)JC(O)DC(F)JC(O)
Sevastopolsky [31]Modified U-Net CNN (DL)0.820.690.940.89
Shankaranarayana et al. [32]Fully convolutional and adversarial network (DL)0.940.7680.9770.897
Arnay et al. [18]Ant colony optimisation-0.757--
ProposedFully convolutional DenseNet0.69030.55670.90360.8289
Table 11. Results of the proposed method for OD segmentation on DRIONS-DB dataset compared with the existing methods in the literature. DL refers to deep learning based approach.
AuthorMethodOptic Disc
DC(F)JC(O)
Sevastopolsky [31]Modified U-Net CNN (DL)0.940.89
Abdullah et al. [51]Circular Hough transform and grow-cut-0.851
Zahoor et al. [52]Polar transform-0.886
ProposedFully convolutional DenseNet0.94150.8912
Table 12. Results of the proposed method for OD segmentation on ONHSD dataset compared with the existing methods in the literature.
AuthorMethodOptic Disc
DC(F)JC(O)Acc
Dashtbozorg et al. [7]Sliding band filter0.91730.83410.9968
Girard et al. [26]K-means clustering-0.84-
Abdullah et al. [51]Circular Hough transform and grow-cut-0.801-
Sigut et al. [9]Contrast based circular approximation-0.865-
ProposedFully convolutional DenseNet0.95560.91550.999

