Towards Generalized Noise-Level Dependent Crystallographic Symmetry Classifications of More or Less Periodic Crystal Patterns


Nano-Crystallography Group, Department of Physics, Portland State University, Portland, OR 97207-0751, USA
Symmetry 2018, 10(5), 133; https://doi.org/10.3390/sym10050133
Submission received: 29 January 2018
/
Revised: 6 April 2018
/
Accepted: 11 April 2018
/
Published: 25 April 2018
(This article belongs to the Special Issue Mathematical Crystallography)
Abstract
:Geometric Akaike Information Criteria (G-AICs) for generalized noise-level dependent crystallographic symmetry classifications of two-dimensional (2D) images that are more or less periodic in either two or one dimensions as well as Akaike weights for multi-model inferences and predictions are reviewed. Such novel classifications do not refer to a single crystallographic symmetry class exclusively in a qualitative and definitive way. Instead, they are quantitative, spread over a range of crystallographic symmetry classes, and provide opportunities for inferences from all classes (within the range) simultaneously. The novel classifications are based on information theory and depend only on information that has been extracted from the images themselves by means of maximal likelihood approaches so that these classifications are objective. This is in stark contrast to the common practice whereby arbitrarily set thresholds or null hypothesis tests are employed to force crystallographic symmetry classifications into apparently definitive/exclusive states, while the geometric feature extraction results on which they depend are never definitive in the presence of generalized noise, i.e. in all real-world applications. Thus, there is unnecessary subjectivity in the currently practiced ways of making crystallographic symmetry classifications, which can be overcome by the approach outlined in this review.
1. Introduction and Background
While there is a large variety of extraction algorithms for geometric features, such as point and translation symmetries from gray level patterns that are more or less periodic in two (2D) and one (1D) dimensions [1,2], related comments by Kenichi Kanatani [3] on symmetry as a continuous and hierarchic feature have been largely ignored for the last two decades by the computational symmetry and applied crystallography communities alike. The notable exceptions in this respect are the work by Yanxi Liu and coworkers [4,5,6] on 1D periodic time series in the form of subsequently recorded 2D images which were done more than a decade ago and much more recent work by the author of this review on objective 2D Bravais lattice type assignments to noisy images [7].
While the applied crystallography community typically speaks of ‘crystal patterns’ when it refers to atomically resolved images [8], more or less 2D and 1D periodic patterns where the individual pixels possess digitized intensity values (i.e. gray-levels rather than colors) are commonly referred to as ‘near regular textures’ within the computational symmetry community [1]. With the title of this review, it is, thus, implied that its main targets are fellow members of the applied crystallography community. This paper should, however, also be of interest to the computational symmetry community because the underlying mathematical and statistical frameworks are identical when images are considered as data planes from which geometric-structural information is to be extracted and classified, regardless of the instruments with which they were recorded.
For the computational symmetry community [1,2,4,5,6] and with regards to Kanatani’s associated developments in the robotics/computer vision fields [3,9,10,11,12], it is entirely natural to consider images as data planes. While this is largely because there are no microscopes and specifics of the underlying physics of the imaging process involved that may need modeling, modern microscopes are so good now that the data plane approach also works well in materials science and structural biology.
It should, therefore, not come as a surprise that this review follows the existing leads from the computational symmetry community but also goes beyond the current state of affairs in crystallographic symmetry classification schemes when multi-model inferences are discussed. The conclusion section of a recent review of the computational symmetry field states fittingly that “strategies … for handling real world complexity have to be developed to deal with … the issue of subgroup relations among symmetry groups, raised by Kanatani” [1]. The time seems indeed to be right for these kinds of developments and this paper reviews both the statistical foundation and the wider crystallographic implications of them. The latter is mainly done in appendices, which may be of limited interest to members of the computational symmetry community.
More or less 2D periodic Islamic building ornaments were assigned to plane symmetry groups in [2] on the basis of the careful elucidation of the approximate site symmetries of conspicuous parts of periodic motifs in direct space. These elucidations rely, however, critically on arbitrary thresholds and must, therefore, always be subjective. The final plane symmetry group assignment can in that kind of an approach never be objective.
Utilizing Kanatani’s approach [3,9,10,11,12], the authors of [2] could, in principle, transform their classifications into objective ones in spite of the multitude of irregularities/defects that their analyzed Islamic ornaments contain. When that was done, model selection uncertainties [13,14,15,16,17] would need to be addressed properly. A solution to the latter problem will be presented in this review in a qualitative way as well. Note that model selection uncertainties are not addressed in the work of Liu and coworkers [4,5,6] either.
The problems associated with the above-mentioned subjective [1,2] crystallographic symmetry classifications, Kanatani’s new statistical theory [3,9,10,11,12], and systematic ways of dealing with model selection uncertainties [13,14,15,16,17] became more relevant to the applied crystallography community with the recent emergence of both the crystalline ‘materials per design paradigm’ [18] and model-based approaches to the imaging of crystals and long-range ordered materials. Straton and co-workers [19,20] utilized, for example, the above-mentioned objective translation symmetry type classification scheme [7] for the detection and subsequent correction of double and multiple mini-tip artifacts in scanning tunneling microscope (STM) images of more or less 2D periodic arrays of molecules on a crystal surface by means of crystallographic image processing [21,22].
Independent of the type of microscope with which the data have been recorded, the purpose of crystallographic image processing is the extraction of geometric-structural information from noisy 2D periodic images. The translation and site/point symmetries in the hypothetical noise-free version of the image are taken advantage of as one averages over the asymmetric unit so that a better signal-to-noise ratio is obtained for the structure of interest. Note that the averaging over the asymmetric unit (rather than the translation periodic unit cell) ensures that better results are obtained than those achievable with traditional Fourier filtering [7]. This is because the multiplicity of the general position [23,24] boosts the number of entities over which one averages by a factor of up to 12.
The noisy 2D periodic image is considered to constitute a data plane and the models for the data at the foundation of crystallographic image processing are the 17 plane symmetry groups of 2D crystallography [23,24], which represent all possible combinations of translation and point/site symmetries in the Euclidean plane. Crystallographic image processing originated about 50 years ago within the structural biology community [25] and contributed under the name ‘crystallographic electron microscopy’ (monikers ‘Fourier or pseudo-kinematic electron microscopy’) to the award of the 1982 Nobel Prize in Chemistry to Sir Aaron Klug.
Another type of model-based imaging in atomic resolution microscopy [26,27,28,29,30] with a complementary foundation originated as a very promising approach to quantitative transmission electron microscopy (TEM) at the University of Antwerp (Belgium) at the beginning of the 21st century and led to the award of the 2017 Ernst Ruska Prize to Sandra Van Aert. The underlying procedures of that approach are analogous to single-crystal X-ray crystallography in so far as one distinguishes between the ‘solving’ of the structure and the ‘refinement’ of the resolved structure [26]. First, the structure is resolved by the imaging of individual projected atomic columns in a more or less 2D periodic array with a state-of-the-art TEM. This is followed by a maximal likelihood refinement of the position and chemical composition of the atomic columns in that array.
Since the number of atoms in projected columns can be determined with single-atom accuracy when an aberration corrected TEM is utilized for the model-based imaging [29,30], a tomographic enhancement, i.e. the combining of structural information that was obtained from several atomic resolution images in different projections, was not necessary for the determination of the 3D structure of nanocrystals for which the thickness did not vary widely from atomic column to atomic column. It is this author’s opinion that the aforementioned model-based atomic-resolution approach to quantitative TEM could benefit from both the complementary geometric Akaike Information Criterion (G-AIC) approach that is outlined below in general terms and crystallographic image processing.
A recent paper by Vasudevan and co-workers seems to be most suitable to illustrate the need for this review at the present time as it describes a geometric-structural feature extraction approach where a window is sliding over a noisy image of a transmitted crystal and the discrete Fourier transform (dFT) is calculated at consecutive window positions of that atomically-resolved image so that the locations of different crystal phases can be mapped in two dimensions [31]. The authors of that paper state that it would, in principle, be possible to derive the local crystallography, i.e. the Bravais lattice type and plane symmetry group, of different types of more or less 2D periodic entities on crystal surfaces or within crystalline matrices from the data that they recorded with their sliding dFT windows in a scanning transmission electron microscope (STEM), but also caution that this “would require substantial efforts at developing the appropriate image classification schemes” [31].
Crystallographic classification schemes for 2D periodic patterns have been in existence for over nine decades [32,33]; see [23] for an authoritative, brief and mathematically comprehensive modern description as well as [34] for a college-level textbook. The real problem that needs to be addressed in the above-mentioned context of the sliding dFT windows is, however, how to make crystallographic classifications objectively on the basis of results from some non-ideal algorithm and when only noisy data are available, as is the case in all real world applications.
The situation is analogous to what is encountered in the field of crystallographic 1D periodic classification schemes for gray-level patterns. The mathematical background of frieze symmetries and their projections from layer symmetries has been around for decades and is neatly summed up in an authoritative text [35], which follows the same outline as the comprehensive description of all plane symmetries of gray-level patterns [23,24] as projections from 3D space symmetries. The problem is again how to make classifications objectively on the basis of noisy experimental image data and without adding a subjective value judgment to arrive at one crystallographic symmetry class only.
More or less 1D periodic 2D images of crystalline materials, such as aberration-corrected STEM images of plane coincidence site lattice (CSL) grain boundaries in edge-on projections which are atomically resolved [36,37,38,39,40,41] are known to be underlain by both predictable [41] types of frieze symmetries and 3D atomic level bi-crystal structures [42,43,44,45,46]. There is, at present, however, no objective way to extract the parameters of grain boundary structures at the atomic level from such images. Subjectivity in the experimental determination of the very basic Σ value (CSL index) has, for example, been recently discussed in [47].
The core ideas of the crystallographic processing of noisy 2D images could be transferred to images that are periodic in 1D only as a first step towards the development of objective crystallographic symmetry classification schemes on the basis of Kanatani’s statistical theory [3,9,10,11,12] and systematic ways of dealing with model selection uncertainties [13,14,15,16,17]. This would be equivalent to the adaptation of the proposal of this review to 1D periodic cases. The atomistic model-based approach that was pioneered at the University of Antwerp [26,27,28,29,30] could also be brought to bear on the extraction of geometric-structural information from atomic resolution images of grain boundaries. Appendix A and [48,49] provide some more background on CSL (and approximate low-CSL index) grain boundaries in order to illustrate opportunities for 1D periodic symmetry classifications in that particular field.
As soon as suitable classification schemes have been demonstrated that work without any arbitrarily set thresholds, a robot could be programmed to classify input images automatically and sort them into crystallographic databases for more or less 2D or 1D periodic patterns objectively. It would then be up to the user of such databases to (subjectively) interpret the objectively-reported classification results. The author of this review presents here key aspects of his novel crystallographic symmetry classification scheme that is designed to work well in the presence of geometric-structural feature extraction uncertainties of the types that exist in more or less 2D and 1D periodic images.
Noise in the imaging process, as well as geometric-structural feature extraction uncertainties in the processing of an image with some real world (non-ideal) algorithm will necessarily break all pre-existing symmetries of a crystalline sample (or that a synthetic image may possess due to its design) so that there will only be non-genuine pseudo-symmetries left to be classified. The image is then, of necessity, only translation periodic to a larger or smaller extent so that none of the strict mathematically abstract restrictions of 2D [23,24] and 1D [35] crystallography are applicable anymore.
Further complications arise when there are genuine pseudo-symmetries [50] in the hypothetical noise-free version of a 2D or 1D periodic image. Geometric-structural feature extraction procedures can in the presence of noise not readily distinguish between non-genuine pseudo-symmetries that combine to form the underlying symmetry group structure of the hypothetical noise-free version of the image, on the one hand, and genuine pseudo-symmetries that exist in addition to this structure [50], on the other hand. Within this review, we will occasionally refer to non-genuine pseudo-symmetries as pseudo-symmetries of a different (or second) kind. Appendix B provides more information on different types of pseudo-symmetries.
Since instances of the latter kind of pseudo-symmetries may be mistaken for instances of the former kind, the wrong underlying symmetry group structure may be inferred so that subsequent crystallographic classifications would be in error. Vice versa, due to noise in the experiments, non-genuine pseudo-symmetries may be mistaken for genuine pseudo-symmetries so that crystallographic symmetry classifications result which underreport the factual existing symmetry when an extrapolation to a zero-noise level is made. Genuine pseudo-symmetries also play important roles in twinning and the formation of multiple domains in crystalline solids [51,52].
Mix-ups of genuine and non-genuine pseudo-symmetries that lead to symmetry classification problems in both inorganic crystal structures and molecule crystals (both small and large) in the presence of experimental noise are for the mainstream 3D crystallography case discussed in Appendix C and [53,54,55,56,57,58,59,60,61,62,63,64,65,66,67,68,69,70,71,72,73,74,75,76,77,78,79,80,81,82].
The three largest crystallographic databases for mainstream 3D crystallography results [83,84,85,86,87] are also briefly mentioned in Appendix C.1. Two of these databases are in open access [83,84,86,87]. Specifics of single-crystal X-ray protein crystallography are mentioned in [88] and [89]. A critical review of crystal structure determinations by means of single-crystal X-ray crystallography in general is provided in [90]. Standard statistical descriptions and the utility of contemporary null hypothesis tests in mainstream 3D single-crystal X-ray crystallography are discussed in Appendix D and [91,92,93,94,95,96,97,98,99,100].
On the basis of [101,102,103,104,105,106,107,108,109,110,111,112,113], Appendix C.3. presents this author’s assessment of the single-crystal X-ray crystallography structure study of a highly topical metal-organic framework (MOF) compound [101,102]. That compound is probably incorrectly classified in the major databases for that class of material [85,86,87] due to an unrecognized pseudo-symmetry arising from the co-existence of triple domains. The published crystal structure of that MOF [101] is most likely an over idealization and at the very least incomplete due to the deliberate removal of experimentally observed electron density during data processing [102]. The crystallographic analysis of a few low electron dose STEM images—see [109] or [110] for one of these images—of that structure (as mentioned briefly in Appendix C.3) proved to be crucial to this author’s arrival at this conclusion on that crystal structure’s validity [109].
In spite of all of the kinds of difficulties that are mentioned above, and because there is now an objective way for recognizing genuine pseudo-symmetries in the presence of noise as outlined below, it makes a great deal of sense to assign a set of approximate crystallographic symmetry classifications to a 2D image so that the models one is using for atomic or molecular resolution imaging are of comparatively small dimensionalities and allow for optimal geometric-structural information extraction processes in the presence of noise.
Any real world geometric feature extraction algorithm will with necessity introduce some small systematic error into geometric-structural feature extraction results so that none of the computer programs that implement such algorithms will ever deliver definitive results [9,10,114] (Kanatani’s dictum). Since there are no definitive feature extraction results, one should not attempt to classify these results into qualitatively exclusive (definitive) classes such as a single Bravais lattice type [7,23], Laue class [24], and plane symmetry group [23,24] in the 2D case but utilize Kanatani’s new statistics [9,10,11,12] instead.
This is because the traditional kinds of classifications imply that the extracted pseudo-symmetries adhere 100% (i.e. definitively) to the restrictions that are imposed by a mathematically-abstract crystallographic type, class, or group, which are all of a qualitatively strict nature per definition. Such an adherence can obviously not be genuine as there is noise in all image recording and processing steps in all real-world applications.
In spite of this, allegedly-definitive symmetry classifications are so far the common practice in both the computational symmetry and applied crystallography communities alike. They are, however, fundamentally unsound because all qualitative classifications will be in error insofar as they claim to be definitive; see Kanatani’s comments from 1997 in this context [3].
Fortunately, crystallographic symmetries are hierarchic and the majority of them are non-disjoint [7,23,24,35,114]. These features allow for a boot-strapping approach that does not require an initial estimate of the generalized noise level in a more or less 2D or 1D periodic image.
By means of pair-wise comparison of non-disjoint models with Kanatani’s G-AIC [9,10,11,12], one first obtains the model that minimizes the expected Kullback-Leibler information loss [13,14,15,16,17] within a set of models that represents a stretch of a symmetry hierarchy branch and later determines for this particular model the generalized noise level. When this has been achieved, one can calculate the relative likelihood that a model in a set of non-disjoint (or disjoint) models minimizes the expected Kullback-Leibler information loss and formulate so-called Akaike weights as conditional model probabilities that add up to 100% for the whole set [13,14,15,16,17].
Instead of a definitive classification that makes a 100% assignment to only one class, which cannot be guaranteed to be correct due to the unavoidable presence of experimental noise and feature extraction uncertainties that are due to the utilized algorithm as discussed above, one obtains by this route a fuzzy classification that is spread over several classes of non-disjoint models within one symmetry hierarchy branch. One may also end up with a fuzzy classification that is spread over several classes of both non-disjoint and disjoint models if there is a genuine pseudo-symmetry [50] in the data plane.
The derived percentages of the adherences to the individual classes of models within (and outside of) a symmetry hierarchy branch will be specific to the noise level of the image to be classified and also very slightly specific to the algorithm with which the classification has been made. The effects of experimental noise and the utilized real world algorithm are summarized in a generalized noise level term. Reduced generalized noise levels of future image data from the same crystalline sample that are recorded with more sophisticated instruments and processed with more ‘truthful’ feature extraction algorithms will have a tendency to change the individual percentages somewhat, but will also never allow for definitive classifications. Additionally a reduction in the experimental noise level per unit cell can be obtained by the processing of a significantly larger image area that contains many more repeats of the 2D or 1D periodic motif.
Major goals of this review are to bring Kanatani’s comments [3] and dictum [9,10,114], as well as his G-AIC approach [9,10,11,12] to the attention of both the applied crystallography and the computational symmetry communities. The utilization of the information theory concept of (i) Akaike weights [13,14,15,16,17] and (ii) their products [13] for complementing geometric-structural pieces of information (that were extracted from the results of the same imaging experiment or from the same synthetic data) for generalized noise-level dependent crystallographic classifications of more or less periodic crystal patterns constitute the novel ideas of this paper. This review will concentrate on crystal patterns in the form of 2D gray-level images that are more or less periodic in one and two dimensions.
Secondary goals of this review are popularizations of a Fourier space version of Liu’s G-AIC for the assignments of plane symmetry groups to more or less 2D periodic images [4,5] and the author’s versions of such criteria for Bravais lattice type [7] and Laue class assignments to such images. The combination of G-AICs for Bravais lattice types, Laue classes, and plane symmetry groups should be useful to deal with the consequences of genuine pseudo-symmetries [50] that the hypothetical noise-free version of an image may possesses, either per design or by the nature of the crystalline sample from which it was recorded.
The rest of the paper is organized as follows: We begin with explaining the nature of Kanatani’s comments on symmetry as a continuous and hierarchic feature in Section 2. This is followed by a discussion of Kanatani’s dictum in Section 3. Within that section, we will concern ourselves with genuine pseudo-symmetries [50]—see Figure 1—which exist per the design of both of the constituting images and quote the related lattice parameter extraction results (for these two images) by three different algorithms/computer programs from [114]. The purpose of that part of this review is to illustrate the non-definitiveness of geometric-structural feature extraction results that are obtained by any real-world algorithm from noise-free and noisy images alike.
Readers interested in the details of the three computer programs that implement these algorithms are referred to [114] for comprehensive information. Two of these programs [115,116] are used in the applied crystallography community and the third [117] one supports all aspects of crystallographic image processing and electron crystallography on the basis of high-resolution (phase-contrast) transmission electron microscope (HRTEM) images [118,119,120,121] that were recorded within the validity range of the weak phase object (WPO) approximation. While one of these programs [115], and most algorithms of the computational symmetry community [1] work in direct space, the other two programs [116,117] that were utilized in [114] work in Fourier/reciprocal space.
For easy references below, we will use the capital letters A, B, and C instead of either the actual names of these three computer programs or their entries in the final list of references at the end of this review. Table 1 provides the conversion key.
The fourth section on G-AICs reviews first the general form of these criteria and then proceeds by giving specifics of Fourier space versions of such criteria for fuzzy, i.e. quantitative generalized noise-level dependent classifications of geometric-structural feature extraction results into plane symmetry groups, Laue classes, and Bravais lattice types. Liu and her co-workers’ frieze pattern assignments to time series recording of both a walking humanoid avatar and a walking human being [4,5,6] will be mentioned in this section briefly (and discussed further in Appendix E) as illustrations of the fact that one should not only report the most likely crystallographic symmetry classification for a real-world experiment, but also its relative likelihood, as well as the likelihoods of reasonable alternatives in order to make a fair assessment of the crystallographic model selection uncertainty [13,14,15,16,17].
In the fifth section, we will provide equations for the relative likelihoods of disjoint and non-disjoint crystallographic symmetry models within a set, their respective mutual evidence ratios, and their Akaike weights. There are also equations for the usage of Akaike weights for multi-model predictions that are based on the relative probabilities of crystallographic symmetry models within a set. Section 5.1 contains the equations for combined posterior model probabilities [13] that are based on complementing pieces of geometric-structural information in more or less 2D periodic (noisy) images. The corresponding combined Akaike weights should be helpful for distinguishing between genuine and non-genuine pseudo-symmetries [50] that the hypothetical noise-free version of an image processes.
The fourth and fifth sections constitute the core of this review and contain the equations/inequalities that refine its novel ideas. Finally, there is a brief summary and conclusions section.
As already mentioned above, there are five appendices that present: (i) the potential of the main proposal of this review with respect of the extraction of grain boundary structures from atomic resolution images that are more or less periodic in 1D; (ii) different types of pseudo-symmetries; (iii) pseudo-symmetry mediated misclassifications in both the scientific literature and the major databases of mainstream 3D crystallography as well as a brief discussion of the crystallographic R value; (iv) statistical descriptors and null hypothesis tests in mainstream 3D crystallography; and (v) crystallographic comments on the only so far existing experimental 1D periodic study that utilized a geometric Akaike Information Criterion.
2. Kanatani’s Comments on Symmetry as a Continuous and Hierarchic Feature
At the core of Kanatani’s comments is the observation that symmetries must, with geometric necessity, be part of disjoint and non-disjoint hierarchy branches. This applies obviously to both crystallographic and non-crystallographic symmetries alike, although no such distinctions were made in [3], as a few non-disjoint and disjoint point symmetries were discussed exclusively.
Since hierarchy branches do exist, crystallographic symmetry types, classes, and groups are quite often non-disjoint. For example, a hexagonal rhombus (with an angle of 120° between its two edges of equal length) is higher up in the symmetry hierarchy than a general rhombus (where this angle is neither 120° nor 90°). The general rhombus, on the other hand, is higher up in the hierarchy than a parallelogram, where the two edges have different lengths and the angle is not 90°.
The square and hexagonal rhombi are, however, disjoint as they are at the top of different hierarchy branches of the quadrilaterals that serve as crystallographic unit cells [7,114]. Analogously, the rectangle and the general rhombus are disjoint as they are part of different hierarchy branches.
Kanatani illustrates in [3] that a consequence of these kinds of hierarchies is that one can never assign extracted geometric-structural features in an objective way to a more constrained symmetry type on the basis of a distance measure alone.
3. Kanatani’s Dictum
A direct quote from [9,10] is in order here to start this section: “The reason why there exist so many feature extraction algorithms, none of them being definitive, is that they are aiming at an intrinsically impossible task.” While this statement might be somewhat shocking to researchers who never before thought about this topic deeply, it is certainly true. No real world feature extraction algorithm working on real world data will ever be able to deliver definitive results. This is because all algorithms (and the computer programs that implement them) are based on heuristics and use approximations, as well as internal thresholds, to achieve their goals. Additionally, all real world image data are of finite resolution and noisy.
As mentioned above, a thorough illustration of Kanatani’s dictum within a crystallographic context is provided in [114]. We take from that paper the lattice parameter extraction results of the two images that are shown in Figure 1 but present them here in a form that is adjusted to the crystallographic setting that we use in this review.
The two images in Figure 1 are synthetic and freely downloadable (together with many more images of the same size and type) at the website that is listed as [122]. On the left hand side of this figure, there is the noise-free (original) image of the pair. The image on the right hand side of this figure has been obtained by adding independent Gaussian noise of mean zero and a standard deviation of 10% of the maximal image intensity to the individual pixels of the noise-free image to the left. The images in Figure 1 possess a rectangular (primitive) Bravais lattice and plane symmetry group pm in the crystallographic p1m1 setting [23,24] per design. One choice of a unit cell is outlined in Figure 1a by a rectangle in yellow ink. Other choices are possible because the origin is in this particular plane symmetry group not fixed at a specific point.
Per crystallographic convention [23,24], the x-axis ([10] vector) runs from the top-left corner of a unit cell to its bottom left corner (in the p1m1 setting). The y-axis ([01] vector) is perpendicular to the x-axis and runs from left to right. The unit cell edges x,0 = and 0,y = are in Figure 1 parallel to the image edges X,Y. The edge relationships between unit cells and images are usually arbitrary, i.e. not subject to any crystallographic restriction, so that Figure 1 shows a very special case of such a relationship.
Per crystallographic convention [23,24], the origin of each unit cell in plane symmetry group p1m1 (pm for short when the setting is not communicated), i.e. the position 0,0 from where all other positions are measured in fractions of the unit translation vectors, is located anywhere on a mirror line of position 0,y. Two possible choices of unit cells for Figure 1a that take the prevailing pseudo-symmetries of the Fedorov type [123] into account are given in Figure 2, where just one magnified single unit cell cutout is displayed both on the left- and right-hand sides of this figure. Pseudo-symmetries of the Fedorov type are compatible with a crystallographic lattice that is of the Bravais type. That lattice is not necessarily the prevailing (genuine) crystallographic lattice; see Appendix B for more information.
As Figure 2a shows, there is always a second mirror line at position ½,y in the unit cell in plane symmetry group p1m1. This mirror line and the 0,y (and 1,y) mirror line(s) are displayed by full yellow lines in both parts of Figure 2. The coordinate y varies from 0 to 1 in the 0,y and ½,y labels of sets of special points, which carry Wyckoff letters a and b, respectively [23,24]. The points y = 0 and y = 1 are symmetry equivalent by way of one unit translation along the y-axis. The genuine translation symmetry in all subfigures of Figure 1 and Figure 2 is that of the rectangular (primitive) Bravais lattice type per design.
As far as genuine point/site symmetries are concerned, the full (four letter) plane symmetry group symbol (p1m1) details that there are only one-fold rotation points in the plane of the image, mirror lines perpendicular to the [10] direction of the unit cell, and one-fold rotation points along its [01] direction; see Figure 1a and Figure 2a. Sets of mirror lines are in crystallography represented by their geometric normal, which are, in Figure 1a and Figure 2a oriented perpendicular to the vector [10] = due to the p1m1 setting.
The ½,y mirror line (which carries Wyckoff letter b in p1m1 [23,24]) splits the three white blobs of the translation periodic motif (and their immediate black surroundings) in Figure 1a and Figure 2a into upper and lower halves. While this line is not drawn out in Figure 1a, it is given as a full yellow line in Figure 2a. The multiplicity of points that are located on that mirror line is one. All of these points are, therefore, at a special position in this plane symmetry group. The general position, on the other hand, possesses a multiplicity of two so that there is a symmetry equivalent position for each x,y position. Both of these positions carry Wyckoff letter c in plane symmetry group p1m1. The asymmetric unit is just one half of the unit cell as sectioned by the ½,y mirror line; see Figure 2a. The alternative asymmetric unit in Figure 2b is composed of one half each of the two less intense white blobs plus two quarters of the most intense white blob and their immediate black surroundings.
Genuine motif-based (four-fold rotation points plus vertical mirror lines) pseudo-symmetry is also present in both images of Figure 1 and Figure 2. This pseudo-symmetry is of the Fedorov type [123]—see Appendix B—and complicates the crystallographic analysis and symmetry classification. The complications are particularly severe in Figure 1b due to the added noise. Genuine translational pseudo-symmetry is caused by the similarity in intensity and size of the three white blobs that form (together with their immediate black surroundings) the content of the rectangular unit cell in Figure 2a.
While the 0,y and ½,y mirror lines in this figure are genuine and intersect the white blobs horizontally, there are also x,0, x,1/3, and x,2/3 pseudo-mirror lines that intersect the while blobs vertically. In order to avoid overcrowding, these pseudo-mirrors are only given as dotted yellow lines in Figure 2b.
These three pseudo-mirror lines generate three more parallel pseudo-mirror lines at positions x,1/6, x,3/6, and x,5/6 , which intersect the black background areas between the white blobs in the middle vertically. The above-mentioned genuine mirror lines 0,y and ½,y (of Figure 1a and Figure 2a) combine with the perpendicular pseudo-mirror lines as drawn into Figure 2b. This generates pseudo-four-fold and pseudo-two-fold rotation points at the crossings of genuine mirror lines and pseudo-mirror lines so that Fedorov pseudosymmetry group pb/34mm ⊃ p1m1 results on the basis of the rectangular Bravais lattice. The pseudo-four-fold rotation points contain in themselves pseudo-two-fold rotation points. There are alternatives to construct the Fedorov pseudosymmetry group that Figure 1a and Figure 2a,b possess, but they all lead to the same end result.
With respect to Figure 1a, the origins of the two unit cells in Figure 2 are shifted to the position of a four-fold pseudo-rotation point. There are two such points in pseudo-symmetry group pb/34mm, which carry pseudo-Wyckoff letters a and b, and their locations with respect to the pseudo-square lattice are 0,0 and ½,½, respectively. As a result of the combination of the genuine symmetries and pseudo-symmetries in Figure 1a, the genuine rectangular lattice of Figure 1a and Figure 2a is “truncated” into a pseudo-square lattice as outlined in Figure 2b.
Due to its design history, the image in Figure 1b possesses also plane symmetry pm (in the p11m setting) but all genuine (point/site and translation) symmetries have been turned into non-genuine (second kind) pseudo-symmetries—see Appendix B—by the added noise. These pseudo-symmetries exist in addition to the above-mentioned genuine pseudo-symmetries. A complementary description of the two images in Figure 1 is provided in [114]. Note that a complementary setting has been used in that paper, but this is inconsequential to a crystallographic analysis. The results of any such analyses will be complementary, e.g., a unit cell angle in one setting would be the difference between 180° and that angle in another setting.
Note that Kanatani includes, per definition, all kinds of image feature extraction uncertainties into the generalized noise term in his G-AICs so that one cannot extract definitive results even from the image in Figure 1a, which is free of added Gaussian noise. In this review, noise is treated in the generalized sense that is in accord with Kanatani’s dictum [9,10].
As already mentioned above, the main thrust of [114] was to illustrate Kanatani’s dictum on multiple examples. Since three algorithms/computer programs were applied to a total of 12 images in [114], a measure of the reliability of subsequent geometric inferences on the basis of the outputs of the computer programs that implemented these algorithms was also obtained. Additionally, since the three algorithms were tested on both noise-free images (such as the one shown in Figure 1a) and noisy images that were derived from the noise-free images (such as the one in Figure 1b), the robustness of the algorithms/computer programs in the presence of Gaussian noise was also tested in [114].
The ratio of the lattice parameters (a/b) of the unit cells in the two images in Figure 1 and Figure 2 is one third and the unit cell angle γ is 90° per design. Values close to this ratio and angle should, therefore, be obtained as result of lattice parameter extractions with suitable computer programs even in the presence of noise.
Table 2, Table 3, Table 4 and Table 5 list the results of the application of the three different computer programs [114] of Table 1 as adapted to the particular unit cell setting of this review (Figure 2). Results that were obtained in the default settings of the three computer programs that implement three different types of algorithms (A to C in Table 1) are listed for the image in Figure 1a in Table 2 and for the image in Figure 1b in Table 4. Table 3 list re-interpreted/re-calculated results from Algorithm B (on the basis of the displayed dFT amplitude map) and results that were obtained in a non-default setting of Algorithm C for the image in Figure 1a. Table 5 does the same kind of thing for the image in Figure 1b.
Somewhat surprisingly, Table 2 shows that only one of the three tested algorithms extracted qualitatively correct lattice parameters from the noise-free, but visibly pseudo-symmetric, image in Figure 1a. These lattice parameters are in good compliance with the rectangular Bravais lattice type that this image possesses per design. For easy reference, qualitatively-correct results are marked in bold font in all of the four image data tables in this review.
Only Algorithm A was, thus, capable of dealing with the translational pseudo-symmetry in Figure 1a effectively as its lattice parameter extraction results are given in bold font in Table 2. The other two algorithms extracted in their default settings a unit cell that is too small by a factor of three from this figure. This is also reflected by the ratio of the two basis vectors, which was incorrectly determined as nearly unity by Algorithms B and C in their respective default settings [114].
Extracted basis vectors that nearly possess the same magnitude, and are also perpendicular to each other within error bars, are, of course, what one would expect for a square Bravais lattice. In other words, to the Algorithms B and C in their default settings, the existing (genuine) translational pseudo-symmetry [50] in Figure 1a was apparently a crystallographic symmetry since ‘quantitatively wrong’ lattice parameter sets were extracted.
It was straightforward to re-interpret/re-calculate the lattice parameter extraction output for Figure 1a as obtained with Algorithm B on the basis of the dFT amplitude map that the program displayed [114]. This resulted in a bold font entry for qualitative correctness in Table 3 for Algorithm B. For Algorithm C, using a non-default setting in the processing of Figure 1a also resulted in a bold font entry in this table.
The added noise in Figure 1b ‘fooled’ all three computer programs (in their default settings) into extracting results that are obviously incorrect, see Table 4. This is a direct consequence of the noise-exacerbated pseudo-symmetries in the image shown in Figure 1b. The oblique unit cell that Algorithm A extracted from the image in Figure 1b—see Table 4—can be straightforwardly transformed into a pseudo-square unit cell with essentially the same parameters as those that were obtained with the other two algorithms.
Re-interpreting/re-calculating the lattice parameter extraction outputs for the image in Figure 1b as obtained with Algorithm B (on the basis of the dFT amplitude map of that image) and using a non-default setting of Algorithm C in the processing of this image led to qualitatively correct results and bold font entries for both algorithms in Table 5.
The stated error bars on the unit cell angles of 0.05° for the two algorithms/computer programs that extract lattice parameters in Fourier space, i.e. B and C, are based on the implied number of significant figures output by one of these programs [114], but seem to be too small to allow for agreement of the extraction results of the different algorithms in the case of lattice parameter extractions by the default program settings from the noisy image in Figure 1b.
The traditional way of assigning Bravais lattice types to the lattice parameters of the two images in Figure 1 that have been extracted by three different algorithms within the stated error bars as listed in Table 2, Table 3, Table 4 and Table 5 may, obviously, lead to misclassifications given the numerical variations in these tables. If one does not know the design parameters and history of the two images in Figure 1 in advance, one is hard pressed to figure out which of the results in these four tables are actually trustworthy, let alone to make definitive classifications into Bravais lattice types. One would certainly be ill advised to average the results from the three different algorithms in Table 2 and Table 4.
Guided by the ‘somewhat squarish’ visual appearance of what appears to be unit cells in the image of Figure 1b, most researchers would probably classify that image as belonging to the square Bravais lattice type. Two of the results listed in Table 4 would support this classification in the traditional way based on the numerical values of the extracted lattice parameters and their somewhat extended error bars. This would, however, be incorrect!
A fuzzy classification into Bravais lattice types on the basis of translation symmetry model probabilities (Akaike weights) would, on the other hand, be noise-level dependent and correct in a fundamental sense. Likewise fuzzy classifications into (i) Laue classes on the basis of point/site symmetry model probabilities and (ii) plane symmetry groups on the basis of plane symmetry model probabilities, both utilizing complementing types of Akaike weights, would also be correct in a fundamental sense and generalized-noise level dependent.
The crystallographic symmetry classifications of the image in Figure 1a would obviously be much less fuzzy than those of the image in Figure 1b, although still not completely definitive as a matter of principle when a real world algorithm is involved. It is expected that the crystallographic classifications of both images would peak for plane symmetry group pm, Laue class 2mm, and the rectangular (primitive) Bravais lattice type. This is because these crystallographic categories went into the design of both images.
In case of the image in Figure 1a, the peaking at these crystallographic categories will be much sharper than for the image in Figure 1b because only geometric-structural feature extraction uncertainties that are due to the particulars of the applied algorithms/computer programs will make the classifications of the former image fuzzy (as there is no added Gaussian noise present that disturbs the recognition of the design categories).
4. Geometric Akaike Information Criteria (G-AICs)
4.1. General Considerations
All G-AICs transfer the central idea of the very widely employed Akaike Information Criterion (AIC) [124,125] of traditional statistics, which is based on the asymptotic limit of an infinite number of observations, to Kanatani’s new type of statistics where a vanishing noise level serves as the asymptotic variable and where there is typically only one observation/image [9,10,11,12].
The following direct quote from Hirotugu Akaike’s original paper [124]: “AIC = (−2) log (maximum likelihood) + 2 (number of independently adjusted parameters within the model)” illustrates that the ‘accuracy’ of a model which constitutes the first term (and is obtained from a maximal likelihood estimation of the model’s parameters) is balanced by the ‘complexity’ of the model (by means of a penalty for having a certain number of free parameters available for the fitting of the model to the data), which constitutes the second term. The ‘log’ in this quote refers to a logarithm to the basis of Euler’s number, i.e. is typically referred to as ‘ln’ outside of the statistics community.
More precisely, the negative log-likelihood score of a model is a measure of the lack of its fit to the data. It forms the first term in an AIC. The second term of an AIC is simply a penalty for greater model complexity, i.e. represents a bias correction. When two frequency-based models for the same data are compared with respect to their predictive power, the model that possesses the smaller AIC value is considered to be the better one.
Traditional AICs, as stated above, and versions of them that account for unfavorable ratios between the number of observation and the number of model parameters are very widely used in countless branches of science and engineering [13,14,15,16,17]. Information criteria that are either derived from Akaike’s AIC or are based on traditional (frequentist) statistics alternatives to this criterion are also at the core of the quantitative model-based atomic resolution TEM approach [27] that was mentioned in the Introduction and Background section.
Akaike referred to his criterion simply as “an information criterion” [124]. The acronym MAICE, which stands for “minimum information theoretic criterion (AIC) estimate”, was also introduced by him. Akaike wrote in 1974 that “the need of the subjective judgment required in the hypothesis testing procedure … is completely eliminated” by the utilization of MAICEs because “the problem of statistical identification is explicitly formulated as a problem of estimation” [124].
As already mentioned above, geometric AICs contain two terms that are analogous to the two terms in the traditional (frequentist) AIC. The particulars of the form of the second term depend on the types of geometric models in a set, from which the one that minimizes the G-AIC value is to be selected as the best model for representing the image data information.
For the practical application of a G-AIC, noise in images must be (to a sufficient approximation) of the ‘white’ Gaussian type and systematic errors in the imaging and algorithmic processing procedures must be small in comparison to random errors. Since G-AICs are first-order approximations, the generalized noise level must be reasonably small. All these preconditions are fulfilled by image recordings with certain modern scientific instruments, where the extraction of model parameters from the recorded data planes proceeds, to a large extent, independently of the particulars and type of the instruments, e.g., STMs, STEMs, …, HRTEMs (in the WPO approximation) as mentioned in the Introduction and Background section, with which image data has been recorded [7,19,20,21,22,26,27,28,29,30,31,115,116,117,118,119,120,121].
With ‘independent to a large extent’, this author means that specifics of the point-spread function of a microscope should be included when better results are required. Approximate results are to be expected when these specifics are ignored. Similarly, the real structure of crystalline samples could either be included for better results or ignored for approximate results.
By virtue of the central limit theorem of frequentist statistics, the white/Gaussian noise requirement of G-AICs can often be considered as fulfilled when there are several different types of noise in a microscopic imaging process [26]. Different types of noise will originate from different sources, but none of these sources are allowed to be dominant for this theorem to be valid.
As a very notable difference to the AIC of traditional statistics, noise is not a model parameter in Kanatani’s G-AIC. Vanishing noise is instead the asymptotic limit in this new kind of statistics in a way similar to the number of observations going to infinity in frequentist statistics. The requirement of Gaussian noise results in maximal likelihood determination procedures of the model parameters that take on the form of least squares fits of the models to the data in G-AICs. Additionally, the number of data points and the dimension of the model enter the penalty term of the equation of the G-AIC, while their counterparts are absent in the equation for the traditional AIC.
When the experimental noise in a more or less 2D periodic image is of the Gaussian type, the standard deviations of the mean values of the intensity of corresponding pixels in repeating unit cells decrease with the square root of the number of repeats. This allows for more precise estimates of the mean values of the intensity of the group of individual pixels that collectively form the 2D periodic unit cell. Loosely speaking, this is analogous to a reduction of the noise level per unit cell. The disturbing effects of the 10% Gaussian noise in the image in Figure 1b are thereby reduced to less than 1% per unit cell.
4.2. G-AIC for Plane and Frieze Symmetry Groups
Liu and coworkers state in [4] (and in the appendix of the earlier version of their paper [5]) that the dimension of their data space is 1 and the dimension of their model space is 0, so that a co-dimension of 1 results. Simple algebra leads to the following ratio of the least-square residual, J, of a more symmetric model, Smore, to the least-squares residual of a less symmetric (more general) model (Sless) that is non-disjoint:
The fulfillment of this inequality allows one to conclude that the (non-disjoint) more symmetric model is the one of the two models that minimizes the expected Kullback-Leibler information loss when one deals with the unit cell content. The variable k is thereby the so called multiplicity of the general position of a plane [23,24] or frieze [35] symmetry group. In the language of 1D and 2D crystallography, the non-disjoint relations of set theory are referred to as maximal non-isomorphic translationengleiche and klassengleiche type IIa subgroup-supergroup relationships, as exhaustively tabulated in [35] and [23,24].
Note that although the least squares residual of the more general (less symmetric) model will typically be smaller than its counterpart for the less general (more symmetric) model or, at most, equal to it, Inequality (1) still allows for the selection of the more symmetric model if its residual is not too large. This is because the model accuracy is balanced in the G-AIC by a penalty term that includes both the higher multiplicity of the general position of the more symmetric model and the lower multiplicity of the general position of the less symmetric model.
There was only one application of Inequality (1) to the identification of most likely frieze symmetry groups [4,5] so far in the scientific literature and none to the identification of most likely plane symmetry groups of which the author of this review is aware. This state of affairs might be due to the necessary computational effort for obtaining the residuals in direct space as the sums of all squared differences of pixel intensities between the raw image and its symmetrized versions [4,5]. Additionally, there is the non-trivial issue of aligning the raw image and its symmetrized versions in direct space; see Appendix E for possible consequences of misalignments and ignorance of the crystallographic origin conventions [23,24,35].
There is, however, a straightforward way to overcome both of these problems in Fourier space that goes by the name of crystallographic image processing [21,22,25]. Origin alignments are actually straightforward in reciprocal space and part of the crystallographic image processing procedures.
Since the intensity values of all pixels contribute to all Fourier coefficients (FCs), the sums of the squared differences of the complex FCs of the raw image and its symmetrized versions can be calculated in Fourier space and be substituted into Inequality (1) for the real space residuals. The complex FCs residuals enter Inequality (1) without modification of its right-hand side because one may substitute the multiplicity of the general position in direct space for the number of symmetry operators of a plane symmetry group. This number is the same in both direct [23,24] and reciprocal/Fourier space [126]. The Fourier space approach to the interpretation of Inequality (1) is enabled by the Fourier coefficient model residuals that approximate [127,128,129,130,131,132,133,134] the direct space least-squares model fitting residuals reasonably well.
While a more or less 2D periodic square image with an edge length of 512 pixels possesses 262,144 individual pixels, there may be less than a hundred FCs to represent all of the information that is contained in it in Fourier space. A large reduction in the computational effort will, therefore, result when one works in Fourier space for the determination of the ratios of the least-squares residuals in Inequality (1).
The precondition for going into Fourier space is from this author’s experience that there are at least some 50—or better yet more than 100—unit cell repeats in the image in order to keep series truncation artifacts and edge effects small. Inequality (1) implies the presence of an integral number of unit cells in the more or less 2D periodic image. Artifacts due to incomplete unit cells and the multiplicities of special positions [23,24,35] should become negligible when the pixels within a unit cell are numerous and there are many repeats of the more or less translation periodic motif in the image.
4.3. G-AIC for 2D Laue Classes
The Laue class of a more or less 2D periodic image is visibly displayed in the amplitude map of its dFT. As a matter of fact, the FC amplitudes are laid out in such a map as discrete values at the positions of the nodes of the reciprocal lattice of the image.
One can, therefore, use Inequality (1) as well when one bases the residuals on the sums of the squared differences between the dFT amplitudes of the raw image and the dFT amplitudes of its symmetrized versions. Crystallographic image processing [21,22] provides, again, the means to obtain the residuals in a computationally efficient manner. The same kinds of considerations of the number of pixels in the image and the number of repeating noisy unit cells in direct space apply as in the previous section.
There are six Laue classes in 2D in both direct and reciprocal/Fourier space. In the latter space, the Laue symmetry classes are defined with respect to the central 0,0 FC amplitude peak in a dFT.
When the Laue class is, for example, assigned to the image in Figure 1a by means of a G-AIC, one will for sure obtain the highest model probability for class 2mm. This is because the plane symmetry of that noise-free image is per design pm, which is ‘mathematically linked’ to Laue class 2mm. The visible four-fold rotation points plus mirror lines (motif-based) pseudo-symmetry in this figure will then be revealed as such.
Plane symmetry pm is of the non-centrosymmetric type [23,24], which means the phase angles of the FCs of the image intensity are not all restricted to be either 0° or 180°. This fact should come in handy when one is trying to deal with the noise-exacerbated pseudo-symmetries in the image in Figure 1b. The associated Akaike weight products of joint fuzzy assignments to Bravais lattice types, Laue classes, and plane symmetry groups (on the basis of the applicable G-AICs) should be able to reveal the pseudo-symmetries also for this image.
One should, therefore, at least for manifestly pseudo-symmetric images, strive for combinations of G-AICs and Akaike weight products in order to make the best use of the available types of complementing geometric-structural information in more or less 2D periodic images.
4.4. G-AIC for 2D Bravais Lattice Types
The author of this review derived the G-AIC for Bravais lattice type assignments to lattice parameters that were extracted from more or less 2D periodic images [7]. For identifying the (non-disjoint) higher symmetric translation symmetry model that minimizes the expected Kullback-Leibler information loss, the following inequality:
suffices, where L is the number of constraints on a quadrilateral that serves as the shape of a crystallographic unit cell. The fulfillment of this inequality means that the more symmetric translation symmetry model is, on information theory grounds, to be preferred over the less-symmetric translation symmetry model. Table 6 lists these numbers for easy reference.
4.5. When is a Noise Level Estimate Mandatory?
There is obviously no need to make an estimate of the generalized noise level of a more or less 2D periodic image in order to use Inequalities (1) and (2). This is due to our dealing with non-disjoint models in these cases, i.e. with models within a crystallographic symmetry hierarchy branch. One can, for the comparison of a pair of such models, as implicitly stated in Inequalities (1) and (2), eliminate the need to know the noise level by algebraic means.
As already mentioned above, comparing disjoint models does, on the other hand, require an estimate of the generalized noise level (Equation (3) below) on the basis of the best model in the set. Such estimates are of particular importance when there are both genuine and non-genuine pseudo-symmetries [50] in a noisy 2D periodic image that is to be classified.
5. Utilizing Geometric Akaike Information Criteria
5.1. Highlights of the Underlying Information Theory
When one has identified the model that minimizes the expected Kullback-Leibler information loss, i.e. the so-called ‘Kullback-Leibler best’ [13,14,15,16,17] model, by a boot-strapping approach within a symmetry branch, one can obtain a good estimate for the noise level on the basis of this model by the following equation:
where r is the co-dimension, N is the number of data points, n is the degree of freedom (in the mathematical sense, i.e. the number of independent pieces of information that enter into this equation), and the subscript best represents the best model in the set [10,11,12]. The hat over the sigma means that it is an estimator.
For this particular model, one can be confident to have extracted the maximum of geometric-structural information from the image by the least-squares fitting of the model parameters to the image data while also separating out the ‘non-information’ that is summed up in the generalized noise estimate of Equation (3).
The estimate of the noise level in the image according to Equation (3) becomes part of the full (first-order) equation for the G-AIC of all i models Si within a set:
where d is the dimension of the model.
All G-AIC values are relative and on the scale of information. Only the relative differences of the AICi values of the i models in either a disjoint or a non-disjoint set matter for crystallographic symmetry classifications.
These differences are standardized on the basis of the Kullback-Leibler best model in the set, i.e. the one for which we obtained the minimum G-AIC value from Equation (4). The (standardized or rescaled) model-specific G-AIC differences are obtained by:
for all i models in a set of models. This kind of difference is obviously zero for the best model in the set, which possesses the smallest G-AIC value and is designated by the subscript best.
The relative likelihoods of all i models in the set are obtained by Akaike’s transformation [13,14,15,16,17,125]:
where ∝ represents ‘proportional to’ and the pre-factor of ½ on the standardized G-AIC differences is due to the original definition of the traditional AIC [124,125]. The best model in the set obtains a relative likelihood of unity and all other models come in at a fraction of unity.
The evidence ratio of one model with respect to another one within the model set is obtained by:
Evidence ratios have a “raffle ticket interpretation” in quantifying the strength of evidence in favor of one model with respect to another in the same set [13]. When, for example, the evidence ratio of model X with respect to model Y is 20, there is at the very least moderate if not strong evidence in support of model X. The difference of the two related relative G-AIC differences in the inner parentheses in Equation (7) is then approximately 6.
This is analogous to model X possessing 20 raffle tickets while model Y possesses only a single ticket. Clearly model X is then more likely to win a raffle and the evidence in support of it is stronger than for model Y, which is, however, not to be discarded as it is not entirely without merit [13] given the generalized noise level.
Note in passing that twenty-to-one odds are incidentally also the basis of many traditional ad hoc ‘tail probability threshold ≤ 0.05’ null hypothesis (‘p-value significance’, ‘α-level’) testing schemes [13]. Note also in passing that Walter Clark Hamilton pioneered the application of such a hypothesis testing scheme for nested crystal structure models in mainstream 3D crystallography on the basis of the ratio of generalized crystallographic ‘R factors’ in 1965 [98]. The information theory-based approach utilized above is, however, much more powerful [13,14,15,16,17] than that kind of null hypothesis testing and does not ‘clip off’ models with moderate and small likelihoods as they could turn out to be correct when data with significantly reduced noise levels becomes available in the future. In Kenneth P. Burnham’s and David R. Anderson’s own words: “information-theoretic criteria … are not a ‘test’ in any sense, and there are no associated concepts such as test power or p-values or α-levels” [15]. Standard statistical descriptors and the utility of contemporary null hypothesis tests in mainstream 3D crystallography are further discussed in Appendix D.
Individual model probabilities that add up to 100% for the whole set of R models are commonly referred to as either Akaike weights [13,14,15,16,17] or “Bayesian posterior model probabilities” [13]. These probabilities are obtained by the normalization of the relative model likelihoods:
where a given wi is the probability that model i is the Kullback-Leibler best model. Akaike weights for a subset of models are additive and can be summed into confidence sets [13]. Obviously, the sum of all Akaike weights in the full set is 100%. While summing into confidence sets is somewhat subjective, there is certainly no arbitrariness in the usage of the equations and inequalities of this review. Note that the alternative name of Akaike weights, i.e. Bayesian posterior model probabilities, does not imply that the information theory approach is to be considered a “Bayesian approach” to statistics. As it can also not be classified as frequentist, it represents something new because it combines the positive features of both approaches while being essentially free of their negative features.
Akaike weights are also useful for the averaging of model parameters and predictions that are based on a multitude of ‘low-Δi models’ within a set [13,14,15,16,17]. Model parameters are in the context of this review the values of the unit cell parameters in direct and reciprocal space, the discrete Fourier coefficient amplitude and phase angles of the image intensity that form (in reciprocal space) the ‘Fourier equivalent’ [126] of the asymmetric unit of a plane symmetry group, and the gray level values of the group of individual pixels that collectively form the asymmetric unit in direct space.
Higher symmetric translation symmetry, Laue symmetry, and plane symmetry models possess obviously fewer parameters than their lower-symmetric counterparts. Just as unit cell parameters are restricted by translation symmetries in all Bravais lattice types higher than oblique, the values of the gray levels of the individual pixels that form a unit cell in direct space are restricted by site symmetries higher than the identity rotation in all plane symmetry groups higher than p1 and pg.
Typical predictions of higher symmetric plane symmetry models in direct space are the values of all pixels in the unit cell rather than just of those pixels that form collectively the asymmetric unit. Model predictions in Fourier space refer to the whole discrete and complex reciprocal data plane rather than just the Fourier space equivalent of the asymmetric unit [126].
Model averaged parameters or predictions are simply the weighted averages over parameters or predictions within a model set:
where the ‘hat’ over the symbol for the parameter or prediction refers to an estimate [13]. An estimator of the variance of a parameter or prediction estimate that incorporates a variance component for model selection uncertainty is given by:
where gi is the ith model and the extended notation clarifies that the parameter or prediction estimator is in each of the R cases specific to a model in the set.
The variance estimate assesses the precision of the parameter or prediction estimate over the considered set of models and allows for the generation of confidence intervals that incorporate a measure for the model selection uncertainty. The standard error of a parameter or prediction is in multi-model averaging given by:
Thus, a 95% confidence interval [13] (or reasonable error bar widths on the model averaged parameters or predictions in other words) can be approximated by:
Equation (8) may also be utilized to combine for a more or less 2D periodic image the probability of its fuzzy classification into a Bravais lattice type with the probability of its fuzzy classification into a Laue class. The combined fuzzy classification of such an image into a Bravais lattice type and a plane symmetry group is also possible on the basis of Equation (8). This particular combination of fuzzy classifications is probably effective for dealing with genuine pseudo-symmetries in the presence of noise and will be further discussed below in Section 5.2.
When a set of discrete prior probabilities on models, pq, exists (in a Bayesian sense [13]) that is best at representing complementary (other) aspects of the finite information in the image data, one is justified to obtain ‘updated’ Bayesian posterior model probabilities by an extension of Equation (8) to:
where:
Fuzzy plane symmetry group and Laue class assignments complement fuzzy Bravais lattice type assignments in 2D because all three of them are based on different (but complementary) pieces of geometric-structural information in the same complex dFT data plane. Equation (13) may, therefore, be expanded by a third factor as defined by Equation (14). A combined Akaike weight with factors for Bravais lattice types, Laue classes, and plane symmetry groups would constitute some kind of a comprehensive probabilistic crystallographic symmetry classification of a more or less 2D periodic image at a given signal to noise ratio.
While the translation symmetry of a Bravais lattice type is contained in a plane symmetry group, a Laue symmetry is just a point symmetry that includes the symmetry of the Fourier transform itself.
5.2. Updated Bayesian Posterior Model Probabilities and Confidence Sets for Crystallographic Symmetry Classifications
5.2.1. Illustration of the Updated Bayesian Posterior Model Probabilities Idea
It is expected that the Bayesian posterior model probability update approach of Equations (13) and (14) will be helpful for the recognition of genuine pseudo-symmetries in noisy 2D periodic images that exist either per design of the image or by the nature of the crystalline sample that has been imaged. This expectation is founded on the fact that Equation (13) represents a product of normalized probabilities.
If we take, for example, the two images in Figure 1, it was demonstrated in Section 3 that the parameters of a rectangular Bravais lattice can be readily extracted in reciprocal space even in the presence of the given amount of Gaussian noise (in the image in Figure 1b) and a genuine translational pseudo-symmetry when one takes the amplitude map of the dFT into account; see Table 5.
Both of these images will, therefore, obtain large Akaike weights for the rectangular Bravais lattice type by the application of Equation (8). The Akaike weights for the square lattice type with the same unit cell area, on the other hand, will on the basis of Equation (8) be very small for both images given the extracted (qualitatively correct) lattice parameters in Table 5. This should settle the question of the prevailing translation symmetry in the presence of a genuine translational pseudo-symmetry for these two images.
As for the 2D periodic motif of the image in Figure 1b, its somewhat ‘squarish’ appearance suggests that the individual Akaike weights (as obtained by the application of Equation (8) to the fuzzy classification of plane symmetry groups) for groups p4 and p4mm are comparably high, while being somewhat modest for the plane symmetry group pm. We know, however, from the design history of this image that (i) plane symmetry group pm and (ii) the rectangular Bravais lattice type combine to the correct crystallographic symmetry classifications for this image.
When we calculate the product of both types of Akaike weights for this particular image with Equations (13) and (14), there should be a good chance that we obtain the correct plane symmetry classification even in the presence of noise and strong genuine pseudo-symmetries. This should be the outcome of the significant down weighting of the Akaike weights of plane symmetry groups p4 and p4mm by the very small Akaike weight for a square Bravais lattice given the (qualitatively correct) extracted lattice parameters of the rectangular Bravais lattice type and the (qualitatively correct) unit cell areas of Table 5 for the image in Figure 1b.
5.2.2. Illustration of the Idea of Rescaled Confidence Sets over Stretches of Crystallographic Symmetry Hierarchy Branches
There are three different types of crystallographic symmetries in noisy 2D periodic images. Each of these symmetry types is hierarchic and there are several distinct hierarchy branches [7,23,24]. Accordingly, there are several different ways of summing individual Akaike weights or their products up into different kinds of confidence sets. When products of Akaike weights of different types of crystallographic symmetries are involved as in updated Bayesian posterior model probabilities, rescaling all model probabilities so that they add up to 100% in the end is a good idea.
Figure 3 illustrates the idea of rescaled confidence sets of updated Bayesian posterior model probabilities for the combination of Bravais lattice types and plane symmetry groups. Three images with plane symmetry group pm, a combination of a translational pseudo-symmetry with a motif-based (four-fold rotation points plus mirror lines) pseudo-symmetry, and varying amounts of noise are chosen for this illustration. The actual translation periodic motifs and the metric relations of the unit cells are supposed to be different in all of these images, but are utterly unimportant for the following considerations because we are only concerned with the combined crystallographic symmetry classifications of these three images. This makes all other details of the images irrelevant with respect to what we want to demonstrate in this section.
We discuss the sketch in the middle of Figure 3 first. Plane symmetry group pm possesses, for the underlying image, the largest, i.e. 40%, combined (and rescaled) Akaike weight for the Bravais lattice type and plane symmetry group in this figure. The fact that there are significant updated (and rescaled) Bayesian model probabilities in the symmetry hierarchy branches p1–p2–p2mm–p4mm and p1–p2–p4–p4mm is due to both noise and the prevailing combination of translational and motif-based pseudo-symmetries. Note that neither of these two symmetry hierarchy branches contains the correct plane symmetry group pm.
The 40% combined probability that plane symmetry group pm is underlying the image for which the joint fuzzy crystallographic symmetry classification is sketched (in rescaled form) in the middle in Figure 3 results from a high Akaike weight for the rectangular Bravais lattice type and a somewhat moderate Akaike weight for plane symmetry group pm. The significantly lower updated (and rescaled) Bayesian posterior model probabilities for plane symmetry groups p4 and p4mm in this figure results from the product of their low Akaike weight for the square Bravais lattice type with the individual Akaike weights for these two plane symmetry groups. These kinds of anticipated results for highly pseudo-symmetric and noisy images are (at least) the ‘promise’ of the mathematical form of Equations (13) and (14). To which extent this is indeed so in practical cases of interest needs, of course, to be demonstrated experimentally for more or less 2D periodic images with various genuine pseudo-symmetries and noise levels.
The calculation of confidence sets for stretches of each of the hierarchy branches and each of the symmetry types should be helpful for the recognition of genuine pseudo-symmetries in noisy images. One may, for example, compare the confidence set p1–pm–p2mm, which represents in the sketch in the middle of Figure 3, a 75% total probability that the correct symmetry classification is within this particular stretch of a plane symmetry hierarchy branch, with the confidence set p1–p2–p4. The latter confidence set sums to only 35% total (rescaled) probability and represents some kind of a measure for the likelihood of the presence of two-fold and four-fold rotation points in the imaginary noise-free version of the underlying image. The confidence set p1–p2–p2mm, which represents some kind of a measure for the likelihood of the presence of two-fold rotation points and a perpendicular set of mirror lines in that particular image, sums up to a total of 45% joint (and rescaled) probability.
As for the first sketch (at the left) in Figure 3, the p1–pm–p2mm confidence set commands a total probability of 90% with a by far largest contribution from the plane symmetry group pm model itself. In order to obtain such a result, the corresponding image must feature a low amount of pseudo-symmetry and noise.
The third sketch (at the right) in Figure 3, on the other hand, shows a total probability of only 55% for this particular confidence set, which is not much larger than for the other two confidence sets that are mentioned above. The underlying features of the corresponding image for such a result to emerge are both a very strong pseudo-symmetry and a large amount of noise.
In spite of the amounts of noise and strengths of pseudo-symmetries, the general feature of all three sketches in Figure 3 is that the confidence set p1–pm–p2mm commands the largest total probability (even if this is only so by a slim margin in the case of the sketch to the right). This is due to two reasons: (i) that pm is indeed the correct plane symmetry and (ii) that plane symmetries p1 and p2mm are in maximal translationengleiche sub-group and super-group relationships with respect to plane symmetry pm.
While the three examples of Figure 3 illustrate the potential utility of confidence sets of summed-up and rescaled joint Akaike weights, it needs again to be demonstrated experimentally for more or less 2D periodic images with various genuine pseudo-symmetries and noise levels to what extent this approach is, indeed, helpful in practical cases of interest.
5.3. Multi-Model Averaging for Better Predictions and Safer Conclusions
The common symmetry classification practice in crystallographic image processing [21,22] and electron crystallography [25,118,119,120,121] is currently characterized by attempts to infer the plane symmetry of a more or less 2D periodic image on the basis of the three traditional symmetry deviation quantifiers of electron crystallography, which are succinctly described in [7]. That approach does, however, rely on judiciously set thresholds [121] as already stated in the Introduction and Background section of this review and is, therefore, not objective.
As a result of the prevailing subjective practice, one ends up with one model description of the image only, which allows for only one set of lattice parameters and defines all pixel intensities within the asymmetric unit. That particular unit is the part of the translation periodic motif from which all other pixel intensities within a unit cell are created by the application of the 2D space group symmetries of the model. The individual pixel intensities within the asymmetric unit are in effect the average over the whole image of all symmetry-related pixel intensities according to the chosen crystallographic model description (i.e. plane symmetry group). One cannot, however, be sure that one has selected the best possible model given the amount of generalized noise in the data as there was subjectivity in the model’s selection when one chooses it in accord with the common practice.
The raffle ticket discussion of Section 5.1, where a set of model probabilities adds up to 100%, allows one to take a broader view and feel comfortable with the spreading of a crystallographic symmetry classification over a range of models that form a set. This is because each of the models in the set possesses an objectively-quantified amount of merit for representing the geometric-structural information in the noisy data optimally, while the model with the highest probability (Δi = 0) is the one that does this job best in the sense that it minimizes the expected Kullback-Leibler information loss. Since one ends up with several model descriptions in the information theory inspired approach of this review while following objective criteria, one also has several sets of unit cell parameters and pixel intensities for the asymmetric units, which one may call, collectively, individual model parameters.
It is a good idea to average over all of the related parameters (and predictions) from all of the models in a set on the basis of their respective Akaike weights, wi, as defined in Equation (8). The main advantage of multi-model averaging is summed up by Akaike himself in his statement: “If the choice of one single model is not the sole purpose of the analysis of the data the average of the models with respect to the approximate posterior probability C exp {(½) AIC(k)} will provide a better estimate of the true distribution of Y.” [125], where C represents a constant, AIC(k) represents the Δi values of a set of models, and Y stands for a set of observations.
In cases of geometric AICs and more or less 2D periodic images, the observations are the unit cell parameters and the gray levels of the individual pixels. There is typically, as already mentioned above, only one image (or at most a few images) with a given generalized noise level to be classified.
Multi-model averaging safeguards against the obtaining of results that may actually refer to symmetries that would not survive extrapolations to vanishing feature extraction uncertainties (or a generalized noise level of zero, in other words). Such slightly broken symmetries may already be present in a sample when it is, for example, a mixed crystal where various transition metal atoms substitute for each other at sites of otherwise moderately high symmetry as it happens in many lower symmetric minerals. It may be difficult (or with currently available technologies quite impossible) to distinguish between such substituted transition metal atoms in imaging experiments reliably so that the above-mentioned multi-model averaging safeguard could be important in order to avoid conclusions that are wrong. Multi-model averaging will typically result in few to zero symmetries but provides the statistically best value of a parameter in the presence of generalized noise.
To illustrate averaging over model predictions and estimated model parameter values in the context of this review briefly, let us assume that the Akaike weights for oblique, rectangular (primitive), rectangular-centered, and square Bravais lattice types are 10%, 50%, 25%, and 15% for a noisy 2D image with many repeats of a more or less translation periodic motif. The averaged unit cell angle is then, for example, obtained by multiplying the individual ‘angle parameter estimates’ of the four models by weights 0.1, 0.5, 0.25, and 0.15, respectively, and the subsequent summing of the four products.
The last of these products is simply 90° times 0.15 for the square Bravais lattice type. Note that the angle between the two unit vectors of equal length of the primitive subunit of the corresponding (two times larger) rectangular-centered unit cell [7,114] needs to be used in the averaging procedure in the penultimate one of the four products. This angle will be somewhat close to 90° for our example as the corresponding Akaike weight for that particular translation symmetry model is 25%.
While the unit cell angle of the oblique Bravais lattice is also somewhat close to 90°, it is precisely 90° for the rectangular (primitive) Bravais lattice type. The averaged angle will consequently be rather close to 90° since the exact 90° value has a combined probability of 65% for this particular example. Note that while the rectangular (primitive) Bravais lattice type is, for our example, the translation symmetry model that minimizes the expected Kullback-Leibler information loss (since it possesses with 50% the largest Akaike weight), the averaged unit cell angle is not restricted to be exactly 90°.
5.4. Acknowledging Model Selection Uncertainties in Qualitative Ways
Akaike weights [13,14,15,16,17], i.e. Equations (8), (13), and (14), are also useful for qualitative acknowledgments of model selection uncertainties. Obviously, if the best model has only a probability of 30% and the second best comes in at 28%, the selection of the first model is quite uncertain given the fact that geometric AICs are first-order approximations for small Gaussian noise levels. One should, therefore, not rule out the second best model and, at least, communicate that model’s probability (and, even better, all of the probabilities of the models in the set) for inclusion into databases.
When better experimental data (with improved signal to noise ratio) and more accurate processing algorithms become available later on in the future, these two models may either change their respective likelihood rankings or the better model may command a higher percentage of the probability of being the Kullback-Leibler best model. For the time being, one is, however, stuck with two models that possess a relative likelihood ratio of nearly unity so that the evidence for the Δi = 0 model is not much stronger than that for the Δi > 0.
To illustrate this with the, so far, only available examples from the literature, we turn to [4,5]. Liu and coworkers give in the earlier version [5] of their 2004 paper [4] details of frieze group classifications for both a walking humanoid avatar and a walking human being. With an inconsistency that is probably due to ignoring the applicable crystallographic origin conventions [35] and further discussed in Appendix E, the walking avatar features most likely frieze symmetry ![Symmetry 10 00133 i001]() 2mg with a comparatively small model selection uncertainty.
2mg with a comparatively small model selection uncertainty.
 2mg with a comparatively small model selection uncertainty.
The time series data for the walking human being is much noisier so that the least-squares residuals for the disjoint frieze symmetries ![Symmetry 10 00133 i001]() 2mg and
2mg and ![Symmetry 10 00133 i001]() 2mm [135] are nearly equal to each other, signifying a large model selection uncertainty. The reason for this could well be the simultaneous existence of genuine pseudo-symmetries in the form a glide-line and a horizontal mirror-line in the recorded time series data; see Appendix E for further discussions.
2mm [135] are nearly equal to each other, signifying a large model selection uncertainty. The reason for this could well be the simultaneous existence of genuine pseudo-symmetries in the form a glide-line and a horizontal mirror-line in the recorded time series data; see Appendix E for further discussions.
2mg and 2mm [135] are nearly equal to each other, signifying a large model selection uncertainty. The reason for this could well be the simultaneous existence of genuine pseudo-symmetries in the form a glide-line and a horizontal mirror-line in the recorded time series data; see Appendix E for further discussions.Returning to the two images of Figure 1, the model selection uncertainty for the noise-free image to the left (Figure 1a) is clearly going to be much smaller than for the image where Gaussian noise has been added (Figure 1b). Note, finally, that the question of model appropriateness is irrelevant in the context of this review because the mathematical frameworks of 2D and 1D crystallography [23,24,35] are without any doubt appropriate for crystallographic symmetry classification of more or less periodic crystal patterns.
6. Summary and Conclusions
Geometric Akaike Information Criteria and associated Akaike weights for generalized noise-level-dependent crystallographic symmetry classification of 2D images that are more or less periodic in 2D (or 1D) and considered to constitute 2D data planes have been reviewed. These kinds of classifications are always fuzzy and, in a sense, preliminary, since images with reduced generalized noise levels may become available in the future. In other words, these kinds of classifications are never definitive and static in all real-world applications, in compliance with Kanatani’s dictum.
While this review concentrates on more or less periodic crystal patterns in two dimensions (and mentioned such patterns in one dimension only briefly on a few occasions), it goes without explicitly saying that the outlined approach is, in principle, also applicable to crystal patterns of dimensions three to six.
It was demonstrated by an example that pseudo-symmetries present challenges to extraction algorithms for geometric-structural features from more or less 2D periodic images, as well as to their subsequent crystallographic symmetry classifications. Pseudo-symmetries in 3D and the problems they cause in mainstream single-crystal X-ray crystallography are discussed in Appendix C. It is noted in that appendix that there are, so far, no statistical descriptors in mainstream 3D crystallography beyond the Hamilton test, which is a form of null hypothesis testing, that are related to Kanatani’s comments. Similarly, there is, so far, no systematic procedure to deal with genuine pseudo-symmetries in 3D on the basis of noisy diffraction data.
The point is also made repeatedly in Appendix C that crystallographically misclassified 3D crystal structures could essentially no longer be found within crystallographic databases as soon as the objective information theory-based approach of this review was implemented and symmetry classifications were allowed to spread over several classes as a function of the generalized noise level of the experimental data. Such a spreading would allow for an objective reporting of the results of crystal structure determinations, but is not necessary for very highly-symmetric and very well-characterized atomic arrangements, where there is no lingering doubt about the validity of the reported ideal structure. For lower-symmetric and poorly-characterized atomic arrangements (as in many biopolymers), on the other hand, the spreading over several crystallographic symmetry classes would be helpful to the users of the databases as uncertainties about the structures’ validity are faithfully/objectively reported. When better crystal structure determinations become available in the future (at lower generalized noise levels), the spreading would allow for a simple updating of the database entry rather than a re-classification.
Crystallographic model selection uncertainties were illustrated in a qualitative manner on the basis of results from the single relevant experimental study (in 1D) in the literature that the author of this review is aware of after quite substantial background searches. Multi-model inferences and averaging were also discussed.
The combining of Akaike weights for Bravais lattice types, Laue classes, and plane symmetry groups should enable successful crystallographic symmetry classifications even in the presence of manifest pseudo-symmetries that exist per design of an image or that pre-exist within a crystalline sample that has been imaged.
Despite the lack of a guarantee that Kanatani’s geometric AIC approach will work well for fuzzy, but quantitative, crystallographic symmetry classifications, the members of the applied crystallography and computational symmetry communities are hereby invited to test them out on the basis of the above-listed equations and inequalities. Demonstrated success in that endeavor could lead, over time, to a widespread adaptation of the information theoretic approach (as briefly outlined in this review for the 2D case) to mainstream 3D periodic crystallography and its higher-dimensional extensions.
Appendix A is directed at the applied crystallography/materials science community and briefly assesses the potential of the main proposal of this review in connection with the extraction of grain boundary structures from atomic resolution images that are more or less periodic in 1D. Appendix B distinguishes between pseudo-symmetries of different types. Experimental noise turns genuine symmetries in data that were collected from a crystal structure into pseudo-symmetries that can be very hard to distinguish from genuine pseudo-symmetries.
Appendix D is concerned with standard statistical descriptions and the utility of contemporary null hypothesis tests in mainstream X-ray crystallography. By quoting from a very recent paper that the great Indian-American statistician Calyampudi Radhakrishna Rao authored (with Miodrag M. Lovric as co-author), it is shown that there is no point in disputing the validity of Kanatani’s dictum by means of null hypothesis testing in all real-world applications.
Appendix E provides comments of a crystallographic nature on the only relevant experimental study in 1D from the literature that has employed a geometric AIC. These comments are peripheral to the main topic of this review, but still worthwhile making for the benefit of the computational symmetry community.
Acknowledgments
Professor Bryant York of the Computer Science Department of Portland State University (PSU), Andrew Dempsey, and Paul DeStefano of PSU’s Nano-Crystallography Group are thanked for critical proof-readings of the manuscript. Paul DeStefano and Andrew Dempsey are also thanked for creating the sketches in Figure 3. Professor Werner Kaminsky of the Department of Chemistry of the University of Washington at Seattle is thanked for his critical proof-reading of Appendix C and the sharing of his professional opinion on the validity of the structure of NU-1000 (as detailed in Appendix C.3) with the author. Emeritus professors Kenichi Kanatani (of the University of Okayama/Japan) and Wolfgang Neumann (of Humboldt University Berlin/Germany and 2017 Carl Hermann Medal Laureate) are thanked for helpful discussions and encouragements to pursue the lines of research that led to this review, which PSU’s faculty enhancement program supported financially. The publication of this article in an open access journal was funded by the Portland State University Library’s Open Access Fund.
Conflicts of Interest
The author declares no conflicts of interest. The funding sponsors had no role whatsoever in the design of this review; in the collection, analysis, and interpretation of the data; in the writing of the paper; or the author’s decision to publish it in a special issue on “Mathematical Crystallography” of the open access journal Symmetry.
Appendix A. Opportunities and Background in the Context of 1D Periodic 2D Images as Obtained from Plane Edge-On Projected 3D Grain Boundaries
Kozak and co-workers [40] demonstrated the application of a computational tool for the automatic extraction of the five macroscopic [48] grain boundary parameters (geometric degrees of freedom, i.e. independent ways of variations within the physical model) from atomic resolution STEM images of GaAs and other materials with a zinc-blende structure. Just like the proposed tool of [31] for automated symmetry classifications of essentially defect-free 2D periodic crystals on the basis of their atomic resolution microscope images, this very recent tool could be enhanced by the incorporation of core ideas of this review as applied to 1D periodic cases.
It is well known that a real grain boundary possesses four microscopic [48] parameters that influence its physical properties, in addition to the five macroscopic parameters that the new tool is able to extract automatically. The four microscopic grain boundary parameters are somewhat restricted by the CSL index that results from the macroscopic grain boundary parameters [48]. Note also that grain boundaries with the same tilt angle, tilt axis, and crystallographic interface plane (i.e. the same five macroscopic parameters) can feature different types of frieze symmetries in edge-on projections, which correspond to different low-energy structures around the interface at the atomic level [41]. In bi-crystallographic terms, different types of frieze symmetries result for the same grain boundary in edge-on projections from the sectioning of a 2D periodic dichromatic pattern or complex with the same CSL index [41,49]. The sectioning process is also known as the scanning of a dichromatic space group (of any dimension) for different types of subperiodic groups [35,49]. The 3D atomic arrangement around an interface plane results, for example, from the sectioning of a dichromatic space group into a layer group [35]. When a 2D periodic dichromatic pattern or complex is sectioned [49], a 1D periodic frieze symmetry group arises [41].
Automated determination of the four microscopic grain boundary parameters (in addition to the five macroscopic parameters) along with the automated classifications of grain boundary segments [41] into frieze symmetries would be highly desirable in connection with trying to make progress within the above-mentioned crystalline materials per design [18] paradigm. By means of the application of Pierre Curie’s symmetry principle [136,137], one obtains different types of allowed physical properties, e.g., polar or non-polar, across grain boundary segments in dependence of their frieze symmetries. Bi-crystallography allows also for the derivation of symmetry dictated maxima and minima of the physical properties of the interface region [43,44].
Aberration corrected atomic resolution STEM imaging revealed, for example, that segments of the same Σ 13 [001] (510) tilt boundary with different frieze symmetries in high-purity SrTiO3 accommodated significantly different amounts of dopants that substituted for titanium close to the interface. These results are statistically significant as several tens of STEM images with the same frieze symmetry along the same grain boundary containing several hundreds of sectioned CSL unit cells were averaged in order to enhance the image contrast and obtain representative atomic arrangements for the differently-sectioned CSL unit cells. For a related study on the same type of grain boundary with the same types of frieze symmetries in undoped high-purity SrTiO3, the images of approximately 400 sectioned CSL unit cells in approximately 50 STEM images were averaged in direct space in order to reveal the characteristic atomic arrangements around the interface for each of the different frieze symmetry types [37]. Note that the orientation relationship and crystallographic interface plane, i.e. the five macroscopic parameters, of the grain boundaries in all of these related studies were highly precise because they were prepared with the high-temperature diffusion bonding technique [37,41].
Interfacial quasicrystallinity is thought to mediate small geometrical deviations from the geometry of sectioned CSL unit cells in general grain boundaries with plane interfaces [46]. Such grain boundaries are, therefore, in principle, amenable to descriptions with the concept of periodic (and symmetric) ‘quasicrystal approximants’.
The term quasicrystal approximant, as coined by Christopher L. Henley in the late 1980s, refers to an ordinary 3D periodic crystal with a very large unit cell and an atomic structure that is ‘to some extent’ indistinguishable from that of a genuine quasicrystal. The atomic arrangement of a fragment of the approximant’s unit cell occurs also in a quasicrystal, which is translation periodic in six dimensions.
The real numbers and ratios that characterize the ordinary unit cell geometry of approximants are ‘bracketing’ the irrational numbers and ratios that are characteristics of the genuine quasicrystals which they are approximating. While the components of CSL transformation matrices are rational numbers for periodic grain boundaries, irrational components of such matrices are characteristics of quasi-periodic grain boundaries.
All general grain boundaries with plane interfaces can, thus, in principle, be approximated to periodic high CSL index grain boundaries and bi-crystallography [35,41,42,43,44,45,46] is applicable to all of them. The predictions of frieze symmetry types in atomic resolution TEM images by means of 2D bi-crystallography [41] are in principle also valid for all high (and low) CSL index grain boundary approximants to general (‘quasi-periodic’ and ‘quasi-symmetric’) grain boundaries with planar interfaces.
The CSL index for a sufficiently good approximation may, however, be very high so that the actual grain size might set practical limits to the applicability of the bi-crystallographic symmetry theory to general grain boundaries with planar interfaces. When finite temperature effects are included, high CSL index grain boundaries reduce effectively to low CSL index grain boundaries [47] as the five macroscopic grain boundary parameters become less well defined.
Appendix B. Pseudo-Symmetries
Pseudo-symmetry refers according to [71] to “a spatial arrangement that feigns a symmetry without fulfilling it”. Be aware of the distinction between genuine pseudo-symmetry, which is in accord to the definition of the IUCr at the URL given as [50] and non-genuine pseudo-symmetry, which is of a different kind as it arises from the effects of random and systematic distortions on the symmetry operations that form space groups in 1D, 2D, and 3D. Such distortions unavoidably occur in any experiment and are considered to constitute generalized noise in Kanatani’s sense [9,10,11,12] in a generalized imaging experiment. Genuine pseudo-symmetries are also referred to as pseudo-symmetries of the first kind. Non-genuine pseudo-symmetries are, on the other hand, referred to as pseudo-symmetries of the second kind [114].
For translational pseudo-symmetry in 3D, see [53,63,70]. For ‘pseudo-rotation/screw axis plus pseudo-mirror/glide plane mediated’ = motif-based pseudo-symmetry in 3D, see [53,54]. For a combination of translational pseudo-symmetry with motif-based pseudo-symmetry and a discussion of what has been termed ‘pseudo-origin structures’, see [59]. Distinctions have also been made between local and global pseudo-symmetries [77]. Genuine global pseudo-symmetry operators are located at positions that allow for their approximate combination with pseudo-symmetries of the second kind so that the unit cell content acquires an apparently higher symmetric pseudo-space group. The results of such combinations are often complications in least-squares refinements of crystal structures form noisy 3D diffraction data and misclassifications in crystallographic databases, as discussed below in Appendix C.
Genuine global pseudo-symmetry in 3D has also been referred to as ‘Fedorov pseudosymmetry’, i.e. a kind of pseudo-symmetry that is compatible with the 14 Bravais lattices. As introduced by Jewgeni Vladimirovich Chuprunov (Евгений, Владимирович Чупрунов), the latter concept is, however, more sophisticated because it allows for straightforward quantifications of the amounts of symmetries present and broken [123]. A review of Fedorov pseudosymmetry with respect to relationships between atomic structures, their electron density distribution throughout the unit cell, and physical properties in given in [123]. There are 230 Fedorov symmetry groups in a space of three dimensions, which feature supergroup-subgroup relationships, and are, outside of Russia, referred to as ‘3D space groups’. Groups of genuine global pseudo-symmetry have been referred to as ‘pseudo-symmetry space groups’ [59]. In this review, we use Chuprunov’s ‘Fedorov pseudosymmetry groups’ neologism to refer to both 2D plane and 3D space groups. The hallmark of Fedorov pseudosymmetry is that it is compatible with a lattice of the Bravais type. This lattice does not need to be the prevailing crystallographic lattice as there can be translational pseudo-symmetry.
Genuine local pseudo-symmetry operators (of the first kind), on the other hand, are often referred to as being ‘non-crystallographic’ and located at positions that do not allow for their approximate combination with pseudo-symmetries of the second kind so that higher symmetric pseudo-space groups cannot be formed. That kind of pseudo-symmetry has, therefore, been referred to as “non-Fedorov pseudosymmetry” [138].
Both global and local pseudo-symmetries may relate atoms of a molecule to atoms in another molecule in some approximate manner in the same asymmetric unit of a Z’ > 1 crystal structure. The atoms do not necessarily need to be of the same kind as similar densities in an electron density map of a single-crystal X-ray diffraction experiment may suffice. Oxygen atoms may, thus, be related to nitrogen atoms by pseudo-symmetry of the first kind if their respective coordinates are somewhat related by some approximate symmetry.
The term ‘non-crystallographic symmetry’ is also used in the structural biology community, mainly (but not exclusively) in reference to local pseudo-symmetry [80,81]. Depending on the particulars, the International Union of Crystallography (IUCr) prefers to use the terms (genuine) pseudo-symmetry, local symmetry, and partial symmetry instead [139] whereby the definition for (genuine) pseudo-symmetry is as given above and at the URL [50]. Strictly speaking, non-crystallographic symmetry must be defined as a negation of crystallographic symmetry [140] and not as a feigning of the latter. The usage of the term ‘non-crystallographic symmetry’ in the structural biology community includes approximate symmetries that are strictly local and, therefore, not subject to the well-known crystallographic symmetry restrictions [23,24].
An example for this is an approximate five-fold rotation point in a 2D periodic crystal pattern. Note that this rotation point supports an approximate symmetry only in its immediate surrounding as there are no five-fold site symmetries in any plane symmetry groups [23,24]. That rotation point will, however, be present in each unit cell due the actions of the genuine symmetry operations of a plane symmetry group.
If there is no genuine pseudo-symmetry and low noise data, the joint probability of ‘matching wi,q pairs’ and ‘wi,q,s triples’ of Akaike weights for Bravais lattice types and plane symmetry groups, as well as for Laue classes, will be high in Equations (13) and (14) in Section 5.1 of the main body of this review because each of the individual probability factors will be large. Such matching pairs and triples are defined by mutual crystallographic compatibility conditions.
The rectangular (primitive) Bravais lattice type and Laue class 2mm are, for example, crystallographically compatible with each other and both are also compatible with plane symmetry groups pm, pg, p2mm, p2mg, and p2gg. All of the symmetries that are components of a particular plane symmetry group are obviously compatible with each other.
Genuine pseudo-symmetries in real-world images represent, on the other hand, cases of non-matching pairs and triples of Akaike weights because they are only, in some approximate manner, compatible with the genuine symmetries of a corresponding hypothetical noise-free image.
Appendix C. Pseudo-Symmetries and Other Problems in Mainstream 3D Crystallography that Have Led to Misclassified Entries in Major Crystallographic Databases
Appendix C.1. Space Group Symmetry Misclassifications in Major Crystallographic Databases
The crystallographic literature demonstrates clearly that genuine pseudo-symmetries and experimental noise (that turns genuine symmetries into pseudo-symmetries of a different kind) are complicating single-crystal X-ray crystallography structure analyses in 3D, but this appendix can only discuss some of the most influential papers in this very wide field.
Starting with 1914 Nobel Laureate William Laurence Bragg’s original mis-assignment of the primitive cubic Bravais lattice type to sylvite (KCl), a historic review of incorrect structures that are associated with genuine pseudo-symmetries is given in [65]. This particular misclassification is due to a very pronounced (ηa/2 = 0.99, see [141]) combination of translational pseudo-symmetry with motif-based pseudo-symmetry of the electron density of KCl in Fedorov pseudosymmetry group ⊂ (see [123] and Appendix B) and an eight times smaller unit cell. In other words, this Fedorov pseudosymmetry group is broken by only 1% so that Sir William Laurence Bragg’s classification was loosely speaking 99% correct while actually being technically completely incorrect. ‘Ambiguous’ space group assignments account for about one half of the discussed cases in [65] and this appendix will be mainly concerned with analogous misclassifications of crystallographic symmetries.
Mainstream 3D crystallography relies on experimentally-obtained X-ray diffraction patterns consisting of Bragg peaks and associated background from a single crystal, the kinematic diffraction theory, Fourier transforms, and least-squares refinements. The crystals are supposed to consist of spherical atoms or point nuclei that undergo harmonic displacements with respect to their equilibrium position independently.
Compared to electron crystallography on the basis of HRTEM images that were recorded within the validity of the WPO approximation [118,119,120,121], this requires mainstream 3D crystallography to find a solution to the problem that the structure factor phase angles (phases for short) are not directly measurable, but required for the solving and refining of a crystal’s structure. Good estimates of the structure factor phases are in electron crystallography, on the other hand, obtained directly from the Fourier coefficient phase angles of the intensity of noisy 2D periodic HRTEM images [118,119,120,121] by means of crystallographic image processing [21,25].
Since about 80% of the “information” in a crystal structure resides in structure factor phases and only about 20% in structure factor amplitudes [142], this is a distinct advantage of the direct space imaging approach. The tomography approach [25] combined with discrete goniometry [143,144,145] is also applicable in atomic resolution HRTEM in order to obtain information in 3D. Another peculiarity of the direct space imaging approach is that the magnitudes of the complex structure factors can be obtained directly from Fourier transforms of the images so that strictly linear least-squares refinements can be undertaken.
It goes without saying that crystals possess genuine symmetries only as spatial and temporal averages. When crystals are sufficiently large and perfect, the spatially- and temporally-averaged atomic arrangement within a unit cell can be idealized by a geometric-structural model that possesses a well-defined space group symmetry. Deriving that space group symmetry on the basis of experimentally-obtained data from a real crystal is, however, fraught with ambiguity because crystallographic symmetries are hierarchic and mathematical abstractions only. Due to noise in the extraction process of geometrical/structural parameters, genuine pseudo-symmetries may easily be mistaken for genuine symmetries (that turned into pseudo-symmetries of the second kind due to experimental noise and the particulars of utilized extraction algorithms).
It is highly instructive to discuss problems in mainstream 3D crystallography in the context of this review because more or less subjective classifications into Bravais lattice types, Laue classes, and space group types are made there as well on the basis of noisy experimental measurements as part of the standard procedures of the current state of affairs. The resulting crystallographic symmetry classifications and misclassifications subsequently end up in crystallographic databases.
Based on a reasonable threshold, it was estimated in 2008 that some 6% [53] of the entries in the open access world-wide Protein Data Bank (wwPDB often abbreviated as just PDB) [83] refer to structures with pseudo-symmetries. At least some, but possibly many, of these pseudo-symmetric structures are misclassified in the public biopolymer structure record and currently do not allow for the derivation of factual structure-function relationships. This is to a large extent due to the fact that “structures in the PDB are based on a subjective interpretation of experimental data, which may itself be of variable quality, a process that can lead to errors with varying degrees of impact” [84]. What is true for the PDB is also true for any other sufficiently large database [85,86,87] of mainstream 3D crystallography results.
Utilizing appropriately-defined measures for the pseudo-symmetry of the electron density distribution, the prevalence of genuine translational and inversion pseudo-symmetry in 211,162 crystal structure entries for organic and organometallic compounds in the Cambridge Structural Database (CSD) [85] was assessed by Somov and Chuprunov in the year 2009 [62]. Of the 60,707 entries with non-centrosymmetric space groups, approximately 19.8% featured a pseudo-centrosymmetry. Approximately 4.7% to 6.1% of the analyzed structures featured a translational pseudo-symmetry. Note that translational pseudo-symmetry may in combination with genuine crystallographic symmetry axes also “create” rotational motif-based pseudo-symmetry as a byproduct [59]. This fact can be appreciated in 2D by looking at the images in Figs. 1 and 2 in the main body of this review. While the percentages of pseudo-centrosymmetry were higher for lower symmetric crystal systems (e.g., triclinic and monoclinic) than for their higher symmetric counterparts (e.g., tetragonal, hexagonal, and cubic), the opposite was true for translational pseudo-symmetry [62].
Up to 2% of the single-crystal X-ray crystallography structures of proteins in the wwPDB are suspected to fit potentially into higher symmetric space groups [53]. Many of these descriptions of crystal structures are not necessarily wrong. These crystal structures are often just reported in a space group that is a subgroup of some reasonably well-fitting higher symmetric space group. In cases of molecule crystals, some of the 3D point symmetries that individual molecules possess may then not have been recognized during the X-ray crystallography analysis and remain unrevealed in the corresponding database records.
The review of [54] reminds the reader that (i) “experimental measurements never establish the space group with absolute confidence. There are always physical uncertainties to be considered both in the positions and the intensities of the Bragg reflections” and (ii) concludes that “the R-factor statistics did not help at all to distinguish between the best symmetry and the underassigned symmetry”.
Jimin Wang stated in [55] along similar lines and also while referring to the wwPDB that (i) “the problems created by missed symmetry cannot be addressed using techniques based on quality control statistics such as Rfree, the cross validation (CV) statistic introduced in 1992 on which so much reliance is placed today” and (ii) issues a “call to arms to the entire structural biology community so that the important, but entirely correctable problems” which that paper discusses can be resolved as far as this is possible given Kanatani’s dictum [9,10]. While the above-mentioned CV index Rfree is described in detail in [56], the review by Jones provides background on the most commonly-used R value and its weighted form (Rw) [90]. Hamilton introduced generalized weighted R values (RG and R’’) in order to facilitate null hypothesis tests concerning the question if the addition of refinement parameters enhances the validity of a structural model in a statistically significant manner [98,99].
The generalized noise-level dependent crystallographic symmetry classifications that are proposed in the main body of this review could be adapted to 3D as part of the solution of these problems both during the experimental structure analysis procedures and at the database level. This is because there could essentially no longer be crystallographic symmetry misclassifications within the major databases for the large class of structures that potentially fit into higher symmetric space groups once the objective information theoretical approach of this review is implemented in 3D. The small price to pay for this would be just the spreading of the entry of a small organic molecule, protein … intermetallic, or mineral crystal structure over a range of crystallographic classes to which everybody would get used to over time.
Very well-known crystal structures, such as the structural prototypes of inorganic materials science and mineralogy, e.g., Cu, Mo, Mg, diamond, NaCl, CsCl, BaTiO3 etc., should remain as they are classified right now, i.e. assigned to one crystallographic symmetry class only as there is no uncertainty to which class they truly belong. Utilizing the combined Akaike weight concept, these structures have been classified with likelihoods exceedingly close to 100% so that there is neither a need nor a basis to spread their entry over several crystallographic classes. All of these structural prototypes are highly symmetric and a thorough review [57] revealed that inorganic materials with very high crystal symmetries are rarely misclassified.
If one deals with certain low-symmetry minerals, on the other hand, where different atoms substitute for each other and there are noticeable differences in the chemical composition depending on the place from which a mineral has been obtained with respect to another such place, a wide spread over crystallographic symmetry classifications and the inclusion of information on from where the mineral sample has come from into the database record would be in order.
As core of the crystallographic classification problems discussed above, [58] identifies “the nature of human cognition, which is frequently influenced by preconceptions that may lead to fanciful results in the absence of proper validation”, i.e. subjectivity, in other words. That subjectivity is bound to contaminate the structure validation process also as long as it is not done objectively, i.e. as long as the ideas outlined in the main body of this review have not been transferred to 3D and are not implemented in structure validation procedures.
Dauter and co-workers stated also that “it would be useful if all data-processing programs took into account all possible supergroup/subgroup relations during the indexing and merging procedures and presented the suggestions to the users” [58]. There is obviously no need to restrict that idea just to the indexing and merging procedures of mainstream 3D crystallography.
One may as well solve and refine an atomic structure in all reasonable space groups within a particular symmetry hierarchy branch and quantify the relative likelihood of each crystallographic model by means of Akaike weights (that may be summed up into confidence sets for stretches of the symmetry hierarchy branch), as discussed in the main body of this review. In cases of strong genuine pseudo-symmetries [50], one could also include quantifications of the relative likelihood of models that are not within the same symmetry hierarchy branch and part of a different confidence set.
The computer program Zanuda by Lebedev and Isupov actually runs a series of structure refinements in space groups that are compatible with the experimentally observed unit cell parameters and selects the space group with the highest symmetry from a subset of space groups that feature the best refinement statistics [59]. Unfortunately, this selection is, with necessity, based on judiciously (but arbitrarily) set thresholds according to the current state of affairs and, therefore, subjective. These two authors stated in [59] also that “all or some of the pseudo-symmetry operations are, in effect, taken for crystallographic symmetry operations and vice versa” in a class of incorrectly determined protein crystal structures. In that class of structures, there can be strong pseudo-symmetries at the Bravais lattice type, Laue class/point group, and space group level that “require comparative refinements in alternative space groups at the stage when the model” of a macromolecule “is nearly complete” [59]. Lebedev and Isupov also demonstrated that translational pseudo-symmetry may lead to incorrect origin choices, which contribute to space group assignment uncertainties [59].
There are many structures of small molecules in the CSD [85] which were refined in apparently ‘wrong’ space groups [57,60,61,62,63,64,65,82]. Approximately 3% of the entries in this database were estimated in the middle/late 1980s of the last century to feature unnecessarily low symmetries [60,61]. These problems are often associated with difficulties in reliably distinguishing genuine symmetries from genuine pseudo-symmetries when experimental noise levels are moderate to high.
The percentage of ‘problematic’ structures that were published in the Journal Inorganica Chimica Acta (and entered into the CSD) was in 2005 approximately 3% [63]. Approximately 16% of these 260 structures in that journal had already been corrected before 2005 and [63] attempts to do the same job for another 20% of these structures, so that 167 ‘dubious’ structural records that originated from that journal remained at that time in the CSD.
It was estimated that 17.7% of the 260 problematic structures in that journal featured “non-space group translations” [63]. Such translations do not represent the translations that are really present in a crystal and are synonymous with translational pseudo-symmetry [50]. The real translations in these problematic structures are typically associated with weak reflections and/or systematic absences (extinctions) so that they are easily overlooked by a crystallographer who works with very noisy experiment data.
Note that this is more or less analogous to the ‘overlooking’ of weak Fourier coefficient amplitudes by program C in its default setting as discussed in Section 3 of the main body of this review. The relative weakness of the (0,1) and (0,2) amplitudes with respect to the (0,3) amplitude in the discrete Fourier transform of the images in Figure 1a,b is caused by the translational pseudo-symmetry that was designed into the noise-free version of the image in Figure 1a.
Richard E. Marsh lamented in 1995 that many journals which publish mainstream 3D crystallography results “are relaxing their standards in many ways” [64]. This includes “relegating crystallographic results to footnotes or even to supplementary material, selecting referees with little or no experience in crystallography and making it quite clear to their readers that, basically, any crystallographic details beyond a drawing of the molecule are unnecessary” [64].
Marsh has, therefore, “no doubt that the percentage of incorrect results” in those journals “is appreciably larger than 3%” [64]. This criticism does, of course, not apply to the journals of the International Union of Crystallography (IUCr).
The analysis of 17,503 protein structures in the wwPDP that were obtained by means of single-crystal X-ray crystallography concluded that the prestige (and alleged impact) of the journal in which these structures were published did not correlate positively with the quality of the structures as determined by the combination of nine complementing metrics [66]. Due to a large percentage of protein structures with quantified quality below the overall average that they had published, the journals Cell, Science, Molecular Cell, and Nature were ranked at the bottom of 30 journals in which the protein structure determination results had appeared. Note that this does not imply that the scientific conclusions on the basis of the published protein structures are invalid. What can be said on the basis of this ranking is that these structures are of restricted utility to the wider scientific community. Among the possible causes for this somewhat surprising result, the authors of that study point to subjectivity of referees and limited time and resources that some journals dedicate to the reviewing process [66]. In the words of the authors of that study: “the rush to publish high-impact work” helps to explain “the proliferation of poor-quality structures” [67].
Crystallographic structure validations have improved much with the implementation of significantly higher standards for publications in the journals of the IUCr and mandatory checks of deposited crystallographic information files (CIFs) with sophisticated software for possible inconsistencies prior to publication and uploading to crystallographic databases. The journal Acta Crystallographica D of the IUCr appeared, accordingly, in the top third of the above-mentioned ranking of 30 journals that published protein structures as derived by single-crystal X-ray crystallography [66].
Anthony L. Spek described great computer programs for such structure validations in [72,73]. One of these two papers also reminds the reader of the importance of employing the crystallographic origin conventions (see also Appendix E in this connection). That paper states that unrecognized genuine “pseudo-symmetry can give rise to structures which initially appear to be plausible, but which have atoms or molecules misplaced with respect to the true symmetry” [72].
The “holy grail of structure validation” would, according to Spek, be based on software tools that utilize “objective criteria” [73]. When the information theory approach and Kanatani’s geometric AICs (as adapted to 2D crystallography classifications in the main body of this review) are eventually incorporated into future software tools for objective crystallographic structure validations in 3D, one might as well make provisions for databases to accept validated structures with noise-level-dependent (fuzziness-quantified) symmetry classifications.
Spek also stated that for only 384 out of 35,760 small molecule structures that were submitted to the CSD between 2006 and early 2007, the software on the submission sites for the journals of the IUCr indicated that a space group change was recommended [73]. Thus, the good news implied by [73] is that, from the year 2009 onwards, misclassifications in this small molecule database might be below 1%.
Note that (i) the subscription-based CSD [85] and the open access Crystallography Open Database (COD) [86,87] possess many more entries than the wwPDB, and (ii) that corrections of the space groups, Laue classes, and Bravais lattice types of crystal structures often result in significant changes in both bond lengths and angles. Each of these corrections constitutes a crystallographic symmetry reclassification. The small molecules in the CSD and COD are typically over-determined to a large extent in a single-crystal X-ray diffraction experiment because there are many more Bragg reflection intensity measurements than there are free parameters of the atomic structures.
In single-crystal X-ray protein crystallography, atomic resolution [88] is, on the other hand, often not achieved because the crystals do not diffract to below 0.12 nm. A plot of the number of observed reflections per atom for all X-ray crystal structure models in the wwPDB that were obtained from studies with a resolution < 2.5 Å peaked in 2011 at approximately seven [146]. For studies with a resolution ≥ 2.5 Å, the corresponding number at the peak of the distribution reduced to approximately three [146]. Since the number of experimental observations falls with the cube of the resolution, the crystal structure determination problem ceases to be over determined at low resolution.
One then uses prior knowledge in the form of restraints during the refinement of the model’s geometric and thermal vibration properties. Such prior knowledge comes often from similar structure models in the wwPDB. In a typical refinement of a protein structure in a low-resolution study, there may be many more restraints than there are actual physical observations in the form of quantified Bragg peak intensities [146].
Proteins are also much larger than small organic molecules so that larger R values [147] result. For protein crystals, good R1 values may be in the 15% to 30% range depending on the resolution of the data and the amount of solvent that remained within the crystals. Small-molecule crystal structures with up to approximately 200 independent atoms, on the other hand, should be refined to R1 ≤ 7% with an ‘allowance’ for disorder of an extra 0.5% [147].
The crystallographic phase problem can for protein structures not be resolved with direct methods so that Carl-Ivar Brändén and T. Alwyn Jones felt compelled to choose ‘Between objectivity and subjectivity’ as the title of their 1990 Nature paper [89] on protein crystallography. The records in the subscription based CSD and the open access COD do not contain biopolymers and should, therefore, be much less often misclassified in the crystallographic symmetry sense than those in the open access wwPDB.
The curators of the wwPDB are well aware of protein structure-specific problems and have taken multiple steps to address them. They have performed comprehensive re-evaluations of their entries from 2008 onwards, provide Internet-based software systems for structure validations, and updated the file format of their structure entries to PDBx (which is based on the mmCIF format of the IUCr) [84].
In crystals with more than one molecule (formula unit) per asymmetric unit, pseudo-symmetry is rather widespread [74,75] and those crystals constituted between 8.8% [76] and about 11% [77,78] of all structures in the CSD in 2006. A genuine pseudo-centrosymmetry may, in space group P1 be easily mistaken for a genuine inversion center [69]. The root-mean-square [90] deviations of the two chiral molecules in a Z’ = 2 structures from their hypothetical counterparts in space group may be as low as 0.07 Å [79]. Jones provided in [90] a reclassification of an inorganic (triclinic) Z’ = 2 structure with space group P1 into its (monoclinic) minimal translationengleiche supergroup [148] Cc.
Appendix C.2. Reasons Why R Values and Similar “Pure Distance Measures” Are Not Helpful in Crystallographic Symmetry Classifications
Referring to non-biopolymer structures (so-called small molecules), Richard L. Harlow distinguished between ‘quality structures’, ‘fuzzy structures’, ‘incorrect structures’, and ‘junk structures’ [82]. While quality structures do not need to be discussed in this appendix, junk structures are what their name implies and could only be refined to “R values well above 0.15”.
Fuzzy structures “are firstly and primarily characterized by good R values”. Incorrect structures “have all of the same characteristics of the fuzzy group, including low R values, and so the two are often hard to distinguish”. Further characteristics of fuzzy structures are that atoms “have been constrained or restrained in some fashion” during the least-squares refinement process and possess unreasonable thermal vibration parameters [82].
The R values in the quotes above (and in this review in general) refer to very popular measures for the ‘disagreement’ between a least-squares refined atomistic model of the content of a unit cell of a single crystal and the observations from that crystal in an X-ray diffraction experiment [149]. This ‘disagreement index’, ‘residue’, ‘R factor’, ‘residual’, or ‘deviate’ (in a strictly mathematical/statistical sense [93]) is the normalized sum of the absolute value of the differences between the calculated structure factor magnitudes and the observed structure factor magnitudes:
where the latter are obtained by taking the square root of the intensity of the observed diffraction spots and the subscripts obs and cal stand for “observed” and “calculated”, respectively. Note that using the square root of the reflection intensity introduces non-linearity into otherwise linear least-squares refinements and Hamilton’s test. The normalized sum of Equation (A1) is often multiplied by 100% and the R value that is defined by this equation is also referred to as R1.
In the context of Kanatani’s comments on symmetry as continuous and hierarchic features [3] (as briefly discussed in Section 2 of the main body of this review), R values are ‘pure distance measures’ and, therefore, of limited use for deciding which atomistic symmetry model is best within a set of models that are within the same symmetry hierarchy branch.
Being in the same symmetry hierarchy branch means that the atomistic models are related to each other by subgroup and supergroup relationships. As far as 3D crystallography is concerned, the definitive reference text on such relationships is a publication of the IUCr [148]. Ulrich Müller applied these relationships to systematic crystal chemistry in the form of Bärnighausen trees [150].
With necessity, exclusive crystallographic symmetry classifications have to be subjective when based on R values (and similar pure distance or disagreement measures) alone. It should, therefore, not have come as a surprise in the previous section that good R values do not safeguard against crystallographic symmetry misclassifications.
As a matter of fact, it is well known that reduced residuals (R values) can be obtained from the fitting of models with more parameters to experimental data that contain negligible systematic errors and approximately Gaussian distributed random errors. An illustration for this is the structure model fitting in a crystallographic subgroup of a reasonably well fitting supergroup. Cruickshank and co-workers [151] reported, for example, for the mineral thortveitite, {Sc(Y,Fe)}2Si2O7, weighted R values (on the basis of the normalized differences of observed and calculated sums of structure factor squares) of 3.25%, 2.83%, and 2.79% for space groups C2/m, Cm, and C2, respectively.
In Hamilton’s own words: “the model with the fewer restraints, that is, with the greater number of parameters, can usually be made to fit the data better than can the more restrained model” and “the model with the greater number of parameters can always be made to fit the data at least as well as the model with the fewer parameters, provided that the parameters in the latter are a subset of those in the former” [98]. When a structural model is incorrect, the R value for a maximal subgroup of a space group, e.g., RI4 = 19.5%, can be higher than its counterpart, e.g., RI422 = 18.9%, for that space group as demonstrated by two refinements of a protein structure from the same low-resolution single-crystal X-ray diffraction data [152].
Note that R values are ‘somewhat related’ to the first term in any Akaike Information Criterion [124,125] (including geometric AICs [9,10,11,12]) as discussed in Section 4.1 and Section 5.1 of the main body of this review. These first terms are always ‘model accuracy/disagreement measures’ or ‘pure distance measures’ depending on one’s viewpoint, but all first-order AICs also have a second term that corrects for biases, takes the complexity of the model into account, and provides a punishment for fits with too many free parameters.
The other key feature of all AIC applications is the ‘entertaining’ of multiple models that individually possess quantified probabilities for representing experimental data with a certain noise level. It is, therefore, not only the goodness of the fit of a model to the data that counts, but also the complexity of that model (and the prevailing signal to noise level).
Model selections based on AICs are objective because these criteria are based on rigorous mathematics and very deep foundations (which are considered to be beyond mathematical proof), such as the expected Kullback-Leibler information loss when a model is used to represent reality. The two terms of AICs make them parsimonious implementations of Occam’s razor that can straightforwardly be calculated in order to ‘escape’ from the subjectivity trap.
When systematic errors are negligible with respect to random errors, estimated standard deviations on bond lengths and angles are useful measures of the precision with which a crystal structure has been derived [90]. Because high parameter precisions do not guarantee high parameter accuracies, structures that were refined in the wrong space group may harbor significant unrecognized systematic errors while featuring reasonable R1, wR1, wR2, and goodness of fit on F2 values [153].
As far as the publications of the IUCr are concerned, references should be made to the standard uncertainty (s.u.) of a derived crystallographic quantity rather than to its estimated standard deviation (e.s.d.) [91,92,93]. These statistical measures are, however, also of limited use for deciding if a crystal structure is better described in a higher or a lower symmetric space group when these groups are within subgroup-supergroup relationships.
As a matter of fact, there are, so far, no statistical descriptors in mainstream 3D crystallography beyond Hamilton’s null hypothesis test [98,99] that are related to Kanatani’s comments [3]. Similarly, there are so far no objective, i.e. subjectively-set threshold-free, procedures for dealing with genuine pseudo-symmetries in crystallographic symmetry classifications in 3D on the basis of noisy diffraction data.
Appendix C.3. Suspected Pseudo-Symmetry Mediated Space Group Symmetry Misclassification of a Highly Topical Material
Metal-organic framework (MOF) compound NU-1000 (catena-[(μ8-4,4′,4′′,4′′′-pyrene-1,3,6,8-tetrayltetrabenzoato)-bis(μ3-oxo)-bis(μ2-oxo)-tetraoxo-tri-zirconium], CSD entry number 955328, COD entry number 4120127), has probably been misclassified [101] after encountering severe problems in the structure refinement [102]. According to Harlow, the published structure of this MOF is ‘fuzzy’ at best [82] since a total of 133 restraints were placed on the positional and vibrational parameters of the identified atoms [101]. As mentioned above, restraints are expressions of presumed prior knowledge that complement the experimental observations in least-squares refinements. Dore Augusto Clemente would probably classify this structure as both being characterized by ‘non-space group translations’ [63] and incorrect.
Since Brändén and Jones “strongly object to publication of structural work … in the form of a cartoon” [89], they would probably not be happy with the way the structure of this MOF is depicted/described in many papers that allege to report the key features of the crystal structure of NU-1000 according to its current CSD and COD entries. See [103,104,105,106,110] for a small selection of such papers. The structure of this MOF is in the form of a cartoon allegedly characterized by “exceptionally wide (31 Å) mesoporous channels extending throughout the structure” [103].
The R1 value of the single-crystal X-ray crystallography study (on the basis of all hexagonally-indexed reflections) was reported to be 13.17% [101], but was probably so low only because the SQUEEZE function [107] of the well-known OLEX2 [108] program had been utilized to remove a significant amount of experimentally-observed electron density from the mesoscopic channels in NU-1000 during the solving and refining of this structure [101,102].
Note that Acta Crystallographica suggested R1 ≤ 7% as the criterion for a reasonably well-refined small molecule crystal structure in the year 2000 [147]. Participants of a conference on the Critical Evaluation of Chemical and Physical Structure Information considered non-biopolymer crystal structures with R1 > 10% as “suspect” already in 1974 [65]. The goodness of fit on the square of the structure factor amplitudes was for NU-1000 as high as 1.737 [101], while it should ideally have been close to unity [153]. It is, therefore, somewhat doubtful if these two quantitative measures for the alleged ‘model disagreement/correctness’ of the published structure of NU-1000 and the removal of observed electron density by electronic means can lead to “that ‘warm happy feeling’ of confidence in the validity of the scientific work and the results presented” that the participants of the above-mentioned conference were talking about [68,154].
In other words, in order to obtain somewhat acceptable refinement results, partially long-range ordered/disordered material [101,102] needed to be squeezed off the mesoscopic channels so that they became apparently “exceptionally wide” [103] (and completely empty per the definition of the word ‘channel’). The fact that these channels have been depicted to be empty in the form of cartoons in [103,104,105,106,110] seems to be a direct consequence of this particular step in the single-crystal X-ray crystallography structure determination of this MOF [101].
Since these mesoscopic channels are, in reality, not completely empty (or are not ‘exceptionally wide’ in other words) and the structure of NU-1000 is probably quite different from what is described in [101,102], it is conceivable that some of the conclusions in [103,104,105,106] are somewhat questionable (in spite of having been co-authored by one of the 2016 Nobel Prize winners in Chemistry). This does by no means imply that these conclusions are wrong. What can be said about them is, however, that one cannot report valid relationships between the atomistic structure of NU-1000 and its chemical/physical properties when there are serious doubts about the former [102].
The author of this review was given a few low-dose Z-contrast STEM images of NU-1000 for crystallographic analyses [109] that show evidence for the co-existence of three different domains of a low space group symmetry that are related to each other by a three-fold pseudo-rotation of approximately 120° around [001] and project along this axis to plane symmetry group p2gg or one of its translationengleiche subgroups. Much of the very high hexagonal symmetry that this MOF allegedly possesses according to [101] (space group P6/mmm) is, thus, probably a consequence of pseudo-symmetries [102].
Note that this explanation is in agreement with Spek’s assertion that “pseudo-symmetry … may result in partially disordered structures when described with respect to the pseudo-symmetry element” [72]. Additionally, note that the probabilistic (fuzzy and generalized noise-level dependent) classification into a range of plane symmetry groups, e.g., p2gg and its translationengleiche subgroups, that this review proposes in its main body would obviously be very helpful for a quantitative communication of the preliminary analysis of the STEM images from this MOF.
One of the STEM images that the author of this paper was given has recently been published in [110]. The faintly visible weak extra spots in the discrete Fourier transform of that image, which cannot be indexed on the basis of the alleged hexagonal lattice [101], have neither been mentioned nor discussed there [102,110]. An indexed version of the discrete Fourier transform of this image is given in [109].
Whenever domains of penetration twins or ‘drillings’ in crystals are very small, their ‘signature telltales’ in X-ray diffraction patterns are very broad peaks [71]. When these peaks possess, in addition, low intensities, they may be easily overlooked in such diffraction patterns because simultaneously broad and weak peaks may be ‘buried’ in experimental noise. The wavelength of the electrons in the STEM study of NU-1000, being more than 60 times shorter than the wavelength of the single-crystal X-ray crystallography study [101], may have made the difference in resolving weak extra reflections that are nearly impossible to detect with Cu Kα radiation.
This author’s crystallographic image processing [21,22] analysis also showed that there is direct space evidence for positionally-ordered material in the mesoscopic channels of this MOF, which are depicted as empty in the corresponding structure cartoons [103,104,105,106,110]. To make matters worse, virtually everybody else seems to assume that the mesoscopic channels are indeed completely empty and there have been numerous attempts to incorporate small molecules (including rotaxanes [104], catenanes [105], and fullerene derivates [106]) into these channels.
The alleged C88H44O32Zr6 asymmetric unit of this MOF is probably also underreported as far as its chemical composition is concerned. This is because more than one half of the experimentally-observed electron density per unit cell has been removed from the single-crystal X-ray crystallography analysis with the SQUEEZE function [107] of the OLEX2 software [108] (as already mentioned above).
This removal of a substantial amount of material from the analysis by electronic means has been faithfully reported in a qualitative way in the supporting material to [101] and is quantifiable from information in the CIF that accomplished the structure determination of NU-1000 there. The removal of that material means, of course, that the systematic name of this compound is probably also in need of revision.
The crystallographer behind the single-crystal X-ray crystallography analysis of NU-1000 [101,102] was so kind and diligent as to leave comprehensive comments in the CIF and made structure factor amplitudes with hexagonal lattice indexing available as part of the openly-accessible CIF in the supporting material to that paper [101] so that it was straightforward to reanalyze this crystal structure [109] with the help of Werner Kaminsky.
The comments in that CIF make it clear that there is strong evidence for the meso-channels being partly filled by long-range ordered material of an unknown chemical composition. Complementing pieces of information to this effect are contained in several comments within the CIF that is part of the supporting material of [101].
Most non-crystallographers are, however, never going to read an individual CIF and are likely to believe instead that the cartoons which have been published multiple times in peer-reviewed journals (see, e.g., [103,104,105,106,110] for a very small selection) are complete and faithful representations of the results of the single-crystal X-ray crystallography structure analysis that only appeared in the supporting material of [101].
As it is typical for the present time, the original recordings of the X-ray area detector (so called X-ray diffraction images) are not available as part of the public structure record of this MOF so that new single-crystal diffraction experiments are needed to reveal the full structure of NU-1000. Due to the rather large lattice constants and suspected small domain sizes of this MOF, it might be best if these experiments were to utilize synchrotron radiation.
In the meantime, comments should be added to the structural record of NU-1000 in the major databases that there is (i) probably a combination of a motif-based (i.e. ‘six-fold rotation axes plus mirror planes’) pseudo-symmetry with a translational pseudo-symmetry in the analyzed crystal of [109] and (ii) generally ignored evidence for long-range ordered material in the allegedly “exceptionally wide” [103] channels. The possible co-existence of three domains in the particular crystal that served as sample for the single-crystal X-ray crystallography study of [101] may either be typical for this material or an unlucky coincidence as other crystals with a single domain throughout a sample may exist [102].
It was also theorized recently that the original synthesis procedures of NU-1000 [101,103] may lead to the formation of ‘heterogeneous crystals’ where NU-1000 and ‘NU-901-like’ structures co-exist [111] in the same sample and some of the exceptionally wide channels are filled with Zr containing nodes in positions and orientations that break the alleged hexagonal symmetry. The proposed heterogeneity of NU-1000 ‘pseudo-crystals’ that were synthesized according to the procedures described in [101,103] could possibly be an explanation for unusually strong local variations of the observed lattice parameters in low electron dose STEM images of NU-1000 [109] that seem to comply with a paracrystal model [112]. The above-mentioned poor goodness of fit value of the single-crystal X-ray crystallography analysis of this MOF [101] could be partly due to the existence of paracrystallinity [112] since it is a measure for both uncorrected systematic errors in the diffraction data and insufficiencies of the structural model.
Appendix D. Standard Statistical Descriptors and Utility of Contemporary Null Hypothesis Tests in Mainstream 3D Crystallography
The International Union of Crystallography (IUCr) provides a set of recommendations on the proper usage of statistical descriptors in mainstream 3D crystallography [91,92,93,94,95,96] and enforces very high crystallographic standards in its publications. Some of its recommendations concern the correct usage (and inherent limitations) of statistical null hypothesis tests as outlined by Cruickshank and Robertson [97], as well as Hamilton [98,99] and Prince [100]. Such tests are quite useful in order to find objective answers to ‘yes or no’ (dichotomous) questions at the explanatory stage of some enquiry that are then interpreted subjectively. A typical question to which a null hypothesis test can be applied could be: ‘is that particular bond length in a certain molecule as obtained experimentally by single-crystal X-ray crystallography in agreement or disagreement with a certain theoretical value?’ Such kinds of questions are conceptually much simpler than a molecule or crystal symmetry classification question: ‘which one of these two symmetry groups should be declared the correct one based on an experimentally derived pure distance measure when both of the structural models are within a subgroup-supergroup relationship?’ which a researcher may ask herself or himself at the end of two crystal structure refinements.
Prince and Spiegelman caution in the International Tables for Crystallography that “it must be understood that the results of these statistical comparisons do not imply that either model is a correct one. A statistical indication of a good fit says only that, given the model, the experimenter should not be surprised at having observed the data values that were observed. It says nothing about whether the model is plausible in terms of compatibility with the laws of physics and chemistry. Nor does it rule out the existence of other models that describe the data as well as or better than any of the models tested.” [94]. Hamilton makes the point that mathematically strict/precise assumptions form the basis of his statistical tests for the preference of a higher symmetric space group over its subgroups [98]. The presence of non-negligible systematic errors in the data may obviously lead to erroneous conclusions in space group assignments to experimental data and crystal structures when Hamilton tests [99] are applied. While the on-line dictionary of the IUCr specifies somewhat cheekily that “standard crystal-structure determination … in its present form answers the needs of chemical crystallographers” [93], the wider scientific community will surely have further demands on the accuracy and precision of determined molecule and crystal structures in the future.
Statistical theory seems to be in the process of ‘moving on’ from apparently irreconcilable debates between proponents of ‘purely frequentist’ and ‘purely Bayesian’ approaches [155] and started to embrace likelihood ratios and information theory based approaches in recent years because the ‘statistical evidence’ that scientists require in the 21st century is much more quantitative than it used to be and tends to be spread over multiple working hypotheses. A very clear distinction is to be made between “purely statistical (mathematical)” significance and ‘real world (material)’ significance [156,157], whereby the latter will always be interpreted somewhat subjectively by any human being.
By using the information theory-based multi-model approach, as outlined for 2D crystal patterns in the main body of this review, the need for being somewhat subjective can be ‘passed on’ from the experimenter, who should just report a set of model probabilities (Akaike weights) as final (and objectively obtained) result, to the end users of the investigation/crystallographic symmetry classification. These end users shall then interpret them as she or he sees fit. The philosophy of sciences ‘license’ for such a procedure is provided by Imre Lakatos with his paradigm of scientific progress that is historically driven by competing ‘research programs’ [158].
When Rao and Lovric state “Hypotheses exactas non fingo!” as “one of the fundamental rules of the 21st century Statistical Science Decalogue” [159] (with italics in the original for emphasis), they are surely right. In order to make progress, one needs to be pragmatic and accept that one is only testing ‘approximate hypotheses’ [156,157,159] (rather than exact hypotheses that can be specified precisely as, for example, by a certain real number [160] or a single symmetry type, class, or group). One will, in the real world, therefore, never arrive at a definitive conclusion/classification by means of a completely objective procedure when nested models are involved. The good news is that such definiteness is not required for the sake of making progress within the wider scientific (Lakatos) research program to which one is prescribing.
Appendix E. Comments on the Experimental Studies of Liu and Co-Workers
Plane and frieze symmetry groups possess crystallographic origin conventions [23,24,35] that must be ensured to hold after alignment procedures of the raw data and symmetrized versions of the data whenever one wants to take full advantage of all of the mathematical relationships of 2D and 1D crystallography (see also Appendix C.1 in this context). When crystallographic origin conventions are ignored, as in [4,5] for example, there is a good chance that subsequent symmetry classifications will be inconsistent. An example for such an inconsistency in the earlier version [5] of [4] is a supergroup ( ![Symmetry 10 00133 i001]() 2mg) possessing a smaller least-squares residual than one of its translationengleiche subgroups (
2mg) possessing a smaller least-squares residual than one of its translationengleiche subgroups ( ![Symmetry 10 00133 i001]() 211). As Inequality (1) shows, this can never happen with good data that are processed correctly because kmore > kless, both variables are positive integers, and kless > 1.
211). As Inequality (1) shows, this can never happen with good data that are processed correctly because kmore > kless, both variables are positive integers, and kless > 1.
2mg) possessing a smaller least-squares residual than one of its translationengleiche subgroups ( 211). As Inequality (1) shows, this can never happen with good data that are processed correctly because kmore > kless, both variables are positive integers, and kless > 1.Some of the translationengleiche subgroups of ![Symmetry 10 00133 i001]() 2mg and
2mg and ![Symmetry 10 00133 i001]() 2mm possess, for the walking human being, least-squares residuals that seem to be too large to allow for the conclusion that either of these two groups can serve as the Kullback-Leibler best model on the basis of Inequality (1) even without having the benefit of a generalized noise level estimate [5]. This could, again, be the result of ignoring the crystallographic origin convention [35] for frieze symmetry groups.
2mm possess, for the walking human being, least-squares residuals that seem to be too large to allow for the conclusion that either of these two groups can serve as the Kullback-Leibler best model on the basis of Inequality (1) even without having the benefit of a generalized noise level estimate [5]. This could, again, be the result of ignoring the crystallographic origin convention [35] for frieze symmetry groups.
2mg and 2mm possess, for the walking human being, least-squares residuals that seem to be too large to allow for the conclusion that either of these two groups can serve as the Kullback-Leibler best model on the basis of Inequality (1) even without having the benefit of a generalized noise level estimate [5]. This could, again, be the result of ignoring the crystallographic origin convention [35] for frieze symmetry groups. One needs to comment finally on Liu’s and coworkers’ examples [4,5] that the time series of a gait pattern of any human being is not going to be perfectly periodic. Additionally, a walking-person motif that is periodic in time always possesses site symmetry 1 (i.e. identity after rotation by 360°) only and cannot feature any higher site symmetries. This is caused by the walking movement itself.
While standing still, on the other hand, the human body features an approximate mirror plane symmetry (in 3D). Unless a camera is not oriented perpendicular to the normal of this mirror plane, any photo or movie sequence of an upright standing person will not feature a mirror line symmetry (in 2D). While walking, the approximate mirror symmetry of a human being is ‘transformed’ into a glide-line symmetry that possesses a translation component which is periodic in time, but with no site symmetries higher than 1. Good examples for this are the traces that a walking human being leaves in sand or freshly-fallen snow.
The frieze symmetry group of a walking person is, therefore, ![Symmetry 10 00133 i001]() 11g, where there are no site symmetries other than the identity rotation. A time series of a walking human being can, however, only possess this frieze symmetry when the recording camera has been oriented so that its axis is perpendicular to the approximate mirror plane of the still-standing person. In all other orientations, the camera will record a time series with frieze symmetry
11g, where there are no site symmetries other than the identity rotation. A time series of a walking human being can, however, only possess this frieze symmetry when the recording camera has been oriented so that its axis is perpendicular to the approximate mirror plane of the still-standing person. In all other orientations, the camera will record a time series with frieze symmetry ![Symmetry 10 00133 i001]() 111, i.e. the equivalent of pure translation periodicity only. All point symmetries of the walking human being motif higher than 1 that are implied by frieze symmetry classifications higher than
111, i.e. the equivalent of pure translation periodicity only. All point symmetries of the walking human being motif higher than 1 that are implied by frieze symmetry classifications higher than ![Symmetry 10 00133 i001]() 111 and
111 and ![Symmetry 10 00133 i001]() 11g in the results of Liu and coworkers [4,5] are, therefore, actually genuine pseudo-symmetries [50].
11g in the results of Liu and coworkers [4,5] are, therefore, actually genuine pseudo-symmetries [50].
11g, where there are no site symmetries other than the identity rotation. A time series of a walking human being can, however, only possess this frieze symmetry when the recording camera has been oriented so that its axis is perpendicular to the approximate mirror plane of the still-standing person. In all other orientations, the camera will record a time series with frieze symmetry 111, i.e. the equivalent of pure translation periodicity only. All point symmetries of the walking human being motif higher than 1 that are implied by frieze symmetry classifications higher than 111 and 11g in the results of Liu and coworkers [4,5] are, therefore, actually genuine pseudo-symmetries [50].This is somewhat analogous to a walking person that carries a very heavy bag on her or his right shoulder. The traces of the right foot in freshly-fallen snow will then be much deeper than the traces of the left foot and the ![Symmetry 10 00133 i001]() 11g symmetry is reduced to pure translation symmetry.
11g symmetry is reduced to pure translation symmetry.
11g symmetry is reduced to pure translation symmetry.Nevertheless, the studies of Liu and coworkers are valuable because the standard deviations of the mean values of the intensity of the pixels that collectively form a time-repeat unit decrease with the square root of the number of repeats when the noise is of the Gaussian type. A large reduction of the effects of the noise in a periodic time-repeat unit can, thus, be obtained when a very long time series is processed.
These kinds of studies should, however, not be considered as constituting genuine applied crystallography studies as there are only two possible outcomes when genuine pseudo-symmetries are not mistaken for genuine symmetries that form a crystallographic symmetry group.
Plane CSL grain boundaries in edge-on projections, as mentioned in the Introduction and Background section and Appendix A, are, on the other hand, on bi-crystallography theory grounds [41] well described by frieze symmetry groups. Parts of the translation periodic motifs typically possess site symmetries higher than 1 so that frieze symmetries higher than ![Symmetry 10 00133 i001]() 111 and
111 and ![Symmetry 10 00133 i001]() 11g result.
11g result.
111 and 11g result.References and Notes
- Liu, Y.; Hel-Or, H.; Kaplan, C.S.; Van Gool, L. Computational Symmetry in Computer Vision and Computer Graphics. Found. Trends Comput. Graph. Vis. 2009, 5, 1–195. [Google Scholar] [CrossRef]
- Albert, F.; Gómis, J.M.; Blasco, J.; Valiente, J.M.; Aleixos, N. A new method to analyse mosaics based on symmetry group theory applied to Islamic geometric patterns. Comput. Vis. Image Underst. 2015, 130, 54–70. [Google Scholar] [CrossRef]
- Kanatani, K. Comments on “Symmetry as a Continuous Feature”. IEEE Trans. Pattern Anal. Mach. Intell. 1997, 19, 246–247. [Google Scholar] [CrossRef]
- Liu, Y.; Collins, R.T.; Tsin, Y. A computational model for periodic pattern perception based on frieze and wallpaper groups. IEEE Trans. Pattern Anal. Mach. Intell. 2004, 26, 354–371. [Google Scholar] [PubMed]
- Liu, Y.; Collins, R.T.; Tsin, Y. A Computational Model for Periodic Pattern Perception Based on Frieze and Wallpaper Groups. (Longer and More Detailed 2002/2003 Version of [4]). Available online: http://www.cs.cmu.edu/~yanxi/images/Bio2003/2002PAMIwallpaper.pdf (accessed on 5 May 2017).
- Liu, Y.; Collins, R.T.; Tsin, Y. Gait Sequence Analysis using Frieze Patterns. In Proceedings ECCV 2002; Lecture Notes in Computer Science; Heyden, A., Sparr, G., Nielsen, M., Johansen, P., Eds.; Springer: Berlin/Heidelberg, Germany, 2002; Volume 2351, pp. 657–671. [Google Scholar] [CrossRef]
- Moeck, P. Advances in Crystallographic Image Processing for Scanning Probe Microscopy. In Microscopy Book Series; Méndez-Vilas, A., Ed.; Formatex: Badajoz, Spain, 2017; pp. 503–514. Available online: http://www.microscopy7.org/book/503-514.pdf (accessed on 5 May 2017).
- Authier, A.; Chapius, G. (Eds.) Online Dictionary of Crystallography of the IUCr. In A Little Dictionary of Crystallography; International Union of Crystallography: Chester, UK, 2014; p. 49. Available online: http://reference.iucr.org/dictionary/Crystal_pattern (accessed on 5 May 2017).
- Kanatani, K. For geometric inference from images, what kind of statistical model is necessary? Syst. Comput. Jpn. 2004, 35, 1–9. [Google Scholar] [CrossRef]
- Kanatani, K. Uncertainty Modeling and Geometric Inference. In Handbook of Geometric Computing, Applications in Pattern Recognition, Computer Vision, Neuralcomputing, and Robotics; Corrochano, E.B., Ed.; Springer: Berlin/Heidelberg, Germany, 2005; Chapter 14; pp. 462–491. [Google Scholar]
- Kanatani, K. Geometric Information Criterion for Model Selection. Int. J. Comput. Vis. 1998, 26, 171–189. [Google Scholar] [CrossRef]
- Kanatani, K. Statistical Optimization for Geometric Computation: Theory and Practice, 2nd ed.; Dover: Mineola, NY, USA, 2005; Chapter 13; pp. 415–450. ISBN 0-486-44308-6. [Google Scholar]
- Anderson, D.R. Model Based Inference in the Life Sciences: A Primer on Evidence; Springer: New York, NY, USA, 2008; ISBN 978-0-387-74073-7. [Google Scholar]
- Johnson, J.B.; Omland, K.S. Model selection in ecology and evolution. Trends Ecol. Evol. 2004, 19, 101–108. [Google Scholar] [CrossRef] [PubMed]
- Burnham, K.P.; Anderson, D.R. Model Selection and Multimodel Inference: A Practical Information-Theoretic Approach; Springer: New York, NY, USA, 2002; ISBN 978-0-387-22456-5. [Google Scholar]
- Burnham, K.P.; Anderson, D.R.; Huyvaert, K.P. AIC model selection and multimodel inference in behavioral ecology: Some background, observations, and comparisons. Behav. Ecol. Sociobiol. 2011, 65, 23–35. [Google Scholar] [CrossRef]
- Burnham, K.P.; Anderson, D.R.; Huyvaert, K.P. Erratum to: AIC model selection and multimodel inference in behavioral ecology: Some background, observations, and comparisons. Behav. Ecol. Sociobiol. 2011, 65, 415. [Google Scholar] [CrossRef]
- Kalinin, S.V.; Sumpter, B.G.; Archibald, R.K. Big-deep-smart data in imaging for guiding materials design. Nat. Mater. 2015, 14, 973–980. [Google Scholar] [CrossRef] [PubMed]
- Straton, J.C.; Bilyeu, T.T.; Moon, B.; Moeck, P. Double-tip effects on Scanning Tunneling Microscopy imaging of 2D periodic objects: Unambiguous detection and limits of their removal by crystallographic averaging in the spatial frequency domain. Cryst. Res. Technol. 2014, 49, 663–680. [Google Scholar] [CrossRef]
- Straton, J.C.; Moon, B.; Bilyeu, T.T.; Moeck, P. Removal of multiple-tips artifacts from scanning tunneling microscope images by crystallographic averaging. Adv. Struct. Chem. Imaging 2015, 1, 14. [Google Scholar] [CrossRef]
- Moeck, P. Crystallographic image processing for scanning probe and transmission electron microscopy. In Proceedings of the 11th IEEE International Conference Nanotechnology, Portland, OR, USA, 15–18 August 2011; pp. 520–525. [Google Scholar] [CrossRef]
- Moeck, P. Crystallographic image processing for scanning probe microscopy. In Microscopy Book Series; Méndez-Vilas, A., Diaz, J., Eds.; Formatex: Badajoz, Spain, 2010; Volume 3, pp. 1951–1962. Available online: http://www.formatex.info/microscopy4/1951-1962.pdf (accessed on 5 May 2017).
- Hahn, T. (Ed.) International Tables for Crystallography, Brief Teaching Edition of Volume A, Space-Group Symmetry, 5th ed.; Wiley & Sons: Chichester, UK, 2010; ISBN 978-0-470-68911-0. [Google Scholar]
- Aroyo, M.I. (Ed.) International Tables for Crystallography, Volume A, Space-Group Symmetry, 6th ed.; Wiley & Sons: Chichester, UK, 2016; ISBN 978-0-470-97423-0. [Google Scholar]
- Klug, A. Image analysis and reconstruction in the electron microscopy of biological macromolecules. Chem. Scr. 1978–1979, 14, 245–256. [Google Scholar]
- Van Aert, S. Statistical Parameter Estimation Theory—A Tool for Quantitative Electron Microscopy. In Handbook of Nanoscopy, 1st ed.; Van Tendeloo, G., Van Dyck, D., Pennycook, S.J., Eds.; Wiley-VCH Verlag GmbH & Co.: Weinheim, Germany, 2012; pp. 281–308. [Google Scholar]
- De Backer, A. Quantitative Atomic Resolution Electron Microscopy Using Advanced Statistical Techniques. Ph.D. Thesis, Department of Physics, University of Antwerp, Antwerp, Belgium, 2015. [Google Scholar]
- Van Aert, S.; De Backer, A.; Martinez, G.T.; Den Dekker, A.J.; Van Dyck, D.; Bals, S.; Van Tendeloo, G. Advanced electron crystallography through model-based imaging. IUCrJ 2016, 3, 71–83. [Google Scholar] [CrossRef] [PubMed]
- De Backer, A.; Van den Bos, K.H.W.; Van den Broek, W.; Sijbers, J.; Van Aert, S. StatSTEM: An efficient approach for accurate and precise model-based quantification of atomic resolution electron microscopy images. Ultramicroscopy 2016, 171, 104–116. [Google Scholar] [CrossRef] [PubMed]
- De Backer, A.; Jones, L.; Lobato, I.; Altantzis, T.; Goris, B.; Nellist, P.D.; Bals, S.; Van Aert, S. Three-dimensional atomic models from a single projection using Z-contrast imaging: Verification by electron tomography and opportunities. Nanoscale 2017, 9, 8791–8798. [Google Scholar] [CrossRef] [PubMed]
- Vasudevan, R.K.; Ziatdinov, M.; Jesse, S.; Kalinin, S.V. Phases and Interfaces from Real Space Atomically Resolved Data: Physics-Based Deep Data Image Analysis. Nano Lett. 2016, 16, 5574–5581. [Google Scholar] [CrossRef] [PubMed]
- Pólya, G. Über die Analogie der Kristallsymmetrie in der Ebene. Z. Kristallogr. 1924, 60, 278–282. (In German) [Google Scholar] [CrossRef]
- Fedorov, E. Симметрія на плоскости (La symétrie sur un plan). Proc. Imp. Petersb. Mineral. Soc. 1891, 28, 345–390. (In Russian) [Google Scholar]
- Julian, M.M. Foundations of Crystallography: With Computer Applications, 2nd ed.; CRC Press: Boca Raton, FL, USA; London, UK; New York, NY, USA, 2015; ISBN 978-1-4665-5291-3. [Google Scholar]
- Kopský, V.; Litvin, D.B. (Eds.) International Tables for Crystallography, Volume E, Subperiodic Groups, 2nd ed.; Wiley & Sons: Chichester, UK, 2010; ISBN 978-0-470-68672-0. [Google Scholar]
- Tong, W.; Yang, H.; Moeck, P.; Nandasiri, M.I.; Browning, N.D. General Schema for [001] Tilt Grain Boundaries in Dense Packing Cubic Crystals. Acta Mater. 2013, 61, 3392–3398. [Google Scholar] [CrossRef]
- Yang, H.; Lee, H.S.; Sarahan, M.C.; Sato, Y.; Chi, M.; Ikuhara, Y.; Moeck, P.; Browning, N.D. Statistical analysis of atomic resolution images to quantify stoichiometry induced variations in grain boundary structure and energy in SrTiO3. Philos. Mag. 2013, 93, 1219–1229. [Google Scholar] [CrossRef]
- Inoue, K.; Saito, M.; Wang, Z.; Kotani, M.; Ikuhara, Y. On the periodicity of <001> symmetrical tilt grain boundaries. Mater. Trans. 2015, 56, 281–287. [Google Scholar] [CrossRef]
- Inoue, K.; Saito, M.; Chen, C.; Kotani, M.; Ikuhara, Y. Mathematical analysis and STEM observations of arrangement of structural units in <001> symmetrical tilt grain boundaries. Microscopy 2016, 65, 479–487. [Google Scholar] [CrossRef] [PubMed]
- Kozak, R.; Kurdzesau, F.; Prieto, I.; Skibitzki, O.; Schroeder, T.; Dasilva, Y.A.R.; Erni, R.; von Känel, H.; Rossell, M.D. A tool for automatic recognition of [110] tilt grain boundaries in zincblende-type crystals. J. Appl. Crystallogr. 2017, 50, 1299–1306. [Google Scholar] [CrossRef]
- Moeck, P.; York, B.W.; Browning, N.D. Symmetries of migration related segments of all [001] CSL tilt boundaries in (001) projection for all holohedral cubic materials. Cryst. Res. Technol. 2014, 49, 708–720. [Google Scholar] [CrossRef]
- Pond, R.C.; Vlachavas, D. Bicrystallography. Proc. R. Soc. Lond. Ser. 1983, 386, 95–143. [Google Scholar] [CrossRef]
- Kalonji, G. A roadmap for the use of interfacial symmetry groups. J. Phys. Colloq. 1985, 46, C4-249–C4-256. [Google Scholar] [CrossRef]
- Kalonji, G.L. Symmetry Principles in the Physics of Crystalline Interfaces. Ph.D. Thesis, Massachusetts Institute of Technology, Cambridge University, Cambridge, MA, USA, 1982. [Google Scholar]
- Sutton, A.P.; Balluffi, R.W. Interfaces in Crystalline Materials; Oxford University Press: Oxford, UK, 1995; ISBN 978-0-19-921106-7. [Google Scholar]
- Romeu, D. Interfaces and quasicrystals as competing crystal lattice: Towards a crystallographic theory of interfaces. Phys. Rev. B 2003, 67, 024202-1–024202-12. [Google Scholar] [CrossRef]
- Runnels, B. A projection-based reformulation of the coincident site lattice Σ for arbitrary bicrystals at finite temperature. Acta Crystallogr. A 2017, 73, 87–92. [Google Scholar] [CrossRef] [PubMed]
- Priester, L. Grain Boundaries, From Theory to Engineering, 1st ed.; Springer Series in Materials Science; Springer: Dordrecht, The Netherlands, 2013; Volume 172, Chapter 1; pp. 3–47. ISBN 978-2-7598-0769-7. [Google Scholar] [CrossRef]
- Litvin, D.B. Scanning of two-dimensional space groups. Acta Crystallogr. A 2015, 71, 111–113. [Google Scholar] [CrossRef] [PubMed]
- Online Dictionary of Crystallography of the IUCr. Available online: http://reference.iucr.org/dictionary/Pseudo_symmetry (accessed on 19 May 2017).
- Herbst-Irmer, R. Twinning. Oxford Scholarship Online, 2010. Available online: www.oxfordscholarship.com (accessed on 19 May 2017). [CrossRef]
- Müller, P.; Herbst-Irmer, R.; Spek, A.L.; Schneider, T.R.; Sawaya, M.R. Crystal Structure Refinement: A Crystallographer’s Guide to SHELXL; IUCr Texts on Crystallography 8; Oxford University Press: Oxford, UK, 2006; Chapter 7; pp. 106–149. ISBN 9780198570769. [Google Scholar]
- Zwart, P.H.; Grosse-Kunstleve, R.W.; Lebedev, A.A.; Murshudov, G.N.; Adams, P.D. Surprises and pitfalls arising from (pseudo) symmetry. Acta Crystallogr. D 2008, 64, 99–107. [Google Scholar] [CrossRef] [PubMed]
- Poon, B.K.; Grosse-Kunstleve, R.W.; Zwart, P.H.; Sauter, N.K. Detection and correction of underassigned rotational symmetry prior to structure deposition. Acta Crystallogr. D 2010, 66, 503–513. [Google Scholar] [CrossRef] [PubMed]
- Wang, J. On the validation of crystallographic symmetry and the quality of structures. Prot. Sci. 2015, 24, 621–632. [Google Scholar] [CrossRef] [PubMed]
- Brünger, A.T. Free R value: A novel statistical quantity for assessing the accuracy of crystal structures. Nature 1992, 355, 472–475. [Google Scholar] [CrossRef] [PubMed]
- Baur, W.H.; Kassner, D. The perils of Cc: Comparing the frequencies of falsely assigned space groups with their general population. Acta Crystallogr. B 1992, 48, 356–369. [Google Scholar] [CrossRef]
- Dauter, Z.; Wlodawer, A.; Minor, W.; Jaskolskih, M.; Rupp, B. Avoidable errors in deposited macromolecular structures: An impediment to efficient data mining. IUCrJ 2014, 1, 179–193. [Google Scholar] [CrossRef] [PubMed]
- Lebedev, A.A.; Isupov, M.N. Space-group and origin ambiguity in macromolecular structures with pseudo-symmetry and its treatment with the program Zanuda. Acta Crystallogr. D 2014, 70, 2430–2443. [Google Scholar] [CrossRef] [PubMed] [Green Version]
- Marsh, R.E.; Herbstein, F.H. More space-group changes. Acta Crystallogr. B 1988, 44, 77–88. [Google Scholar] [CrossRef] [PubMed]
- Baur, W.H.; Tillmanns, E. How to avoid unnecessarily low symmetry in crystal structure determinations. Acta Crystallogr. B 1986, 42, 95–111. [Google Scholar] [CrossRef]
- Somov, N.V.; Chuprunov, E.V. The translational and inversion pseudosymmetry of the atomic crystal structure of organic and organometallic compounds. Crystallogr. Rep. 2009, 54, 727–733. [Google Scholar] [CrossRef]
- Clemente, D.A. A study of the 8466 structures reported in Inorganica Chimica Acta: 52 space group changes and their chemical consequences. Inorg. Chim. Acta 2005, 358, 1725–1748. [Google Scholar] [CrossRef]
- Marsh, R.E. Some thoughts on choosing the correct space group. Acta Crystallogr. B 1995, 51, 897–907. [Google Scholar] [CrossRef]
- Donohue, J. Incorrect Crystal Structures: Can they be avoided? In Critical Evaluation of Chemical and Physical Structural Information, Proceedings of the a Conference with the Same Name at Dartmouth College, Hanover, New Hampshire, 24–29 June 1973; Lide, D.R., Paul, M.A., Eds.; National Academy of Sciences: Washington, DC, USA, 1974; pp. 199–218. ISBN 0-309-02146-4. [Google Scholar]
- Brown, E.N.; Ramaswamy, S. Quality of protein crystal structures. Acta Crystallogr. D 2007, 63, 941–950. [Google Scholar] [CrossRef] [PubMed]
- Borman, S. Structure quality, crystal structures in ‘hotter’ journals tend to have more errors. Chem. Eng. News 2007, 85, 11–12. [Google Scholar] [CrossRef]
- Ibers, J.A. Problem Crystal Structures. In Critical Evaluation of Chemical and Physical Structural Information, Proceedings of the a Conference with the Same Name at Dartmouth College, Hanover, New Hampshire, 24–29 June 1973; Lide, D.R., Paul, M.A., Eds.; National Academy of Sciences: Washington, DC, USA, 1974; pp. 186–198. ISBN 0-309-02146-4. [Google Scholar]
- Marsh, R.E. P1 or P1? Or something else? Acta Crystallogr. B 1999, 55, 931–936. [Google Scholar] [CrossRef] [PubMed]
- Chook, M.; Lipscomb, W.N.; Ke, H. Detection and use of pseudo-translation in determination of protein structures. Acta Crystallogr. D 1998, 54, 822–827. [Google Scholar] [CrossRef] [PubMed]
- Ruck, M. Kristallographische Konsequenzen von Pseudosymmetrie in Kristallstrukturen. Z. Kristallogr. 2000, 215, 148–156. (In German) [Google Scholar] [CrossRef]
- Spek, A.L. Single-crystal structure validation with the program PLATON. J. Appl. Crystallogr. 2003, 36, 7–13. [Google Scholar] [CrossRef]
- Spek, A.L. Structure validation in chemical crystallography. Acta Crystallogr. D 2009, 65, 148–155. [Google Scholar] [CrossRef] [PubMed]
- Brock, C.P.; Dunitz, J.D. Towards a Grammer of Crystal Packing. Chem. Mater. 1994, 6, 1118–1127. [Google Scholar] [CrossRef]
- Kuleshova, L.N.; Antipin, M.Y.; Komkov, I.V. The role of molecular association in the formation of crystals with Z’ > 1 of some hydroxy-containing compounds. J. Mol. Struct. 2003, 647, 41–51. [Google Scholar] [CrossRef]
- Anderson, K.M.; Goeta, A.E.; Hancock, K.S.B.; Steed, J.W. Unusual variations in the incidence of Z’ > 1 in oxo-anion structures. Chem. Commun. 2006, 2138–2140. [Google Scholar] [CrossRef] [PubMed]
- Desiraju, G.R. On the presence of multiple molecules in the crystal asymmetric unit (Z’ > 1). CrystEngComm 2007, 9, 91–92. [Google Scholar] [CrossRef]
- Anderson, K.M.; Steed, J.W. Comment on “On the presence of multiple molecules in the crystal asymmetric unit (Z’ > 1)” by Gautam R. Desiraju. CrystEngComm 2007, 9, 328–330. [Google Scholar] [CrossRef]
- Steed, J.W. Should solid-state molecular packing have to obey the rules of crystallographic symmetry? CrystEngComm 2003, 5, 159–178. [Google Scholar] [CrossRef]
- Müller, P. Pseudo-Symmetry. Oxford Scholarship Online, 2010. Available online: www.oxfordscholarship.com (accessed on 24 February 2018). [CrossRef]
- Müller, P.; Herbst-Irmer, R.; Spek, A.L.; Schneider, T.R.; Sawaya, M.R. Crystal Structure Refinement: A Crystallographer’s Guide to SHELXL; IUCr Texts on Crystallography 8; Oxford University Press: Oxford, UK, 2006; Chapter 6; pp. 97–105. ISBN 9780198570769. [Google Scholar]
- Harlow, R.L. Troublesome Crystal Structures: Prevention, Detection, and Resolution. J. Res. Natl. Inst. Stand. Technol. 1996, 101, 327–339. [Google Scholar] [CrossRef] [PubMed]
- Berman, H.M.; Kleywegt, G.J.; Nakamura, H.; Markley, J.L. The Protein Data Bank archive as an open data resource. J. Comput. Aided Mol. Des. 2014, 28, 1009–1014. [Google Scholar] [CrossRef] [PubMed]
- Gore, S.; Velankar, S.; Kleywegt, G.J. Implementing an X-ray validation pipeline for the Protein Data Bank. Acta Crystallogr. D 2012, 68, 478–483. [Google Scholar] [CrossRef] [PubMed]
- Groom, C.R.; Bruno, I.J.; Lightfoot, M.P.; Ward, S.C. The Cambridge Structural Database. Acta Crystallogr. B 2016, 72, 171–179. [Google Scholar] [CrossRef] [PubMed]
- Gražulis, S.; Chateigner, D.; Downs, R.T.; Yokochi, A.F.T.; Quirós, M.; Lutterotti, L.; Manakova, E.; Butkus, J.; Moeck, P.; Le Bail, A. Crystallography Open Database—An open access collection of crystal structures. J. Appl. Crystallogr. 2009, 42, 726–729. [Google Scholar] [CrossRef] [PubMed]
- Gražulis, S.; Daškevič, A.; Merkys, A.; Chateigner, D.; Lutterotti, L.; Quirós, M.; Serebryanaya, N.; Moeck, P.; Downs, R.T.; Le Bail, A. Crystallography Open Database (COD): An open-access collection of crystal structures and platform for world-wide collaboration. Nucleic Acids Res. 2011, 40, D420–D427. [Google Scholar] [CrossRef] [PubMed]
- Wlodawer, A.; Dauter, Z. ‘Atomic resolution’: A badly abused term in structural biology. Acta Crystallogr. D 2017, 73, 379–380. [Google Scholar] [CrossRef] [PubMed]
- Brändén, C.-I.; Jones, T.A. Between objectivity and subjectivity. Nature 1990, 343, 687–689. [Google Scholar] [CrossRef]
- Jones, P.G. Crystal Structure Determination: A Critical Review. Chem. Soc. Rev. 1984, 13, 157–172. [Google Scholar] [CrossRef]
- Schwarzenbach, D.; Abrahams, S.C.; Flack, H.D.; Gonschorek, W.; Hahn, T.; Huml, K.; Marsh, R.E.; Prince, E.; Robertson, B.E.; Rollett, J.S.; et al. Statistical descriptors in crystallography, Report of the International Union of Crystallography Subcommittee on Statistical Descriptors. Acta Crystallogr. A 1989, 45, 63–75. [Google Scholar] [CrossRef]
- Schwarzenbach, D.; Abrahams, S.C.; Flack, H.; Prince, E.; Wilson, A.J.C. Statistical descriptions in crystallography. II: Report of a Working Group on Expression of Uncertainty in Measurement. Acta Crystallogr. A 1995, 51, 565–569. [Google Scholar] [CrossRef]
- Online Dictionary of Crystallography of the IUCr. Available online: http://reference.iucr.org/dictionary/Statistical_descriptors (accessed on 24 February 2018).
- Prince, E.; Spiegelman, C.H. Statistical significance tests. In International Tables for Crystallography, Vol. C: Mathematical, Physical and Chemical Tables, 3rd ed.; Prince, E., Ed.; International Union for Crystallography: Chester, UK, 2004; pp. 702–706. ISBN 978-1-4020-1900-5. [Google Scholar]
- Cruickshank, D.W.J. Remarks about protein structure precision. Acta Crystallogr. D 1999, 55, 583–601. [Google Scholar] [CrossRef] [PubMed]
- Cruickshank, D.W.J. Remarks about protein structure precision, Erratum. Acta Crystallogr. D 1999, 55, 1108. [Google Scholar] [CrossRef] [PubMed]
- Cruickshank, D.W.J.; Robertson, A.P. The comparison of theoretical and experimental determinations of molecular structures, with applications to naphthalene and anthracene. Acta Crystallogr. 1953, 6, 698–705. [Google Scholar] [CrossRef]
- Hamilton, W.C. Significance tests on the crystallographic R factor. Acta Crystallogr. 1965, 18, 502–510. [Google Scholar] [CrossRef]
- Hamilton, W.C. Tests for statistical significance. In International Tables for X-ray Crystallography, Vol. IV Revised and Supplementary Tables to Vol. II and III; Ibers, J.A., Hamilton, W.C., Eds.; Kynoch Press: Birmingham, UK, 1974; pp. 285–310. [Google Scholar]
- Prince, E. Comparison of the fits of two models to the same data set. Acta Crystallogr. B 1982, 38, 1099–1100. [Google Scholar] [CrossRef]
- Mondloch, J.E.; Bury, W.; Fairen-Jimenez, D.; Kwon, S.; DeMarco, E.J.; Weston, M.H.; Sarjeant, A.A.; Nguyen, S.T.; Stair, P.C.; Snurr, R.Q.; et al. Vapor-Phase Metalation by Atomic Layer Deposition in a Metal–Organic Framework. J. Am. Chem. Soc. 2013, 135, 10294–10297. [Google Scholar] [CrossRef] [PubMed]
- Sarjeant, A.A. personal and several e-mail communications at and after the 24th World Congress and General Assembly of the International Union of Crystallography, Hyderabad, India, August 2017; Sir Stoddart, J.F. personal communication October 2017; and Farha, O.K. several email communications between November 2017 and February 2018 (on the advice of Sarjeant and Sir Stoddart).
- Wang, T.C.; Wang, T.C.; Vermeulen, N.A.; Kim, I.S.; Martinson, A.B.; Stoddart, J.F.; Hupp, J.T.; Farha, O.K. Scalable synthesis and post-modification of a mesoporous metal-organic framework called NU-1000. Nat. Protoc. 2016, 11, 149–162. [Google Scholar] [CrossRef] [PubMed]
- McGonigal, P.R.; Deria, P.; Hod, I.; Peyman, Z.; Moghadam, P.Z.; Avestro, A.-J.; Horwitz, N.E.; Gibbs-Hall, I.C.; Blackburn, A.K.; Chen, D.; et al. Electrochemically addressable trisradical rotaxanes organized within a metal–organic framework. Proc. Natl. Acad. Sci. USA 2015, 112, 11161–11168. [Google Scholar] [CrossRef] [PubMed] [Green Version]
- Chen, Q.; Sun, J.; Li, P.; Hod, I.; Moghadam, P.Z.; Kean, Z.S.; Snurr, R.Q.; Hupp, J.T.; Farha, O.K.; Stoddart, J.F. A Redox-Active Bistable Molecular Switch Mounted inside a Metal–Organic Framework. J. Am. Chem. Soc. 2016, 138, 14242–14245. [Google Scholar] [CrossRef] [PubMed]
- Howarth, A.J.; Buru, C.T.; Liu, Y.; Ploskonka, A.M.; Hartlieb, K.J.; McEntee, M.; Mahle, J.J.; Buchanan, J.H.; Durke, E.M.; Al-Juaid, S.S.; et al. Postsynthetic Incorporation of a Singlet Oxygen Photosensitizer in a Metal–Organic Framework for Fast and Selective Oxidative Detoxification of Sulfur Mustard. Chem. Eur. J. 2017, 23, 214–218. [Google Scholar] [CrossRef] [PubMed]
- Spek, A.L. PLATON SQUEEZE: A tool for the calculation of the disordered solvent contribution to the calculated structure factors. Acta Crystallogr. C 2015, 71, 9–18. [Google Scholar] [CrossRef] [PubMed]
- Dolomanov, O.V.; Bourhis, L.J.; Gildea, R.J.; Howard, J.A.K.; Puschmann, H. OLEX2: A complete structure solution, refinement and analysis program. J. Appl. Crystallogr. 2009, 42, 339–341. [Google Scholar] [CrossRef]
- Moeck, P.; Mehdi, B.L.; Stevens, A.; DeStefano, P.; Browning, N. Scanning transmission electron microscopy assessment of a metal-organic framework compound. Acta Crystallogr. A 2017, 73, C596, (In Proceedings of the 24th World Congress and General Assembly of the International Union of Crystallography, Hyderabad, India, 21–28 August 2017). [Google Scholar] [CrossRef]
- Platero-Prats, A.E.; League, A.B.; Bernales, V.; Ye, J.; Gallington, L.C.; Vjunov, A.; Schweitzer, N.M.; Li, Z.; Zheng, J.; Mehdi, B.L.; et al. Bridging Zirconia Nodes within a Metal–Organic Framework via Catalytic Ni-Hydroxo Clusters to Form Heterobimetallic Nanowires. J. Am. Chem. Soc. 2017, 139, 10410–10418. [Google Scholar] [CrossRef] [PubMed]
- Liu, W.-G.; Truhlar, D.G. Computational linker design for highly crystalline metal-organic framework NU-1000. Chem. Mater. 2017, 29, 8073–8081. [Google Scholar] [CrossRef]
- Hindeleh, A.M.; Hosemann, R. Microparacrystals: The intermediate stage between crystalline and amorphous. J. Mater. Sci. 1991, 26, 5127–5133. [Google Scholar] [CrossRef]
- Webber, T.E.; Liu, W.-G.; Desai, S.P.; Lu, C.C.; Truhlar, D.G.; Penn, R.L. Role of a modulator in the synthesis of phase-pure NU-1000. Appl. Mater. Interfaces 2017, 9, 39342–39346. [Google Scholar] [CrossRef] [PubMed]
- Moeck, P.; DeStefano, P. Accurate lattice parameters from 2D periodic images for subsequent Bravais lattice type assignments. Adv. Struct. Chem. Imaging 2018, 4, 5. [Google Scholar] [CrossRef] [PubMed]
- Mevenkamp, N.; Berkels, B. Unsupervised and accurate extraction of primitive unit cells from crystal images. Lect. Notes Comput. Sci. 2015, 9358, 105–116. [Google Scholar] [CrossRef] [Green Version]
- Klinger, M.; Jäger, A.J. Crystallographic Tool Box (CrysTBox): Automated tools for transmission electron microscopists and crystallographers. J. Appl. Crystallogr. 2015, 48, 2012–2018. [Google Scholar] [CrossRef] [PubMed]
- Hovmöller, S. CRISP: Crystallographic image processing on a personal computer. Ultramicroscopy 1992, 41, 121–135. [Google Scholar] [CrossRef]
- Fan, H.-F.; Zhong, Z.-Y.; Zheng, C.-D.; Li, F.-H. Image processing in high-resolution electron microscopy using the direct method. I. Phase Extension. Acta Crystallogr. A 1985, 41, 163–165. [Google Scholar] [CrossRef]
- Han, F.-S.; Fan, H.-F.; Li, F.-H. Image processing in high-resolution electron microscopy using the direct method. II. Image deconvolution. Acta Crystallogr. A 1986, 42, 353–356. [Google Scholar] [CrossRef]
- Liu, Y.-W.; Fan, H.-F.; Zheng, C.-D. Image processing in high-resolution electron microscopy using the direct method. III. Structure-factor extrapolation. Acta Crystallogr. A 1988, 44, 61–63. [Google Scholar] [CrossRef]
- Zou, X.; Hovmöller, S.; Oleynikov, P. Electron Crystallography: Electron Microscopy and Electron Diffraction; IUCr Texts on Crystallography 16; Oxford University Press: Oxford, UK, 2011; ISBN 978-0-19-958020-0. [Google Scholar]
- Unit Cell Extraction. Available online: https://nmevenkamp.github.io/UnitCellExtraction/ (accessed on 5 May 2017).
- Chuprunov, E.V. Fedorov Pseudosymmetry of Crystals: Review. Crystallogr. Rep. 2007, 52, 1–11. [Google Scholar] [CrossRef]
- Akaike, H. A New Look at the Statistical Model Identification. IEEE Trans. Autom. Control. 1974, 19, 716–723. [Google Scholar] [CrossRef]
- Akaike, H. A Bayesian analysis of the minimum AIC procedure. Ann. Inst. Stat. Math. A 1978, 30, 9–14. [Google Scholar] [CrossRef]
- Verberck, B. Symmetry-Adapted Fourier Series for the Wallpaper Groups. Symmetry 2012, 4, 379–426. [Google Scholar] [CrossRef]
- Cochran, W. The Fourier Method of Crystal-Structure Analysis. Acta Crystallogr. 1948, 1, 138–142. [Google Scholar] [CrossRef]
- Cochran, W. The Fourier Method of Crystal Structure Analysis. Nature 1948, 161, 765. [Google Scholar] [CrossRef]
- Booth, A.D. A New Fourier Refinement Technique. Nature 1948, 161, 765–766. [Google Scholar] [CrossRef]
- Cruickshank, D.W.J. The convergence of the least-squares and Fourier refinement methods. Acta Crystallogr. 1950, 3, 10–13. [Google Scholar] [CrossRef]
- Cruickshank, D.W.J. On the relations between Fourier and least-squares methods of structure determination. Acta Crystallogr. 1952, 5, 511–518. [Google Scholar] [CrossRef]
- Cruickshank, D.W.J.; Rollett, J.S. Electron-Density Errors at Special Positions. Acta Crystallogr. 1953, 6, 705–707. [Google Scholar] [CrossRef]
- Cruickshank, D.W.J. Errors in Fourier series. In Computing Methods in Crystallography; Rollett, J.S., Ed.; Pergamon Press: Oxford, UK, 1965; Chapter 14; pp. 107–111. [Google Scholar]
- Cruickshank, D.W.J. Errors in least squares methods. In Computing Methods in Crystallography; Rollett, J.S., Ed.; Pergamon Press: Oxford, UK, 1965; Chapter 14; pp. 112–116. [Google Scholar]
- Note that frieze symmetries
![Symmetry 10 00133 i001]() 2mg and
2mg and ![Symmetry 10 00133 i001]() 2mm are disjoint in the translationengleiche sense only [35]. Since
2mm are disjoint in the translationengleiche sense only [35]. Since ![Symmetry 10 00133 i001]() 2mm is a type II minimal non-isomorphic supergroup of
2mm is a type II minimal non-isomorphic supergroup of ![Symmetry 10 00133 i001]() 2mg, the latter group is also a type IIa maximal non-isomorphic subgroup of the former when the transformation is employed.
2mg, the latter group is also a type IIa maximal non-isomorphic subgroup of the former when the transformation is employed. - Curie, P. Sur la symmétrie des phénomènes physiques: Symmétrie d’un champ électrique et d’un champ magnétique. J. Phys. 1894, 3, 393–415. (In French) [Google Scholar]
- Allen, S.M.; Thomas, E.L. The Structure of Materials; The MIT Series in Materials Science & Engineering; John Wiley & Sons Inc.: New York, NY, USA, 1999; pp. 188–189. ISBN 0-471-00082-5. [Google Scholar]
- Lombardo, G.M.; Punzo, F. False symmetry, pseudosymmetry, disorder, polymorphism and atomic displacement parameters. J. Mol. Struct. 2014, 1078, 158–164. [Google Scholar] [CrossRef]
- Online Dictionary of Crystallography of the IUCr. Available online: http://reference.iucr.org/dictionary/Noncrystallographic_symmetry (accessed on 19 May 2017).
- Nespolo, M.; Souvignier, B.; Litvin, D.B. About the definition of “noncrystallographic symmetry”. Z. Kristallogr. 2008, 223, 605–606. [Google Scholar] [CrossRef]
- Katkova, M.R.; Krutov, A.I.; Chuprunov, E.V. On pseudosymmetry in structure types. Crystallogr. Rep. 1995, 40, 62–65. [Google Scholar]
- Mackay, A.L. The Development of Electron Crystallography. Crystallogr. Rep. 2001, 46, 901–908. [Google Scholar] [CrossRef]
- Moeck, P.; Qin, W.; Fraundorf, P.B. Towards 3D image-based nanocrystallography by means of transmission electron goniometry. Mater. Res. Soc. Symp. Proc. 2005, 839, P4.3.1–P4.3.6. [Google Scholar] [CrossRef]
- Fraundorf, P.; Qin, W.; Moeck, P.; Mandell, E. Making sense of nanocrystal lattice fringes. J. Appl. Phys. 2005, 98, 114308. [Google Scholar] [CrossRef]
- Moeck, P.; Fraundorf, P. Transmission electron goniometry and its relation to electron tomography for materials science applications. arXiv, 2006; arXiv:cond-mat/0611345. [Google Scholar]
- Merritt, E.A. To B or not to B: A question of resolution? Acta Crystallogr. D 2012, 68, 468–477. [Google Scholar] [CrossRef] [PubMed]
- Krebs, F.C. How the R factor changes as the molecules become larger. J. Appl. Crystallogr. 2000, 33, 392–393. [Google Scholar] [CrossRef]
- Wondratschek, H.; Müller, U. (Eds.) International Tables for Crystallography, Volume A1, Symmetry Relations between Space Groups, 1st ed.; Kluwer Academic Publishers: Dortrecht, The Netherlands; Boston, MA, USA; London, UK, 2004; ISBN 1-4020-2355-3. [Google Scholar]
- Authier, A.; Chapius, G. (Eds.) Online Dictionary of Crystallography of the IUCr. In A Little Dictionary of Crystallography; International Union of Crystallography: Chester, UK, 2014; pp. 167–168. Available online: http://reference.iucr.org/dictionary/R_factor (accessed on 31 December 2017).
- Müller, U. Symmetry Relationships between Crystal Structures, Applications of Crystallographic Group Theory in Crystal Chemistry; IUCr Texts on Crystallography 18; Oxford University Press: Oxford, UK, 2013; ISBN 978-0-19-966995-0. [Google Scholar]
- Cruickshank, D.W.J.; Lynton, H.; Barclay, G.A. A reinvestigation of the crystal structure of thortveitite Sc2Si2O7. Acta Crystallogr. 1962, 15, 491–498. [Google Scholar] [CrossRef]
- Kleywegt, G.J.; Hoier, H.; Jones, T.A. A re-evaluation of the crystal structure of chloromuconate cycloisomerase. Acta Crystallogr. 1996, 52, 858–863. [Google Scholar] [CrossRef] [PubMed]
- Giacovazzo, C.; Monaco, H.L.; Artioli, G.; Viterbo, D.; Ferraris, G.; Gilli, G.; Zanotti, G.; Catti, M. Fundamentals of Crystallography, 2nd ed.; IUCr Texts on Crystallography 7; Oxford University Press: Oxford, UK, 2002; ISBN 0-19-850958-8. [Google Scholar]
- Shoemaker, D.P. Well-behaved crystal structure determinations. In Critical Evaluation of Chemical and Physical Structural Information, Proceedings of a Conference with the Same Name at Dartmouth College, Hanover, New Hampshire, 24-29 June 1973; Lide, D.R., Paul, M.A., Eds.; National Academy of Sciences: Washington, DC, USA, 1974; pp. 157–185. ISBN 0-309-02146-4. [Google Scholar]
- Taper, M.L.; Lele, S.R. (Eds.) The Nature of Scientific Evidence, Statistical, Philosophical, and Empirical Considerations; Chicago University Press: Chicago, IL, USA, 2004; ISBN 0-226-78957-8. [Google Scholar]
- Hodges, J.L., Jr.; Lehmann, E.L. Testing the approximate validity of statistical hypotheses. J. R. Stat. Soc. Ser. B 1954, 16, 261–268. [Google Scholar]
- Serlin, R.C.; Lapsley, D.K. Rationality in psychological research: The good-enough principle. Am. Psychol. 1985, 40, 73–83. [Google Scholar] [CrossRef]
- Lakatos, I. The Methodology of Scientific Research Programs; Philosophical Papers; Cambridge University Press: Cambridge, UK, 1980; Volume 1, ISBN 0521280311. [Google Scholar]
- Rao, C.R.; Lovric, M.M. Testing Point Null Hypothesis of a Normal Mean and the Truth: 21st Century Perspective. J. Mod. Appl. Stat. Methods 2016, 15, 2–21. [Google Scholar] [CrossRef]
- Zumbo, B.D.; Kroc, E. Some Remarks on Rao and Lovric’s ‘Testing Point Null Hypothesis of a Normal Mean and the Truth: 21st Century Perspective’. J. Mod. Appl. Stat. Methods 2016, 15, 33–40. [Google Scholar] [CrossRef]
Figure 1.
(a) Image with plane symmetry group p1m1 (pm for short when there is no need to communicate the crystallographic setting) that possesses genuine pseudo-symmetries per design which are in (b) exacerbated by added independent Gaussian noise of mean zero and a standard deviation of 10% of the maximal image intensity. The translation symmetry in (a) is visibly of the rectangular (primitive) Bravais lattice type [7]. In the noisy image (b), the translation symmetry is apparently of the square Bravais lattice type. Both images are in open access [122] and are reproduced here with CC-BY (share—copy and redistribute the material in any medium or format adapt—remix, transform, and build upon the material for any purpose, even commercially) licenses. The labeling of the images with the letters a and b and the outline of one unit cell by a yellow rectangle in (a) are the only modifications that were made. The directions X and Y refer to the edges of both images and are parallel to the unit cell edges x,0 and 0,y (that are defined by the 2D lattice vectors and ).

Figure 2.
Choices of unit cells that take the prevailing pseudo-symmetries in Figure 1a into account, i.e. which fix the unit cell origins at four-fold pseudo-rotation points. Only the genuine symmetry operations of plane symmetry group p1m1, i.e. the mirror lines 0,y, ½,y, (and 1,y) are highlighted by full yellow lines on the left-hand side in subfigure (a). Subfigure (b), on the right hand side, shows, in addition, pseudo-mirrors as dotted yellow lines that intersect with the genuine mirrors to create two-fold and four-fold pseudo-rotation points as well as a pseudo-square unit cell with three repeats. (Additional pseudo-mirror and pseudo-glide lines are generated by the combination of these genuine pseudo-symmetry operations with the genuine mirror lines, but their locations are not specifically marked.) Fedorov pseudosymmetry [123] group pb/34mm ⊃ p1m1 arises as a result of these combinations, as can be straightforwardly seen in (b). The area of one pseudo-unit cell of the pseudo-square type in (b) is just one-third of the genuine rectangular unit cell in (a).

Figure 3.
Outcomes of the fuzzy plane symmetry classification of three more or less 2D periodic images that possess plane symmetry group pm per design and a combination of translational pseudo-symmetry with a motif-based (four-fold rotation points plus mirror lines) pseudo-symmetry in addition to varying amounts of recording and processing noise. Each of the three individual sketches (at the left, in the middle, and at the right) corresponds to one of three images. Note that the given percentages represent the joint probability that a particular plane symmetry group and Bravais lattice type are the ones which minimize the expected Kullback-Leibler information loss utilizing Equations (13) and (14) rescaled to sum up to 100% in each sketch. For simplicity, these percentages are assumed, rather than derived from experimental data, but this suffices for the illustration of the core idea of updated Bayesian posterior model probabilities confidence set over stretches of plane symmetry hierarchy branches. For added visual appeal, the areas of the displayed unit cells were scaled proportional to the (rescaled) numerical model probability product percentages. The unit cell shapes were chosen in accordance with the prevailing Bravais lattice types. The actual metric of the unit cells and their respective content are utterly irrelevant for the illustration of the confidence set idea.


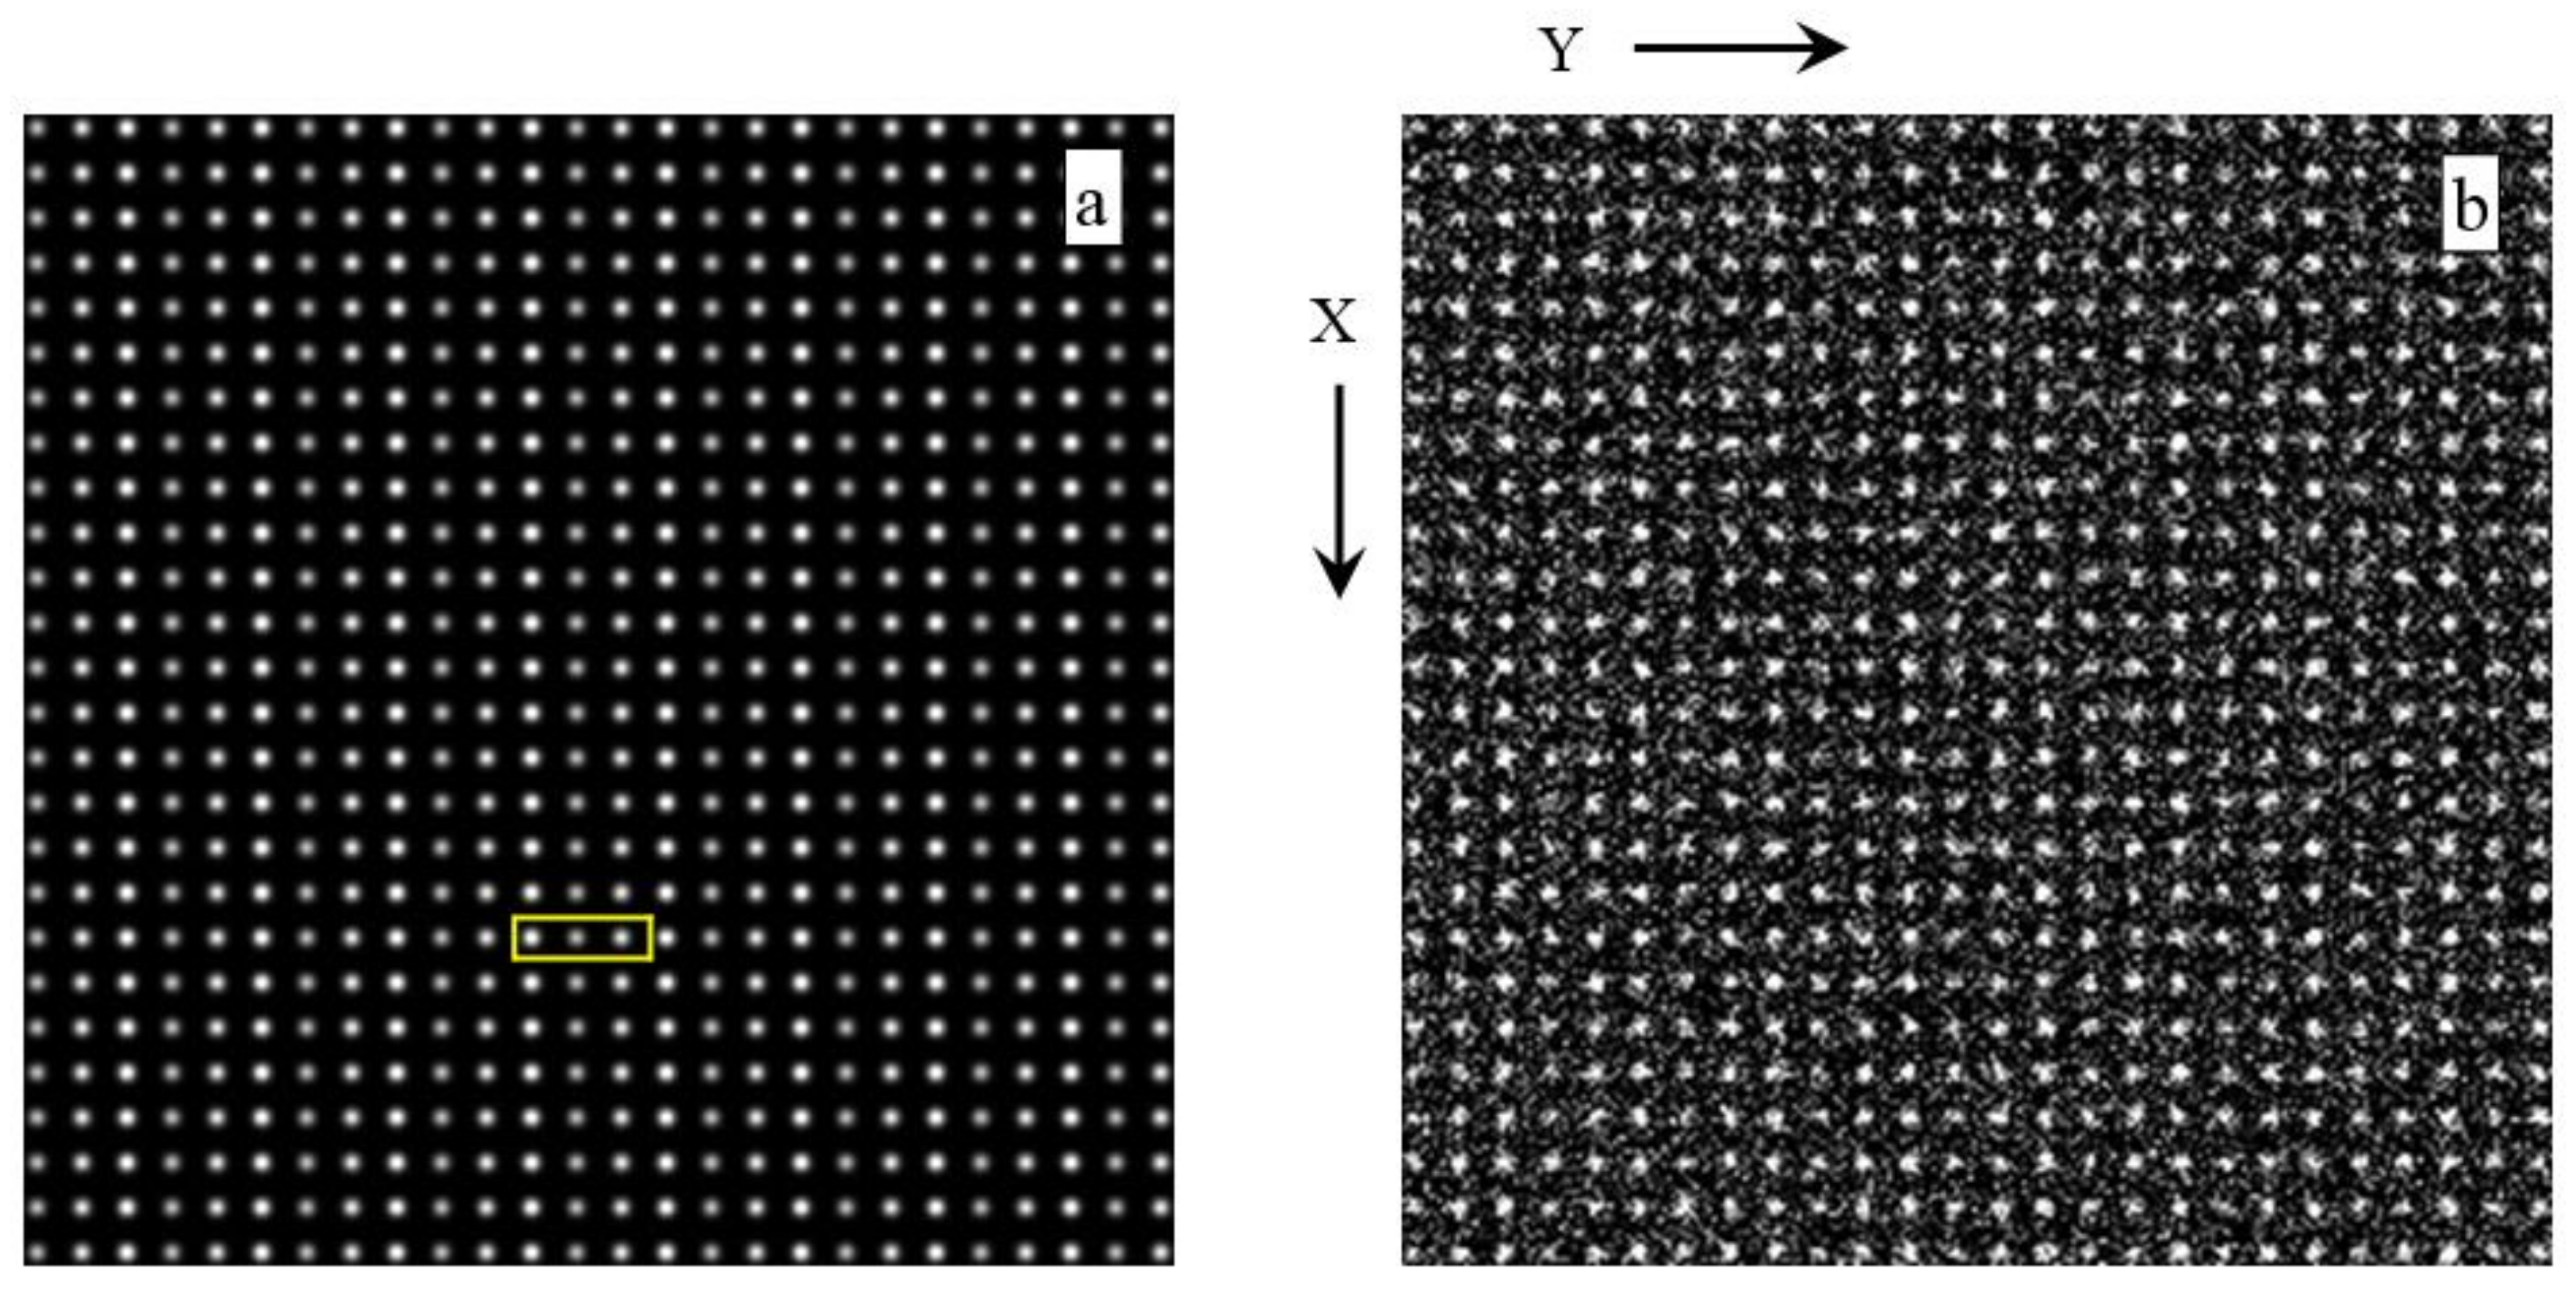
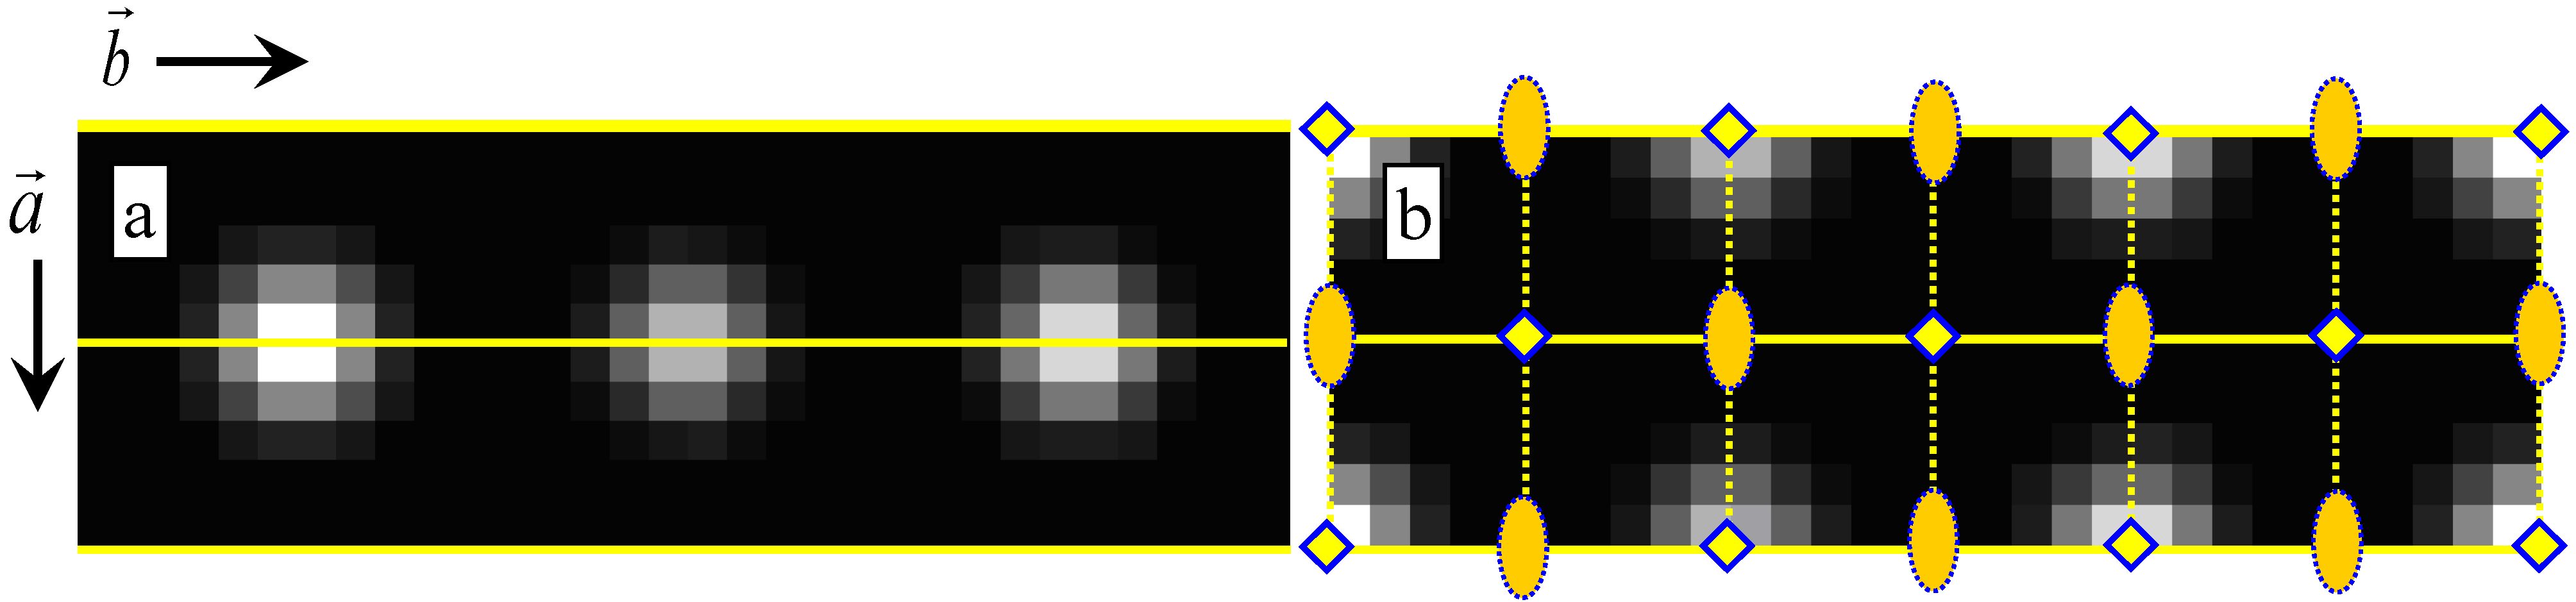
Table 1.
Letter key for references to the three algorithms/computer programs for which we will quote quantitative results [114] in this review.
Table 1.
Letter key for references to the three algorithms/computer programs for which we will quote quantitative results [114] in this review.
| Algorithm’s Number in the Final Reference Section | Algorithm’s Letter Reference in this Review |
|---|---|
| [115] | A |
| [116] | B |
| [117] | C |
Table 2.
Extracted lattice parameters from the noise-free image in Figure 1a and derived unit cell areas utilizing the default settings of three computer programs. The qualitatively correct result is marked in bold font.
Table 2.
Extracted lattice parameters from the noise-free image in Figure 1a and derived unit cell areas utilizing the default settings of three computer programs. The qualitatively correct result is marked in bold font.
| Algorithm’s Reference Letter | a/b | γ in ° | Unit Cell Area in Square Pixels |
|---|---|---|---|
| A | 0.333 ± 0.06 | 90.0 ± 0.4 | 300.0 ± 2.0 |
| B | 1.004 ± 0.01 | 90.0 ± 0.05 | 99.4 ± 1.0 |
| C | 0.998 ± 0.01 | 90.0 ± 0.05 | 99.8 ± 1.0 |
Table 3.
Extracted lattice parameters from the noise-free image in Figure 1a and derived unit cell areas after a re-interpretation of the results from Algorithm B and as obtained in a non-default setting of Algorithm C. Both results are qualitatively correct and, therefore, marked in bold font.
Table 3.
Extracted lattice parameters from the noise-free image in Figure 1a and derived unit cell areas after a re-interpretation of the results from Algorithm B and as obtained in a non-default setting of Algorithm C. Both results are qualitatively correct and, therefore, marked in bold font.
| Algorithm’s Reference Letter | a/b | γ in ° | Unit Cell Area in Square Pixels |
|---|---|---|---|
| B | 0.335 ± 0.01 | 90.0 ± 0.05 | 298.2 ± 3.0 |
| C | 0.333 ± 0.02 | 90.0 ± 0.05 | 300.0 ± 2.0 |
Table 4.
Extracted lattice parameters from the noisy image in Figure 1b and derived unit cell areas utilizing the default settings of three different computer programs. There is no qualitatively correct result to be marked in bold font.
Table 4.
Extracted lattice parameters from the noisy image in Figure 1b and derived unit cell areas utilizing the default settings of three different computer programs. There is no qualitatively correct result to be marked in bold font.
| Algorithm’s Reference Letter | a/b | γ in ° | Unit Cell Area in Square Pixels |
|---|---|---|---|
| A | 1.414 ± 0.07 | 135.8 ± 0.6 | 98.6 ± 1.5 |
| B | 0.995 ± 0.01 | 90.2 ± 0.05 | 99.1 ± 1.0 |
| C | 1.000 ± 0.01 | 90.0 ± 0.05 | 100.0 ± 1.0 |
Table 5.
Extracted lattice parameters from the noisy image in Figure 1b and derived unit cell areas after a re-interpretation of the results from Algorithm B and as obtained in a non-default setting of Algorithm C. Both results are qualitatively correct and, therefore, marked in bold font.
Table 5.
Extracted lattice parameters from the noisy image in Figure 1b and derived unit cell areas after a re-interpretation of the results from Algorithm B and as obtained in a non-default setting of Algorithm C. Both results are qualitatively correct and, therefore, marked in bold font.
| Algorithm’s Reference Letter | a/b | γ in ° | Unit Cell Area in Square Pixels |
|---|---|---|---|
| B | 0.332 ± 0.01 | 90.2 ± 0.05 | 297.3 ± 3.0 |
| C | 0.333 ± 0.02 | 90.0 ± 0.05 | 300.0 ± 2.0 |
Table 6.
Number of constraints that enter Inequality (2) in a G-AIC for the fuzzy classification into Bravais lattice types.
Table 6.
Number of constraints that enter Inequality (2) in a G-AIC for the fuzzy classification into Bravais lattice types.
| Parallelogram | Rectangle | General Rhombus | Square | Hexagonal Rhombus |
|---|---|---|---|---|
| 2 | 3 | 3 | 4 | 4 |
© 2018 by the author. Licensee MDPI, Basel, Switzerland. This article is an open access article distributed under the terms and conditions of the Creative Commons Attribution (CC BY) license (http://creativecommons.org/licenses/by/4.0/).
Share and Cite
MDPI and ACS Style
Moeck, P. Towards Generalized Noise-Level Dependent Crystallographic Symmetry Classifications of More or Less Periodic Crystal Patterns. Symmetry 2018, 10, 133. https://doi.org/10.3390/sym10050133
AMA Style
Moeck P. Towards Generalized Noise-Level Dependent Crystallographic Symmetry Classifications of More or Less Periodic Crystal Patterns. Symmetry. 2018; 10(5):133. https://doi.org/10.3390/sym10050133
Chicago/Turabian StyleMoeck, Peter. 2018. "Towards Generalized Noise-Level Dependent Crystallographic Symmetry Classifications of More or Less Periodic Crystal Patterns" Symmetry 10, no. 5: 133. https://doi.org/10.3390/sym10050133
Note that from the first issue of 2016, this journal uses article numbers instead of page numbers. See further details here.