A Comparative Study of Logistic Models Using an Asymmetric Link: Modelling the Away Victories in Football


1
Campus Universitario de Tafira, s/n, Department of Applied Economic Analysis & TIDES Institute, University of Las Palmas de Gran Canaria, 35017 Las Palmas de Gran Canaria, Spain
2
Campus Universitario de Tafira, s/n, Department of Quantitative Methods & TIDES Institute, University of Las Palmas de Gran Canaria, 35017 Las Palmas de Gran Canaria, Spain
*
Author to whom correspondence should be addressed.
Symmetry 2018, 10(6), 224; https://doi.org/10.3390/sym10060224
Submission received: 10 April 2018
/
Revised: 28 May 2018
/
Accepted: 11 June 2018
/
Published: 15 June 2018
Abstract
:The target of this paper is to study the relevant factors affecting the victories away from home of football teams in order to fit the probability of winning an away match. The paper addressed the following research issues: (a) Is the identification of the significant variables underlying the results plausible? (b) Can information of these factors increase the probability of winning away from home and assist coaches in their decisions? Empirically, it is shown that there are more home victories and draws than away victories in the professional football leagues in Europe and this fact has to be taken into account. Thus, the classical logistic and Bayesian regression models do not seem to be adequate in this case and an asymmetric logistic regression model is therefore considered. This paper analyses 380 games played in the First Division of the Spanish Football League during the 2013–2014 season. Asymmetric logistic regression from a Bayesian point of view is chosen as the best model. This model detects new relevant factors undetected by standard logistic regressions. In view of the paper’s findings, various practical recommendations were made in order to improve decision-making in this field. The Asymmetric logit link is a helpful device that can assist coaches in their game strategies.
1. Introduction
In the middle of the 1990s, most of the European football leagues replaced the old point score system (two points for a victory and one point for a draw) with a new one (three points for a victory and one point for a draw). The English Premier League was the first one to adopt this system in 1981 (see [1,2] for details). The new system of points was not only applied in the first division, but also in the rest of the categories of football competitions in all countries. The new rule was introduced in the World Cup and the European qualifying in 1994 and one year later in Spain and the Champions League. In the words of [3], the motivation behind the change was to avoid boring draws.
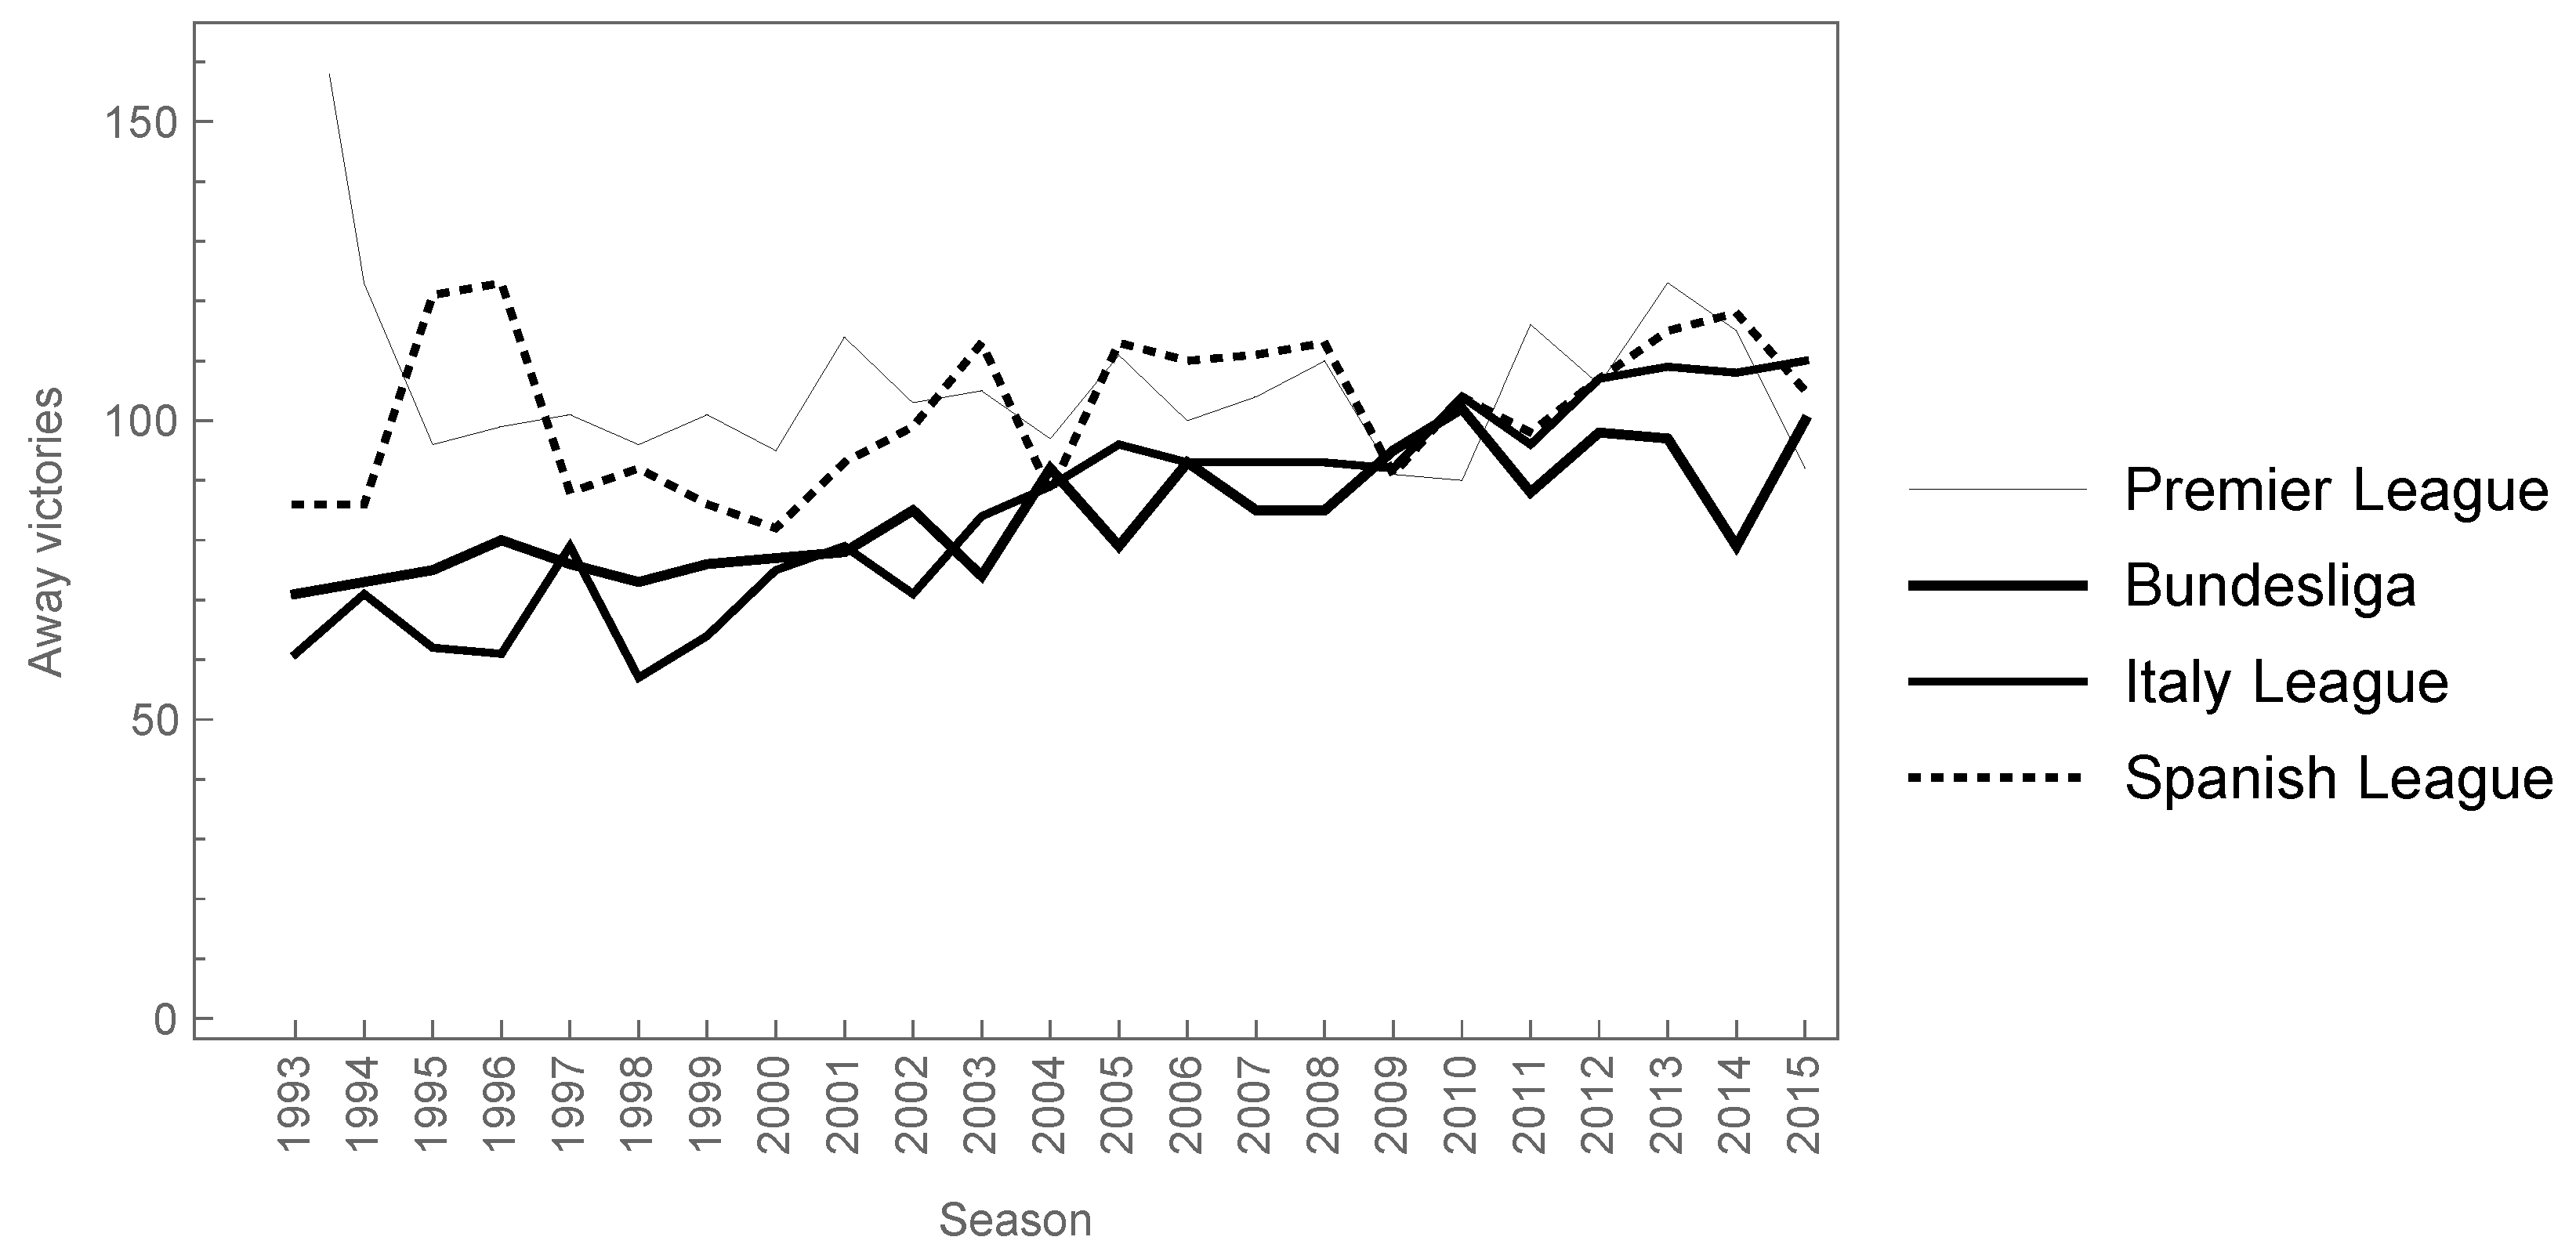
Some works related with the effects caused by the transition from the 2–1–0 to the 3–1–0 award system in football have been published in the last few decades. See, for example [4,5,6,7], among others. The consequences of the new point score system are not clear, but, at least in Spain, most teams play in order to get the victory not only in their home location, but also in away games. In this sense, in the past, teams playing a football match in an away place were satisfied with getting a draw, at least in Spain and Italy. These days, most teams are only focusing on getting three points from the match because the difference between getting a victory and a draw is two points instead of one point, as it was in the past. In the long term, a large number of draws would lead the team to the lowest position in the classification, and, therefore, the probability of avoiding the relegation decreases. Figure 1 shows the away victories in four of the most important European football leagues (Premier League, Bundesliga, Italy Football League and Spanish Football League) from 1993–1994 to 2015–2016 seasons. It can be seen that there is a growing trend in the away victories from 1993. Therefore, it seems that it is important to play to get the victory, instead of playing to get a draw, even when the football teams play as visitors.
However, the target of this paper is to study the relevant factors affecting the away victories of football teams in order to fit the probability of winning an away match. In this way, in our experience, no preceding studies have supposed the situation in which the matches have many more home victories and draws than away victories. A classical logit model can be used to analyse the factors that determine sporting achievement, but sometimes the individual results are more clearly related to one category than to the another. This is the case shown in this paper, in which there are more drawing and winning matches as a local team in the final results of the games, therefore, the asymmetric logit model can improve the estimations. In this context, [8] applied a Bayesian procedure applying a skewed link in their analysis of binary response data when one response is much more frequent than the other. Similarly, [9] used a skewed logit link for estimating the fraudulent conduct reflected in a Spanish database of insurance claims. [10] applied the asymmetric logit model to analyse infection rates in a General and Digestive Surgery hospital department. [11] studied the risk variables underlying automobile insurance claims taking into account the asymmetry of the database.
The formal aspects of the different logistic regression models considered in this work are developed in Section 2. The description of the database is shown in Section 3. Section 4 discusses the results, and conclusions and future lines of research connected with this work are presented in the last Section.
2. Logit Specifications
2.1. Frequentist Estimation
When research deals with binary outcomes, the logit and probit models are the highest popular models in regards to this case. A binary response model is a regression model in which the dependent variable y is a binary random variable that takes only the values zero and one. In our case, the variable if a match ends with an away victory while otherwise, that is, the match ends with the visiting team getting a draw or a defeat. In this article, we use the logit model in order to estimate the probability of an away victory in football competition given a set of characteristics of the event; that is, given the predictor X, we estimate , i.e., the conditional probability that given the value of the predictor. As is known, the logit specification is a particular instance of a generalized linear model (see [12], chapter 12, for details). On the other hand, the logistic link function is a moderately not confusing alteration of the prediction curve and also yields odds ratios. Both characteristics make it well-received among researchers in front of the probit regression. The standard logistic distribution has a closed form expression and a shape notably similar to the normal distribution. Logit models have been used widely in several fields, including medicine, biology, psychology, economics, insurance, politics, etc. Recent applications of the linear logit specification in statistics in sports are [13,14] in basketball, [15,16] for football, among others.
Specifically, the logit is defined as follows. For observation t in a sample of size n, let , , a binary variable taking the value of 1 with probability
and 0 with probability , where is a vector of regression coefficients, which represents the effect of each variable in the model and it should be estimated. Finally, is a vector (explanatory variables) of known constants, including an intercept, the vector of covariates for the match t in our case. The regression is therefore modelled by assuming that , where F is the inverse of the standard logistic cumulative function (link function). Recall that the probability density function of the standard logistic distribution is symmetric about 0. In summary, the logit specification adopts the following form:
Thus, the likelihood is given by
where is a symmetric function with respect to zero. The parameters are usually estimated by the maximum likelihood method. In this way, the model gives the probability of each visiting team winning. The next step is to take into consideration a cut-off for determining whether a match will end with an away victory or not. The classical logit (frequentist approach) model is implemented in most of the standard statistical packages as Mathematica (Champaign, IL, USA), STATA (Texas, TX, USA) and R (Vienna, Austria), among others. We have estimated the basic logit model using STATA 14.1 econometric software.
2.2. Bayesian Estimation
In contrast to the frequentist approach, the Bayesian approach has gained a lot of popularity in the last decades. In the past, the main motivation for using the standard logit regression model was basically by computational effort. Software for implementing other methodologies became widely available in the last few decades due to the advances in computational sciences. From the pioneering work of [17] (first published in 1971), the applications of Bayesian methodology in econometrics theory have increased considerably.
In the Bayesian approach, the parameters are considered to be random variables assuming non-informative and centered normal prior distributions, making the comparisons with classical results easy. The Bayesian methods use the data and the prior knowledge to obtain the estimations and these results usually are more accurate than those derived under classical methods.
Bayesian inference for logit studies satisfies the standard mechanism in Bayesian analysis consisting of the likelihood function of the data, the prior distribution over the unknown parameters and the use of the Bayes theorem to compute the posterior distribution of the parameters.
The set of unknown parameters is represented by the vector . Thus, the logit Bayesian model can be specified as follows:
where is the prior distribution of . The selection of the prior distribution can involve informative prior distributions if the researcher knows something about the parameters, or non-informative prior if there is little information about these coefficients. A problem arises when informative prior distributions are chosen: the information must be given on the logit scale, i.e., on the parameters directly.
We suppose as it is usual that the parameters of the logit models follows a normal distribution, , , where is zero, and is usually chosen to be large enough to be considered as non-informative.
By combining the prior assumption with the likelihood in (2), we obtain the posterior distribution for the parameters , which is proportional to
Multiple integration for calculating the marginal distribution is required because it does not have a closed-form expression. The literature at this respect uses a Gibbs sampler as implemented by WinBUGS to obtain approximately the properties of the marginal posterior distributions for each parameter. WinBUGS (1.4, Cambridge, UK), the MS Windows operating system version of BUGS: Bayesian Analysis Using Gibbs Sampling, is a flexible software program that carries out Markov chain Monte Carlo (MCMC) simulations for a broad diversity of Bayesian models (WinBUGS was developed jointly by the Medical Research Council Biostatistics Unit (University of Cambridge, UK) and the Imperial College School of Medicine at St. Mary’s, London; see [18]).
2.3. Bayesian Asymmetric Estimation
The use of a symmetric link function as developed in the frequentist and Bayesian logit specification models above is recommended for binary response data in which the frequency of both responses are similar. If one response is much more frequent than the other, an asymmetric link is preferable.
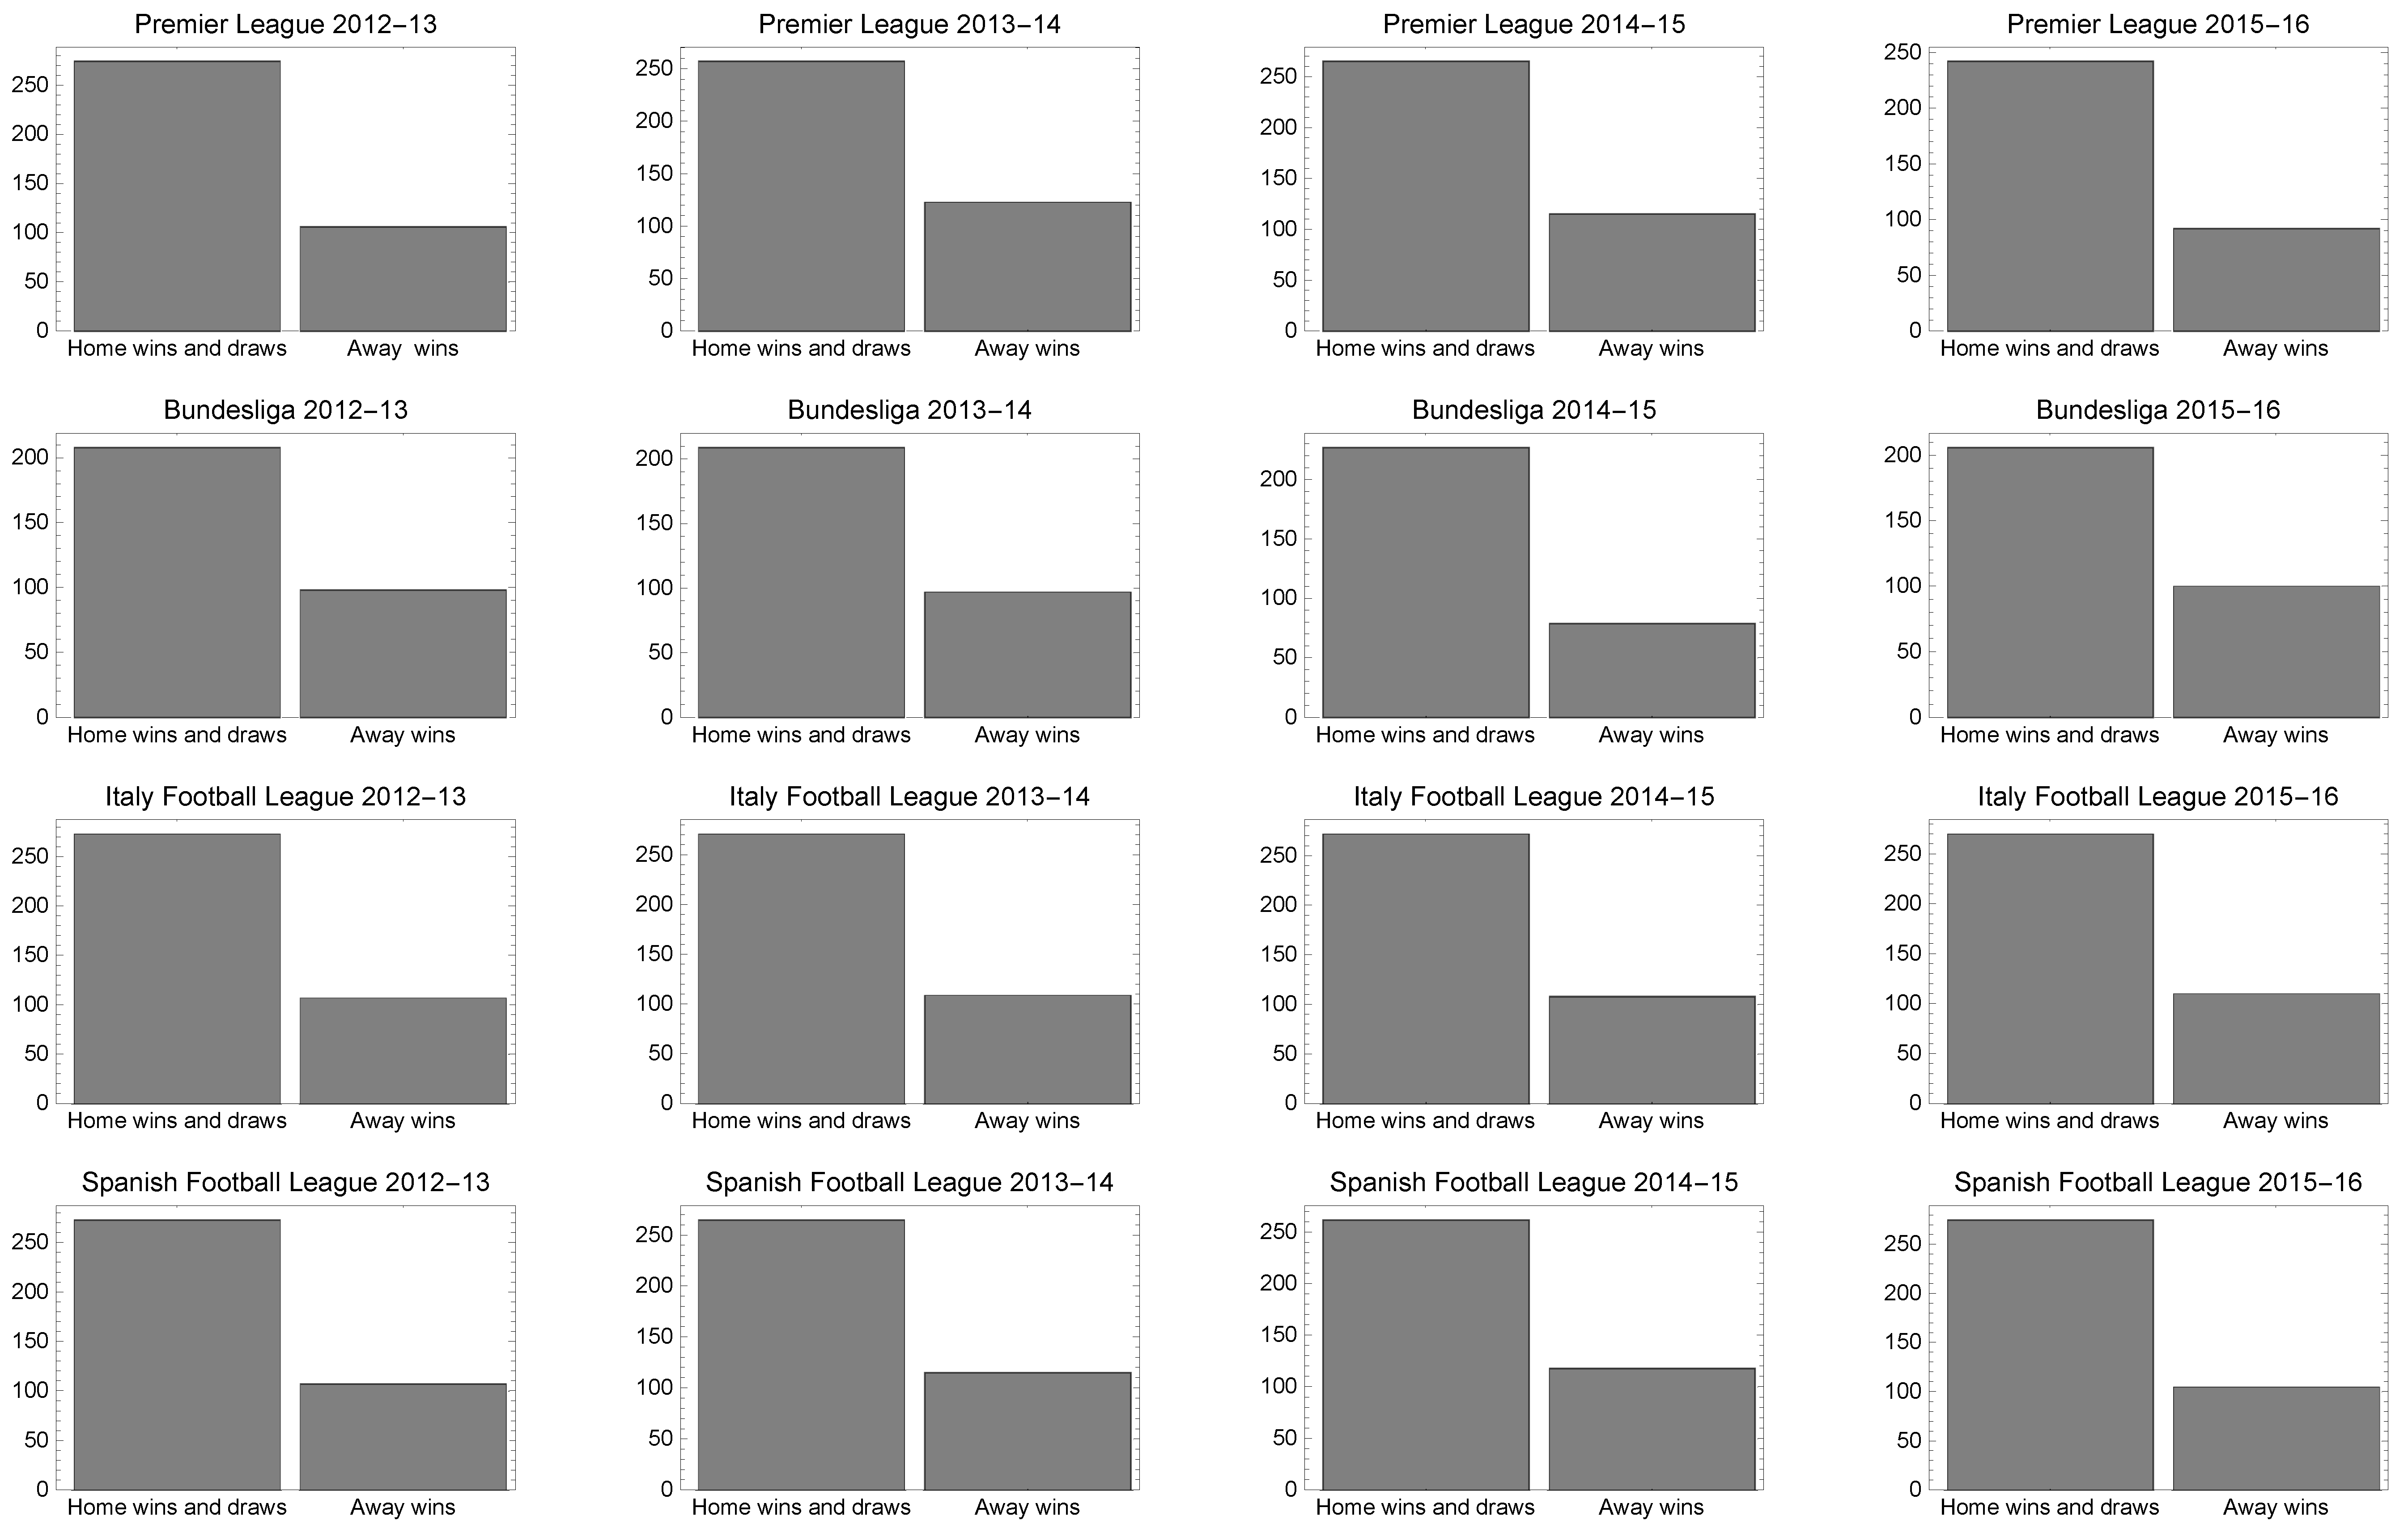
Figure 2 shows the home victories and draws versus the away victories in the four most important European football leagues from the 2012–2013 to 2015–2016 seasons. It can be seen that the 0 (home victory and draw) response is much more frequent than the 1 (away victory) and therefore an asymmetric link function is preferable in order to explain the conditional probability . In this case, application of the above classical models can lead to model misspecification, a misinterpretation of the marginal effects and unidentified predictors.
A commonly adopted asymmetric link function is the complementary loglog link function, which has a fixed negative skewness and therefore does not have the possibility to incorporate positive skewness. Several attempts to overcome this problem appear in the statistical literature. Some of them are [8,19,20], among others.
The model proposed by [20] includes the complementary log–log link and the probit models. However, Stukel’s models yield improper posterior distributions under an improper uniform prior for (see [8] for details). From the asymmetric point of view, [8,21] considered a procedure based on data augmentation supposing that
where . The parameter is the skewness coefficient and so the asymmetry of the logistic model is estimated by . If , the probability of , the probability that the tth match ends with an away victory, increases. On the other hand, if , the probability of ending with a draw or a defeat of the visiting team increases.
The new Bayesian asymmetric logit model can be written as follows:
where is a bivariate prior distribution for . The symmetric logistic model (3)–(4) is just a particular case of model (6)–(7) when there is no skewness ().
We assume that and are independent and that F and G are the standard logistic and half-standard normal cumulative distribution functions, respectively. The last one is given by ,
Likelihood function is given by
Again, we assume that the prior distribution of the parameters is normal and non-informative. Thus, , and , supposing , and are sufficiently large, pointing out the absence of prior knowledge about the parameters of interest and facilitating the comparison with the classical model. The values of the variances considered are , and .
The posterior distribution for the and parameters is proportional to
where
Again, we use WinBUGS to solve in an approximate way the properties of the marginal posterior distributions for each parameter.
3. Description of Database
This paper analyses 380 matches played in the First Division of the Spanish Football League, La Liga, during the season 2013–2014 in order to analyse the factors that might have affected the probability of winning an away match. We consider four sets of variables: those related to the game statistics (HS, AS, AF, HC, AC, HY, AY, HR and AR), a game variable we term DERBY, non-sports variables (BUDH and BUDA) and those associated with the referee (INTERNATIONAL and ACIENT). This dataset and others may be downloaded from [22]. These variables were chosen by applying the Bayesian model averaging (BMA) tool from 262,144 competing models and after testing the absence of collinearity under the variance inflation factor (VIF) criterion.
The variables included in the game statistics category were HS and AS, the total shots of the home and visiting teams, respectively; AF, representing the fouls committed by the visiting team; HC and AC, the number of corners for each team; and, finally, yellow or red cards shown to the home or visiting teams, HY, AY, HR and AR. There is one game variable, DERBY, which takes the value 1 when the match is played between teams from the same region or city, or between the strongest teams in the competition, and 0 otherwise. The non-sports variables, BUDH and BUDA, represent the budgets of the home and visiting teams. Finally, the variables related to the referee: the international experience, INTERNATIONAL, which was scored as 1 if he had such experience, and 0, otherwise; and the number of years of experience in the first division, ACIENT.
A brief description of these variables is shown in Table 1.
4. Empirical Results
In this section, we check that the non-informative Bayesian symmetric and the frequentist estimations of the logistic model provide similar results in terms of fit and coefficient estimates. Then, we compare these estimations with those obtained by the Bayesian asymmetric logistic model and we observe that this last model improves the overall fitting and detects new relevant variables. To evaluate the quality of fitting, we propose three different measures: the percentage of correct fittings calculated by considering the estimates probabilities; the Akaike information criterion (AIC) defined as ; and the deviance information criterion (DIC), given by . Here, are the estimated parameters obtained usually by maximum likelihood estimation. Both statistics measure the relative quality of statistical models for a given set of data. The idea is that models with smaller AIC and DIC should be preferred to models with larger AIC and DIC. See [23,24] for details.
We estimate the above-mentioned probability for match t as
for the Bayesian symmetric and the frequentist logistic models, and
for the Bayesian asymmetric logistic model.
The posterior distributions for Bayesian models were simulated using WinBUGS. A total of 500,000 iterations were carried out (after a burn-in period of 100,000 simulations). Three different chains were carried out and the convergence was evaluated for all parameters using tests provided within the WinBUGS Convergence Diagnostics and Output Analysis (CODA) software. The source codes of Bayesian estimations are available upon request from the authors.
The results of estimating the frequentist and the non-informative symmetric Bayesian models are shown in Table 2. In the light of these results, the following significant variables regarding the game statistics and non-sports variables were obtained: shots of the visiting team and red cards shown to the home team, AS and HR; and the home and away budgets, BUDH and BUDA. In relation to the signs of the coefficients, they were positive except for the BUDH, which means that the expectation of winning an away match decreases with the home team’s budget. It seems coherent under the idea that the higher the budget of the local team, the lower the probability of victory for the visitor. The high level of significance that the red cards shown to the home team have in the victory of the visiting team should be noted. The results are similar for both models because the prior information is non-informative in the Bayesian estimation. However, using the Bayesian approach, a new variable arises, INTERNATIONAL, which implies that, if the referee has international experience, the expectation of the victory of the visiting team increases, i.e., non international referees decrease the probability of winning for visiting teams.
The results for estimating the Bayesian asymmetric logit model are also shown in Table 2. We observe that the estimated coefficients differ considerably from those of the previous models, although the signs remain the same. This difference is further accentuated in the estimation of the constant. In the symmetric models, the estimated constant may contain part of the asymmetry effect made apparent in the asymmetric model. It may be seen that the new estimation, using the asymmetric Bayesian approach, improves the results, which is strengthened with the values of the AIC and DIC.
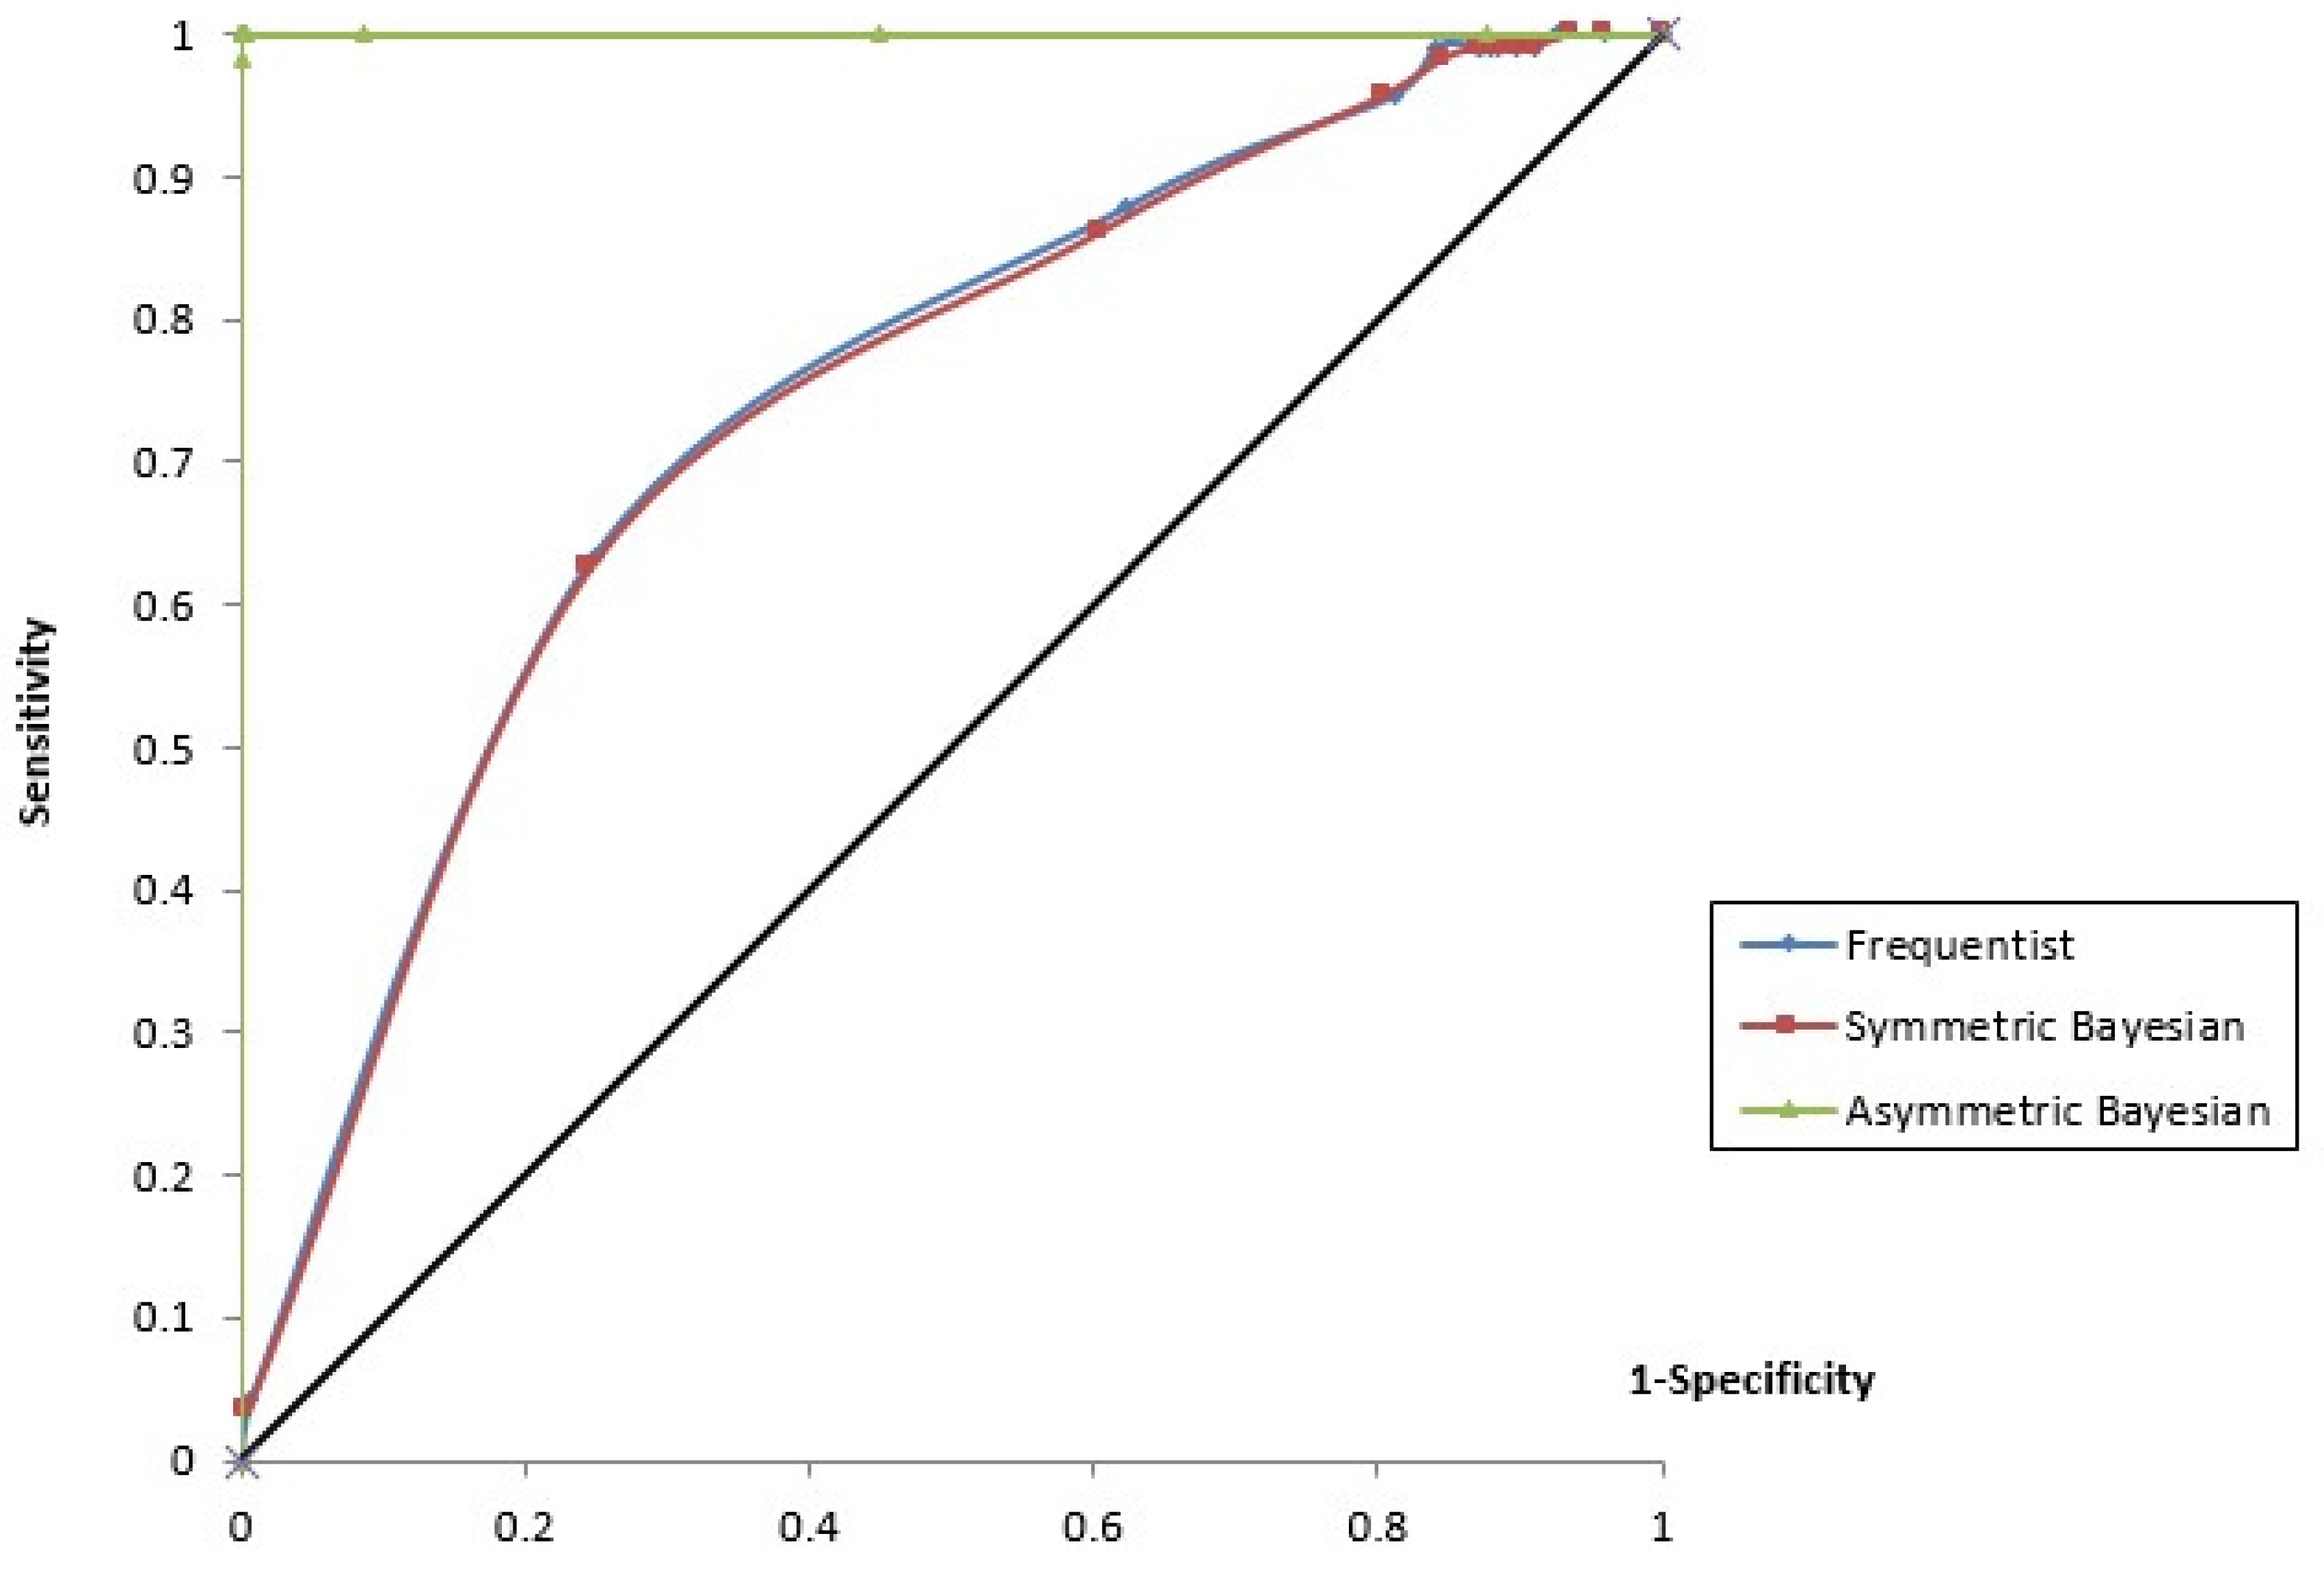
The percentage of correct fittings and the results of the AIC and DIC criteria appear at the bottom of Table 2. For our database, we obtained an AIC of 433.553 and a DIC of 403.553 for the frequentist logit model, an AIC of 449.0 and a DIC of 434.096 for the symmetric Bayesian logit model and an AIC of 82.56 and a DIC of 99.95 for the asymmetric Bayesian logit model. This table also shows that the accuracy, i.e., the proportions of victories and non-victories (defaults or draws) that were correctly classified by the models, is around 73.68% for the frequentist model (corresponding to 40 away victories and 240 away defeats or draws) and 71.58% for the symmetric Bayesian model (corresponding to 72 away victories and 200 away defeats or draws). The threshold probabilities used to fit an away victory was the sample frequency of victories, 0.302. As we can observe, the Bayesian symmetric model fits the away victories better but the away draws and defeats worse. Nevertheless, the best result is taken from the asymmetric Bayesian logit estimation, which fits 100% of the away victories. Obviously, these results are explained by the increase in the probability of fitting the cases induced by the asymmetric model, since was negative. Figure 3 shows the receiver operating characteristic (ROC) curve for the frequentist, symmetric and asymmetric Bayesian models. The c-statistics are 0.725 for the frequentist model, 0.722 for the symmetric Bayesian model and 1 for the asymmetric Bayesian model.
Table 3 shows the results obtained by the restricted models, i.e., the models including only the significant variables obtained in the previous estimations. These results remark the robustness of the estimations obtained in Table 2. The signs, significant levels and percentages of correct fitting remain stable.
5. Conclusions
In this paper, we use a novel econometric methodology to increase the available quantitative mechanisms, the asymmetric logistic regression. In binary response data, the application of a skewed link function is suggested when one category is much more recurrent than the other, as it is usually the case in football datasets, where the away victories response is much less frequent than the home victories and draws responses.
Specifically, we present the asymmetric logistic regression to study the impact of the main factors on the probability of winning an away match. To our knowledge, this tool has not been applied in football studies. Through this new methodology, the model detects new relevant factors to explain the away victories of the football teams that have not been detected by the standard methodologies. In this way, the team staff would have a potential tool to replicate matches more efficiently considering these important factors and estimating the probability of winning. The results lead to the consideration of practical recommendations on coach’s decision-making such as, for instance, playing strategically as visitors or taking the initiative in attacking what favours shouting on goal, or forcing the rivals playing hard to be issued with red cards. It seems clear that if coaches want to improve teams’ performances, they should behave in such a way whereby the management of the available resources allows them to maximize the winning probability of their teams by paying special attention to these key factors.
Taking all of these results into account, it is clear that the asymmetry has to be included into the logit model. As future research lines, panel data including random effects for a database of several seasons can be used, keeping in mind the asymmetric link. Future studies might also be addressed to predict the probability of the away victories in the next period (season), considering the asymmetric information to improve the quality of this prediction.
Author Contributions
All the authors contributed equally to the work.
Funding
J.M.P.S. and E.G.D. were supported by the Ministerio de Economía, Industria y Competitividad, Agencia Estatal de Investigación (Project ECO2017-85577-P).
Acknowledgments
The authors thank the three anonymous reviewers for the detailed comments and suggestions made.
Conflicts of Interest
The authors declare no conflict of interest.
References
- Del Corral, J.; Prieto-Rodríguez, J.; Simmons, R. The effect of incentives on sabotage: The case of Spanish football. J. Sports Econ. 2010, 11, 243–260. [Google Scholar] [CrossRef]
- Halicioglu, F. The impact of football point systems of the competitive balance: evidence from some European football leagues. Rivista di Dritto ed Economia dello Sport 2006, 2, 67–76. [Google Scholar]
- Haugen, K. Point score systems and competitive imbalance in professional soccer. J. Sports Econ. 2008, 9, 191–210. [Google Scholar] [CrossRef]
- Brocas, I.; Carrillo, J. Do the ”three-point victory” and ”golden goal” rules make soccer more exciting? J. Sports Econ. 2004, 5, 169–185. [Google Scholar] [CrossRef]
- Dilger, A.; Geyer, H. Are three points for a win really better than two? a comparison of german soccer league and cup games. J. Sports Econ. 2009, 10, 305–318. [Google Scholar] [CrossRef]
- Guedes, J.; Machado, F. Changing rewards in contests: Has the three-point rule brought more offense to soccer? Empir. Econ. 2002, 27, 607–630. [Google Scholar] [CrossRef]
- Hon, L.; Parinduri, R. Does the three-point rule make soccer more exciting? evidence from a regression discontinuity design. J. Sports Econ. 2016, 17, 377–395. [Google Scholar] [CrossRef]
- Chen, M.; Dey, D.; Shao, Q. A new skewed link model for dichotomous quantal response data. J. Am. Statist. Assoc. 2013, 94, 1172–1186. [Google Scholar] [CrossRef]
- Bermúdez, L.; Pérez-Sánchez, J.; Ayuso, M.; Gómez-Déniz, E.; Vázquez-Polo, F. A bayesian dichotomous model with asymmetric link for fraud in insurance. Insur. Math. Econ. 2008, 42, 779–786. [Google Scholar] [CrossRef]
- Sáez, A.; Olmo-Jiménez, M.; Pérez, J.; Negrín, M.; Arcos, A.; Díaz, J. Bayesian analysis of nosocomial infection risk and length of stay in a department of general and digestive surgery. Value Health 2010, 13, 431–439. [Google Scholar] [CrossRef] [PubMed]
- Pérez-Sánchez, J.; Negrín-Hernández, M.; García-García, C.; Gómez-Déniz, E. Bayesian asymmetric logit model for detecting risk factors in motor ratemaking. Astin Bull. 2014, 44, 445–457. [Google Scholar] [CrossRef]
- Weisberg, S. Applied Linear Regression; John Wiley & Sons, Inc.: Hoboken, NJ, USA, 2005. [Google Scholar]
- Gómez, M.; Lorenzo, A.; Ibáñez, S.; Sampaio, J. Ball possession effectiveness in men’s and women’s elite basketball according to situational variables in different game periods. J. Sports Sci. 2013, 31, 1578–1587. [Google Scholar] [CrossRef] [PubMed] [Green Version]
- Sánchez, J.; Castellanos, P.; Dopico, J. The winning production function: Empirical evidence from Spanish basketball. Eur. Sport Manag. Q. 2007, 7, 283–300. [Google Scholar] [CrossRef]
- Alves, A.; de Mello, J.S.; Ramos, T.; Sant’Anna, A. Logit models for the probability of winning football games. Pesqui. Oper. 2011, 31, 459–465. [Google Scholar] [CrossRef] [Green Version]
- Chinwe, I.; Enoch, N. An improved prediction system for football a match result. J. Eng. 2014, 4, 12–20. [Google Scholar] [CrossRef]
- Zellner, A. An Introduction to Bayesian Inference in Econometrics; John Wiley & Sons, Inc.: Hoboken, NJ, USA, 1996. [Google Scholar]
- Lunn, D.; Thomas, A.; Best, N.; Spiegelhalter, D. Winbugs: A Bayesian modelling framework: Concepts, structure, and extensibility. Stat. Comput. 2000, 10, 325–337. [Google Scholar] [CrossRef]
- Jiang, X.; Dey, D.K.; Prunier, R.; Wilson, A.; Holsinger, K.E. A new class of flexible link functions with applications to species co-occurrence in cape floristic region. Ann. App. Stat. 2013, 7, 2180–2204. [Google Scholar] [CrossRef]
- Stukel, T. Generalized logistic model. J. Am. Statist. Assoc. 1988, 183, 426–431. [Google Scholar] [CrossRef]
- Albert, J.; Chib, S. Bayesian residual analysis for binary response regression models. Biometrika 1995, 82, 747–769. [Google Scholar] [CrossRef] [Green Version]
- Football-Data. Available online: http://www.football-data.co.uk/data.php (accessed on 10 April 2018).
- Akaike, H. A new look at the statistical model identification. IEEE Trans. Autom. Control 1974, 19, 716–723. [Google Scholar] [CrossRef]
- Spiegelhalter, D.; Best, N.; Carlin, B.; van der Linde, A. Bayesian measures of model complexity and fit (with discussion). J. R. Stat. Soc. Ser. B 2002, 64, 583–639. [Google Scholar] [CrossRef]
Figure 1.
Away victories in four of the most important European football leagues from 1993–1994 to 2015–2016 seasons.
Figure 1.
Away victories in four of the most important European football leagues from 1993–1994 to 2015–2016 seasons.

Figure 2.
Home victories and draws versus away victories in four of the most important European football leagues from the 2012–2013 to 2015–2016 seasons.
Figure 2.
Home victories and draws versus away victories in four of the most important European football leagues from the 2012–2013 to 2015–2016 seasons.

Figure 3.
ROC curves for the models considered.


Table 1.
Variables used in the study.
| Variable Name | Description |
|---|---|
| Game statistics | |
| HS | Home team shots. |
| AS | Away team shots. |
| AF | Fouls committed by the away team. |
| HC | Corners in favour of the home team. |
| AC | Corners in favour of the away team. |
| HY | Yellow cards shown to the home team. |
| AY | Yellow cards shown to the away team. |
| HR | Red cards shown to the home team. |
| AR | Red cards shown to the away team. |
| Game variable | |
| DERBY | Match played between teams from the same city or region or between the strongest teams in the league. |
| Extra games | |
| BUDH | Home team budget |
| BUDA | Away team budget |
| Referee | |
| INTERNATIONAL | International experience |
| ACIENT | Years of experience in the first division |
Table 2.
Frequentist, Bayesian and asymmetric Bayesian logit estimation results in the full models.
| Variables | Frequentist | Bayesian | Asymmetric Bayesian | ||||||
|---|---|---|---|---|---|---|---|---|---|
| Robust Sd | p -Value | Sd | MC Error | Sd | MC Error | ||||
| Intercept | −2.417 *** | 0.929 | 0.009 | −1.313 *** | 0.504 | 0.000 | 12.58 *** | 1.343 | 0.009 |
| HS | 0.006 | 0.031 | 0.836 | 0.006 | 0.031 | 0.000 | 0.020 | 1.343 | 0.0009 |
| AS | 0.051 * | 0.030 | 0.100 | 0.052 * | 0.030 | 0.000 | 0.592 *** | 1.532 | 0.014 |
| AF | 0.025 | 0.033 | 0.450 | 0.026 | 0.033 | 0.000 | 0.256 | 1.187 | 0.008 |
| HC | 0.055 | 0.054 | 0.306 | 0.058 | 0.056 | 0.000 | 0.284 | 1.075 | 0.007 |
| AC | −0.047 | 0.052 | 0.364 | -0.050 | 0.055 | 0.000 | −0.200 | 1.215 | 0.009 |
| HY | 0.034 | 0.098 | 0.730 | 0.034 | 0.098 | 0.000 | 0.417 | 1.135 | 0.007 |
| AY | −0.032 | 0.097 | 0.738 | −0.034 | 0.103 | 0.000 | 0.306 | 1.054 | 0.007 |
| HR | 1.390 *** | 0.326 | 0.000 | 1.460 *** | 0.342 | 0.000 | 15.417 *** | 1.765 | 0.020 |
| AR | −0.418 | 0.439 | 0.341 | −0.459 | 0.482 | 0.000 | −0.981 | 0.912 | 0.005 |
| DERBY | −0.026 | 0.324 | 0.936 | −0.035 | 0.354 | 0.000 | −0.206 | 3.246 | 0.024 |
| BUDH | −0.004 ** | 0.001 | 0.012 | −0.004 ** | 0.001 | 0.000 | −0.024 *** | 1.353 | 0.012 |
| BUDA | 0.003 *** | 0.0009 | 0.001 | 0.003 *** | 0.0009 | 0.000 | 0.035 *** | 1.897 | 0.020 |
| INTERNATIONAL | 0.369 | 0.276 | 0.182 | 0.389 * | 0.282 | 0.000 | 3.139 * | 2.345 | 0.024 |
| ACIENT | 0.001 | 0.031 | 0.968 | 0.001 | 0.031 | 0.000 | 0.042 | 1.294 | 0.009 |
| −35.03 *** | 6.488 | 0.1034 | |||||||
| AIC | 433.553 | 449.000 | 82.56 | ||||||
| DIC | 403.553 | 434.096 | 99.95 | ||||||
| % Correct Fitting | 73.68 | 71.58 | 100 | ||||||
| indicates 1% significance or relevance level | |||||||||
| indicates 5% significance or relevance level | |||||||||
| indicates 10% significance or relevance level | |||||||||
Table 3.
Frequentist, Bayesian and asymmetric Bayesian logit estimation results in the restricted models.
Table 3.
Frequentist, Bayesian and asymmetric Bayesian logit estimation results in the restricted models.
| Variables | Frequentist | Bayesian | Asymmetric Bayesian | ||||||
|---|---|---|---|---|---|---|---|---|---|
| Robust Sd | p -Value | Sd | MC Error | Sd | MC Error | ||||
| Intercept | −0.985 *** | 0.131 | 0.000 | −1.231 *** | 0.225 | 0.000 | 11.55 *** | 2.859 | 0.131 |
| AS | 0.158 | 0.131 | 0.227 | 0.156 | 0.135 | 0.000 | 2.63 *** | 1.381 | 0.039 |
| HR | 0.494 *** | 0.115 | 0.000 | 0.517 *** | 0.115 | 0.000 | 5.542 *** | 1.763 | 0.063 |
| BUDH | −0.578 ** | 0.228 | 0.011 | −0.641 *** | 0.23 | 0.000 | −3.119 *** | 0.992 | 0.030 |
| BUDA | 0.409 *** | 0.127 | 0.001 | 0.423 *** | 0.126 | 0.000 | 4.571 *** | 1.79 | 0.057 |
| INTERNATIONAL | 0.327 | 0.262 | 0.000 | 2.715 * | 2.13 | 0.06 | |||
| −33.19 *** | 7.125 | 0.335 | |||||||
| AIC | 420.119 | 426.7 | 67.43 | ||||||
| DIC | 410.119 | 420.75 | 108.105 | ||||||
| % Correct Fitting | 72.89 | 70 | 100 | ||||||
| indicates 1% significance or relevance level | |||||||||
| indicates 5% significance or relevance level | |||||||||
| indicates 10% significance or relevance level | |||||||||
© 2018 by the authors. Licensee MDPI, Basel, Switzerland. This article is an open access article distributed under the terms and conditions of the Creative Commons Attribution (CC BY) license (http://creativecommons.org/licenses/by/4.0/).
Share and Cite
MDPI and ACS Style
Pérez–Sánchez, J.M.; Gómez–Déniz, E.; Dávila–Cárdenes, N. A Comparative Study of Logistic Models Using an Asymmetric Link: Modelling the Away Victories in Football. Symmetry 2018, 10, 224. https://doi.org/10.3390/sym10060224
AMA Style
Pérez–Sánchez JM, Gómez–Déniz E, Dávila–Cárdenes N. A Comparative Study of Logistic Models Using an Asymmetric Link: Modelling the Away Victories in Football. Symmetry. 2018; 10(6):224. https://doi.org/10.3390/sym10060224
Chicago/Turabian StylePérez–Sánchez, José María, Emilio Gómez–Déniz, and Nancy Dávila–Cárdenes. 2018. "A Comparative Study of Logistic Models Using an Asymmetric Link: Modelling the Away Victories in Football" Symmetry 10, no. 6: 224. https://doi.org/10.3390/sym10060224
Note that from the first issue of 2016, this journal uses article numbers instead of page numbers. See further details here.