Article

Investigations of Laser Produced Plasmas Generated by Laser Ablation on Geomaterials. Experimental and Theoretical Aspects

1
Faculty of Physics, LOA-SL, Alexandru Ioan Cuza University of Iasi, Iasi 700506, Romania
2
Institute for Laser, Plasma and Radiation Physics, Bucharest 077125, Romania
3
Faculty of Materials Science and Engineering, “Gh. Asachi” Technical University from Iasi, Iasi 700050, Romania
4
Department of Geology, Babes-Bolyai University, Cluj-Napoca 400084, Romania
5
Integrated Center for Studies in Environmental Science for North-East Region (CERNESIM), Alexandru Ioan Cuza University of Iasi, Iasi 700506, Romania
6
Department of Physics, “Gh. Asachi” Technical University of Iasi, Iasi 700050, Romania
7
Romanian Scientists Academy, Bucharest 050094, Romania
*
Author to whom correspondence should be addressed.
Symmetry 2019, 11(11), 1391; https://doi.org/10.3390/sym11111391
Submission received: 21 October 2019 / Revised: 4 November 2019 / Accepted: 7 November 2019 / Published: 9 November 2019
(This article belongs to the Special Issue Advances in Laser Produced Plasmas Research)

Abstract

:
Several surface investigation techniques, such as X-ray diffraction (XRD), EDX, and optical microscopy, were employed in order to describe the mineral contents in several geomaterials. Space and time resolved optical emission spectroscopy was implemented to analyze the plasma generated by the laser–geomaterial interaction. The values of the plasma parameters (velocity and temperature) were discussed with respect to the nature of the minerals composing the geomaterials and the morphological structure of the samples. Correlations were found between the excitation temperatures of the atomic and ionic species of the plasmas and the presence of calcite in the samples. A mathematical model was built to describe the dynamics in ablation plasma using various mathematical operational procedures: multi structuring of the ablation plasma by means of the fractal analysis and synchronizations of the ablation plasma entities through SL (2R) type group invariance and in a particular case, through self-modulation in the form of Stoler type transformations. Since Stoler type transformations are implied in general, in the charge creation and annihilation processes, then the SL (2R) type group invariance become fundamental in the description of ablation plasma dynamics.

Graphical Abstract

1. Introduction

One of the new emerging applications of laser ablation is laser-induced breakdown spectroscopy (LIBS) with implementation in environmental science, space applications or food industry [1]. LIBS can analyze a wide range of samples spanning from metals, semiconductors, glasses, biological tissues, plastics, soils, and plants, to thin layer paint coatings or electronic materials [2]. From the perspective of analyzing geo-materials [3] this technique has its advantages: Fast to no preparation of samples which also means no special sample preparation skills are required, potential for in situ analysis, small sample size requirements, the samples can be in a solid [3], liquid or gas state [4], and sensitive to light elements as H, Be, Li, B, C, N, O, Na, and Mg [5]. Successful applications of the LIBS technique to the analysis of range of metallic targets (aluminum alloys, iron-based alloys, copper-based alloy, precious alloys) and a summary of good practices were discussed in the works of Palleski et al. [6]. The performance of such a technique is strongly dependent on the complex processes involved during plasma formation and expansion, as the study object for LIBS is the strong emitting laser induced plasmas. As such differential absorption by the material and by the particle vapor, or the matrix effect [7] can strongly affect the properties of the resultant plasma (usually confined to a few mm from the sample and expanding with high velocities). The matrix effect issues are shown to be overcome by different sample preparation techniques (i.e., in the form of pressed pelletized powder [8] or, with much better results, fused glass), however these are breaking on the main advantage of LIBS—reduced time consuming sample preparation—which is lost and the operational costs are higher due to the special equipment needed. The implementation of LIBS technique on soils needs also to consider the influences of compression force, moisture, and total content of easily ionized elements on line intensities and electron density were studied and because dramatic changes occur, the recommendations were to use dry samples as much as possible and observe plasma as early it can be done in order to minimize the matrix effects on results [9].
In case of qualitative elemental analysis and to simultaneous deal with the complexity of data, statistical methods like partial least squares discriminant analysis [10,11] (PLSDA) are used to obtain information about unknown samples.
The practicality of the technique is often shown in the little preparation of the diagnostics apparatus itself with approaches like calibration free LIBS (CF-LIBS) [1] which manages to produce closer values than Monte Carlo simulated annealing optimization method (MC-LIBS) [12] with respect to a standard measurement. Aside their many advantages there are still some important drawbacks to this approach, mainly the need for accurate plasma parameters of the investigated area. Real experimental conditions have proven a deviation from ideal conditions (optically thin, in LTE and spatio–temporal homogenous). Therefore, errors are introduced by experimental aberrations and inaccuracy of spectral data, and it was found that they are contributing to the overall uncertainty on the quantitative results more than theoretical parameters (inaccuracy of measurements of detector spectral efficiency weighs more on the results than a typical uncertainty in the electron density value) [13]. As the LIBS shifts to non-ideal plasmas, one major issue is self-absorption in thick plasmas in CF-LIBS, this phenomenon was investigated, and correction procedures were developed to ensure the reliability of results. A recursive algorithm was created to consider the non-linear self-absorption effects occurring in the plasma and this extended the range of application of the CF-LIBS method [14].
For CF-LIBS the presence of local thermodynamic equilibrium (LTE) is imperative as such estimation of electron density and plasma temperature, have a huge impact on the overall result, especially with strong heterogeneity in the ratio of the emitted lines. A special attention needs to be given to Boltzmann plot method implemented for each composing element, which for complex minerals and geomaterials can be an arduous job, thus the need of combining different types of investigations for both accurate plasma parameter determination and elemental identification. Data fusions of LIBS results with complementary methods of analysis like Raman and reflectance spectroscopy, X-Ray fluorescence were performed on iron ore, and remote sensing instrument suite was integrated in the Mars 2020 Rover [11]. There are other approaches like LIBS as quantitative analysis for materials located relatively far away from the LASER source. This requirement comes mandatory when dealing with potentially dangerous or out of reach radioactive or extraterrestrial materials. Mineral discrimination can also be performed with the help of PLSDA statistical method [11].
Another domain of actual and acute interest is the detection of explosive residues using LIBS in standoff mode of operation. Organic and inorganic explosive residues placed up to 30 meters behind transparent barriers (polymethylmethacrylate and glasses) were successfully detected without false positives with 8 shots as long as the laser beam energy can go through the barrier and part of the plasma light can be collected [15].
In this work we use a combinatorial plasma diagnosis approach in order to expand the quantity of information provided by LIBS. The approaches are used for mineral identification purposes, with the aim here, being the investigations of the relationships between plasma parameters in terms of temperature and velocity, and the nature of minerals. For this purpose, four geomaterials previously collected from various locations within the Northern Hemisphere were analyzed. For all minerals we implemented step-by-step investigation methods that expanded from polarized light microscopy, EDX spectroscopy and X-Ray Diffraction Spectroscopy. The techniques allowed the identification of the composing minerals and offered information about the heterogeneity of the investigated samples. Finally, the samples were irradiated with high power ns beams, and the light emitted from the laser induced plasma was investigated through space-and time-resolved investigation techniques. The complementary investigation methods used here, aid us in founding a strong possible correlation between parameters like excitation temperature or expansion velocity with the abundance of calcite structure. Also, a mathematical model to describe the ablation plasma dynamics using various mathematical operational procedures (fractal analysis, group invariance, differentiable geometry in Lobacewski, etc.) is built. From such a perspective the SL (2R) type group invariance can become fundamental in describing complex phenomena in laser ablation plasmas.

2. Materials and Methods

2.1. Samples Details

Coordinates of the places from where the samples were collected are given below along with the potential expectations in terms of composition, structure, and formation, information taken from the literature review. This cannot reflect or aspire to fully describe our particular samples but will provide a sense of perspective to each subsequent analysis. As most of the investigated geomaterials are found to present a wide range of minerals which could characterize an entire geographical area it becomes important not only to know the structure of our samples but also to get information on an entire family of rocks that could possibly be found in the vicinity of our collected samples.
Sample #1—the collected sample was taken from Petra, Jordan [16], Coordinates: 30°20’11.8” N 35°25’59.3” E. Petra area is located in the Western Jordan, in a large rift valley which extend from Gulf of Aqaba, northwards along the Wadi Araba to the Dead Sea and the Jordan Valley. The sample from Petra is assigned to the Umm Ishrin Formation, part of a larger sequence called the Ram Group of Cambrian age. The sediments are deposited on the igneous, crystalline basement rock formed during the Precambrian that are exposed in the mountains outside the rift valley. Red Cambrian sandstones are about 300 m thick [16]. The Umm Ishrin Formation consists of medium-to-coarse-grained, well to moderately sorted, poorly cemented quartz arenites, with minor amounts of siltstone and mudstone [17,18]. The color is generally reddish brown, with hues of red, orange, yellow and white, due to the presence of iron oxides, mainly limonite. The mineralogical composition of red sandstones consists mainly of quartz (up to 95%), and then, in small amounts, feldspar and micas [18,19]. It is considered to be of fluvial origin [19].
Sample #2—the collected sample was from Bowen Island, British Columbia, Canada (42°46’50.9” N 0°27’22.7” W). Bowen Island is located on the west flank of the Coast range batholith of British Columbia, at the junction of Howe Sound and the Gulf of Georgia. The rocks from Bowen Island are of igneous origin, of an extrusive and intrusive nature. In the main, the rocks consist of a volcanic assemblage of great thickness, made up of flows, breccias, agglomerates and tuffaceous sediments cut by basic porphyry dykes [20]. Most of the rocks from the island belong to the Bowen Island Group of Lower Jurassic age [21], consisting of mafic to intermediate volcanic rocks (basalts and andesite) formed as lavas, shallow intrusions, volcanic ash deposits, interbedded with volcanoclastic sandstone, siliceous argillite, chert and tuff, and intruded by sills and shallow level intrusions. Because they are resistant to erosion, they can form prominent hills. The volcanic formation is deformed and form tight east trending folds, being intruded by granodiorite and monzonite of Middle and Late Jurassic age [22]. On the eastern part of Bowen Island, where the sample was collected, massive meta-basalt flows and sills, and andesitic feldspar porphyry intrusions are found [22]. On Bowen Island, dark green, fine-grained andesites are composed of albitized plagioclase and hornblende, variably altered to opaque minerals, epidote, and calcite. These rocks are locally interbedded with thinly laminated to massive fine-grained siliceous tuff [17]. The volcanic sequence and Jurassic structures are cut by a north-trending quartz feldspar porphyry stock of rhyodacite composition.
Sample #3—the collected sample was taken from a reddish formation near Pico Anayet [18], 2575 m, Pyrenees, Spain (42°46’50.9” N 0°27’22.7” W). The Anayet Massif is an E–W axis mountain range located in the central segment of the Pyrenean axial zone (northern Spain), displaying an extensive sedimentary record of Stephanian–Permian deposits. This large outcrop of late-hercynian materials is surrounded by Devonian slates, Lower Carboniferous greywackes, and several types of pyroclastic rocks (deformed during the Hercynian orogeny). The Permian deposits are represented by several thousand meter-thick series of continental sediments, volcanoclastic and volcanic sediments [23]. The continental detrital deposits between Stephanian and Lower Triassic have been described as post-Hercynian molasses [23]. These deposits have been classically divided in four main detrital groups, mainly composed of arenites (sandstones), conglomerates and lutites, with three basic volcanic episodes interbedded [24].
Sample #4—the collected sample was taken from the top of Pico Collarada, 2886 m, Pyrenees, Spain (42°42’51.88” N, 0°28’14.81” W). The analyzed sample was collected from the Pyrenees Mountains area, about 17 km north of Jaca (Spain). The Pyrenean orogenic belt resulted from the collision between the Iberian and the European plates from Late Cretaceous to Miocene times. The Pyrenees consists of an Axial Zone, composed of Paleozoic rocks—granitoids and metamorphic rocks, bounded by the North Pyrenean and South Pyrenean zones, where Mesozoic and Cenozoic rocks—clastic and carbonate rocks, are found [25]. The Paleogene sequence from the southern side of the Pyrenean orogen consists of Paleocene to Eocene light-coloured massive limestones, turbidites (Lower–Middle Eocene flysch) and coastal, non-marine deposits [26] (Upper Eocene–Lower Oligocene molasse). The turbidite systems (Lutetian) are built up by a succession of sandstones and mudstones including carbonate megaturbidites [27].

2.2. Characterization Methods

X-ray diffraction (XRD) analyses were performed using a Bruker D8 Advance diffractometer equipped with a Cu Kα anticathode. The XRD spectra were recorded from 5° to 65° 2θ degree (40 kV, 40 mA). The ICDD Database PDF-2/Release 2012 was used to specify the values of the reflection peaks. Optical microscopy analyses were performed on a Zeiss AxioLab microscope. A scanning electron microscope model Vega LMH II–Tescan®, coupled with an EDX detector, model Quantax QX2-Bruker-Roentec® allowed the recording of the micrographic analyzed area and the spectrum in order to investigate the structure distribution and elemental composition. The EDX analyses were performed on an area of 1 mm2 for each sample. For an individual analysis and the determination of the standard deviation, 10 experiments were performed on each area of the experimental samples.
Optical emission spectroscopy analysis was performed using the experimental set up described in [28,29]. The second harmonic with λ = 532 nm of a 10 ns Nd: YAG pulsed laser beam (Brilliant EaZy) was focused by a f = 40 cm lens on the samples. The spot diameter at the impact point was around 700 µm while the laser fluence was 19 J/cm2. The samples were placed in a vacuum chamber where the pressure (5·10–2 Torr) was maintained using a 300 L/m dry scroll pump (Agilent TriScroll 300). The formation and dynamics of the plasma plume were studied by an intensified ICCD camera: PI-MAX3, 1024i with a gate time of 30 ns, placed orthogonal to the plasma expansion direction, coupled to a Princeton Instruments Acton 2750 monochromator (with a resolution of 0.2 nm). Two experimental approaches were considered: In the first one the overall emission of the plasma was studied by ICCD fast camera imaging (each image was averaged over 20 events) while in the second one the spectrally resolved emission was recorded (with each spectrum being averaged over 1000 events). For the later, a step-and-glue procedure was used to record the global emission spectra (gate width of 2 μs and a gate delay of 100 ns) in a 300–700 nm spectral range from a 600 μm wide plasma volume centered on the main expansion direction. The recording of each spectrum was preceded by the collection of the background noise and the subsequent subtraction of it from the data. During the experiments the targets were continuously moved to ensure fresh surfaces and to overcome the heterogeneity of the investigated rocks.

3. Results and Discussions

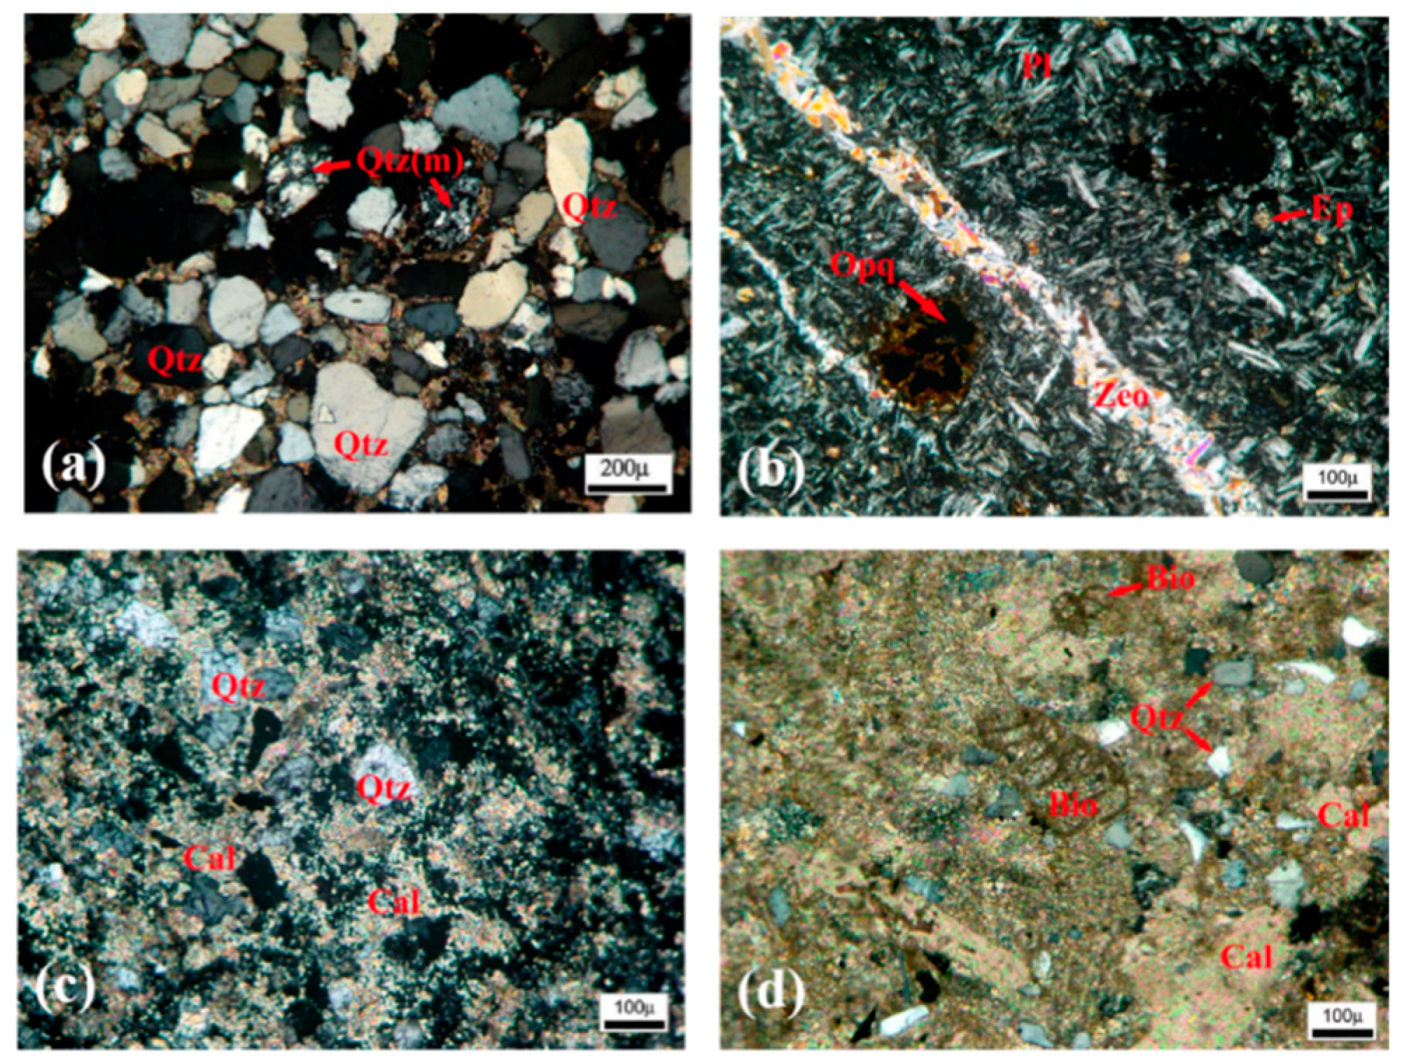
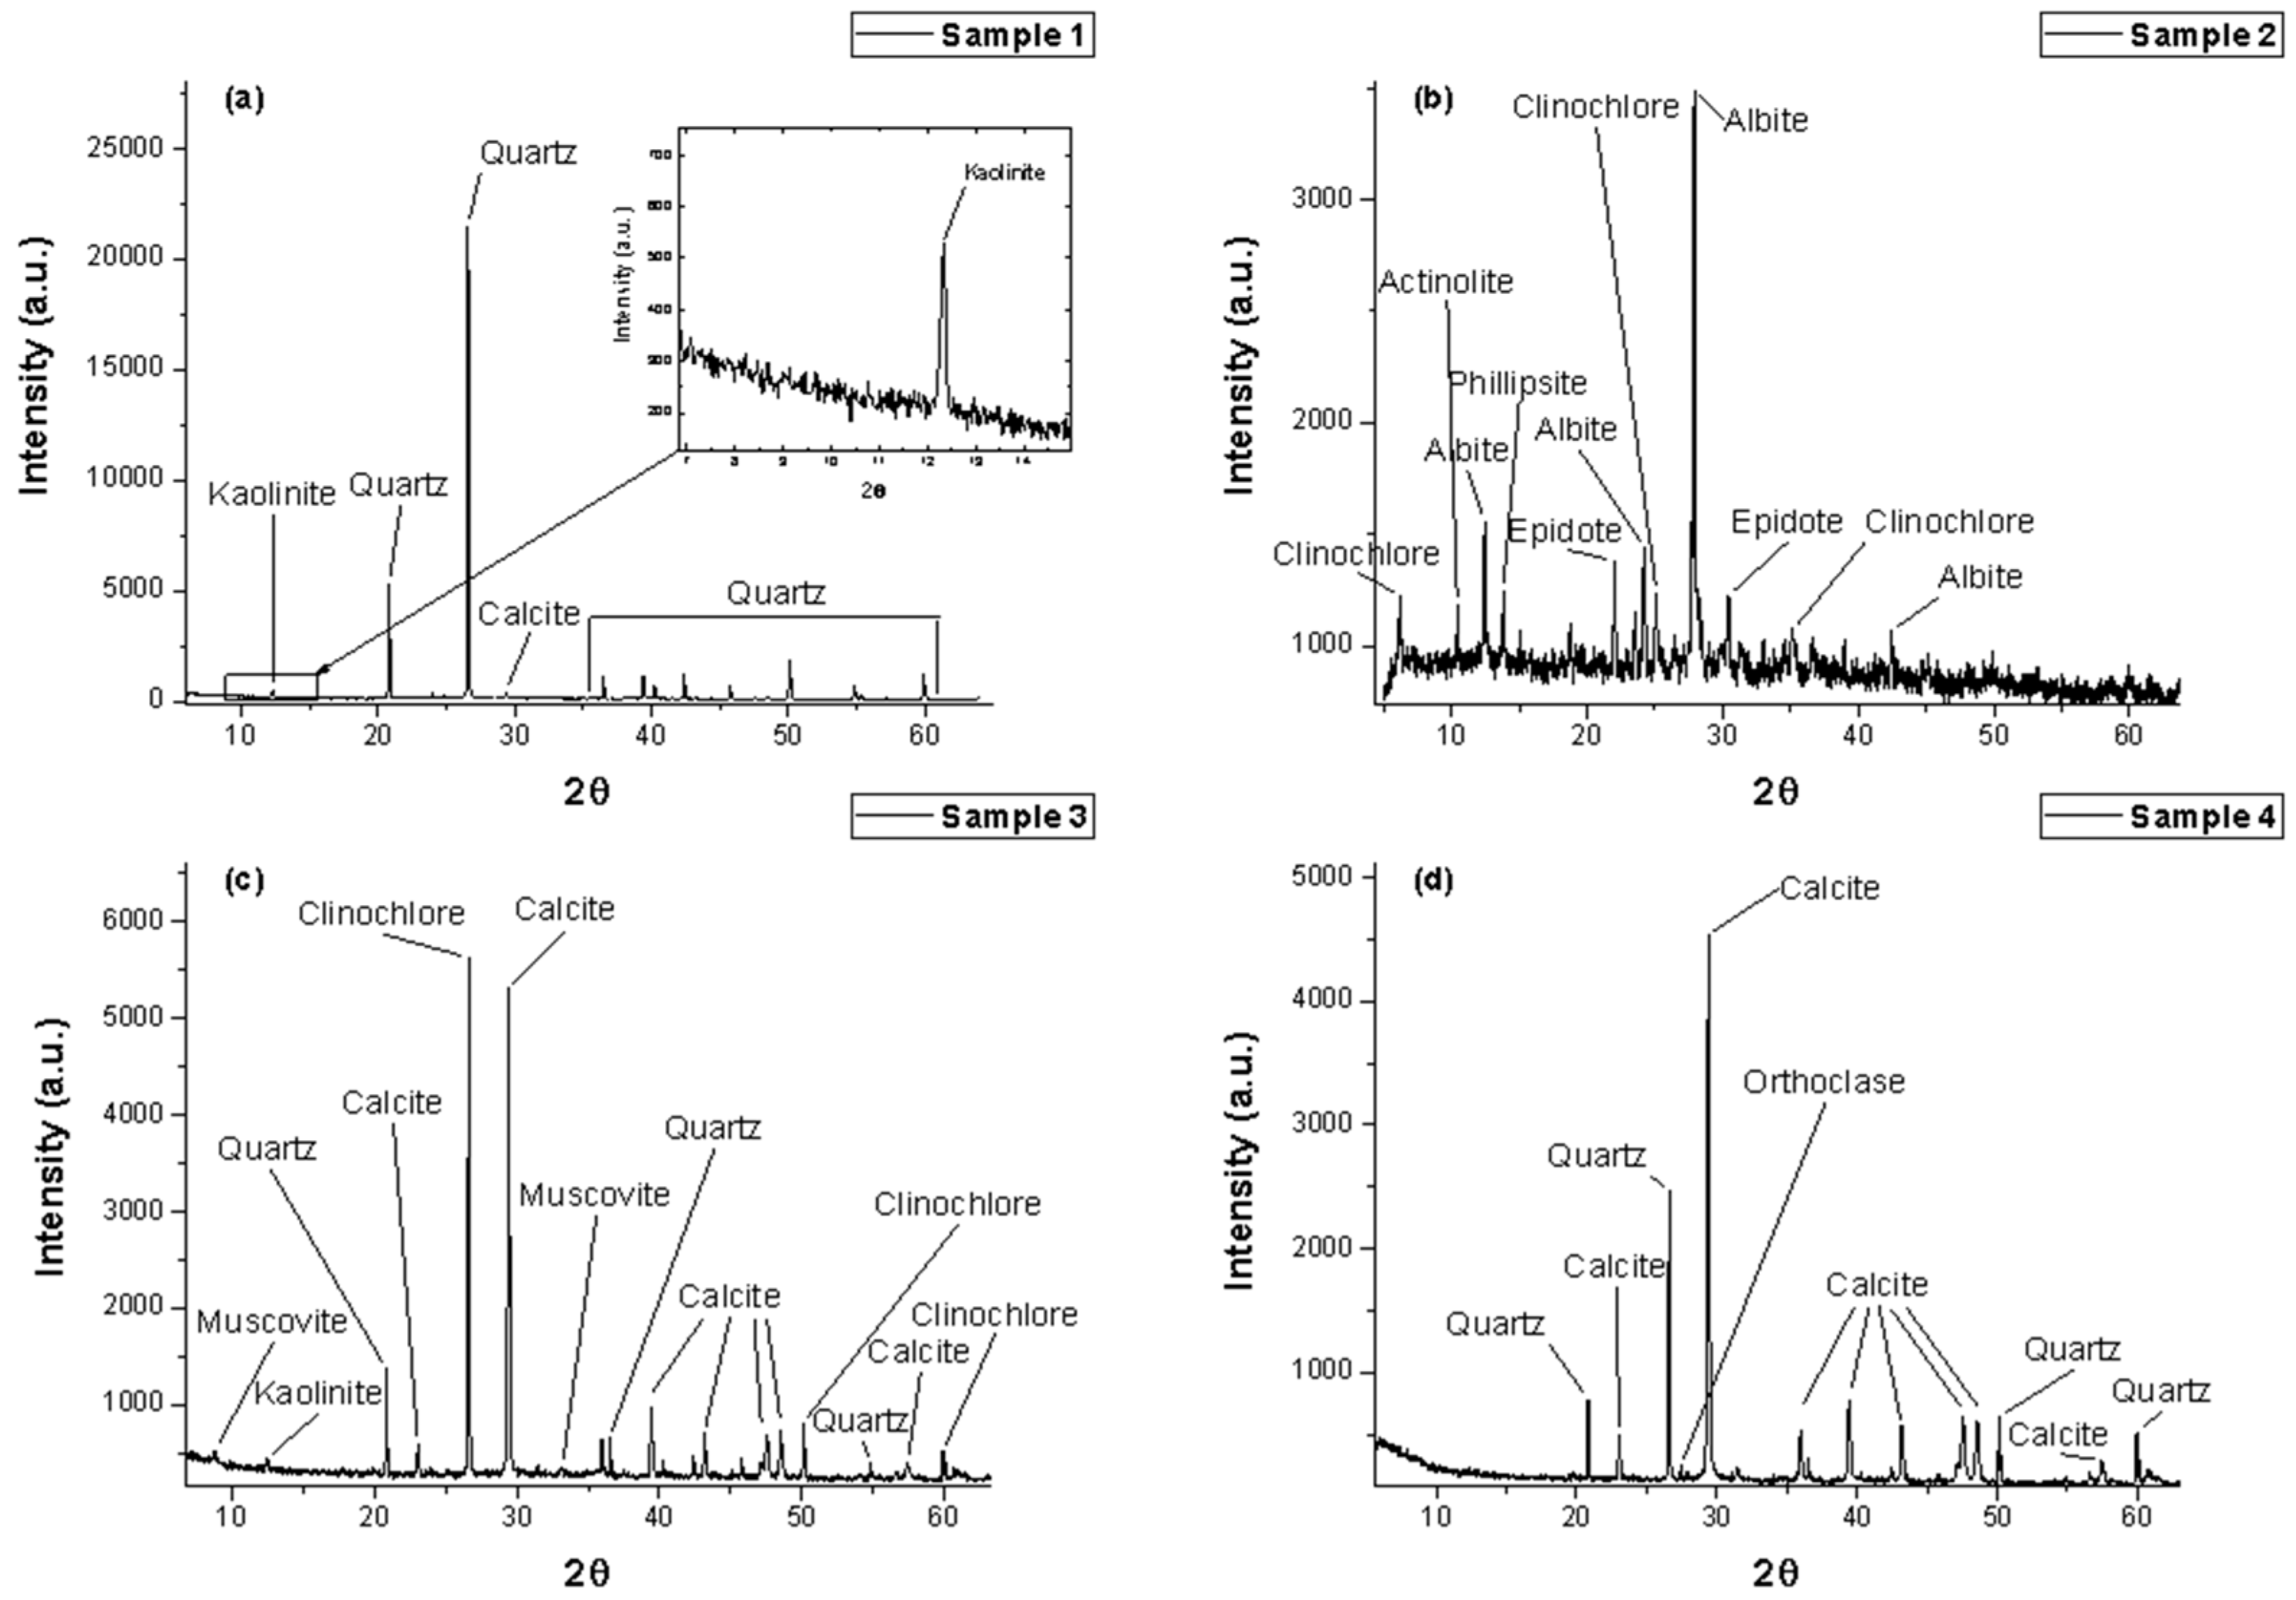
3.1. Structural Investigations

For the identification of individual minerals found in the four samples, a series of complementary surface techniques was considered. Optical microscopy in polarized light is a fast analyzing technique which can be used to identify the individual minerals of the rocks and offers a general idea about the heterogeneity of the surface which is one of the main factors that has to be considered before a technique like LIBS is implemented. The results of these investigations are presented in Figure 1a–d.
Sample #1 (Figure 1a) is identified as a sedimentary rock [16]—quartz sandstone—that contains sand-sized grains (0.063–2 mm). The quartz grains (SiO2) can be composed of single crystal or can be polycrystalline (fragments of quartzite—a metamorphic rock). All grains are moderately rounded. The carbonate cement (calcite—CaCO3) fills the spaces between the quartz granules. Some limonite (FeO(OH)·nH2O) staining can be observed, which causes the reddish color of the rock, the full picture is completed with some traces of Kaolinite (Al2Si2O5(OH)4) observed only on XRD (Figure 2a).
Sample #2 (Figure 1b) is a basalt (spilite), an extrusive igneous (volcanic) rock. Spilite is an igneous rock produced when basaltic lava reacts with seawater, or is formed by hydrothermal alteration when sea water circulates through hot volcanic rocks. Under the microscope, the sample rock is composed of phenocrysts of plagioclase and very rare relict pyroxenes in a fine-grained holocrystalline groundmass made up of plagioclases, epidote (Ca2(Fe3+, Al)3(SiO4)3(OH)), opaque minerals, and iron oxides/hydroxides. Different types of alteration can be observed: primary feldspar has been transformed into albite (NaAlSi3O8); pyroxenes and plagioclases have been replaced by other minerals such as epidote/zoisite (in thin sections, some “nests” of epidote/zoisite surrounded by a microlitic mass consists of the same minerals could be observed); secondary minerals as the result of alteration could be commonly chlorite (Mg5Al(AlSi3O10)(OH)8) and iron oxides/hydroxides (hematite, limonite). Cavities filled with secondary minerals (probably zeolites, phillipsite—[(K,Na,Ca)1-2(Si,Al)8O16·6H2O]) could be observed in thin sections. Actinolite (Ca2(Mg,Fe)5Si8O22(OH)2) (observed only on XRD, Figure 2b) is a secondary mineral as a fine-grained alteration product of pyroxene.
Sample #3 (Figure 1c) is a sandstone rock containing grains of detrital quartz (SiO2), embedded in a matrix of carbonates, clay minerals and iron oxides/hydroxides. Due to its reddish-brown color and its composition, the sample could be a sandstone (formed in a continental environment). X-ray diffraction analysis revealed the presence of mainly quartz and calcite (CaCO3), and small amounts of kaolinite (Al2(Si2O5)(OH)4), muscovite (KAl2(AlSi3O10)(OH)2), clinochlore (Mg5Al(AlSi3O10)(OH)8) (Figure 2c).
Sample #4 (Figure 1d) identified as extraclastic bioclastic limestone and could be described as a bioclastic grainstone. The extraclasts are represented mainly by angular–slightly rounded quartz and orthoclase (KAlSi3O8—potassium feldspar, Figure 1d) grains, with a micritic-microsparitic cement (calcite crystals are 5–10 μm in size). The fossil remnants consist mainly of foraminifera fragments (benthic and planktonic).
XRD measurements were performed on powders obtained from various areas of the samples. The obtained X-ray diffractograms are presented in Figure 2a–d and the identified crystalline structures are listed in Table 1. These results confirm the presence of the previously mentioned minerals in all samples. This confirmation allows us to have a better understanding of the interactions between the laser beam and the target and how the overall ablation process is affected by the presence of such wide spread of minerals.
The data base indicatives of the minerals which fit with the XRD peaks are shown in Table 1.
The chemical composition and distribution of the main elements were analyzed by EDX (Table 2). The results revealed the presence of metallic atoms in all samples which correspond to the elements found in the more complex minerals observed by XRD. However, for Sample #1, traces of Ti and Mg were noticed which can be considered as impurities due to the environment and natural conditions. Similar discussion can be made for all samples as all of them present a more heterogeneous distribution of elements on the surface.
Two of the most important elements in the earth’s crust are silicon (Si) and calcium (Ca), which are part of the various minerals (silicates, quartz, respectively calcite), so we focused on the concentrations of these two elements. From Table 2 it can be observed that Sample #2 contains the lowest concentrations of calcium (~6%) while Sample #3 contains the lowest concentration of Silicon (1%) and the highest concentration of calcium (~32%). Thus it is safe to assume that Sample #2 may contain very low concentration of calcite and Sample #3 contains low concentrations of silicates but high concentration of calcite. Sample #2 contains high concentrations of silicon (~18%), iron (~6.5%) and aluminum (~9%) which points to the inclusion of significant quantities of alumino-ferro-silicates.
For all investigated samples we performed an estimation analysis related to the micro porosity of the surface. We determined micro-porosities between 4 and 12% across all samples’ surfaces (Sample #1—12%, Sample #2—4.7% Sample #3—9.23%, Sample #4—4.9%). The porosity was determined over an average of 10 surfaces of 1 mm2, with the mention that throughout the surface of the samples the values of micro porosity were similar. These differences in the porosity of the targets could be expected to influence the values of the expansion velocities of the laser produced plasmas.

3.2. Optical Investigations of Laser Produced Plasmas

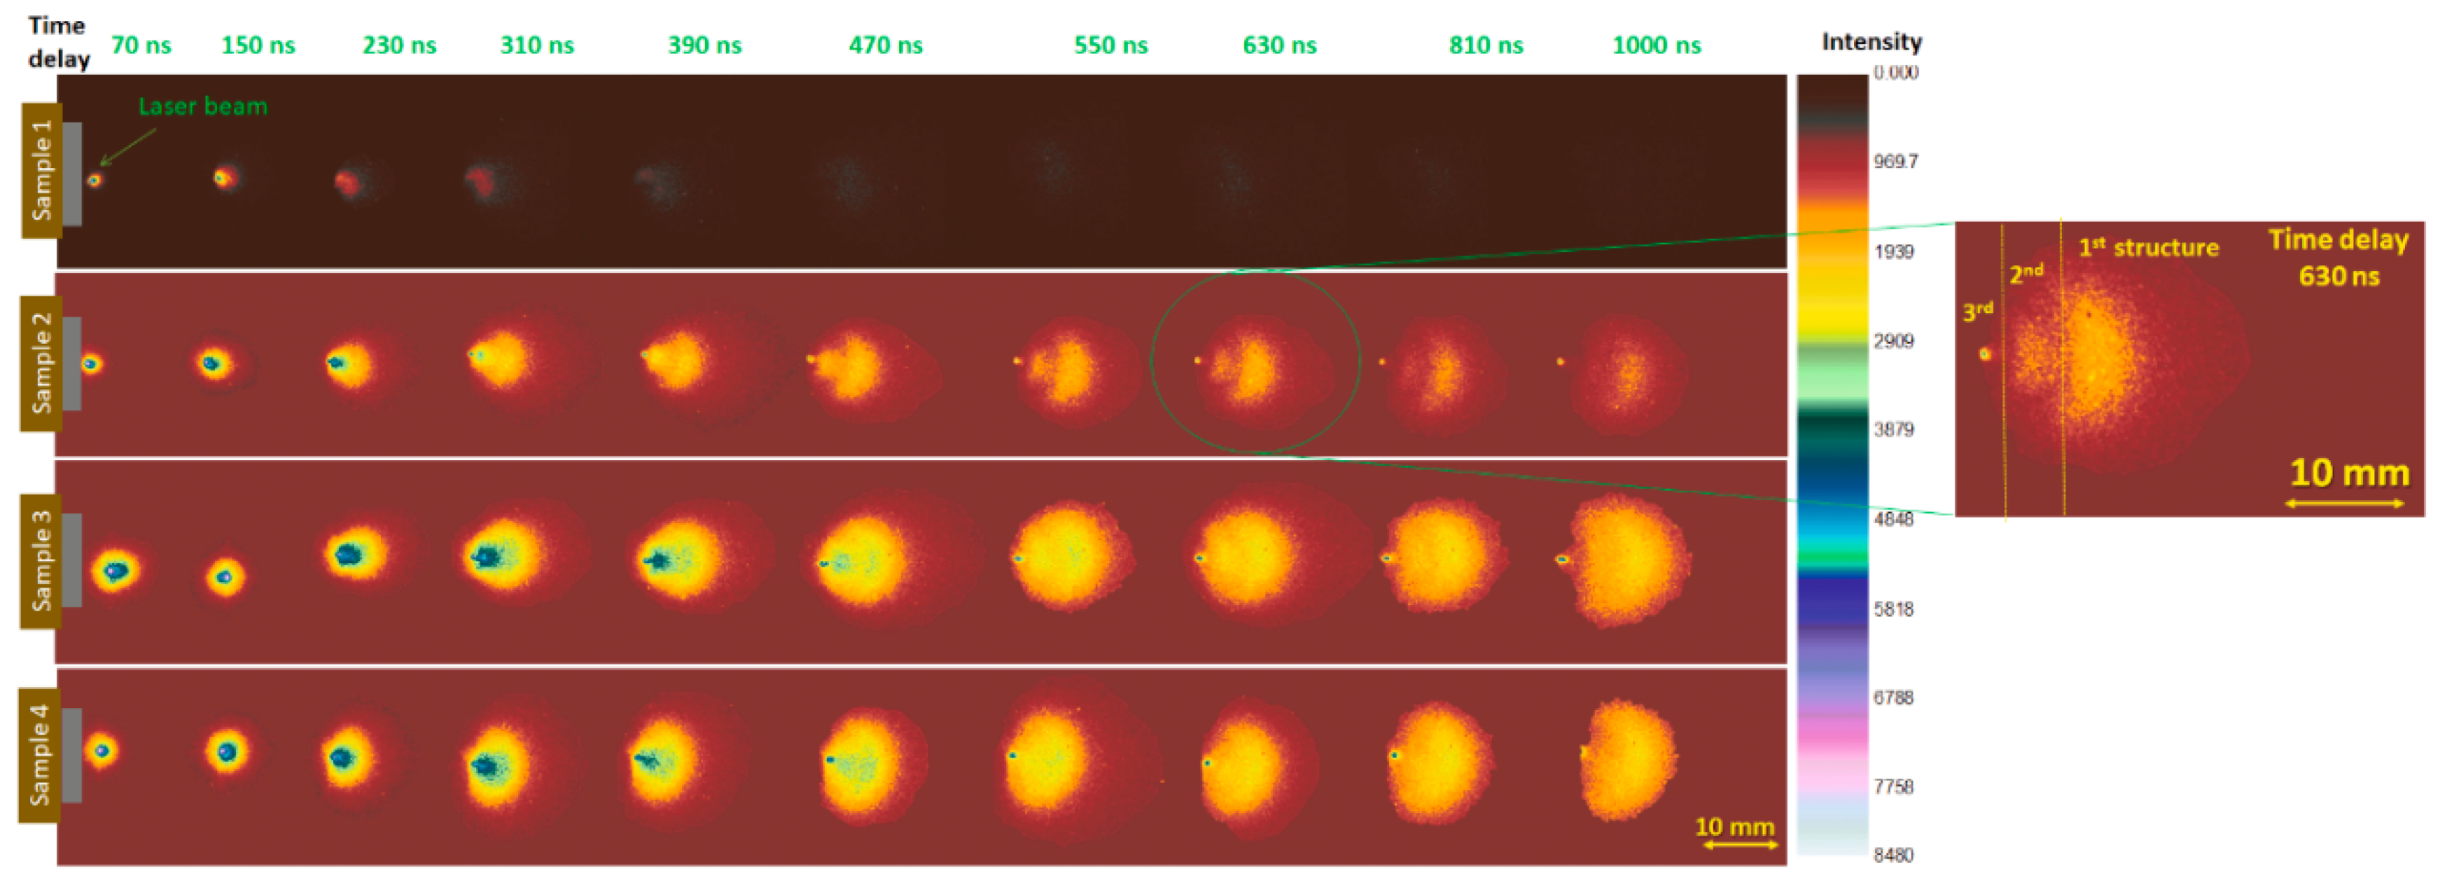
3.2.1. ICCD Fast Camera Imaging

When a laser beam impinges onto a surface the beam energy is absorbed by the target. For the case of homogenous materials, the energy is transferred to the electrons which are the first species ejected from the target by means of Coulomb explosion, while the rest of the target goes through various phase changes from solid–liquid–vapor, thus completing the ablated cloud which represents the object of study for LIBS. As expected for the case of our samples the beam energy will be absorbed differently by the various minerals presented in the target. These phenomena can lead to a complex ablation process which is harder to be analyzed than in the case of samples of single elements or even minerals.
The general LIBS technique is used for the identification of elements from a sample. More information (in terms of plume center-of-mass velocity and wave front dynamics) can be obtained by acquiring ICCD images at various delays. This approach was implemented in the study of simple [29] or complex targets [30], in controlled conditions.
The fast camera imaging is suitable for transient phenomena investigation. In the case of laser produced plasmas (LPP), it is necessary to have an adequate triggering system as LPP generally have a lifetime of a few μs [31]. Each recorded image is generally described by a series of parameters: resolution (which is given by the CCD detector and the optical system), time-delay (the moment of time, with respect to the trigger signal, at which acquiring starts), and the gate width (or integration time). In this case the initial moment (t = 0) is considered to be the “laser beam—target interaction moment”. In order to have a good temporal resolution the gate width is usually of a few ns and it can increase towards longer evolution time where the plume is more rarefied and the emission is weaker. After their recording the images are transferred to the computer where they can be further analyzed. In order to estimate the expansion velocities, bi-dimensional images (“snapshots”) of the laser-produced plasmas were recorded at constant laser fluence (19 J/cm2) at various moments in time with respect to the laser beam (Figure 3). During the expansion, the LPP increases its volume and the center-of-mass, estimated as the maximum emission intensity zone, shifts towards higher distances as the recording time is changed. This leads to the conclusion that the expansion velocity is constant during the whole lifetime of the plume.
The cross-section on the expansion direction of the recorded images (Figure 4) shows more clearly the presence of two maxima which were attributed to two plasma components [32]. Due to the difference in their expansion velocities, in literature they can be found as the fast structure (or the “first structure”) and slow structure (or the “second structure”) [30]. Each of the two plasma structures expands with constant, yet different velocities. The velocity of each structure was determined by distance over time representation of the maximum intensity characteristic to each structure, method in line with the theoretical view of the laser produced plasma expansion at low pressures. The constant nature of the expansion is given by the linearity, respect for all the investigated plasmas.
The plume splitting behavior has been experimentally reported by several groups [33,34] and it is considered as a result of the different ejection mechanisms involved in the ns-laser ablation process. Therefore, the first—fast structure of the plume is ascribed to the electrostatic ejection mechanism (Coulomb explosion), while the second—slow structure corresponds to the thermal mechanisms (phase explosion, explosive boiling, evaporation). Our results show the presence of a third plasma structure (inset Figure 3), for samples #2, #3, and #4, described by a small emission region in the proximity of the target. In literature this structure is attributed to the presence of clusters, nanoparticles or molecules and it has its origin in the Knudsen layer which is usually characterized by black body radiation [35,36,37]. The structures observed in this study can be compared to the structures observed in ablation on Ni, Al, stainless-steel [28,29] or more complex targets like GeSe chalcogenide glasses [30].
For the samples #1 and #2 the expansion velocities of the first structure of the order of tens of km/s (Sample #1—11 km/s, Sample #2—13.5 km/s) while for the second structure we found velocities the order of a few km/s (Sample #1—4 km/s and Sample #2—6.5 km/s).
Although the velocity of second structure of the plasma plume generated on Sample #3 and #4 is in line with the values of the previous samples (Sample #3—3 km/s and Sample #4—6 km/s), for the first structure we found relative low velocities (Sample #3—8 km/s and Sample #4—9 km/s) most probable related to the nature of the mineral in each sample which could enhance the thermal ablation mechanism in the detriment of the electrostatic ones. This aspect of the laser-produced plasma is consistent with other reported results on pure metals or other complex materials [30] and it is important for the LIBS techniques as the most part of the emission is given by this second thermalized structure. For the second structure, in the case of nanosecond laser ablation, the emission is enhanced by the absorption of the laser beam tail by the ejected particle cloud.
With respect to the expansion velocity values of the first and second plasma structures, the highest ones were found for the plasma generated on Sample #2 (Figure 5), the one that contains almost no Calcite. The lowest velocities were observed for the plasma plumes of Sample #3—the one that contains very low concentrations of Quartz. All the other plasmas (generated on sample with both Calcite and Quartz) were found to be expanding with intermediate velocities. We note however that no correlation was observed between the porosity of the target and the estimated velocities. Samples #2 and #4 presented similar porosities but strong differences in expansion velocities for each of the two plasma structures. A similar observation can be made for Samples #3 and #1 where for approximately similar porosities, consistent differences in the expansion velocities were observed.
A possible explanation for this behavior can result by analyzing the energy transfer during laser-target interaction. For samples where, strong bonds like C=O or Ca-O are present, more of the incident laser energy is used on breaking the bond, leading to some relatively slower plasmas. This is the case for Sample #1, #3, and #4. These differences can be seen as a signature of the petrographic origins of the investigated rocks: Sample #2 is part of the magmatic rock family, while the other three samples belong to the sedimentary family—Sample #1 and Sample #3 are sandstones while Sample #4 is a bioclastic limestone.

3.2.2. Optical Emission Spectroscopy

The Optical Emission Spectroscopy technique [38] can help to determine the nature of the ejected particles through the energetic levels by identifying the wavelength and by using specialized databases [39]. The profile and intensity of the spectral lines can also provide information regarding the interactions between the ejected particles (e.g., Stark broadening [40]) and the internal energy of the plasma (i.e., electron temperature and electron density). For the plasma generated on each target, the global emission spectra were collected using a gate width of 2 μs. The experimental configuration ensures the collection of 600 μm plasma slice centered on the main expansion direction, thus providing a global characteristic in both a spatial and temporal perspective. This was done in order to collect all the emission lines regardless of their flight time [31]. For each of the sample we have identified atomic and ionic species characteristic for Ca, Si, Al, Mg, C, and O. Samples #2 and #3 have revealed the presence of their elements like K, Cl or S (see Figure 6). Most of the emission lines correspond to the elements identified with the EDX and XRD techniques, as discussed in the previous section. Thus, a qualitative comparison can be done between the LIBS signal and the EDX measurements. We notice that the evolution trends observed from EDX follow the LIBS signal changes, as such the increase in Ca amount by a factor of 17 in the target would lead to an enhancement of the Ca line intensity by a factor of 19. For the case of Si, an increase by a factor of 26 would only lead to an increase of a factor of 6. Finally, for all the other elements which were fund in significant smaller amounts (such as Al or Fe) an 8 times higher concentration would lead to an increased emission lines intensity of approximately 8 times. We observe that although the ratio is not always kept, especially for Si or lighter elements like K, most of the elements follow the changes from the target. At this moment, a quantitative proportionality is difficult the be achieved between the LIBs signal and the EDX data, given the complex process involved in both investigation techniques. However, under LTE the LIBS line intensity depends on the concentration of neutrals and singly ionized species, which allow us to tentatively use a qualitative comparison between the two techniques.
Most if not all plasma diagnostics techniques are valid under the assumption of the presence of a local thermodynamic equilibrium (LTE). However, in the case of transient plasmas all the plasma parameters such as electron temperature and particle density have a steep decrease in both time and space and thus the equilibrium has to be understood in a dynamic mode. There are different approached to estimate the limit of LTE with the most common one being the McWhirter criterion [40]:
N e ( cm 1 ) 1.6 × 10 12 Δ E 3 ( e V ) T e 1 2 ( K )
The above relation provides a real threshold above which we can assume LTE and implement the investigation techniques to further determine the excitation temperatures. Particularly we found 1.23 × 1015 cm–3 for Sample #1, 1.5 × 1015 cm–3 for Sample #2, 1.25 × 1015 cm–3 for Sample #3 and finally 1.18 × 1015 cm–3 for Sample # 4.
Once established the limit for which LTE model can be applied, the electron density can be estimated from the Saha-Eggert equation [41]. The relationship connects the plasma ionization equilibrium temperature to the proportion of population of two successive ionization states:
n e = 4.83 10 15 I * g + A + λ * I + g * A * λ + T e 1.5 e V + + E + E * k B T e
where the (*, +) superscripts represent the neutral excited atom and the singly charged ion, respectively, I is the emission intensities of a spectral line of λ wavelength (nm), T is the ionization temperature (expressed in K), which is taken as the excitation temperature in LTE conditions, V+ is the first ionization potential, and E is the energy of the upper level of the transition. By implementing the Saha-Eggert equation we found a series of global ne values for our plasmas that characterizes the 600 μm wide plasma volume throughout its evolution: 1.5 × 1016 cm–3 for Sample #1, 5.5 × 1016 cm-3 for Sample #2, 8.2 × 1016 cm–3 for Sample #3 and respectively 1.6 × 1017 cm–3 for Sample #4. The electron density exceeds the LTE limit with about one order of magnitude, thus, within our experimental conditions of laser fluence, background pressure and acquisition parameters, all the investigated plasmas respect the McWhirter criterion for LTE.
The excitation temperature of the plasma can be simply calculated from [41] using the intensity ratio of two spectral lines characterizing the same species (ion or atom), with the specific spectroscopic data (E, A, f) can be found in various databases (e.g., [39]). We note however that there are some reserves regarding the latter parameters, which can lead to significant uncertainties. In order to minimize the errors regarding the values of the oscillator strengths, it is suitable to use not two but a series of atomic lines with different upper excitation levels. The Boltzmann plot method represents the logarithmic function of the line intensity versus the upper level energy:
ln ( I k i λ g k A k i ) = ln ( N 0 h c 4 π Z ( T ) ) E k k b T e
The slope of this representation will give the excitation temperature, and its linearity or the deviation from it can be considered as an indication of LTE validity (an example can be seen in Figure 7).
The values of the excitation temperature were found to be in a range of 0-1 eV for the atomic species (i.e., Ca in Sample #1-6264 K, Sample #2-9976 K, Sample #3-6496 K and Sample #4-5800 K) and of about one order of magnitude higher for the ions (i.e., Ca in Sample #1-39440 K, Sample #2-15080 K, Sample #3-32480 K and Sample #4-41760 K). These discrepancies were previously reported by our group in [30,42,43] were they were related to the differential heating of the plume by the incoming laser beam. However, in the LTE conditions we would expect that regardless of the nature of the atom/ion investigated the plasma temperature should have the same values. For all the investigated atoms the values of the temperatures are almost the same (within a 5% error margin), while for the ions the discrepancies are higher. For the identified metallic species (Fe, Al, Ti, Mg) in the plasmas we found electron temperature between 3480 K and 5800 K through all the investigated plasmas while for lighter elements like Ca, C, Si or K we found significantly increased temperature (from 6264 K for Ca up to 19,720 K for K). The excitation temperatures were found to be relatively close to the ones reported for laser produced plasmas on copper (13,200 K to 17,200 K) or lead (11,700 K to 15,300 K) [44], while for studies on a Silicon plasma [45] it was reported that the electron temperatures varied between 6000 K to 9000 K.
The plasmas generated on Sample #1, #3, and #4 (all sedimentary rocks) present the highest values for the excitation temperature for the ionic species of Ca and Si, with respect to the other investigated plasma. This is in line with the structure observed through EDX investigation, as all three targets have a significant larger concentration of Ca. The result also correlates well with the values of the expansion velocity of the first plasma structure, determined through ICCD fast camera imaging. On the other hand, the plume generated on Sample #2 (volcanic rock) presents the highest values for the neutral species, having the highest expansion velocity for the second plasma structure. In literature [30,42,43] the first plasma structure contains mainly ions, while the second and the third one contains mainly neutral species. This view over the nature of the plasma components it is also confirmed by our experimental results. The spectral investigations revealed that the temperature for the ionic Ca is much lower than the ones of ionic Ca for the other samples. This could be related to the nature of Sample #2—a magmatic rock that has almost no Calcite in it versus the other samples which are sandstones.
The experimental data showcased that the properties of the LPP strongly depend on the nature of the rocks. Nevertheless, the nature of the rocks includes multiple variables as composition of minerals, elemental composition of each mineral, physical properties of the rock resulted from the mechanisms of mineral formation across time which were addressed in our study by performing XRD and Optical microcopy. However, not only the quantity of Calcite microcrystals are directly responsible for low velocity plasma plumes as there are other aspects to be considered like porosity of the rock, degree of impurity on the sample, crystallinity, grain size, hardness, coherence, and moisture or reflectivity of the target. The state of the sample is one major aspect that needs to be considered in order to have a better control on the LIBS process. Thus, the extension towards quantitative analysis in terms of atomic or ionic temperature and expansion velocity becomes a strong tool in material investigations and understanding how the history of the target affects the laser matter interaction process and subsequently the LIBS technique.

4. Mathematical Model

4.1. Fractal Analysis

Ablation plasma behaves like a fractal medium taking into account the collision processes amongst the ejected particles. Indeed, between two successive collisions, the trajectories of the plasma particles are straight lines, that become nondifferentiable in their impact points. Considering that all the collision impact points are an uncountable set of point, it results that the trajectories of the plasma particles become continuous but non-differentiable curves (fractal curves). Since in these conditions the non-differentiability (fractality) appears as a fundamental property of the ablation plasma dynamics it seems necessary to construct a corresponding non-differentiable plasma physics model, for example in the form of fractal hydrodynamics model [46]. The mathematics behind this model as well as some applications of the model were development in a systematic manner by our group in [28,29,46,47]. In the following, a fractal analysis will prove a multi-structuring of the ablation plasma in the form of Coulomb, thermal and cluster structures. Let us consider the solutions for the fractal hydrodynamic equations system in the following form [48]:
V = V D + i V F = v 0 α 2 + ( λ α ) 2 x t α 2 + ( λ α ) 2 t 2 + i λ ( x v 0 t ) α 2 + ( λ α ) 2 t 2
ρ = 1 ( π ) 2 [ α 2 + ( λ α ) 2 t 2 ] 1 / 2 exp [ ( x v t ) α 2 + ( λ α ) 2 t 2 ]
λ = μ ( d t ) ( 2 D F 1 ) , i = 1
In Equations (1)–(3) x is the fractal space coordinated, t is the non-fractal temporal coordinate, having the role of an affine parameter of the movement curve, V is the complex velocity field, VD is the real component, independent on the scale resolution dt,
V F = λ ln ρ
is the imaginary component dependent on the scale resolution, ρ is the state density, µ is a coefficient associated to the fractal-non-fractal transition, V0 is the initial velocity, α is the Gaussian parameter characterizing the initial energy distribution and DF is the fractal dimension of the movement curves. For the fractal dimension we can choose and use either Kolmogorov relation, either Hausdorff–Besikovici relation etc. [49,50]. Once chosen it needs to be constant and arbitrary: DF < 2 for corelative processes, DF > 2 for non-corelative processes, etc. [49]. We would like to remind that through the variable x, t, V, ρ and through parameters: α, μ, dt, DF and V0 we will be able to showcase various dynamics of multiple ablation plasma structures.
The solutions (1) and (2) can be simplified through the normalizations:
x α = ξ ,   V 0 t α = τ ,   V D V D 0 = V ¯ D ,   V F V F 0 = V ¯ F ,   ρ ρ 0 = ρ ¯ ,   ( λ α V 0 ) = θ ,   V 0 = V D 0 ,   λ α = V F 0 ,   ρ 0 = 1 α π
Then V ¯ D ,   V ¯ F ,   ρ ¯ become:
V ¯ D = 1 + θ 2 ξ τ 1 + θ 2 τ 2
V ¯ F = θ ( ξ τ ) 1 + θ 2 τ 2
ρ ¯ = 1 ( 1 + θ 2 τ 2 ) 1 / 2 exp [ ( ξ τ ) 2 1 + θ 2 τ 2 ]
From Equations (5) and (7) the state current density at differentiable scale resolution takes the form:
J ¯ D = ρ ¯ V ¯ D = 1 + θ 2 ξ τ ( 1 + θ 2 τ 2 ) 3 / 2 exp [ ( ξ τ ) 2 1 + θ 2 τ 2 ]
while, the state current density at fractal scale resolution takes the form:
J ¯ F = ρ ¯ V ¯ F = θ ( ξ τ ) ( 1 + θ 2 τ 2 ) 3 / 2 exp [ ( ξ τ ) 2 1 + θ 2 τ 2 ]
During the expansion of a laser produced plasma we can identify three important moments (chronologically): The Coulomb explosion moment, the thermal ejection moment and the cluster formation moment. Each of these moments are defined by three different types of ejection mechanism which lead to the formation of three independent plasma structures [34,36,42,43]. In such a context the dynamics of fast plasma structure generated though Coulomb explosion mechanism would be described by relations (5), (7) and (8) while the dynamics of the slow structure generated through thermal ejection mechanisms are given by relations (6), (7) and (9). The reasoning behind this association is given by the fact that the nondifferentiable behavior of the laser ablation plasmas is induced through the collision process between the ejected particles in each plasma structure. In Figure 8 we have shown the 3D representation of states current density at differentiable and fractal resolution scale for different degrees of fractalizations, which is identified with the real particle density. With the increase of the fractalization degree we observe a change in the slope defining the velocity of the differentiable part of the current. This can be read as an increase in the thermal velocity of the particle as this component is induced by thermal mechanism. On the other hand, the particle current at a fractal resolution scale, induced by Coulomb mechanisms, will present two components. These components are generated by a double layer formed in the initial stages of ablation. The fractality degree has little contribution to the spatio–temporal evolution of this component, although at a higher resolution scale we observe a better separation between the two components of the current.
In order to describe the dynamics of the third substructure, containing mainly clusters and nanoparticles, we will postulate that the specific momentum at the global scale resolution is null. This means that at the differentiable scale resolution the velocity is equal and of opposite sign with the velocity at a fractal scale resolution.
V D = V F = λ ( d t ) ( 2 D F 1 ) x ( ln ρ )
In these conditions the conservation law of the state density:
t ρ + x x ( ρ V D ) = 0
takes the form of a fractal diffusion equation:
t ρ = λ ( d t ) ( 2 D F 1 ) x x ρ
The solution of this equations has the following expression [40]:
ρ ( x , t ) = a ( 4 π λ ( d t ) ( 2 D F 1 ) t ) 1 / 2 exp [ ( x b ) 2 4 λ ( d t ) ( 2 D F 1 ) t ]
where a and b are integrationn constant. In such a context the velocity takes the form:
v = x b 2 t
while the states current density is:
j = a ( x b ) ( 16 π λ ( d t ) ( 2 D F 1 ) ) 1 / 2 t 3 / 2 exp [ ( x b ) 2 4 λ ( d t ) ( 2 D F 1 ) t ]
Now, we calibrate the structure that contains mainly clusters with the dynamics of the other two structures in order to admin a normalization by imposing the restrictions: a ≡ 1 and b ≡ 0. We can find:
ρ ¯ = 1 ( 4 θ τ ) 1 / 2 exp [ ξ 2 4 θ τ ]
V ¯ = V D V 0 = ξ 2 τ
J ¯ = ξ ( 4 θ τ ) 1 / 2 τ 3 / 2 exp [ ξ 2 4 θ τ ]
In Figure 9 we have represented the 3D representation of current density for various degrees of fractalization depicted through θ. The three ranges of values were chosen for the fractalization degree in order to cover the full range of ablation mechanism seen experimentally: Coulomb explosion, thermal evaporation, and explosive boiling. The range of fractality degrees which are specific for each ablation mechanism were defined in our previous work. Here we confirm that the range remains constant regardless of the nature of the target.
In Figure 9 we see the space-time representation of the particle current density. The contour plot representation attached to the 3D representation shows that the maxima shifts during expansion. This behavior was seen experimentally through ICCD fast camera imagining (Figure 3). As the current maxima characteristic for each ablation mechanism shifts, it defines a unique slope which describes the expansion velocity of each structure. For the particles ejected through Coulomb explosions which are described by a low degree of fractalization a steep slope is defined and thus a high expansion velocity. The particles are mainly visible in the first moments of expansion. For those ejected through thermal mechanism we notice a different slope with a longer life-time and a bigger spatial expansion (characteristics of a reduced expansion velocity). The last structure is formed mainly by nanoparticles and clusters and it is defined by a high fractalization degree. We notice that the maximum of the particle current holds its value at small distances even for a long expansion time. This is a well-known trait of this complex structure. If we perform a small calculation by using the initial conditions of our experiments and impose them onto the fractal analysis we can estimate the expansion velocities of each plasma structure. We find for the first structure velocities of 18.7 km/s, for the second structure 2.5 km/s, while for the last structure 710 m/s. The results are in line with the values reported in literature. Thus, the fractal analysis is a robust one and can be implemented on a wide range plasma regardless the nature of targets.

4.2. Group Invariance Analysis

In the one-dimensional stationary case, the fractal hydrodynamic equation system becomes [48]:
x x u + k 0 2 u = 0
where
u = ρ 1 / 2 ,   k 0 2 = E 2 m 0 λ 2
E is an integration constant having a signification of the plasma entity energy and m 0 the rest mass of the entity.
The general solution of Equation (18) takes the following form [50]:
u = h e i ( k 0 x + Φ ) + h ¯ e i ( k 0 x + Φ )
where h is a complex amplitude, h ¯ is the complex conjugate of h and Φ is the initial phase. Thus, h and h ¯ and Φ label each entity of the ablation plasma structure that has a general characteristic the Equation (18) and consequently the same k0.
In such a context, can an a priori connection between the entities of the ablation plasma be established? Since (18) has a “hidden” symmetry in the form of a homographic group, we can answer to this question positively. Indeed, the ratio of two independent linear solution of (18), τ 0 , is a solution of Schwartz differential equation [51]:
{ τ 0 , x } = d d x ( τ ¨ 0 τ ˙ 0 ) 1 2 ( τ ¨ 0 τ ˙ 0 ) 2 = 2 k 0 2
τ ˙ 0 = d τ 0 d x ,   τ ¨ 0 = d 2 τ 0 d x 2
The left part of Equation (21) is invariant with respect to homogeneous transformation:
τ 0 τ 0 = a 1 τ 0 + b 1 c 1 τ 0 + d 1
with a1, b1, c1, d1 real parameters. The set of transformations (23) corresponding to all possible values of the parameters is the group SL (2R). Therefore, the ablation plasma structure of all the entities having the same k0 is in the bi-univocal correspondence with the transformation of the group SL (2R). This allows the construction of a “personal” parameter τ0 for each entity of the ablation plasma structure separately. Indeed, we choose as “guide” the general form of the solution of (21) which is written in the form:
τ 0 = m + n   tan ( k 0 x + Φ )
where m, n and Φ are constant and characterizes an entity of the ablation plasma structure. By identifying the phase from Equation (23) with one from Equation (20) we can write the “personal” parameter of the entity as:
τ 0 = h ¯ τ 0 + h τ 0 + 1 ,   h = m + i n ,   h ¯ = m i n ,   τ 0 e 2 i ( k 0 x + Φ )
The fact that (24) is also a solution of Equation (21) implies, by explicating Equation (22) the group of transformation [51]
h = a 1 h + b 1 c 1 h + d 1
k = c 1 h ¯ + d 1 c 1 h + d 1 k
This group work as a group of “synchronization” among the various entities of the ablation plasma structure, process to which the amplitudes and phases of each of them obviously participate, in the sense that they are also connected. More precisely, by means of the group (25), the phase of k is only moved with a quantity depending on the amplitude of the entity of the ablation plasma structure at the transition among various entities of the ablation plasma structures. But not only that, the amplitude of the entity of the ablation plasma structure is also affected from a homographic perspective. The usual “synchronization” manifested through the delay of the amplitudes and phases of the entities of the ablation plasma structure must represent here only a totally particular case.
The infinitesimal generator of the group (25)
L ^ 1 = h + h ¯ ,   L ^ 2 = h h h ¯ h ¯ ,   L ^ 3 = h 2 h + h ¯ 2 h ¯ + ( h h ¯ ) k k
satisfies the commutation relations:
[ L ^ 1 , L ^ 2 ] = L ^ 1 , [ L ^ 2 , L ^ 3 ] = L ^ 3 , [ L ^ 3 , L ^ 1 ] = 2 L ^ 2
Thus, the structure of the group (25) is given by Equation (27) so that the only non-zero structure constants should be:
C 12 1 = C 23 2 = 1 , C 31 2 = 2
Therefore, the invariant quadratic form is given by the “quadratic” tensor of the group (25)
C α β = C α ν μ C β μ ν
where summation over the repeated indices is understood. Using Equations (28) and (29), the tensor Cαβ is:
C α β = ( 0 0 4 0 2 0 4 0 0 )
meaning that the invariant metric of the group (25) has the form:
d s 2 f = Ω 0 2 4 Ω 1 Ω 2
with f an arbitrary constant factor and
Ω 0 = i ( d k k d h + d h ¯ h h ¯ ) , Ω 1 = d h ( h h ¯ ) k , Ω 2 = k d h ¯ h h ¯
three differential 1-forms, absolutely invariant through the group (25). In these conditions, the metric (31) becomes:
d s 2 f = ( d k k d h + d h ¯ h h ¯ ) 2 + 4 d h d h ¯ ( h h ¯ ) 2
A particular case of ablation plasma entities synchronization is the one induced through the parallel transport of direction in a Levi-Civita sense [51]. Then, in the space of variables ( h , h ¯ , k ) the differential 1-form Ω0 is null, Ω 0 = 0 , or in the space of variables (m, n, Φ):
d Φ = d m n
In such a situation the metric (33) can be reduced to the Lobacewski plane metric in Poincare representation:
d s 2 f = d h d h ¯ ( h h ¯ ) 2 = d m 2 + d n 2 n 2
Then the functionality of a variational principle of Matzner-Misner type associated to the Lagrangian built with the metric (35) implies the “field equations” [51,52]:
( h h ¯ ) 2 h = 2 h h
( h h ¯ ) 2 h ¯ = 2 h ¯ h ¯
The solution are as follows:
h = m + i n = i cos h Ψ e i χ sin h Ψ cos h Ψ + e i χ sin h Ψ
with
2 Ψ = 0
and χ real and arbitrary, which means that for m and n we have the following expression:
m = 2 r sin Φ 1 + r 2 + 2 r cos Φ , n = 1 r 2 1 + r 2 + 2 r cos Φ
r = tanh Ψ
Admitting that for χ a continuous variation, the solution (20) with the restriction (34) implies the synchronization of the ablation plasma structure entities in the form of self-modulation in amplitude through transformations of Stoler type [48,51]. Taking into consideration the meaning of such a transformation it results that the self-modulation in amplitude is realized through “annihilation” and “creation” of charges, i.e., through recombinations and ionizations.

5. Conclusions

Various samples with different geomorphological backgrounds collected from the Northern Hemisphere were investigated. Optical microscopy and XRD analysis were used to identify the minerals present in the rocks while EDX measurements revealed the composition of the samples.
The dynamics of laser induced plasmas on the four samples were investigated by means of ICCD fast camera imaging and optical emission spectroscopy. The images showed for three samples the split of the ejected cloud into three distinct structures. Optical emission spectroscopy allowed the identification of all the elements from the target and confirmed the results obtained by EDX and XRD. The Saha-Eggert equation was used to determine the electron density and the McWhirter criterion was used to verify if the local thermodynamic equilibrium conditions were met. All the investigated plasmas presented electron densities above the LTE threshold. The Boltzmann plot method was used to determine the excitation temperatures. Important differences were found between the values of each species and their corresponding ions, result discussed in the framework of selective heating by the incoming pulse.
The values of the global plasma structure and those of the individual species temperatures, were connected to the presence of calcite in the samples. Other aspects like target porosity were found to play a smaller role in the plasma plume dynamic. The samples with highest velocities were presenting low concentration of calcite while the sedimentary rocks were presenting low expansion velocities and high excitation temperatures, in line with effects of a strong thermalized ablation process.
A mathematical model to describe the dynamics in ablation plasma using various mathematical operational procedures is developed: multi structuring of the ablation plasma, by means of the fractal analysis and synchronizations of the ablation plasma entities through SL (2R) group invariance and in a particular case through self-modulation in the form of Stoler type transformations. The model proves that during the synchronization phenomena not only the amplitudes but also the phases are affected from a homographic perspective. A self-modulation through a Stoler type transformation is initiated functionalizing charge creating/annihilation processes.

Author Contributions

Conceptualization, S.G., M.A. and G.B.; methodology. G.B., H.B., S.G., N.C. and M.A.; investigation, S.A.I., F.E., N.C., H.B., M.A. and S.G.; writing—original draft preparation, S.A.I., F.E., H.B., G.B.; writing—review and editing, S.A.I., F.E. and M.A.; visualization, S.A.I.; supervision, M.A. and S.G.

Funding

This work was financially supported by Romanian Space Agency (ROSA) within the STAR Program, Project no.: 169/20.07.2017, by the National Authority for Scientific Research and Innovation in the framework of Nucleus Program–16N/2019 and by a grant of Ministry of Research and Innovation, CNCS-UEFISCDI, project number PN-III-P4-ID-PCE-2016-0355, within PNCDI III.

Conflicts of Interest

The authors declare no conflict of interest.

References

  1. Davari, S.A.; Hu, S.; Mukherjee, D. Calibration-free quantitative analysis of elemental ratios in intermetallic nanoalloys and nanocomposites using Laser Induced Breakdown Spectroscopy (LIBS). Talanta 2017, 164, 330–340. [Google Scholar] [CrossRef] [PubMed]
  2. Hahn, D.W.; Omenetto, N. Laser-Induced Breakdown Spectroscopy (LIBS), Part I: Review of Basic Diagnostics and Plasma–Particle Interactions: Still-Challenging Issues Within the Analytical Plasma Community. Appl. Spectrosc. 2010, 64, 335–366. [Google Scholar] [CrossRef] [PubMed]
  3. Xu, T.; Liu, J.; Shi, Q.; He, Y.; Niu, G.; Duan, Y. Multi-elemental surface mapping and analysis of carbonaceous shale by laser-induced breakdown spectroscopy. Spectrochim. Acta Part B-At. Spectrosc. 2016, 115, 31–39. [Google Scholar] [CrossRef]
  4. Xie, S.; Xu, T.; Han, X.; Lin, Q.; Duan, Y. Accuracy improvement of quantitative LIBS analysis using wavelet threshold de-noising. J. Anal. At. Spectrom. 2017, 32, 629–637. [Google Scholar] [CrossRef]
  5. El Haddad, J.; Canioni, L.; Bousquet, B. Good practices in LIBS analysis: Review and advices. Spectrochim. Acta-Part B At. Spectrosc. 2014, 101, 171–182. [Google Scholar] [CrossRef] [Green Version]
  6. Legnaioli, S.; Lorenzetti, G.; Pardini, L.; Cavalcanti, G.H.; Palleschi, V. Applications of LIBS to the Analysis of Metals. In Laser-Induced Breakdown Spectroscopy; Springer: Berlin/Heidelberg, Germany, 2014. [Google Scholar]
  7. Eppler, A.S.; Cremers, D.A.; Hickmott, D.D.; Ferris, M.J.; Koskelo, A.C. Matrix effects in the detection of Pb and Ba in soils using laser-induced breakdown spectroscopy. Appl. Spectrosc. 1996, 50, 1175–1181. [Google Scholar] [CrossRef]
  8. Sanghapi, H.K.; Jain, J.; Bol’Shakov, A.; Lopano, C.; McIntyre, D.; Russo, R. Determination of elemental composition of shale rocks by laser induced breakdown spectroscopy. Spectrochim. Acta-Part B At. Spectrosc. 2016, 122, 9–14. [Google Scholar] [CrossRef] [Green Version]
  9. Popov, A.M.; Zaytsev, S.M.; Seliverstova, I.V.; Zakuskin, A.S.; Labutin, T.A. Matrix effects on laser-induced plasma parameters for soils and ores. Spectrochim. Acta-Part B At. Spectrosc. 2018, 148, 205–210. [Google Scholar] [CrossRef]
  10. Barker, M.; Rayens, W. Partial least squares for discrimination. J. Chemom. 2003, 17, 166–173. [Google Scholar] [CrossRef]
  11. Dyar, M.D.; Carmosino, M.L.; Breves, E.A.; Ozanne, M.V.; Clegg, S.M.; Wiens, R.C. Comparison of partial least squares and lasso regression techniques as applied to laser-induced breakdown spectroscopy of geological samples. Spectrochim. Acta-Part B At. Spectrosc. 2012, 70, 51–67. [Google Scholar] [CrossRef]
  12. Harmon, R.S.; Russo, R.E.; Hark, R.R. Applications of laser-induced breakdown spectroscopy for geochemical and environmental analysis: A comprehensive review. Spectrochim. Acta-Part B At. Spectrosc. 2013, 87, 11–26. [Google Scholar] [CrossRef]
  13. Tognoni, E.; Cristoforetti, G.; Legnaioli, S.; Palleschi, V.; Salvetti, A.; Müller, M.; Gornushkin, I. A numerical study of expected accuracy and precision in calibration-free laser-induced breakdown spectroscopy in the assumption of ideal analytical plasma. Spectrochim. Acta-Part B At. Spectrosc. 2007, 62, 1287–1302. [Google Scholar] [CrossRef]
  14. Bulajic, D.; Corsi, M.; Cristoforetti, G.; Legnaioli, S.; Palleschi, V.; Salvetti, A.; Tognoni, E. A procedure for correcting self-absorption in calibration free-laser induced breakdown spectroscopy. Spectrochim. Acta-Part B At. Spectrosc. 2002, 57, 339–353. [Google Scholar] [CrossRef]
  15. González, R.; Lucena, P.; Tobaria, L.M.; Laserna, J.J. Standoff LIBS detection of explosive residues behind a barrier. J. Anal. At. Spectrom. 2009, 24, 1123–1126. [Google Scholar] [CrossRef]
  16. Waltham, T. The sandstone fantasy of Petra. Geol. Today 1994, 10, 105–111. [Google Scholar] [CrossRef]
  17. Makhlouf, I.M.; Abed, A.M. Depositional facies and environments in the Umm Ishrin Sandstone Formation, Dead Sea area, Jordan. Sediment. Geol. 1991, 71, 177–187. [Google Scholar] [CrossRef]
  18. Migoń, P.; Goudie, A. Sandstone geomorphology of south-west Jordan, Middle East. Quaest. Geogr. 2014, 33, 123–130. [Google Scholar] [CrossRef]
  19. Amireh, B.S. Mineral composition of the Cambrian-Cretaceous Nubian Series of Jordan: Provenance, tectonic setting and climatological implications. Sediment. Geol. 1991, 71, 99–119. [Google Scholar] [CrossRef]
  20. Leitch, H.C.B. Contributions to the Geology of Bowen Island. Ph.D. Thesis, University of British Columbia, Kelowna, BC, Canada, 1947. [Google Scholar]
  21. Boyle, D.R.; Turner, R.J.W.; Hall, G.E.M. Anomalous arsenic concentrations in groundwaters of an island community, Bowen Island. British Columbia. Environ. Geochem. Health 1998, 20, 199–212. [Google Scholar] [CrossRef]
  22. Friedman, R.M.; Monger, J.W.H.; Tipper, H.W. Age of the Bowen Island Group, southwestern Coast Mountains, British Columbia. Can. J. Earth Sci. 1990, 27, 1456–1461. [Google Scholar] [CrossRef]
  23. Valero Garcés, B.L.; Aguilar, J.G. Shallow carbonate lacustrine facies models in the Permian of the aragon-bearn basin (Western Spanish-French Pyrenees). Carbonates Evaporites 1992, 7, 94–107. [Google Scholar] [CrossRef]
  24. Sibuet, J.C.; Srivastava, S.P.; Spakman, W. Pyrenean orogeny and plate kinematics. J. Geophys. Res. 2004, 109, B08104. [Google Scholar] [CrossRef]
  25. Dunham, R.J. Classification of Carbonate Rocks According to Depositional Textures. In Classification of Carbonate Rocks—A Symposium; Ham, W.E., Ed.; American Association of Petroleum Geologists: Vancuver, BC, Canada, 1962; pp. 108–121. [Google Scholar]
  26. Roigé, M.; Gómez-Gras, D.; Remacha, E.; Daza, R.; Boya, S. Tectonic control on sediment sources in the Jaca basin (Middle and Upper Eocene of the South-Central Pyrenees). C. R. Geosci. 2016, 348, 236–245. [Google Scholar] [CrossRef]
  27. Rodríguez, L.; Cuevas, J.; Tubía, J.M. Structural Evolution of the Sierras Interiores (Aragón and Tena Valleys, South Pyrenean Zone): Tectonic Implications. J. Geol. 2014, 122, 99–111. [Google Scholar] [CrossRef]
  28. Irimiciuc, S.; Bulai, G.; Agop, M.; Gurlui, S. Influence of laser-produced plasma parameters on the deposition process: In situ space- and time-resolved optical emission spectroscopy and fractal modeling approach. Appl. Phys. A Mater. Sci. Process. 2018, 124, 615. [Google Scholar] [CrossRef]
  29. Irimiciuc, S.A.; Mihaila, I.; Agop, M. Experimental and theoretical aspects of a laser produced plasma. Phys. Plasmas 2014, 21, 93509. [Google Scholar] [CrossRef]
  30. Irimiciuc, S.; Boidin, R.; Bulai, G.; Gurlui, S.; Nemec, P.; Nazabal, V.; Focsa, C. Laser ablation of (GeSe2)100−x (Sb2Se3)x chalcogenide glasses: Influence of the target composition on the plasma plume dynamics. Appl. Surf. Sci. 2017, 418, 594–600. [Google Scholar] [CrossRef]
  31. Puretzky, A.A.; Geohegan, D.B.; Haufler, R.E.; Hettich, R.L.; Zheng, X.Y.; Compton, R.N. Laser ablation of graphite in different buffer gases. AIP Conf. Proc. 1993, 288, 365–374. [Google Scholar] [Green Version]
  32. Amoruso, S.; Armenante, M.; Bruzzese, R.; Spinelli, N.; Velotta, R.; Wang, X. Emission of prompt electrons during excimer laser ablation of aluminum targets. Appl. Phys. Lett. 1999, 75, 7–9. [Google Scholar] [CrossRef] [Green Version]
  33. Amoruso, S.; Unitá, I.; Fisiche, S.; Federico, N.; Angelo, M.S.; Cintia, V.; Napoli, I.; Toftmann, B.; Schou, J. Thermalization of a UV laser ablation plume in a background gas: From a directed to a diffusionlike flow. Phys. Rev. E 2004, 69, 56403. [Google Scholar] [CrossRef]
  34. Harilal, S.S.; Bindhu, C.V.; Tillack, M.S.; Najmabadi, F.; Gaeris, A.C. Plume splitting and sharpening in laser-produced aluminium plasma. J. Phys. D Appl. Phys. 2002, 35, 2935–2938. [Google Scholar] [CrossRef] [Green Version]
  35. Harilal, S.S.; Bindhu, C.V.; Tillack, M.S.; Najmabadi, F.; Gaeris, A.C. Internal structure and expansion dynamics of laser ablation plumes into ambient gases. J. Appl. Phys. 2003, 93, 2380–2388. [Google Scholar] [CrossRef] [Green Version]
  36. Chen, Z.; Bogaerts, A. Laser ablation of Cu and plume expansion into 1 atm ambient gas. J. Appl. Phys. 2005, 97, 063305. [Google Scholar] [CrossRef]
  37. O’Mahony, D.; Lunney, J.; Dumont, T.; Canulescu, S.; Lippert, T.; Wokaun, A. Laser-produced plasma ion characteristics in laser ablation of lithium manganate. Appl. Surf. Sci. 2007, 254, 811–815. [Google Scholar] [CrossRef]
  38. Ershov-Pavlov, E.A.; Katsalap, K.Y.; Stepanov, K.L.; Stankevich, Y.A. Time-space distribution of laser-induced plasma parameters and its influence on emission spectra of the laser plumes. Spectrochim. Acta Part B At. Spectrosc. 2008, 63, 1024–1037. [Google Scholar] [CrossRef]
  39. Kramida, A.; Ralchenko, Y.; Reader, J. NIST ASD Team, NIST Atomic Spectra Database Lines Form, NIST At. Spectra Database (Ver. 5.2). 2014. Available online: http://physics.nist.gov/asd (accessed on 9 October 2018).
  40. Rao, K.H.; Smijesh, N.; Nivas, J.J.; Philip, R. Ultrafast laser produced zinc plasma: Stark broadening of emission lines in nitrogen ambient. Phys. Plasmas 2016, 23, 43503. [Google Scholar] [CrossRef]
  41. Aguilera, J.A.; Aragón, C. Multi-element Saha-Boltzmann and Boltzmann plots in laser-induced plasmas. Spectrochim. Acta-Part B At. Spectrosc. 2007, 62, 378–385. [Google Scholar] [CrossRef]
  42. Irimiciuc, S.A.; Gurlui, S.; Agop, M. Particle distribution in transient plasmas generated by ns-laser ablation on ternary metallic alloys. Appl. Phys. B 2019, 125, 190. [Google Scholar] [CrossRef]
  43. Irimiciuc, S.A.; Bulai, G.; Gurlui, S.; Agop, M. On the separation of particle flow during pulse laser deposition of heterogeneous materials—A multi-fractal approach. Powder Technol. 2018, 339, 273–280. [Google Scholar] [CrossRef]
  44. Lee, Y.I.; Sawan, S.P.; Thiem, T.L.; Teng, Y.Y.; Sneddon, J. Interaction of a laser beam with metals. Part II: Space-resolved studies of laser-ablated plasma emission. Appl. Spec. 1992, 46, 436–441. [Google Scholar] [CrossRef]
  45. Milan, M.; Laserna, J.J. Diagnostics of silicon plasmas produced by visible nanosecond laser ablation. Spectrochim. Acta-Part B At. Spectrosc. 2001, 56, 275–288. [Google Scholar] [CrossRef]
  46. Irimiciuc, S.A.; Gurlui, S.; Nica, P.; Focsa, C.; Agop, M. A compact non-differential approach for modeling laser ablation plasma dynamics. J. Appl. Phys. 2017, 12, 083301. [Google Scholar] [CrossRef]
  47. Irimiciuc, S.A.; Agop, M.; Nica, P.; Gurlui, S.; Mihaileanu, D.; Toma, S.; Focsa, C. Dispersive effects in laser ablation plasmas. Jpn. J. Appl. Phys. 2014, 53, 116202. [Google Scholar] [CrossRef]
  48. Merches, I.; Agop, M. Differentiability and Fractality in Dynamics of Physical Systems; World Scientific: Singapore, 2015. [Google Scholar]
  49. Mandelbrot, B. The Fractal Geometry of Nature; WH Freeman Publisher: New York, NY, USA, 1993. [Google Scholar]
  50. Nottale, L. Scale Relativity and Fractal Space-Time: An Approach to Unifying Relativity and Quantum Mechanics; Imperial College Press: London, UK, 2011. [Google Scholar]
  51. Agop, M.; Merches, I. Operational Procedures Describing Physical Systems; CRC Press, Taylor and Francis Group: London, UK, 2019. [Google Scholar]
  52. Mihaileanu, M. Differential, Projective and Analytical Geometry; Didactical and Pedagogical Publishing House: Bucuresti, Romania, 1972. [Google Scholar]
Figure 1. Optical microscopy and polarized microscopy images of all the investigated samples. Bio—bioclasts; Cal—calcite; Ep—epidote; Opq—opaque mineral; Pl—plagioclase; Qtz—quartz; Qtz(m) —metamorphic quartz; Zeo—zeolites. ((a) Sample #1—Quartz sandstone, (b) Sample #2—Spilite, (c) Sample #3—Sandstone, (d) Sample #4—Extraclastic bioclastic limestone).
Symmetry 11 01391 g001
Figure 2. X-ray diffractogram of the (a) Sample #1Quartz sandstone. Minerals: quartz, calcite, kaolinite (inset), (b) Sample #2—Basalt (Spilite) Minerals: albite (plagioclase feldspar), epidote, clinochlore, actinolite, phillipsite, (c) Sample #3—Sedimentary rock. Minerals: quartz, calcite, kaolinite, muscovite, clinochlore, (d) Sample #4—Bioclastic limestone. Minerals: quartz, calcite, orthoclase.
Symmetry 11 01391 g002
Figure 3. ICCD camera images, on a range of 1 μs, of laser produced plasmas generated by nanosecond laser ablation of mineral samples and a detail of the three-plasma structure (inset).
Symmetry 11 01391 g003
Figure 4. Cross section on the ICCD snapshot collected at 550 ns of the laser produced plasmas (LPP) generated on Sample #2.
Symmetry 11 01391 g004
Figure 5. Plasma structure velocities for Sample #1, #2, #3, and #4 and their dependence on the abundance of calcite structure.
Symmetry 11 01391 g005
Figure 6. Global emission spectra collected at 1 mm from the target with a 2 μs gate width, gate delay of 100 ns, and laser fluence of 19 J/cm2 of all the investigated samples (Sample #1 (a), Sample #2 (b) Sample #3 (c), Sample #4 (d)).
Symmetry 11 01391 g006
Figure 7. Representative Boltzmann plot for the Ca atoms representing the plasma generated on Sample #2.
Symmetry 11 01391 g007
Figure 8. 3D representation and contour plot of the differentiable (ac) and fractal (df) particle density for various degrees of fractalization (θ = 0.1, 1, 5).
Symmetry 11 01391 g008
Figure 9. 3D representation and contour plot of the global particle density for various degrees of fractalization (θ = 0.7 (a), 5 (b) and 50 (c)).
Symmetry 11 01391 g009
Table 1. Minerals confirmed by the X-ray diffraction (XRD) data base and their indicative.
RocksConfirmed Minerals from XRD Database
Sample #1PDF 01-070-7244 SiO2 Quartz
PDF 00-058-2001 (Al2Si2)5(OH)4 Kaolinite 1A
PDF 00-005-0586 CaCO3 Calcite
Sample #2PDF 00-073-2147 Ca2Fe0.33Al2.67Si3O12OH Ca Fe (Epidote)
PDF 00-046-1427 (K,Na)2(Si,Al)8O16*4H2O (Philipsite)
PDF 00-019-0749 Mg5Al(Si3Al)O10(OH)8 (Clinochlore)
PDF 00-001-0739 NaAlSi3O8 (albite)
PDF 00-080-0521 Ca2(Mg,Fe)5Si8O22(OH) (Actinolite)
Sample #3PDF 01-070-7344 SiO2 Quartz
PDF 00-024-0027 CaCO3 Calcite
PDF 01-078-2110 Al4(OH)8(Si4O10) Kaolinite
PDF 01-070-1869 K0.77Al1.93(Al0.5Si3.5)O10(OH)2 Muscovite-2M2
PDF 00-007-0078 (Mg,Fe,Al)6(Si,Al)4O10(OH)8 Clinochlore
Sample #4PDF 01-083-1762 Ca(CO3) Calcite
PDF 01-070-7344 SiO2 Quartz
PDF 01-083-1324 K0.59Ba0.19Na0.33(Al0.18Si2.82O8) Orthoclase
Table 2. Results from EDX measurements depicting each sample elemental configuration and the respective error bar for each element.
Sample #1 (Petra)Sample #2 (Bowen Island)Sample #3 (Pico Anayet)Sample #4 (Pico Collarada)
ElementAt %ElementAt %ElementAt %ElementAt %
Si19.14 ± 0.25Si21.97 ± 0.25Ca31.85 ± 0.2Ca24.62 ± 0.3
Ca5.78 ± 0.1Fe6.50 ± 0.13Fe1.33 ± 0.1Si17.98 ± 0.2
C1.74 ± 0.1Al9.31 ± 0.16C0.27 ± 0.05Al2.84 ± 0.1
Al2.14 ± 0.12Mg5.03 ± 0.11Si1.00 ± 0.08Mg0.93 ± 0.08
Ti0.23 ± 0.05Ba0.68 ± 0.1Al0.6 ± 0.05K4.39 ± 0.1
Fe0.68 ± 0.05Ca2.04 ± 0.11Mn0.67 ± 0.06Fe0.81 ± 0.06
Mg0.53 ± 0.05K1.63 ± 0.08K1.47 ± 0.08C0.34 ± 0.05
O69.71 ± 1.1Na0.73 ± 0.07O62.77 ± 1.2O48.06 ± 1.0
Cl0.58 ± 0.05
P1.05 ± 0.07
C1.13 ± 0.05
O49.27 ± 1.0

