Mechanical Vibration for the Control of Membrane Fouling in Direct Contact Membrane Distillation

1
Department of Civil and Environmental Engineering, New Mexico Tech, Socorro, NM 87801, USA
2
Department of Civil and Environmental Engineering, Michigan Technological University, Houghton, MI 49931, USA
*
Author to whom correspondence should be addressed.
Symmetry 2019, 11(2), 126; https://doi.org/10.3390/sym11020126
Submission received: 13 November 2018
/
Revised: 11 January 2019
/
Accepted: 16 January 2019
/
Published: 22 January 2019
(This article belongs to the Special Issue Asymmetric Membranes)
Abstract
:One of the biggest challenges for direct contact membrane distillation (DCMD) in treating wastewater from flue gas desulfurization (FGD) is the rapid deterioration of membrane performance resulting from precipitate fouling. Chemical pretreatment, such as lime-soda ash softening, has been used to mitigate the issue, however, with significant operating costs. In this study, mechanical vibration of 42.5 Hz was applied to lab-scale DCMD systems to determine its effectiveness of fouling control for simulated FGD water. Liquid entry pressure and mass transfer limit of the fabricated hollow fiber membranes were determined and used as the operational constraints in the fouling experiments so that the observed membrane performance was influenced solely by precipitate fouling. Minimal improvement of water flux was observed when applying vibration after significant (~16%) water-flux decline. Initiating vibration at the onset of the experiments prior to the exposure of foulants, however, was promising for the reduction of membrane fouling. The water-flux decline rate was reduced by about 50% when compared to the rate observed without vibration. Increasing the module packing density from 16% to 50% resulted in a similar rate of water-flux decline, indicating that the fouling propensity was not increased with packing density in the presence of vibration.
1. Introduction
Traditionally, the bulk of the U.S. water demand has been satisfied by a combination of surface water and fresh groundwater. However, as climate and land use change, resources deplete, and population grows, these sources are not expected to suffice. Thus, unconventional water resources, such as reclaimed wastewater and brackish groundwater, have become increasingly more important to make up the deficiency [1,2]. Membrane distillation (MD) is a desalination process that relies on vapor pressure gradients across a hydrophobic, microporous membrane to drive the production of distilled water, and can be used for the treatment of these unconventional water sources. This process is particularly suited for locations where low-cost energy (e.g., waste heat or geothermal energy) is readily available. This paper focuses on the application of asymmetric membranes in MD for recycling and concentrating heated wastewater generated from flue gas desulfurization (FGD) in thermoelectric power plants. For FGD using wet scrubbers, the water consumption rate was estimated to be about 242 L (64 gallons) per Megawatt hour [3]. For a power generating station with a capacity of 1500 MW, the annual FGD wastewater amounts to about 3.18 million m3 (841 million gallons), a significant quantity in need of volume reduction and reclamation. Due to the application of lime in wet scrubbers, this type of FGD wastewater generally has high concentrations of Ca2+, which would pose serious fouling impact to membrane processes (e.g., reverse osmosis, RO) employed for wastewater reclamation [4]. Pretreatment with lime-soda ash softening is commonly used to reduce the scaling potential associated with Ca2+; however, this process generates a significant amount of sludge and can be costly.
MD desalination processes consist of three steps: evaporation of water from the hot, brackish feed side, diffusion of water vapor through the membrane following water vapor pressure gradients, and condensation of water vapor on the cold permeate side of the membrane [5]. There are four basic MD configurations; direct contact membrane distillation (DCMD), air gap membrane distillation (AGMD), sweeping gas membrane distillation (SWMD), and vacuum assist membrane distillation (VAMD) [6,7]. The simplest configuration is DCMD, in which the condensed permeate is in direct contact with the membrane. Heat loss by conduction, however, is highest in this configuration. The three most prevalent polymers used to fabricate MD membranes are polyvinylidene fluoride (PVDF), polypropylene (PP), and polytetrafluoroethylene (PTFE). Their properties and fabrication methods are described elsewhere [8]. This study focused on PVDF-based MD hollow fiber membranes (HFM) that can be fabricated using nonsolvent induced phase separation (NIPS) through the dry jet-wet spinning process. By controlling the composition of the nonsolvent (e.g., water, isopropanol (IPA), or a mixture of them) and the fiber spinning conditions, membranes with symmetric or asymmetric pore structures can be fabricated [9,10]. Symmetric hollow fiber membranes have rather uniform pore structures and properties, such as crystallinity and mechanical strength, throughout the membranes, whereas asymmetric membranes may possess multiple dissimilar pore structures throughout the cross-sections [9]. Asymmetric membranes with inner finger-like macrovoids coupled with an outer sponge layer are of particular interest to this study. The intention was to prevent pore wetting from the hot saline fluid with the sponge layer, while using the macrovoid layer to increase the water flux and thermal efficiency of the membrane via the reduction of tortuosity and thermal conductivity [11,12]. Water flux and thermal efficiency as high as 98.6 (liters/m2-hour, LMH) and 94%, respectively have been observed for dual-layer hollow fiber membranes with such a pore structure. Long-term DCMD performance of this membrane showed a decline in water flux of less than 10% over 200 h, which was attributed to inorganic salt scaling on the membrane surfaces [13]. Other researchers also investigated the long-term performance of PVDF hollow fiber membranes with the opposite membrane configuration (i.e., an outer macrovoid layer coupled with an inner sponge layer) [14]. However, rapid decline of water flux at 20% was observed after 200 h of operation, and the reduction was attributed to progressive pore wetting. Addition of PTFE particles to increase hydrophobicity of the membrane slowed down the initial decline of water flux; however, over 80% reduction of the water flux was still observed after 1000 h of operation [14,15].
Membrane fouling in DCMD systems is detrimental to membrane performance because it can degrade water flux and reduce salt rejection. Membrane fouling can also lead to an increase in energy consumption, greater system downtime, and the requirement of frequent membrane replacement. Additionally, membranes continuously exposed to foulants are more likely to fail from reduced mechanical strength and increased membrane defects [16,17,18,19]. Scaling refers to the precipitation of minerals on membrane surfaces, and is likely the most common type of inorganic fouling observed in DCMD. Evaporation of water at the hot feed side of the membrane increases the ionic concentration at the membrane surface. This disparity between the ionic concentration at the membrane surface and that in the bulk feed water stream is termed concentration polarization (CP). CP heightens the mineral precipitation potential at the membrane surface, increasing the likelihood of membrane fouling. CP can also reduce water flux by depressing the local saturation water vapor pressure [18,20,21]. As minerals precipitate and grow on membrane surfaces and in pores, water flux is degraded, and membrane hydrophobicity is often compromised, leading to membrane pore wetting and permeate contamination [18,20]. Precipitate fouling by alkaline salts can be especially detrimental to DCMD performance, because many of these salts exhibit retrograde solubility, meaning that they become less soluble as temperature increases. The most prevalent inorganic foulant is the retrograde soluble alkaline salt, calcium carbonate (CaCO3). CaCO3 has a tendency to precipitate at higher water temperatures when dissolved carbon dioxide (CO2) comes out of solution, and as a result, raises the pH of the water [18,20,22]. Membrane fouling by CaCO3 precipitation can be prevented or mitigated via pretreatment of source waters. Commonly used pretreatment techniques include pH modulation, addition of anti-scalants, ion exchange, and lime-soda ash softening; however, these measures can be cost intensive [18,20,23]. In addition to chemical-based pretreatment for scalant control, studies have been performed to assess the benefits of vibration-based treatment for membrane processes. It was reported that ultrasound or vibration applied to membrane filtration devices could help to maintain water flux by instilling a turbulent flow regime, thereby minimizing the effects of temperature and concentration polarization [20,24,25]. This concept has been studied in membrane bioreactors (MBR), and has shown significant reduction of fouling and increased flux after shear rates were applied through vibration with frequencies at 2 to 10 Hz [26]. In a wastewater reclamation study, the application of high-frequency mechanical vibration was also shown to significantly increase water flux and run time of the microfiltration system [27]. For MD systems specifically, ultrasonic vibration has been studied for fouling control. The technique was found to improve membrane flux in an AGMD system by inducing ultrasonic cavitation, as well as providing increased convection and mixing near the membrane surface [28]. Another study found that membrane scaling could potentially be reduced through ultrasonic vibration in DCMD desalination of seawater [29]. No data has been reported in literature thus far for the effectiveness of mechanical vibration for the control of membrane fouling in DCMD.
The objective of this research was to investigate the feasibility of replacing lime-soda ash softening with low-cost mechanical vibration for the control of membrane fouling resulting from the precipitation of Ca2+ in direct contact membrane distillation (DCMD) used for FGD wastewater reclamation.
2. Materials and Methods
2.1. Membrane Fabrication and Characterization
Hollow fiber membranes used for this research were fabricated via nonsolvent induced phase separation (NIPS). The polymer (dope) solution for membrane fabrication consisted of 12 wt% of polyvinylidene fluoride, PVDF (~534 kDa from Sigma-Aldrich, St. Louis, MO) as the membrane material, 12 wt% of ethylene glycol, EG (Sigma-Aldrich, St. Louis, MO) as the pore forming agent, and 76 wt% of 1-methyl 2-pyrrolidinone, NMP (VWR, Randor, PA) as the solvent. Dehydrated PVDF powder was mixed with NMP and EG. The mixture was kept in a 70 °C oven for 5 h to ensure complete dissolution of PVDF in NMP. The homogenous dope solution was then placed in vacuum to degas for 2 h before usage. The hollow fibers were fabricated using a dry jet-wet spinning process equipped with a spinneret (AEI, Inc., Waxhaw, NC, USA), which has a polymer bore of 1520 µm (for dope solution), needle OD of 510 µm, and needle ID of 410 µm (for bore solution). The bore solution consisted of 60 wt% of isopropyl alcohol, IPA (PL Developments, Clinton, SC) and 40 wt% of de-ionized water, DI (18.2 MΩ-cm, Milli-Q system) as the non-solvent. After polymer was extruded from the spinneret, the nascent polymer fibers travelled through an air gap before entering the coagulation bath, which contained a mixture of IPA and DI as the non-solvent, for phase inversion. Table 1 lists the conditions of the fiber spinning process. The newly spun hollow fibers were immersed in DI for 24 h to remove any residual NMP and EG. Thereafter, the wet fibers were freeze-dried before characterization and module-making.
Morphologies of the hollow fiber membranes were observed using scanning electron microscopy, SEM (Hitachi S3200N). The fiber samples were freeze fractured using liquid N2, and then platinum sputter coated. Pore sizes of the hollow fiber membranes were determined using capillary flow porometry (Quantachrome 3G zh), with a through-pore size range from 0.013 to 500 µm. Samples of hollow fibers were wetted with Porofil® before being installed onto the hollow-fiber sample holder for the porometry analysis (Quantachrome, 2016). Membrane porosity (ε) was estimated using Equation (1), and the mass of the dry fiber was measured using a digital microbalance (Sartorius M3P) with an accuracy of 0.001 mg.
where is the mass of dry fiber, is the density of PVDF, and is the volume of the dry fiber calculated based on the membrane wall thickness observed using SEM. Mechanical properties of the hollow fiber membranes were measured at 20 °C using a tensile tester (Mark-10 ESM303) equipped with a 100 N digital force gauge (Model M5-20). A strain rate of 1.27 cm/min (0.5 inches/min) was applied to the fibers until breakage. The stress-strain behaviors of the fibers were recorded to assess the mechanical properties.
2.2. Module Fabrication
The fabricated HFMs were sorted visually for defects before being potted with epoxy in clear acrylic tubes rated for 82 °C. The dimensions of each acrylic tube were 0.635 cm (¼ inches) in the inner diameter × 13.97 cm (5.5 inches) long. Modules contained various amounts of fibers to create different fiber packing densities. The packing density is defined in Equation (2) as the percentage of packable area utilized by the HFMs within the membrane module.
where is the total number of fibers in a module and is the maximum number of fibers packable in the module [8].
2.3. DCMD Experimental Setup
The general process flow diagram of the lab-scale DCMD setup is shown in Figure 1. Membrane modules with a packing density of 15% were used in all the experiments, unless otherwise noted. Peristaltic pumps (Cole-Parmer, model: 07551-20) or rotary piston pumps (FMI, “Q” Pump) were used to apply a permeate flow rate of 6 ml/min per fiber through the lumen and a feed flow rate of 12 ml/min per fiber through the module shell. Water flux trends for both co-current and counter-current flow configurations through the modules were evaluated. The flow rates were maintained consistently throughout all experimentation and were measured using rotameters (Cole-Parmer, model T-03219-31) placed after module outlets on both the feed and permeate sides. Needle valves (Swagelock Company, Solon, OH, USA) were installed after the flow meters to choke the flow if needed. Heat exchangers were placed in temperature control baths (Fisher Scientific Isotemp, model: FS- GPD20) for the hot and cold sides in order to maintain the desired inlet temperature set-points for the modules. Resistive temperature detectors, RTDs (Pt100), and digital pressure gauges (0–30 psi, SSI Technologies, Inc., Janesville, WI, USA) were installed at both inlets and outlets of the membrane modules in order to measure the feed and permeate temperatures and pressures. The concentrations of total dissolved solids (TDS) for the feed and permeate were measured twice per day using conductivity cells (Cole-Parmer, K = 0.1 and 10, 10 kΩ ATC). Permeate water flux was determined by using a digital balance (Sartorius, model: Entris 6202-1S) to measure the accumulated water mass in the permeate basin. A DI water reservoir, positioned above the feed reservoir, was used to maintain consistent salinity of the brackish feed water. As water in the feed permeated through the HFMs in the module, a slight vacuum was induced on the DI water reservoir to replenish the feed water reservoir.
At the onset of experimentation, flow rates though the module shell and membrane lumen were gradually increased until their respective final flow rates were reached. Module functionality was verified by performing a baseline test. The baseline was performed by measuring the cumulative permeate water mass produced by a module with a negligible applied vapor pressure (or temperature) gradient over the course of an hour. If permeate accumulated at a rate of less than 6 g/h, the module was deemed viable for use in experimentation. Permeate water flux () and salt rejection (R) of the membrane modules were calculated using Equations (3) and (4) below.
where is the accumulation rate of water mass in the permeate reservoir, is the density of water, and is the total active surface area of the HFMs in the module. is the TDS concentration of the permeate out of the module and is the TDS concentration of the brackish feed into the module. The average trans-membrane vapor pressure gradient (), instead of the average temperature gradient, was used for the performance correlation of HFMs. is a better process parameter than the temperature gradient for MD because it is the driving force for vapor transport across a MD membrane and therefore is scaled linearly with water flux. The temperature gradient is instead scaled non-linearly with water flux due to the exponential increase of water vapor pressure with temperature. Equation (5) shows the definition of the average vapor pressure gradient () in this study. The water vapor pressure at a specific temperature was estimated using the Antoine equation [30].
where and are the water vapor pressures at the shell-side inlet and outlet of a module, and are the water vapor pressures at the lumen-side inlet and outlet of a module, and is the membrane wall thickness.
2.4. Operational Constraints
Membrane fouling generally manifests as a reduction of water flux over time, which may also result from operating the DCMD system under conditions where gradual pore wetting occurs. Therefore, it is imperative to determine the operational constraints of a DCMD system and run the system within limits when applying the foulants so that the observed water-flux reduction arises mainly from membrane fouling. Two operational constraints, liquid entry pressure (LEP) and mass transfer limit (MTL), were determined using the experimental setup shown in Figure 1.
LEP is the threshold of the trans-membrane pressure beyond which water will penetrate through the membrane pores leading to membrane failure. Experiments were set up to incrementally increase the trans-membrane pressure at different hot-side temperatures until membrane failure was observed. Specifically, the pressure on the lumen side was increased by about 0.14 bar (2 psi) every 2 h, while maintaining the shell-side pressure as well as the flow rates on the lumen and shell sides through throttling of the needle valves. Keeping the flow rates constant throughout the experiment provided a steady vapor pressure gradient for water flux comparison. LEP exceedance was signaled by an excessive pressure drop through the lumen or a rapid reduction of water flux. When either of these two module behaviors was observed, the pressure difference was deemed the LEP for that specific hot-side temperature.
MTL is the maximum water-vapor pressure gradient across the membrane, beyond which the mass transfer rate through the membrane would be constrained, leading to gradual pore wetting from condensation and decline of water flux. The general inclination is to maximize the vapor pressure gradient (e.g., using the hottest brackish water within the module tolerance) so that the water flux can be maximized. However, this approach may inadvertently cause membrane failure once the MTL is exceeded. Experiments were performed with gradual increase of the vapor pressure gradient until membrane failure. Specifically, at the commencement of each test, a low average vapor pressure gradient was applied to the HFM module after about 20 h, and if rapid water flux decline was not observed, the vapor pressure gradient was increased. This pattern was repeated until precipitous water flux decline was observed, at which point the vapor pressure gradient was deemed the MTL for the HFMs.
2.5. Simulated FGD Wastewater
The composition of the FGD wastewater was obtained from a coal-fired power plant located in China [31]. Table 2 shows a composition comparison between the FGD wastewater and the synthetic wastewater used in this study. Due to their low concentrations, iron and copper in the actual FGD wastewater were not emulated in the simulated water. ACS grade chemicals and ultrapure water (18.2 MΩ-cm, Milli-Q system) were used to prepare the simulated fluid. After the addition of chemicals, the simulated FGD wastewater was stirred and heated to 70 °C for two hours. Large precipitated matter was then filtered (Whatman, 1.2µm exclusion size) before the simulated water was used in the fouling experiments.
2.6. Fouling Experiments
For all fouling experiments, the membrane module was tested using the general DCMD setup shown in Figure 1 with the co-current flow configuration. The simulated FGD wastewater was stirred in the feed reservoir to keep the potential foulants in suspension. Before introducing the simulated wastewater, water fluxes at two distinct vapor pressure gradients were recorded for about 20 h using DI water as both the feed and permeate. The purpose was to develop a non-fouling module-specific relationship between the vapor pressure gradient and water flux. The relationship was used to calculate the expected non-fouling water flux once the potential foulants were introduced, and provided differentiation of changes in water flux due to vapor pressure gradient fluctuations from membrane fouling. For tests where fouling prevention was intended, vibration (described in Section 2.6.1) was applied to membrane modules with DI as both the feed and permeate for about 10 h before simulated water was added. This baseline period helped establish the expected water flux in the presence of vibration. Thereafter, the simulated FGD wastewater was introduced as the feed. In experiments where fouling mitigation was intended, simulated wastewater was added to the feed side immediately after the module-specific water flux testing with DI water had concluded. Vibration was applied to membrane modules only after water flux had declined by about 10%. At the conclusion of each experiment, the fouled membranes were carefully removed to perform SEM analysis for the confirmation of mineral precipitation on the membrane surfaces.
Vibrational Force Application
High-frequency mechanical vibration was applied to the membrane modules through vibration motors (model JQ24-35F580C, Jinlong Machinery & Electronics, Inc., Brooklyn, NY, USA) during the fouling experiments. Each motor was secured to a membrane module and an accelerometer (PCB Piezotronics, model: 352B10, sensitivity: 10 mV/g acceleration) was used to determine the acceleration for force calculations. For all fouling experiments requiring vibrational force application, a vibrational speed of 2550 RPM (frequency of 42.5 Hz) was used. This vibrational speed was chosen based on the available range of 1600 to 3200 RPM (frequency from 26.7 to 53.3 Hz) for industrial vibrators. The vibration motor was comprised of an off-center weight attached to the drive shaft of a small motor. In experimentation, the base of the motor was attached to the center of the membrane module with two heavy-duty zip ties. The vibrational force exerted on a membrane module is dependent upon the mass of the vibrating motor/weight assembly and the acceleration at which the assembly hits the module. Because the vibrating motor was securely fastened to the membrane module, the force exerted by the vibrating assembly was dampened. Consequently, the equivalent or dampened mass of the vibrating assembly would have to be estimated for the force calculation. Equation (6) illustrates the relationship used to determine the equivalent mass [32].
where is the equivalent mass of the vibrating motor/weight assembly, is the acceleration of the vibrating motor measured by the accelerometer, is the mass of the off-center weight attached to the motor, is the eccentricity or the distance from the motor drive shaft to the centroid of the off-center weight, and is the angular velocity of the off-center weight. The weights of the motor and the off-center weight were measured with an analytical balance (Mettler Toledo, model: ML503T). The eccentricity of the weight was calculated using Equation (7) based on its semi-circular form [33].
where is the radius of the semi-circular off-center weight. The vibration motor was run from low to high RPM and at each rotational speed, acceleration data was sampled and averaged over a period of five minutes using an oscilloscope (Rigol, model: MSO1000-Z/DS1000Z). Linear regression was performed on data and the slope of the line was the equivalent mass of the vibrating motor/weight assembly, which was found to be 29.8 g. The calculated vibrational force that was applied to all membrane modules in the fouling experiments was then determined to be 2.27 Newton (N) per impact.
3. Results and Discussion
3.1. Membrane Characterization
The fabricated PVDF hollow fiber membranes exhibited an asymmetric structure, consisting of an outer sponge layer and an inner macrovoid layer, as shown in Figure 2. Their membrane properties were characterized and listed in Table 3. The compositions of the non-solvents (IPA/DI wt% ratio = 60:40) used as the bore fluid and in the coagulation bath controlled the rate of phase inversion, which strongly influenced the final structure of the membrane. The IPA/DI mixture in the coagulation bath induced delayed demixing, leading to a sponge-like porous structure. The same mixture was used as the bore solution; however, rapid refreshing of the non-solvent at the internal interface of the fibers enhanced instantaneous demixing, leading to a macrovoid structure. The air gap in the fiber spinning process can be manipulated to change the relative thickness of sponge and macrovoid layers in a fiber wall [8].
3.2. Membrane Performance
3.2.1. Effects of Flow Configurations
DCMD experiments, with a general setup shown in Figure 1, were conducted to establish the relationships between water flux and average water vapor pressure gradient (Gvp) under different flow configurations; co-current and counter-current. Membrane modules with a packing density of 15% were used in the experiments, and DI water was used as both the feed and permeate streams. Salt rejection of the membranes with the synthetic FGD wastewater as the feed was determined later in the fouling experiments (Section 3.5) and was always greater than 99.7%. Figure 3 shows the water flux values under different average water vapor pressure gradients across the membranes. The water flux increased linearly with the vapor pressure gradient and shows values comparable to those reported in the literature for membranes with a similar pore structure [13,14,34]. Higher water flux was observed in the counter-current configuration than the co-current configuration for a specific vapor pressure gradient. This observation possibly resulted from higher conductive heat loss through the membranes and consequently less available energy for distillation under the co-current configuration.
3.2.2. Liquid Entry Pressure (LEP)
LEP is often used to determine the operating pressure limits of a DCMD system, below which liquid penetration through a membrane would not occur. Figure 4 shows the LEP of the PVDF membrane as a function of the feed-side inlet temperature. The observed LEP dropped from 1.32 to 0.53 bar (from 19.2 to 7.7 psi) as the feed inlet temperature increased from 22 to about 81 °C, suggesting that the LEP reported at room temperature might not be an appropriate threshold for MD operations. It was also evident that the counter-current flow configuration posed a higher operational risk under elevated feed temperatures for breaching the LEP, since the membrane modules would experience greater transmembrane pressure differentials in this configuration.
3.2.3. Mass Transfer Limit (MTL)
Mass transfer limits were observed in the lab-scale experiments when the inlet vapor pressure gradient for the modules was raised to about 6.5 MPa/cm (90 °C and 20 °C on the feed and permeate inlets, respectively). An immediate and steady decrease in water flux and an increase in permeate conductivity was observed, signaling membrane failure. It was hypothesized that at a certain, large vapor pressure gradient, mass transfer would be limited by the rate at which vapor was capable of transferring through the membrane. Further experimentation by incrementally reducing the inlet vapor pressure gradient suggested that the MTL for the PVDF membranes was about 3.5–3.9 MPa/cm, translating to about 75–80 °C on the hot inlet side and 20–25 °C on the cold inlet side for a co-current flow configuration.
3.3. Membrane Fouling
The flow configuration of all the fouling experiments was co-current with modules vertically oriented. The upward flow direction was to minimize the accumulation of bubbles in the modules, which could lead to air lock of flow and depressed water flux. The flow rates on both the feed and the permeate side were slowly increased at the onset of each experiment to ensure that the membrane LEP was not exceeded. The vapor pressure gradients examined during the experiments were also maintained below the observed MTL.
3.3.1. Precipitation Potential
Speciation modeling was performed for the synthetic FGD wastewater using PHREEQC, a geochemical computer program developed by the United States Geological Survey (USGS), to evaluate its precipitation potential [35]. Table 4 shows the potential precipitates for the synthetic FGD wastewater and the corresponding saturation indices (SI). SI of a mineral is defined as the log value of the difference between the ion activity product and the solubility product constant. A SI value of zero indicated that the solution was in equilibrium, whereas a value greater than zero suggested the mineral was oversaturated thermodynamically and could potentially precipitate [36]. All the potential precipitates, except for amorphous silica, are retrograde soluble and exhibit higher membrane fouling potential at elevated temperatures [37,38,39,40]. Based on the PHREEQC modeling, about 180 mg of precipitates per liter of the synthetic FGD wastewater were expected to form in the feed.
3.3.2. Effects of Mechanical Vibration on Precipitate Fouling
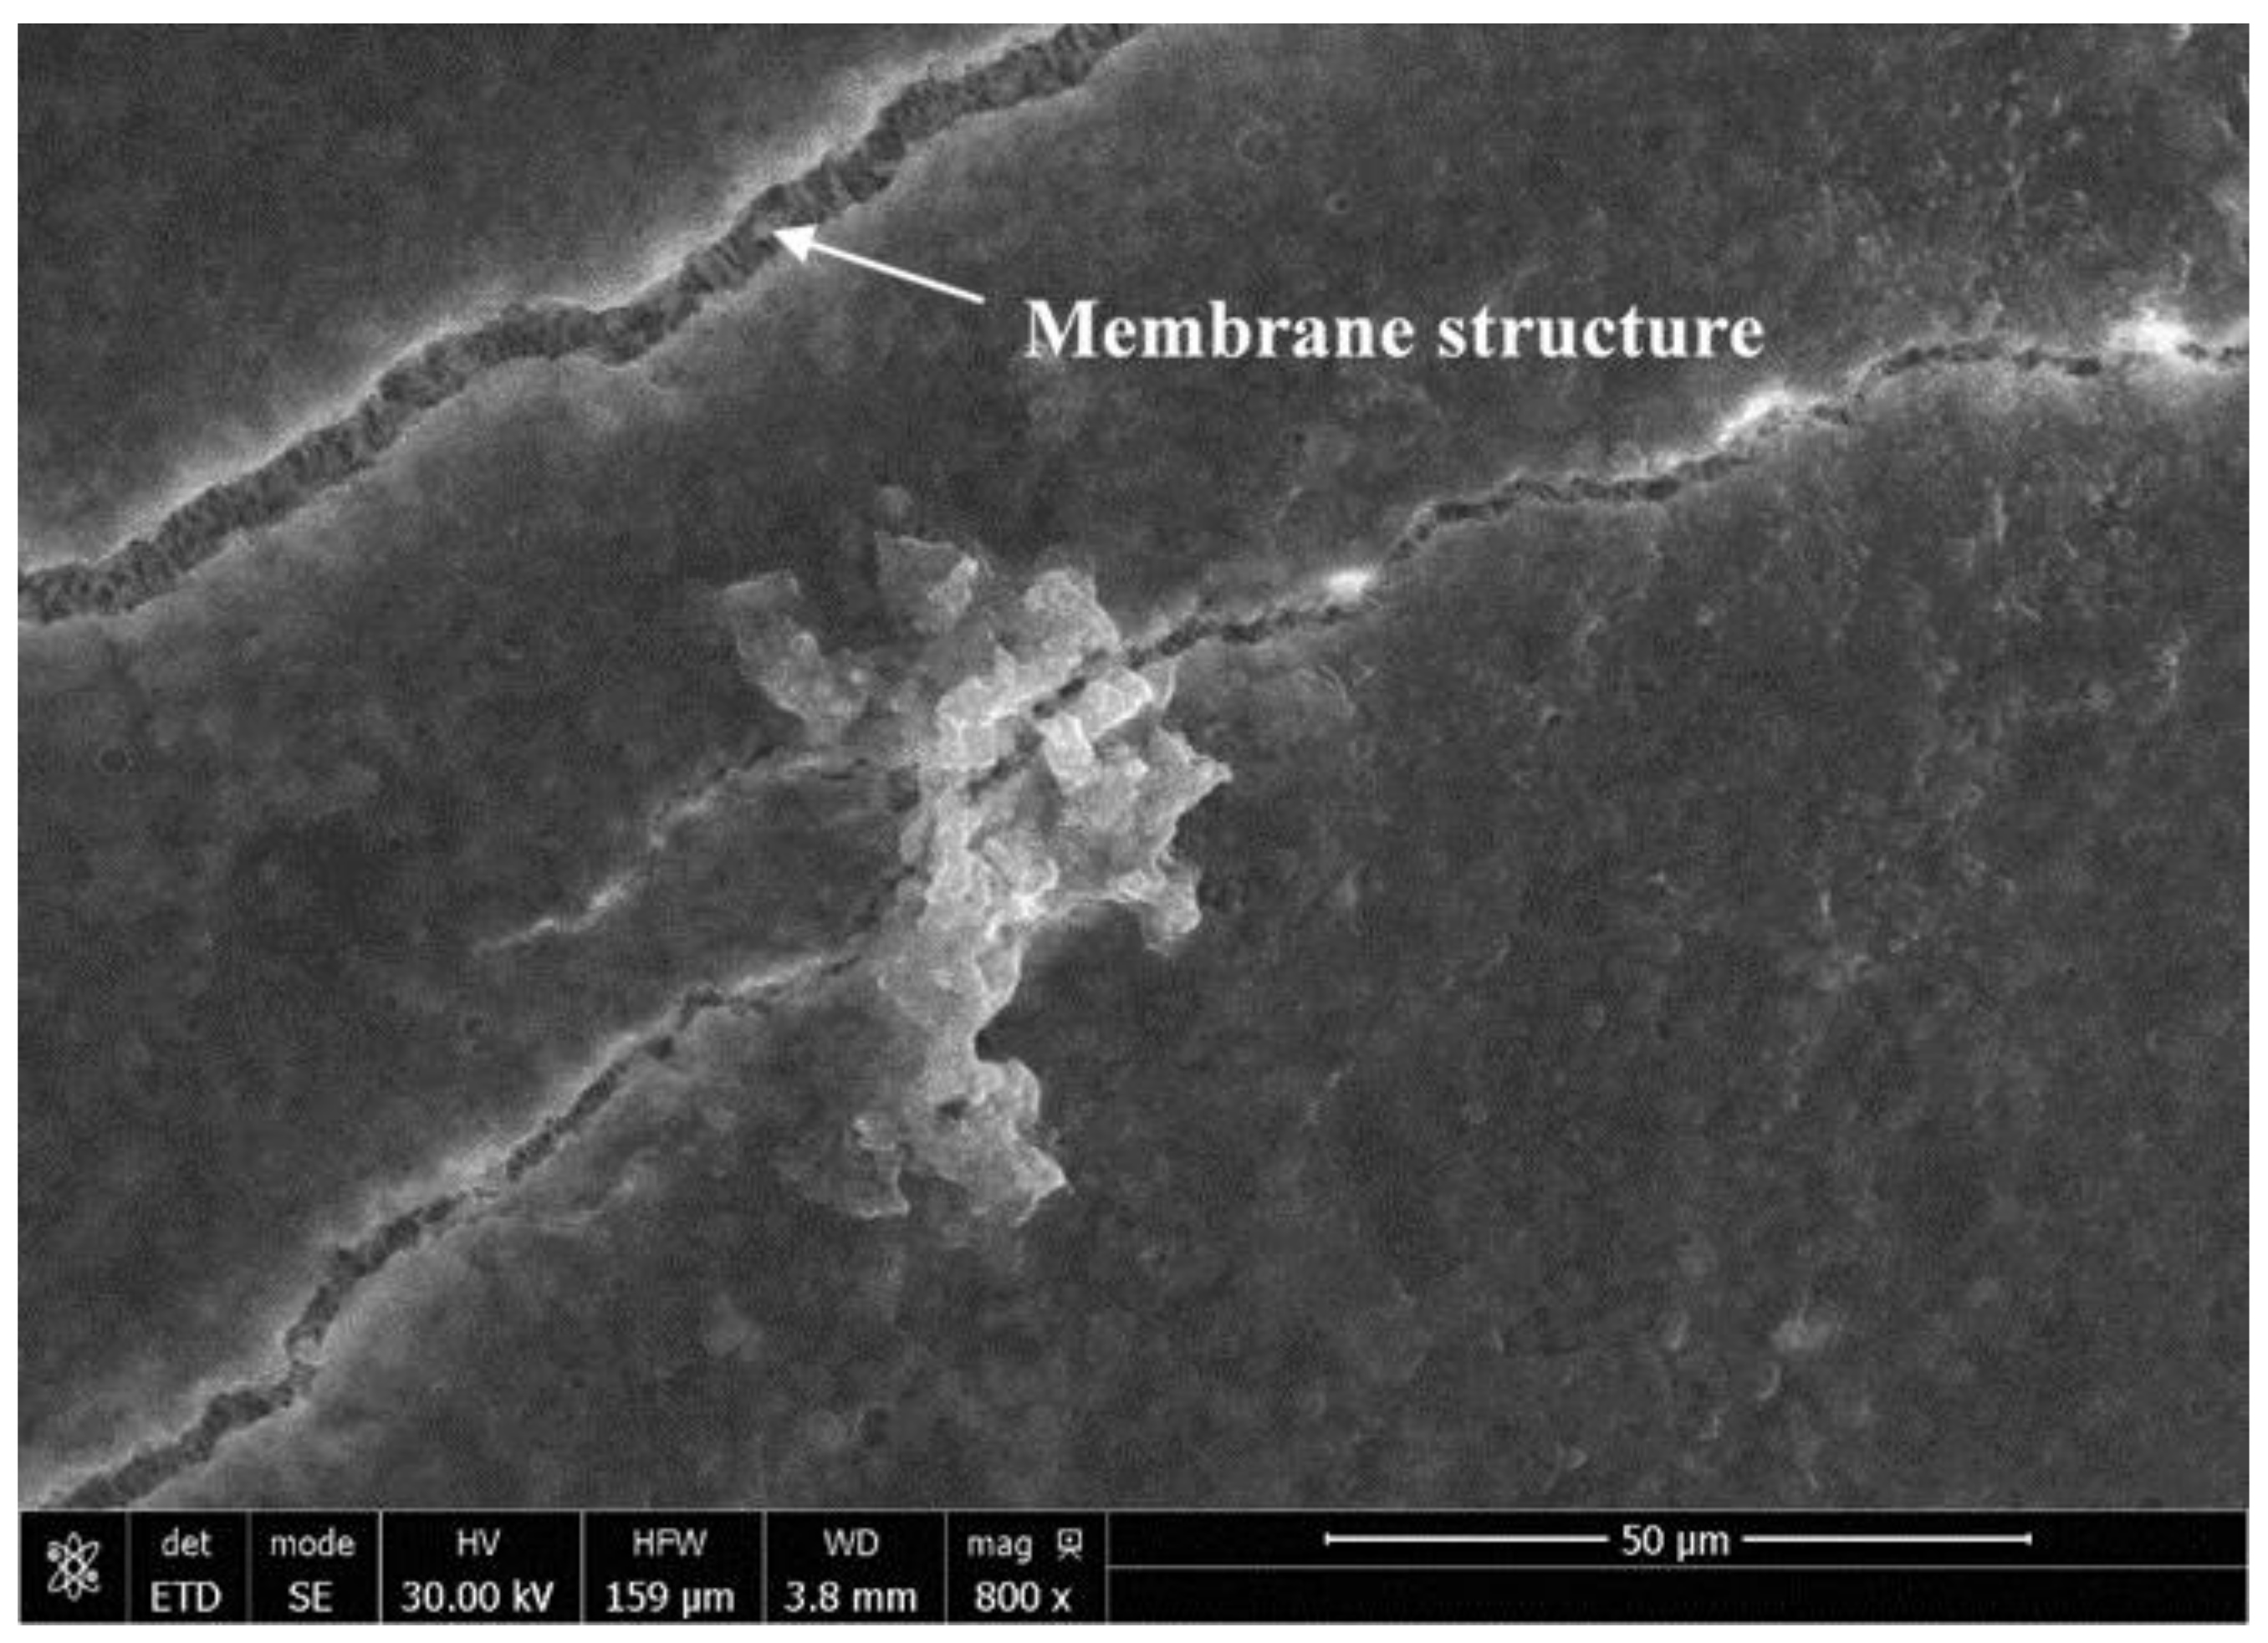
Two types of precipitate fouling experiments, mitigation and prevention, were conducted to examine the effectiveness of mechanical vibration on membrane fouling control. Figure 5 shows the observed water flux, expected water flux, and the average water vapor pressure gradient for a fouling mitigation experiment. Multiple membrane modules with a packing density of 16% were tested to repeat the experiment. For each mitigation experiment, the synthetic FGD wastewater was introduced at the beginning of the experiment, immediately after the module-specific baseline relationship between water flux and average vapor pressure gradient was established for DI water. Water flux reduction was observed in this experiment as soon as the synthetic wastewater was introduced as feed water. The decline was evident when compared to the expected non-fouling water flux estimated using the established baseline relationship. Although the water flux was observed to decline at a rate of about 3.1% per day, the salt rejection remained fairly constant at 99.75% to 99.98% over 200 h. The water recovery rate started off at 0.8% and was reduced to 0.67% before vibration was applied. Mechanical vibration was applied to the membrane module when the water flux declined by about 16% relative to that observed right after the synthetic FGD wastewater was introduced. In this experiment, the vibration was shown to have minimal effect on recovering of water flux, and deposition of precipitates was visible on the membrane surface, as shown in Figure 6. In other repeated experiments, water flux was observed to increase momentarily from the application of vibration, followed by a steeper rate of decline. It was theorized that in addition to surface deposition, the precipitates might have penetrated deep into the membrane after prolonged exposure. Vibration resulted in some detachment of the surface deposition and repositioning of the precipitates in the pore structure, and at times provided temporary relief of the fouling impact.
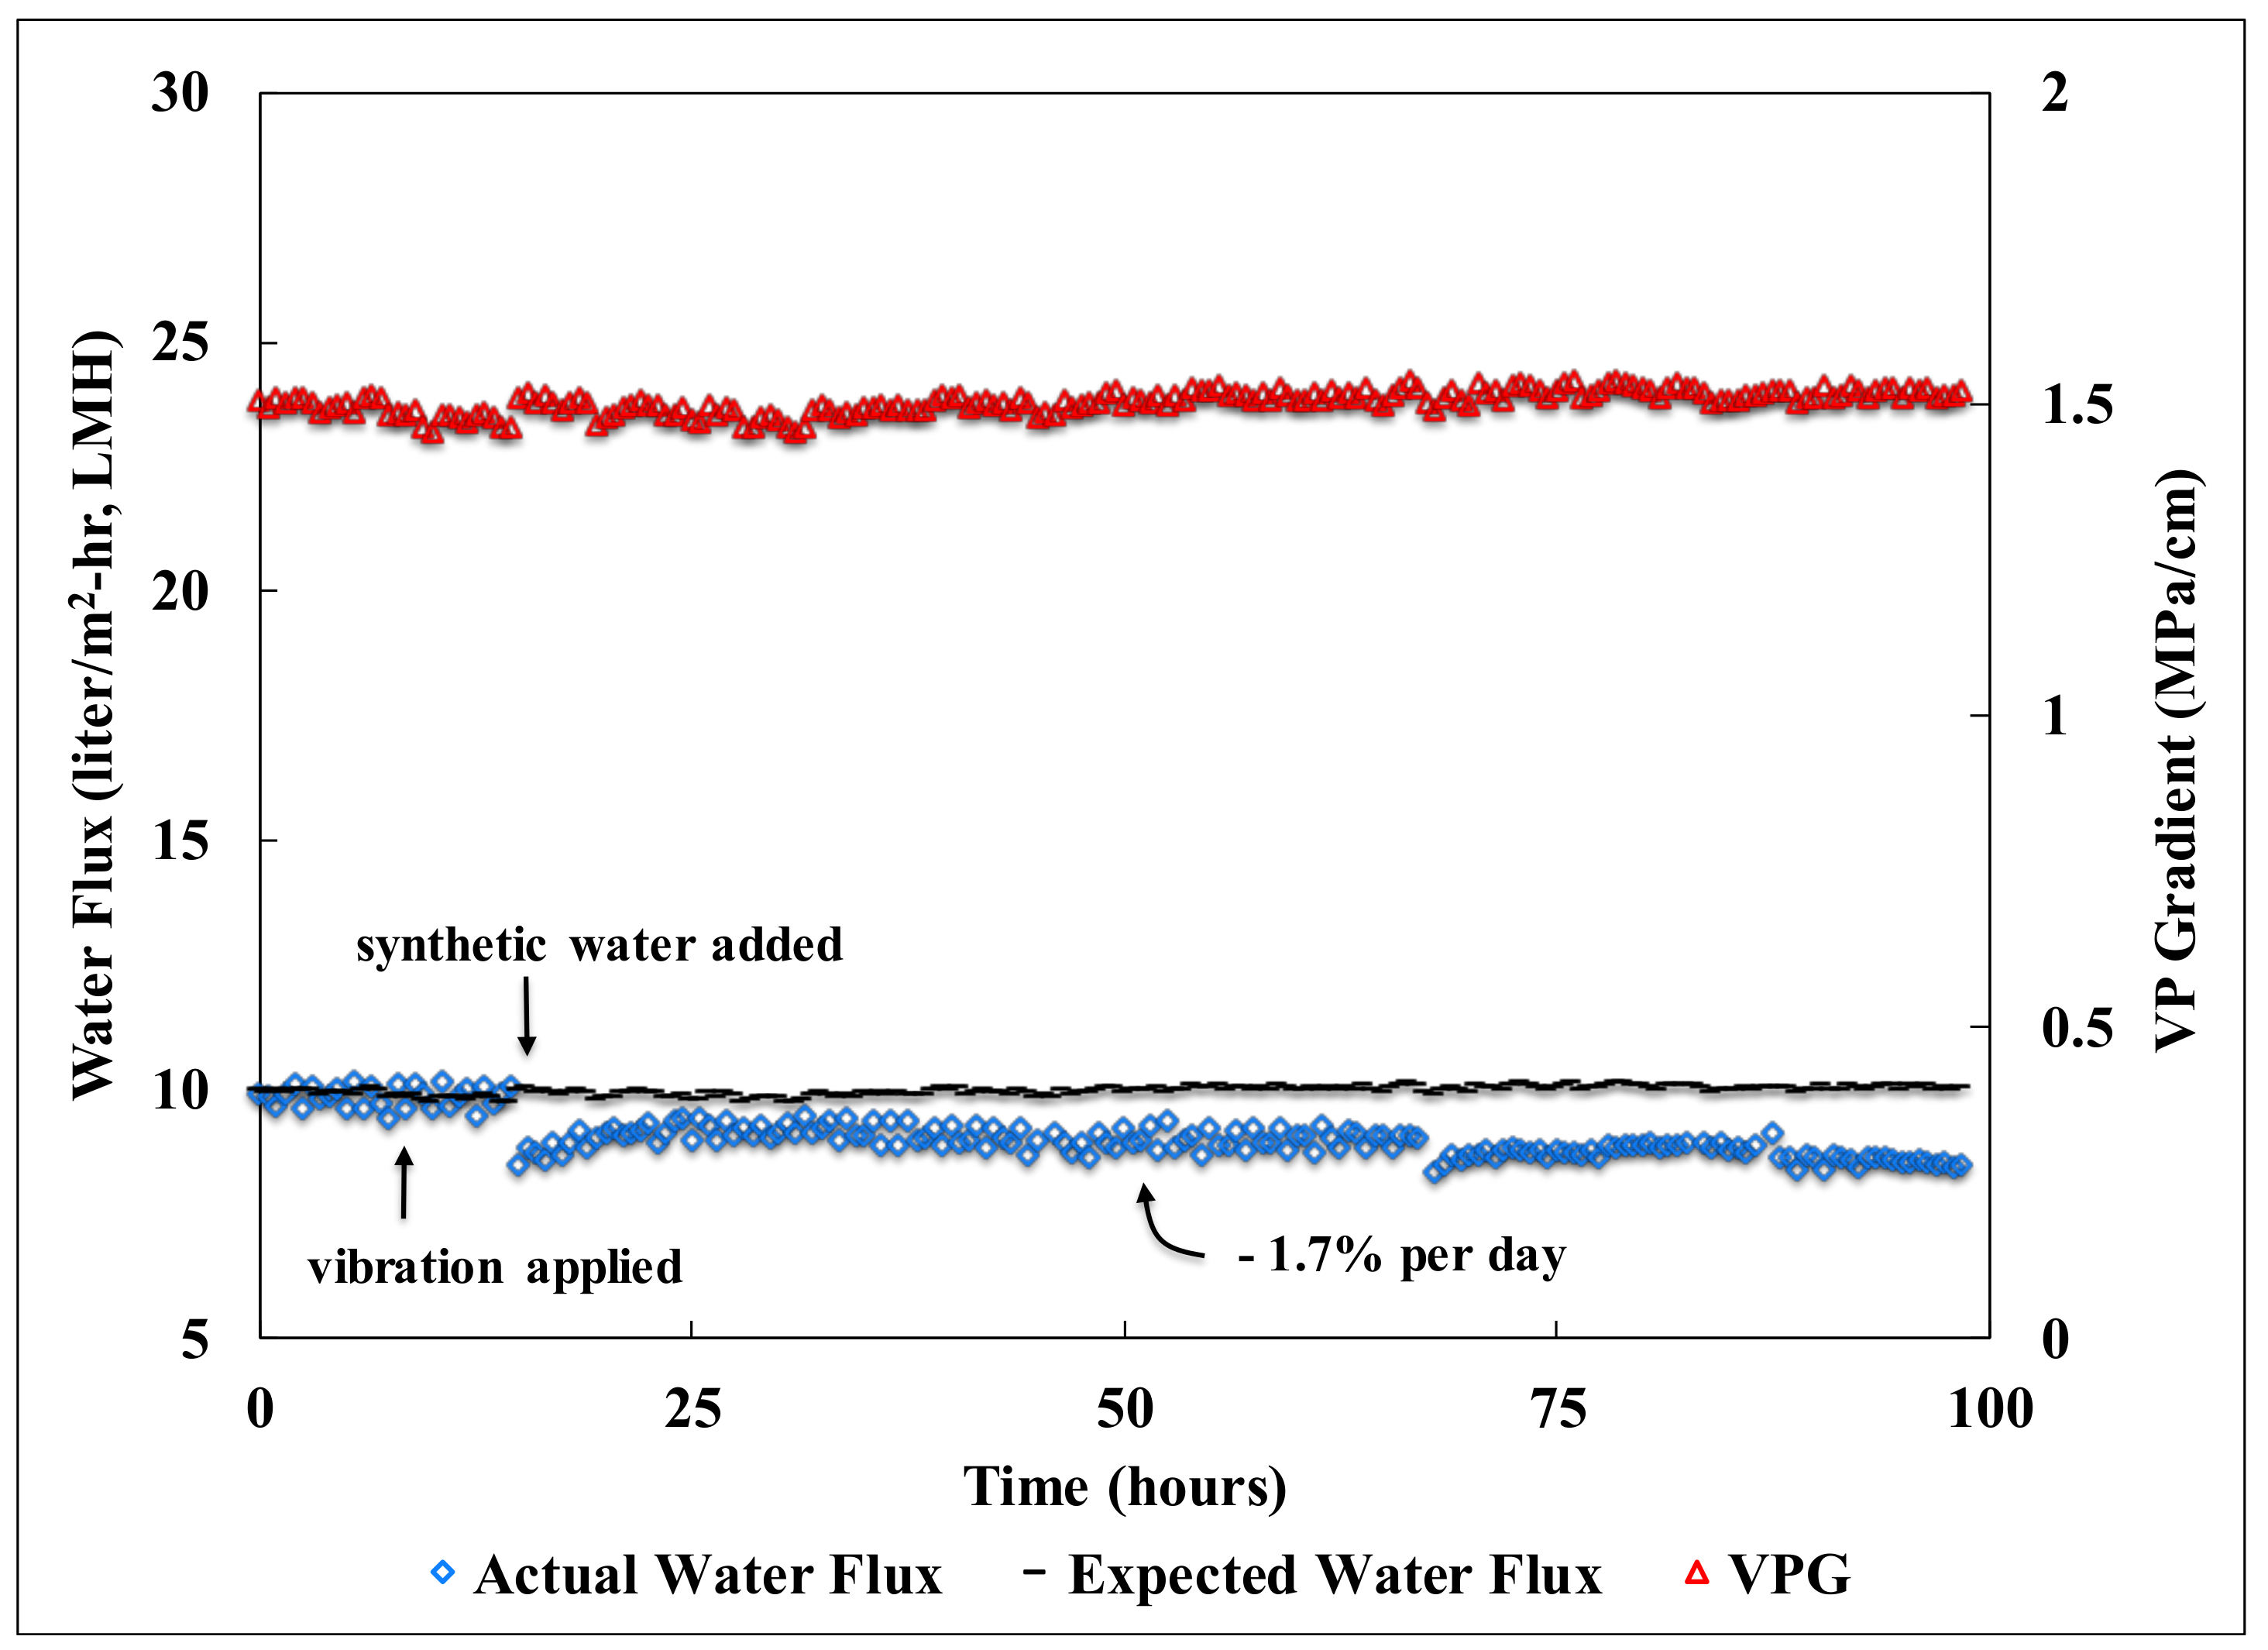
For the fouling prevention experiments, vibrational force was applied to membrane modules with a 16% packing density before the addition of synthetic FGD wastewater. The initial water flux and recovery rate were 20.1 LMH and 0.63%, respectively, for an average vapor pressure gradient of 1.79 MPa/cm. When the FGD feed water was introduced, a very low rate of water flux decline at about 1.67% per day was observed, as shown in Figure 7, and the salt rejection ranged from 99.70% to 99.94%. For DCMD, a high packing density of the module is generally needed in order to increase the permeate production rate per module. It is conceivable that under this condition, the membrane fouling propensity will increase due to high degree of concentration polarization and frequent membrane contact with the foulants [41]. Fouling mitigation experiments were conducted for modules with a packing density of 50%. The fluid velocity on the membrane surfaces was adjusted to match that for the modules with a 16% packing density, so that fluid turbulence on membrane surfaces was equivalent for comparison of the fouling impact. As the packing density increased from 16% to 50%, the water flux observed reduced from 20.1 to 11.4 LMH at an average vapor pressure gradient of 1.79 MPa/cm. The permeate production rate per module, however, almost doubled from 0.17 ml/day to 0.32 ml/day, due to the much larger membrane surface area (3.2 times) in the modules with a 50% packing density. These observed trends of water flux and permeate production rate with packing density is consistent with the findings reported in literature [42]. When the FGD feed water was introduced, a similar rate of water flux decline at 1.7% per day was observed with the application of the vibrational force at the onset of the experiment. Figure 8 shows the membrane performance in a fouling prevention experiment for a module with a 50% packing density. The salt rejection in this experiment fluctuated within a range of 99.8% to 99.9% and the average water recovery rate was calculated to be 1.3%.
4. Conclusions
Wastewater generated from flue gas desulfurization generally contains elevated concentrations of Ca2+ and Mg2+, which can rapidly compromise membrane performance during wastewater reclamation. In this study, low-cost mechanical vibration was evaluated for its effectiveness to replace the commonly-used lime softening as the measure of precipitate fouling control in DCMD. For fouling experiments, water flux decline is frequently used as an indicator of effectiveness for fouling control, and therefore, the experiments must be conducted within the operational limits to ensure that such decline is not a result of membrane pore wetting from improper operations. Liquid entry pressure (LEP) and mass transfer limit (MTL) represent the two main operational constraints for DCMD. The general inclination when operating DCMD is to maximize the water flux by using the largest temperature gradient across a membrane. However, this approach may inadvertently lead to water flux decline once the MTL is exceeded. LEP is another source of concern, since its value decreases with temperature. Ultrasonic vibration has been shown to improve water flux and reduce scaling in MD systems. In this study, low-cost mechanical vibration was tested for the mitigation and prevention of precipitate fouling, mainly in the form of calcite. For membranes with significant reduction of water permeability from exposure to precipitates, applying mechanical vibration did not improve the performance, possibly due to significant surface coating and pore deposition. Initiating mechanical vibration on the DCMD module prior to the exposure of foulants, however, showed significant reduction of membrane fouling as evidenced by the slowed decline of water flux. It is anticipated that for FGD wastewater, the pre-treatment cost of DCMD fouling control can potentially be reduced through a combination of mechanical vibration and other pre-treatment measures. Further studies should be conducted to elucidate the effectiveness of mechanical vibration as a function of frequencies and forces.
Author Contributions
Conceptualization, F.H. and C.M.; methodology, C.M. and F.H.; formal analysis, C.M., F.H., and A.A.; investigation, C.M.; writing—original draft preparation, F.H. and A.A.; writing—review and editing, A.A. and C.M.; funding acquisition, F.H.
Funding
This research was funded by United States National Science Foundation, award number IIA-1301346 to NM EPSCoR and its Osmotic Power Research Group.
Acknowledgments
The authors would like to express our gratitude to Dr. Qiang Wei of Trevi Systems for providing information pertinent to FGD wastewater.
Conflicts of Interest
The authors declare no conflict of interest.
References
- Gleick, P.H. Roadmap for sustainable water resources in southwestern North America. Proc. Natl. Acad. Sci. USA 2012, 107, 21300–21305. [Google Scholar] [CrossRef] [PubMed]
- Angelakis, A.N.; Snyder, S.A. Wastewater treatment and reuse: Past, present, and future. Water 2015, 7, 4887–4895. [Google Scholar] [CrossRef]
- Diehl, T.H.; Harris, M.A.; Murphy, J.C.; Hutson, S.S.; Ladd, D.E. Methods for Estimating Water Consumption for Thermoelectric Power Plants in the United States; Scientific Investigations Report 2013–5188; U.S. Geological Survey, U.S. Department of the Interior: Washington DC, USA, 2013.
- Tow, E.W.; Warsinger, D.M.; Trueworthy, A.M.; Swaminathan, J.; Thiel, G.P.; Zubair, S.M.; Myerson, A.S.; Lienhard, J.H. Comparison of fouling propensity between reverse osmosis, forward osmosis, and membrane distillation. J. Membr. Sci. 2018, 556, 352–364. [Google Scholar] [CrossRef] [Green Version]
- Susanto, H. Towards practical implementations of membrane distillation. Chem. Eng. Process. 2011, 50, 139–150. [Google Scholar] [CrossRef]
- Simone, S.; Figoli, A.; Criscuoli, A.; Carnevale, M.C.; Rosselli, A.; Drioli, E. Preparation of hollow fibre membranes from PVDF/PVP blends and their application in VMD. J. Membr. Sci. 2010, 364, 219–232. [Google Scholar] [CrossRef]
- Wang, P.; Chung, T. Recent advances in membrane distillation processes: Membrane development, configuration design and application exploring. J. Membr. Sci. 2015, 474, 39–56. [Google Scholar] [CrossRef]
- Huang, F.Y.C.; Laumbach, L.; Reprogle, R.; Medin, C. Geothermal Membrane Distillation in Industrial Greenhouse Applications: Membrane Fabrication and Characterization. Environ. Eng. Sci. 2018, 35, 815–828. [Google Scholar] [CrossRef]
- Sukitpaneenit, P.; Chung, T. Molecular elucidation of morphology and mechanical properties of PVDF hollow fiber membranes from aspects of phase inversion, crystallization and rheology. J. Membr. Sci. 2009, 340, 192–205. [Google Scholar] [CrossRef]
- Teoh, M.M.; Chung, T.; Yeo, Y.S. Dual-layer PVDF/PTFE composite hollow fibers with a thin macrovoid-free selective layer for water production via membrane distillation. Chem. Eng. J. 2011, 171, 684–691. [Google Scholar] [CrossRef]
- Li, D.F.; Chung, T.S.; Wang, R.; Liu, Y. Fabrication of fluoropolyimide/polyethersulfone (PES) dual-layer asymmetric hollow fiber membranes for gas separation. J. Membr. Sci. 2002, 198, 211–223. [Google Scholar] [CrossRef]
- Li, D.F.; Chung, T.S.; Wang, R. Morphological aspects and structure control of dual-layer asymmetric hollow fiber membranes formed by a simultaneous co-extrusion approach. J. Membr. Sci. 2004, 243, 155–175. [Google Scholar] [CrossRef]
- Wang, P.; Teoh, M.M.; Chung, T. Morphological architecture of dual-layer hollow fiber for membrane distillation with higher desalination performance. Water Res. 2011, 45, 5489–5500. [Google Scholar] [CrossRef]
- Gryta, M.; Barancewicz, M. Influence of morphology of PVDF capillary membranes on the performance of direct contact membrane distillation. J. Membr. Sci. 2010, 358, 158–167. [Google Scholar] [CrossRef]
- Lawson, K.W.; Lloyd, D.R. Membrane Distillation. J. Memb Sci. 1997, 124, 1–25. [Google Scholar] [CrossRef]
- Li, J.; Guan, Y.; Cheng, F.; Liu, Y. Treatment of high salinity brines by direct contact membrane distillation: Effect of membrane characteristics and salinity. Chemosphere 2015, 140, 143–149. [Google Scholar] [CrossRef]
- Tijing, L.D.; Woo, Y.C.; Choi, J.S.; Lee, S.; Kim, S.H.; Shon, H.K. Fouling and its control in membrane distillation—A review. J. Membr. Sci. 2015, 475, 215–244. [Google Scholar] [CrossRef] [Green Version]
- Warsinger, D.M.; Swaminathan, J.; Guillen-Burrieza, E.; Arafat, H.A.; Lienhard V, J.H. Scaling and fouling in membrane distillation for desalination applications: A review. Desalination 2015, 356, 294–313. [Google Scholar] [CrossRef] [Green Version]
- Fard, A.K.; Rhadfi, T.; Khraisheh, M.; Atieh, M.A.; Khraisheh, M.; Hilal, N. Reducing flux decline and fouling of direct contact membrane distillation by utilizing thermal brine from MSF desalination plant. Desalination 2016, 379, 172–181. [Google Scholar] [CrossRef]
- Gryta, M. Fouling in direct contact membrane distillation process. J. Membr. Sci. 2008, 325, 383–394. [Google Scholar] [CrossRef]
- Alkhudhiri, A.; Darwish, N.; Hilal, N. Membrane distillation: A comprehensive review. Desalination 2012, 287, 2–18. [Google Scholar] [CrossRef]
- Ge, J.; Peng, Y.; Li, Z.; Chen, P.; Wang, S. Membrane fouling and wetting in a DCMD process for RO brine concentration. Desalination 2014, 344, 97–107. [Google Scholar] [CrossRef]
- Peng, Y.; Ge, J.; Li, Z.; Wang, S. Effects of anti-scaling and cleaning chemicals on membrane scale in direct contact membrane distillation process for RO brine concentrate. Sep. Purif. Technol. 2015, 154, 22–26. [Google Scholar] [CrossRef]
- Hou, D.; Wang, Z.; Li, G.; Fan, H.; Wang, J.; Huang, H. Ultrasonic assisted direct contact membrane distillation hybrid process for membrane scaling mitigation. Desalination 2015, 375, 33–39. [Google Scholar] [CrossRef] [Green Version]
- Jaffrin, M.Y. Dynamic shear-enhanced membrane filtration: A review of rotating disks, rotating membranes and vibrating systems. J. Membr. Sci. 2008, 324, 7–25. [Google Scholar] [CrossRef]
- Li, T.; Law, A.W.K.; Cetin, M.; Fane, A.G. Fouling control of submerged hollow fibre membranes by vibrations. J. Membr. Sci. 2013, 427, 230–239. [Google Scholar] [CrossRef]
- Huang, F. Full-Scale Testing of the Global Filter™ System. Final Report for Global Filter, Inc.; Department of Civil and Environmental Engineering, New Mexico Tech: Socorro, NM, USA, 2007. [Google Scholar]
- Zhu, C.; Liu, G. Modeling of ultrasonic enhancement on membrane distillation. J. Membr. Sci. 2000, 176, 31–41. [Google Scholar] [CrossRef]
- Hsu, S.T.; Cheng, K.T.; Chiou, J.S. Seawater desalination by direct contact membrane distillation. Desalination 2002, 143, 279–287. [Google Scholar] [CrossRef]
- Basile, A.; Figoli, A.; Khayet, M. Pervaporation, Vapour Permeation, and Membrane Distillation Principles and Applications; Elsevier Ltd.: Oxford, UK, 2015; pp. 147–377. [Google Scholar]
- Wei, Q.; (Trevi Systems, Petaluma, CA, USA). Personal communication, 2018.
- Sinha, A. Vibration of Mechanical Systems; Cambridge University Press: New York, NY, USA, 2010. [Google Scholar]
- Hibbeler, R.C. Engineering Mechanics: Statics, 11th ed.; Pearson Prentice Hall: Upper Saddle River, NJ, USA, 2007. [Google Scholar]
- Su, M.; Teoh, M.M.; Wang, K.Y.; Su, J.; Chung, T.S. Effect of inner-layer thermal conductivity on flux enhancement of dual-layer hollow fiber membranes in direct contact membrane distillation. J. Membr. Sci. 2010, 364, 278–289. [Google Scholar] [CrossRef]
- Parkhust, D.L.; Appelo, C.A. User’s Guide to PHREEQC (Version 2)—A Computer Program for Speciation, Batch-Reaction, One-Dimensional Transport, and Inverse Geochemical Calculations; Water-Resources Investigations Report; U.S. Geological Survey, U.S. Department of the Interior: Denver, CO, USA, 1999.
- Snoeyink, V.L.; Jenkins, D. Water Chemistry; John Wiley & Sons: New York, NY, USA, 1980. [Google Scholar]
- Brady, P.V. Surface complexation and mineral growth: Sepiolite. In Proceedings of the 7th International Symposium on Water-Rock Interaction, Park City, UT, USA, 13–18 July 1992; Kharaka, Y.K., Maest, A.S., Eds.; A.A. Balkema: Rotterdam, The Netherlands, 1992. [Google Scholar]
- Azimi, G.; Papangelakis, V.G.; Dutrizac, J.E. Modelling of calcium sulphate solubility in concentrated multi-component sulphate solutions. Fluid Phase Equilibria 2007, 260, 300–315. [Google Scholar] [CrossRef]
- Alexander, G.B.; Heston, W.M.; Iler, R.K. The solubility of amorphous silica in water. J. Phys. Chem. 1954, 58, 453–455. [Google Scholar] [CrossRef]
- Dabb, L.M. Calcium Carbonate Dissolution and Precipitation in Water: Factors Affecting the Carbonate Saturometer Method. M.S. Thesis, Utah State University, Logan, UT, USA, 1971. [Google Scholar]
- Medin, C. Prevention and Mitigation of Hollow Fiber Membrane Fouling in Direct Contact Membrane Distillation Applications. M.S. Thesis, New Mexico Institute of Mining and Technology, Socorro, NM, USA, 2018. [Google Scholar]
- Paiz, J. Module Packing Density and Performance Optimization for Hollow Fiber Direct Contact Membrane Distillation. M.S. Thesis, New Mexico Institute of Mining and Technology, Socorro, NM, USA, 2018. [Google Scholar]
Figure 1.
The general process flow diagram of the lab-scale DCMD setup.
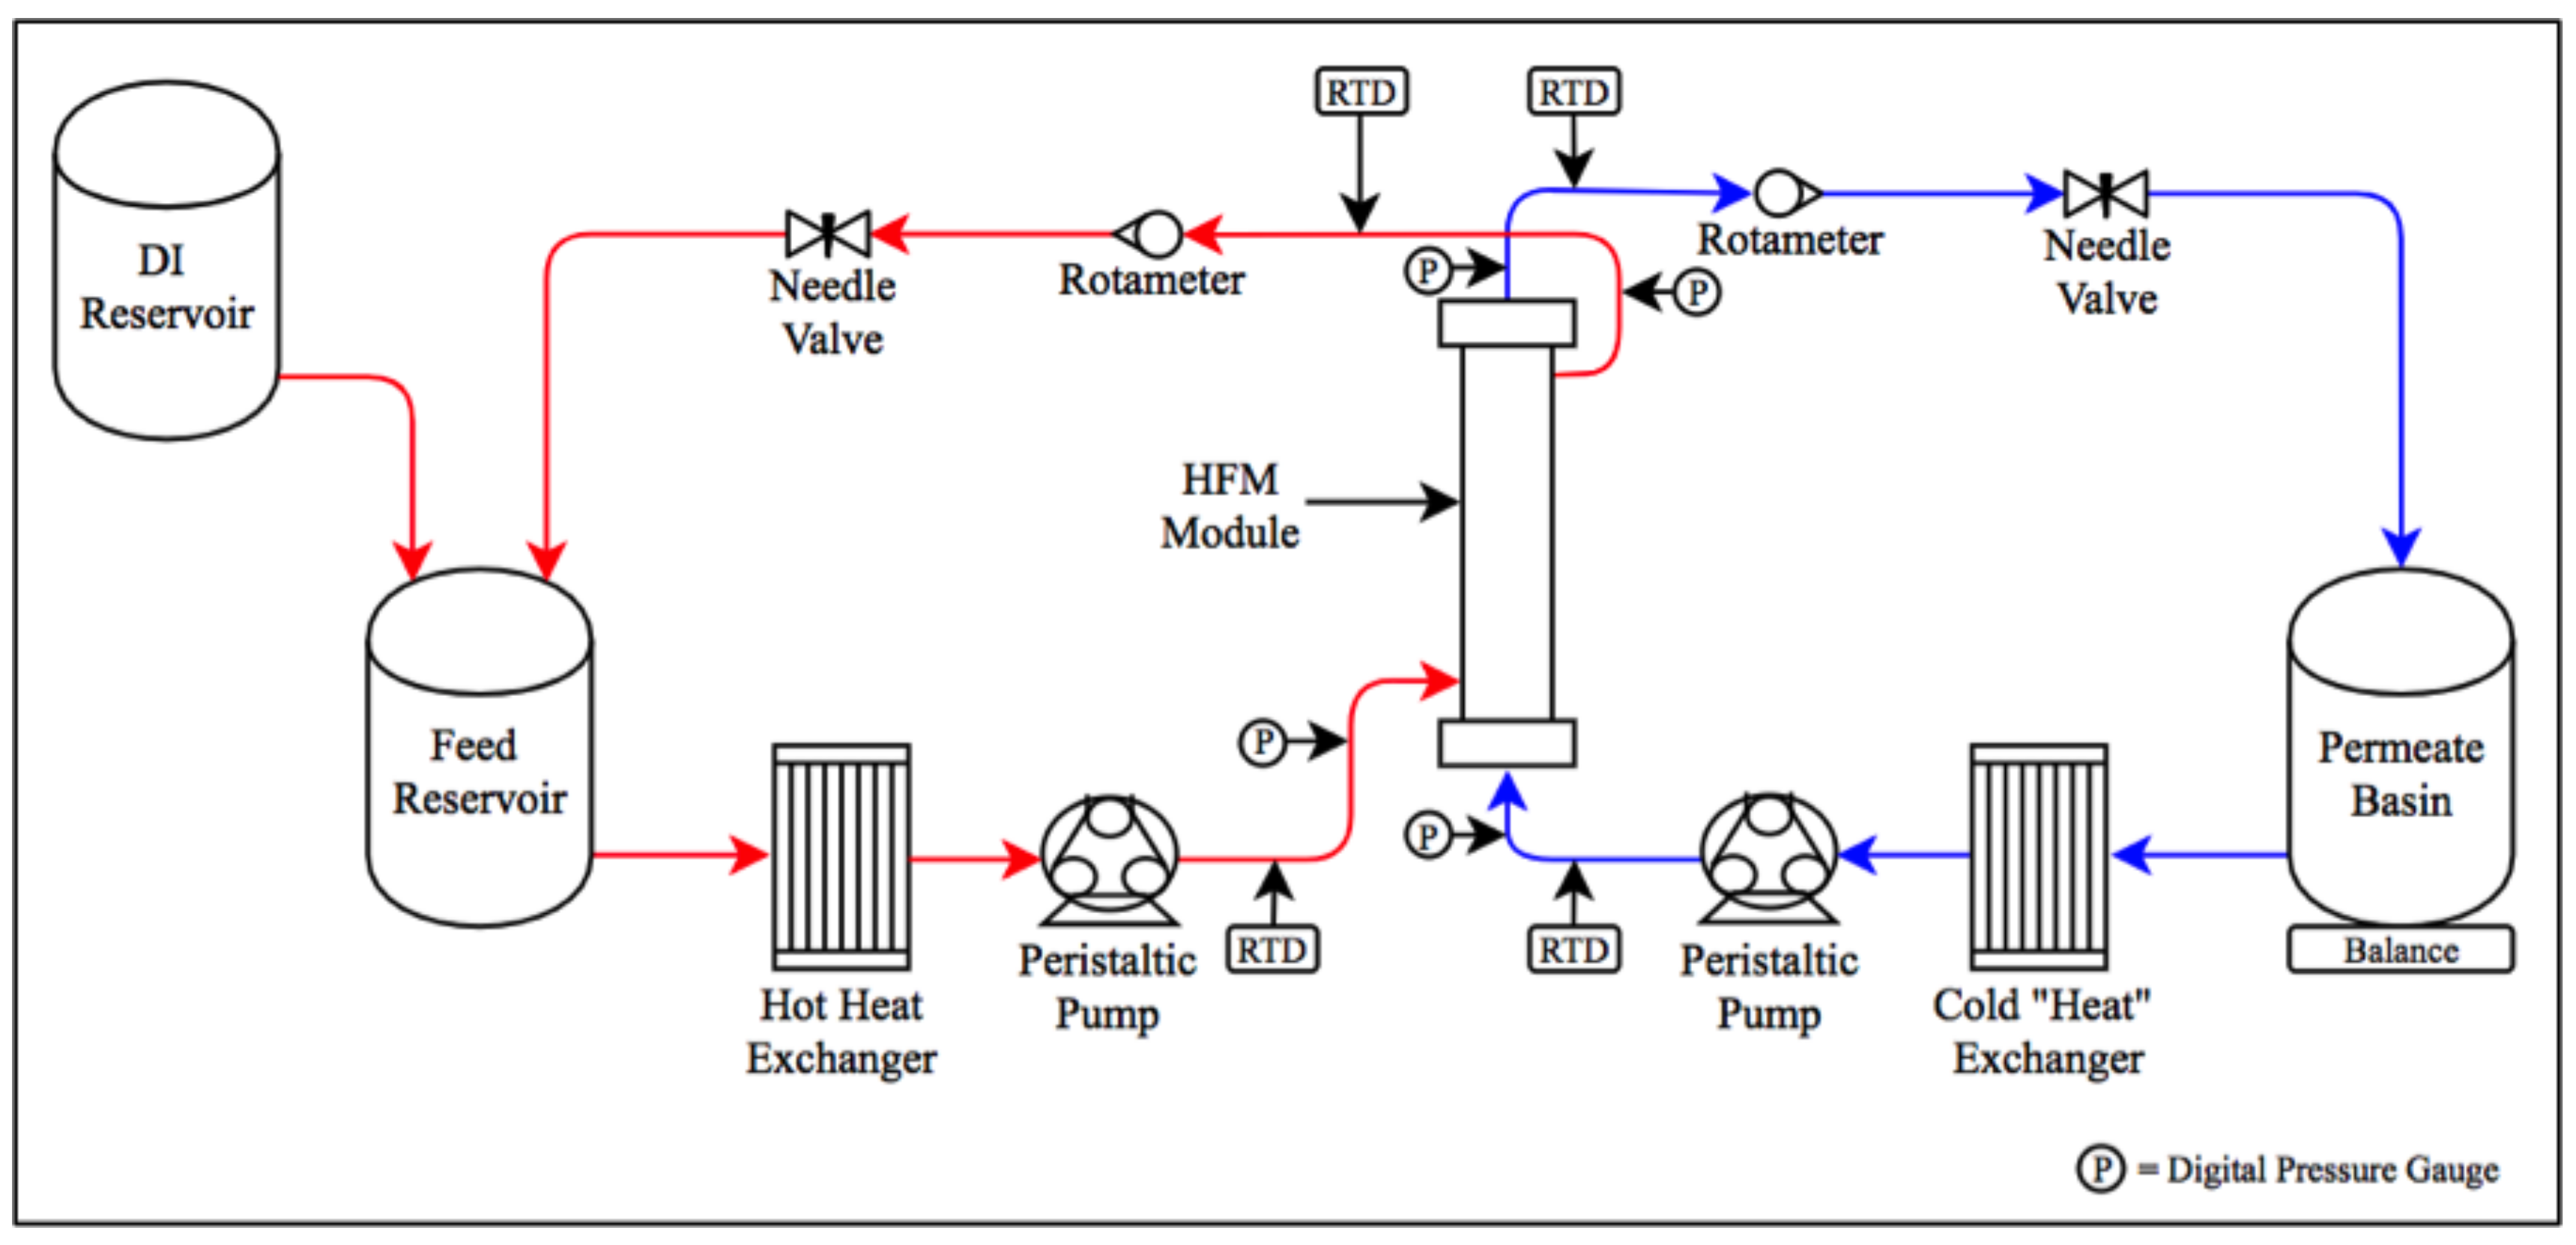
Figure 2.
Morphology of the PVDF membrane (a) cross-section (b) sponge/macrovoid layer (c) sponge layer (d) external surface.
Figure 2.
Morphology of the PVDF membrane (a) cross-section (b) sponge/macrovoid layer (c) sponge layer (d) external surface.
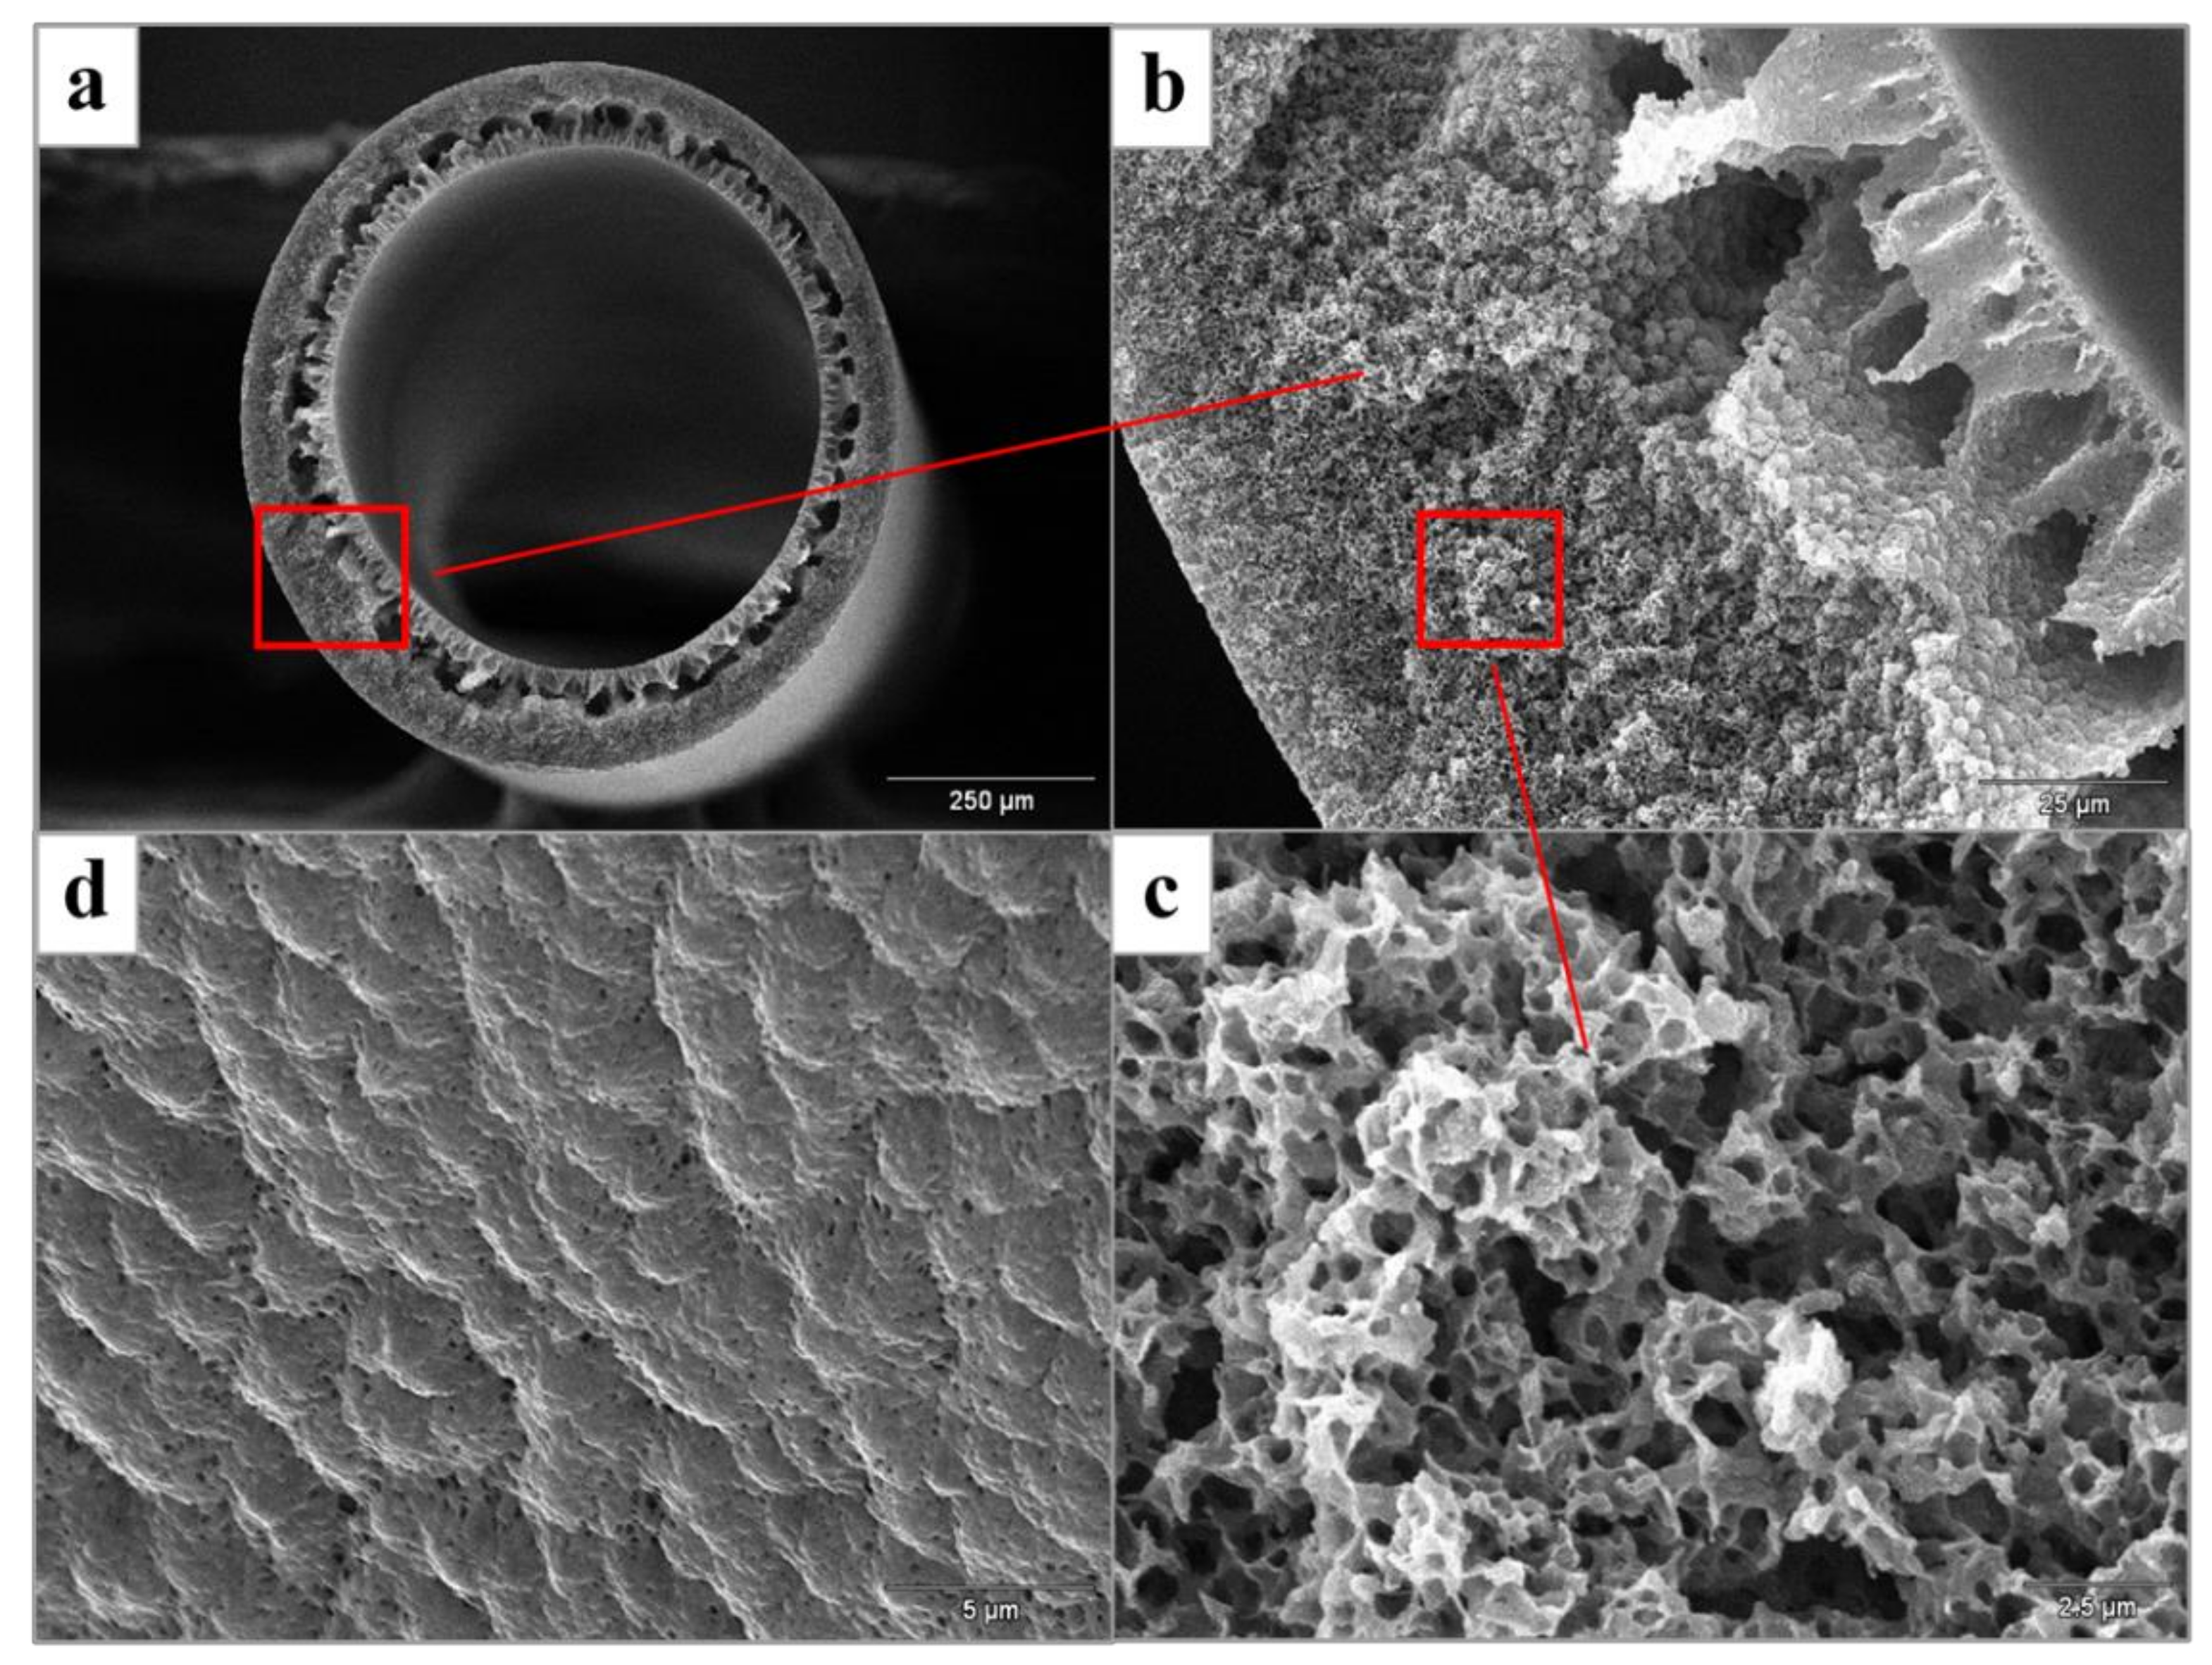
Figure 3.
Water flux versus average water vapor pressure gradients.
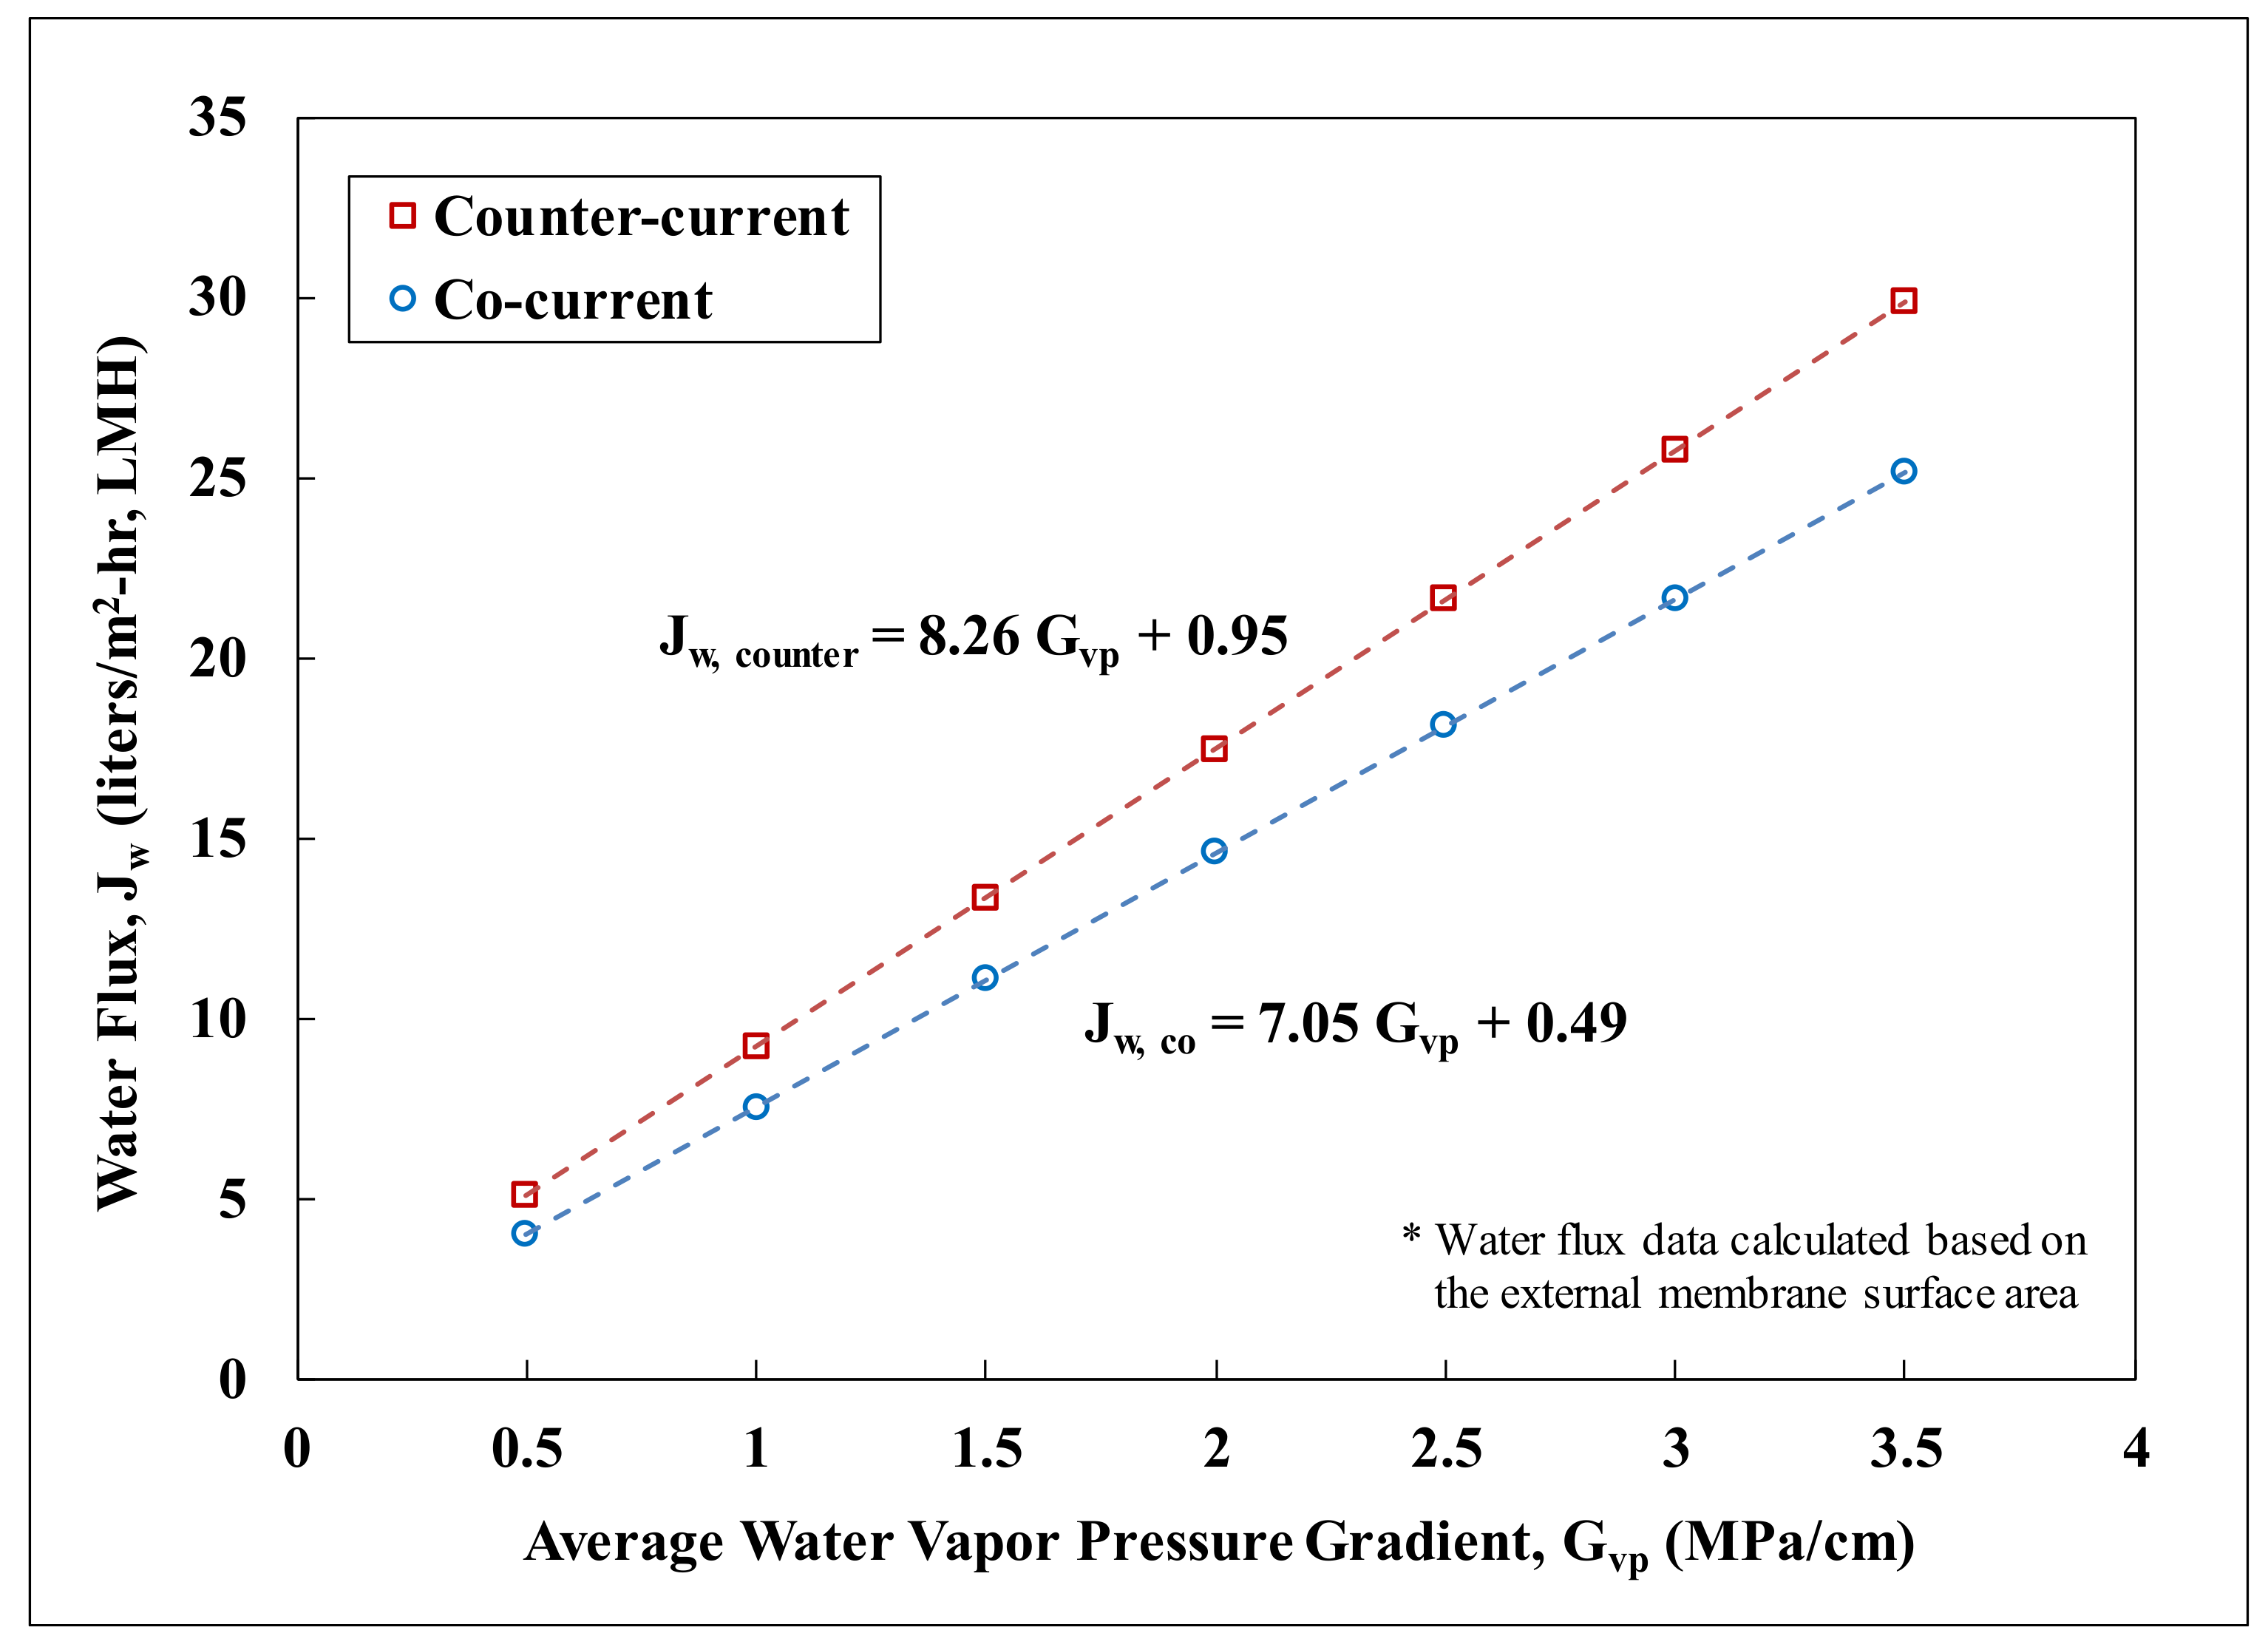
Figure 4.
LEP versus hot-side inlet temperature.

Figure 5.
Membrane performance with the application of mechanical vibration for fouling mitigation. Other experimental conditions: the synthetic FGD wastewater as the feed, module packing density was 16%.
Figure 5.
Membrane performance with the application of mechanical vibration for fouling mitigation. Other experimental conditions: the synthetic FGD wastewater as the feed, module packing density was 16%.

Figure 6.
Deposition of precipitates on the surface of hollow fiber membrane at the conclusion of the fouling mitigation experiment. Membrane structure was visible through the cracks of the precipitates.
Figure 6.
Deposition of precipitates on the surface of hollow fiber membrane at the conclusion of the fouling mitigation experiment. Membrane structure was visible through the cracks of the precipitates.

Figure 7.
Membrane performance with the application of mechanical vibration for fouling prevention. Other experimental conditions: the synthetic FGD wastewater as the feed, module packing density was 16%.
Figure 7.
Membrane performance with the application of mechanical vibration for fouling prevention. Other experimental conditions: the synthetic FGD wastewater as the feed, module packing density was 16%.

Figure 8.
Membrane performance with the application of mechanical vibration for fouling prevention. Other experimental conditions: the synthetic FGD wastewater as the feed, module packing density was 50%.
Figure 8.
Membrane performance with the application of mechanical vibration for fouling prevention. Other experimental conditions: the synthetic FGD wastewater as the feed, module packing density was 50%.


Table 1.
Conditions of the Fiber Spinning Process.
| Spinning Parameters | Values |
|---|---|
| Dope solution | |
| PVDF/EG/NMP, wt% | 12/12/76 |
| Bore solution | |
| IPA/DI, wt% | 60/40 |
| Coagulation bath | |
| IPA/DI, wt% | 60/40 |
| Flow rate, ml/min | |
| dope solution | 1 |
| bore solution | 1 |
| Air-gap distance, cm (inch) | 15.24 (6) |
| Take-up velocity, m/min | 1.2 |
| Coagulation temperature, °C | 20 ± 1 |
Table 2.
Compositions of the FGD Wastewater and Simulated Water *.
| Parameter | FGD Wastewater | Synthetic FGD Water |
|---|---|---|
| Ca2+ | 679.7 | 679.7 |
| Mg2+ | 527 | 527 |
| K+ | 88.5 | 88.5 |
| Na+ | 6195.4 | 6195.4 |
| NH4+ | 76.8 | 76.8 |
| Fe2+ | 0.12 | na ** |
| Cu2+ | 0.05 | na ** |
| F- | 17.7 | 17.7 |
| Cl- | 9823 | 9530 |
| SO42- | 3704.3 | 3704.3 |
| NO3- | 139 | 139 |
| Si (as SiO2) | 19.85 | 19.85 |
| Alkalinity (as CaCO3) | 297.4 | 297.4 |
| pH | 8.34 | 8.34 |
| TDS | 22230 | 21140 |
| Temperature (°C) | 50-70 | 70 |
* Units are in mg/L unless otherwise noted. ** Not added.
Table 3.
Characteristics of the PVDF Hollow Fiber Membranes.
| Membrane Characteristic | PVDF |
|---|---|
| Outer diameter (µm) * | 779 ± 18 |
| Wall thickness (µm) * | 112 ± 13 |
| Pore size (µm) | 0.319/0.333/0.422 ** |
| Porosity | 0.79 ± 0.05 |
| Failure stress (MPa) | 6 |
| Young’s modulus (MPa) | 35 |
* nominal size based on SEM image post-processing. ** minimum pore size/mean pore size/maximum pore size.
Table 4.
Potential Precipitates and the Corresponding Saturation Indices a.
| Potential Precipitate | SI of the Feed b | Retrograde Soluble c |
|---|---|---|
| Calcite, CaCO3 | 1.77 | yes |
| Sepiolite, Mg4Si6O15(OH)2⋅6H2O | 8.44 | yes |
| Silica (amorphous), SiO2 | −1.32 | no |
| Gypsum, CaSO4 | −0.22 | yes |
© 2019 by the authors. Licensee MDPI, Basel, Switzerland. This article is an open access article distributed under the terms and conditions of the Creative Commons Attribution (CC BY) license (http://creativecommons.org/licenses/by/4.0/).
Share and Cite
MDPI and ACS Style
Huang, F.Y.C.; Medin, C.; Arning, A. Mechanical Vibration for the Control of Membrane Fouling in Direct Contact Membrane Distillation. Symmetry 2019, 11, 126. https://doi.org/10.3390/sym11020126
AMA Style
Huang FYC, Medin C, Arning A. Mechanical Vibration for the Control of Membrane Fouling in Direct Contact Membrane Distillation. Symmetry. 2019; 11(2):126. https://doi.org/10.3390/sym11020126
Chicago/Turabian StyleHuang, Frank Y.C., Carolyn Medin, and Allie Arning. 2019. "Mechanical Vibration for the Control of Membrane Fouling in Direct Contact Membrane Distillation" Symmetry 11, no. 2: 126. https://doi.org/10.3390/sym11020126
Note that from the first issue of 2016, this journal uses article numbers instead of page numbers. See further details here.