A Generalised Bayesian Inference Method for Maritime Surveillance Using Historical Data


1
Intelligent Transport System Research Center, Wuhan University of Technology, Wuhan 430068, China
2
College of Marine Sciences, Minjiang University, Fuzhou 350108, China
3
Department of Electrical, Electronic & Computer Engineering, University of Pretoria, Pretoria 0002, South Africa
4
School of Mechanical, Materials, Mechatronic and Biomedical Engineering, University of Wollongong, Wollongong, NSW 2522, Australia
*
Author to whom correspondence should be addressed.
Symmetry 2019, 11(2), 188; https://doi.org/10.3390/sym11020188
Submission received: 30 November 2018
/
Revised: 30 January 2019
/
Accepted: 31 January 2019
/
Published: 8 February 2019
(This article belongs to the Special Issue Symmetry in Mechanical Engineering)
Abstract
:In practice, maritime monitoring systems rely on manual work to identify the authenticities, risks, behaviours and importance of moving objects, which cannot be obtained directly through sensors, especially from marine radar. This paper proposes a generalised Bayesian inference-based artificial intelligence that is capable of identifying these patterns of moving objects based on their dynamic attributes and historical data. First of all, based on dependable prior data, likelihood information about objects of interest is obtained in terms of dynamic attributes, such as speed, direction and position. Observations on these attributes of a new object can be obtained as pieces of evidence profiled as probability distributions or generally belief distributions if ambiguity appears in the observations. Using likelihood modelling, the observed pieces of evidence are independent of the prior distribution patterns. Subsequently, Dempster’s rule is used to combine the pieces of evidence under consideration of their weight and reliability to identify the moving object. A real world case study of maritime radar surveillance is conducted to validate and prove the efficiency of the proposed approach. Overall, this approach is capable of providing a probabilistic and rigorous recognition result for pattern recognition of moving objects, which is suitable for any other actively detecting applications in transportation systems.
1. Introduction
In diverse transportation systems, the concerns about management efficiency and public safety bring forward high request to sensor networks [1,2,3]. To obtain more detailed and real-time information of traffic objects, varieties of powerful sensors have been invented and equipped, leading to information explosions [4,5,6]. For example, IMO (International Marine Organization) demands all the ports and vessels to equip Radar, AIS (Automatic Identification System) and satellite monitoring systems [7]. It can be inferred that the operators of transportation systems have to deal with much information, which requires them to choose, filter and determine useful data [8]. In practice, there are limitations respectively in different kinds of sensors. Meanwhile, it is widely recognised that information from multisources will conflict frequently with each other. Hence, the radar systems are still the most reliable tool for the maritime surveillance in vessel transportation systems [9].
However, radars generally provide multiple objects indiscriminately. Even worse, the sensors often misunderstand the behaviours of targets, leading to management difficulties [10]. To address this issue, sensor manufactures have paid enormous effort to improve the sensitivity and the capability of noise suppression. For example, the late-model marine radar is capable of tracking a 0.5-square metre target at a distance of 5 miles [9]. However, the differences between a drowning person, a clump of sea-grass and a canoe cannot be obtained from radars [11]. In fact, high sensitivity will bring more false and useless information. Therefore, most radar monitoring systems need manual assistant to identify moving targets, such as whether the corresponding object is a moving or anchoring [12]. Nevertheless, in most situations where many nondistinctive false or unimportant targets appear on the screen will distract the attention of supervisors. In the increasingly crowded harbours, the manual identification becomes impractical. For instance, downstream of the Yangtze Rivers, there might be 20,000 vessels passing through during peak hours. It is impossible to ensure that any single radar object is inspected manually [13,14]. Therefore, it is practical to propose an intelligent approach to identify the patterns of objects, which will reduce the burden of supervisors observably and improve the safety.
It is possible to establish the correlations between dynamic attributes and the patterns of moving targets based on historical data [15]. Hence, a probabilistic inference is appropriate for identifying the objects [16]. It is worth noting that the prior distribution of patterns is generally an indispensable part in conventional probabilistic inference process [17]. However, it is very difficult to estimate or observe in practice. For instance, in coastal radar surveillance, blips caused by noises might confuse the supervisors and need further identification on their authenticity. However, the proportion of false targets is erratic and will be affected by weather, blocks and other factors. Therefore, in the former research, the assumptions of prior distribution have to be made before the probabilistic inference process [18]. Actually, supervisors normally do not take such a proportion or prior distribution into consideration, but would like to identify the blips with the correlations between authenticities and dynamic attributes such as speed, course and location. For instance, a vessel is barely allowed to operate at a speed higher than 30 knots in the Yangtze Rivers. As a result, the speed, trajectory or other attributes can be used to build the correlations through data mining. However, very limited work has been done to address this issue by building a relationship between the attributes and patterns of moving objects without prior pattern distributions.
In order to bridge this research gap, a new method is proposed in this work using the Evidential Reasoning (ER) rule [19] to model the correlations the attributes and patterns of moving objects and make the conjunctive inference. Different from conventional Bayesian inference, the ER rule no longer needs a prior pattern distribution for inference as it constitutes a likelihood-based inference process [20]. Using the likelihood-based inference process, multiple pieces of evidence can be generated from multisource-verified samples and human experts. Meanwhile, the ER rule provides a probabilistic process for the conjunctive combination of independent evidence, while the quality of data can be taken into account in the form of evidence reliability. Experimental data acquired from the Yangtze Rivers have been used to demonstrate the effectiveness of the proposed method for maritime surveillance.
2. Related Work
As discussed, the dynamic attributes, including speed, course and trajectory, are the kernel evidence for manual identification. These attributes are widely studied in pattern recognition for transportation systems. In general, the recognition methods can be divided into two categories: nonprobabilistic inference and probabilistic inference.
2.1. Nonprobabilistic Inference Identification
Nonprobabilistic inference relies on the attributes in vector space or self-adapted classification model, which is not based on probability theory. Generally, it is more widely used. Typical algorithms include fuzzy k-means (FCM) [21], k Nearest Neighbour (KNN) [22], principal component analysis (PCA) [23], support vector machine (SVM) and artificial neural network (ANN) [24].
The k-means is popular for cluster analysis in data mining. It divides the observations into k clusters in which each observation belongs to the cluster with the nearest mean, serving as a prototype of the cluster. In FCM observation can belong to more than one cluster. Ma et al. [10] proposed a method on classification to identify the false targets in maritime radar surveillance using FCM, and the accuracy reached 91.0%. Tang et al. [21] used FCM to identify missing data in traffic perception. However, the problem of FCM recognition is that the model could not give the probabilities to individual groups and there is no clear meaning for distances in vector space. Different from FCM, KNN does not specify the edges of different groups, but use the distance to nearest neighbour points as the basis for classification. Zheng et al. [22] uses KNN-enhanced constrained linearly sewing principle to recognize the traffic pattern and predict the traffic flow. It found that KNN is suitable for datasets with incomplete information.
Generally, more attributes would lead better pattern recognition. However, too many attributes would increase the computation difficulty. Therefore, PCA is proposed to address this problem by using an orthogonal transformation to convert a set of possibly correlated variables into a set of linearly uncorrelated variables. Jin et al. [23] used an improved PCA-based method to identify abnormal traffic flow pattern isolation and loop detector fault detection.
SVM adopts supervised learning to analyse data and recognize patterns. Although SVM and its improved algorithms have proven to be effective in transportation research, the problem is that the classification in vector space is based on morphological characteristics which have no physical meaning to the real world. In addition to SVM, ANN is another nonprobabilistic method for pattern recognition in transportation research. Srinivasana et al. [25] proposed an ANN model based on reduced multivariate polynomial pattern classifier for freeway incident detection. With enough training samples, ANN could solve the best solution and be able to restrain the noise efficiently. Different from SVMs, ANN does not need a vector space for illustration and modelling.
In summary, nonprobabilistic recognition algorithms are efficient for applications with complete prior probability in transportation systems. However, it is difficult to deal with uncertainties using nonprobabilistic recognition algorithms.
2.2. Probabilistic Inference Identification
In traffic object detection, all the dynamic attributes are quantitative data, which can be acquired from various sensor systems. Therefore, the probabilistic inference identification is feasible in transportation systems. The commonly used methods include Gaussian mixture model (GMM), Bayes’ rule, Dempster’s rule, Evidence Combine rule (ECR), probability box and ER rule. GMM refers to a mixture model that is a probabilistic model for representing the presence of subpopulations within an overall population. With a specific prior distribution discovered from historical data, any observation could be defined into groups according to probability [14]. In the circumstances with incomplete prior data GMM assumes all the random process obeys indeterminate Gaussian distribution. Xia et al. [6] proposed a GMM for vehicle segmentation for traffic flow estimation.
Bayes’ rule is suitable for applications with abundant and sufficient prior samples. However, Bayes’ rule strictly requires that the elements in discrimination framework must be independent and all the source information should be reliable and equally treated. Furthermore, the prior distribution in the discrimination framework should be stable. Bayesian Network (BN) can overcome these problems and is highly accepted in the uncertain inference [26]. Zhang et al. [16] used BN to reason the block risk in the Yangtze River. The BN provides a conjunctive probabilistic inference, and keep the consistency with Bayes’ rule. Besides BN, Dempster’s rule is another method for probabilistic inference, which constitutes a conjunctive probabilistic process. ECR is a derivative of Dempster’s rule [27] and is used to address the paradoxes and counterintuitive problems, such as the Yager’s rule, Dubois and Prade’s rule [28]. The literature review indicates that the probabilistic inference methods are suitable for traffic object identification if multisource prior information is provided [29,30,31,32]. The combination of Bayesian reference logic and Dempster’s rule is appropriate to address the characteristic discrimination problem in traffic objects. To our best knowledge, the Bayesian reference based Dempster’s rule method has not been found to model the uncertainty and detect moving objects in transportation systems.
3. The Proposed Approach
3.1. Likelihood Modelling
To satisfy the conceivable dependency of propositions, Dempster’s rule is investigated on a power set . Suppose is the set of mutually exclusive and collectively exhaustive propositions, with (), where denotes an empty set and refers to a frame of discernment. A Basic Probability Assignment (pba) is a function m: , satisfying
Let or represent the power set of ,
then denotes a basic probability mass that is assigned exactly to a proposition . Therefore, the unions of any propositions have been considered as individual elements in discrimination.
The pattern recognitions on traffic objects include authenticity, importance, risk and behaviours. As discussed in the introduction, in order to imitate the manual work, the initial discrimination framework can be modelled. Let X be a specific characteristic,
The basic concept is to classify the targets into the discrete groups and evaluate the probabilities to individual classifications. Based on the power set, the discrimination framework transforms to
Because of empty set , most of the unions of elements, are meaningless. Therefore, the investigated discrimination framework is
In particular, linear identification problems can be discretised, making it compatible with Equation (5). The actively detecting tool in maritime surveillance is able to obtain the target dynamic attributes, including speed, course, location, acceleration, image size and so on. The objective of likelihood modelling is to find out the correlations between such attributes and the probabilities to specific classification of a characteristic. For example, when a target is moving at the speed of 100 km/h in the harbour, the probability of being a real vessel is negligible. Based on this concept, the verified historical data could be represented as Table 1. There are m separated values on an attribute offered by m sensors. Let be the frequency of a singleton value i in specific characteristic j, (i = 1, 2, …, m, j = 1, 2, …, n), represents the sum of sample in classification j.
It is worth noting that the distributions of attributes in different groups could be observed from multiple sources. In maritime management, AIS uses GPS to get reliable positioning information. In the conventional Bayes’ rule-based inference, AIS data is used to model conditional probabilities. However, the conditional probabilities require the prior distributions of , which might not be appropriate. To this end, a likelihood modelling method is proposed, which is independent of prior distributions of . Based on different attributes, it is feasible to build up several pieces of evidence to identify the targets. Actually, the dynamic attributes only relate to the inherent features of moving object and regulations. In this light, based on Table 1 the likelihood (probability) of attribute value to specific classification of characteristic can be presented in a new way, as shown in Table 2 and Equations (6) and (7).
where denotes the likelihood to which the value i is expected to occur given that the classification is true and denotes the likelihoods to the normalization form among . The prior distribution of a characteristic can be treated as a normal piece of evidence [20]. Whether to use it in the conjunctive inference depends on its stability.
3.2. Conjunctive Inference with Dempster’s Rule
With proper likelihood model, all the dynamic attributes could be mapped into pieces of evidence. Since all the dynamic attributes of each radar target are varying randomly and almost independently, the pieces of evidence can be regarded as approximately independent component. Hence, in this research, Dempster’s rule is applicable in the evidence combination [14].
Assume a target located at the position , its probability of being a real moving vessel is estimated based on Section 3.1, in accordance with three pieces of evidence (i.e., speed, course and location). Dempster’s rule can be used to combine the three pieces of evidence as
4. A Case Study
To validate the method proposed in this paper, a case study on a waterway management is carried out using coastal surveillance radar to identify passing vessels.
4.1. Experimental Platform and Discrimination Framework
In port management, the supervisors have to face crowded vessels and narrow waterways, which put forward a high request for surveillance. Although several monitoring systems have been equipped on vessels requested by IMO, the radar is the most credible tool. However, a non-ignorable part in the radar systems is the effect of multipath, waves and noise, which leads to false probability distribution. In practice, the supervisors generally identify the targets by dynamic attributes measured by radar, especially for the speed, course and trajectory. Another monitoring system is AIS. The supervisors are able to use the AIS directly through database sharing systems. Therefore, it is logical to investigate the correlations in the AIS record and identify the authenticity of targets.
An experiment platform has been built at the Yangtze River, Wuhan, which contains X-band maritime radar with ARPA (Automatic Radar Plotting Aid) function, and three individual AIS receivers to provide historical data, as shown in Figure 1.
Three experiments have been conducted. Experiment ①: The AIS receivers obtained 13,087,777 messages from 2014-04-12 17:11:45 to 2014-06-07 11:31:01 between the lines of latitude 30.1244N and 30.4566N, which is also the capturing area of the ARPA radar. To clarify, during the experiment, the external environment is steady. Since only the real vessels would report AIS messages, all the AIS targets could be considered as verified vessel samples.
Different from real vessels, the noise targets would not report information. Moreover, the noise targets are generally cluttered with real vessels. Therefore, the verified noise ARPA targets are unattainable in normal circumstances. To address such problem, the paper chose a special situation to obtain verified noise targets as followed.
Experiment ②: From 2014-06-07 10:31:00 to 2014-06-07 12:30:59, the measured waterway was temporally forbidden. During this time, the ARPA captured 19,549 records which include 120 individual false targets. As the noise targets normally are caused by the multipath effects and background noise, which do not correlate to the real vessels; an assumption could be made that the 2 h noise sample represents the generic distribution characteristics of noise speed, course.
Experiment ③: A second round of radar testing is running from 13:35 to 16:65 on 10th November 2013, which is proceed for method validation. In total, 55 targets have been captured and verified, which include 22 vessels and 33 noises. Particularly, the verification on targets is very difficult, as the telescope observation is the only way that affected by the visibility and weather. Only if the target was sailing nearby the known buoys was the position conjecturable. Therefore, although more than 500 hundred targets were captured, only 55 targets had been verified.
This paper aims to use Dempster’s rule to identify the real targets from the ARPA targets offered by the radar. Therefore, the discrimination framework is {TRUE, FALSE, UNKNOWN}.
4.2. Step 1: Object Attribute Likelihood Modelling
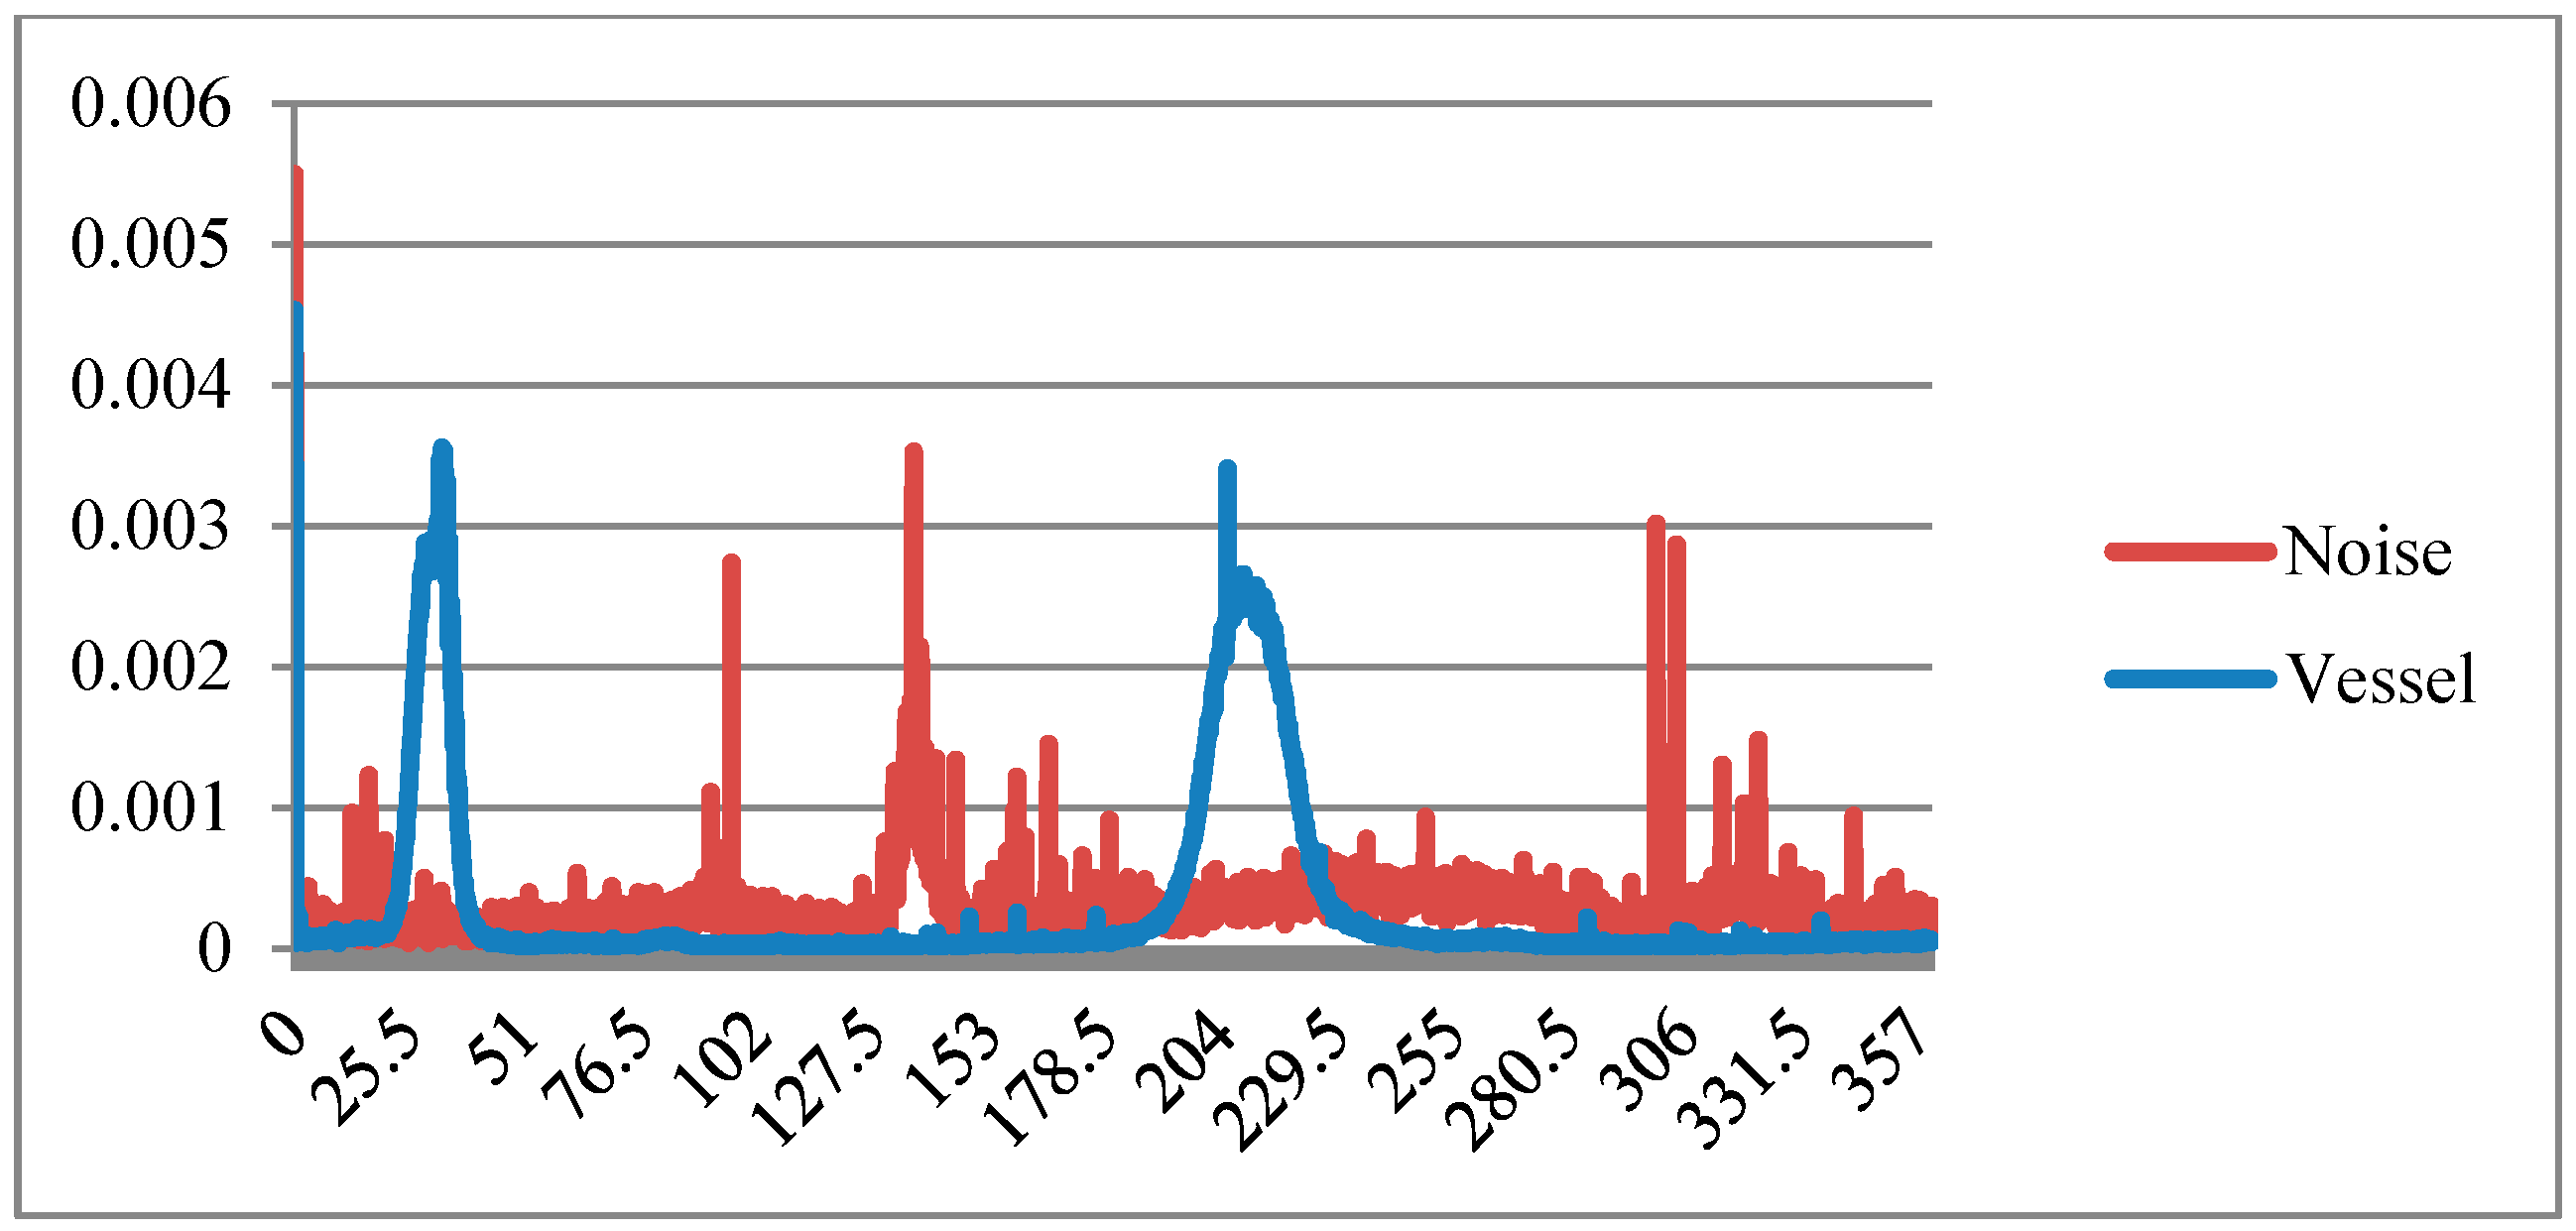
Experiment ① and ② provided the verified samples of vessel and noise targets to model likelihood. Consequently, the speed and course normalised likelihoods to vessel and noise are represented in Figure 2 and Figure 3. The X axis represents the speed and course values and the Y axis represents the normalised likelihoods given by Table 2 and Equation (6).
As per Figure 2 and Figure 3, the speed and course distribution of vessels and noise follows certain patterns. To save fuel in the specific area where the experiments were conducted, each vessel normally maintained a stable speed; therefore, the speed distribution conforms to a regular pattern that is determined by the actual operation. However, because false targets are caused by factors such as noise and multipath effects, the speed distribution of noise ARPA targets would conform to a another pattern determined by the ARPA algorithm embedded in radars.
Similarly, such pattern differences could be found in course evidence. In Figure 4, the two dash circles marked two major courses of vessels, which are exactly the upstream and downstream courses. On contrary, there is no particular pattern in noise target courses, and the courses distribute randomly.
Different from the speed and course evidence, the location is a two dimensional variable, which contains latitude and longitude. To analyse it, the paper divided the waterway of Figure 4 into cross-sections. Since the studied waterway is south–north direction, using the latitude lines as the cross-sections is a practical option. A typical cross-section of vessel densities is represented in Figure 4. The dash line denotes the studied cross line, and the bold lines marked the waterway boundaries. The vessel distribution on this section is represented in the dialog box, which is marked in the dash circle. Another problem is how to estimate the distribution of noise targets. The experiment ② has not provided enough samples to model distributions in this section, meanwhile the occurrence principles of noise ARPA targets are difficult to estimate. Hence, the distribution of noise on sections is assumed to be normal. Another noteworthy factor is that there are some places in the waterway where no vessel has passed in records, but there is still a chance of some vessels passing through. In this instance, on such locations, a {UNKOWN} proposition is activated.
4.3. Step 2: Dempster’s Rule-Based Conjunctive Inference
To validate the methods, software on Windows 7 has been developed and shown in Figure 5. In this dialog, the ARPA targets are marked as green circles, the bold lines denote the directions, the right bottom number denotes the targets number and the right top number denotes the probabilities of being a real vessel provided by Dempster’s rule. It is worth noting that there are two values separated by ‘:’. Taking the samples from experiment ③ as the research objects, the recognition result is presented in Table 3.
The total accuracy is 91.43%. In similar research, the improved Fuzzy C Means algorithm can recognize the false targets with an accuracy of 82.0% under same sample [10], which is also lower than the accuracy when the method proposed in this work is used. The proposed approach has been proved to be efficient.
5. Conclusions and Discussion
Moving targets captured by actively detecting tools need further identification, which includes risk, authenticity, importance and behaviours. The paper proposes a likelihood modelling and Dempster’s rule-based inference approach to identify targets’ patterns based on dynamic attribute values. The conclusions are below.
- In conventional probabilistic inference, the prior distribution of discrimination framework has been incorporated into pieces of evidence. However, such prior distribution is generally erratic or even not existing at all in transportation systems.
- The likelihoods to propositions of moving object dynamic attributes are steady and stable, and only relates to the inherent characteristics of objects or local regulations. Based on this, the likelihood modelling in this paper is more persuasive.
With the help of Dempster’s rule, it is possible to build artificial intelligence to identify the characteristics of moving targets in transportation systems and improve the management. However, there are several problems that should be discussed in the future.
- The pieces of evidence might have correlations to each other, which does conform to the preconditions of Dempster’s rule. For example, when a vessel is passing through a bridge, there is a speed recommended by local supervisors. In this instance, there is an obvious connection between the speed and position. To make the model practical and rigorous, the correlations among the pieces of evidence should be taken into consideration.
- Furthermore, it is very practical to develop an interactive optimization in response to the feedback from supervisors.
In maritime management, consider an extreme case where an accident occurred in a waterway, leading to a blockage. Suppose that no vessel is sailing, all of the targets are false in radar observation, and the authenticity prior distribution is definitely invalid. The error rate in radar is erratic and affected by many factors, which means the prior distribution of false targets might not exist at all. The assumption on the distribution in certain period could indicate illogical observation. Therefore, the valid evidence for automobile type identification have to be the size, plate colour, which have a steady correlation to automobile type that would not be changed easily; such evidence could be modelled as Table 2 and Equations (6) and (7).
In fact, if you take a deep look into manual judgment, it is easy to find out that the identification on characteristic is irrelevant to certain sample, only to the inherent properties of objects. In inland river waterways it is unauthentic for an object to move at 100 km/h. There are two different views. First, based on a certain sample, few vessels have sailed at this high speed, most high speed targets are noise. The other view is that, based on distribution of vessels, the vessels is not likely to have the ability to sail at this speed. Actually, the second one is more acceptable and generic. The likelihood modelling above is exactly the representation of the second view.
Author Contributions
J.L. conceived and designed the experiments; F.M. performed the experiments and wrote the paper; X.C. and Z.L. revised the paper; and W.H. and R.M. analysed the data.
Acknowledgments
This study is supported by the National Natural Science Foundation of China (Grant No. 51479155), the Fujian Province Natural Science Foundation (No: 2018J01506), the Young Teachers Education Research Project of Department of Education of Fujian Province (No. JK2017038, JAT170439), the 2017th Outstanding Young Scientist Training Program of Colleges in Fujian Province, the Fuzhou Science and Technology Planning Project (No: 2018-G-92, 2018-S-113) and Australia ARC DECRA (No. DE190100931). The authors would like to express their thanks to Wuhan Maritime Bureau for providing AIS data.
Conflicts of Interest
The authors declare no conflicts of interest.
References
- Tian, Z.; Liu, F.; Li, Z.; Malekian, R.; Xie, Y. The development of key technologies in applications of vessels connected to the internet. Symmetry 2017, 9, 211. [Google Scholar] [CrossRef]
- Ma, F.; Chen, Y.W.; Yan, X.P.; Chu, X.M.; Wang, J. A novel marine radar targets extraction approach based on sequential images and Bayesian Network. Ocean Eng. 2016, 120, 64–77. [Google Scholar] [CrossRef]
- He, W.; Li, Z.; Malekian, R.; Liu, X.; Duan, Z. An internet of things approach for extracting featured data using AIS database: An application based on the viewpoint of connected ships. Symmetry 2017, 9, 186. [Google Scholar] [CrossRef]
- Ma, F.; Chu, X.M.; Yan, X.P. Short message characteristics of AIS base stations. Jiaotong Yunshu Gongcheng Xuebao 2012, 12, 111–118. [Google Scholar]
- Li, Z.; Jiang, Y.; Guo, Q.; Hu, C.; Peng, Z. Multi-dimensional variational mode decomposition for bearing-crack detection in wind turbines with large driving-speed variations. Renew. Energy 2018, 116, 55–73. [Google Scholar] [CrossRef]
- Xia, Y.; Shi, X.; Song, G.; Geng, Q.; Liu, Y. Towards improving quality of video-based vehicle counting method for traffic flow estimation. Signal Process. 2016, 120, 672–681. [Google Scholar] [CrossRef]
- Guerriero, M.; Willett, P.; Coraluppi, S.; Carthel, C. Radar/AIS data fusion and SAR tasking for maritime surveillance. In Proceedings of the International Conference on Information Fusion, Cologne, Germany, 30 June–3 July 2008; pp. 1–5. [Google Scholar]
- Li, H.; Shen, Y.; Liu, Y. Estimation of detection threshold in multiple ship target situations with HF ground wave radar. J. Syst. Eng. Electron. 2007, 18, 739–744. [Google Scholar]
- Lee, P.T.W.; Yang, Z. (Eds.) Multi-Criteria Decision Making in Maritime Studies and Logistics; Springer: Cham, Switzerland, 2018. [Google Scholar]
- Ma, F.; Wu, Q.; Yan, X.; Chu, X.; Zhang, D. Classification of automatic radar plotting aid targets based on improved Fuzzy C-means. Transp. Res. Part C Emerg. Technol. 2015, 51, 180–195. [Google Scholar] [CrossRef]
- Liu, G.P.; Yang, J.B.; Whidborne, J.F. Multiobjective Optimisation and Control; Research Studies Press: Baldock, UK, 2003. [Google Scholar]
- Lin, B.; Huang, C.H. Comparison between ARPA radar and AIS characteristics for vessel traffic services. J. Mar. Sci. Technol. 2006, 14, 182–189. [Google Scholar]
- Talavera, A.; Aguasca, R.; Galván, B.; Cacereño, A. Application of Dempster—Shafer theory for the quantification and propagation of the uncertainty caused by the use of AIS data. Reliab. Eng. Syst. Saf. 2013, 111, 95–105. [Google Scholar] [CrossRef]
- Ma, F.; Chen, Y.W.; Huang, Z.C.; Yan, X.P.; Wang, J. A novel approach of collision assessment for coastal radar surveillance. Reliab. Eng. Syst. Saf. 2016, 155, 179–195. [Google Scholar] [CrossRef]
- Smarandache, F.; Dezert, J.; Tacnet, J. Fusion of sources of evidence with different importances and reliabilities. In Proceedings of the 2010 13th Conference on Information Fusion (FUSION), Edinburgh, UK, 26–29 July 2010; pp. 1–8. [Google Scholar]
- Zhang, D.; Yan, X.P.; Yang, Z.L.; Wall, A.; Wang, J. Incorporation of formal safety assessment and Bayesian network in navigational risk estimation of the Yangtze River. Reliab. Eng. Syst. Saf. 2013, 118, 93–105. [Google Scholar] [CrossRef]
- Shafer, G.; Pearl, J. Readings in Uncertain Reasoning; Morgan Kaufmann Publishers Inc.: San Mateo, CA, USA, 1990. [Google Scholar]
- Trucco, P.; Cagno, E.; Ruggeri, F.; Grande, O. A Bayesian Belief Network modelling of organisational factors in risk analysis: A case study in maritime transportation. Reliab. Eng. Syst. Saf. 2008, 93, 845–856. [Google Scholar] [CrossRef]
- Yang, J.B.; Xu, D.L. ER rule for evidence combination. Artif. Intell. 2013, 205, 1–29. [Google Scholar] [CrossRef]
- Yang, J.B.; Xu, D.L. A Study on Generalising Bayesian Inference to Evidential Reasoning. In Belief Functions: Theory and Applications; Springer: Cham, Switzerland, 2014; pp. 180–189. [Google Scholar]
- Tang, J.; Zhang, G.; Wang, Y.; Wang, H.; Liu, F. A hybrid approach to integrate fuzzy C-means based imputation method with genetic algorithm for missing traffic volume data estimation. Transp. Res. Part C Emerg. Technol. 2015, 51, 29–40. [Google Scholar] [CrossRef]
- Zheng, Z.; Su, D. Short-term traffic volume forecasting: A k-nearest neighbor approach enhanced by constrained linearly sewing principle component algorithm. Transp. Res. Part C Emerg. Technol. 2014, 43, 143–157. [Google Scholar] [CrossRef]
- Jin, X.; Zhang, Y.; Li, L.; Hu, J. Robust PCA-based abnormal traffic flow pattern isolation and loop detector fault detection. Tsinghua Sci. Technol. 2008, 13, 829–835. [Google Scholar] [CrossRef]
- Islam, T.; Rico-Ramirez, M.A.; Han, D.; Srivastava, P.K. Artificial intelligence techniques for clutter identification with polarimetric radar signatures. Atmos. Res. 2012, 109, 95–113. [Google Scholar] [CrossRef]
- Srinivasan, D.; Sharma, V.; Toh, K.A. Reduced multivariate polynomial-based neural network for automated traffic incident detection. Neural Netw. 2008, 21, 484–492. [Google Scholar] [CrossRef]
- Hossain, M.; Muromachi, Y. A Bayesian network based framework for real-time crash prediction on the basic freeway segments of urban expressways. Accid. Anal. Prev. 2012, 45, 373–381. [Google Scholar] [CrossRef]
- Dempster, A.P. Upper and lower probabilities induced by a multivalued mapping. Ann. Math. Stat. 1967, 38, 325–339. [Google Scholar] [CrossRef]
- Shafer, G. A Mathematical Theory of Evidence; Princeton University Press: Princeton, NJ, USA, 1976; Volume 1. [Google Scholar]
- Howells, J. Innovation, consumption and services: Encapsulation and the combinatorial role of services. Serv. Ind. J. 2004, 24, 19–36. [Google Scholar] [CrossRef]
- Kritayakirana, K.; Gerdes, J.C. Autonomous vehicle control at the limits of handling. Int. J. Veh. Auton. Syst. 2012, 10, 271–296. [Google Scholar] [CrossRef]
- Petsios, M.N.; Alivizatos, E.G.; Uzunoglu, N.K. Solving the association problem for a multistatic range-only radar target tracker. Signal Process. 2008, 88, 2254–2277. [Google Scholar] [CrossRef]
- Sun, S.; Fu, G.; Djordjević, S.; Khu, S.-T. Separating aleatory and epistemic uncertainties: Probabilistic sewer flooding evaluation using probability box. J. Hydrol. 2012, 420, 360–372. [Google Scholar] [CrossRef]
Figure 1.
Experiment platform.

Figure 2.
Verified noised and vessel objects’ normalised likelihoods on speed.

Figure 3.
Verified noised and vessel objects’ normalised likelihoods on course.

Figure 4.
2,555 Vessels’ Paths and Distributions on the some Latitude section.

Figure 5.
The Experiment.


Table 1.
Verified sample on characteristic.
| Classification on X | Verified Sample Observation Attribute Value | Total | ||||
|---|---|---|---|---|---|---|
| Value 1 | … | Value i | … | Value m | ||
| … | … | |||||
| … | … | |||||
| … | … | |||||
| … | … | |||||
Table 2.
Likelihoods without classification prior distribution.
| Classification on X | Verified Sample Observation Attribute Value Likelihood | ||||
|---|---|---|---|---|---|
| Value 1 | … | Value i | … | Value m | |
| … | … | ||||
| … | … | … | … | … | … |
| … | … | ||||
| … | … | … | … | … | … |
| … | … | ||||
| … | … | ||||
Table 3.
Confusion matrix.
| Verified Observations | Vessel Probability ≥ 50% | Noise Probability ≥ 50% | Accuracy |
|---|---|---|---|
| vessel | 139 | 21 | 86.88% |
| noise | 118 | 1355 | 91.99% |
© 2019 by the authors. Licensee MDPI, Basel, Switzerland. This article is an open access article distributed under the terms and conditions of the Creative Commons Attribution (CC BY) license (http://creativecommons.org/licenses/by/4.0/).
Share and Cite
MDPI and ACS Style
Li, J.; Chu, X.; He, W.; Ma, F.; Malekian, R.; Li, Z. A Generalised Bayesian Inference Method for Maritime Surveillance Using Historical Data. Symmetry 2019, 11, 188. https://doi.org/10.3390/sym11020188
AMA Style
Li J, Chu X, He W, Ma F, Malekian R, Li Z. A Generalised Bayesian Inference Method for Maritime Surveillance Using Historical Data. Symmetry. 2019; 11(2):188. https://doi.org/10.3390/sym11020188
Chicago/Turabian StyleLi, Jia, Xiumin Chu, Wei He, Feng Ma, Reza Malekian, and Zhixiong Li. 2019. "A Generalised Bayesian Inference Method for Maritime Surveillance Using Historical Data" Symmetry 11, no. 2: 188. https://doi.org/10.3390/sym11020188
Note that from the first issue of 2016, this journal uses article numbers instead of page numbers. See further details here.