Estimating Efforts and Success of Symmetry-Seeing Machines by Use of Synthetic Data

Fraunhofer-IOSB, Gutleuthausstr. 1, 76375 Ettlingen, Germany
*
Author to whom correspondence should be addressed.
Symmetry 2019, 11(2), 227; https://doi.org/10.3390/sym11020227
Submission received: 29 December 2018
/
Revised: 4 February 2019
/
Accepted: 11 February 2019
/
Published: 14 February 2019
(This article belongs to the Special Issue Visual Symmetry 2018)
Abstract
:Representative input data are a necessary requirement for the assessment of machine-vision systems. For symmetry-seeing machines in particular, such imagery should provide symmetries as well as asymmetric clutter. Moreover, there must be reliable ground truth with the data. It should be possible to estimate the recognition performance and the computational efforts by providing different grades of difficulty and complexity. Recent competitions used real imagery labeled by human subjects with appropriate ground truth. The paper at hand proposes to use synthetic data instead. Such data contain symmetry, clutter, and nothing else. This is preferable because interference with other perceptive capabilities, such as object recognition, or prior knowledge, can be avoided. The data are given sparsely, i.e., as sets of primitive objects. However, images can be generated from them, so that the same data can also be fed into machines requiring dense input, such as multilayered perceptrons. Sparse representations are preferred, because the author’s own system requires such data, and in this way, any influence of the primitive extraction method is excluded. The presented format allows hierarchies of symmetries. This is important because hierarchy constitutes a natural and dominant part in symmetry-seeing. The paper reports some experiments using the author’s Gestalt algebra system as symmetry-seeing machine. Additionally included is a comparative test run with the state-of-the-art symmetry-seeing deep learning convolutional perceptron of the PSU. The computational efforts and recognition performance are assessed.
1. Introduction
The state-of-the-art of machine vision is dominated by so-called artificial intelligence approaches featuring deep multilayer perceptrons. They contain various layers of different architecture such as convolutional layers, pooling layers, and fully connected layers. Context on small scales is handled in low layers, while the deeper layers learn context over substantial distance. Such approaches code the domain in a raster, where each cell provides evidence about the presence of certain objects in the form of an activation. The objects themselves are not represented at all. Funk and Liu use such rationale for their approach [1], which sets the current best performance in recognizing reflection and rotational symmetry. In their discussion, they use the dichotomy dense—sparse coding, where dense refers to approaches that cover the complete domain by sampling it with activation cells, or “neural layers”. The depth of the layered perceptron samples the scale-part of the domain.
The opposite is sparse representation. Here we have, e.g., the approach of Loy and Eklundh [2], which used to be the best performing method before. Such approaches use primitive extraction as first step. After that, the method continues operating on a set of objects, where features such as location, scale, and orientation are associated with the objects. Loy and Eklundh use the scale invariant feature transform (SIFT) keypoints of Lowe as primitives. Not everywhere in the domain exist such primitives. Large regions may well be empty, e.g., where the image is homogeneous.
Estimating the recognition success of symmetry-seeing machines as well as comparing or assessing their performance requires a representative set of images together with ground truth on the contained symmetry. Funk and Liu proposed to use heatmaps as ground truth [1]. The heatmap has the same raster format as the corresponding image, and it contains values between 0 and 1. Zero means there is no symmetry at that location, and 1 means there is maximal symmetry there. A separate map is needed for each type of symmetry, e.g., in Reference [1] one map per image codes reflection axes, and one map per image codes rotation centers. This paper contains various such heatmaps using the inverted graphical convention that “hot” or “1.0” is indicated black, and “cold” or “0.0” is indicated as white, since white is less salient on white paper.
The following properties are eligible for synthetic test data: (1) they should provide all kinds of symmetric patterns as well as adjustable amounts of clutter objects, (2) they should provide both representations—a sparse list of objects as well as a dense raster image of any desired sampling density, (3) hierarchies of symmetries should be possible with a syntactic ground truth format.
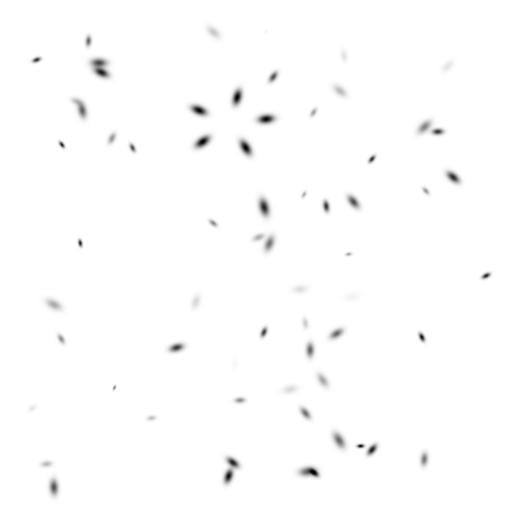
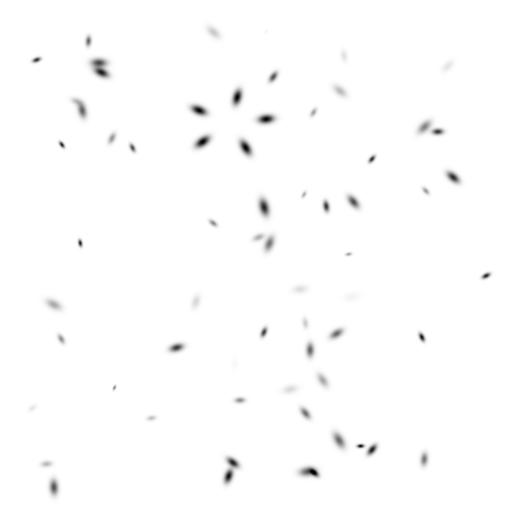
Figure 1 shows my suggestion for synthetic test data. Such images are both, a test image, as well as a heatmap presenting the presence of a primitive object in the inverted convention. The arrangement shown in the Figure follows A. Desolneux’s two-model approach [3]: the foreground represents the symmetric pattern, the Gestalt, which may be disturbed by small normally distributed displacements; the background is given by uniformly distributed clutter patterns, which are similar to the parts of the foreground aggregate. The atoms of such datum are given in our Gestalt domain [4], i.e., they feature a location, a scale, an orientation, and a quality. Their rotational periodicity is always set to two here. They have no other features, such as colors or forms. The datum then is generated as a list of such atoms by random number generation. Additionally, it contains ground truth on the foreground in the form of a Gestalt term, see Reference [4].
This paper proposes translation of the atoms to a dense raster format by sampling for each of them a Gaussian normal distribution, and staining the pixels accordingly. Figure 1 uses the 400 × 400 format standard of connectionist approaches. The location l sets the mean of the normal distribution. Orientation and scale are coded in the 2 × 2 covariance matrix C. The quality or assessment α is coded in the weight, or maximal gray tone, so that bad atoms almost disappear in the white background, and the best ones appear in salient black. The dense recoding of such a set of atoms requires: (1) listing the set of atoms, (2) listing all cells for all entries in (1), (3) for each cell in (2) c reckon exp((c-l)TC−1(c-l)). If that should take too long, one may restrict the listing of cells to the neighboring cells of the location. The contribution to the taint of distant cells will be very low anyway.
Inversely—from the dense to the sparse representation—the estimation of the parameters of a Gaussian mixture is required. There are standard methods for this, such as expectation maximization. For such spotted imagery, they should converge very stably and quickly.
Pizlo argues that human symmetry perception is inherently three-dimensional [5]. Accordingly, he uses synthetic imagery, where 3D polyhedrons are presented using line rendering. He sees no value in two-dimensional symmetry seeing, stating that almost always the symmetries of the objects are lost by the projective mapping to the detector or retina. We do not follow that rationale for the following reasons: (1) the view directions on symmetric objects are not uniformly distributed, e.g., when taking a picture of a façade or inspecting it, everyone would prefer a symmetry preserving direction; (2) a robust method can tolerate perspective distortion to a certain degree. For example, Section 5 below gives evidence that our method has no problem with 30° off axis projections, and the problem really causes loss in performance around 60°. Consequently, there are more serious problems to be addressed, such as occlusion or lighting problems. Moreover, what is missing in his synthetic imagery is distracting clutter. In the following Section we will present our own approach to symmetry-seeing briefly. It belongs to the category of sparse methods and has been outlined in detail in Reference [4].
2. The Gestalt Domain and Some Operations on It
For what follows, the location domain is two-dimensional and continuous. The world under discussion is the world of pictures. In contrast to many machine-vision approaches from Grenander’s Pattern Theory [6] to modern convolutional deep learning models [1] where the input is a pixel matrix, this work prefers a continuous domain, and accordingly sparse representations. Among the possible two-dimensional manifolds, the Cartesian vector space over the field of real numbers is the preferred choice. We are aware that this neglects the margins, but we see no serious disadvantage in that. There is general agreement that the domain for symmetry seeing also needs a scale dimension varying continuously through the positive sizes. Accordingly, this feature is a continuous group, with multiplication as operation. Therefore, e.g., a mean scale should always be a geometric mean, and log-normal distributions are preferred probabilistic models for it. Most objects of concern also feature an orientation, which is element of a continuous additive group with no margin, but finite. In this part of the domain, normal distribution models are an approximation valid only for small deviations. How the orientation is interpreted geometrically, depends on the rotational self-similarity, which is called periodicity in Reference [4] or frequency in earlier papers such as References [7,8]. For example, the Gestalten in the foregrounds of Figure 1 have periodicity five. Accordingly, orientation of such objects must be understood as phase modulo 2/5 π. There is yet another important property assigned to the objects, their saliency or assessment. We do not dare to use the word probability yet. Instead, a heuristic continuous value between zero and one is used. Together these features (location, scale, orientation, periodicity, assessment) form the Gestalt-domain.
Table 1 lists the operations defined on the Gestalt-domain in Reference [4]. All these operations yield a single Gestalt as output. Therefore, the construction resembles a context-free grammar. However, there are no restrictions on the input. The operations are defined for any input. If the input violates the laws given with the operation completely, the assessment of the output will be zero. If everything is in perfect symmetry, the assessment of the output will be one. In between, there is plenty of room for all sorts of deviations and distortions. Therefore, the term algebra is preferred instead of grammar, because there is algebraic closure for the operations.
Algebra is also important on the input side (right column in Table 1). For example, the reflection operation is commutative: g|h = h|g. Accordingly, there is a group operating on the input enumeration, in this case the simple two-element group. The same group operates on the input of the frieze operation, because inversion of the enumeration leaves the resulting row-Gestalt invariant. Some of the other operations have less trivial groups operating on the input. For example, prolongation is invariant to any permutation of the listing of the input set. In any case, these groups define equivalence classes on the elements of the domain, and the resulting Gestalten are understood modulo these classes.
3. Estimating the Computational Efforts for Symmetry-Seeing
The number of arithmetical atoms often called FLOPS (floating-point operations) which a multilayer perceptron, such as the one presented in Reference [1], executes on a single input datum, can be precisely given. For that, the details of the connectionist architecture must be known, which C. Funk provided in January 2019 [9]. The resolution has grown to 513 × 513 cells containing three colors. The architecture is derived from the architectures for semantic segmentation given in References [10,11]. It is 40 layers deep. The depth of the hyper-columns of neurons on each layer block double from initially 64 to 1024. Such blocks consist of two or three convolutional layers followed by a pooling layer. While the depth of the hyper-columns rises, the resolution of the layers drops from 513 × 513 to 16 × 16, so that the efforts remain roughly the same for each layer block. This constitutes the ingoing side of the perceptron. The outgoing half is a reflection of the ingoing. By deconvolution, the resolution rises back to the original 513 × 513 cells, while the hyper-column depth decreases. Our rough estimation reckons 160 Giga FLOPS for one run. On the other hand, running the Funk and Liu perceptron on our 90 images for the comparison given below in Section 4 took only 30 min. We used no GPU and only one CPU of a standard desktop computer with Windows 10 and a virtual Linux machine inside of it. 20 s for 160 Giga FLOPS would be a very good performance. There must be at least a factor three overestimation in our reckoning. Additionally, the Caffe system obviously gives a very efficient utilization of the computational resources.
The same rough estimation yields 30 million parameters to be adjusted for such a perceptron. Therefore, training from scratch requires millions of images with ground truth. Using pre-trained perceptrons, and adjusting them to a specific task such as symmetry seeing still requires several thousand training images. Such work is only possible with parallel computing and the help of GPUs running in batch-mode for days. However, once the machine is trained, the result for a single datum is at hand with moderate delay. The 20 s we experienced can be reduced to sub-second level by use of GPUs.
Changing one parameter of the network architecture a little—such as raising image resolution from 224 in Reference [9] to 400 in Reference [1] or further on to 513—has severe consequences on the workload. It may well be a factor ten then. Recall, nobody would buy a camera with only 0.16 Mega Pixel resolution today. There is common agreement that 16 Mega Pixel cameras are close to human perception.
The processing efforts of dense modelling perceptrons is not data-dependent. This is different with sparse models such as Loy and Eklundh’s [2] or ours [4]. Input to these methods is a set or list of n primitives. A naïve search for reflection symmetry would list all n(n-1)½ primitive pairs and test the reflection law on them. Each such test involves at least the call of a few analytic functions, such as exponential function, cosine, square root, etc. Loy and Eklundh use inner products of feature vectors of dimension 128 for additional discrimination in the correspondence in these tests. Therefore, about one kilo-FLOP may be a good estimate for such test. Data, such as presented in Figure 1, contain about 100 objects. Accordingly, five Mega-FLOPS result for this configuration. The standard output step is performed by Hough accumulation of the test results. Initializing the accumulator requires another 20 kilo-FLOPS, depending on its resolution. Recall, an accumulator is a dense method in our dichotomy. It would have a similar resolution and sampling width like the original data.
Obviously, the effort is quadratic in n. With a set of about 20,000 primitives the 160 Giga FLOPS of the dense perceptron model would be reached. However, on the one hand, there is hardly any reasonable extraction method, which would yield so many primitives on such a small image, and on the other hand, less naïve methods can be sub-quadratic in the effort growth.
Figure 2 presents the preferred visualization of sparse input data. Objects are presented as circles, where the center gives the location and the diameter gives the scale. Periodicity is indicated by drawing a corresponding number of spokes into such wheels, and again assessment is coded as gray-tone. The central column (b) presents the same datum that is given in dense raster format in Figure 1a. This datum contains 40 clutter primitives, of which two are occluded by the foreground pattern and thus removed from the datum. The foreground Gestalt consists of five primitives. The column (a), presented to the left of the central example, contains less clutter, namely 25 primitives, of which three happened to be occluded. On the other hand, the column (c) to the right contains 65 primitives. Only one is occluded, because here the scale of the foreground pattern was drawn rather small. Recall, the features of the foreground object result from uniform random numbers, such that they are located inside the dense 400 × 400-unit scene, their scale is between 50 and 110, and their orientation is free.
The upper line of the Figure gives the input datum. Below that, the corresponding reflection-of-primitive aggregates are presented, provided they are better assessed than 0.5. Prolongation of reflection symmetry axes is performed in the bottom line of the figure. This is done using the operation Λ in this case on pairs only. The acceptance threshold is here set to 0.8.
The figure exemplarily demonstrates what is meant by the term combinatorial growth: The meaning of the operations can only be fixed if the acceptation thresholds τ on the assessments are kept constant. Then the number of objects on the first aggregated level will rise possibly quadratic with the number of primitives, and on the next level—the aggregates of aggregates—there may well be a growth of fourth order with rising numbers of primitives.
Table 2 gives the actual numbers of the example data displayed in Figure 2. Although we can be sure that no infinite number of higher order aggregated Gestalten assessed better than any threshold τ > 0 is possible, there can be very huge numbers, and useful bounds can hardly be given.
One possible countermeasure against the lack of robustness resulting from combinatorial growth of numbers of objects with the depth of hierarchy is hard restriction. Only a certain fixed number N of objects is accepted on each level. For instance, one may permit the same number as in the primitive layer for all layers. It is a natural choice to select the best-assessed ones. To this end, sorting according to the assessments is required, once all objects on a layer are given, and the number is larger than the number threshold N. This rationale is similar to the well-known constant false alarm rate (CFAR) method. Such approach trades meaning for feasibility. We cannot be sure anymore, that a Gestalt contained and hidden in the datum and having better assessment than the threshold τ will be instantiated. Whether it is found or not, depends also on the workload caused by the clutter.
With a stratified CFAR search as indicated above the computational efforts can be bounded as follows: (1) first factor is the number of layers, i.e., the depth of hierarchy, which is limited by the ratio between the scale of the primitives and the scale covered by the whole datum (and also τ), (2) N2 is a bound for the number of operation calls on each layer, plus the costs for sorting the result (N2∙log(N2)), (3) each operation of Table 1 has its own computational costs when called once. The operations require reckoning all features of the new Gestalt, which means calling a few analytic functions, such a cosine or exponentials, overall in the order of a kilo-FLOP. For N = 200 and hierarchical depth 5 efforts well below one Giga-FLOP result.
For the examples presented below in Section 4, such method was used. However, the stratified approach has an important disadvantage: Complex deep hierarchies can only be established after all simpler layers have been completely aggregated. It is a breath-first search. There are also algorithms for assessment-driven depth-early search [12]. Although these methods were originally designed for knowledge-based methods, they apply here as well. They cause substantial overheads. However, they may yield deep hierarchical aggregations very early, and provide thus some kind of any-time performance, which turns out important when visual perception is used in control cycles of robots.
4. Estimating Performance
So far, the most diligent efforts for comparing recognition performances in machine-symmetry-seeing have been made by the team of Y. Liu at Pennsylvania State University with the competitions in 2011, 2013 and 2017 [13,14,15]. They decided to use snapshots found in the web or taken occasionally, images that may be somehow representative of the imagery filling the memory discs of our computers. The only special thing about these pictures is that they all contain the symmetries targeted by the different competition branches. There are no negative samples, i.e., images containing no symmetry at all. I admit that the results, which our method achieved in these competitions, were not satisfying. Coding symmetry recognition by use of combinatorics and smooth assessment functions is an engineering approach. Therefore, collecting failures can be a source of constant improvement.
On the other hand, the synthetic samples generated as outlined above in Section 1 usually give close to perfect recognition performance with our method. Figure 2 above shows already that the system will find the correct parts, organization, location, etc. with high reliability. Following again Desolneux’s rationale presented in Reference [3], the recognition should be compared to human seeing. The images are shown to several observers asking them to mark salient symmetry. For example, most of them would quickly find the pattern in Figure 2a, which is only masked by moderate clutter, but they would have problems with the cluttered scene given in Figure 2c. The machine has no difficulty with this scene as Figure 3 clearly indicates. The synthetic input data are still required in order to determine the breakdown point of stratified CFAR search, or other non-exhaustive enumeration methods.
The figure shows the few best elements of the 4716-element-set displayed in Figure 2c. Obviously, even in this very cluttered example, where most human subjects will not see the foreground object instantaneously, the best instances perfectly reproduce the ground truth. However, this is a somehow deceiving example. It is too benign, because there are no deviations from the perfect symmetry, as demanded by Desolneux’s two-model approach [3]. Repeating the experiment with rising deviations of the features of the foreground primitives yields the true stability and breakdown point. In Section 5 below we used projective distortions as deviation.
Desolneux compares her methods and theoretical bounds on the maximally meaningful aggregation of friezes with human performance, asking subjects at what amount of clutter and deviations they still perceive the frieze instantaneously. She finds similar values for human perception and automatic extractability, and interprets this as empirical argument for the correctness of her probabilistic derivations. Our experience is that the machine is often a little better than the human on such simplified synthetic data. However, here machine and rendering are perfectly attuned to each other. If the symmetry-seeing module is to be used in robots interacting with an open world, unpredictable failures will be likely. We experienced such failures when participating in the contests of the PSU [13,15].
Now we return to hierarchy topic once more. Figure 4a shows a datum given by the same generator as Figure 1b. Recall, Figure 1b shows the dense raster format, whereas here in Figure 4a we have a list of primitives drawn in the usual manner. There are 200 distracting clutter objects uniformly distributed in the Gestalt domain. In scale, they are similar to the 20 foreground primitives. In this datum, there is no occlusion, so that clutter objects may well be placed inside the region covered by the foreground pattern.
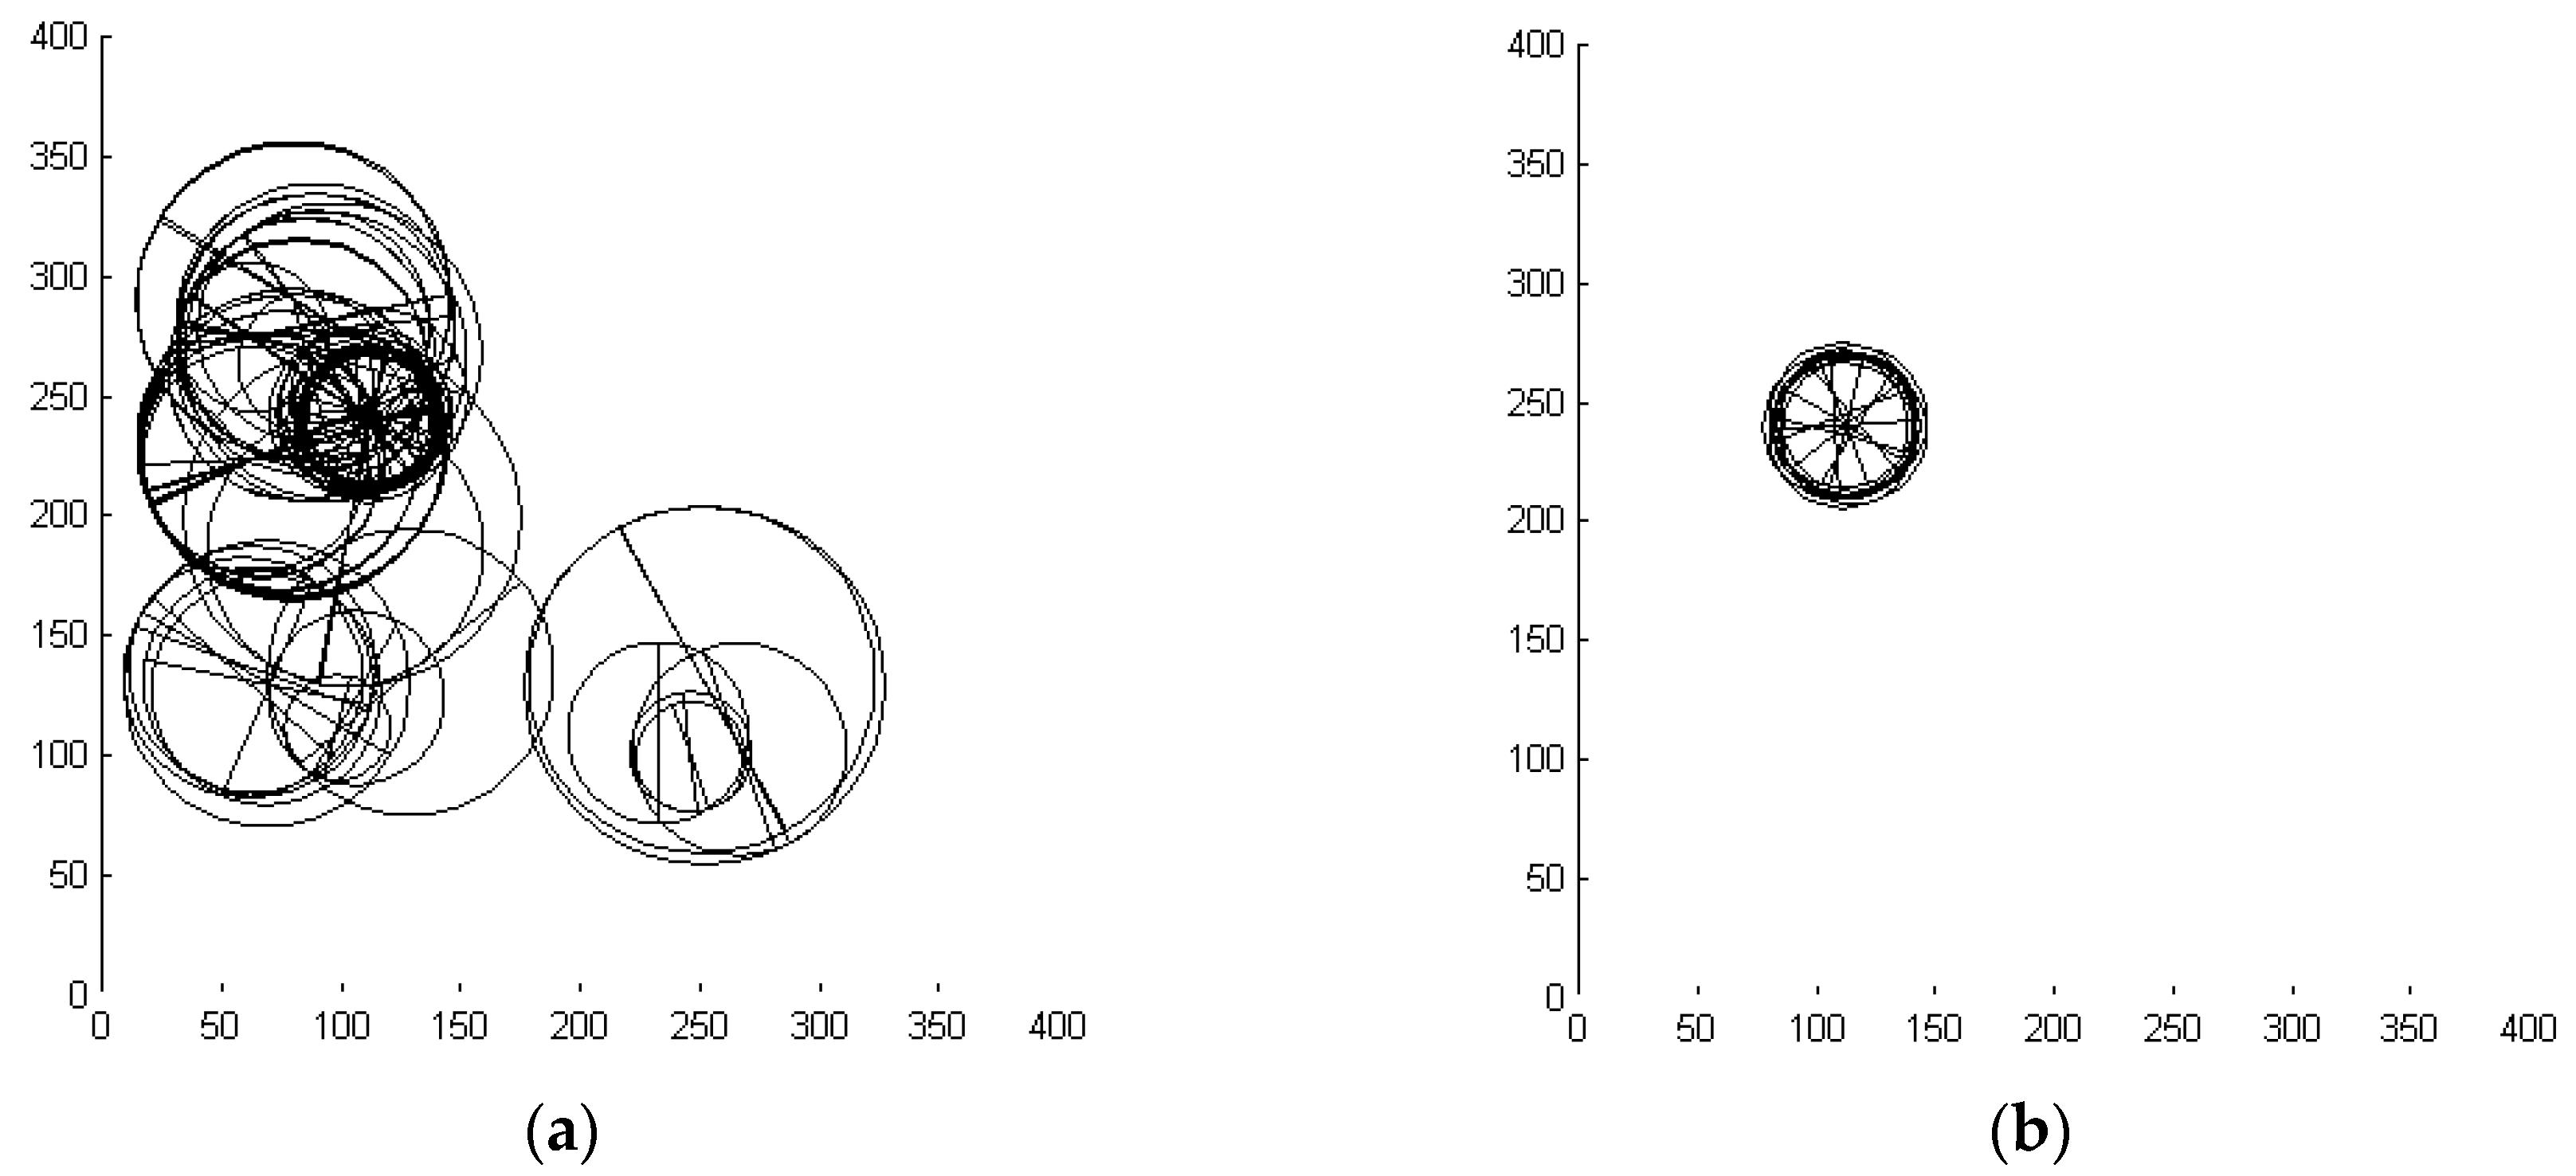
The organization of the foreground is highly symmetric. It is a dihedron of five friezes each containing four primitives. Such patterns are very salient and somehow attractive to the human observer. Although the symmetry is sophisticated, and the inherent algebraic features are not taught in every school, intuitive understanding of it comes instantaneously and easily to anyone. The figure shows the stratified search for symmetry along the hierarchy and scale layer by layer: (a) gives the primitives, (b) the friezes of primitives, (c) the reflection aggregates of such friezes, and (d) the axis prolongation of such aggregates, i.e., the consistent reflection symmetry aggregations. Of course, there is more symmetry in this datum. For example, there is also rotational symmetry in such dihedral patterns, and the rotation center coincidences with the intersection of all the reflection axes.
Figure 4 documents a stratified, bottom-up, CFAR search using 220 elements on each layer. It can be clearly seen how the efforts more and more concentrate on the salient region, until only patterns remain, which are consistent with the ground truth. Moreover, the scale of the objects is rising with hierarchical depth. The search terminates at Level (d), because no larger scales are possible anymore.
By intention, the clutter in this datum was allowed to occur inside the pattern. Therefore, occasional over-grouping becomes likely. Recall, we follow Desolneux’s approach searching for the maximal meaningful aggregation [3]. Accordingly, the greedy prolongation of frieze patterns will fail to reproduce the ground truth sometimes and yield too long aggregations instead. In this datum, the upper left spoke in the star pattern in Figure 4b is prolonged one element too far towards the center. While this is in accordance with human seeing, the second such error on the upper right spoke—this time over-grouping towards the periphery—is less consistent with natural perception. We used the default parametrization of the operation, which might still be a little too illusory here. Obviously, occasional such mistakes do not disturb the robustness of the whole process very much.
In Reference [4] we constructed means to overcome such failures by use of top-down propagation of constraints. For example, in the pure bottom up approach discussed up to now, the rotational symmetry only tests for equal scale of its five parts, finding that two are a little too long and two are a little too short. However, if they are aggregates themselves, we may also test whether they all have the same number of parts. Reference [4] defines the term balanced term tree for that property. If not, we may revise decisions made in the greedy prolongation steps on lower levels based on the knowledge won on higher aggregation levels. The goal is a balanced derivation tree with an aggregated Gestalt of highest possible assessment at its root.
Many more constraints can be tested once a balanced derivation has been achieved. It defines correspondence between lower level objects through the enumeration of the parts in higher aggregation levels. Therefore, correspondence can even be achieved between small-scale objects very far away from each other. Constraints can be given on their mutual orientation, mutual positions dictated by frieze generator vectors, similar scales, colors, etc.
In the case of the star pattern displayed in Figure 4a, the primitive parts are constrained to have similar orientation within their spoke-frieze. However, they are also ruled by a higher order rotational law between the spokes, which becomes evident not before the overall rotational symmetry is established. Moreover, there is a reflection constraint for these primitives between neighboring spokes stemming from the reflection symmetric aggregates established on the level displayed in Figure 4c. On that level, reflection symmetry is also established between primitives of non-adjacent spokes. Together, these constraints force primitives to be either orthogonal or collinear with their immediate aggregate.
In the general case, all these constraints need to be combined using the non-trivial algebraic tools outlined by Meidow and Hammer in Reference [16]. Even in comparably shallow cases, like the one presented above, dozens of constraints remain, and they should all be used in one equation system minimizing the sum of squared residuals of the observations (i.e., features of the primitives).
By now, it is hard to estimate how much computational efforts systematic application of these top-down mechanisms to the few best higher aggregates will cause. However, it is very unlikely that 20 out of 220 primitives given by some uniform clutter process obey several dozens of mutual constraints by chance. Therefore, using the Helmholtz principle of Desolneux’s approach [3], we may infer that this subset forms a foreground object. Moreover, hierarchical aggregations yield many more constraints on larger sets of primitives. Therefore, they are very much stronger as compared to flat hierarchies.
Research on the subject of hierarchical perceptual grouping needs example data. This is where the synthetic symmetry generator proposed above will help. It will provide data for debugging the codes, for empirical evidence backing theoretic bounds, for comparing against human perceptions, for estimating efforts, for illustration of the phenomena, etc. Moreover, the dense version of the data can also be used as training samples for deep learning perceptrons.
5. Empirical and Phenomenological Comparison—Dense Versus Sparse
As result of personal contact with the authors of Reference [1], the corresponding perceptron architectures and connection weights were published on the web [16]. We downloaded these data for the version called SYM-VGG-reflection, and succeeded in implementing and running the model on our imagery. This architecture has 513 × 513 as first and last layer format. Therefore, we modified our synthetic image generator accordingly. A shallow hierarchy Gestalt (again a dihedron of order five) sets the foreground. Its size is chosen uniformly between 50 and 110 units. Additionally, uniformly drawn are orientation and location, the latter so that the full pattern remains well in the interior of the 513 × 513 frame. A corresponding ground truth image is sampled for each such datum using the method outlined in Section 1.
The simple version of our sparse recognition method used here does not model the distortions resulting from 3D-to-2D projection. This is often seen as erroneous in the newer literature [1,5]. In order to include this point into the empirical validation the foreground dihedron was not directly presented, like in Figure 1 and Figure 4. Instead, we tilted the pattern off the optical axis, and rendered it using a short focal length (namely also 513 units). Therefore, we achieved adjustable projective distortions, as they occur due to 3D-to-2D projection. We choose the tilt angle in three steps 10°, 30°, and 60°, respectively.
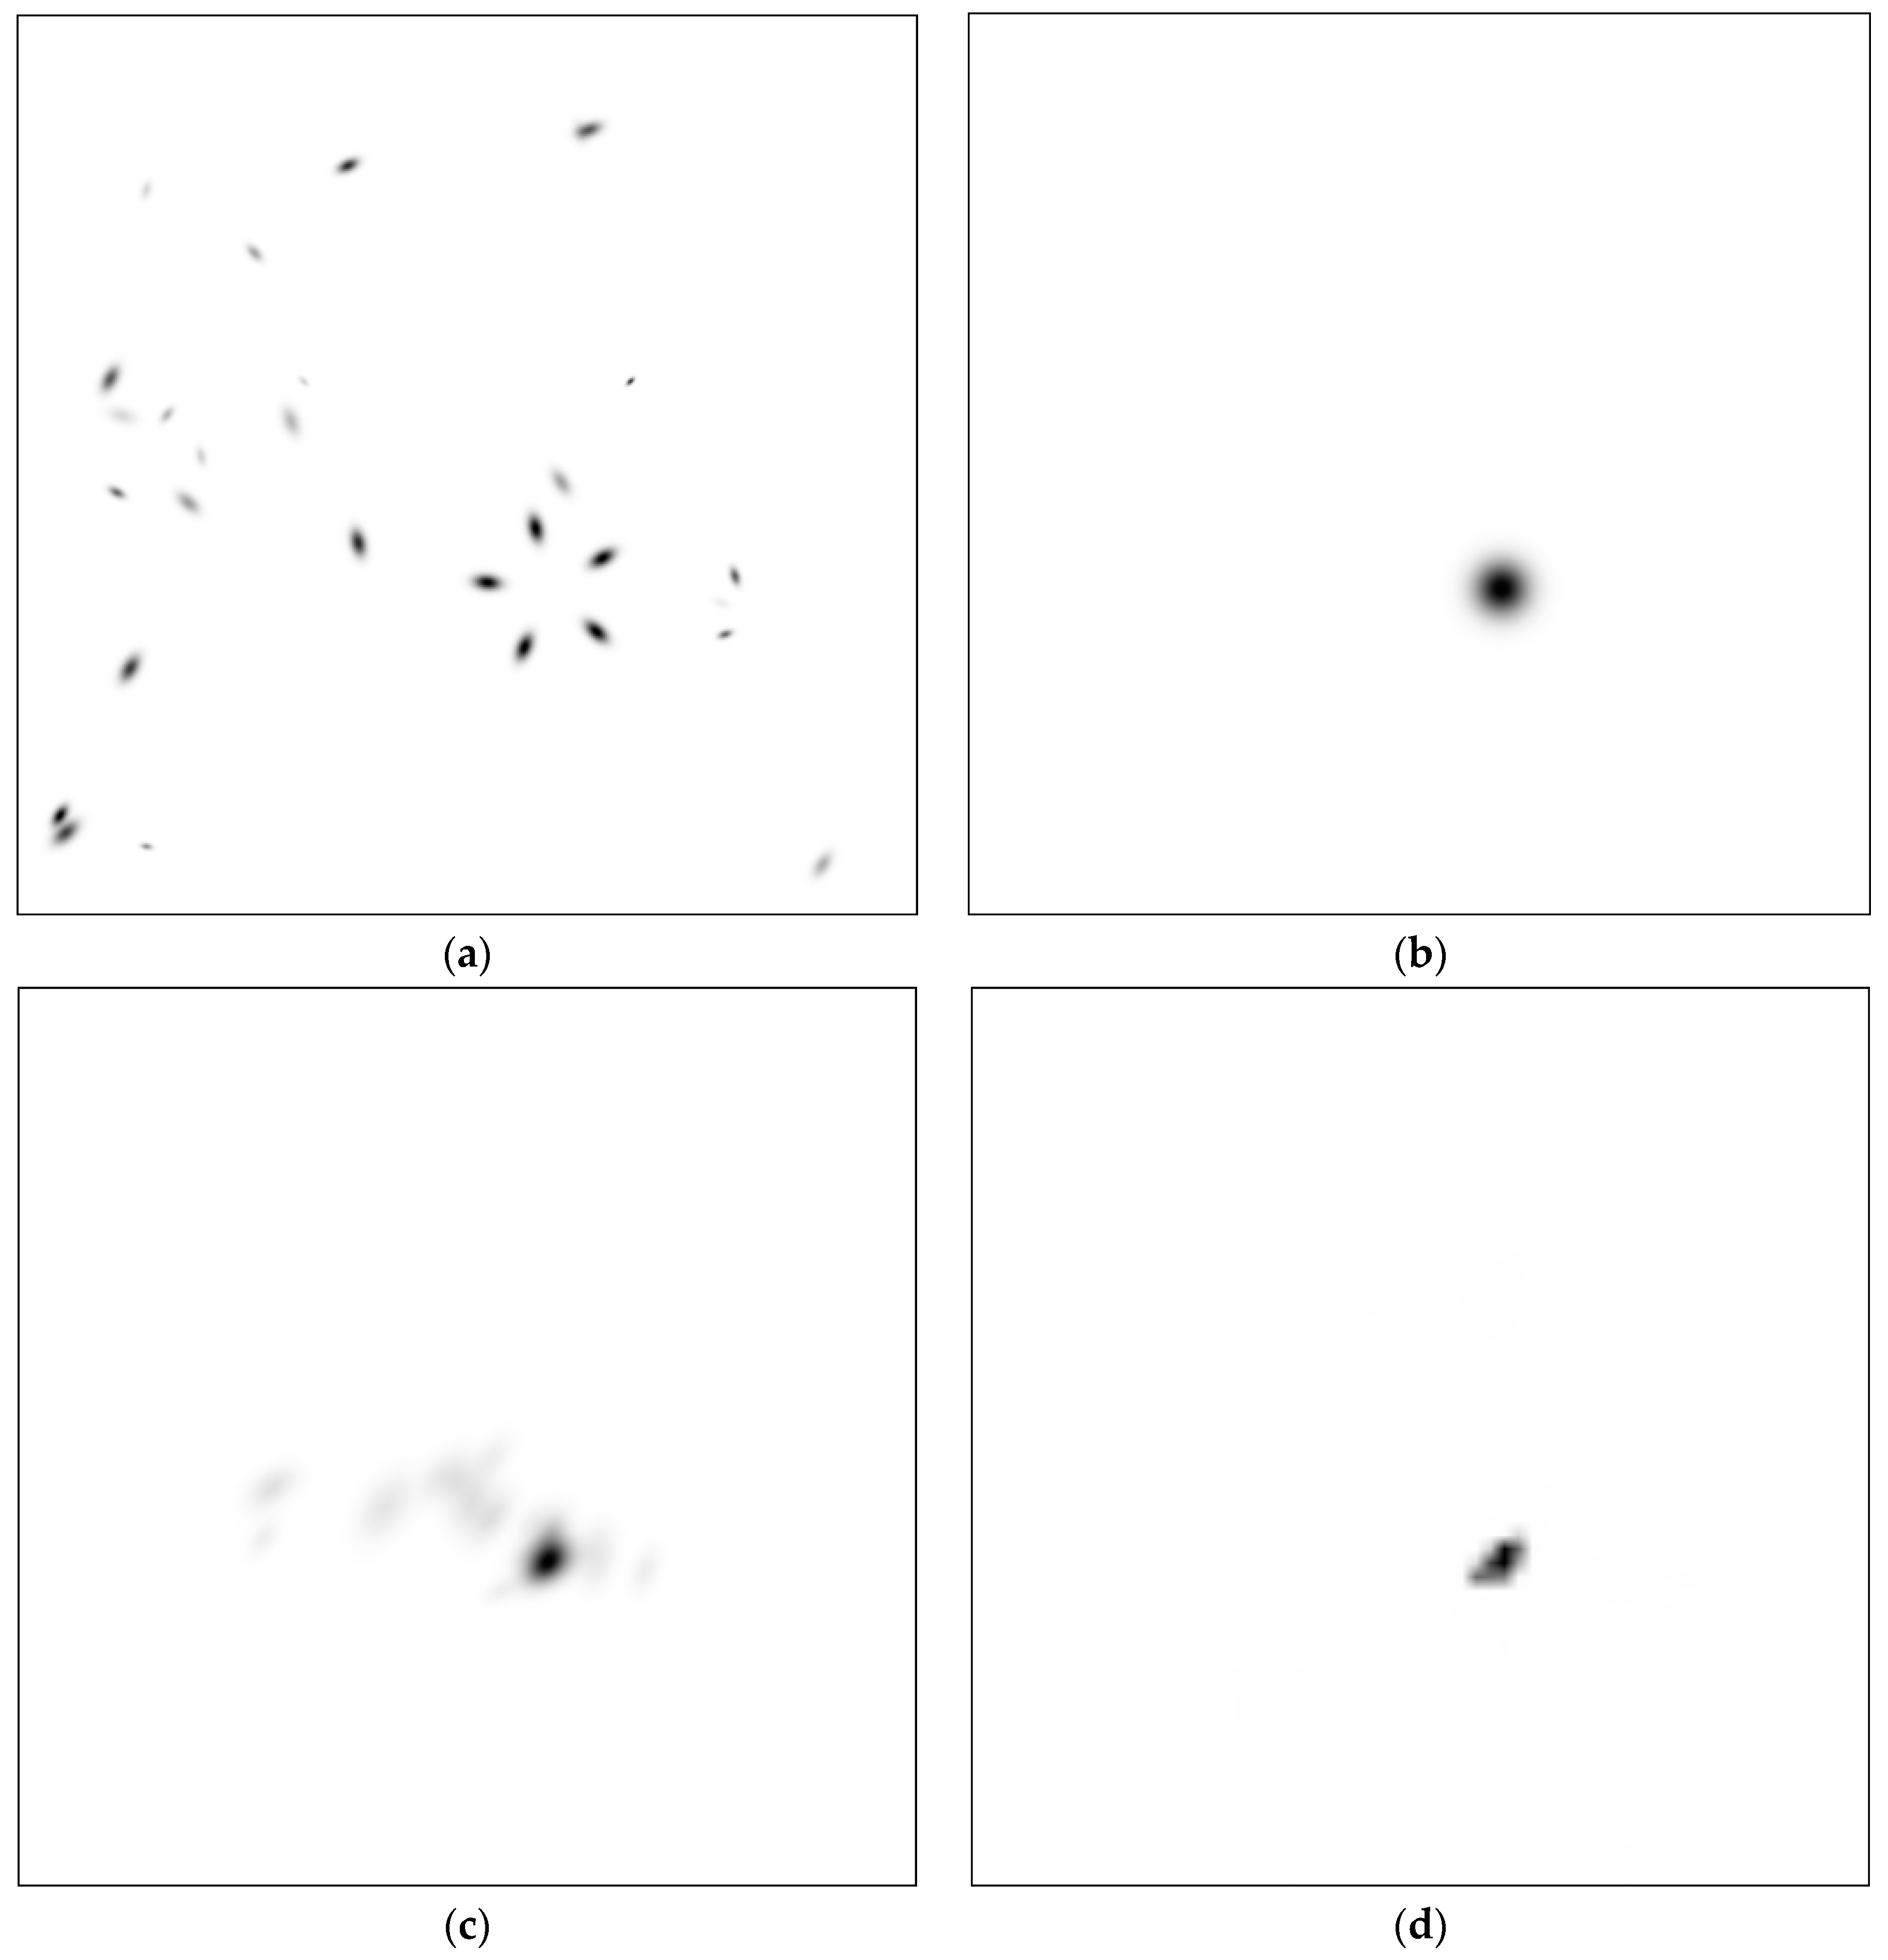
Following Desolneux et al. [3] we added adjustable amounts of clutter objects. We choose three steps here as well, namely 25, 40, and 65 objects. Elements occluded by the foreground are suppressed. Figure 5a,b show such datum. We added a thin black frame for better orientation. There are 90 such data, representing three off axis tilt angles × 3 clutter amounts × 10 repetitions with different random setting. The figure presents the first datum, which turns out a complete success for both methods. The resulting heatmaps are displayed in (c) and (d), respectively.
The most plausible empirical examination for recognition performance takes into account the deviation of the location of the optimum in the resulting heatmap from the location of the optimum in the ground truth. In such dense representation, this is a raster vector. In the case of the presented datum #01 it is (0,1) for the sparse Gestalt method and (1,1) for the dense perceptron given by [9]. Such small deviations are definitely negligible.
Rather arbitrarily, we set a threshold of 20 units for the Euclidian length of the deviation vector. Below that, a system run is counted as success. Table 3 gives the counts yielded by our experiment with the Gestalt method using the CFAR accumulation of Λ(gi|hi)-Gestalten. On each of the two hierarchy levels, the number of accepted instances was bounded by the number of primitives of the input. Obviously, the outcome confirms empirically that the method has indeed a problem with the loss of symmetry due to the 3D-to-2D projection. However, this becomes distinct only at very high tilt rates causing huge distortions. Recall, 10 means here that all runs were successful, and 5 means that half of runs failed to present the correct location.
The same experiments were repeated using the deep perceptron proposed by Funk and Liu [1,9], yielding Table 4. C. Funk conjectured that his perceptron would perform badly on such imagery [17], the reason being that the machine had never seen anything like that before in training, and the lower layers copied from the DeepLab semantic segmentation perceptron were trained on real imagery only. They fitted to other types of features. Given this prior expectation, we found that the abused perceptron performed remarkably well on our data.
The dense heatmap-format allows also a more sophisticated empirical evaluation of the robustness of the recognition machines. Two such images H and J can be subtracted and the difference integrated, e.g., by
Such distance provides a precise measure on how much evidence mass is seen outside of the main cluster hopefully located near the ground truth bump. To this end, the two maps must be normalized. We normalized all such maps so that the maximum is 1 and the minimum 0. For Figure 5b to 5c we reckon dsparse (#01) = 51.07, and for 5b to 5d ddense (#01) = 62.50. We regard such minor differences as insignificant.
A comparably small sample—such as the 90 test images used here—allows also phenomenological analysis. With moderate efforts, the investigator can scan through the data and look for particular instances from which important or surprising things can be learned. For example, we looked for a sample where the deep perceptron outperforms the Gestalt search, and found #67. Visually, this is one of the harder samples where a lot of clutter distracts the attention. Figure 6 displays this datum using the same format as in Figure 5. However, Table 4 already showed that the performance of the perceptron does not drop with rising clutter, as we had expected before the experiments. On this picture both methods succeed with a deviation below threshold—namely, (1,1) for the Gestalt search and (2,7) for the perceptron. However, the latter gives the lower difference as defined by (1), namely dsparse (#01) = 368.93 versus ddense (#01) = 130.90. In Figure 6c we see the cause for the large integral: The Gestalt grouping also accumulates strong evidence in a second slightly lower optimum located above the pattern. A second glance on that region in the original image shows that plausible alternative symmetries occur by chance in the clutter configuration there. This is rather typical for data with high clutter density. The corresponding Gestalt heatmap has a lot of mass smeared rather arbitrarily all over the background. Therefore, with even higher clutter density a loss of robustness can be expected.
Although the resulting map presented in Figure 6d for the perceptron appears much more stable on this instance #67, the overall performance on all 90 images is not satisfying. In fact, on all instances where the foreground Gestalt is just a little smaller than the one in #67 the perceptron failed. This also constitutes the reason why it tends to fail on the strongly tilted examples: Originally, it has seen many strongly distorted symmetries in training. Therefore, it can tolerate such tilt angles easily. However, tilting the pattern makes it appear smaller in in one direction. We learned that the machine is very sensitive to reducing the scale of the target. It is hard to unveil such facts with real imagery, but easy to see, when synthetic images are used, where e.g., parameters such as scale can be controlled.
Figure 7 shows instance #29 again in the same format. In this instance, the foreground pattern is strongly tilted, so that it appears foreshortened, and it is not very large. To the human observer it is still very salient because of the low clutter level. The Gestalt grouping succeeds. However, there is a lot of mass on a second wider bump in the heat map, caused by an almost symmetric clutter object pair above the target. The perceptron fails. It sees the same distracting configuration above the target, where the scale seems more appropriate to what it has learned. Surprisingly it sets a lot of mass into a region to the right, which is quite empty in the input image.
The heatmap displayed in Figure 7d should not be used for comparison with a ground truth map using formula (1). It reveals that the normalization is inadequate for some of the maps produced by the perceptron. Actually, in instances like these the maximal activation is much smaller than in the success cases, such as given in Figure 5d and Figure 6d. Most often, the minimal activation in the output layer of the perceptron is slightly negative. Due to normalization, these regions appear white in the figure, while regions with zero activation appear gray. So a kind of output noise becomes visible in these maps, where the maximal activation is low. This also unveils a lack of spatial resolution visible as block structure of the noise.
6. Discussion
There is evidence that visual symmetry comes in hierarchies. Parts are organized in an ordered scheme such that they map on each other with little residual displacement. Together they constitute an aggregate. On a larger scale such aggregate may find other such aggregates, so that it is now a part of an even bigger pattern. In the other direction in scale, the parts may be decomposable into smaller parts. Often these smaller parts will not be placed arbitrarily or randomly in the visual domain. Instead, their setting will also be ordered following some law of symmetry.
The clearest evidence for such organization is given by facades of older buildings. However, we encounter such phenomena also in almost any other environment, whether it is natural or artificial. For human beings these mutual constraints and aggregations are very salient, and esthetically appealing. There should be a natural tendency to include them in our efforts, being engineers on our way to the construction of seeing machines.
For the time being, the recently proposed architectures for visually perceiving machines do not emphasize such symmetry. Still, we believe that seeing machines can be improved by introducing symmetry perception explicitly in them. This opens prospects for many automation tasks, such as object recognition, e.g., in remote sensing and mapping, obstacle avoidance for robots, e.g., moving in traffic, flying, or fixed in industrial environments, medical applications, and scientific exploration of imagery in general.
The other side are the costs caused by such endeavor. It may constitute an unnecessary waste, caused by the tempting beauty of the example images. There seems to be no immediate market or necessity for such ivory-tower investigations. There are only limited resources, which can be assigned to the investigation, design, and construction of symmetry-seeing machines:
- Computational resources in the form of FLOPS and memory BYTES. In the early days of our subject—people are working on it for a hundred years—this set hard constraints. However, progress in hard- and software development, in particular in parallel computing and GPUs, has been huge. FLOPS and BYTES are very cheap these days.
- Volunteers willing to participate as test-subjects in psychological experiments. These are needed to compare and evaluate the human seeing to the proposed machinery, and gain sound quantitative empirical evidence. Obviously, this is a more precious resource. However, volunteers need no specific training. Actually, machine-vision researchers, psychologists, computer or robotic experts etc. should be avoided. They might have a biased perception.
- Vison experts, computer scientists, psychologists, and mathematicians interested in the field. They have to study the vast body of literature that has compiled in more than hundred years on the topic, generate ideas, concepts, and models on how seeing-machines can be realized, code and debug the methods until they work, and test and compare them in interdisciplinary cooperation with psychologists. This is the most precious resource.
Success in the field at hand is mostly depending on the dispatching of the last resource. This paper proposes to concentrate, for the time being, on synthetic images. If volunteers are used to label real imagery, much more diligence and care is needed in their instructions, and in the setup. Instead, there should be close cooperation with computer graphics.
7. Conclusions
We are well aware that the real test comes, when a seeing machine is confronted with imagery not stemming from its creator. Funk and Liu use the term “in the wild” for this. For fully automated systems this will come, when a robot has a symmetry-seeing sub-module implemented in its visual perception and interpretation system. Then we may accumulate statistics on the benefit of this module. For a half-automated system interacting with human users, the test has come when users not familiar with the subject start trying to apply it. Do they accept it as beneficial? This all depends on a nice graphical user interface. Our subject has an advantage here, because of its beauty. People like symmetries, and tend to play around with them.
What can be concluded on the benefits of such synthetic imagery? If in the end only the performance on imagery form the open world counts, i.e., “images in the wild”, the efforts and time spent on synthetic images may well be wasted. However, we are engineers, and engineers test their prototype machines on test stands under well-defined circumstances varying the parameters of interest and measuring the performance. Namely, we see the following advantages:
- Such imagery contains only symmetry and clutter. It is a closed world. Therefore, we can separate the symmetry-seeing performance from other performances, such as object recognition, person recognition, vehicle recognition, etc.
- In particular, in the case of the Funk and Liu perceptron, we found that this machine has considerable capabilities in symmetry-seeing, even though it has never seen anything close to such imagery in its training phase. This is a counterintuitive result and has not been expected by the designers. Moreover, the machine appears very robust against clutter. We saw serious failures in very low cluttered instances in almost homogenous image regions on the one side, as well as surprising success on highly cluttered instances on the other side.
- The use of synthetic data allows the direct generation of primitive objects. Therefore, in the case of sparse methods, the influence of the primitive extraction method on the performance and efforts is separated.
- The controlled variation of one parameter—while keeping everything else fixed—allows determination of critical parameters. In the case of the Funk and Liu perceptron scale turned out a very critical issue. In the case of our Gestalt grouping, we could show that perspective distortion due to the 3D-to-2D projection, appears not very critical. To many experts this probably constitutes a surprise as well.
- For state-of-the-art perceptrons, the computational efforts are not data-dependent, and are huge. For the sparse methods less effort results, but it is data-dependent. Accordingly, such imagery can be used to estimate the efforts depending on certain parameters, such as clutter density. If the sparse method uses a CFAR-control, the relation between clutter density and recognition performance can be measured.
- Large quantities of images can be generated at almost no cost, while gathering and labeling large quantities of images causes considerable organization and labor.
- Investigating individual failure instances can give very valuable hints on how to improve the machine. It may be a program bug, some inapt parameter setting, etc. We can lay out our probe-tools and study the details, also apply small changes to the input, etc. Such work—whether it is applied to a perceptron or a sparse method—will certainly improve the robustness and performance, also for the use “in the wild”.
- The same material can also be used for psychological experiments with test subjects, e.g., comparing machine performance with human performance.
Author Contributions
Conceptualization, E.M.; Methodology, E.M.; Software sparse method, E.M., dense CNN method, S.V.; Validation, E.M. and S.V.; Writing-Review & Editing, E.M.
Funding
This research received no external funding.
Conflicts of Interest
The authors declare no conflict of interest.
References
- Funk, C.; Liu, Y. Beyond Planar Symmetry: Modelling Human Perception of Reflection and Rotation Symmetry in the Wild. In Proceedings of the IEEE ICCV 2017, Venice, Italy, 22–29 October 2017. [Google Scholar]
- Loy, G.; Eklundh, J. Detecting Symmetry and Symmetric Constellations of Features. In Proceedings of the ECCV, Graz, Austria, 7–13 May 2006; pp. 508–521. [Google Scholar]
- Desolneux, A.; Moisan, L.; Morel, J.-M. From Gestalt Theory to Image Analysis: A Probabilistic Approach; Springer: Berlin, Germany, 2008. [Google Scholar]
- Michaelsen, E.; Meidow, J. Advances in Computer Vision and Pattern Recognition. In Hierarchical Perceptual Grouping for Object Recognition; Springer: Cham, Switzerland, 2019. [Google Scholar] [CrossRef]
- Pizlo, Z.; Li, Y.; Sawada, T.; Steinman, R.M. Making a Machine that Sees Like Us; Oxford University Press: Oxford, UK, 2014. [Google Scholar]
- Grenander, U. General Pattern Theory; Oxford University Press: Oxford, UK, 1993. [Google Scholar]
- Michaelsen, E. Gestalt algebra—A proposal for the formalization of gestalt perception and rendering. Symmetry 2014, 6, 566–577. [Google Scholar] [CrossRef]
- Michaelsen, E.; Yashina, V.V. Simple gestalt algebra. Pattern Recognit. Image Anal. 2014, 24, 542–551. [Google Scholar] [CrossRef]
- Funk, C. Beyond Planar Symmetry, Architecture and weights of the Caffee model based on deep Lab V2. Available online: http://vision.cse.psu.edu/research/beyondPlanarSymmetry/index.shtml (accessed on 31 January 2019).
- Chen, L.C.; Yang, Y.; Wang, J.; Xu, W.; Yuille, A.L. Attention to Scale: Scale-aware Semantic Image Segmentation. In Proceedings of the CVPR, Las Vegas, NV, USA, 26 June–1 July 2016. [Google Scholar]
- Simonyan, K.; Zisserman, A. Very Depp Convolutional Networks for Large-scale Image Recognition. In Proceedings of the ICLR, San Diego, CA, USA, 7–9 May 2015. [Google Scholar]
- Michaelsen, E.; Doktorski, L.; Luetjen, K. An accumulating interpreter for cognitive vision production systems. Pattern Recognit.Image Anal. 2012, 22, 1–6. [Google Scholar] [CrossRef]
- Symmetry Detection from Real World Images—A Competition. Available online: http://vision.cse.psu.edu/research/symmComp/index.shtml (accessed on 26 December 2018).
- Liu, J.; Slota, G.; Zheng, G.; Wu, Z.; Park, M.; Lee, S.; Rauschert, I.; Liu, Y. Symmetry Detection from Real World Images, Competition 2013: Summary and Results. In Proceedings of the CVPR 2013, Portland, OR, USA, 23–28 June 2013. [Google Scholar]
- Funk, C.; Lee, S.; Oswald, M.R.; Tsokas, S.; Shen, W.; Cohen, A.; Dickinson, S.; Liu, Y. 2017 ICCV Challenge: Detecting Symmetry in the Wild. In Proceedings of the IEEE ICCV 2017, Venice, Italy, 22–29 October 2017. [Google Scholar]
- Meidow, J.; Hammer, H. Algebraic reasoning for the enhancement of data-driven building reconstruction. ISPRS J. Photogramm. Remote Sens. 2016, 114, 179–190. [Google Scholar] [CrossRef]
- Funk, C.; Pennsylvania State University, University Park, PA, USA. Personal communication, December 2018.
Figure 1.
Synthetic test data displayed as 400 × 400-pixel gray-tone raster image: (a) Simple dihedral symmetry of order 5 with about 40 clutter Gestalten; (b) Hierarchical symmetry—dihedron of friezes with about 160 clutter Gestalten.
Figure 1.
Synthetic test data displayed as 400 × 400-pixel gray-tone raster image: (a) Simple dihedral symmetry of order 5 with about 40 clutter Gestalten; (b) Hierarchical symmetry—dihedron of friezes with about 160 clutter Gestalten.

Figure 2.
Combinatorial growing numbers of higher level Gestalten: upper row—primitives, middle row—Gestalten of the form g|h, lower row—Gestalten of the form Λ(gi|hi) (a) thinly distributed clutter (25 elements of whom three are occluded by the foreground); (b) medium clutter (40 elements, 3 occluded by the foreground); (c) dense clutter (65 elements, 3 occluded).

Figure 3.
Accepting only the best: (a) best 60 Λ(gi|hi)-Gestalten of Figure 2c; (b) best 10 Λ(gi|hi)-Gestalten of Figure 2c.

Figure 4.
A more hierarchical example with a dihedron of friezes: (a) 200 uniformly distributed random primitives and 20 objects constituting the Gestalt; (b) the 220 best non-primitives of the structure ∑(gi); (c) the 220 best non-primitives of the structure (∑(gi))|(∑(gj)); (d) the 220 best non-primitives of the structure Λ(∑(gi))|(∑(gj))k.

Figure 5.
#01 of the evaluation list—tilt angle 10°, 25 clutter elements: (a) input image; (b) ground truth image; (c) result image of sparse method; (d) result image of dense CNN method.
Figure 5.
#01 of the evaluation list—tilt angle 10°, 25 clutter elements: (a) input image; (b) ground truth image; (c) result image of sparse method; (d) result image of dense CNN method.

Figure 6.
#67 of the evaluation list—tilt angle 10°, 65 clutter elements: (a) input image; (b) ground truth image; (c) result image of sparse method; (d) result image of dense CNN method.
Figure 6.
#67 of the evaluation list—tilt angle 10°, 65 clutter elements: (a) input image; (b) ground truth image; (c) result image of sparse method; (d) result image of dense CNN method.

Figure 7.
#29 of the evaluation list—tilt angle 60°, 25 clutter elements: (a) input image; (b) ground truth image; (c) result image of sparse method; (d) result image of dense CNN method.
Figure 7.
#29 of the evaluation list—tilt angle 60°, 25 clutter elements: (a) input image; (b) ground truth image; (c) result image of sparse method; (d) result image of dense CNN method.


Table 1.
Operations on the Gestalt domain.
| Symmetry | Notation | Input |
|---|---|---|
| Reflection | g|h | Pair |
| Frieze | Σg1… gn | n-tuple |
| Rotational | Πg1… gn | n-tuple |
| Prolongation | Λg1… gn | n-set |
| Parallel | G‖h | Pair |
| Lattice | #g11… gnm | n × m-tuple |
Table 2.
Numbers of elements with rising aggregation level.
| Thin | Standard | Thick |
|---|---|---|
| 27 | 43 | 69 |
| 20 | 38 | 114 |
| 148 | 544 | 4716 |
Table 3.
Success numbers of the sparse Gestalt method
| tilt 10° | tilt 30° | tilt 60° | |
|---|---|---|---|
| clutter 25 | 10 | 10 | 5 |
| clutter 40 | 10 | 10 | 7 |
| clutter 65 | 10 | 10 | 5 |
Table 4.
Success numbers of the dense deep perceptron
| tilt 10° | tilt 30° | tilt 60° | |
|---|---|---|---|
| clutter 25 | 5 | 4 | 1 |
| clutter 40 | 5 | 2 | 0 |
| clutter 65 | 6 | 7 | 1 |
© 2019 by the authors. Licensee MDPI, Basel, Switzerland. This article is an open access article distributed under the terms and conditions of the Creative Commons Attribution (CC BY) license (http://creativecommons.org/licenses/by/4.0/).
Share and Cite
MDPI and ACS Style
Michaelsen, E.; Vujasinovic, S. Estimating Efforts and Success of Symmetry-Seeing Machines by Use of Synthetic Data. Symmetry 2019, 11, 227. https://doi.org/10.3390/sym11020227
AMA Style
Michaelsen E, Vujasinovic S. Estimating Efforts and Success of Symmetry-Seeing Machines by Use of Synthetic Data. Symmetry. 2019; 11(2):227. https://doi.org/10.3390/sym11020227
Chicago/Turabian StyleMichaelsen, Eckart, and Stéphane Vujasinovic. 2019. "Estimating Efforts and Success of Symmetry-Seeing Machines by Use of Synthetic Data" Symmetry 11, no. 2: 227. https://doi.org/10.3390/sym11020227
Note that from the first issue of 2016, this journal uses article numbers instead of page numbers. See further details here.