Using Reflection Symmetry to Improve the Protection of Radio-Electronic Equipment from Ultrashort Pulses


Tomsk State University of Control Systems and Radioelectronics, 634050 Tomsk, Russia
*
Author to whom correspondence should be addressed.
Symmetry 2019, 11(7), 883; https://doi.org/10.3390/sym11070883
Submission received: 6 June 2019
/
Revised: 25 June 2019
/
Accepted: 2 July 2019
/
Published: 5 July 2019
(This article belongs to the Special Issue Symmetry: Anniversary Feature Papers 2018)
Abstract
:The paper considers the protection of critical radio-electronic equipment (REE) from ultrashort pulses (USP) by means of modal filters (MFs). A new approach to improve modal filtration by using reflection symmetry is analyzed. The results of a sophisticated research into protective devices based on reflection symmetric MFs are presented: improving the characteristics of four MFs through optimization both by one and simultaneously by several criteria; calculating the per-unit-length time delays matrix of a reflection symmetric MF using the obtained analytical expressions; calculating the time and frequency responses of an MF with and without losses in conductors and dielectric; developing the laboratory evaluation board; analyzing the effect of moisture protection on the characteristics; analyzing the features of reflection symmetry structures; comparing microstrip and reflection symmetric four-conductor MFs. The obtained results allow us to argue that the reflection symmetric MF protects REE from a USP due to its decomposition into a sequence of pulses with pairwise equalized voltage amplitudes and close time intervals between decomposition pulses with an attenuation coefficient of four times with a controlled bandwidth of a useful signal. This research helps take advantage of the possibilities of using the symmetry to improve modal filtering and opens the ways to create a large number of new MF designs, applying only the principles of the symmetry described in the work.
1. Introduction
Currently, radio-electronic equipment (REE) has been introduced in almost all industries, including military, nuclear, space, medical and telecommunications. Such a tendency leads to an aggravation of the electromagnetic compatibility (EMC) problem due to vulnerability of equipment, especially to intentional electromagnetic interferences (IEMI). The problem of IEMI is regularly discussed at international conferences, for example at AMEREM, EUROEM and ASIAEM. At the ASIAEM 2015 conference, there was a conference panel called “IEMI Threats, Effects and Protection” and even two special panel discussion groups “Design of Protective Devices and Test Methods”, and “Evaluation of HEMP/IEMI Impacts on Critical Infrastructure”. The first open discussion of this problem took place at the plenary session of the AMEREM conference in 1996 [1]. The first review of the IEMI problem was presented at the EMC symposium in Wroclaw in 1998 [2]. In addition, in some articles of the well-known journal “IEEE Transactions on EMC”, where the results of the latest EMC research in the world are published, there are many valuable results that can be used to create a noise immunity technology for critical REE. For example, [3] considered this new IEMI threat to civil society. The currently topical EMC direction is protection against conductive interference. Particularly, it is important to protect computers from interference originating in power lines [4]. Recent investigations have shown the possibility of interrupting the normal functioning of IT networks through high-power electromagnetic interference via the power lines [5] and the local area network cables [6]. The analysis of the impact of a commercially available powerful source of damped sinusoids on a computer network was presented in [7]. Overview of the possible IEMI effects on cyber-physical systems was performed in [8]. A powerful ultrashort pulse (USP) seems to be especially dangerous [9]. The results obtained in the investigation of local area networks for Fast Ethernet and Gigabit Ethernet exposed to nanosecond electromagnetic interference were presented in [10]. The devices based on nonlinear protection elements for electronic system protection against natural or man-made electromagnetic interferences with high energies and amplitudes, in particular against USPs, were presented in [11].
Unfortunately, traditional devices used as a protection against pulse interference, for example, voltage suppressors, varistors, passive RC- and LC-filters, have a number of disadvantages (vulnerability to radiation, short service life, failure to operate at high voltages, insufficient operating speed, etc.), making it difficult to protect against powerful USPs. One of the new protection principles is based on modal filtering—the use of modal distortions (signal changes due to the difference in modal delays of a multiconductor transmission line (MCTL)) based on serial modal decomposition of the pulse in cascaded segments of coupled lines. New devices based on modal filtering technology are called modal filters (MF) [12]. A qualitative comparison of MFs against traditional and dedicated protection devices is presented in Table 1.
They are devoid of these disadvantages and what is more, provide several benefits (lack of semiconductor components, resulting in high radiation resistance; long service life; operation at high voltages; and small dimensions and low cost).
In the spaceborne equipment, flexible printed cables (FPCs) are used to provide connection between spacecraft units [13] (Figure 1).
Due to the large number of contacts in the rows of a connector, the outermost conductors of the cable remain unused. In accordance with the technical specifications, they are technological (they provide insulation on a nearby printed conductor). However, they can be used to implement a modal filtration in the cable. Thus, the outermost conductors (which can be used as reference or passive) can be used as a protection means based on modal filtration. Figure 2 considers cross-sections of two structures of such an approach. These cross-sections, according to the location of the active and passive conductors relative to the reference, are called symmetric (Figure 2a) and asymmetric (Figure 2b) structures.
The propagation of pulses in sections of an FPC of different lengths in a symmetric structure was investigated. The reduction of the amplitude of an exciting pulse with a duration of 0.3 ns by 2 times in the FPC segment with a length of 1 m has been shown, which demonstrates the ability to protect REE from a powerful USP due to its decomposition into a sequence of pulses, which is easily feasible because of the specific character of the FPC structure. The time response simulation results for the asymmetric structure did not show any significant decrease in the amplitude of the exciting pulse at the end of the active conductor. Thus, the possibility of modal decomposition of the excitation pulse in the FPC directly depends on the symmetry. This can be generalized to any arbitrary pair of coupled lines whose cross-section is symmetric with respect to the axis passing through the reference conductor. Hence, for all matrices of per-unit-length parameters (L, C, R, G) we get:
l11 = l22; c11 = c22; r11 = r22; g11 = g22.
In addition, in order to obtain equal amplitudes of the decomposition pulses at the MF output, the matching symmetry is important, which is discussed below. We considered the lines with strong and weak couplings. Their cross-sections are presented in Figure 3a,b respectively, where w is the width of the conductors, s is the separation between them, t is the thickness of the conductors, h is the thickness of the dielectric and εr is the relative permittivity of the substrate [14]. It is established that for the amplitudes of the decomposition pulses to be equal, it is essential to provide the axial symmetry of the structure cross-section (active and passive conductors are mirrored with respect to the reference, located on symmetry axis) and the symmetry of loads R (Figure 3c) expressed by
R = R1 = R2 = R3 = R4.
However, although the conditions of the cross-section symmetry and the load symmetry are necessary, they are not sufficient for the equality of the decomposition pulse amplitudes. We performed the simulation of the time response when the excitation signal had an electromotive force (EMF) of 1 kV and the duration of 300 ps. First, the nominal value of the resistors R was chosen to be equal to the value of the diagonal coefficients (z11 = z22) of the matrix Z, calculated from the per-unit-length matrices C and L, according to the results of [15]. As a result of simulating the time response of the structure with weak coupling, the decomposition pulses with close amplitudes were obtained (238 V and 245 V). However, for the structure with strong coupling, with the same criterion for choosing the boundary conditions, the equality of the amplitudes of the decomposition pulses is no longer preserved (225 V and 58 V). In addition, the voltage amplitude at the beginning of the line decreases (from 490 V to 360 V) [14]. Thus, another choice of R values is needed.
There exists a well-known analytical expression for voltage amplitudes (normalized to the amplitude of the EMF) of the even and odd mode pulses at the end of two coupled lines [16]. In this case, it looks like
where
Ve,o/E = (1 + Γe,o)/(2Pe,o)
Γe,o = (R − Ze,o)/(R + Ze,o), Pe,o = 1 + R/Ze,o.
Equating the amplitudes of the pulses of even and odd modes after simple algebraic transformations gives the condition of symmetry matching:
R = (ZeZo)0.5.
Using this value of R, the time response for structures with weak and strong couplings is similarly calculated. The value of R, being equal to the diagonal coefficient of the matrix Z, leads to the inequality of the amplitudes of the decomposition pulses, which is especially significant for structures with strong coupling. If the values of R are equal to the geometric mean value of the even and odd modes impedances, then we get pulses with equal amplitudes as a result of the decomposition. The voltage amplitude at the beginning of the active conductor of the line is equal to half the EMF.
Note that with strong coupling, the amplitude of the pulses is much smaller (132 V) than with the weak one (250 V). Therefore, structures with strong coupling are preferable for implementing modal filtration.
The amplitudes of the voltage pulses with R = (ZeZo)0.5 can be obtained analytically. Substituting Equation (3) into Equation (1), after simple algebraic transformations, we obtain an analytical expression for the amplitudes of the normalized and equal amplitudes of the even and odd modes through their characteristic impedances
where k = (Ze/Zo)0.5 with Ze > Zo.
V/E = k/(k + 1)2,
Thus, an important condition for modal filtration is the matching condition for the choice of resistive loads at the ends of the MF segment, which makes it possible to obtain equal amplitudes of decomposition pulses at the MF output.
A two-conductor structure was considered, wherein the active and passive conductors are reflection symmetric with respect to the horizontal axis, and the reference conductor is located symmetrically to this axis (Figure 4).
When simulating the time response to the excitation of the EMF of 5 V and the total duration of 150 ps, it was found that the amplitudes of the decomposition pulses at the end of the active conductor are the same and equal to 1.25 V, which is half as much as the amplitude of the input pulse. It is shown that the structure with the symmetry of the signal conductors relative to the reference allows obtaining equalized amplitudes of the decomposition pulses at the MF output. In other words, in order to obtain higher characteristics of the MF, it is advisable to change the configuration of the structure before reaching the symmetry for more efficient decomposition of the USP in the MF.
As a result, a new approach to improve modal filtration through the use of reflection symmetry was proposed [17]. In general, reflection symmetry is a mapping of space onto itself, wherein any point goes into a point symmetric to it, relative to a plane. From this definition it is clear that a reflection symmetric structure can be called a structure wherein the conductors and dielectrics reflect to each other. In the cross-section of a reflection symmetric structure, the number of conductors (except the reference one) is even, and they are at the same distance relative to the axis of symmetry.
The reflection symmetric structure with respect to the horizontal axis of symmetry α and vertical β, which passes through conductor 5, is shown in Figure 5. It differs from the structure with weak coupling (Figure 3b) in that the opposite conductors 3 and 4 are added to conductors 3 and 4, the dielectric thickness h1 = 2h + t is increased and conductor 5 is located in the dielectric.
Thus, the reflection symmetric configuration of the MF consists of five identical and rectangular conductors on a dielectric layer, with conductors 1 and 2 located on one side, two additional conductors (3 and 4) placed reflection-symmetrically relative to conductors 1 and 2 on the reverse side of the dielectric layer, and the grounded conductor 5 located in the dielectric layer at an equal distance from the external conductors [18]. This structure is generally regarded as a four-conductor transmission line with inhomogeneous dielectric filling in the cross-section. Consequently, four modes with corresponding characteristics propagate in this structure. Due to the symmetry of the cross-section along two axes, for each of the per-unit-length parameters of matrices, the following equations (given for the matrix L) are valid:
l11 = l22 = l33 = l44; l12 = l34; l13 = l24; l14 = l23.
The reflection symmetric MF is noteworthy in that it allows one to obtain a USP decomposition at the MF output with equal amplitudes of pulses and time intervals between decomposition pulses, which allows one to achieve higher characteristics of the MF without additional optimization. This is achieved by ensuring simultaneously the edge and broad-side couplings between the conductors. The papers [19,20,21] are devoted to some research into reflection symmetric structures. However, there is no systematic representation of the recently obtained and new results of reflection symmetric MFs. Meanwhile, this is relevant, since the summary of the latest results in the field of protection from USPs with the use of reflection symmetric MFs in one paper may be useful for an interested reader. The aim of this paper is to fill this gap.
2. Cross-Sections and Schematic Diagram of MFs under Consideration and Simulation Approach
2.1. Cross-Sections and Schematic Diagram of Reflection Symmetric MF
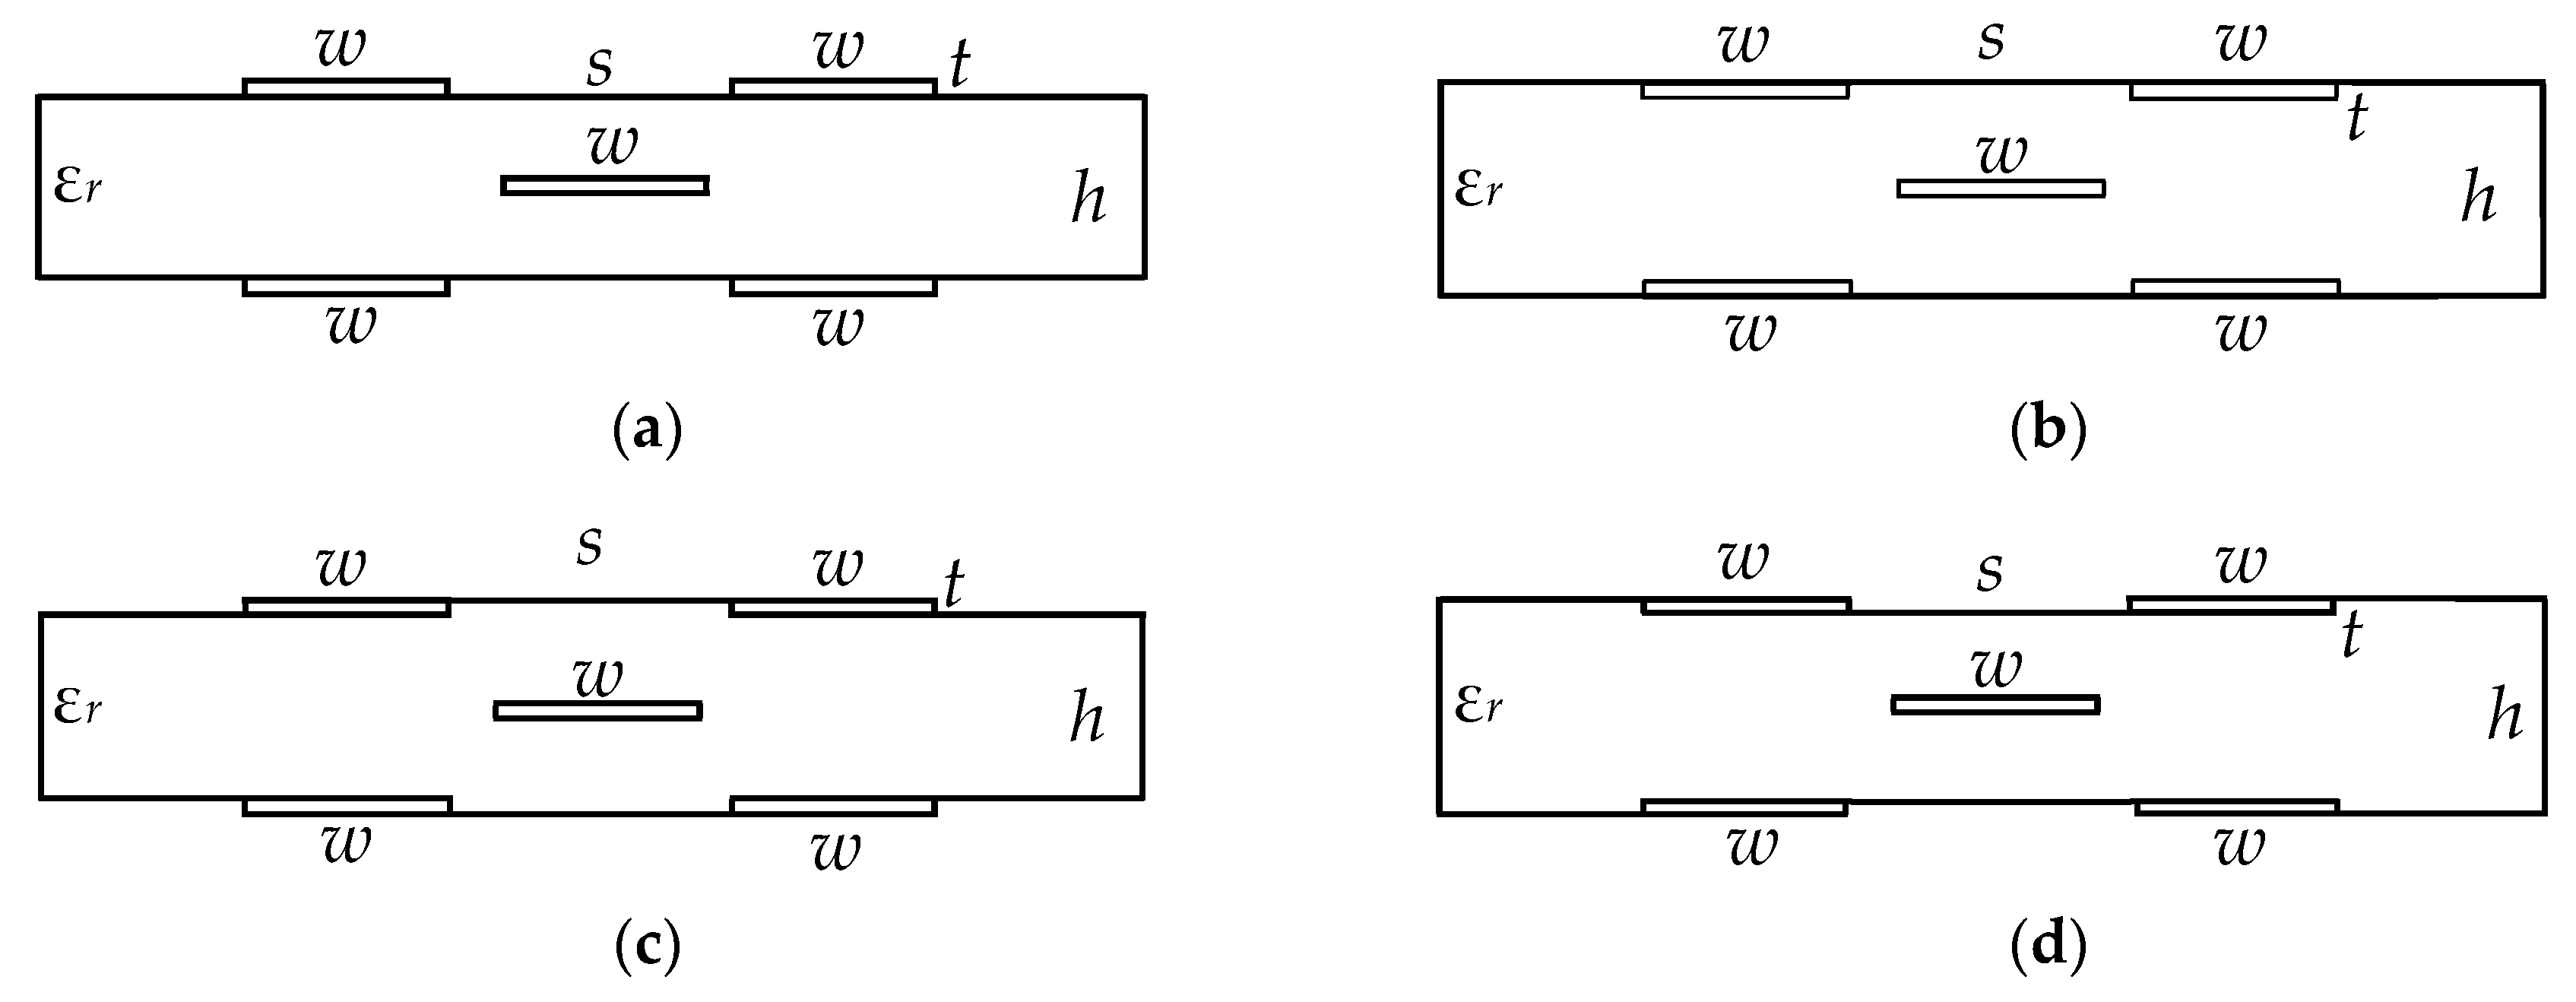
Generally speaking, with a quasistatic approach, the number of modes propagating in a line is equal to the number of conductors (N) in the line. The reflection symmetric MF is considered as a four-conductor transmission line with inhomogeneous dielectric filling in the cross-section. Consequently, in such structure four modes with corresponding characteristics are distributed. In this work, four structures of reflection symmetric MFs slightly differing from each other by the arrangement of conductors in the dielectric are used as the objects of research. Cross-sections of these structures are shown in Figure 6.
Per-unit-length parameters and responses were calculated with a quasistatic approach in the TALGAT software assuming the propagation of only T-waves [22]. In order to do that, first, the geometric models of the investigated MFs cross-sections were developed, and the matrices of the per-unit-length coefficients of electrostatic (C) and electromagnetic (L) induction were calculated. If it was necessary to consider the losses, we calculated the matrices of the per-unit-length resistances R (for the losses in the conductors) and conductivities G (for the losses in the dielectric). When considering the losses, we used a widely known model [23] of the frequency dependence of the relative permittivity and the tangent of the dielectric loss angle of FR-4 material for calculating the G matrix. The entries of the matrix R were calculated considering the skin effect, the proximity effect and the losses in the ground plane using the method proposed in [24]. In the case without losses, the per-unit-length entries of the resistance matrix (R) and conduction matrix (G) were accepted to be equal to zero.
The conductor roughness was not considered, since it has a significant effect only at a small value of the conductor thickness (≈5 μm). However, in the long run, this can be useful and easy to accomplish in practice using the TALGAT software. The situation is similar with regard to the frequency dependence of the substrate permittivity. For example, in continuation of research [23] for a single transmission line, it was shown in [25] that when the frequency dependence of the permittivity is considered, the non-causality in the form of a premature arrival of a pulse signal to the output of a coupled line becomes less. Such research for the considered MFs will be performed in the future.
Next, we created a schematic diagram for simulation, and set loads and pulse excitation values. Finally, we calculated the time and frequency responses in the parameter range. In some tasks, parametric optimization was also performed by heuristic search.
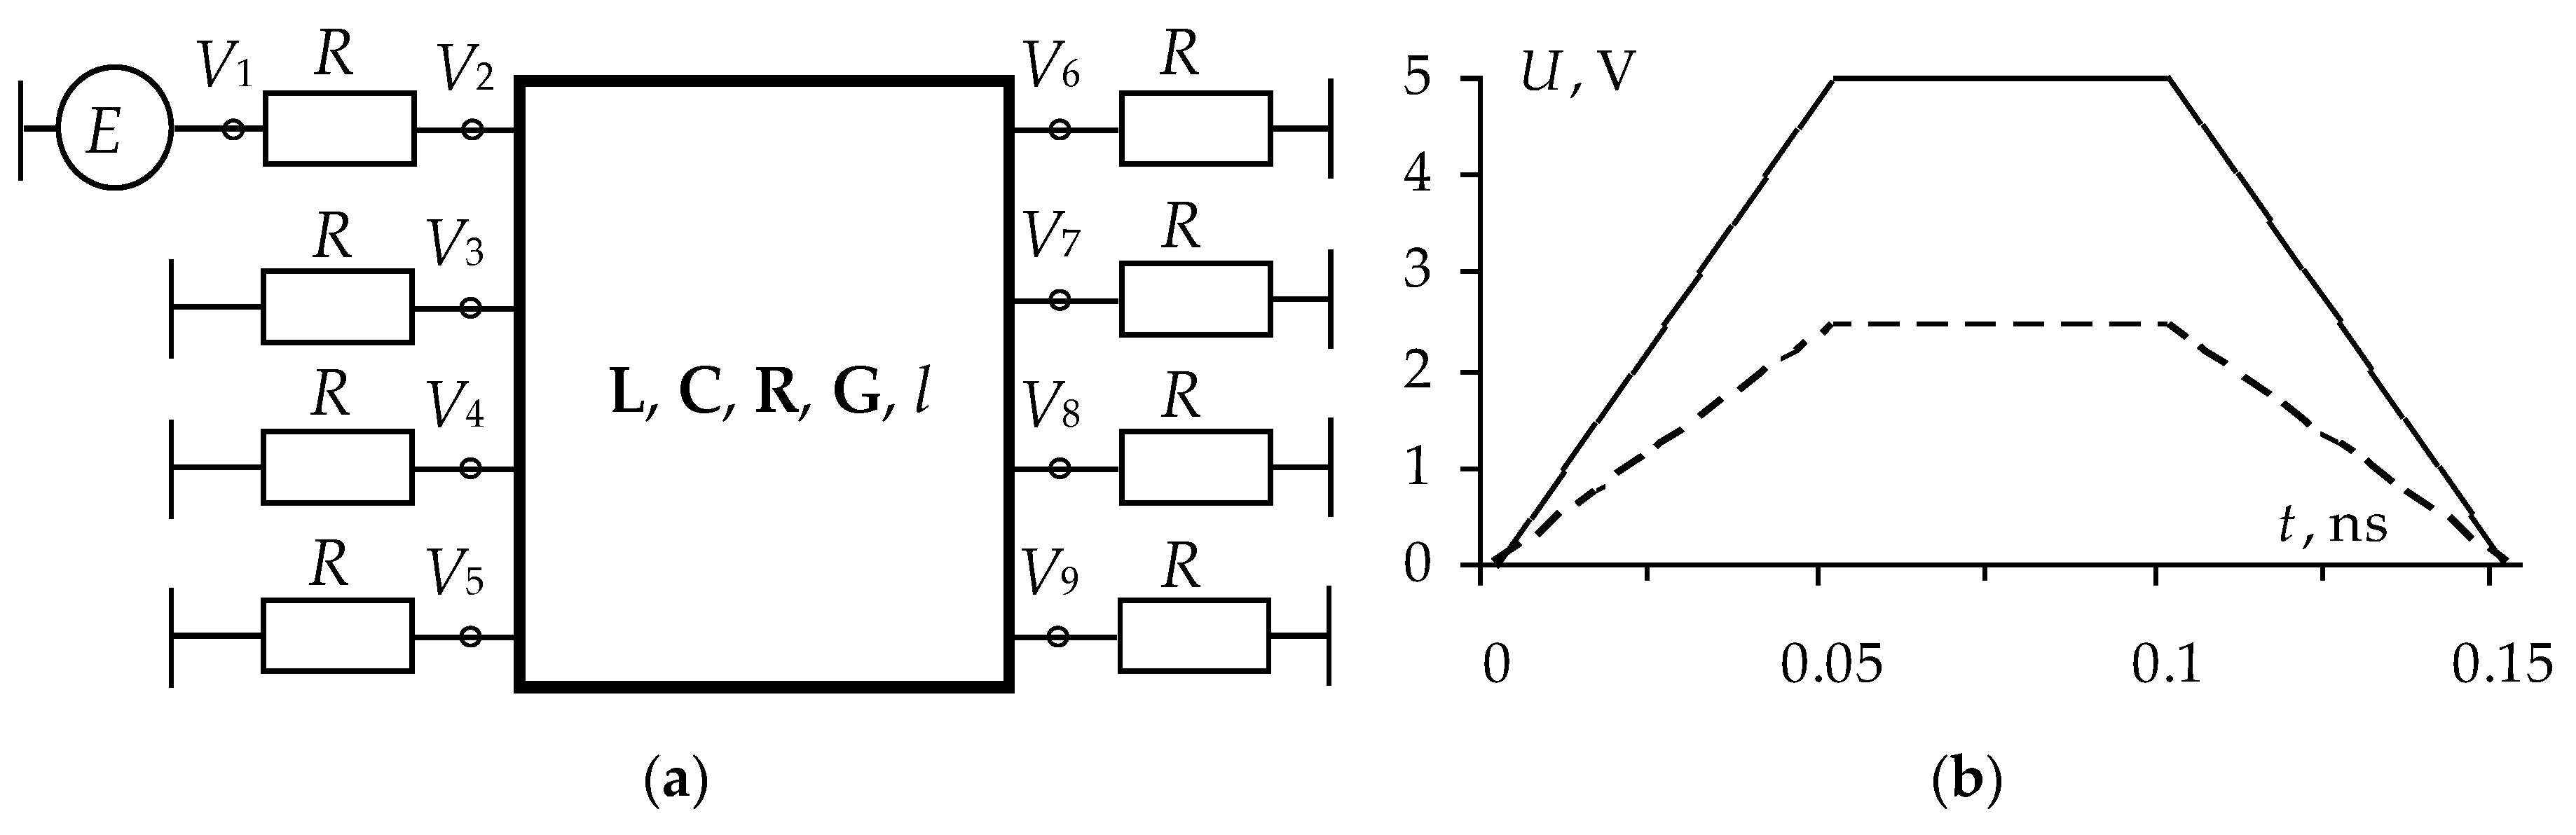
The schematic diagram of the reflection symmetric MF is shown in Figure 7a. The resistance values (R) were taken to be equal to 50 Ω while the MF length was l = 1 m. To simulate the time response, we used a source of trapezoidal pulse signals, represented by an ideal EMF source with an amplitude of 5 V and with durations of rise, fall and flat top of 0.05 ns each, so the total duration of the input pulse (tΣ) was 0.15 ns (Figure 2b). The simulation of the frequency response of the MFs was performed with the harmonic excitation of the EMF source of 2 V in the frequency range from 1 MHz to 3.5 GHz.
2.2. Confirmation and Validation of the Simulation Approach
Traditionally, when simulating such protective devices, electrodynamic and quasistatic approaches are used. The first is based on Maxwell’s equations considering all types of waves. It provides high simulation accuracy, but leads to high computational costs, even for simple configurations. Therefore, the electrodynamic approach is used mainly for simulating the structures at microwave frequencies. The quasistatic approach considers the propagation of only a transverse T-wave without considering higher types of waves. It is based on reducing Maxwell’s equations to telegraph equations [26], which are less expensive to solve, and its accuracy is often quite reasonable, especially for extended structures [27].
Telegraph equations use matrices of per-unit-length parameters. The accuracy of their calculation is of key importance. To validate the results of the TALGAT system, we calculated the C matrix in the range of parameters of the two-conductor strip structure. These results are compared with the results of measurements and simulations performed by the Green’s function method (GFM), method of moments (MoM), and variational method (VM) published in [28] (Table 2). The coincidence of our data with the others is satisfactory: the maximum error for C11 is −6.3%, and for C12 is −16.7%.
The considered MF is a four-conductor structure. Therefore, along with this MF, we also compared two other four-conductor structures and carried out similar simulations using the published results with sufficient initial data.
The results of calculating matrix C of a four-conductor structure of a complex shape in the air above the infinite ground plane using the TALGAT system while increasing segmentation and using another method [29] are listed in Table 3. The maximum difference with the data from [29] is ±15% with 20 segments on the conductor perimeter (this is an error for capacitances between curved conductors, which is quite natural for such a specific arrangement and coarse segmentation in the method of moments), but quickly decreases with increasing segmentation, as can be seen from the convergence of the data obtained to the data in the last row.
Next, we compared the entries of matrix C for a four-conductor structure [30], where the reference (left) one is a similar conductor (like in the reflection symmetric MF). All conductors with a radius of 0.19 mm are isolated by dielectric (εr = 3.5) with a radius of 0.44 mm and are located in a line with a pitch of 1.27 mm (Table 4). The maximum deviation is less than ±0.44% and confirms the correctness of the C matrix calculations performed in the TALGAT system.
Thus, the performed comparative analyses showed satisfactory coincidence of the results and the relevance of the TALGAT system for computing per-unit-length matrices for structures of various complexities. Meanwhile, for complete verification, we must compare the time response of the structure.
There exist indicative and commonly available examples of comparing the TALGAT system results with the measurement [31] and electromagnetic analysis [32] results being omitted here. However, it is representative to show the comparison results for coupled lines consisting of three conductors [33], one of which is the reference (Figure 3b), because this line is a prototype of a reflection symmetric MF. Electrodynamic simulation has been performed using the CST MICROWAVE STUDIO (CST MWS) software with rare (2 h 7 min) and fine (6 h 33 min) segmentations, while the quasistatic approach used the TALGAT system (11 s). When segmentation increases, there is a convergence of the CST MWS results to the TALGAT results both in pulse delays and amplitudes. Thus, we have correct TALGAT results obtained in a considerably lower computational time. The voltage waveforms are presented in Figure 8.
3. The Investigation of the Reflection Symmetric MF
3.1. Optimization
3.1.1. Parametric Optimization of Reflection Symmetric Modal Filters by Heuristic Search by Two Criteria
As previously noted, the reflection symmetric MF, due to its specificity, allows obtaining high attenuation characteristics of the USP (while decomposing a USP into a sequence of pulses with pairwise equalized voltage amplitudes and close time intervals between the decomposition pulses), without resorting to global optimization methods. However, to improve the characteristics of the reflection symmetric MF, it is advisable to use optimization, for example, parametric optimization by heuristic search. To begin with, we specify the main optimization criteria: by amplitude and by time [34]. Meanwhile, in order to obtain higher characteristics of the reflection symmetric MF, the following criteria are relevant:
- Minimization of the maximum voltage of an MF output waveform. This criterion is the most important, since it is the amplitude of the voltage of an MF output that determines its main characteristic: filter attenuation. Due to the peculiarity of the USP decomposition in reflection symmetric structures, it is assumed that the achievement of this criterion is possible, first of all, by equalizing the pulse amplitudes at the MF output.
- Equalization of decomposition pulse delay differences. This criterion is important to prevent the overlapping of pulses at the MF output, and, as a consequence, the increase of the total amplitude of decomposition pulses. At the same time, the equalization of delay differences between the decomposition pulses will maximize the duration of the input excitation to be decomposed completely.
In this section, four structures of reflection symmetric MFs are optimized for several parameters. The parameters s and w were optimized in the range of 200–2000 μm according to two criteria with the same parameters: t = 18 μm, h = 500 μm, εr2 = 1, εr1 = 4.5, tgδ = 0.017.
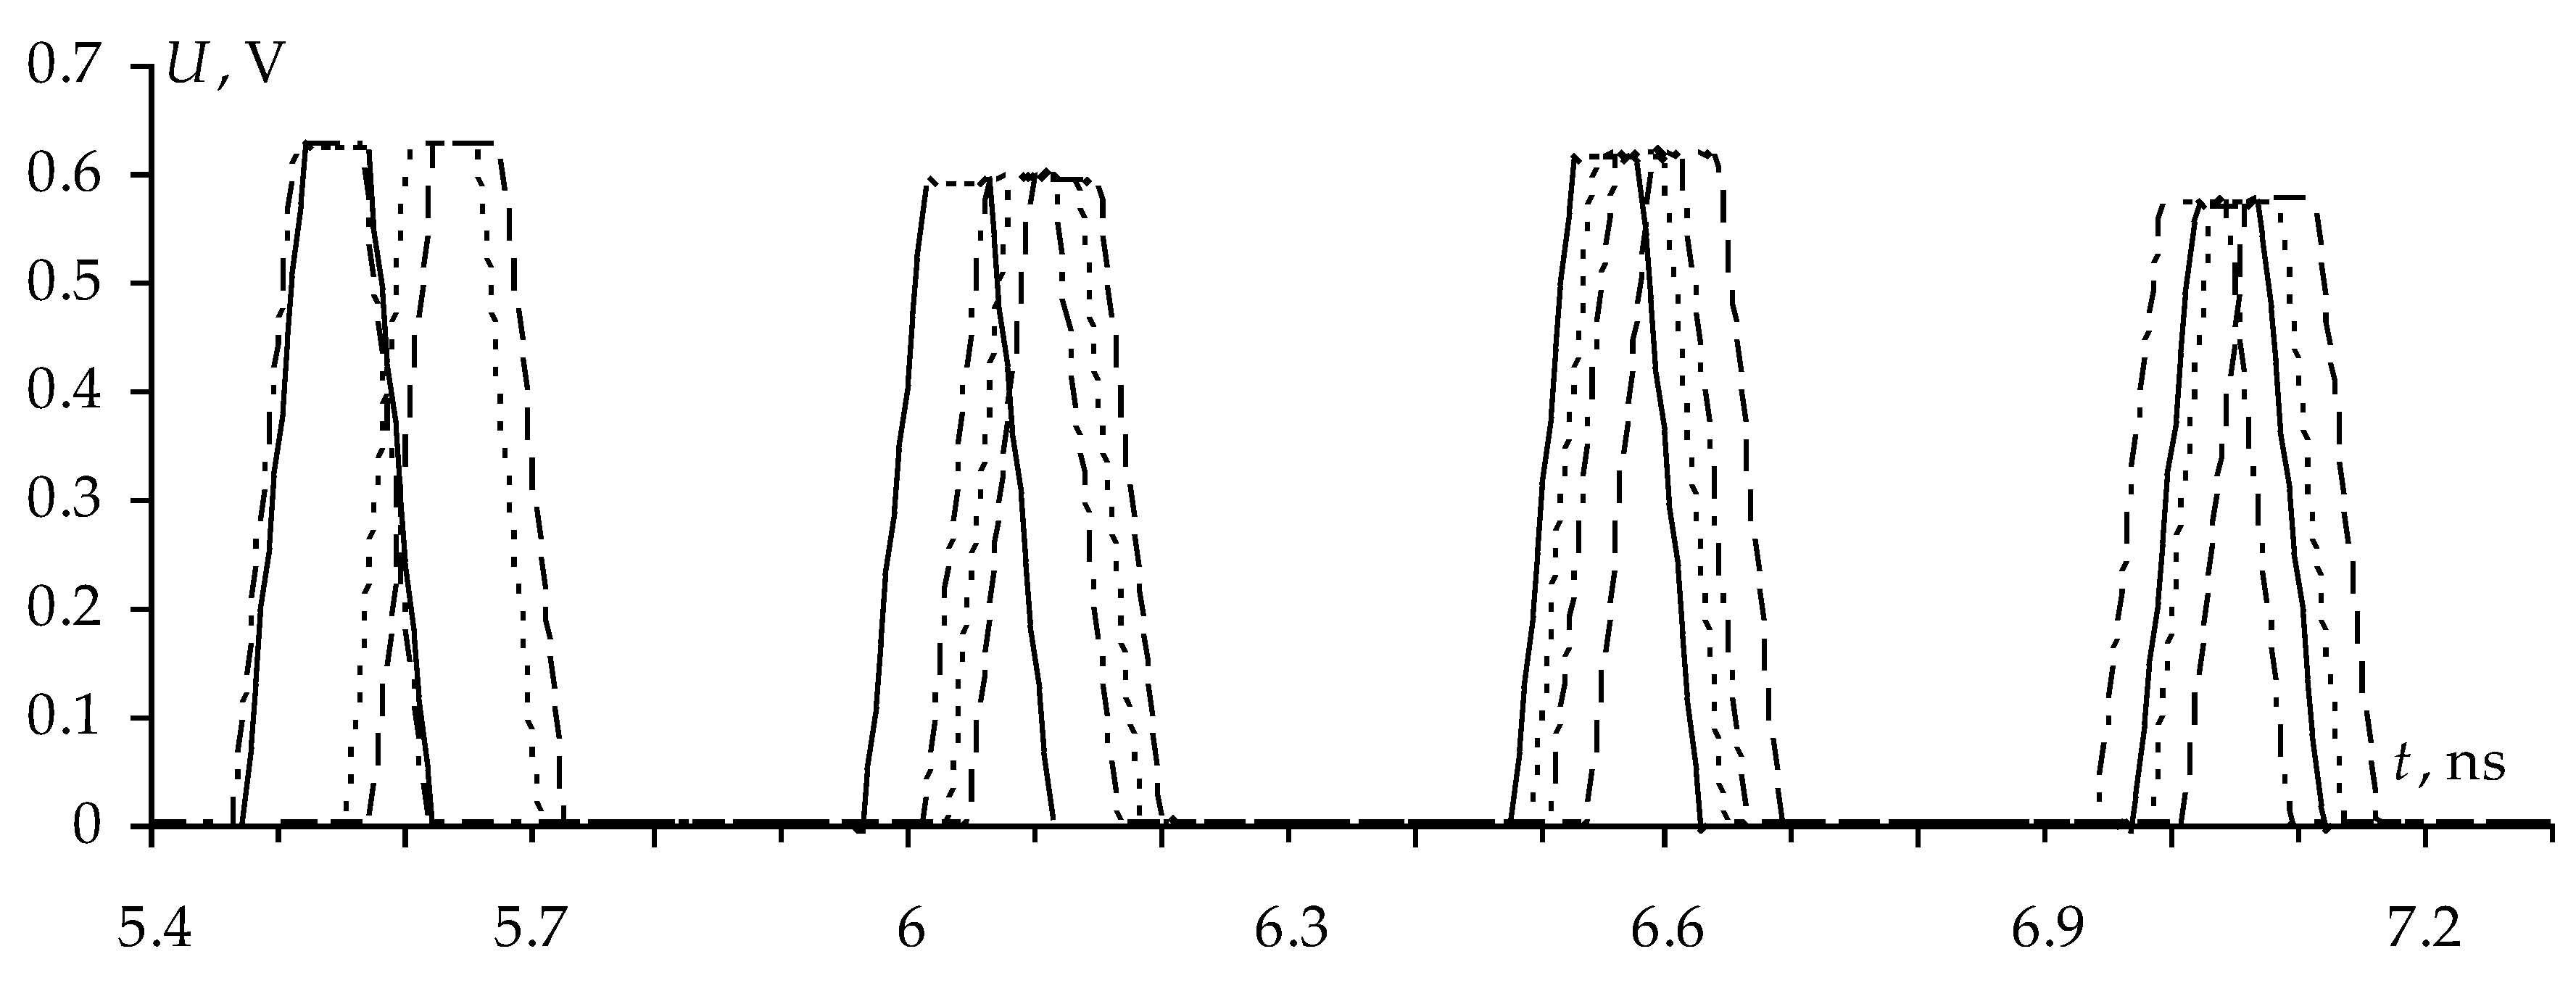
As a result, for structure 1 (Figure 6a), the values w = 1600 μm, s = 250 μm were obtained. With these parameters we satisfied the first criterion—minimization of the maximum voltage of an MF output waveform (Figure 9a). When optimizing by the second criterion (equalization of decomposition pulse delay differences), the values w = 1600 μm, s = 500 μm were obtained (Figure 9b). Structure 2 (Figure 6b) differs from structure 1 in that the conductors 1, 2, 3, 4 are located under the dielectric-air boundary. As a result of the optimization, according to the first criterion, w = 1600 μm, s = 250 μm were obtained (Figure 9a), and for the second criterion, w = 1600 μm, s = 550 μm (Figure 9b). Structure 3 (Figure 6c) differs from structure 1 in that the separations between the edges of conductors 1, 2 and 3, 4 are filled with dielectric. As a result of optimization, according to the first criterion, w = 1600 μm, s = 250 μm were obtained (Figure 9a), and for the second criterion, w = 1600 μm, s = 575 μm (Figure 9b). Structure 4 differs from structure 1 in that the dielectric is filled by the external edges of conductors 1, 3 and 2, 4 (Figure 6d). As a result of optimization, according to the first criterion, w = 1600 μm, s = 250 μm were obtained (Figure 9a), and for the second criterion, w = 1600 μm, s = 520 μm (Figure 9b). The waveforms at the output of the reflection symmetric MF after optimization by the first criterion are presented in Figure 9a, and after optimization by the second criterion in Figure 9b.
The values of the optimized parameters, the amplitudes of the pulses at the MF output, as well as the decomposition pulse delay differences are summarized in Table 5 and Table 6. In this case, the voltages at the MF output are similar for all the structures under consideration and do not exceed 0.622 V (Table 5), which is four times less than the input pulse amplitude. We also obtained approximately equalized time intervals between decomposition pulses (Table 6), which makes it possible to eliminate the overlapping of pulses in these structures with an increase in the duration of the excitation pulse up to 450 ps, and as a result, an increase in the maximum amplitude.
Comparative analysis of the structures showed that a change in the arrangement of conductors in a single dielectric does not significantly affect the values of the amplitudes of the pulses or the values of the differences in the delays between the decomposition pulses.
As a result of the parametric optimization of the four reflection symmetric MF structures by two criteria, it was obtained that optimizing structures 2 and 3 by criterion 2 the deviations of the neighboring values of the delay differences were 0.02 ns, while optimizing structure 4 by criterion 2 the optimal value of the difference between the delays of the fourth and third pulses was not obtained. Meanwhile, optimization of all structures by criterion 2 made it possible to increase the minimum delay differences. However, the amplitudes of the pulses are almost the same (Table 5). Meanwhile, by criterion 1, the same values of w and s were obtained for all structures.
3.1.2. Multicriteria Optimization of Reflection Symmetric Structure Parameters
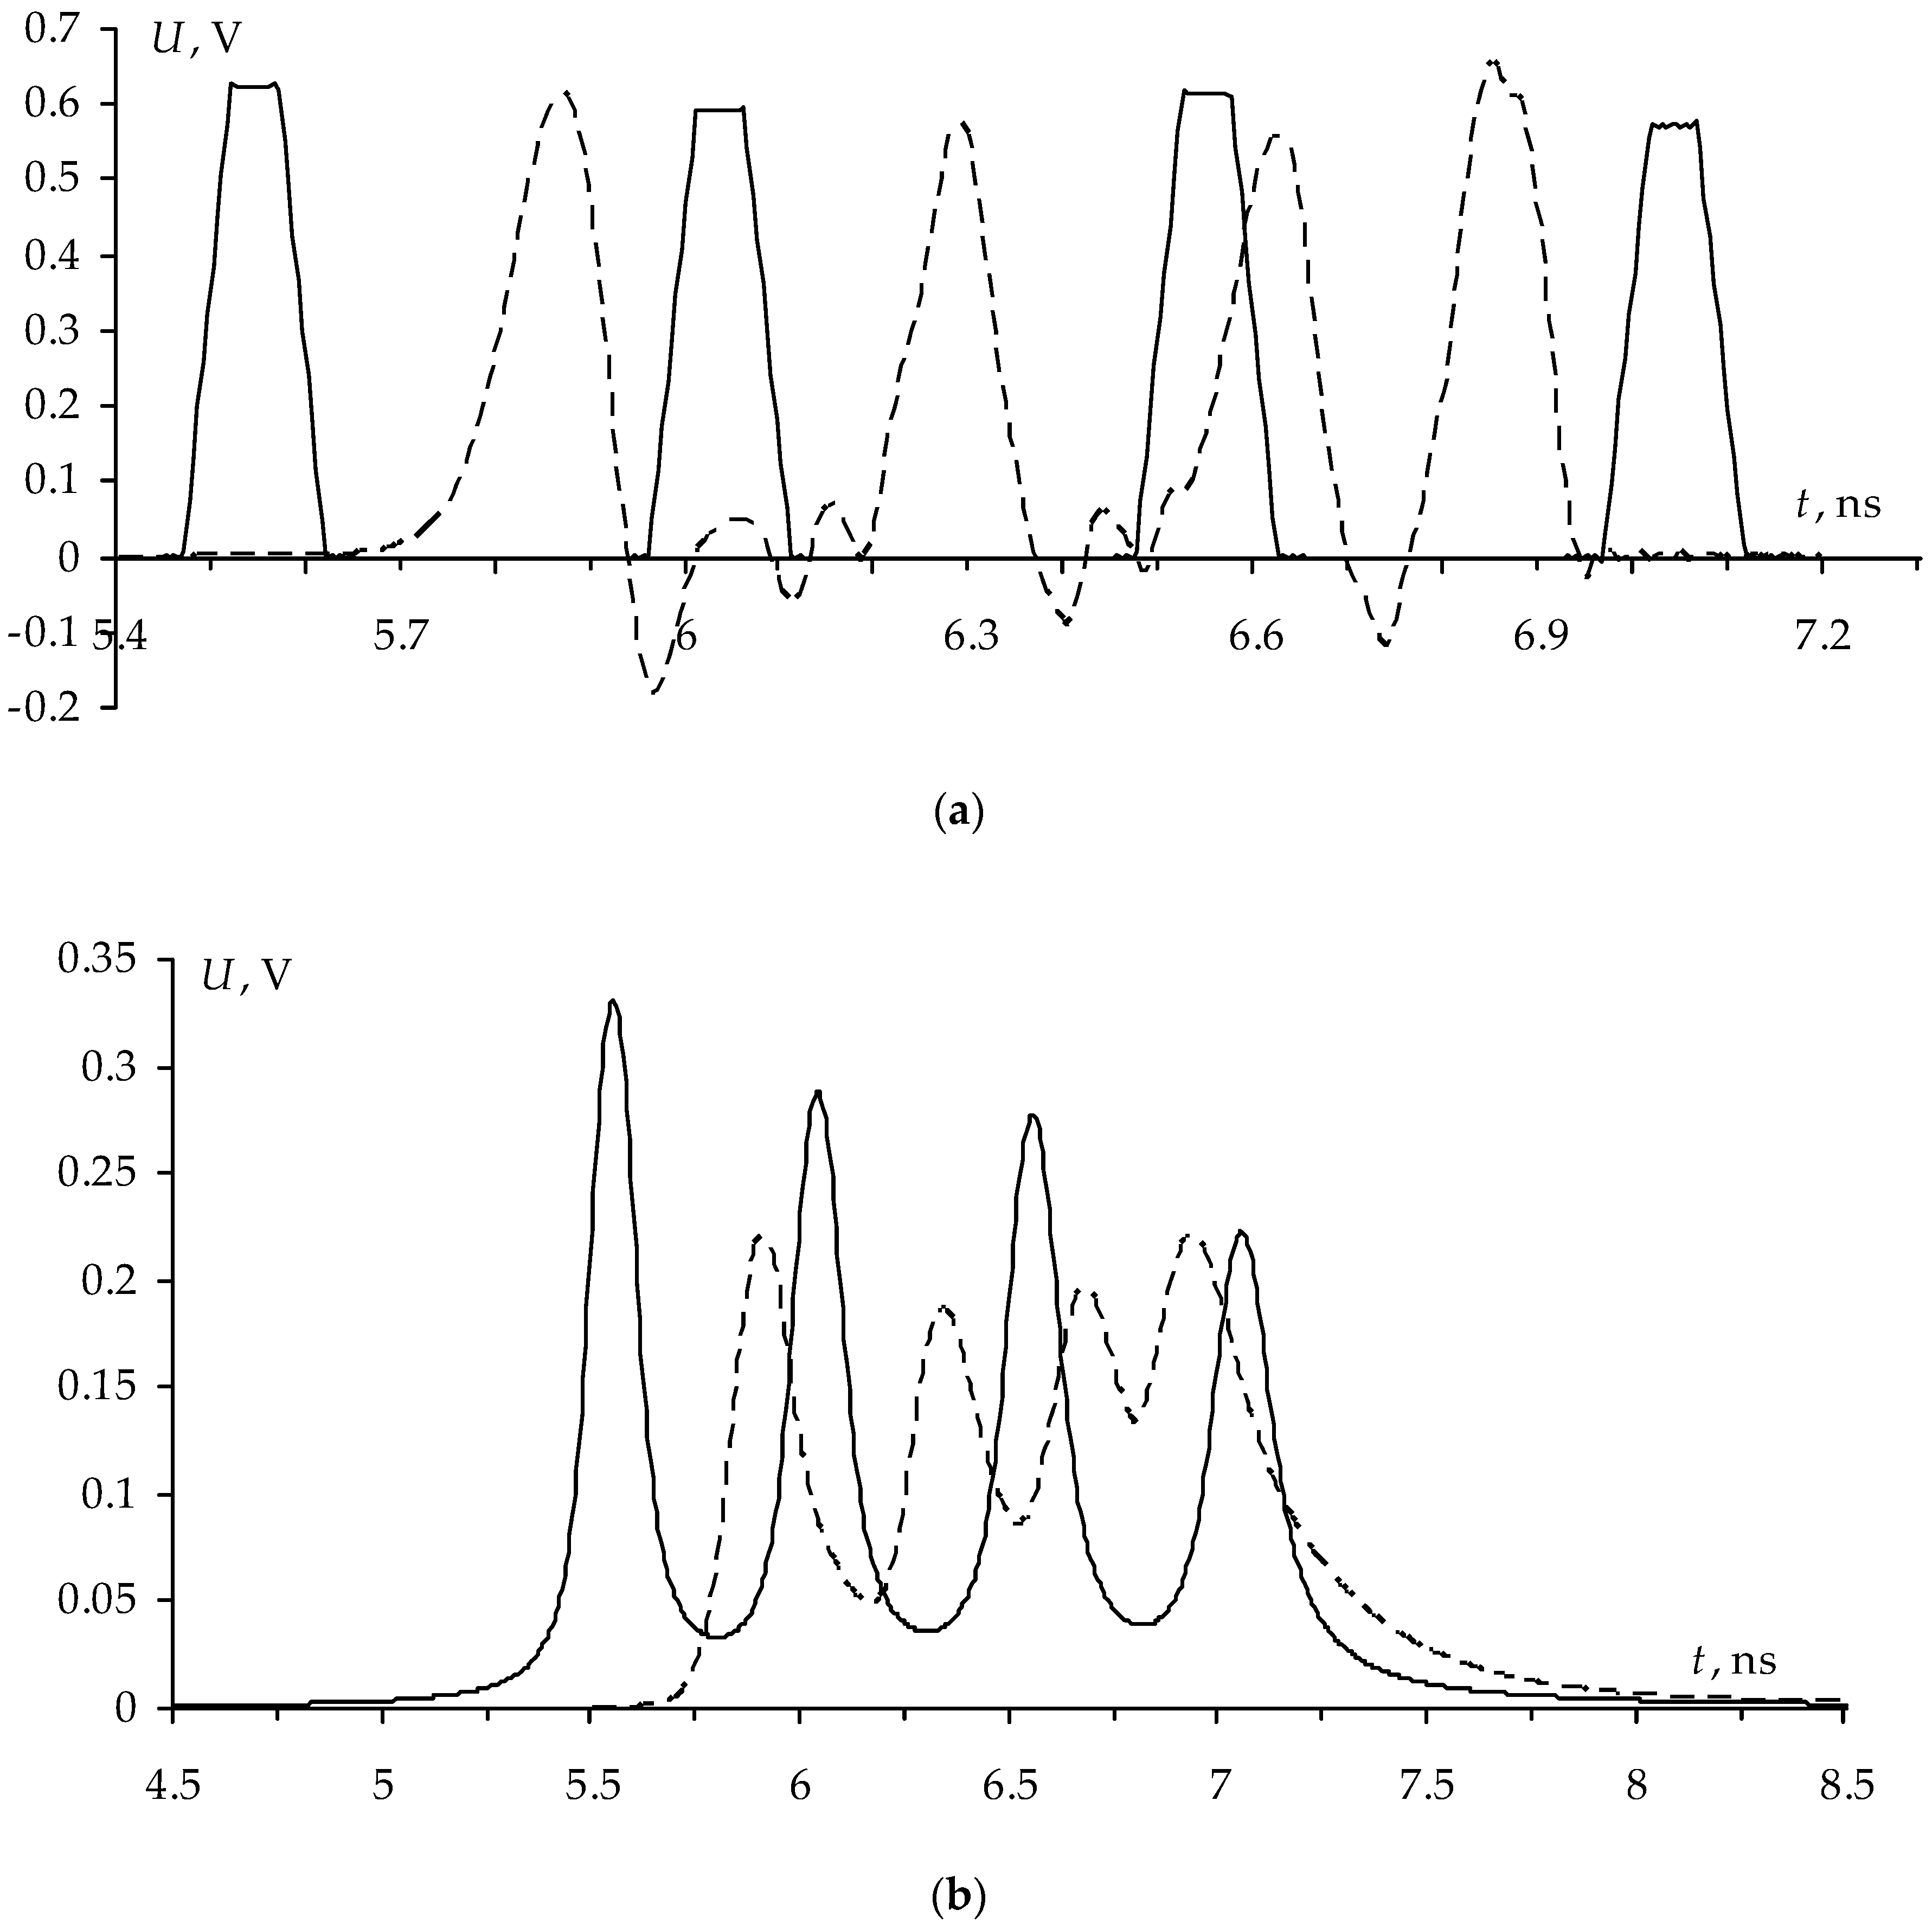
Optimization by two criteria performed separately allowed us to obtain positive results, but when one criterion is reached, the other deteriorates. Thus, when criterion 1 is fulfilled (Figure 9a), the first and second pulses become closer to each other, which can lead to their overlapping (for example, due to dispersion, when considering the losses or increasing the duration of the input pulse), however, the equal amplitudes of pulses 1 and 3, as well as 2 and 4 are obtained. When criterion 2 is fulfilled (Figure 9b), an increase in the maximum voltage at the end of the active conductor from 0.627 V to 0.63 V is observed, which somewhat reduces the attenuation coefficient of the MF, however, equalized values of the delay differences of decomposition pulses are achieved. Meanwhile, with such optimization, attention was not paid to the matching of the path, although it is important for minimizing reflections of useful high-frequency signals from the MF input. Thus, it is advisable to perform multicriteria optimization to further improve the characteristics of the reflection symmetric MF simultaneously using three criteria: minimizing the maximum voltage (max(U)) at the MF output, equalizing the time intervals between decomposition pulses (Δti), and ensuring matching with the path of 50 Ω. To achieve matching, we used the condition that the signal amplitude at the beginning of the line (V2) should be equal to half the EMF of the signal source (V1) (Figure 7a) [34]. The optimization by three criteria was performed for four reflection symmetric MF structures (Figure 6) by heuristic search in the range of parameters.
The parameters s and w were optimized in the range of 200–2000 μm. The values of the parameters t and h did not change during optimization. The waveforms at the output of four reflection symmetric MF structures are presented in Figure 10, while optimization results are summarized in Table 7.
As can be seen from Table 7, the best optimization results are obtained in structure 1, since it simultaneously provides all 3 criteria: equalized time intervals between decomposition pulses and the lowest possible voltage level at the end of the active conductor along with the matching of the MF. Thus, this structure of the reflection symmetric MF can decompose the USP having the duration of up to 150 ps with an attenuation coefficient of 4 times. On this basis, structure 1 has been selected for further research.
3.2. Analytical Expressions for Calculating Modal Per-Unit-Length Time Delays of a Reflection Symmetric Modal Filter
In this section, we consider the calculation of modal per-unit-length time delays (τi) of the reflection symmetric MF using analytical expressions. Analytical expressions for calculating τi for a four-conductor transmission line are presented in [16]:
where aij, i, j = 1, 2, 3, 4 are the elements of matrix A, which is the product of matrices C and L.
The expressions (5–6) were used to calculate the τi values for structure 1 of the reflection symmetric MF (Figure 6a) with the parameters obtained after multicriteria optimization. The results of calculating τi using the TALGAT software and analytical expressions are compared in Table 8.
As can be seen from Table 8, the values of τi, obtained using the TALGAT software and analytical expressions completely coincide. This is due to the fact that in the TALGAT software, the calculation of τi is performed through the eigenvalues of the product of L and C matrices using the mathematical library (Eigen). Yet with small orders of the matrix (4 × 4 in this case), because of the replacement of numerical methods with analytical expressions, the same operations are actually used with the same numbers. Therefore, the values of τi, obtained using the TALGAT system may coincide with the results of analytical expressions.
Note that as the structure is symmetric (Figure 6a) with respect to the vertical and horizontal axes, the diagonal elements of matrix A are the same a11 = a22 = a33 = a44 and there is a pairwise equality of elements outside the main diagonal (a12 = a34 and a13= a24). Finally, matrix A turns out to be symmetric, since it is a product of symmetric and commutative matrices L and C:
In addition, by simplifying expressions (5, 6), it is possible to obtain analytical expressions in a short form for the reflection symmetric MF:
Thus, the values of τi have been calculated using analytical expressions. The obtained analytical expressions can be used not only to calculate the per-unit-length time delays matrices, but also as part of more complex analytical expressions to calculate the time response, which can significantly speed up the optimization process.
3.3. Computational Experiment for a Reflection Symmetric MF
Note that in the previous sections, a quasistatic approach was used in the simulation. However, it is advisable to check its reliability with regard to the possibility of USP decomposition in the reflection symmetric MF. Therefore, it is important to perform a computational experiment, namely, to simulate a time response under the excitation of the USP, and then compare the results with the results of the quasi-static simulation with the same cross-section parameters. Within the framework of this task, the simulation will be carried out both with and without considering the losses for two approaches: quasi-static and electrodynamic. In the electrodynamic simulation without considering the losses, the perfect electric conductor (PEC) was used with the dielectric material having the parameters εr1 = 4.5 and tgδ = 0. When considering the losses, the conductor material is copper (relative magnetic permeability μr = 1, electrical conductivity σ = 5.8 × 10⁷ S/m), and the parameters of the dielectric material are εr1 = 4.5 and tgδ = 0.017.
For the experiment, we selected structure 1 (Figure 6a) with the optimal parameters obtained by multicriteria optimization: w = 1600 μm, s = 510 μm, t = 18 μm, h = 500 μm, εr = 4.5 with l = 1 m and R = 50 Ω.
The voltage waveforms at the reflection symmetric MF output with quasi-static and electrodynamic approaches without losses are presented in Figure 11a, and with losses in Figure 11b.
Table 9 summarizes the amplitudes of the decomposition pulses, as well as the time delays of each pulse in both quasi-static and electrodynamic approaches without considering the losses.
As can be seen from Table 9, the maximum deviation in the pulse voltages is 4.9%, and in the time delays it is 2.5%, which can be considered acceptable. The difference in the shape of decomposition pulses and the difference in time delays obtained by quasi-static and electrodynamic approaches are explained, first of all, by different ways to consider the frequency dependence of εr, as well as by a possible influence of radiation losses which are considered only in the electrodynamic approach.
A similar simulation was performed considering the losses in conductors and dielectrics (Figure 11b). The consistency of results is also acceptable. Meanwhile, with the quasistatic analysis, non-causality in the form of a premature arrival of a pulsed signal is observed. For example, when simulating without considering the losses, the first pulse comes to the output in 5.75 ns, whereas with considering the losses, the time of the pulse arrival shifts to 5 ns. This is explained by neglecting the frequency dependence of εr and tgδ in the quasistatic analysis.
Table 10 summarizes the amplitudes of the decomposition pulses in both quasistatic and electrodynamic analyses considering the losses.
The loss consideration showed a significant (by half) decrease in the pulse amplitudes. However, the difference in considering the frequency dependence of losses in quasi-static and electrodynamic analyses led to an increase in the deviation of up to 20%. Therefore, the evaluation of the pulse delays was not performed.
Thus, the simulation results obtained using the quasi-static analysis are generally confirmed by the electrodynamic analysis. This fact is important since it allows us to assume that the implementation of the layout of the reflection symmetric MF printed-circuit board (PCB) and its measurement will show similar results. An important conclusion is also the need for a more accurate calculation of the frequency dependence of material parameters.
3.4. Frequency Characteristics of a Reflection Symmetric Modal Filter
In this section, the effect of the reflection symmetric MF on a useful signal is estimated by determining the MF bandwidth, which can be done through frequency analysis. To characterize a filter in a frequency domain, S-parameters, particularly |S21| representing a transmission coefficient, are used. To calculate |S21|, we perform the simulation using the quasi-static approach, and confirm the reliability of the results by the electrodynamic approach.
Figure 12 shows the simulation results for|S21| with and without taking into account the losses.
Table 11 presents bandwidths by the level of −3 dB (Δf) and the values of the first three resonant frequencies (f1, f2, f3), and their deviations obtained using both quasi-static and electrodynamic approaches.
As can be seen from simulation results, the MF bandwidth is 0.216 GHz with the quasi-static approach and 0.185 GHz with the electrodynamic approach, however, with the simulation considering the losses, the bandwidth decreases slightly to 0.171 GHz and 0.164 GHz, respectively. The deviation for Δf is 7.7% without and 2.1% with considering the losses. For f1, the consistency of the results of the quasi-static and electrodynamic approaches is visible, where the deviation is 6.2% without and 6.1% with considering the losses. As can be seen from Table 11, the frequency of the second and third resonances in the electrodynamic approach is shifted by 0.5 GHz in relation to the frequencies obtained in the simulation by the quasi-static approach. This is explained by the difference in simulating a dielectric, losses and frequency dependence, as well as by the presence of radiation losses during the electrodynamic approach. In general, we can consider the results obtained with the use of different approaches to be reasonably consistent.
3.5. Development of a Reflection Symmetric MF Printed-Circuit Board
This section presents the results of simulating and developing the reflection symmetric MF PCB. The PCB parameters were chosen in compliance with the technological characteristics: the minimum values of s and w (in this case, the gap between conductors) of 200 μm for t = 18 μm; and 250 μm for t = 35 μm; h values are 500, 1000, 1500 and 2000 μm. We also consider the fact that the software used for the PCB development has a minimum grid spacing of 25 μm. Therefore, all parameters were taken as multiples of this number. To design the PCB, as a basis, we took the parameters obtained previously by multicriteria optimization and it was assumed that s = 500 μm and w = 1600 μm. Meanwhile, the minimum distance from the edge of the PCB to the conductors (d) necessary to ensure the proper-quality mounting of components is set to 0.3 mm. We accepted d = 2w. The final values of the parameters are presented in Table 12. They will allow providing the minimum possible voltage level at the MF output, as well as equalized time intervals between decomposition pulses with a matching of the path of 50 Ω.
When designing the PCB, the following features were taken into account: the reference conductor is located in the dielectric between the upper and lower layers; the length of the MF is 1 m, and the PCB size is 27 × 30 cm, so the line is made in the form of a meander; to reduce the influence of turns on each other, the separations between them were chosen to be 5w.
A connection pad (CP) of 0.85 × 2.8 mm was used to mount the matching resistors and Subminiature version A (SMA) connectors. In the CP, to ensure connection with the reference conductor, there are three vias with a diameter of 0.2 mm (Figure 13). The vias are taken out to the upper and lower layers of the PCB on the CP.
To provide matching, the resistors of type 0603 with a resistance of 50 Ω (Figure 14) are used; their dimensions are presented in Table 13. To enable the subsequent mounting of resistors, a CP with the size of 1.7 × 0.925 mm is installed at each end of the passive lines, with the distance between the reference CP and the CP for the resistor being 1 mm.
To connect the PCB with the measurement path, we need to install an SMA connector (Figure 15). For its installation, a CP of 0.85 × 0.925 mm is installed at the end of the active line. The distance between the reference CP and the CP for the SMA connector is 4 mm.
Thus, the prototype of the PCB with the reflection symmetric MF with l = 1 m was developed (Figure 16). In the future, it is planned to manufacture it and to verify the reliability of the obtained results by conducting a full-scale experiment. Meanwhile, the implementation of this design is possible, but very difficult, because it does not follow the standard technological process of manufacturing multilayer PCBs (three-layer PCB). However, the development of the configuration of a reflection symmetric MF with multiple numbers of layers is highly relevant and will be carried out in the future.
3.6. Analysis of the Waterproof Coating Influence on the Characteristics of a Reflection Symmetric Modal Filter
This section discusses the assessment of how the waterproof coating influences the characteristics of a reflection symmetric MF. Traditionally, PCB waterproofing is provided by using vanishes based on urethane, acrylic and epoxy resins, which also perform the important function of protecting the PCB surface from contamination and accidental short-circuiting of conductors. The application of the waterproof coating ensures reliable operation of products in different environmental conditions [35].
To analyze the effect of a waterproof coating on the parameters of a reflection symmetric MF, we chose EP-730 lacquer (code GOST 0824-81), which is applied on the board in three layers and represents an epoxy resin solution mixed with organic solvents with the addition of a hardening agent. In accordance with GOST 20824-81, the thickness of the dried monolayer film is 18–22 μm, with a value of the tangent of the dielectric loss angle tgδ = 0.03 and a relative dielectric constant ɛro = 3.5 at the frequency of 1 MHz.
The simulation of the reflection symmetric MF coated with one, two and three lacquer layers with thicknesses (ho) of 20, 40 and 60 μm, respectively, was performed in the TALGAT system [22]. The cross-section of the investigated MF covered with one layer of lacquer (ho = 20 μm) is shown in Figure 17. It should be noted that layers two and three evenly and completely cover the MF.
The MF simulation was carried out with the cross-section parameters obtained after multicriteria optimization of structure 1. The losses in the conductors and dielectrics were not considered. The excitation EMF waveform is shown in Figure 7a, and the schematic diagram is shown in Figure 7b.
The simulation results (values of the maximum voltage at the end of the active conductor Umax and differences of decomposition pulse delays Δti) of the reflection symmetric MF covered with one, two and three lacquer layers, as well as without coating, are summarized in Table 14. The waveforms at the MF output are shown in Figure 18.
Table 14 shows that with the growth of the ho parameter, the Umax value remains unchanged when the coating thickness changes and does not exceed 0.629 V, which is 7.94 times less than the EMF, while the MF with optimal parameters without a covering layer decomposes the USP into pulses eight times lower than the EMF. As ho increases, Δti changes non-linearly, but as can be seen from Table 14, Δti values are approximately equalized. This fact is confirmed by the MF output waveforms with approximately equal time intervals between the decomposition pulses obtained with increasing ho.
Thus, the analysis of the reflection symmetric MF covered with one, two and three layers of lacquer was performed. It was found that the increase in the thickness of the lacquer layer slightly affects the output characteristics of the signal. However, it was revealed that the influence of lacquer thickness on the minimum difference in pulse delays has a non-linear nature, which requires additional research.
3.7. Features of Reflection Symmetric Structures
The final section presents some specific structural features of protective devices based on reflection symmetry. Taking into consideration all the obtained results, their analysis and evaluation, several features of reflection symmetric structures can be distinguished:
- In the reflection symmetric MF, the diagonal and reciprocal elements of matrices L and C are the same. Some of the reciprocal elements are the same, depending on their location relative to the ground. This feature can be used to calculate τi using analytical expressions in reduced form.
- The values of the modal voltage matrix of the reflection symmetric MF are equal in magnitude. It was revealed that changes in the structure parameters change the values of τi, but do not affect the elements of the modal voltage matrix Sv. For example, for the reflection symmetric MF with N = 2 (Figure 4), the eigenvector matrix of the product of matrices L and C is equal to
- Providing both the edge and broad-side couplings with certain parameters of the reflection symmetric MF simultaneously allows obtaining close values of the time intervals between decomposition pulses and the pairwise equality of decomposition pulses.
3.8. Comparative Analysis of the Microstrip and Reflection Symmetric Four-Conductor MFs
Reflection symmetry of an MF is proposed to improve the interference protection devices based on modal filtration technology. However, as noted earlier, there are other MF structures. Therefore, it would be useful to make a qualitative comparison of the reflection symmetric MF with another MF that is close in structure. For the comparative analysis, the four-conductor microstrip (Figure 19) and reflection symmetric MF structures were selected. These MFs have the same number of conductors but differ in their emplacement. Such a comparison will make it possible to determine the advantages and disadvantages of each device, and, in particular, to identify the pros and cons of using reflection symmetry.
The results of a qualitative comparison of the microstrip and reflection symmetric MFs for a number of attributes are presented in Table 15. The following are clarifications for each of the points.
- The microstrip and reflection symmetric MFs are able to reduce the amplitude of the input signal due to its modal decomposition into four pulses of smaller amplitude at the output.
- Due to the constructive arrangement of the conductors relative to the grounded conductor in the reflection symmetric MF, broad-side and edge couplings are simultaneously provided, which allows obtaining close values of the time intervals between decomposition pulses at the MF output without resorting to additional optimization.
- Equalized time intervals between decomposition pulses can be obtained for both structures by optimizing the parameters. However, due to the specificity of the reflection symmetric MF structure, the process of optimization by this criterion is easier.
- The microstrip MF has both a larger set of parameters for optimization and a range for their optimization since it is not limited to maintaining symmetry, unlike the reflection symmetric MF.
- To optimize the reflection symmetric MF, it is sufficient to use a heuristic search, whereas when optimizing the microstrip MF, it may be necessary to use other approaches (for example, genetic algorithms) [34].
- The microstrip MF has a wider bandwidth than the reflection symmetric MF [36].
- For s = 200, 500 and 800 μm, the reflection symmetric MF is able to decompose the input signal with a duration of up to 345, 540 and 465 ps, respectively, whereas with the microstrip MF this value is only up to 165, 150 and 135 ps.
- distinctive feature of the microstrip MF is the simplicity of manufacturing (a single-layer PCB) and low cost, whereas manufacturing the reflection symmetric MF is laborious and expensive.
Thus, a comparative analysis of two new devices for protection against a USP (microstrip and reflection symmetric four-conductor MFs) was performed. The comparison revealed a number of advantages and disadvantages of each device for a number of features. In addition, the results of a comparative analysis showed that the use of reflection symmetry leads to the improvement in the MF protective properties in view of the simplicity to achieve the required characteristics of the MF, but at the same time it also leads to an increase in the final cost of the MF if it is put into production. The comparison results showed the importance of such work since it can be used to further research and compare various configurations for protection devices in order to identify their strengths and weaknesses. Note that some of the features discussed in Table 15 are related to each other. For example, the greater the attenuation of a filter, the lower the bandwidth is. However, this relation was not considered here.
4. Conclusions
The paper presents for the first time the results of a comprehensive research of the characteristics of various reflection symmetric MF structures. Obviously, due to the constructive arrangement of the conductors, relative to the reference conductor, in the reflection symmetric MF both broad-side and edge couplings are simultaneously provided, which allows to obtain pairwise equalized voltages of decomposition pulses and close values of the time intervals between them. Due to the symmetry, this is achievable by means of conventional parametric optimization by heuristic search (manual search of parameters) without resorting to costly global optimization methods (for example, genetic algorithms). The results of optimization for four reflection symmetric MF structures are presented both separately by two criteria, and simultaneously by three criteria along with considering the matching criterion. Analytical expressions were obtained for calculating τi of reflection symmetric MFs, which can be used not only for calculating per-unit-length time delay matrices, but also as part of more complex analytical expressions for calculating the time response, which can significantly speed up the optimization. A computational experiment for the MF with optimal parameters with and without considering losses in conductors and dielectric in the time and frequency domains has been performed, which confirmed the reliability of the results obtained. This fact is important because it suggests that the implementation of the PCB layout of the reflection symmetric MF and its measurement will show similar results. A prototype of the reflection symmetric MF with a length of l = 1 m was developed. In the future, it is planned to produce a PCB prototype based on the MF design developed. An assessment of the effect of the waterproof coating on the MF characteristics was performed. It was found that increasing the thickness of the lacquer slightly affects the output characteristics of the signal. As a result of a comprehensive research of reflection symmetric structures of MFs, their features and properties have been revealed. A comparative analysis of two new USP protection devices (the microstrip and reflection symmetric four-conductor MFs) was performed, which revealed a number of advantages and disadvantages of each device in a number of characteristics, as well as strengths and weaknesses of structures with reflection symmetry to protect against a USP.
Thus, the researched configurations of reflection symmetric MFs can provide proper REE protection against a USP through its decomposition into a sequence of pulses four times smaller in amplitude with a controlled bandwidth of the useful signal. The results are important for further research and the possibility of creating various configurations of protection devices based on both reflection symmetry and completely new structures.
Author Contributions
Conceptualization, A.Z.; investigation, E.C. and A.B.; writing—original draft preparation, E.C.; writing—review and editing, A.B. and T.G.; supervision, T.G and A.Z.
Funding
This research was funded by the Ministry of Science and Higher Education of the Russian Federation grant number 8.9562.2017/8.9 and the Russian Federation President grants MD-2652.2019.9 and MD-365.2018.8.
Acknowledgments
Authors thank reviewers for valuable comments having permitted to improve considerably the paper.
Conflicts of Interest
The authors declare no conflicts of interest.
References
- Loborev, V.M. The modern research problems. Plenary lecture. In Proceedings of the AMEREM Conference, Albuquerque, NM, USA, 27–31 May 1996; pp. 121–127. [Google Scholar]
- Gardner, R.L. Electromagnetic terrorism. A real danger. In Proceedings of the 14th International Wroclaw Symposium on EMC, Wroclaw, Poland, 23–25 June 1998; pp. 10–14. [Google Scholar]
- Radasky, W.A.; Baum, C.E.; Wik, M.W. Introduction to the special issue on high-power electromagnetics (HPEM) and intentional electromagnetic interference (IEMI). IEEE Trans. Electromagn. Compat. 2004, 46, 314–321. [Google Scholar] [CrossRef]
- Gizatullin, Z.M.; Gizatullin, R.M. Investigation of the immunity of computer equipment to the power-line electromagnetic interference. J. Commun. Technol. Electron. 2016, 61, 546–550. [Google Scholar] [CrossRef]
- Brauer, F.; Fahlbusch, S.; Ter Haseborg, J.L.; Potthast, S. Investigation of hardening measures for IT equipment against radiated and conducted IEMI. IEEE Trans. Electromagn. Compat. 2015, 54, 1055–1065. [Google Scholar] [CrossRef]
- Kreitlow, M.; Garbe, H.; Sabath, F. Influence of software effects on the susceptibility of Ethernet connections. In Proceedings of the IEEE International Symposium on Electromagnetic Compatibility, Raleigh, NC, USA, 4–8 August 2014; pp. 544–548. [Google Scholar] [CrossRef]
- Kreitlow, M.; Sabath, F.; Garbe, H. Analysis of IEMI effects on a computer network in a realistic environment. In Proceedings of the IEEE International Symposium on Electromagnetic Compatibility, Dresden, Germany, 16–22 August 2015; pp. 1063–1067. [Google Scholar] [CrossRef]
- Dawson, J.F. Intentional electromagnetic interference effects in cyber-physical systems. In Proceedings of the EMC UK 2015, Newbury, UK, 6–7 October 2015; pp. 1–5. [Google Scholar] [CrossRef]
- Mora, N.; Vega, F.; Lugrin, G.; Rachidi, F.; Rubinstein, M. Study and classification of potential IEMI sources. Syst. Assess. Notes 2014, 41, 92. [Google Scholar]
- Gizatullin, Z.M.; Gizatullin, R.M. Study of the electromagnetic compatibility of local area networks under the action of nanosecond electromagnetic disturbances. J. Commun. Technol. Electron. 2014, 59, 424–426. [Google Scholar] [CrossRef]
- Weber, T.; Krzikalla, R.; Ter Haseborg, J.L. Linear and non-linear filters suppressing UWB pulses. IEEE Trans. Electromagn. Compat. 2004, 46, 423–430. [Google Scholar] [CrossRef]
- Gazizov, A.T.; Zabolotsky, A.M.; Gazizov, T.R. UWB pulse decomposition in simple printed structures. IEEE Trans. Electromagn. Compat. 2016, 58, 1136–1142. [Google Scholar] [CrossRef]
- Gazizov, T.R.; Dolganov, E.S.; Zabolotsky, A.M. Modal filter as a device for electrostatic discharge protection of onboard computers and control units of space vehicles. Russ. Phys. J. 2012, 55, 282–287. [Google Scholar] [CrossRef]
- Samotin, I.E. Damping of pulse signals in modal filters with high face coupling. Dokl. Tom. gos. un-ta System upr. i Radioelectroniki 2010, 22, 169–171. (In Russian) [Google Scholar]
- Broyde, F.; Clavelier, E. A new method for the reduction of crosstalk and echo in multiconductor interconnections. IEEE Trans. Circuits Syst. 2005, 52, 405–416. [Google Scholar] [CrossRef]
- You, H.; Soma, M. Crosstalk analysis of interconnection lines and packages in high-speed integrated circuits. IEEE Trans. Electromagn. Compat. 1990, 37, 1019–1026. [Google Scholar] [CrossRef]
- Zabolotsky, A.M. Application of reflective symmetry for modal filtration improvement. Dokl. Tom. gos. un-ta System upr. i Radioelectroniki 2015, 36, 41–44. (In Russian) [Google Scholar]
- Zabolotsky, A.M.; Gazizov, T.R.; Kuksenko, S.P. Four-Way Mirror-Symmetrically Structure, Protecting from Ultrashort Impulses. Patent RF No. 2624465, 4 July 2017. [Google Scholar]
- Belousov, A.O.; Chernikova, E.B.; Khazhibekov, R.R.; Zabolotsky, A.M. Quasi-static and electrodynamic simulation of reflection symmetric modal filter time response on ultra-short pulse excitation. J. Phys. Conf. Ser. 2018, 1015, 1–5. [Google Scholar] [CrossRef]
- Chernikova, E.B.; Belousov, A.O.; Gazizov, T.R. Research of frequency characteristics of a reflection symmetric modal filter. In Proceedings of the IEEE Siberian Symposium on Data Science and Engineering, Novosibirsk, Russia, 30–31 October 2018; pp. 74–78. [Google Scholar]
- Chernikova, E.B.; Belousov, A.O.; Zabolotsky, A.M. Comparative analysis of microstrip and reflection symmetric four-conductor modal filters. In Proceedings of the International Siberian Conference on Control and Communications (SIBCON), Tomsk, Russia, 18–20 April 2019. [Google Scholar]
- Kuksenko, S.P.; Gazizov, T.R.; Zabolotsky, A.M.; Ahunov, R.R.; Surovtsev, R.S.; Salov, V.K.; Lezhnin, E.V. New developments for improved simulation of interconnects based on method of moments. Advances in Intelligent Systems Research. In Proceedings of the 2015 International Conference on Modeling, Simulation and Applied Mathematics, Phuket, Thailand, 23–24 August 2015; pp. 293–301. [Google Scholar] [CrossRef]
- Djordjevich, A.R.; Biljic, R.M.; Likar-Smiljanic, V.D.; Sarkar, T.K. Wideband frequency-domain characterization of FR-4 and time-domain causality. IEEE Trans. Electromagn. Compat. 2001, 43, 662–666. [Google Scholar] [CrossRef]
- Matthaei, G.L.; Chinn, G.C. Approximate calculation of the high-frequency resistance matrix for multiple coupled lines. In Proceedings of the 1992 IEEE MTT-S Microwave Symposium Digest, Albuquerque, NM, USA, 1–5 June 1992; pp. 1353–1354. [Google Scholar] [CrossRef]
- Salov, V.K.; Orlov, P.E.; Gazizov, T.R. Vazhnost korrektnogo uchyota chastotnoj zavisimosti dielektricheskoj pronicaemosti materialov pri modelirovanii zadach ems. J. High. Educ. Inst. Phys. 2012, 55, 106–108. (In Russian) [Google Scholar]
- Jackson, J.D. Classical Electrodynamics; John Wiley & Sons: New York, NY, USA, 1962; p. 641. [Google Scholar]
- Orlov, P.E.; Buichkin, E.N. Quasistatic and electromagnetic simulation of interconnects of printed circuit boards with modal reservation. In Proceedings of the 18th International Conference of Young Specialists on Micro/Nanotechnologies and Electron Devices, Erlagol (Altai Republic), Russia, 29 June–3 July 2017; pp. 54–58. [Google Scholar]
- Scheinfein, M.R.; Palusinski, O.A. Methods of calculation of electrical parameters for electronic packaging applications. Trans. SCS 1987, 4, 187–254. [Google Scholar]
- Olyslager, F.; Fache, N.; Zutter, D.D. New fast and accurate line parameter calculation of general multiconductor transmission lines in multilayered media. IEEE Trans. Microw. Theory Tech. 1991, 39, 901–909. [Google Scholar] [CrossRef]
- Tesche, F.M.; Ianoz, M.V.; Karlsson, T. EMC Analysis Methods and Computational Models; Wiley-Interscience: New York, NY, USA, 1992; p. 623. [Google Scholar]
- Gazizov, A.T.; Zabolotsky, A.M.; Gazizov, T.R. Measurement and simulation of time response of printed modal filters with broad-side coupling. J. Commun. Technol. Electron. 2018, 63, 270–276. [Google Scholar] [CrossRef]
- Orlov, P.E.; Gazizov, T.R.; Zabolotsky, A.M. Short pulse propagation along microstrip meander delay lines with design constraints: Comparative analysis of the quasi-static and electromagnetic approaches. Appl. Comput. Electromagn. Soc. J. 2016, 31, 238–243. (In Russian) [Google Scholar]
- Gazizov, T.R.; Dolganov, E.S.; Orlov, P.E. Quasistatic and electromagnetic simulation of modal phenomena in multiconductor structures. Infokommunikacionnye Tehnol. 2011, 9, 96–100. [Google Scholar]
- Belousov, A.O.; Gazizov, T.R. Systematic approach to optimization for protection against intentional ultrashort pulses based on multiconductor modal filters. Complexity 2018, 2018, 1–15. [Google Scholar] [CrossRef]
- Kirdyaev, M.M.; Kochegarov, I.I.; Trusov, V.A. Vlagozashchitnye pokrytiya pechatnyh plat. Mezhdunarodnyj Simpozium «Nadezhnost’ i Kachestvo» 2015, 2, 329–336. (In Russian) [Google Scholar]
- Belousov, A.O.; Gazizov, T.R. Frequency characteristics of multiconductor microstrip modal filters. In Proceedings of the 2017 Dynamics of Systems, Mechanisms and Machines (Dynamics), Omsk, Russia, 14–16 November 2017; pp. 1–4. [Google Scholar] [CrossRef]
Figure 1.
Photograph of a flexible printed cable (FPC).

Figure 2.
Cross-sections of (a) symmetric and (b) asymmetric structures. Conductors: P—passive, A—active, R—reference.
Figure 2.
Cross-sections of (a) symmetric and (b) asymmetric structures. Conductors: P—passive, A—active, R—reference.

Figure 3.
Cross-sections of structures with (a) strong (b) and weak couplings and (c) a connection diagram of coupled lines.
Figure 3.
Cross-sections of structures with (a) strong (b) and weak couplings and (c) a connection diagram of coupled lines.

Figure 4.
Cross-section of a two-conductor MF structure with reflection symmetry.

Figure 5.
Cross-section of the reflection symmetric structure.

Figure 6.
Cross-sections of reflection symmetric MF structures: (a) 1; (b) 2; (c) 3; (d) 4.

Figure 7.
(a) Schematic diagram for simulation; (b) the forms of the exciting EMF (––) and the voltage on the MF input (- -) when simulating the time response.
Figure 7.
(a) Schematic diagram for simulation; (b) the forms of the exciting EMF (––) and the voltage on the MF input (- -) when simulating the time response.

Figure 8.
Voltage waveforms at the near and far ends of the active conductor of the structure from Figure 3b obtained with rare (─) and fine (––) segmentations in CST MWS and in TALGAT (– –) [33].

Figure 9.
Waveforms at the output of the structures: 1 (––); 2 (– –); 3 (· ·) and 4 (–·–) after optimization by criteria (a) 1 and (b) 2.
Figure 9.
Waveforms at the output of the structures: 1 (––); 2 (– –); 3 (· ·) and 4 (–·–) after optimization by criteria (a) 1 and (b) 2.

Figure 10.
Voltage waveforms at the output of the structures 1 (––), 2 (– –), 3 (· ·) and 4 (–·–) after multicriteria optimization.
Figure 10.
Voltage waveforms at the output of the structures 1 (––), 2 (– –), 3 (· ·) and 4 (–·–) after multicriteria optimization.

Figure 11.
The voltage waveforms at the reflection symmetric MF output with quasi-static (––) and electrodynamic (– –) approaches (a) without and (b) with considering the losses.
Figure 11.
The voltage waveforms at the reflection symmetric MF output with quasi-static (––) and electrodynamic (– –) approaches (a) without and (b) with considering the losses.

Figure 12.
Frequency dependences of |S21| for the reflection symmetric MF calculated by quasi-static (––) and electrodynamic (– –) approaches (a) without and (b) with taking into account the losses.
Figure 12.
Frequency dependences of |S21| for the reflection symmetric MF calculated by quasi-static (––) and electrodynamic (– –) approaches (a) without and (b) with taking into account the losses.

Figure 13.
CP which provides connection to the reference conductor.

Figure 14.
Type 0603 resistor.

Figure 15.
SMA connector.

Figure 16.
Top layer layout of the reflection symmetric MF.

Figure 17.
The cross-section of the reflection symmetric MF covered with a single layer of lacquer.

Figure 18.
Waveforms at the reflection symmetric MF output for ho = 0 (––), 20 (––), 40 (- -), 60 (– –) μm.
Figure 18.
Waveforms at the reflection symmetric MF output for ho = 0 (––), 20 (––), 40 (- -), 60 (– –) μm.

Figure 19.
Cross-section of the four-conductor microstrip MF.


Table 1.
A qualitative comparison of modal filters (MFs) against traditional and dedicated protection devices.
Table 1.
A qualitative comparison of modal filters (MFs) against traditional and dedicated protection devices.
| Parameter | Network Filter | USP Filter Suppression Filter-6.3A («EMSOTECH» Company) | MF |
|---|---|---|---|
| Protection against ultrashort pulse (USP) | Does not protect | Protects | Protects |
| Weight | Small | Large | Small |
| Dimensions | Network filter size | 40 × 30 × 5 cm | Inside a power outlet or a network filter |
| Radiation resistance | Low | High | High |
| Service life | Low | Low | High |
| Cost ($) | 8–40 | 29,000 | ≈5 |
Table 2.
The results of measurements and simulations obtained with Green’s function method (GFM), method of moments (MoM), variational method (VM) and TALGAT (pF/cm).
Table 2.
The results of measurements and simulations obtained with Green’s function method (GFM), method of moments (MoM), variational method (VM) and TALGAT (pF/cm).
 | |||
|---|---|---|---|
| Size (mills) for h1 = 10, h2 = 20, t = 0.5 | Results | C11 | −C12 |
| w = 40, s = 10 | GFM | 5.61 | 0.77 |
| MoM | 5.62 | 0.76 | |
| VM | 5.64 | 0.68 | |
| TALGAT | 5.52 | 0.69 | |
| Max. error, % | −2.1 | −10.4 | |
| Measurements | 5.59 ± 0.06 | 0.62 ± 0.15 | |
| w = 20, s = 10 | GFM | 3.78 | 0.70 |
| MoM | 3.78 | 0.70 | |
| VM | 3.78 | 0.63 | |
| TALGAT | 3.66 | 0.62 | |
| Max. error, % | −3.2 | −11.4 | |
| Measurements | 3.69 ± 0.04 | 0.38 ± 0.10 | |
| w = 10, s = 20 | GFM | 2.66 | 0.29 |
| MoM | 2.65 | 0.30 | |
| VM | 2.67 | 0.24 | |
| TALGAT | 2.57 | 0.28 | |
| Max. error, % | −3.7 | −16.7 | |
| Measurements | 2.64 ± 0.03 | 0.20 ± 0.05 | |
| w = 10, s = 5 | GFM | 2.77 | 0.59 |
| MoM | 2.76 | 0.60 | |
| VM | 2.77 | 0.53 | |
| TALGAT | 2.65 | 0.50 | |
| Max. error, % | −4.3 | −16.7 | |
| Measurements | 2.75 ± 0.30 | 0.48 ± 0.12 | |
| w = 40, s = 10 | GFM | 3.00 | 0.97 |
| MoM | 2.99 | 0.97 | |
| VM | 2.96 | 0.94 | |
| TALGAT | 2.81 | 0.83 | |
| Max. error, % | −6.3 | −14.4 | |
| Measurements | 2.95 ± 0.03 | 0.92 ± 0.23 | |
Table 3.
Matrix C (pF/m) of a four-conductor structure of a complex shape.
 | ||||||
|---|---|---|---|---|---|---|
| Source, Number of Segments Per Conductor | C11 | C22 | C33 = C44 | C23 = C24 | C34 | C12 = C13 = C14 |
| TALGAT, 20 | 132.89 | 110.63 | 129.98 | −28.32 | −23.23 | −44.30 |
| TALGAT, 40 | 135.17 | 122.95 | 142.60 | −34.10 | −28.94 | −45.06 |
| TALGAT, 80 | 135.79 | 127.50 | 147.23 | −36.26 | −31.08 | −45.26 |
| TALGAT, 160 | 135.94 | 128.52 | 148.28 | −36.75 | −31.57 | −45.31 |
| TALGAT, 500 | 135.99 | 128.84 | 148.60 | −36.90 | −31.71 | −45.33 |
| [29] | 136.0 | 128.87 | 148.64 | −36.92 | −31.73 | −45.33 |
Table 4.
Matrix C (pF/m) of the structure of the conductors in isolation with one of them being the reference.
Table 4.
Matrix C (pF/m) of the structure of the conductors in isolation with one of them being the reference.
 | ||||||||
|---|---|---|---|---|---|---|---|---|
| Data | C11 = C33 | C12 = C23 | C13 | C14 | C22 | C24 | C34 | C44 |
| [30] | 38.152 | −15.974 | −2.2829 | −2.0343 | 38.401 | −3.2263 | −17.861 | 26.017 |
| TALGAT | 37.916 | −15.850 | −2.2891 | −2.0411 | 38.165 | −3.2327 | −17.735 | 25.909 |
| ±Δ% | 0.31 | 0.39 | 0.14 | 0.17 | 0.44 | 0.1 | 0.35 | 0.21 |
Table 5.
Optimization results for criterion 1.
| Structure | Parameter Values | Pulse Amplitude Values Ui, V | |||
|---|---|---|---|---|---|
| w, μm | s, μm | t2 − t1 | t3 − t2 | t4 − t3 | |
| 1 | 1600 | 500 | 0.4852 | 0.5191 | 0.4971 |
| 2 | 1600 | 550 | 0.4996 | 0.4738 | 0.4573 |
| 3 | 1600 | 575 | 0.4794 | 0.4607 | 0.4873 |
| 4 | 1600 | 520 | 0.5226 | 0.5188 | 0.4507 |
Table 6.
Optimization results for criterion 2.
| Structure | Parameter Values | Pulse Amplitude Values Δti, ns | |||
|---|---|---|---|---|---|
| w, μm | s, μm | t2 − t1 | t3 − t2 | t4 − t3 | |
| 1 | 1600 | 500 | 0.4852 | 0.5191 | 0.4971 |
| 2 | 1600 | 550 | 0.4996 | 0.4738 | 0.4573 |
| 3 | 1600 | 575 | 0.4794 | 0.4607 | 0.4873 |
| 4 | 1600 | 520 | 0.5226 | 0.5188 | 0.4507 |
Table 7.
Multicriteria optimization results.
| Structure | w, μm | s, μm | max(U), V | Δti, ns |
|---|---|---|---|---|
| 1 | 1600 | 510 | 0.625 | 0.49; 0.49; 0.49 |
| 2 | 1600 | 488 | 0.625 | 0.47; 0.49; 0.47 |
| 3 | 1600 | 567 | 0.625 | 0.48; 0.46; 0.47 |
| 4 | 1600 | 580 | 0.625 | 0.43; 0.49; 0.54 |
Table 8.
Comparison of τi calculation results, ns/m.
| Mode Number | TALGAT | Analytic Expressions |
|---|---|---|
| 1 | 5.46988 | 5.46988 |
| 2 | 5.95914 | 5.95914 |
| 3 | 6.47467 | 6.47467 |
| 4 | 6.96879 | 6.96879 |
Table 9.
Comparison of voltages (U) and time delays (t) of four output pulses for various types of approaches without considering the losses.
Table 9.
Comparison of voltages (U) and time delays (t) of four output pulses for various types of approaches without considering the losses.
| Parameters | Electrodynamic | Quasi-Static | Deviation, % |
|---|---|---|---|
| U1, V | 0.63 | 0.62 | 0.8 |
| U2, V | 0.60 | 0.58 | 1.7 |
| U3, V | 0.62 | 0.56 | 5 |
| U4, V | 0.58 | 0.64 | 4.9 |
| t1, ns | 5.75 | 5.47 | 2.5 |
| t2, ns | 6.22 | 5.97 | 2 |
| t3, ns | 6.55 | 6.58 | 0.2 |
| t4, ns | 6.84 | 6.97 | 0.9 |
Table 10.
Comparison of voltages (U) of four output pulses for various types of approaches considering the losses.
Table 10.
Comparison of voltages (U) of four output pulses for various types of approaches considering the losses.
| Parameters | Electrodynamic | Quasi-Static | Deviation, % |
|---|---|---|---|
| U1, V | 0.22 | 0.33 | 20 |
| U2, V | 0.19 | 0.29 | 20.8 |
| U3, V | 0.2 | 0.28 | 16.7 |
| U4, V | 0.22 | 0.22 | 0 |
Table 11.
Bandwidths and resonant frequencies of the reflection symmetric MF for two approaches and their deviations.
Table 11.
Bandwidths and resonant frequencies of the reflection symmetric MF for two approaches and their deviations.
| f, GHz | Quasistatic | Electrodynamic | Deviation, % | |||
|---|---|---|---|---|---|---|
| Lossless | Lossy | Lossless | Lossy | Lossless | Lossy | |
| Δf | 0.216 | 0.171 | 0.185 | 0.164 | 7.7 | 2.1 |
| f1 | 0.5 | 0.49 | 0.567 | 0.563 | 6.2 | 6.1 |
| f2 | 1.01 | 1 | 1.519 | 1.683 | 20 | 25.4 |
| f3 | 1.5 | 1.47 | 2.11 | 2.08 | 16.8 | 17.1 |
Table 12.
Parameters of the reflection symmetric MF printed-circuit board (PCB).
| h, μm | t, μm | w, μm | s, μm | d, μm | εr1 | εr2 | tgδ |
|---|---|---|---|---|---|---|---|
| 500 | 18 | 1600 | 500 | 3200 | 1 | 4.5 | 0.017 |
Table 13.
Dimensions of type 0603 resistor.
| EIA Standard Size | Standard Size Metric | L (mm) | W (mm) | H (mm) | D (mm) | T (mm) |
|---|---|---|---|---|---|---|
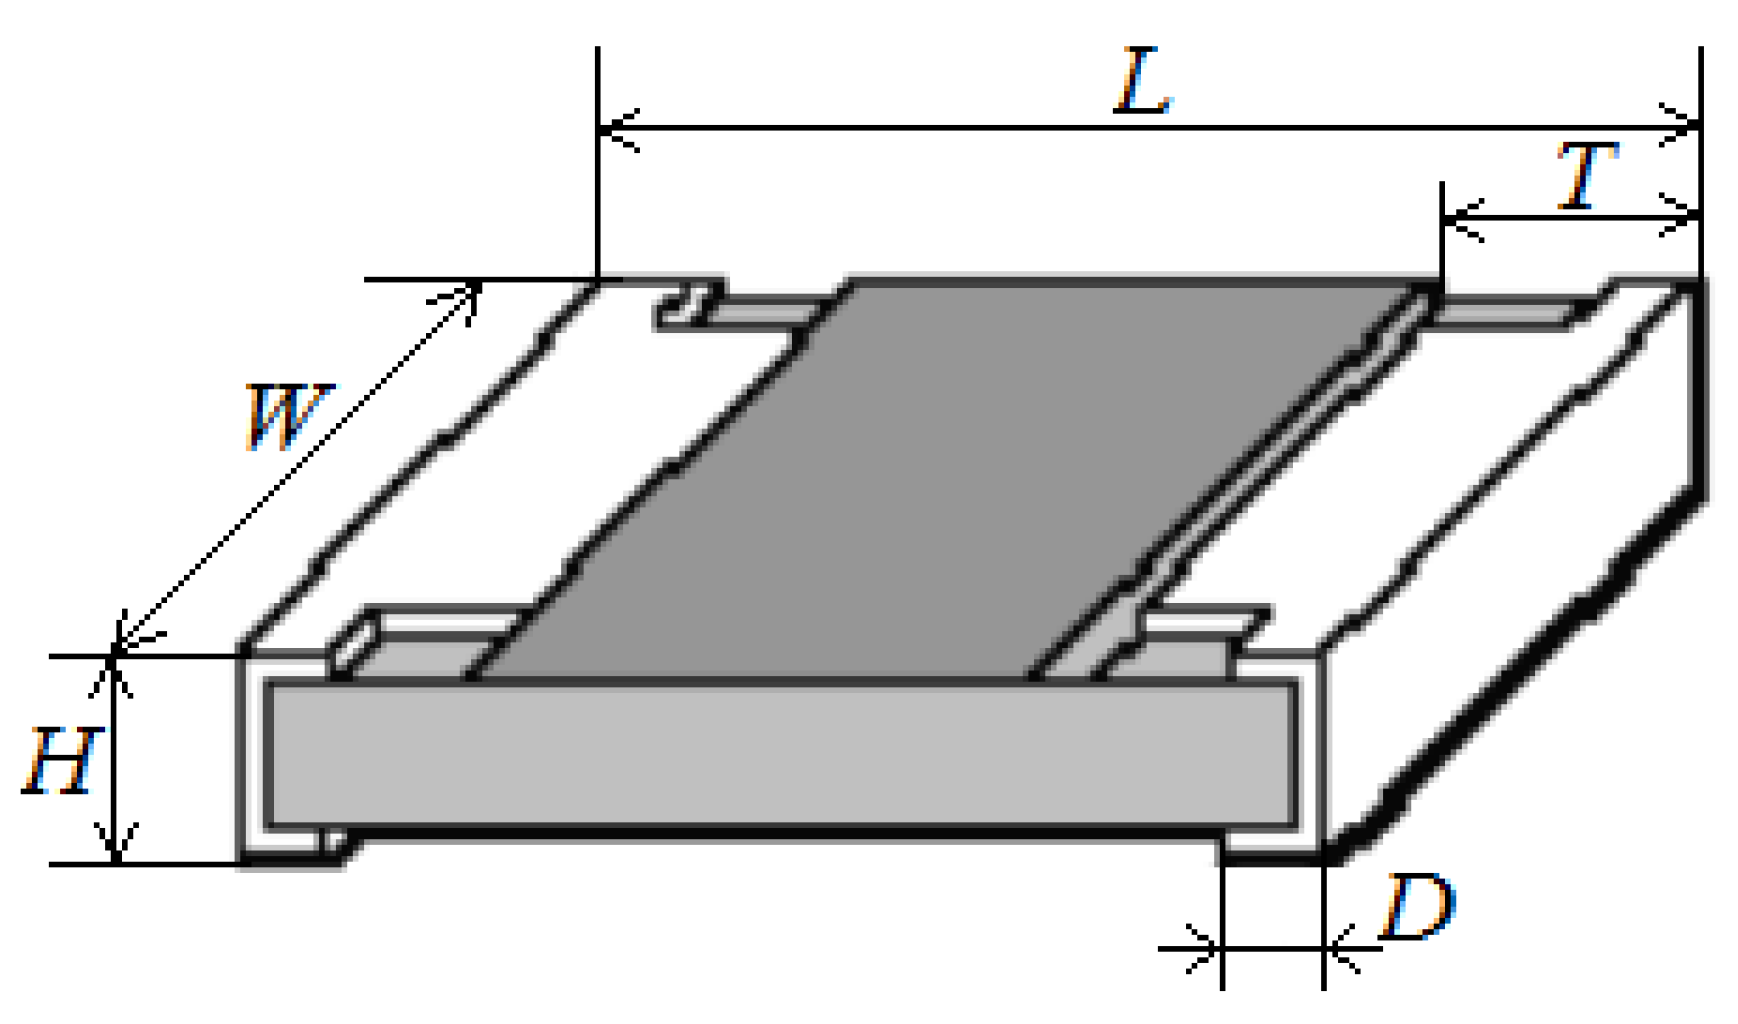
| 0603 | 1608 | 1.6 ± 0.1 | 0.85 ± 0.1 | 0.45 ± 0.05 | 0.3 ± 0.2 | 0.3 ± 0.2 |
Table 14.
Characteristics of the reflection symmetric MF with waterproof coating.
| ho, μm | Umax, V | Δt1, ns | Δt2, ns | Δt3, ns |
|---|---|---|---|---|
| 0 | 0.625 | 0.489 | 0.515 | 0.494 |
| 20 | 0.629 | 0.525 | 0.481 | 0.471 |
| 40 | 0.629 | 0.515 | 0.433 | 0.448 |
| 60 | 0.629 | 0.547 | 0.452 | 0.468 |
Table 15.
Comparison of the four-conductor microstrip (MS) and reflection symmetric (RS) MFs. Notations: (+) suitable; (0) medium suitable; (–) not suitable.
Table 15.
Comparison of the four-conductor microstrip (MS) and reflection symmetric (RS) MFs. Notations: (+) suitable; (0) medium suitable; (–) not suitable.
| № | Attribute | MS | RS |
|---|---|---|---|
| 1 | Attenuation of the input signal by decomposing it intoa sequence of pulses of smaller amplitude | + | + |
| 2 | Presence of both broad-side and edge couplings | 0 | + |
| 3 | Ability to align the time intervals between the decomposition pulses | 0 | + |
| 4 | Possibility to increase the structure and the range of values of optimized parameters | + | 0 |
| 5 | Absence of necessity to use additional optimization | 0 | + |
| 6 | High bandwidth | + | 0 |
| 7 | Possibility to increase the duration of the input pulse | 0 | + |
| 8 | Simplicity of implementation | + | 0 |
© 2019 by the authors. Licensee MDPI, Basel, Switzerland. This article is an open access article distributed under the terms and conditions of the Creative Commons Attribution (CC BY) license (http://creativecommons.org/licenses/by/4.0/).
Share and Cite
MDPI and ACS Style
Chernikova, E.B.; Belousov, A.O.; Gazizov, T.R.; Zabolotsky, A.M. Using Reflection Symmetry to Improve the Protection of Radio-Electronic Equipment from Ultrashort Pulses. Symmetry 2019, 11, 883. https://doi.org/10.3390/sym11070883
AMA Style
Chernikova EB, Belousov AO, Gazizov TR, Zabolotsky AM. Using Reflection Symmetry to Improve the Protection of Radio-Electronic Equipment from Ultrashort Pulses. Symmetry. 2019; 11(7):883. https://doi.org/10.3390/sym11070883
Chicago/Turabian StyleChernikova, Evgeniya B., Anton O. Belousov, Talgat R. Gazizov, and Alexander M. Zabolotsky. 2019. "Using Reflection Symmetry to Improve the Protection of Radio-Electronic Equipment from Ultrashort Pulses" Symmetry 11, no. 7: 883. https://doi.org/10.3390/sym11070883
Note that from the first issue of 2016, this journal uses article numbers instead of page numbers. See further details here.