Article

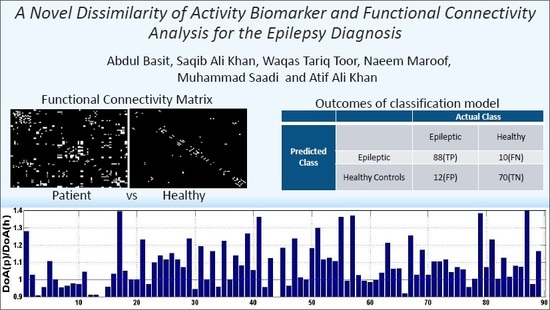
A Novel Dissimilarity of Activity Biomarker and Functional Connectivity Analysis for the Epilepsy Diagnosis

1
Department of Computer Engineering, Khwaja Fareed University of Engineering & Information Technology (KFUEIT), Rahim Yar Khan 64200, Pakistan
2
Department of Electrical Engineering, Khwaja Fareed University of Engineering & Information Technology (KFUEIT), Rahim Yar Khan 64200, Pakistan
3
Department of Electrical and Electronic Engineering, University of Jeddah, Asfan Road, Jeddah 23891, Saudi Arabia
4
Department of Electrical Engineering, University of Central Punjab, Lahore 54000, Pakistan
5
Department of Medicine, and Institute of Genomics and Systems Biology, Knapp Center for Biomedical Discovery, University of Chicago, Chicago, IL 60637, USA
*
Author to whom correspondence should be addressed.
Symmetry 2019, 11(8), 979; https://doi.org/10.3390/sym11080979
Submission received: 21 June 2019 / Revised: 18 July 2019 / Accepted: 24 July 2019 / Published: 2 August 2019
(This article belongs to the Special Issue Symmetry and Asymmetry in Computational Biology and Bioinformatics)

Abstract

:
Epilepsy is a central nervous system disorder that results in asymmetries of brain regional activation and connectivity patterns. The detection of these abnormalities is oftentimes challenging and requires identification of robust bio-markers that are representative of disease activity. Functional Magnetic Resonance Imaging (fMRI) is one of the several methods that can be used to detect such bio-markers. fMRI has a high spatial resolution which makes it a suitable candidate for designing computational methods for computer-aided biomarker discovery. In this paper, we present a computational framework for analyzing fMRI data consisting of 100 epileptic and 80 healthy patients, with an overall goal to produce a novel bio-marker that is predictive of epilepsy. The proposed method is primarily based on Dissimilarity of Activity (DoA) analysis. We demonstrate that the bio-marker presented in this study can be used to capture asymmetries in activities by detecting any abnormalities in Blood Oxygenated Level Dependent (BOLD) signal. In order to represent all asymmetries (of connectivity and activation patterns), we used functional connectivity analysis (FCA) in conjunction with DoA to find underlying connectivity patterns of the regions. Subsequently, these biomarkers were used to train a Support Vector Machine (SVM) classifier that was able to distinguish between healthy and epileptic patients with 87.8% accuracy. These results demonstrate the applicability of computer-aided methods in complex disease diagnosis by simply utilizing the existing data. With the advent of all modern sensing and imaging techniques, the use of intelligent algorithms and advanced computational methods are increasingly becoming the future of computer-aided diagnosis.

Graphical Abstract

1. Introduction

The human brain is a complex network consisting of anatomical regions that act as nodes. The connections between these nodes are called edges. In order to perform certain task(s), the anatomical regions of brain develop temporary connections with each other [1]. Similarly, brain activity patterns represented by Blood Oxygen Level Dependent (BOLD) signals, change in response to a physical/mental task(s). The connectivity and activity patterns among the regions are task specific and they can be disturbed by the presence of neuro-biological disease [2]. These neurobiological disease induced variations in the brain activity and connectivity patterns serves as a fundamental resource for understanding the underlying mechanisms of the disease [2]. For example, in the case of a neurobiological disease such as epilepsy, a relatively decreased activity is usually observed in the neo-cortical and mesial temporal regions [3]. Exploring and distinguishing such patterns are of great significance for the adequate diagnosis and treatment of serval neurological conditions. This study presents a computational framework and demonstrate the use of a novel bio-marker that can be used to distinguish between normal and epileptic patients.
Epilepsy is one of the most common neurological disorders of the brain that affects over 50 million people globally [4]. Apart from patient sufferings and social stigma, there is huge economic cost associated with epilepsy in terms of health-care needs and the lost work productivity. Just like with any other condition, a fundamental challenge for epileptic patients is in-time, cost-effective, and accurate diagnosis. Substantial progress has been made lately in understating the etiology of epilepsy by analyzing genetics contribution, environment contribution, and their potential interactions. Despite the progress that has been made, the accurate and timely diagnosis of epilepsy remains challenging. The scientific community has long been emphasizing the need of innovate computational techniques and intelligent algorithms for automatic seizure detection that can likely advance both monitoring of the outcome of a treatment in a patient and clinical research in epilepsy [5].
Epilepsy causes disturbance in brain network topology and is characterized by brain seizures [6]. These seizures can be of brief duration ranging from few seconds to few minutes of body shaking [7]. The diagnosis of epilepsy is often times challenging in clinical settings with about 5 to 30 percent chances of misdiagnosis in every case [8]. Traditional clinical diagnostic methods require subjects to fill questionnaires regarding their past and current health states that are evaluated in conjunction with their observed clinical symptoms. However, it has been noticed that the common symptoms of epilepsy i.e., partial and focal seizures and loss of consciousness etc. overlap with other neuro-biological disorders such as bipolar disorder [9]. These constraints thus limit the accuracy and reliability of the conventional diagnostic and reporting procedures. Therefore, it is critical to think of and develop alternative, and perhaps better, ways to adequately diagnose neurobiological diseases in general and epilepsy in particular. With the advent of all modern sensing and imaging techniques, the use of intelligent algorithms, and advanced computational methods make a strong case for the computer aided diagnosis.
Finding robust disease specific biomarkers is a challenging task in the field of neuroscience. Traditionally, the brain response of affected patients are compared with that of matched healthy controls with an overall goal of understanding the similarities and differences between the two groups [7]. Electroencephalography (EEG) response represents the electrical activity of the brain, and is one of the many methods that can be used for identification of the difference described above. EEG is a cost effective method but comes with several limitations. EEG has very poor spatial resolution and usually fails to capture a change of electrical activity in nearby locations of the brain, thus affecting the reliability of the signal. Therefore EEG cannot accurately discriminate the signals from two nearby locations [10]. In addition, EEG cannot detect activity changes below the upper layer of the brain. Another limitation includes poor signal to noise ratio. An alternative to EEG is fMRI, which is more expensive and time consuming compared to EEG but comes with far better spatial resolution. fMRI is also well suited to the modern computational methods that often require high quality and repeated measurements of a specific signal to account for sensitivity and variability [11]. fMRI is a neuro-imaging procedure which uses MRI technology to represent brain activity by measuring changes in the blood flow during a certain neural activity. fMRI technique works under the basic principle that the blood flow in the brain is highly dependent upon the activity of neurons, which means that more blood flows in the active parts of the brain than the inactive ones [12,13].
In this paper, we present a computational framework that produced a novel bio-marker for epilepsy diagnosis based on fMRI of healthy and epileptic patients. A classification model developed based on this bio-marker outperformed the existing model in terms of classification performance. Although, the scope of this paper is limited to differentiating epileptic patients from healthy controls, but the general pipeline can be implemented for many other neurological conditions. The rest of the paper is organized as following: The literature review on the topic is presented in Section 2. The details of dataset and classification model are provided in Section 3, namely materials and methods. Section 4 details the results and related discussion, while conclusion and future works are presented in Section 5.

2. Literature Review

fMRI data acquisition techniques are broadly categorized in two groups, namely, event-related fMRI (efMRI) and resting-state fMRI (rsfMRI). efMRI technique can be used to detect changes in the BOLD signal during certain events; e.g. finger movement or viewing images etc. rsfMRI is a technique that detects changes in BOLD signal during the rest state, i.e., the subject under observation is not performing any specific task and is suggested to rest, defer thinking and try to go into a sleeping state. efMRI requires a carefully designed task and failure to do so may yield discrepancies in the acquired data [14]. On the other hand, rsfMRI does not require specifically designed task/experiment. The subject is usually asked to relax and think about nothing in particular during the data acquisition [15]. Hence rsfMRI is suitable for infants and patients with learning disabilities as it does not expect any certain response from subjects under examination.
The presence of neuro-biological disorder, such as epilepsy, induces the abnormalities of activation region and connectivity patterns in the patient’s brain. These abnormalities can be exploited to distinguish epileptic patients from healthy controls by finding robust neuro-imaging biomarkers. Several studies have produced neuro-imaging biomarkers to identify the group difference between healthy controls and patient groups. Lately, fMRI-based biomarkers for diagnosis of depression, schizophrenia and Alzheimer disease have successfully been developed [16,17,18]. Zang et al. proposed a robust biomarker extracted through regional homogeneity analysis (ReHO) [19]. This ReHO based bio-marker, which has been employed widely for epilepsy diagnoses in the past, was based on the idea that the brain’s activity of a certain region correlates with its neighboring regions and a neuro-psychological disorder like epilepsy disturbs this correlation among the neighboring regions. The ReHO based biomarker works on the principle of calculating the similarity index of a certain brain regions and its neighboring regions. However, ReHO based biomarker has its own limitations i.e., it can represent similarities at regional neighborhood but cannot capture the inter-community relationships. A community represents a set of particular regions that are located next to each other.
Functional connectivity analysis (FCA) is another robust biomarker that exploits the brain connectivity to analyze brain functions. Functional connectivity is defined as the statistical dependencies of activities on each other in the brain regions. This can be achieved by finding the correlation between different brain regions. In Laufs et al. [20] and Luo et al. [21], the authors discuss functional connectivity of the brain using default mode networks. Connectivity asymmetries in the brain network to diagnose epilepsy using two robust biomarkers namely, community matrix (K) and global connectivity asymmetry (GCA), have been exploited previously by Zhang et al. [22]. FCA is extracted from fMRI data using correlation [20,21,22] or clustering [23,24,25] of BOLD series of regions. However, dependencies between brain regions are highly affected by the neighboring regions when the connectivity analysis includes more than two brain regions. It is crucial to determine whether the observed relationship i.e., strength of correlation between any two regional time series, is due to a direct connection between the two brain regions or because of an indirect dependence involving a third region. If the effect of all other regions is not regressed out, then correlation may not represent a true relationship between the regions. Actual connectivity strength between the two regions can be determined by partial correlation and by suppressing false correlations (i.e., correlations due to effect of other regions) [26]. Moreover, biomarkers presented in [20,21,22,23,24,25] only address abnormalities in connectivity patterns of different brain regions but none of them capture asymmetries in the activities of brain regions.
In this paper, a complete computational framework is presented for the diagnosis of epilepsy by exploiting asymmetries in activity and connectivity patterns. We demonstrate that, with the help of FCA and DoA, all asymmetries in brain activity and connectivity patterns can be extracted. The proposed classification model is validated by testing it on data set provided by Zhang et al. [22]. Moreover, a comparative analysis is presented by evaluating performance of proposed biomarkers against the performance of biomarkers designed previously (in literature) by using the same dataset. The proposed rsfMRI-based classification model for diagnosis of epilepsy is suitable for clinical utility due to ease of data acquisition modality and superior diagnostic accuracy.

3. Materials and Methods

In this section, we describe the details of data set, data pre-processing steps, and the feature extraction techniques that were used in our proposed method.

3.1. Data Set

The study reported here makes secondary use of the dataset originally produced by Zhang et al. [22] to investigate and identify neuroimaging biomarkers of epilepsy. The complete details about the rsfMRI-based dataset can be found in previous work by Zhang et al. [22]. Briefly, the original dataset consisted of 180 participants who volunteered for fMRI-based data acquisition. There were 80 healthy controls (mean age: 24.89 ± 8.63) and 100 epileptic patients (mean age: 23.85 ± 5.66) with a variety of epilepsy diagnoses i.e., temporal lobe epilepsy, partial and global epilepsy. All subjects were right-handed and all the epileptic patients within the study population had experienced epileptic seizures more than twice. Furthermore, at the time of data acquisition, 82 of 100 epileptic patients were taking antiepileptic drugs (AED) regularly that included valproic acid, phenytoin, carbamazepine, and topiramate. The remaining 18 were not taking any AEDs for the treatment but the typical symptoms of epilepsy were found evident in those patients. The epileptic and control groups were age matched and there was no statistically significant difference among the two groups. Ethical approval for the original study was obtained from the local medical ethics committee at Jinling Hospital, Nanjing University School of Medicine. Since this study made secondary use of the same dataset with an overall aim to improve the diagnostic accuracy, no further approval was obtained.
Original data was acquired with the help of a 3 Tesla Siemens Trio Tim scanner [22]. To capture BOLD signals, the scanner used an eight-channel head coil with acquisition parameters shown in Table 1. In order to cover the whole brain, 30 slices were used. An informed written consent was obtained from all the participants before acquisitions. During acquisition of fMRI data, all the subjects were in relaxed mode and held still. To detect morphological deforming, MRI scans were conducted as per routine. The participants did not undergo any other procedure apart from above mentioned procedures and considerations.

3.2. Data Pre-Processing

Data pre-processing was done with the help of software Data Processing Assistant for Resting-State fMRI (DPARSF). DPARSF is based on Statistical Parametric Mapping (SPM) and Resting-State fMRI Data Analysis Toolkit (REST) [27]. First of all, head motion correction was performed and then smoothing was done on motion corrected data. Presence of low frequency drift and high frequency noises can distort the original signal and often needs be removed before the analysis. This was achieved by using band pass filter (0.010.08 Hz) of BOLD signals. After these pre-processing steps, fMRI time series was obtained for the whole brain. This time series was later segregated into 116 regions using Tzourio-Mazoyer et al. [28] template for anatomical labeling of brain regions. Out of these 116 regions, 90 were from cortex and the rest were from the cerebellum. In this study, we only considered the regions of the cortex, as it is the largest part of a brain and is responsible for most of the functions. The final pre-processed data for each subject consists of a matrix of dimensions 200 × 90 (time-points × regions).

3.3. Feature Extraction

We used a combination of two biomarkers to capture all asymmetries produced by the presence of epilepsy. The first was functional connectivity that has been previously used by Zhang et al. [22] and the second one was a novel biomarker that captured dissimilarity of activity (DoA) between bilaterally homologous regions of the brain.
In order to perform a certain activity, brain regions form specific connections among themselves. These connections are usually altered in the presence of neurobiological disorders. These disease induced alterations in the connectivity patterns serve as vital resources for discriminate healthy brain from diseased. Here we made use of partial correlation to determine true connection or relation between the two regions.
Given a set of variables, the partial correlation between two variables is a linear relationship between those two when the effect of other variables is suppressed or removed. Let us assume that we have n variables X 1 , X 2 , X 3 ,   ,   X n and we want to find partial correlation between X 1 and X 2 . In such a case, we have to estimate linear approximation of variables X 1 and X 2 based on rest of variables i.e., X 3 ,   X 4 ,   ,   X n , which we denote as X 1 ; 3 , 4 n * and X 2 ; 3 , 4 n * respectively. The partial correlation between V 1 = ( X 1 X 1 ; 3 , 4 n * ) and V 2 = ( X 2 X 2 ; 3 , 4 n * ) is denoted by δ 1 , 2 ; 3 , 4 , n and is given by Equation (1).
δ 1 , 2 ; 3 , 4 n = μ { ( V 1 μ ( V 1 ) ) ( V 2 μ ( V 2 ) ) } v a r ( V 1 ) × v a r ( V 2 )
where μ ( ) and v a r ( ) represent the mean and variance respectively. Partial correlation can be represented in terms of correlation matrix [6]. Let C = c i j be the correlation matrix and c i j be the correlation coefficient between variables X 1 and X 2 and let C i j be the cofactor of c i j in the determinant of C , then the partial correlation coefficient for X 1 and X 2 is given by Equation (2).
δ 1 , 2 ; 3 , 4 n = c 12 c 11 c 22
Similarly, in the case of three variables, partial correlation between X 1 and X 2 is given by Equation (3).
δ 1 , 2 ; 3 = c 12 c 13 c 23 ( 1 c 13 2 ) ( 1 c 23 2 )
We computed partial correlation of whole time series using functional connectivity toolbox provided by Dongli et al. [29]. Functional connectivity matrix (community matrix K) for a healthy control and an epileptic patient computed using clustering and partial correlation can be seen in Figure 1, below. fMRI data was normalized before computing partial correlation between the brain regions. Moreover, threshold operation was performed on functional connectivity matrix to yield binary values. However, one drawback of computing functional connectivity matrix using partial correlation is that the error induced by multiple regression increases as the number of control variables (number of brain regions) increases. Standard error of partial correlation is given by Equation (4).
S E 2 = ( 1 R 2 ) ( N k 1 ) ( 1 R i 2 )
where the R 2 is the variance of the data, N is the number of data points and k is the number of variables. As the number of samples increase, error in partial correlation decreases. Solving it for minima, we obtain N > k + 1 . In our case we have N = 200 and k = 90 , and hence N > 2 k . Zalesky et al. demonstrated the suitability of partial correlation for fMRI connectivity for N > 2 k [30].
In Figure 1a,b, it can be seen that the functional connectivity matrix obtained by clustering was quite dense. This happened due to the presence of the spurious/indirect connections. Similarly, the difference matrix, as shown in Figure 1e, was not very descriptive as it showed highly random patterns. However, the partial correlation-based functional connectivity matrix represented connectivity pattern more comprehensively as shown in Figure 1c,d. Here, it can be noted that many spurious connections were suppressed by regressing out indirect connections. The difference matrix using partial correlation, in Figure 1f, showed a diagonal pattern. The differences between two groups seemed very prominent along the diagonal line.
As the functional connectivity matrix was symmetrical, we only considered either the upper or lower triangles across the diagonal. We had 90 regions with total number of elements in functional connectivity matrix being 90 × 90 = 8100 . However, due to the symmetry, we only considered the upper triangle which contained 90 × ( 90 1 ) / 2 = 4005 elements. For the second biomarker, one of the choices was to use Global Connectivity Asymmetries (GCA) proposed by Zhang et al. in [22] where the authors’ used connectivity profile differences of bilaterally homologous brain regions as potential biomarker.
Figure 2 shows the connectivity profile asymmetries ratio between healthy control and epileptic patients. On the x-axis, homologous pairs are indicated while the y-axis represents asymmetry ratio between epileptic patient and healthy control for a particular homologous pair. If d p and d H are average connectivity asymmetries of a patient and healthy group, respectively, then the y-axis represents d p / d H .
As described in Section 1, the presence of neuropsychiatric disease can induce amplitude variations in BOLD response of a region and hence regional activities of brain are influenced by neurological disorder. The variations in activity can be exploited to discriminate the epileptic patients from healthy controls. GCA method is, however, unable to fully address these variations as it only captures the connectivity asymmetries. Figure 3 shows the BOLD signals of a healthy and an epileptic patient. These signals were normalized using procedure explained in details by Lowe et al. [31].
It was difficult to discriminate between the two groups on the basis of their BOLD signals. The difference between two groups was more visible when these signals were presented in terms of power spectral density as shown in Figure 4.
The difference between these two groups was a potential biomarker to discriminate healthy controls and epileptic patients from each other. Also it is evident from Figure 1c to 1d that the brightness of functional connectivity matrix along diagonal entries showed strong connectivity between corresponding regions in healthy controls and their strength of connectivity was suppressed by presence of epilepsy. This shows that the analysis of those particular regions where the connectivity strength was represented along the diagonal entries of the functional connectivity matrix was helpful in discriminating healthy controls from epileptic patients, and hence it would be interesting to measure changes in activity between them. To capture these changes in activity of regions, we proposed a novel biomarker named DoA. We compute DoA using:
D o A ( k ) = 1 P F ( R k ( t )   ,   N k ( t ) )
where R k ( t ) is regional activity of region k , and N k ( t ) is the average regional activity of regions adjacent to k in community matrix. N k ( t ) is computed as:
N k ( t ) =   s = 1 m R k + s ( t ) m
P F represents relationship between R k ( t ) and N k ( t ) in terms of power spectral density as explained in (7):
P F ( R k ( t ) , N k ( t ) ) = f   | P R k N k ( f ) | 2 f   P R k R k ( f ) f   P N k N k ( f )
where P R k R k ( f ) and P N k N k ( f ) are power spectral densities of R k ( t ) and N k ( t ) respectively while P R k N k ( f ) is the crosspower spectral density of R k ( t ) and N k ( t ) .
The smaller value of DoA indicated that asymmetries in BOLD activity were very weak. Similarly, the larger value of DoA corresponded to large asymmetries of BOLD activity. DoA consisted of 90 features and further 90 features form second biomarker were aimed to capture activity differences between brain regions. The ratio of dissimilarity of activity between epileptic patient group and healthy control group is shown in Figure 5. It is evident from comparison between Figure 2 and Figure 5 that due to presence of epilepsy, both connectivity and activity patterns in brain regions were affected. Interestingly, it was observed that the ratio of DoA has greater magnitude than ratio of GCA between epileptic patients and healthy controls. In other words, activity patterns of brain regions were greatly influenced by the presence of a neurobiological disorder as compared to the connectivity profiles of bilaterally homologous brain regions. This provided an indication that DoA was potentially capable of discriminating epileptic patients from healthy controls and hence can be used as a biomarker for classification model. The discrimination power of DoA can be observed using box plot of mean of DoA for healthy controls and mean DoA for epileptic patients and is shown in Figure 6.
On each box, the central red mark is the median and the edges of the box represent the 25th and 75th percentiles. It can be seen that on average DoA for epileptic patient group is greater than healthy controls. This advocates the suitability of DoA for discriminative analysis.

3.4. Feature Selection

The biomarker functional community matrix consisted of 4005 features which were computationally very expensive to process. Therefore, we selected a subset of features for the classification purpose. Moreover, the large number of features does not always guarantee higher classification accuracy. Rather, in many cases, larger number of features degrades the classification accuracy, a phenomena broadly known as “curse of dimensionality” in the machine learning domain. Therefore we reduced the number of features to minimize the computational cost and to improve the model performance by selecting only most discriminative and non-redundant features.
Zhang et al. [22] selected discriminative features from functional connectivity matrix using Sparse Linear Regression (SLR) which was based on following optimization criteria.
m i n x | A x y | 2 +   λ | x |
where A is the data matrix of the training data, x is regression coefficient, λ is regularization parameter and y represents the labels of training data. The degree of sparsity was controlled by λ . Larger value of λ means less number of features selected and vice versa. Riaz et al. [32] used difference statistics to select most discriminative features. The problem with SLR is that it is a parametric model with respect to λ . The choice of λ may affect the whole model’s performance. On the other hand, difference statistic uses mean difference of two classes to select most discriminative feature. However, this type of feature selection is highly dependent upon the training data. Noisy samples in the training data will affect the whole feature selection criteria and thus the corresponding feature selection will be suboptimal.
The choice of features is crucial as the poor selection of features degrades the classification accuracy. We used wrapper-based feature selection method. Wrapper-based methods tends to perform better feature selection on large-scale datasets and features are selected on the basis of performance rather than statistical measure; therefore a noisy sample makes minimal effect on the selection criteria [33]. We used forward feature selection to obtain the most discriminative features.

3.5. Classification

After selecting relevant features, we trained a support vector machine classifier on training data. SVM has several advantages including its effectiveness in high dimensional space and the ability to solve linear and non-linear problems. SVM uses subsets of training point for decision making and therefore making it memory efficient. Zhang et al. [22] used SVM with radial basis function to classify healthy controls and epileptic patients. The reported performance achieved was 80.2% ± 3.45% for 50-50 split of training and test data. For the sake of comparative analysis, we used similar classification model for our proposed pipeline.

4. Results and Discussion

Our analysis consisted of 100 epileptic and 80 healthy controls. We made used of fMRI data of 180 age matched individuals to produce biomarkers that are predictive of epilepsy. We used combination of two biomarkers to capture all asymmetries produced by the presence of epilepsy. The first was functional connectivity that has been previously used by Zhang et al. [22] and the second one was a novel biomarker that captured dissimilarity of activity (DoA) between bilaterally homologous regions of the brain, as discussed in detail in the previous section.
Classification experiment was performed by splitting the dataset into two halves. The first half was used for training while the other half was used for independently testing. Healthy controls were assigned a class label of “1” whereas the epileptic patients were assigned a class label of “−1”. SVM with radial bias function (RBF) kernel was used to classify epileptic patients from the healthy controls. SVM parameters such as box-constraint and sigma were selected by performing grid search. We tested our classification model under various settings with different number of edges of functional connectivity matrix. Again, each model was trained on one half of the dataset and tested on the other. The SVM model performed reasonably well when tested on held out set as depicted in Table 2. The proposed model was able to classify epileptic patients with 87.8% accuracy with a sensitivity of 89.8%. These results show that our proposed scheme is potentially capable of identifying epilepsy patients from rsfMRI.
We made further comparative analysis of our proposed model to the previously published models using the same data. Table 3 shows the comparative analysis of the proposed classification model with classifications models of Zhang et al. [22] and correlation based functional connectivity analysis. The proposed model outperformed the two reference techniques and provided an accuracy of 87.8% using 400 discriminative links of function community matrix and 90 features of DoA.
The results presented in Table 2 and Table 3 shows that the proposed scheme performed relatively better than other compared schemes. It also shows that the proposed novel biomarkers are robust for classification of epileptic patients from healthy controls. There are three main factors that lead to the improved performance.
(i).
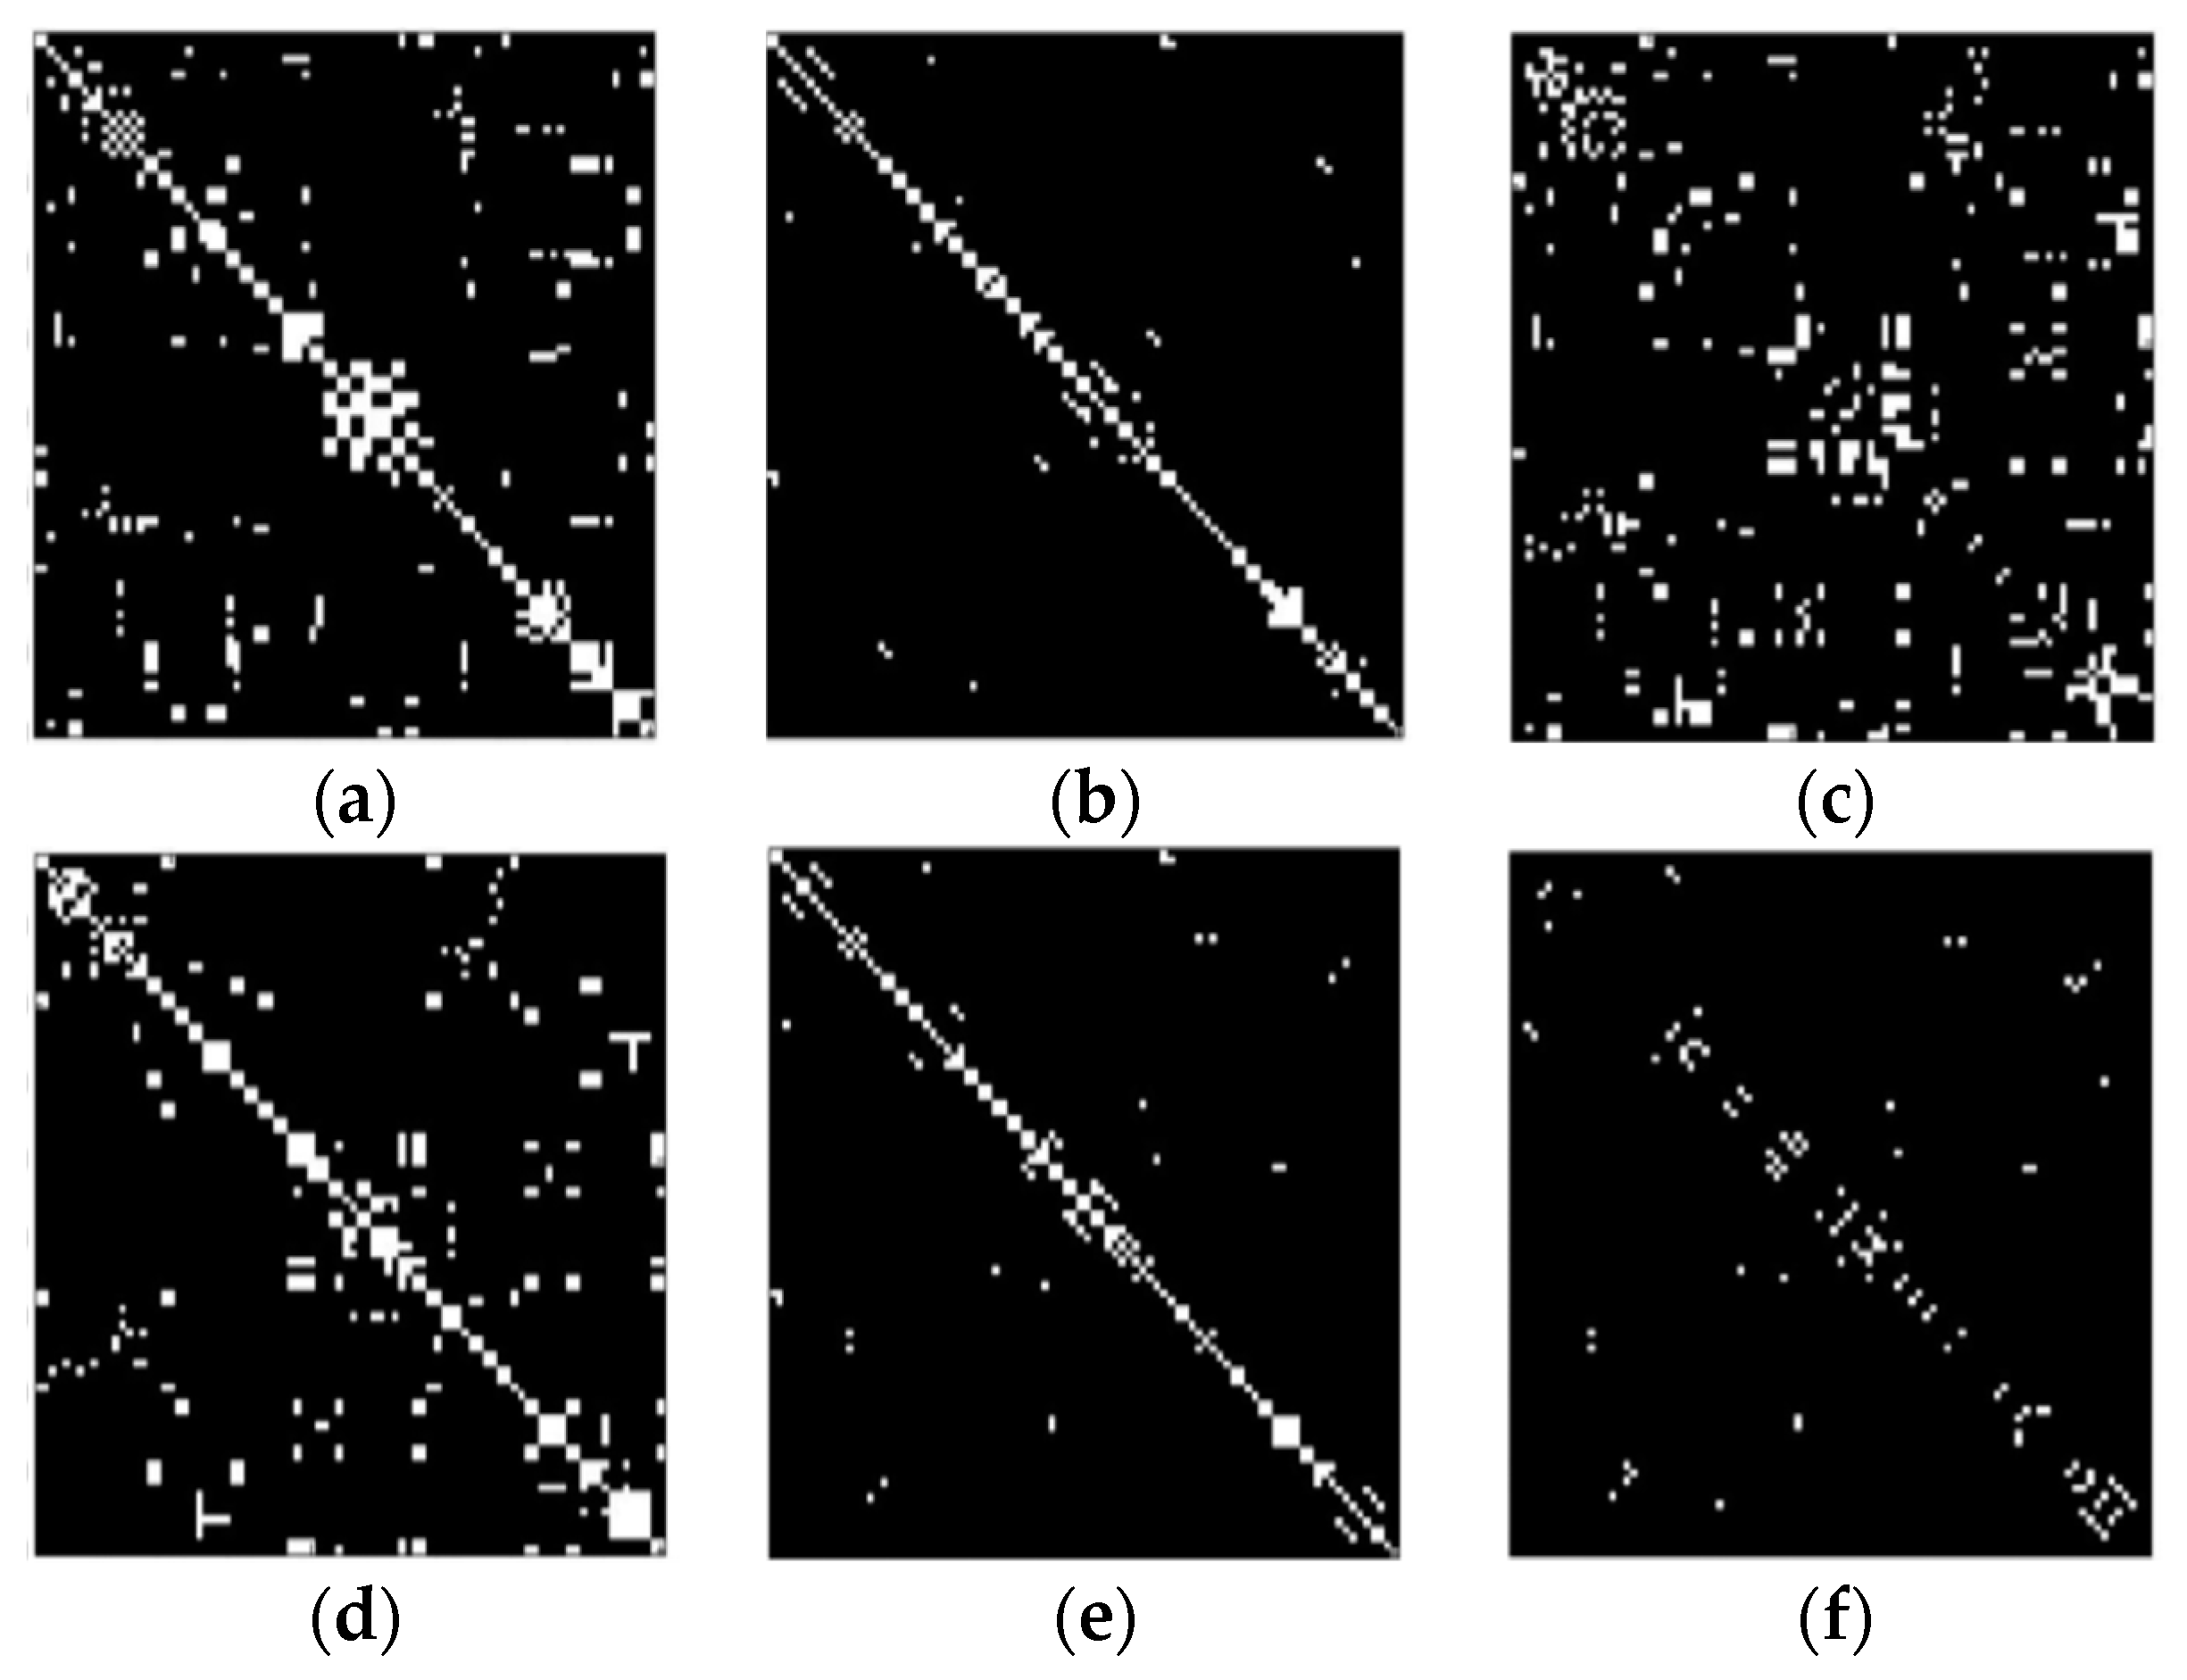
Better functional connectivity estimation (via partial correlation)
(ii).
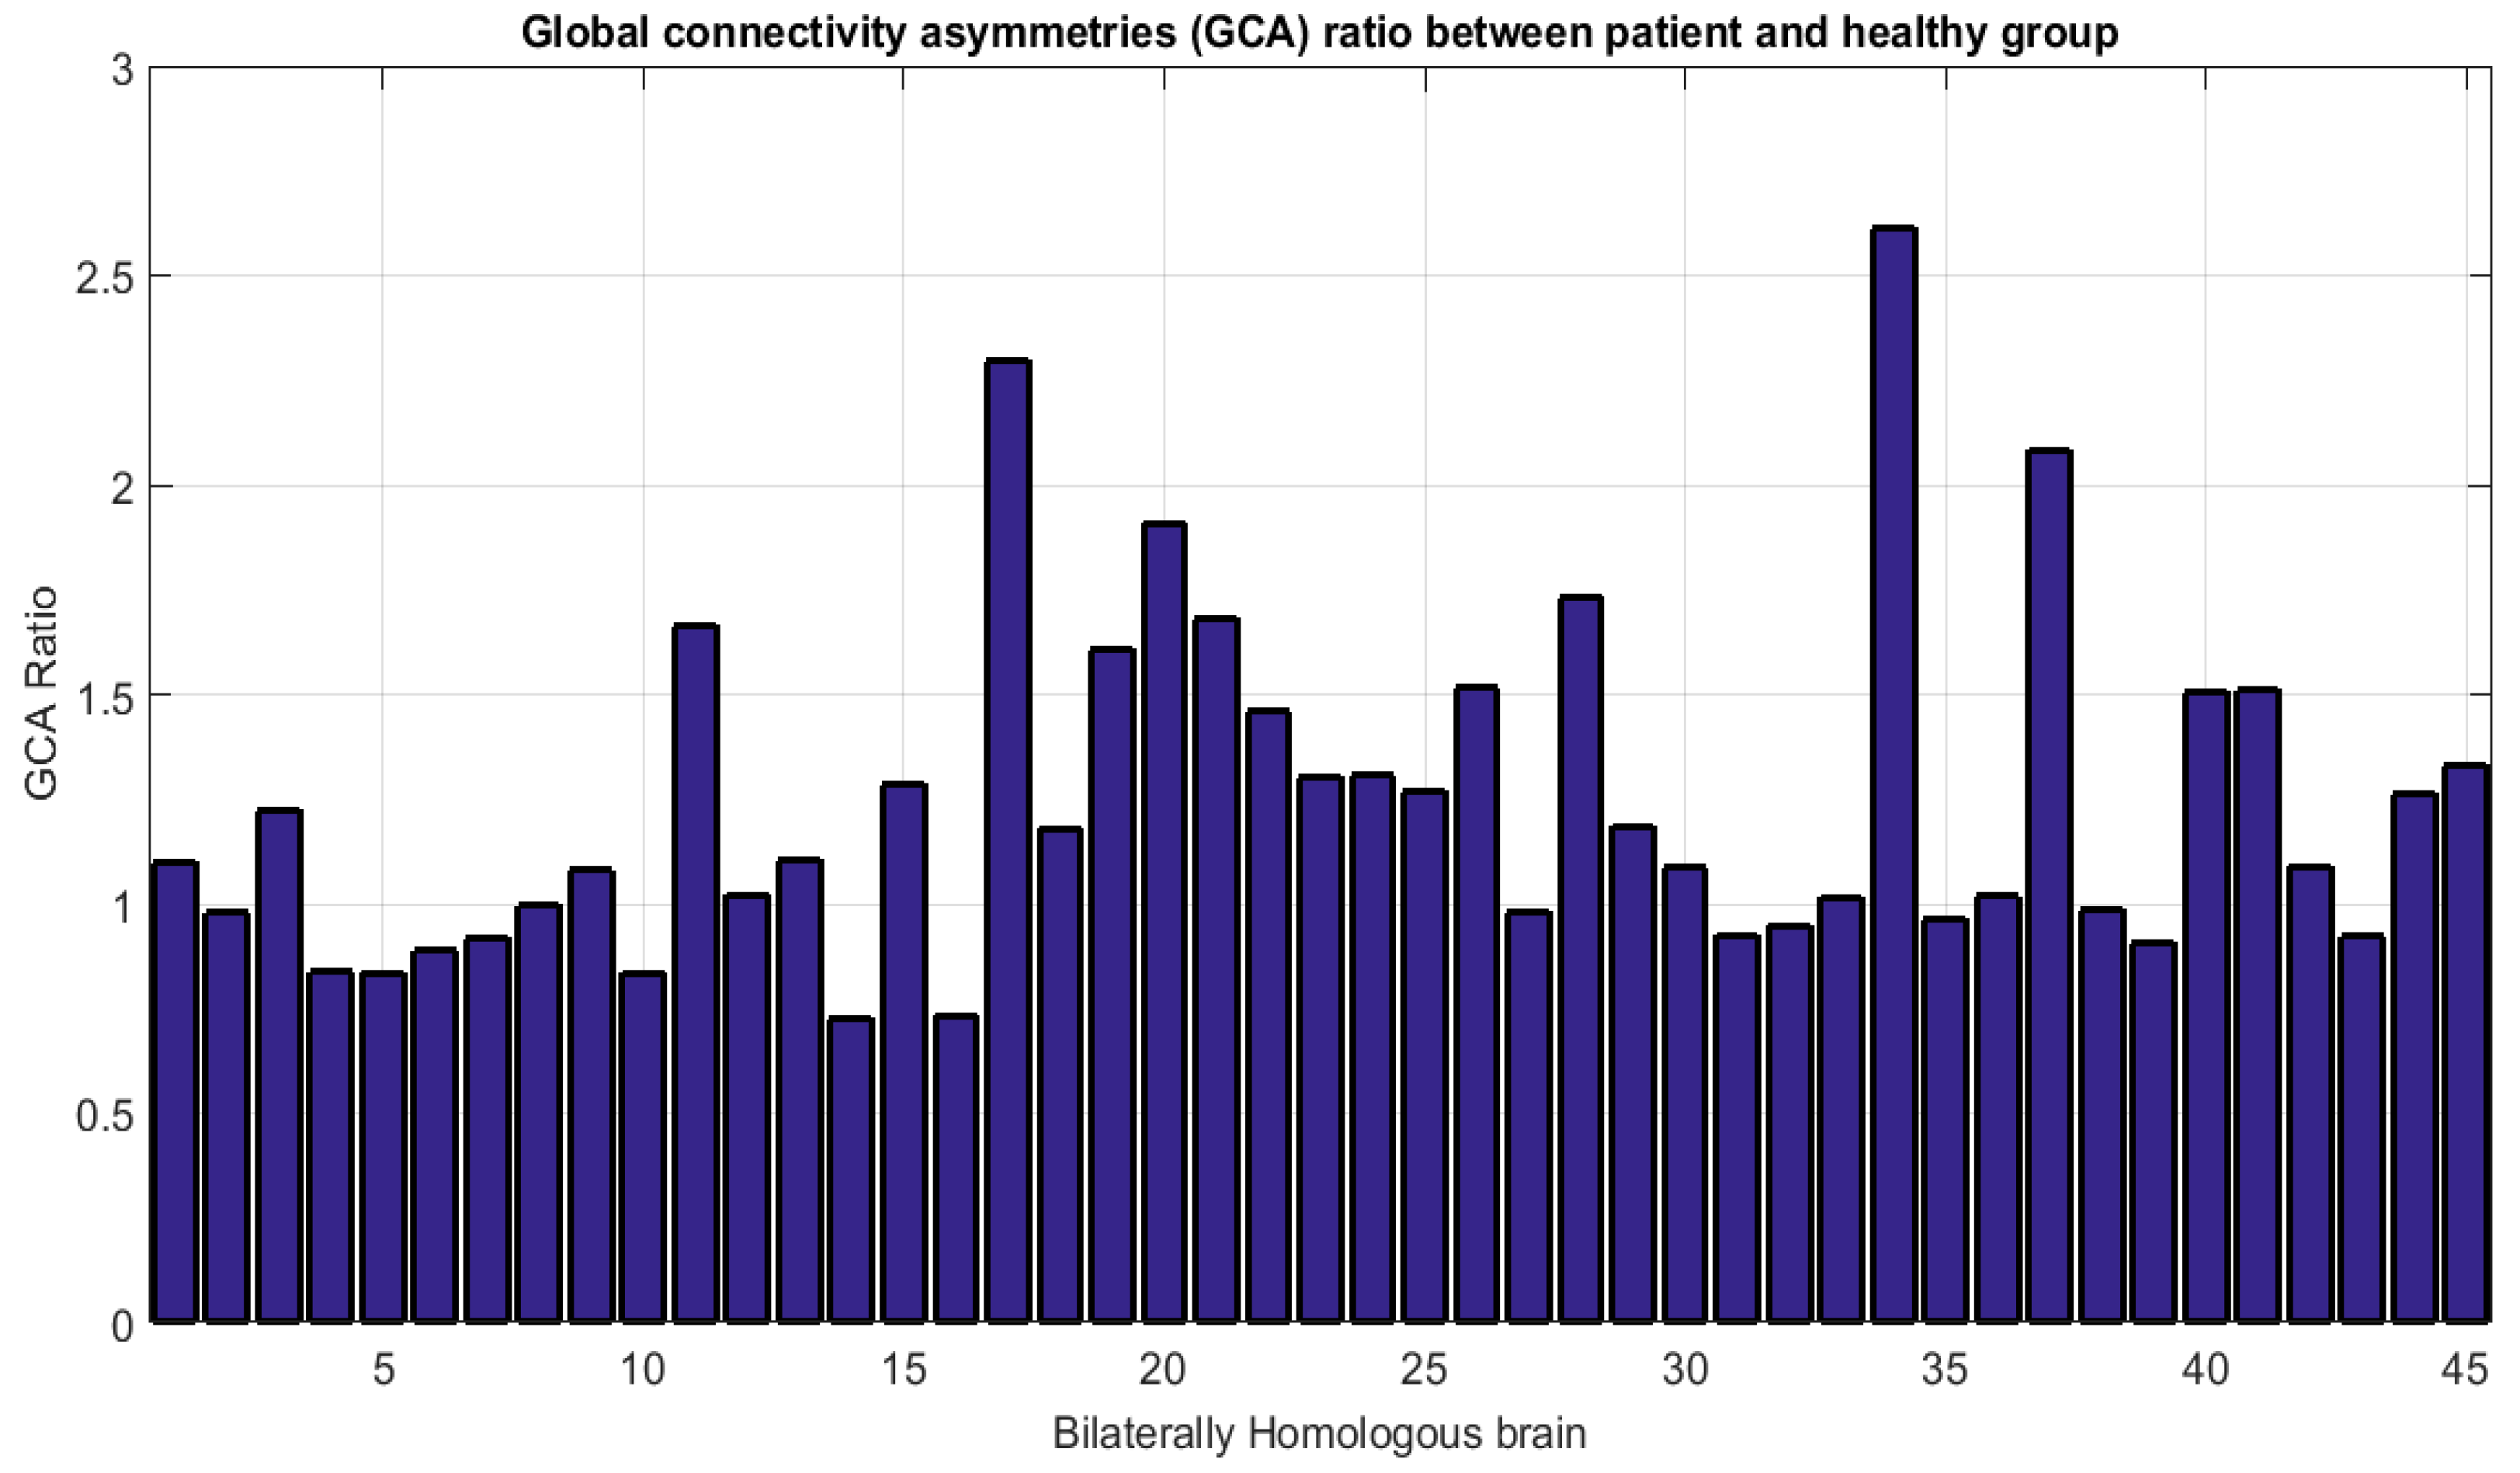
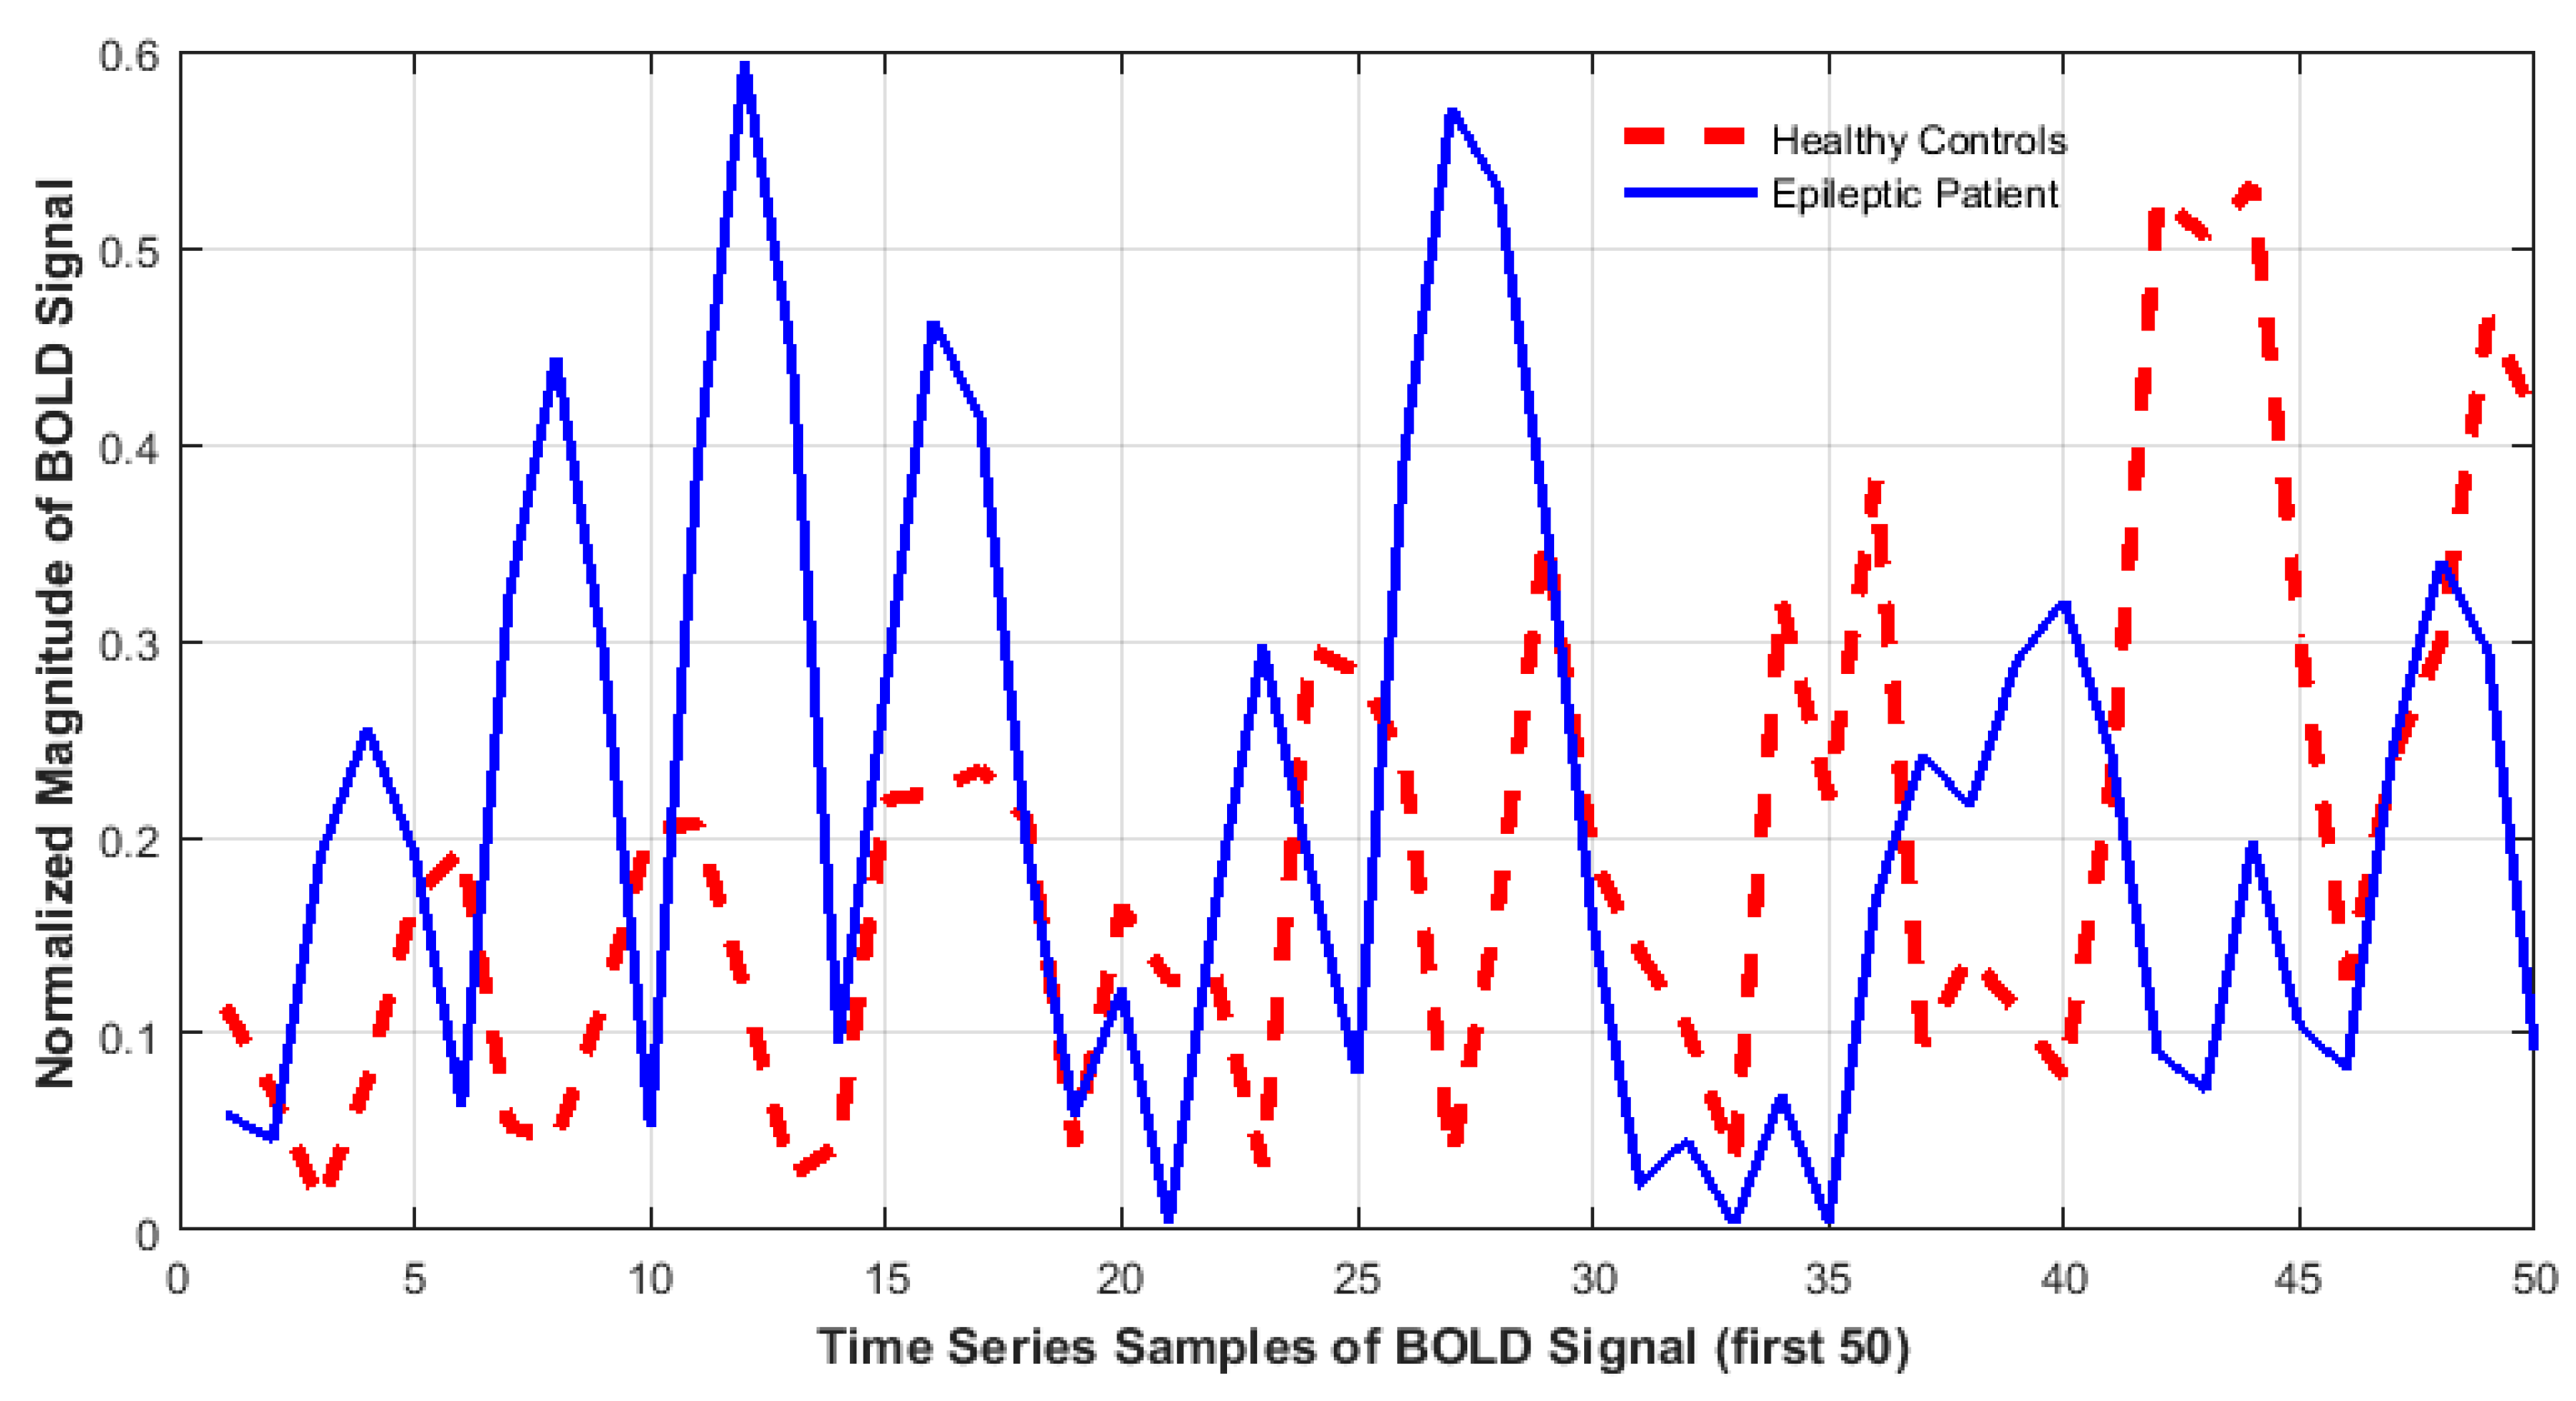
Accounting for dissimilarity of activity (DoA) in bilaterally homologous regions
(iii).
Better feature selection approach
It is important to note that neighboring regions influence activity of a brain region. If we want to know the true connectivity of two regions, the effect of other regions on connectivity should not be neglected. We would also like to stress that it is vital to remove the dependency or effect of all other regions from those two regions in order to find true relation or connectivity between them. As demonstrated in our analysis, partial correlation can effectively capture such factors and is useful in finding the true relation between two regions based on their activity.
We also observed that the presence of epilepsy disturbs the activity of regions and degree of dissimilarity in activity of regions can be exploited to discriminate epileptic brains from the healthy ones. We used this dissimilarity of activity (DoA) as a biomarker for classification purpose and achieved 76.6% classification accuracy using only 90 features. Feature selection was performed as a functional community matrix yielding a biomarker that consisted of 4005 features. Out of these 4005 features, many were found redundant and including all of them would have affected classification accuracy. We used wrapper-based technique e.g. forward feature selection to find discriminative features as wrapper-based techniques find optimal set for classifier. Together these factors were able to capture all asymmetries arising due to presence of epilepsy, which were necessary for discriminating epileptic patients from healthy controls.

5. Conclusion and Future Work

In this paper, we studied the alterations in brain connectivity and activation patterns observed in epileptic patients. We demonstrated that the asymmetries in connectivity and activity can be exploited to distinguish between healthy and epileptic patients. Specifically, we used functional connectivity analysis to observe the connectivity patterns of brain regions among each other. We consolidated that the effect of other regions on a specific region’s activity cannot be overlooked. It is crucial to suppress the effect of all other regions from two regions in order to find true connection strength between those two regions. We achieved this with the help of partial correlation.
We also concluded that neuropsychiatric diseases like epilepsy mark great effects on brain regions activation patterns. These activation patterns are very discriminative and should not be neglected in order to achieve better classification performance. We captured asymmetries caused by epilepsy on activation patterns of regions with a novel biomarker DoA. We demonstrated that functional connectivity analysis along with DoA forms a robust feature set that can describe all the asymmetries in brain region’s connectivity and activity patterns.
It is also imperative that the choice of feature selection technique should be made with care. We conclude that the wrapper-based feature selection techniques proved better than filter-based techniques for the considered dataset as they select features on the basis of classification performance rather than some statistical measure. However, due to the computational complexity and cost, we were not able to explore the complete feature space for the selecting the best predictive features. We encourage future studies to try different and perhaps better feature selection techniques to obtain an optimal feature set that could further enhance the predictive performance.

Author Contributions

A.B. conceived the study, designed analysis and performed simulation work. S.A.K. and W.T.T. performed validation analysis and did the literature review. N.M. and M.S. produced the initial manuscript. M.S. supervised the overall study and analyzed the results. M.S. and A.A.K. did proof-reading and revision of the manuscript.

Funding

This research received no external funding.

Acknowledgments

We are thankful to Jie Zhang for providing us with rsfMRI-based dataset. Jie Zhang is an Assistant Professor of the School of Computer Engineering and Academic Fellow of the Institute of Asian Consumer Insight at NTU, Singapore.

Conflicts of Interest

The authors declare no conflict of interest.

References

  1. Wei, L.; Zhang, Z.; Mantini, D.; Ding, J.; Duan, X.; Luo, C.; Chen, H. Altered functional connectivity and small-world in mesial temporal lobe epilepsy. PLoS ONE 2010, 5, e8525. [Google Scholar]
  2. Logothetis, N. What we can do and what we cannot do with fMRI. Nature 2008, 453, 869–878. [Google Scholar] [CrossRef] [PubMed]
  3. Chkhenkeli, S.A.; Chkhenkeli, I.S. Effects of therapeutic stimulation of nucleus caudatus on epileptic electrical activity of brain in patients with intractable epilepsy. Stereotact. Funct. Neurosurg. 1997, 69, 221–224. [Google Scholar] [CrossRef] [PubMed]
  4. Niriayo, Y.L.; Mamo, A.; Kassa, T.D.; Asgedom, S.W.; Atey, T.M.; Gidey, K.; Demoz, G.T.; Ibrhim, S. Treatment outcome and associated factors among patients with epilepsy. Sci. Rep. 2018, 8, 17354. [Google Scholar] [CrossRef] [PubMed]
  5. Elger, C.E.; Hoppe, C. Diagnostic challenges in epilepsy: Seizure under-reporting and seizure detection. Lancet Neurol. 2018, 17, 279–288. [Google Scholar] [CrossRef]
  6. Kramer, M.A.; Eric, D.K.; Heidi, E.K. Emergent network topology at seizure onset in humans. Epilepsy Res. 2008, 79, 173–186. [Google Scholar] [CrossRef]
  7. Apkarian, A.V.; Bushnell, M.C.; Treede, R.D.; Zubieta, J.K. Human brain mechanisms of pain perception and regulation in health and disease. Eur. J. Pain 2005, 9, 463. [Google Scholar] [CrossRef]
  8. Brodtkorb, E. Common imitators of epilepsy. Acta Neurologica Scandinavica 2013, 127, 5–10. [Google Scholar] [CrossRef]
  9. Wiglusz, M.S.; Landoski, J.; Cubala, W.J.; Aqius, M. Overlapping phenomena of bipolar disorder and epilepsy–a common pharmacological pathway. Psychiatr Danub 2015, 27, S177–S181. [Google Scholar]
  10. Ferree, T.C.; Clay, M.T.; Don, M.T. The spatial resolution of scalp EEG. Neurocomputing 2001, 38–34, 1209–1216. [Google Scholar] [CrossRef]
  11. Alois, S.; Slater, M.; schiller, G.P. Presence research and EEG. In Proceedings of the 5th International Workshop on Presence, Porto, Portugal, 9–11 October 2002. [Google Scholar]
  12. Aguirre, G.K.; D’Esposito, M. 30 Experimental Design for Brain fMRI. In Funct. MRI; Springer: Berlin, Gemany, 1999; pp. 369–380. [Google Scholar]
  13. Hedrich, T.; Pllegrino, G.; Kobayashi, E.; Lina, J.M.; Grova, C. Comparison of the spatial resolution of source imaging techniques in high-density EEG and MEG. NeuroImage 2017, 157, 531–544. [Google Scholar] [CrossRef]
  14. Qiao, P.; Gao, P.; Dai, J.; Niu, G. Research progress on resting state fMRI of epilepsy. Brain Dev. 2012, 34, 8–12. [Google Scholar] [CrossRef]
  15. Biswal, B. Resting state fMRI: A personal history. Neuroimage. 2012, 62, 938–944. [Google Scholar] [CrossRef]
  16. Zeng, L.L.; Shen, H.; Liu, L.; Wang, L.; Li, B.; Fang, P.; Zhou, Z.; Li, Y.; Hu, D. Identifying major depression using whole-brain functional connectivity: A multivariate pattern analysis. Brain 2012, 135, 1498–1507. [Google Scholar] [CrossRef]
  17. Reisa, S. The potential of functional MRI as a biomarker in early Alzheimer’s disease. Neurobiol. Aging 2011, 32, S37–S43. [Google Scholar]
  18. Magnin, B.; Mesrob, L.; Kinkingn’ehun, S.; P’el´egrini-Issacet, M.; Colliot, O.; Sarazin, M.; Dubois, B.; Lehericy, S.; Benali, H. Support vector machine-based classification of alzheimers disease from whole brain anatomical MRI. Neuroradiology 2009, 51, 73–83. [Google Scholar] [CrossRef]
  19. Zang, Y.; Jiang, T.; Lu, Y.; He, Y.; Tian, L. Regional homogeneity approach to fMRI data analysis. Neuroimage 2004, 22, 394–400. [Google Scholar] [CrossRef]
  20. Laufs, H.; Hamandi, K.; Salek-Haddadi, A.; Kleinschmidt, A.; Duncan, J.; Lemieux, L. Temporal lobe interictal epileptic discharges affect cerebral activity in ‘default mode’ brain regions. Hum. Brain Mapp. 2007, 28, 1023–1032. [Google Scholar] [CrossRef]
  21. Luo, C.; Li, Q.; Lai, Y.; Xia, Y.; Qin, Y.; Liao, W.; Li, S.; Zhou, D.; Yao, D.; Gong, Q. Altered functional connectivity in default mode network in absence epilepsy: A resting-state fMRI study. Hum. Brain Mapp. 2011, 32, 438–449. [Google Scholar] [CrossRef]
  22. Zhang, J.; Cheng, W.; Wang, Z.; Zhang, Z.; Lu, W.; Lu, G.; Feng, J. Pattern classification of large-scale functional brain networks: Identification of informative neuroimaging markers for epilepsy. PLoS ONE 2012, 7, e36733. [Google Scholar] [CrossRef]
  23. Cordes, D.; Haugton, V.; Carew, J.D.; Arfanakis, K.; MaraVilla, K. Hierarchical clustering to measure connectivity in fMRI resting-state data. Magn. Reson. Imaging 2002, 20, 305–317. [Google Scholar] [CrossRef]
  24. Van de Ven, V.G.; Formisano, E.; Prvulovic, D.; Roeder, C.H.; Linden, D.E. Functional connectivity as revealed by spatial independent component analysis of fMRI measurements during rest. Hum. Brain Mapp. 2004, 22, 165–178. [Google Scholar] [CrossRef]
  25. Peltier, S.J.; Thad, A.P.; Douglas, C.N. Detecting low frequency functional connectivity in fMRI using a self-organizing map (SOM) algorithm. Hum. Brain Mapp. 2003, 20, 220–226. [Google Scholar] [CrossRef]
  26. De La Fuente, A.; Bing, B.; Hoeschele, I.; Mendes, P. Discovery of meaningful associations in genomic data using partial correlation coefficients. Bioinformatics 2004, 20, 3565–3574. [Google Scholar] [CrossRef] [Green Version]
  27. Chao, G.Y.; Yu, F.Z. DPARSF: A MATLAB toolbox for ‘pipeline’ data analysis of resting-state fMRI. Front. Syst. Neurosci. 2010, 4, 1–13. [Google Scholar]
  28. Tzourio-Mazoyer, N.; Landeau, B.; Rapathanassiou, D.; Crivello, F.; Etard, O.; Delcroix, N.; Mazoyer, B.; Joliot, M. Automated anatomical labeling of activations in SPM using a macroscopic anatomical parcellation of the MNI MRI single subject brain. Neuroimage 2002, 15, 273–289. [Google Scholar] [CrossRef]
  29. Zhou, D.l.; Wesley, K.T.; Greg, S. MATLAB toolbox for functional connectivity. Neuroimage 2009, 47, 1590–1607. [Google Scholar] [CrossRef] [Green Version]
  30. Andrew, Z.; Fornito, A.; Bullmore, E. On the use of correlation as a measure of network connectivity. Neuroimage 2012, 60, 2096–2106. [Google Scholar]
  31. Lowe, M.J.; Mock, B.J.; Sorenson, J.A. Functional connectivity in single and multislice echoplanar imaging using resting-state fluctuations. Neuroimage 1998, 7, 119–132. [Google Scholar] [CrossRef]
  32. Riaz, A.; Rajpoot, K.; Rajpoot, N. A connectivity difference measure for identification of functional neuroimaging markers for epilepsy. In Proceedings of the 6th International IEEE/EMBS Conference on Neural Engineering (NER), San Diego, CA, USA, November 2013; pp. 1517–1520. [Google Scholar]
  33. Mineichi, K.; Sklansky, J. Comparison of algorithms that select features for pattern classifiers. Pattern Recognit. 2000, 33, 25–41. [Google Scholar]
Figure 1. Functional connectivity matrix (a) Healthy control using clustering (b) Epileptic patients using clustering (c) Healthy control using partial correlation (d) Epileptic patients using partial correlation (e) Difference matrix using clustering (f) Difference matrix using partial correlation.
Symmetry 11 00979 g001
Figure 2. Global connectivity asymmetries (GCA) ratio between patient and healthy group.
Symmetry 11 00979 g002
Figure 3. Blood Oxygenated Level Dependent (BOLD) signal of a healthy control and an epileptic patient.
Symmetry 11 00979 g003
Figure 4. Power spectral density of BOLD signal of (a) Epileptic patient (b) Healthy control.
Symmetry 11 00979 g004
Figure 5. Dissimilarity of Activity (DoA) ratio between patient and healthy group.
Symmetry 11 00979 g005
Figure 6. Box plot of DoA for patients and healthy group.
Symmetry 11 00979 g006
Table 1. Acquisition parameters for dataset.
Data Acquisition Details
ScannerTesla Siemens Trio Tim
No. of receiver Coils 8
Matrix 64 × 64
TR   ( ms ) 2000
TE   ( ms ) 30
FOV ( cm 2 ) 24 × 24
Slice thickness ( mm ) 4
Flip angle 90 0
Slice gap ( mm ) 0.4
Table 2. Outcomes of classification model with 50–50 training-testing data split.
Class TypeGroupActual Class
Predicted Class EpilepticHealthy Controls
Epileptic88(TP)10(FN)
Healthy Controls12(FP)70(TN)
Table 3. Comparison between different classification methods using different biomarkers.
Feature Set (Combination of Biomarkers)Classification Method
Proposed MethodZhang et al. [22]Correlation Method
Functional Connectivity Matrix (50 edges)77.31%73.2%69.5%
Functional Connectivity Matrix (400 edges) FC82.57%77.6%72.11%
Global Connectivity Asymmetry (GCA) 76.1%75.57%57.61%
Dissimilarity of Activity (DoA)76.6%76.6%76.6%
FC + GCA84.23%80.2%74.2%
FC + DoA87.78%81.46%74.6%

