DSP: Schema Design for Non-Relational Applications
by
 , ,
, ,
Abdullahi Abubakar Imam
1,2,*, 
Shuib Basri
1,
Rohiza Ahmad
1,
Amirudin A. Wahab
3,
María T. González-Aparicio
4,
Luiz Fernando Capretz
5,
Ammar K. Alazzawi
1 and
Abdullateef O. Balogun
1 1
Department of Computer and Information Science, Universiti Teknologi PETRONAS, Bandar Seri Iskandar 32610, Malaysia
2
Department of Computer Science, Faculty of Science, Ahmadu Bello University, Zaria 1044, Nigeria
3
Cybersecurity HQ Malaysia, Menara Cyber Axis, Jalan Impact, Cyberjaya 63000, Malaysia
4
Computing Department, University of Oviedo, 3, 33003 Gijon, Spain
5
Department of Electrical and Computer Engineering, Western University, London, ON N6A5B9, Canada
*
Author to whom correspondence should be addressed.
Symmetry 2020, 12(11), 1799; https://doi.org/10.3390/sym12111799
Submission received: 14 August 2020
/
Revised: 7 October 2020
/
Accepted: 12 October 2020
/
Published: 30 October 2020
(This article belongs to the Section Computer)
Abstract
:The way a database schema is designed has a high impact on its performance in relational databases, which are symmetric in nature. While the problem of schema optimization is even more significant for NoSQL (“Not only SQL”) databases, existing modeling tools for relational databases are inadequate for this asymmetric setting. As a result, NoSQL modelers rely on rules of thumb to model schemas that require a high level of competence. Several studies have been conducted to address this problem; however, they are either proprietary, symmetrical, relationally dependent or post-design assessment tools. In this study, a Dynamic Schema Proposition (DSP) model for NoSQL databases is proposed to handle the asymmetric nature of today’s data. This model aims to facilitate database design and improve its performance in relation to data availability. To achieve this, data modeling styles were aggregated and classified. Existing cardinality notations were empirically extended using synthetically generated queries. A binary integer formulation was used to guide the mapping of asymmetric entities from the application’s conceptual data model to a database schema. An experiment was conducted to evaluate the impact of the DSP model on NoSQL schema production and its performance. A profound improvement was observed in read/write query performance and schema production complexities. In this regard, DSP has significant potential to produce schemas that are capable of handling big data efficiently.
1. Introduction
With the rise of asymmetric data, there emerge new concerns about how data can be managed efficiently and effectively in a conventionally symmetric environment [1,2]. One of these concerns is the storage capability of the relational databases. This is because the inherent complexity, high access latency demand, and unpredictable nature of today’s data (i.e., big data) has rendered relational databases less capable due to their structural rigidity and untimely response [3,4,5,6,7]. Relational databases provide engines that provide central control of redundancy and data access patterns, enforce a schema, and eliminate inconsistencies [8]. This has led to the invention of a more flexible database called NoSQL (“Not only SQL”) to handle such complex asymmetric data. These types of databases do not require full knowledge of the target data at the initial stage of database design, because they are easily extendable, scalable, and can tolerate limitless partitions [9] (Section 2). The schemas of such databases are flexible and are enforced by client-side application developers rather than database engines, as in the case of relational databases [4,10]. This means, however, that the quality of NoSQL schema depends solely on the designers’ competence and professionalism [3,5,11,12,13,14].
As such, numerous techniques have been developed to aid designers in modeling NoSQL schemas properly [6,15]. However, existing modeling tools are inadequate for the NoSQL setting [11,16]. They are either proprietary [17,18], symmetrical [3,19,20], or post-development assessment tools [17,21,22]. As a result, NoSQL modelers rely on rules of thumb to model schemas that require a high level of competence [23]. In this study, a Dynamic Schema Proposition (DSP) model for NoSQL databases is proposed to handle the asymmetric nature of today’s data. This model aims to ease database design and improve its query performance. The model covers both the physical and logical stages of database designs. It consists of the following contributions:
- Design and development of a new model that takes into account both user and system requirements of NoSQL clients and proposes a NoSQL schema accordingly.
- Relationship classifications: mathematical formulas that calculate all relationship expectations and finally classify entities.
- Automatic prioritization of guidelines using a feedforward neural network concept.
- An algorithm that calculates parameters and maps entities based on relationship classifications.
- Accelerating incremental records view through bucketing as opposed to non-relational caching.
A small scale of DSP was originally introduced in an earlier article [24,25] as SPM. In this extended presentation, we focus on one impotent parameter (i.e., performance) and also describe how DSP supports a broader class of query complexities, like single-selectivity, drill-down, and rollup. We also include additional formulas to make the model more dynamic and accurate. These advancements have become necessary as data increase asymmetrically in size and complexity daily, thus necessitating dynamic modeling solutions for a more generic application [11,17,26,27].
The remainder of the paper is structured as follows. Section 2 presents an overview of the NoSQL databases. Section 3 discusses related works. Section 4 presents the proposed DSP model. Section 5 highlights the method adopted. Section 6 presents and discusses the results of our study. Finally, the conclusions and future direction are described in Section 7.
2. Overview of the NoSQL Databases
Not only SQL (NoSQL) databases are powerful databases created to handle big data that are asymmetric in nature. These databases differ from relational databases in many significant ways, such as their avoidance of rigid symmetric table structure and SQL as the only query language. In addition, joint operations are indirectly performed or not allowed in some cases. The Atomicity, Consistency, Isolation, and Durability (ACID) properties are not guaranteed. In contrast to traditional ACID, the NoSQL databases are based on semantics known as BASE (Basically Available, Soft state, Eventual consistency), which are rooted in the Consistency, Availability, and Partition-tolerance (CAP) theorem. In the context of read/write query performance of voluminous data, the Availability of the CAP theorem will be the focus in this study. It also important to note that NoSQL databases are scaled horizontally rather than vertically, as in the case of relational databases. These types of databases may be classified in many ways; however, the most significant factor for NoSQL classification is the data model, i.e., the way data is organized and stored [28]. The most common are key-value, document-store, column family, and graph databases [29,30]. In this research, we focus on document-stores for their popularity [27]. Although DSP was experimented with on this type of data model, it can also be used on the key-value data model with very limited adjustments.
3. Related Work
Numerous techniques and tools are available for solving related schema design issues in relational databases. These solutions organize collections of indexes, select an optimized version of them, and finally support workloads by materializing views [31,32,33,34,35,36,37,38]. However, as highlighted in Section 2 and Section 4, many important differences exist between NoSQL schema design and the relational schema design, which DSP addresses. Other solutions have emphasized partitioning relations vertically, either to identify covering indexes and offer some recommendations [39] or to classify relations and determine their physical representation [40,41]. Similarly, automatic partitioning and layout tools do exist for relational layout across servers [33,42] or storage devices [43,44]. DBDesigner [45] uses projections to physically represent tables used by Vertica [40] column-store, based on the incoming workloads. However, recommending single projection may not produce optimal solutions, especially when the effects of updates are not explicitly considered, as when DBDesigner limits its number of projections based on heuristics only.
Normally, physical designs of relation include identifying physical structures and their candidates, followed by candidates’ selections. DSP uses a slightly different approach. The order of the process is altered to start with the identification before the structural selection. This is to make DSP dynamic in producing structure, based on both old and new candidates. Some design tools for relational databases, including CORADD [46], CoPhy [47,48], and a technique used for physical design called C-Store [41], have communicated some steps that should be followed to choose good candidates. A binary integer program also was presented through a simple problem formulation by Papadomanolakis and Ailamaki [36]. This work was extended as CoPhy [38], which aims to reduce several trips to the relational query optimizer. In their work, queries are broken down into components that are analyzed independently. This approach has some sets of extendable constraints that may be utilized by DSP.
Our approach to the schema design problem has inherited some existing techniques from the relational schema design proposed by Peter Chen [49] and Gordon Everest [50]. In their approach, data should be modelled in only three different ways: one-to-one, one-to-many, and many-to-many. The authors produced these categories out of a desire to cover all possible data modeling options. However, this system was introduced before the emergence of big data with its numerous characteristics. In the late 1990s, a Unified Modeling Language (UML) was introduced by Dembczy [51], which was later improved by Rumbaugh et al. [52] to consolidate the data modeling symbols and notations invented by Peter Chen [49] and Gordon Everest [50]. They are harmonized into one standardized language, all for the purpose of visualization, construction, and documentation of the artifacts of software systems, and for business modeling of the non-software systems. UML uses mostly graphical notations to express the design of software projects. In our solution, these techniques are adopted out of necessity to minimize the learning curve of our extended cardinalities, which are produced as a result of the emergence of big data. The second technique DSP adopted owes an intellectual debt to Zola William [11], who initiated the idea of modeling classifications. In his view, whether entities are modelled together as one or separately has a significant effect on query performance. This is because, unlike in relational databases, queries make several trips to NoSQL databases for retrieving related data from different collections. In contrast, we found that schema optimization can be best started right from its time of creation [14]. Moreover, our solution added more new techniques, such as modeling guidelines, performance computations, and a schema generation algorithm (please refer to Section 4 for details).
Other solutions focus more on enhancing the performance of NoSQL through queries that are written against a conceptual model. For instance, instead of improving the structural design or mapping each query to a given set of physical structures, NoSE [1], which extends many features of GMAP [53], chooses a set of physical structures that are suitable for a given workload. In addition, ERQL [47] enhances the entity relationship diagram using a conceptual query language. This approach refers to a series of entities using the path expressions it has defined. Our query models, however, adopted the relational modeling structure as defined in Section 5.4. The performance of the physical structure that our approach recommends relies on the foundations of the structure rather than the queries. Our argument is that although NoSQL databases were originally designed to be flexible, the way the data is modeled has a significant correlation with its performance. This has also been argued by Bertino and Kim [46] where path indexes and nested indexes are introduced.
Michael et al. [22] presented a schema design in a similar way to our setting. They used a cost-driven approach to optimize the schema design. It analyzes the workloads and execution costs required to map the physical data model with the application data model. Like our method, this approach makes several decisions from vital inputs, such as entity types, indices, estimated number of each type, and estimated cardinality of each field. While in our approach, only the initial entities and their expected number of records are required, the DSP model handles the remaining schema design processes. As in our proposed solution, the cost-driven approach also does not consider modeling data in a more in-depth way using the new cardinalities and relations classifications.
Vertica [40] used a similar technique that resides only on the C-Store database [54]. It consists of an SQL interface that uses multiple encoding techniques to improve the query performance via views denormalizations. This approach is an extension of earlier work by Zodnik et al. [41] who initiated an automated schema design for C-Stores.
Conversely, the work of the Object Management Group [55,56,57] has scientifically proved that separating platform technologies from application logic can provide more generic models that can be applied on virtually any platform. As such, a Model Driven Architecture (MDA) was proposed. MDA provides guidelines for structuring software specifications that are expressed as models. MDA was utilized by [58,59,60] for different purposes, such as data collection and aggregation in a mobile context, controlling short- and long-term adaptive behavior, and modeling of a cataract intervention. While it is significant to make both the business and technical aspects of an application independent, it is equally imperative to make their relationship as efficient. DSP comes in here to provide optimal database designs that can handle requests from the application layer efficiently.
However, Atzeni et al. [61] believed that, instead of emphasizing more on separating the application logic from the platform technologies, as proposed by [55], a unified interface would play a better role, leaving both sections untouched. As such, Save Our Systems (SOS) was proposed by [61] as a common programming interface to the NoSQL systems. This system aims to map specific interfaces of the individual systems regardless of their individual differences; thus, interoperability. In a similar work conducted by Tan et al. [62], an interface known as Tempo was created for DBAs to have a simpler way of specifying performance objectives and optimize Resource Manager Configurations. This is to optimize job processing time allocations and make sure deadlines are not missed. As mentioned in the previous paragraph, DSP focus on the foundation layer of the NoSQL databases rather than the application or interface layers. DSP argues that the structure in which NoSQL databases are designed has a significant impact on its performance, especially with the presence of voluminous and highly diversified datasets (i.e., big data).
4. The DSP Model and Components
This section presents the proposed DSP model and the description of the proposed method. The section consists of the DSP model architecture and its associated components, such as the cardinalities notations, modeling classifications, and modeling guidelines; it also contains the DSP model algorithm (Algorithm 1) and the procedure that DSP follows to generate NoSQL schemas. At first, the DSP architecture is presented.
4.1. DSP Architecture
The architecture of the proposed DSP model is presented in Figure 1. There are seven phases or layers in the architecture, which are labeled with numbers from 1 to 7. Every layer consists of a process that relies on the outcome of its predecessor (previous layer).
As noted earlier, the following architecture (presented in Figure 1) is made up of seven interconnected layers: (1) command layer; (2) iteration layer; (3) parameter-values composition layer; (4) cardinality layer; (5) classification layer; (6) guidelines ranking layer; and (7) output layer. At the beginning (Layer 1), modelers are expected to supply values to the parameters and execute the command. These parameters are the choice of CRUD operations, list of parent entities, availability (which is a constant parameter), and expected number of records. It is important to note that the constant parameter (availability) is originally from the CAP theorem, which means more work is required on DSP before it can handle the remaining members of CAP theorem (i.e., Consistency and Partition-tolerance).
After the first layer command, the DSP model takes over the operational responsibility from Layer 2 to Layer 7. The engine of the model runs from Layer 4 to Layer 7. Within this engine, the semantic mappings of the logical model to the schema take place, including the calculations and selection of the appropriate entities, cardinalities, classifications, and guidelines. These are partly achieved through the use of modeling guidelines, relationship classifications, and new generation cardinalities, all of which are presented in the following sections.
4.2. Cardinality Notations
In modeling the NoSQL databases, the following new cardinalities are proposed, highlighted with the gray color background (Table 1).
Please note that (in Table 1) the original cardinalities are also included in the list without any highlighting. This is to indicate the progression in the area with respect to cardinality notations and their evolvement base. The table outlines the proposed cardinalities for NoSQL databases. These cardinalities are selected based on the classifications that are presented in the following section. It should be noted that the new cardinalities do not propose the elimination of the original cardinalities, rather complementing them in the big data world where data is highly voluminous. They contain an almost similar structure with the existing cardinalities; however, a new concept is provided in the new cardinalities, such as differentiating “few-records” from “billions-of-records” on the many side of a relationship as opposed to conventional cardinalities where both are considered “many”. This provides a more in-depth breakdown on data modeling possibilities for better performance.
4.3. Relationship Classifications
Data access patterns and the nature of applications’ data are considered the major indicators of whether or not entities should be modeled together or should be modeled separately or bucketed. These classifications (as presented in Table 2) possess unique qualities suitable for different situations.
The three relationship classifications are explained as follows using their applicable models.
4.3.1. Embedding
Embedding refers to inserting a child document into a parent document. There are two types of embedding, namely, one-way and two-way; both are computed using Equation (1).
where represents a parent document and represents a child document.
4.3.2. Referencing
Unlike embedding, referencing connects child entities to a parent entity using their unique identities. This class of relationship can be modeled as shown in Equation (2).
where represents a parent document and represents a child document. Both ids are interchanged.
4.3.3. Bucketing
Bucketing refers to the splitting of records of entities into manageable portions. It is situated between the flexibility of referencing and the rigidity of embedding and is modeled using Equation (3) as follows:
where denotes a parent document and represents a child document.
4.3.4. Embedding and Referencing
It is important to note that, although the modeling classifications are distinctly implemented, there is a high possibility of combining Embedding and Referencing, as modeled in Equation (4).
where represents a parent document and represents a child document. Both ids are interchanged in the case of referencing while child documents are directly attached to parents in the case of embedding. This type of classification may be required when document volatility is high, or a document relationship is more than one, among others.
4.4. Schema Proposition Guidelines
The model proposed in this paper adopts the guidelines as proposed by [70]. These guidelines (in Table 3) are helpful in prioritizing relationships.
While ranking the guidelines in Table 3, equal ranks are allowed to be given to more than one guideline. However, for each participant involved in the ranking process, a constraint of a total number of 276 (= 1 + 2 + 3 + 4 + … + 23) are expected. This is calculated using Equation (5). The assigned ranks were organized by guideline, leading to the results as presented in Table 3.
Referring to Table 3, the guidelines are ranked based on their availability requirement. As such, the total score values are considered to be the weight of each guideline.
Now, because the requirements are linearly separable, True (T) and False (F) are attached to each guideline and the OR Boolean is used to determine the combination, which will collectively be summed up as the input of our activation function. The activation function in DSP is a function that calculates the possibility of including or excluding a guideline from the list of applicable guidelines. The verdict ranges from 0 to 1, where 1 is fully accepted (True) or 0 fully rejected (False). The average value for consideration is 0.5. Any guideline that falls below the average is given low priority except when another guideline that depends on it is considered. In such cases, the weight of the two or more guidelines are put together and divided by their numbers to get the average. This is done using Equation (6).
where Av is the average value of each of the inter-dependent applicable guidelines and stands for guideline scores from 1 until n, and is the number of participating guidelines. When the Av value is 0.5 or higher, all the inter-dependent applicable guidelines are considered, otherwise the least scoring guideline is removed using Equation (7) and the remaining guidelines are recomputed again using Equation (6).
where is the function that extracts the guideline with the least value, and a limit of is set, such that at least one guideline is returned if the guidelines do not collectively add up to 0.5. The following algorithm explains the DSP logic.
4.5. DSP Algorithm
The brain of the DSP model follows the following algorithm (Algorithm 1) in order to perform its operations and produce the desired schema. In the following algorithm, the process of generating the NoSQL schema is demonstrated.
| Algorithm 1 DSP Algorithm | |
| Input: E = entities. ENR = Estimated number of records. EMB = Embedding, REF = Referencing, BUK = Bucketing. CRUD Operations Cr (C, R, U, D). Output: NoSQL Schema. Definitions: ≈ approximation, ≫ much less than. | |
| 1. | begin |
| 2. | variables (E(E + ENR), CRUD, i = 1) |
| 3. | ifE.|S| != : then |
| 4. | A ← Availability |
| 5. | Cr ← get preferred CRUD |
| 6. | while i < E.|S| do |
| 7. | ENR ← get ENR(E) |
| 8. | for each item in E do |
| 9. | if (Cr ≜ C||U) then |
| 10. | if ENR[i] ≈ ≫ 0 and ENR[i] ≈ ≪ 9! × 3 then |
| 11. | execute EMB; |
| 12. | else if ENR[i]: = ∞ || ENR[i] ≈ ≫ 11! × 2 then |
| 13. | execute REF; |
| 14. | end; |
| 15. | end; |
| 16. | if (Cr ≜ R) then |
| 17. | execute BUK; |
| 18. | for (j = 0; j <= ROUND (ENR/5! × 2); j++) |
| 19. | Tpg[j] = ROUND (ENR/5! × 2); |
| 20. | end; |
| 21. | foreach (range(Tpg) as pg) |
| 22. | Next = pg->Tpg; |
| 23. | end; |
| 24. | end; |
| 25. | end; |
| 26. | i+ = 1; |
| 27. | end; |
| 28. | else |
| 29. | return null; |
| 30. | end; |
The algorithm starts by accepting inputs such as entities and expected number of records. It then proceeds to the declaration of variables that are capable of holding the required values for schema design. The anticipated schema is thereafter produced as the output of the algorithm. It is important to note that the numbers of Line 10 and 11 are the approximate thresholds values for deciding which of the modeling classifications is suitable for modeling records that are ≈≪9! × 3 or ≈≫11! × 2. Such thresholds are also used for bucketing, which refers to the splitting of records of entities into manageable portions. These thresholds are experimentally established through the use of new cardinality notations as presented in Table 1 and the modeling classifications as shown in Table 2. The DSP model follows the following procedure to execute its processes.
4.6. DSP Model Procedure
In this section, the procedure that DSP follows to suggest a NoSQL schema is depicted and explained. There are three subsections in the procedure, as shown in Figure 2; each is explained in its separate section.
Initially, the main DSP procedure flow is presented, through which all other subsections are referenced during the schema production processes. Each process in the DSP main procedure (Figure 2a) makes a call to a separate figure to perform a unique responsibility and return back a desired result. This is indicated, for example, in Figure 3, which directly refers to the corresponding branch of the main process.
Figure 2a provides the overview of the main activities that DSP follows to produce a desired schema. After starting the process, the purpose of the first operation is to supply the required values to the available parameters. These values are the primary expected entities as well as their expected number of records. The second set of values that are expected at this stage are the CRUD operations, i.e., Create, Read, Update, and Delete (CRUD). The next step is the computation and the preparation of all the DSP-dependent components. Finally, all of the prepared components are calculated and mapped, and they continue to generate the desired schema. Each of the aforementioned activities is further depicted and explained in the following subsections.
4.6.1. Requirements Selection
The first step of the schema generation process is to retrieve all the necessary schema construction requirements. These requirements (values) are either selectable values or supplementary values (project peculiar requirements), as indicated in the first activity of Figure 2b.
After providing either the list or number of entities, each entity in the list is expected to have its estimated number of records that will be considered when establishing a relation between entities, whether it will be referencing or embedding, as highlighted in Section 4.3. This is, however, not meant to be static as depicted and explained in Section 4.2.
The thresholds of the ENR values are described and used in the DSP algorithm (Section 4.5). The CRUD operations and system requirements (Availability) are also selected based on the ENR values provided. All these values are mapped and saved for later retrieval during schema generation.
4.6.2. Requirements Computation
After all requirements are selected as inputs, the guidelines, as presented in Section 4.4, are aligned with the selected requirements, after which initial weights and biases are assigned for guideline inclusivity computations (please see Figure 3).
The result of this process (as shown in Figure 3) would be an integer value (usually a large number) that is suppressed to a value between 0 and 1 inclusive. A guideline is dropped if it scores less than 0.5; however, if another guideline scores > 0.5 and is dependent on the guideline that has been dropped, a further computation is considered for possible inclusion. If there is no guideline that depends on the dropped guideline, an alternative, more capable guideline is retrieved and evaluated using the same procedure.
4.6.3. Calculate Availability
Availability (i.e., read/write performance) is the major target area for improvement in this research. As such, Figure 4 describes the process of performing availability-related computations. In each step of this process (as shown in Figure 4), the three classifications are given equal integration opportunities. However, a suitable classification is only implemented based on the computations performed in Figure 3 and Figure 4.
For the availability computations, the expected number of records (ENR) plays a very significant role alongside Create, Read (C, R) of the CRUD operations. Small, mid, and large parameters contain different data sizes, as experimentally defined, while preliminary assessing the new cardinality notations and their associated modeling classifications.
Small, medium, and large parameters contain different data sizes, as experimentally defined, while a preliminary assessment of the new cardinality notations and their associated modeling classifications is carried out. Next, the method that was used to apply and evaluate DSP is explained.
5. Method: Pilot Application and Evaluation Description
This section presents the approaches taken to produce, implement, and experiment with the proposed Dynamic Schema Proposition (DSP) model as well as its associated components. Other subsections include the experimental and analytical procedures.
5.1. Datasets
In this study, four different datasets are used, of which three are produced by industry experts. All the datasets have the same format, as depicted in Figure 5.
Figure 5 shows a sample dataset that was generated using the DSP model as well as the industry experts within our network. These experts have an average of nine years system development experience in various areas of databases, which includes data migration from relational to NoSQL databases, data modeling, system designs, etc.
Since one of the ways to test a system is through its product [3,71], we generated schemas using the same requirements as used by all the participating experts. This is to enable us to test and compare the performances of all the schemas without discrimination or bias.
It is important to note that the DSP model does not discriminate between data structures or formats, rather, it studies the data structure and develop schemas that can improve data availability when performing CRUD operations. This is achieved using the new cardinalities as proposed in Section 4.2, classifications offered in Section 4.3, and also the modeling guidelines that are presented in Section 4.4.
In general, the datasets are nothing but the daily routine records that are generated from small, medium, or large systems, and include common information such as name, id, title, age, gender, paragraph, or bunch of texts, etc. The following section explains how we fused these datasets together.
5.2. Prototype Building Using the Datasets
The datasets, as explained in the previous section, are integrated into a prototype system. The following architecture (Figure 6) describes the system. It was used to execute the read/write query experiments [72]. The components of the system include the NoSQL repositories containing all the participating datasets, the graphical user interface (GUI), and the data processing unit.
The four datasets that are stored in the NoSQL repositories have two optional access points, as shown in Figure 6. The first one is accessed through the MapReduce framework, while the second is accessed through JDBC drivers. Both the two access points can be used to assess the read/write query performance (availability).
In this research, both data access points are adopted. However, since the scope of this research is not a comparison between the access points, both the access points are used, and their results are merged and categorized based on the query models as presented in Table 4. Although each access point has a separate cost analysis model, our target is to improve the schema design regardless of which access point is used. Therefore, analyzing both at the same time justifiably shows, generally, which schema is better than the other.
5.3. Experimental Setup
Before the actual DSP model was developed, this research work began with a preliminary analysis experiment. The aim of this preliminary experiment was to identify which of the relational database cardinalities can be used for the non-relational databases and which of them require more in-depth breakdown. A single machine with the following configurations was used to conduct the experiment: running on the Ubuntu OS 12.0.4 (LINUX), CPU of 8 cores, 32 GB RAM, Ethernet card with 1 GB bandwidth, and 1 terabyte HDD. Datasets with sizes of 1 GB, 500 MB, 300 MB, 100 MB, and 10 MB were loaded into a mini prototype system. Synthetically generated queries were run to assess all cardinalities in relation to different levels of data sizes as mentioned earlier. These preliminary experiments yielded the need to further break down the existing cardinalities and provide modeling guidelines that resulted in the DSP.
Subsequently, two main experimental environments were setup to evaluate the DSP model: (1) using the Hadoop-2.7.2-stable platform where a cluster with five nodes was prepared, four of which are DataNodes (slaves), to house the four datasets in MongoDB (version 4.2.0), while the remaining one acts as master (NameNode). All these nodes have the following configurations: running on the Ubuntu OS 12.0.4 (LINUX), CPU of 8 cores, 32 GB RAM, Ethernet card with 1 GB bandwidth, and 1 terabyte HDD; and (2) using a webpage that connects to MongoDB (version 4.2.0) through MongoDB ODBC Driver for Mac V18 (version: 18.0.6894). The system configuration for the second experimental environment is the same as the first.
5.4. The Test Queries
The queries used in the experiment utilized two different combinations of CRUD operations (queries). The two combinations are (1) Create and Read; and (2) Create and Update. These have adopted the following models:
where r represents a relation and relational algebra expression represented as E.
where r is the relation, and σ is the select command. is the query-control from limit 1 to limit n that are joined by .
Each Fn is either the nth attribute of r, if the nth attribute is not updated, or, to be updated, the Fn attribute involving only constants.
where r represents a relation or the entity, while the relational algebra expression is represented as E.
Equations (8)–(11) are used to construct the query models as presented in Table 4. The queries are further classified into three types: selectivity, drill-down, and roll-up. This means each classification will contain several queries to test the schema capabilities. Table 4 presents the corresponding models for the three types of queries.
In the models shown in Table 4, we use Δ to denote the limit of numbers, like number of comments or likes in a particular post, and Φ to denote the interval of query executions between nodes. Some models are applicable to Create while others are applicable to Read and Update queries. Accordingly, the aim of the single selectivity is to retrieve data that falls within one indexed data collection. While in drill-down query, a subset of data of one indexed collection is queried. Finally, the rollup query involves querying multiple indexed collections.
5.5. The Experimental Procedure
The experiment involved the implementation of all four participating datasets (schemas), as explained in Section 5.1, as well as the running of the queries that adopted the models, as presented in Table 4. The sizes of the dataset were on average the same (±1 MB) and came in multiple files within the collections. A function db.collection.totalSize () was used to make sure the content of each dataset was within ±1 MB. The queries were run to test the performance of all the participating schemas.
The selectivity percentages of insert queries were different from the select and update query operations. With the insert query operation, all the records that are available are inserted into the NoSQL databases across the participating nodes, while some percentage of them is selected (as for select query operation) and updated (for update query operation) on different conditions of query complexities. Table 5 shows the summary of the distribution of the records across the three categories of queries.
For each of the records above, a query is run to insert, retrieve, or update part of the records. Each query has a starting and end time and other resources to consider when comparing with another. As such, the following section explains the cost analysis models that are adopted to calculate the returning values as well as the starting and end time of each query.
5.6. Cost Analysis Models
This section presents the models that are adopted to calculate the execution runtime (ERT) of each of the read/write operations performed on all the participating schemas. The testing of availability is performed using two different approaches, namely MapReduce and JDBC deriver. The architecture (Figure 6) describes a complete system that was followed during the read/write query experiments [72].
The two availability evaluation approaches are related as represented in Figure 6. Both the approaches start by sending a query through graphical user interface. By using the MapReduce approach, the data processing framework processes the query and then passes it to any of the selected/active datasets. In the second approach (through JDBC drivers), the query is processed using the wrapper and then passed to NoSQL through the JDBC driver. Each of these two approaches is further explained using their applicable cost analysis models as follows.
5.6.1. MapReduce Cost Model Analysis
The cost analysis model proposed by Wang and Wang [73], as shown in Equation (12), was adapted to calculate the ERT of each read/write operation performed, thus testing availability (i.e., A of the CAP theorem). In the equation, the RT for the input data N can be calculated by summing up all TMaps and TReduceMarge processes that are commonly executed by the Hadoop and other NoSQL databases during the query processing life time.
is the time taken for all map processes to complete and is the time taken by the reduce phase to complete merging the results.
It can be observed that, for the reduce phase, the time considered is only that of the merging of the key-value emitted by the map phase, even though the reduce phase comprises other sub-processes, such as copy, sort, and merge. This is due to the fact that the reduce phase does the copying and sorting in parallel with the map phase and only begins the merging when all maps are completed [73]. Equation (13) shows the formula used to calculate of Equation (12).
From the equation, is the time taken by a single map process to be completed. TMapDelay denotes the time between the completion of one map job and the assigning of another job. is the total number of maps processed and denotes the parallel degree of maps. This calculation can be further described, as shown in Figure 7.
The cost analysis model as presented in Equations (12) and (13) are used to calculate the availability for the first approach (MapReduce approach as shown in Figure 6). This analysis pass through a process as depicted in Figure 7, where the first layer is defined as the input that receives the data to be analyzed, process layer, and finally produced results in the output layer.
The following section describes the cost analysis models for the second approach (JDBC driver).
5.6.2. Hypercube Topology and Gaian Topology Cost Model Analysis
The second ETR calculation was done through the wrapper and JDBC driver. Unlike the first approach, where only the MapReduce framework is involved, this approach includes many other factors, such as the JDBC driver, APIs, wrapper, network, etc. [74]. As such, two related cost analysis models (Hypercube topology and Gaian topology) are used in this approach.
Let:
- N be the number of nodes in the network, and
- LTx be proportion of fragments of the Logical document collection named X, and
- PLN be the average path length in a network with N nodes, and
- SLL be the size of a logical document lookup message and response (per network step), and
- SQ be the size of a query message and standard (no data) response, and
- SQR be the size of data results per logical document fragment.
Using the above-defined variables, the cost models work as follows:
- (a)
- Hypercube topology with Content Addressable Network (CAN):where is the query type and is the cost model, like hypercube CAN in this case. Further computations can be explained as
- the cost of logical document lookup in a CAN is PLN * SLL, and
- the cost of sending the query to the specific locations with that logical document is N * LTx * PLN * SQ, and
- the cost of retrieving results is PLN * SQR * N * LTx.
- (b)
- Gaian topology cost analysis model:where is the query type and is the cost model, like Gaian in this case. Further computations can be explained as
- the cost of sending the query to all nodes is 2 * N * SQ, and
- the cost of retrieving results is PLN * N * LTx * SQR.
In the following section, results from the aforementioned experiment and analysis are presented and discussed.
6. Results and Discussion
The main target of the DSP model is to improve the read/write performance of the NoSQL databases. Hence, a low execution runtime on Create, Read and Update query operations is the major determinant for meeting the target or otherwise. Therefore, in order to evaluate the impact of the DSP model, a query execution runtime of its schema was compared against the schemas produced by industry experts who hold a minimum of nine years working experience. The DSP model itself is then compared against formal schema generation methods on parameters such as reusability, extendibility, understandability, creation time, requirement integration, etc. All the query processing approaches were created using the query models presented in Table 4 and were run using the three query types, namely single selectivity, drill-down, and rollup. The datasets (schemas) used here are also presented in Section 5.1. At the outset, the preliminary results that guided the development of the DSP model are put forward.
6.1. Preliminary Analysis Results on DSP Foundations
In an attempt to determine a suitable structure and compatible components that can serve as the foundation upon which the proposed DSP will be built, a preliminary analysis of the existing cardinality notations was carried out. This has led us to propose new cardinality notations and modeling classifications that are suitable for a big data setting (please see Section 4.2 and Section 4.3). The main aim here is to clearly demonstrate whether or not there is need for a more in-depth breakdown of the existing cardinalities.
At first, the one-to-many relationship is further classified into one-to-few (1:F), one-to-many (1:M), and one-to-squillion (1:S). These cardinalities were tested and assessed. Each query was run three times on each dataset size for a particular cardinality, after which the average of the three trials was taken while reporting the discrepancies in the graph (error bars). The following sections describe the performance of each cardinality in different data size conditions
As can be observed from Figure 8a, each of the cardinalities (1:F, 1:M, and 1:S) exhibits a unique behavior across data sizes. At the earliest stage, 1:F performs better than 1:M, and 1:S with an average interval of around 700 ms at the 300 MB data point and below; the strength of 1:M ranges from the 400 MB to 800 MB data sizes. However, as data size reach around 900 MB and above, 1:S consistently proves to be the most suitable cardinality for a very large dataset. These differences arose as a result of applying the new modeling classifications as proposed in Table 2 on each of the cardinalities. In addition to the read operations, performance analysis was also conducted on the write operation, the results of which are presented in Figure 8b.
Unlike in the read operations, write operations take more time across the three tested cardinalities. However, in write operations, a similar pattern of performance between the cardinalities is observed as in the read operations. According to Figure 8b, a 400 MB data size and below is best modeled as 1:F, while a data size above 800 MB is best modeled as 1:S. Moreover, the strength of 1:M lies in-between 1:F and 1:S. This shows that performances of the write operations strongly agree with those of the read operations.
Secondly, performance analysis was conducted to assess the many-to-many (M:N) cardinality. At first the surrogate associates, such as F:F and S:S, are created to compliment the M:N relationship modeling for more in depth analysis. Their performances are assessed during the read and write operations as conducted in the previous experiment (Figure 8a,b). The results of the read operations on M:N cardinality and its competing associates are presented in Figure 8c.
It is implied from Figure 8c that the F:F cardinality performs significantly better at around the 450 MB data size and below as compared with M:N and S:S. This cardinality, however, performs very poorly as data size increases by 200 MB, with an average increment of 500 ms. On the other hand, as the data size reaches 500 MB, M:N cardinality takes over as being the most suitable model, but at around 900 MB its performance begins to drastically decrease as compared to S:S, which performs very poorly at the beginning of the graph (between 1 MB to 1000 MB), but then as the data size becomes very large, it turns out to be more suitable than its counterparts. It can be clearly seen that S:S has a very stable performance, with a considerably lower increment in time despite the massive increase in the data sizes, especially at 700 MB and above.
Furthermore, the performance of F:F, M:N, and S:S on the write operations were assessed equally. This is to support the decision of adopting a more in-depth breakdown of M:N cardinality in the big data setting. The results of the write operations F:F, M:N, and S:S are presented in Figure 8d and discussed as follows.
It is observed that the findings presented in Figure 8d strongly support the results of the read operations, as shown in Figure 8c. This indicates that the F:F cardinality still performs better at around the 460 MB data size and below as compared with M:N and S:S. This cardinality, however, performs weakly as the data size increases by 200 MB, with an average increment of 500–600 ms. Alternatively, as the data size reaches about 500 MB, the M:N cardinality becomes the most suitable adoptable model for the task, but at around 900 MB its performance begins to drastically decline as compared to S:S, which performs very poorly at the beginning of the graph (between 1 MB to 1000 MB); but, as the data size reaches levels over 1000 MB, it turns out to be more suitable than its counterparts. Again, it can be clearly seen that S:S has a very stable performance during the write operations, with a considerably lower increment in time, despite the massive increase in the data sizes, especially at 500 MB and above.
The aforementioned preliminary experiments were analyzed using the ANOVA statistical tool. The F values obtained are 0.2811 and 0.3707 for the read and write operations, respectively, on 1:F, 1:M, and 1:S; the F values for the read and write operations of F:F, M:N, and S:S are 8.1457 and 5.7503. Having F values bigger than the critical value of 3.682 clearly show that there is a need for more in depth cardinality notations that are suitable for big data storage settings. All cardinalities are presented in Section 4.2.
6.2. Schema Performance: Evaluation of DSP Schema against Formal Methods Schemas
In order to evaluate the performance of the DSP-based schema, three different experts were engaged in the production of similar schemas using the same case study. These experts have a minimum of nine years database design and modeling experience. The schemas they produced, alongside the DSP-based schema, were then implemented in different nodes with the same system specifications for performances testing (Section 5.2).
At first, the read/write performance of the DSP based schema was compared to other schemas produced by experts of the NoSQL databases. The testing was performed using queries that were generated through the query models presented in Table 4. The generated queries were classified as Create operation queries and Update operation queries. Experiments on each of these classifications were performed separately. The results are analyzed and reported in the following sections.
6.2.1. Scenario 1: Create Operation
In this section, the queries (as presented in Table 4) are executed under different conditions of data sizes and query complexities, such as single-selectivity, drill-down, and rollup. The Create operation results are presented as follows.
The first query in Table 4 is single selectivity. This type of query focuses on records insertion of one large file in a single collection. The documents that are enclosed therein do not have many branches that will complicate the writing process. As such, parallelism in records creation is permitted at this level because there are minimal entity dependencies in the collection. As a result, the difference in the write performance is insignificant, as shown in Figure 9, unlike in the subsequent queries (Figure 10 and Figure 11) where much more complex queries are implemented. These results (in Figure 9) are further described as presented in Table 6 below. This is to clearly show the gaps in numbers that exist between the participating schemas, including the schema generated by the DSP model.
These results (as presented in Table 6) are expected because the size of the file under consideration is in megabytes and contains less dependencies, thereby having minimal impact on the new cardinalities. In the subsequent experiment, however, a significant gap is noticed between the participating cardinalities. In this experiment a more complex query (drill-down) is executed.
The drill-down query has proven different results. Unlike the competing schemas, the results of the DSP-based schema show steady incremental increases in execution runtimes across all data sizes (see Figure 10). Others, such as Expert1 and Expert2 schemas, perform below average right from the beginning (20 GB) and fluctuate as the data size increases. The Expert3 schema is left behind under these conditions with around 1700 s at Position 1 (20 GB) and it then rises steeply from Position 2 (50 GB) onward, with an average increment of 55 s. Table 7 shows the row data of this experiment.
Referring to Table 7, it can be observed that the DSP schema performs better as compared to the Expert1, Expert2, and Expert3 schemas, regardless of the data size increment across data points. This consistent increment can be seen continuously in the category of rollup query complexity, as depicted in Figure 11 below.
As noted in the previous results (drill-down), more distinctive output is observed as query complexity increases (rollup). In Figure 11, a clearer gap is noticed between the DSP schema and Expert1 and Expert2, with an average interval of around 720 s. Moreover, unlike the interval between the Expert1 and Expert2 schemas, which is around 300 s, the Expert3 schema performed very poorly with a kick-off time of around 4630 s and continues to increase with an average increment of 200 s as the data size increases. The gap between the Expert3 schema and DSP schema is around 1600 s, making the Expert3 schema the lowest performing schema in the list of the four competing schemas.
Although a dramatic gap is observed between the schemas produced by Expert2 and Expert3 in Table 8, the intervals across the earlier experiments have been consistent on average, which further supports the evidence that the Expert3 schema is consistently slower across the data points and the DSP schema is steadily faster.
In the following section, the data that is loaded into the nodes in the earlier experiments will now be queried out. This is to perform the Read operation analysis as an opposite of the Create operation. All experiments will be analyzed at the end of this section.
6.2.2. Scenario 2: Read Operation
Unlike in the previous section where the Create queries are loaded with data and executed, this section presents the results of the Read operations. This is to say the Read operation focuses on retrieving data that have already settled in all the databases. As conducted in Scenario 1, the Read queries are also executed under different data-size conditions and different query complexities.
As can be observed from Figure 12, the Read performance of Expert1 and Expert3 schemas are generally slower than the Expert2 and DSP-based schemas across all data points (20 GB–1 TB).
However, as the data size reached around 700 GB, the performances of all schemas began to deteriorate, except for the DSP-based schema that maintained a steady increment despite the increase in the data size, as shown in Table 9.
Moreover, according to the analysis of variance, the F value obtained for this test is 147.01, which is far greater than the critical value of 3.1. This indicates a massive difference between the DSP-based and Expert2 schemas on the one hand and other competing schemas (Expert1 and Expert3) on the other hand on the single-selectivity query of the Read operation. While, in the drill-down query, the difference is even more significant, as shown in Figure 13.
The difference between the DSP-based schema against other participating schemas begins to be more significant as query complexity increases. The performance of the DSP schema started at around 335 s on the 20 GB data point and continued with a minimal (10 s) increment across all data points. However, this is not the case for the Expert1 and Expert2 datasets, whose starting point is around 2500 s and 1400 s, respectively, and continued with a similar increment as in the DSP-based schema. Furthermore, the worst performance recorded for this test is on the Expert3 schema, which is slower than all the schemas across data points with an average increment of ×4 at the early stage and ×6 at later stages (500 GB and above). Table 10 shows the row data in seconds.
In Figure 13, six different trails are performed, as presented in Table 10. However, in this case, the average row data are presented for a more detailed comparisons between the DSP-based, Expert1, Expert2, and Expert3 schemas.
Analysis of variance was performed to assess the significance level of the differences as discussed earlier on drilldown query complexity; the F value obtained for this test is 346.68, which is significantly greater than the critical value of 3.09. This has shown that the difference between the DSP-based schema and other competing schemas is significant on drill-down query complexity of the Read operation.
For the Read operation, the drill-down query model is divided into two. Query number two, as presented earlier, and query number three (Figure 14). Query number three makes more trips to the database in search of related and dependent data than query number two. In this type of query, the gap between the schemas produced by Expert1, Expert2, and Expert3 are the same on average (around 1000 s), having the Expert2 schema leading the group with initial results of 2520 s. These results continue to increase with an average of 20 s across all data points as shown in Figure 14. As for the DSP-based schema, the increment between the starting and the end point was very low (around 11 s). This adds to its dramatic performance improvement as compared with its counterparts. Table 11 presents the row results of this type of experiment (Read operations) for query number three under drill-down query complexity.
In addition, an analysis was performed to ascertain the differences between the participating schemas in this type of query using the ANOVA statistical tool. The F value obtained for this test is 112.39. This value is bigger than the critical value of 3.09, which again emphasized the significance of the new cardinality notations and styles that are embedded in the DSP-based schema.
In the final experiment under this category, a much more complex query (rollup) was tested against all the participating schemas on Read operations. Again, generally, the performance of the DSP-based schema is significantly faster than all its counterparts as depicted in Figure 15. It started at around 2250 s and worked its way up with minimal increments in seconds, despite the large increment in the data sizes. This is not the case with the Expert1, Expert2, and Expert3 schemas; they all started and ended poorly as compared with the DSP-based schema in this category. The average interval between the DSP-based schema and its counterparts is around 3200 s across all data points, which is much bigger than the simpler queries presented earlier. Table 12 shows the exact values of each test for this type of query.
Furthermore, the analysis of variance test was performed on the results presented in Table 12. The test produced the F value of 45.11, which was compared against the critical value of 3.1. This indicates that the DSP-based schema performs significantly better than its counterparts on rollup query of the Read operation.
6.3. Schema Generation: Evaluation of DSP Model Process against Formal Methods
In this section, the performance of the proposed model (DSP) itself is tested on imperative variables such as time taken to generate the schema and production complexities. These variables are examined by comparing the DSP model and experts’ production. As such, the time taken to produce schema by the DSP model is analyzed against Expert1, Expert2, and Expert3 as follows.
It can be observed from Figure 16 that there is a big gap between the DSP model and formal methods in the time taken to produce schemas. While the DSP Model took only around 1120 s to complete its schema production assignment, formal methods take as long as 59,400 s, 92,520 s, and 69,480 s for Expert1, Expert2, and Expert3, respectively. This significant margin (in terms of speed) is as a result of the automation of the entire process of schema generation by the DSP model. The proposed model accepts a few requirements as parameters from the modeler and automatically generates the desired schema (please see schema production process in Section 4.6). The manual implementation of all the processes explained in Section 4.6 would be not only difficult and cumbersome, but naturally erroneous due to human involvement, depending on the modeler’s level of expertise.
The data generated from the schema production experiment was subjected to analysis using an analysis of variance (ANOVA). In this analysis, the F value obtained is 3,025,280,364.5 for schema production. This indicates that the F value is greater than CV of 3.09 in all the trials. This supports the notion of DSP functioning better in terms of schema production time.
In addition to schema production time, the DSP model is further evaluated on schema-complexity against formal methods. This complexity is classified into different categories, such as number of redo’s per document and per collection (as shown in Figure 17), full requirements integration, understandability, reusability, and extendibility (as presented in Figure 18).
The schema complexity comparison was conducted in a different context. At first, the DSP model was evaluated against formal methods on the number of redo’s per document and per collection. This experiment was conducted during the schema production where a digit 1 is recorded if any document or collection is revisited after the first design. It was observed that around 420, 300, and 610 documents were revisited by Expert1, Expert2, and Expert3, respectively. Moreover, around 7, 12, and 17 collections were revisited by Expert1, Expert2, and Expert3, respectively, as shown in Figure 17a,b. However, none of the documents or collections was revisited by the DSP model.
Like any other system, database design and modeling require the system and user requirements to be collected and translated. In Figure 18a, the requirement integration results are presented. A scale of 0–5 was used as the ranking measurement (0 = no integration and 5 = full integration). Expert3 has the least (1 out of 5) coverage of the target requirements while the DSP model has the most coverage (4 out of 5).
Understandability is one of the most important factors that determines the level of complexity. This is because it is only when a schema is understood that other activities such as possible extension or integration can take place. In Figure 18b, the understandability results of DSP model and formal methods are presented. A scale of 0–5 was used as a ranking measurement (0 = not-understandable and 5 = Highly-Understandable). Expert1 and Expert3 have the least understandable schemas with a scale of 1 each, while Expert2 schema scored up to 3 out of 5. However, the schema produced by DSP model has the highest level of understanding (4 out of 5), as indicated in Figure 18b.
The reusability of the schema indicates the possibility of duplicating the produced schema in a similar organizational setting. Using a similar scaling system as in the previous paragraph, the DSP model schema has proven to be the most reusable schema, having scored 5 out 5 (as shown in Figure 18c). This is because the changing requirements in the produced schema result in the need to adjust only a few parameters, while rigorous scrutiny of all documents within a collection is required for other competing schemas.
Extendibility means that a schema can be easily extended to incorporate additional requirements without having to redesign the entire schema or adjust any of its sections. Using the same scaling system, all the competing schemas score 1 out 5, which means they are virtually not extendable, or that extensions require manual alterations of the existing schema. While the DSP-based schema was able to score 4 out 5 (please see Figure 18d). This high score obtained by the DSP schema emerges as a result of automation in the requirements selection process. In DSP, extending schemas due to the additional requirements only means increasing the list of parameters and rerun.
The data generated from the six complexity experiments are subjected to analysis using the chi-square statistical (Ch2) tool. A p-value approach was used to determine whether or not the difference is significant enough to make conclusions. Not significant was defined as p-value ≤ α value (0.05). The p-values obtained for No-of-redo’s per document, No-of-redo’s per collection, requirements-integration, understandability, reusability, and extendibility are 0.014, 0.032, 0.132778358, 0.065789053, 0.283886131, and 0.020344999 for the schema complexity testing. This has indicated, based on Ch2, that the schema produced by the DSP model is more reusable, extendible, and understandable than its counterparts. It is also more capable of incorporating a greater coverage of requirements as well as eliminating the number of redo’s per document/collection. Therefore, the perception of the DSP model being better than its counterpart is retained, since the average p-value (0.045640402) for both scenarios is less than the significance level (α = 0.05).
6.4. Discussion
In this section, the findings of this research in relation to the proposed DSP model and its competitors are discussed. Prior to the development of the DSP model, a preliminary experiment was conducted to assess the existing cardinality notations in a big data setting. It was observed that the existing cardinalities used in the traditional databases do not fit the NoSQL databases and therefore necessitate a more in-depth breakdown of the cardinalities as well as introducing new modeling classifications for better read/write performance. The results obtained from this experiment are used to guide the construction of the proposed DSP model.
The DSP model was evaluated alongside three other competing schemas. The comparison was between DSP and schemas produced by three different experts. This comparison was based on read/write query performance of the NoSQL databases. Moreover, other imperative variables like schema reusability, extendibility, understandability, etc., were also considered in the evaluation process. The results of the experiment indicate the following.
The new cardinality notations and modeling classifications proposed in our earlier study and utilized in this study have made a significant contribution to the read/write performance of the NoSQL databases. This is proven by the results obtained and presented in Section 6.1 and Section 6.2 when the DSP-based schema is compared with the schemas developed by industry experts for the purpose of this experiment. In this comparison, the DSP-based schema surpasses its counterparts with approximately a 75% increment in the read/write query speed.
In addition, supporting the NoSQL modelers with modeling guidelines has been proven to be more important than assisting traditional database modelers. This is because of the high-flexibility of the NoSQL database and lack of standards and engines to enforce schemas, and as a result, the quality of the modeled schema stays in the hands of novice modelers. Results from the experiments presented in the previous sections have shown that when modelers are guided using the 23 empirically developed guidelines, the quality of database design improves significantly in terms of read/write performance.
On the other hand, the schema production process was also assessed between the DSP model and formal methods. The results of this experiment show that the DSP model takes only around 1120 s to produce the desired schema, while it takes days to produce the same schema using formal methods. In addition to schema production time, an experiment was also conducted to assess the schema complexities in terms of reusability, extendibility, understandability, etc. It is observed that the DSP-based schema is more reusable, extendible, and understandable. It is also able to incorporate, on average, all the user and system requirements. Furthermore, the DSP model does not repeat or revisit any document or collection after its completion, while other competing experts had to revisit the modeled documents around 600 times on average for the given case study. Collections are usually revisited to correct erroneous implementations, improve design performance, and improve synergy between the collaborative collections. These and many other possibilities are experimentally calculated, classified, and integrated into the DSP model, which eliminates re-visitations of documents after the schema production.
To further improve the accuracy in the schema production, several algorithms and mathematical models are produced. This is to make sure that the replication of the schemas produced by the Dynamic Schema Proposition model is as accurate as possible, making it compatible and applicable in almost all the big data settings. Formulas, such as relationship classifications (presented in Section 4.3), are invented to always calculate the compatibility of each cardinality with relationship classifications, such that a unique response is applied in the appropriate location.
In general, the proposed DSP-based schema not only proves to be better in terms of read/write performance on the schemas produced by experts, but also show remarkable improvements on other schema generation aspects. It has proven its capabilities in quick schema production without having to redo/revisit collections after completing the development of schemas. It has also been shown to be more extendible, reusable, and understandable in addition to being better at integrating the user and system requirements. These findings have clearly shown that the proposed model is ideal for schema generations in the big data storage setting.
7. Conclusions
Because the way a database schema is designed has a high impact on its performance, a Dynamic Schema Proposition (DSP) model for NoSQL databases is proposed in this study. This research was motivated by the fact that erroneous design and implementation problems have become rampant in the area of NoSQL database design. This is because of the flexibility offered by the NoSQL databases. The lack of design-aiding tools in NoSQL, as they are in relational databases, has forced designers to rely on rule of thumb to model NoSQL databases that require a high level of competence. Therefore, the proposed model aims at easing the database design process and improving its read/write performance. The model covers both physical and logical stages of database designs. An experimental approach was adopted to achieve this goal.
The results have shown that the proposed DSP model is significantly better than its counterparts in terms of read/write performance when compared with the schemas produced by industry experts. This is confirmed using analysis of variance (ANOVA), where an average F value of 74.10 and 162.80 was derived for the create and read operations, respectively, which are greater than the critical value of 3.09. DSP has also shown remarkable improvements on schema generation aspects such as quick schema production, without having to redo/revisit collections after completion. The DSP model has again revealed itself to be more extendible, reusable, and understandable in addition to being better in covering the user and system requirements integration than its counterparts. This is also confirmed using Chi2 analysis where an average p-value of 0.045640402 was generated for the schema complexity testing, which is less than the alpha value (≤α). In the future, we hope to make DSP more general and compatible to all the available data models of the NoSQL databases. We also intend to cover the remaining CAP theorem variables, namely, consistency and partition-tolerance, in addition to availability that is covered in this research.
Author Contributions
Conceptualization, A.A.I. and S.B.; methodology, A.A.I., S.B., R.A., M.T.G.-A. and L.F.C.; software, A.A.I., A.K.A. and A.A.W.; validation, M.T.G.-A., A.A.I. and S.B.; formal analysis, R.A., A.A.I. and A.O.B.; investigation, A.A.I., L.F.C. and S.B.; resources, A.A.W. and M.T.G.-A.; data curation, A.A.I., S.B., R.A. and L.F.C.; writing—original draft preparation, A.A.I. and R.A.; writing—review and editing, A.O.B., A.K.A., A.A.I. and L.F.C.; visualization, M.T.G.-A., L.F.C. and S.B.; supervision, S.B., R.A. and M.T.G.-A.; project administration, S.B.; funding acquisition, S.B. All authors have read and agreed to the published version of the manuscript.
Funding
This research received no external funding.
Acknowledgments
This paper/research was fully supported by Ministry of Higher Education Malaysia, under the Fundamental Research Grant Scheme (FRGS) with Ref. No. FRGS/1/2018/ICT04/UTP/02/4 and Yayasan Universiti Teknologi PETRONAS (YUTP) Research Grant Scheme (YUTP-FRG/015LC0297).
Conflicts of Interest
The authors declare no conflict of interest.
References
- Mior, M.J.; Salem, K.; Aboulnaga, A.; Liu, R. NoSE: Schema design for NoSQL applications. IEEE Trans. Knowl. Data Eng. 2017, 29, 2275–2289. [Google Scholar] [CrossRef]
- Pirzadeh, P.; Carey, M.; Westmann, T. A performance study of big data analytics platforms. In Proceedings of the 2017 IEEE International Conference on Big Data (Big Data 2017), Boston, MA, USA, 11–14 December 2017; pp. 2911–2920. [Google Scholar] [CrossRef]
- Mior, M.J.; Salem, K.; Aboulnaga, A.; Liu, R. NoSE: Schema design for NoSQL applications. In Proceedings of the 2016 IEEE 32nd International Conference on Data Engineering (ICDE), Helsinki, Finland, 16–20 May 2016; Volume 4347, pp. 181–192. [Google Scholar] [CrossRef]
- Zhang, H.; Chen, G.; Ooi, B.C.; Tan, K.L.; Zhang, M. In-Memory Big Data Management and Processing: A Survey. IEEE Trans. Knowl. Data Eng. 2015, 27, 1920–1948. [Google Scholar] [CrossRef]
- Everest, G.C. Stages of Data Modeling Conceptual vs. Logical vs. Physical Stages of Data Modeling, in Carlson School of Management University of Minnesota, Presentation to DAMA, Minnesota. 2016. Available online: http://www.dama-mn.org/resources/Documents/DAMA-MN2016CvLvPstages.pdf (accessed on 12 December 2019).
- Gonzalez-Aparicio, M.T.; Younas, M.; Tuya, J.; Casado, R. A new model for testing CRUD operations in a NoSQL database. In Proceedings of the 2016 IEEE 30th International Conference on Advanced Information Networking and Applications (AINA), Crans-Montana, Switzerland, 23–25 March 2016; Volume 6, pp. 79–86. Available online: http://ieeexplore.ieee.org/lpdocs/epic03/wrapper.htm?arnumber=7474073 (accessed on 4 March 2020). [CrossRef]
- IBM. Why NoSQL? Your Database Options in the New Non-Relational World. Couchbase. 2014. Available online: https://cloudant.com/wp-content/uploads/Why_NoSQL_IBM_Cloudant.pdf (accessed on 1 May 2020).
- Ramez Elmasri, A.; Navathe Shamkant, B. Fundamentals of Database Systems, 6th ed.; Addison-Wesley Publishing Company: Boston, MA, USA, 2010; Volume 6, Available online: https://dl.acm.org/citation.cfm?id=1855347 (accessed on 12 December 2019). [CrossRef]
- Mongo, D.B. How a Database Can Make Your Organization Faster, Better, Leaner. MongoDB White Pap. 2016. Available online: http://info.mongodb.com/rs/mongodb/images/MongoDB_Better_Faster_Leaner.pdf (accessed on 1 January 2020).
- Jovanovic, V.; Benson, S. Aggregate data modeling style. In Proceedings of the Association for Information Systems, Savannah, GA, USA, 8–9 March 2013; pp. 70–75. Available online: http://aisel.aisnet.org/sais2013/15 (accessed on 12 December 2019).
- William, Z. 6 Rules of Thumb for MongoDB Schema Design. MongoDB. 2014. Available online: https://www.mongodb.com/blog/post/6-rules-of-thumb-for-mongodb-schema-design-part-1 (accessed on 23 January 2019).
- Wu, X.; Zhu, X.; Wu, G.Q.; Ding, W. Data mining with big data. IEEE Trans. Knowl. Data Eng. 2014, 26, 97–107. [Google Scholar] [CrossRef]
- Varga, V.; Jánosi, K.T.; Kálmán, B. Conceptual Design of Document NoSQL Database with Formal Concept Analysis. Acta Polytech. Hung. 2016, 13, 229–248. [Google Scholar]
- Imam, A.A.; Basri, S.; Ahmad, R.; Abdulaziz, N.; González-aparicio, M.T. New cardinality notations and styles for modeling NoSQL document-stores databases. In Proceedings of the IEEE Region 10th Conference (TENCON), Penang, MA, USA, 5–8 November 2017; p. 6. [Google Scholar]
- Naheman, W. Review of NoSQL databases and performance testing on HBase. In Proceedings of the 2013 IEEE International Conference on Mechatronics, Vicenza, Italy, 27 February–1 March 2013; pp. 2304–2309. [Google Scholar]
- Truica, C.O.; Radulescu, F.; Boicea, A.; Bucur, I. Performance evaluation for CRUD operations in asynchronously replicated document oriented database. In Proceedings of the 2015 20th International Conference on Control Systems and Computer Science, Bucharest, Romania, 27–29 May 2015; pp. 191–196. [Google Scholar] [CrossRef] [Green Version]
- Craw Cuor, R.; Makogon, D. Modeling Data in Document Databases. United States: Developer Experience & Document DB. 2016. Available online: https://www.youtube.com/watch?v=-o_VGpJP-Q0 (accessed on 12 May 2020).
- Patel, J. Cassandra Data Modeling Best Practices, Part 1, Ebaytechblog. 2012. Available online: http://ebaytechblog.com/?p=1308 (accessed on 2 August 2017).
- Korla, N. Cassandra Data Modeling—Practical Considerations@Netflix, Netflix. 2013. Available online: http://www.slideshare.net/nkorla1share/cass-summit-3 (accessed on 2 August 2017).
- Ron, A.; Shulman-Peleg, A.; Puzanov, A. Analysis and Mitigation of NoSQL Injections. IEEE Secur. Priv. 2016, 14, 30–39. [Google Scholar] [CrossRef]
- Obijaju, M. NoSQL NoSecurity—Security Issues with NoSQL Database. Perficient: Data and Analytics Blog. 2015. Available online: http://blogs.perficient.com/dataanalytics/2015/06/22/nosql-nosecuity-security-issues-with-nosql-database/ (accessed on 21 September 2016).
- Mior, M.J. Automated Schema Design for NoSQL Databases. 2014. Available online: http://dl.acm.org/citation.cfm?id=2602622.2602624 (accessed on 12 May 2019).
- González-Aparicio, M.T.; Younas, M.; Tuya, J.; Casado, R. Testing of transactional services in NoSQL key-value databases. Futur. Gener. Comput. Syst. 2018, 80, 384–399. [Google Scholar] [CrossRef] [Green Version]
- Imam, A.A.; Basri, S.; Ahmad, R.; Watada, J.; González-Aparicio, M.T. Automatic schema suggestion model for NoSQL document-stores databases. J. Big Data 2018, 5, 1–17. [Google Scholar] [CrossRef] [Green Version]
- Imam, A.A.; Basri, S.; Ahmad, R.; González-Aparicio, M.T. Schema proposition model for NoSQL applications. In Proceedings of the 3rd International Conference of Reliable Information and Communication Technology (IRICT 2018), Kuala Lumpur, Malaysia, 23–24 July 2018; Volume 843, pp. 40–46. [Google Scholar] [CrossRef]
- Atzeni, P. Data Modelling in the NoSQL World: A contradiction? In Proceedings of the International Conference on Computer Systems and Technologies, London, UK, 21–22 October 2020; pp. 23–24. [Google Scholar] [CrossRef]
- April, R. NoSQL Technologies: Embrace NoSQL as a Relational Guy—Column Family Store. DB Council. 2016. Available online: https://dbcouncil.net/category/nosql-technologies/ (accessed on 21 April 2017).
- Jatana, N.; Puri, S.; Ahuja, M. A Survey and Comparison of Relational and Non-Relational Database. Int. J. 2012, 1, 1–5. [Google Scholar]
- Bhogal, J.; Choksi, I. Handling big data using NoSQL. In Proceedings of the IEEE 29th International Conference on Advanced Information Networking and Applications Workshops, WAINA 2015, Washington, DC, USA, 24–27 March 2015; pp. 393–398. [Google Scholar] [CrossRef]
- Tauro, C.J.M.; Aravindh, S.; Shreeharsha, A.B. Comparative Study of the New Generation, Agile, Scalable, High Performance NOSQL Databases. Int. J. Comput. Appl. 2012, 48, 1–4. [Google Scholar] [CrossRef]
- Finkelstein, S.J.; Schkolnick, M.; Tiberio, P. Physical database design for relational databases. ACM Trans. Database Syst. 1988, 13, 91–128. [Google Scholar] [CrossRef]
- Agrawal, S.; Chaudhuri, S.; Narasayya, V. Automated selection of materialized views and indexes for SQL databases. In Proceedings of the 29th International Conference on Very Large Data Bases (VLDB 2003), Berlin, Germany, 12–13 September 2003; pp. 496–505. [Google Scholar]
- Zilio, D.C.; Rao, J.; Lightstone, S.; Lohman, G.; Storm, A.; Garcia-Arellano, C.; Fadden, S. DB2 design advisorIntegrated automatic physical database design. In Proceedings of the 2004 VLDB Conference, Toronto, ON, Canada, 31 August–3 September 2004; pp. 1087–1097. [Google Scholar] [CrossRef]
- Dageville, B.; Das, D.; Karl, D.; Yagoub, K.; Mohamed, Z.; Mohamed, Z. Automatic sql tuning in oracle 10 g. In Proceedings of the 2004 VLDB Conference, Toronto, ON, Canada, 31 August–3 September 2004; Volume 30, pp. 1098–1109. [Google Scholar]
- Bruno, N.; Chaudhuri, S. Automatic physical database tuning: A relaxation-based approach. In Proceedings of the 2005 ACM SIGMOD International Conference on Management of Data, Baltimore, MD, USA, 14–16 June 2005; pp. 227–238. [Google Scholar]
- Papadomanolakis, S.; Ailamaki, A. An integer linear programming approach to database design. In Proceedings of the 2007 IEEE 23rd International Conference on Data Engineering Workshop, Istanbul, Turkey, 17–20 April 2007; pp. 442–449. [Google Scholar] [CrossRef]
- Kimura, H.; Huo, G.; Rasin, A.; Madden, S.; Zdonik, S.B. CORADD: Correlation aware database designer for materialized views and indexes. Proc. VLDB Endow. 2010, 3, 1103–1113. [Google Scholar] [CrossRef]
- Dash, D.; Polyzotis, N.; Ailamaki, A. CoPhy: A scalable, portable, and interactive index advisor for large workloads. Proc. VLDB Endow. 2011, 4. [Google Scholar] [CrossRef]
- Papadomanolakis, S.; Ailamaki, A. AutoPart: Automating schema design for large scientific databases using data partitioning. In Proceedings of the International Conference on Statistical and Scientific Database Management (SSDBM), Santorini Island, Greece, 23 June 2004; Volume 16, pp. 383–392. [Google Scholar] [CrossRef] [Green Version]
- Lamb, A.; Fuller, M.; Varadarajan, R.; Tran, N.; Vandier, O.B.; Doshi, L.; Bear, C. The vertica analytic database: Cstore 7 years later. Proc. VLDB Endow. 2012, 5, 1790–1801. [Google Scholar] [CrossRef]
- Rasin, A.; Zdonik, S. An automatic physical design tool for clustered column-stores. In Proceedings of the 16th International Conference on Extending Database Technology, Genoa, Italy, 18 March 2013; pp. 203–214. [Google Scholar] [CrossRef]
- Rao, J.; Zhang, C.; Megiddo, N.; Lohman, G. Automating physical database design in a parallel database. In Proceedings of the 2002 ACM SIGMOD International Conference on Management of Data, Madison, WI, USA, 3–6 June 2002; pp. 558–569. [Google Scholar] [CrossRef] [Green Version]
- Agrawal, S.; Chaudhuri, S.; Das, A.; Narasayya, V. Automating layout of relational databases. In Proceedings of the 19th International Conference on Data Engineering, Bangalore, India, 5–8 March 2003; pp. 607–618. [Google Scholar] [CrossRef]
- Ozmen, O.; Salem, K.; Schindler, J.; Daniel, S. Workload-aware storage layout for database systems. In Proceedings of the 2010 ACM SIGMOD International Conference on Management of Data, Indianapolis, IN, USA, 6 June 2010; pp. 939–950. [Google Scholar] [CrossRef]
- Varadarajan, R.; Bharathan, V.; Cary, A.; Dave, J.; Bodagala, S. DB designer: A customizable physical design tool for Vertica Analytic Database. In Proceedings of the 2014 IEEE 30th International Conference on Data Engineering, Chicago, IL, USA, 31 March–4 April 2014; pp. 1084–1095. [Google Scholar] [CrossRef]
- Bertino, E.; Kim, W. Indexing Techniques for Queries on Nested Objects. IEEE Trans. Knowl. Data Eng. 1989, 1, 196–214. [Google Scholar] [CrossRef]
- Lawley, M.J.; Topor, R.W. A Query language for EER schemas. In Proceedings of the Australasian Database Conference, Sydney, Australia, 24–27 May 1994; pp. 292–304. [Google Scholar]
- Vajk, T.; Deák, L.; Fekete, K.; Mezei, G. Automatic NOSQL schema development: A case study. In Proceedings of the IASTED International Conference on Parallel and Distributed Computing and Networks, PDCN 2013, Innsbruck, Austria, 11–13 February 2013; pp. 656–663. [Google Scholar] [CrossRef] [Green Version]
- Chen, P.; Shan, P. The entity-relationship model—Toward a unified view of data. ACM Trans. Database Syst. 1976, 1, 9–36. Available online: http://dl.acm.org/citation.cfm?id=320434.320440 (accessed on 12 May 2020). [CrossRef]
- Everest, G.C. Basic data structure models explained with a common example. In Proceedings of the Fifth Texas Conference on Computing Systems, Austin, TX, USA, 18–19 October 1976; pp. 18–19. [Google Scholar]
- Dembczy, K. Evolution of Database Systems; Intelligent Decision Support Systems Laboratory (IDSS) Poznan, University of Technology: Poznan, Poland, 2015. [Google Scholar]
- Rumbaugh, J.; Jacobson, I.; Booch, G. The Unified Modeling Language Reference Manual; Pearson Higher Education: New York, NY, USA, 2004. [Google Scholar]
- Tsatalos, O.G.; Solomon, M.H.; Ioannidis, Y.E. The GMAP: A versatile tool for physical data independence. VLDB J. 1996, 5, 101–118. [Google Scholar] [CrossRef]
- Stonebraker, M.; Abadi, D.J.; Batkin, A.; Chen, X.; Cherniack, M.; Ferreira, M.; Lau, E.; Lin, A.; Madden, S.; O’Neil, E.; et al. C-Store: A Column-Oriented DBMS. In Proceedings of the 31st International Conference on Very Large Data Bases, Trondheim, Norway, 24 August 2005; Volume 5, pp. 553–564. [Google Scholar]
- Kleppe, A.; Warmer, J.; Bast, W. MDA explained: The model driven architecture: Practice and promise. In Computer & Technology Books; Addison-Wesley Professional: Boston, MA, USA, 2003. [Google Scholar]
- Object Management Group. Decision Model and Notation. Version 1.0. 2015. Available online: http://www.omg.org/spec/DMN/1.0/PDF/ (accessed on 17 September 2020).
- Object Management Group. Decision Model and Notation. Version 1:1. 2016. Available online: http://www.omg.org/spec/DMN/1.1/PDF/ (accessed on 17 September 2020).
- Kharmoum, N.; Ziti, S.; Rhazali, Y.; Omary, F. An automatic transformation method from the E3value model to IFML model: An MDA approach. J. Comput. Sci. 2019, 15, 800–813. [Google Scholar] [CrossRef] [Green Version]
- Dörndorfer, J.; Florian, H.; Christian, S. The SenSoMod-Modeler—A model-driven architecture approach for mobile context-aware business applications. In Proceedings of the International Conference on Advanced Information Systems Engineering, Grenoble, France, 8–12 June 2020; pp. 75–86. [Google Scholar]
- Allison, M.; Robinson, M.; Rusin, G. An autonomic model-driven architecture to support runtime adaptation in swarm behavior. In Proceedings of the Future of Information and Communication Conference, San Francisco, CA, USA, 14–15 March 2019; pp. 422–437. [Google Scholar]
- Atzeni, P.; Francesca, B.; Luca, R. Uniform access to NoSQL systems. Inf. Syst. 2014, 43, 117–133. [Google Scholar] [CrossRef]
- Tan, Z.; Shivnath, B. Tempo: Robust and self-tuning resource management in multi-tenant parallel databases. Proc. VLDB Endow. 2015. [Google Scholar] [CrossRef] [Green Version]
- Li, C. Transforming relational database into HBase: A case study. In Proceedings of the 2010 IEEE International Conference on Software Engineering and Service Sciences, ICSESS 2010, Beijing, China, 16–18 July 2010; pp. 683–687. [Google Scholar] [CrossRef]
- Max, C.; El Malki, M.; Kopliku, A.; Teste, O.; Tournier, R. Benchmark for OLAP on NoSQL technologies comparing NoSQL multidimensional data warehousing solutions. In Proceedings of the 2015 IEEE 9th International Conference on Research Challenges in Information Science (RCIS), Athens, Greece, 13–15 May 2015; pp. 480–485. [Google Scholar]
- Zhang, D.; Wang, Y.; Liu, Z.; Dai, S. Improving NoSQL Storage Schema Based on Z-Curve for Spatial Vector Data. IEEE Access 2019, 7, 78817–78829. [Google Scholar] [CrossRef]
- Buchschacher, N.; Fabien, A.; Julien, B. No-SQL Databases: An Efficient Way to Store and Query Heterogeneous Astronomical Data in DACE. ASPC 2019, 523, 405. [Google Scholar]
- Mozaffari, M.; Nazemi, E.; Eftekhari-Moghadam, A.M. Feedback control loop design for workload change detection in self-tuning NoSQL wide column stores. Expert Syst. Appl. 2020, 142, 112973. [Google Scholar] [CrossRef]
- Störl, U.; Tekleab, A.; Klettke, M.; Scherzinger, S. In for a Surprise when Migrating NoSQL Data. In Proceedings of the 2018 IEEE 34th International Conference on Data Engineering (ICDE), Paris, France, 16–20 April 2018; p. 1662. [Google Scholar]
- Ramzan, S.; Imran, S.B.; Bushra, R.; Waheed, A. Intelligent Data Engineering for Migration to NoSQL Based Secure Environments. IEEE Access 2019, 7, 69042–69057. [Google Scholar] [CrossRef]
- Imam, A.A.; Basri, S.; Ahmad, R.; María, T.G.-A.; Watada, J.; Ahmad, M. Data Modeling Guidelines for NoSQL Document-Store Databases. Int. J. Adv. Comput. Sci. Appl. 2018, 9. [Google Scholar] [CrossRef]
- Hunter, S.; Simpson, J.T. Machines, Systems, Computer-Implemented Methods, and Computer Program Products to Test and Certify Oil and Gas Equipment. U.S. Patent 10,196,878, February 2019. Available online: https://patentimages.storage.googleapis.com/a9/61/da/18454297348f9b/US10196878.pdf (accessed on 21 May 2020).
- Bondiombouy, C.; Valduriez, P. Query processing in multistore systems: An overview. Int. J. Cloud Comput. 2016, 5, 309. [Google Scholar] [CrossRef]
- An, M.; Wang, Y.; Wang, W. Using index in the MapReduce framework. In Proceedings of the 2010 12th International Asia-Pacific Web Conference, Washington, DC, USA, 6 April 2010; Volume 52, pp. 52–58. [Google Scholar] [CrossRef]
- Stone, P.D.; Dantressangle, P.; Bent, G.; Mowshowitz, A.; Toce, A.; Szymanski, B.K. Coarse grained query cost models for DDFDs. In Proceedings of the 4th Annual Conference of the International Technology Alliance, London, UK, 15–16 September 2010; Volume 1, pp. 1–3. [Google Scholar]
Figure 1.
The Dynamic Schema Proposition (DSP) model.

Figure 2.
(a) Schema generation process using the DSP model; (b) requirements selection.
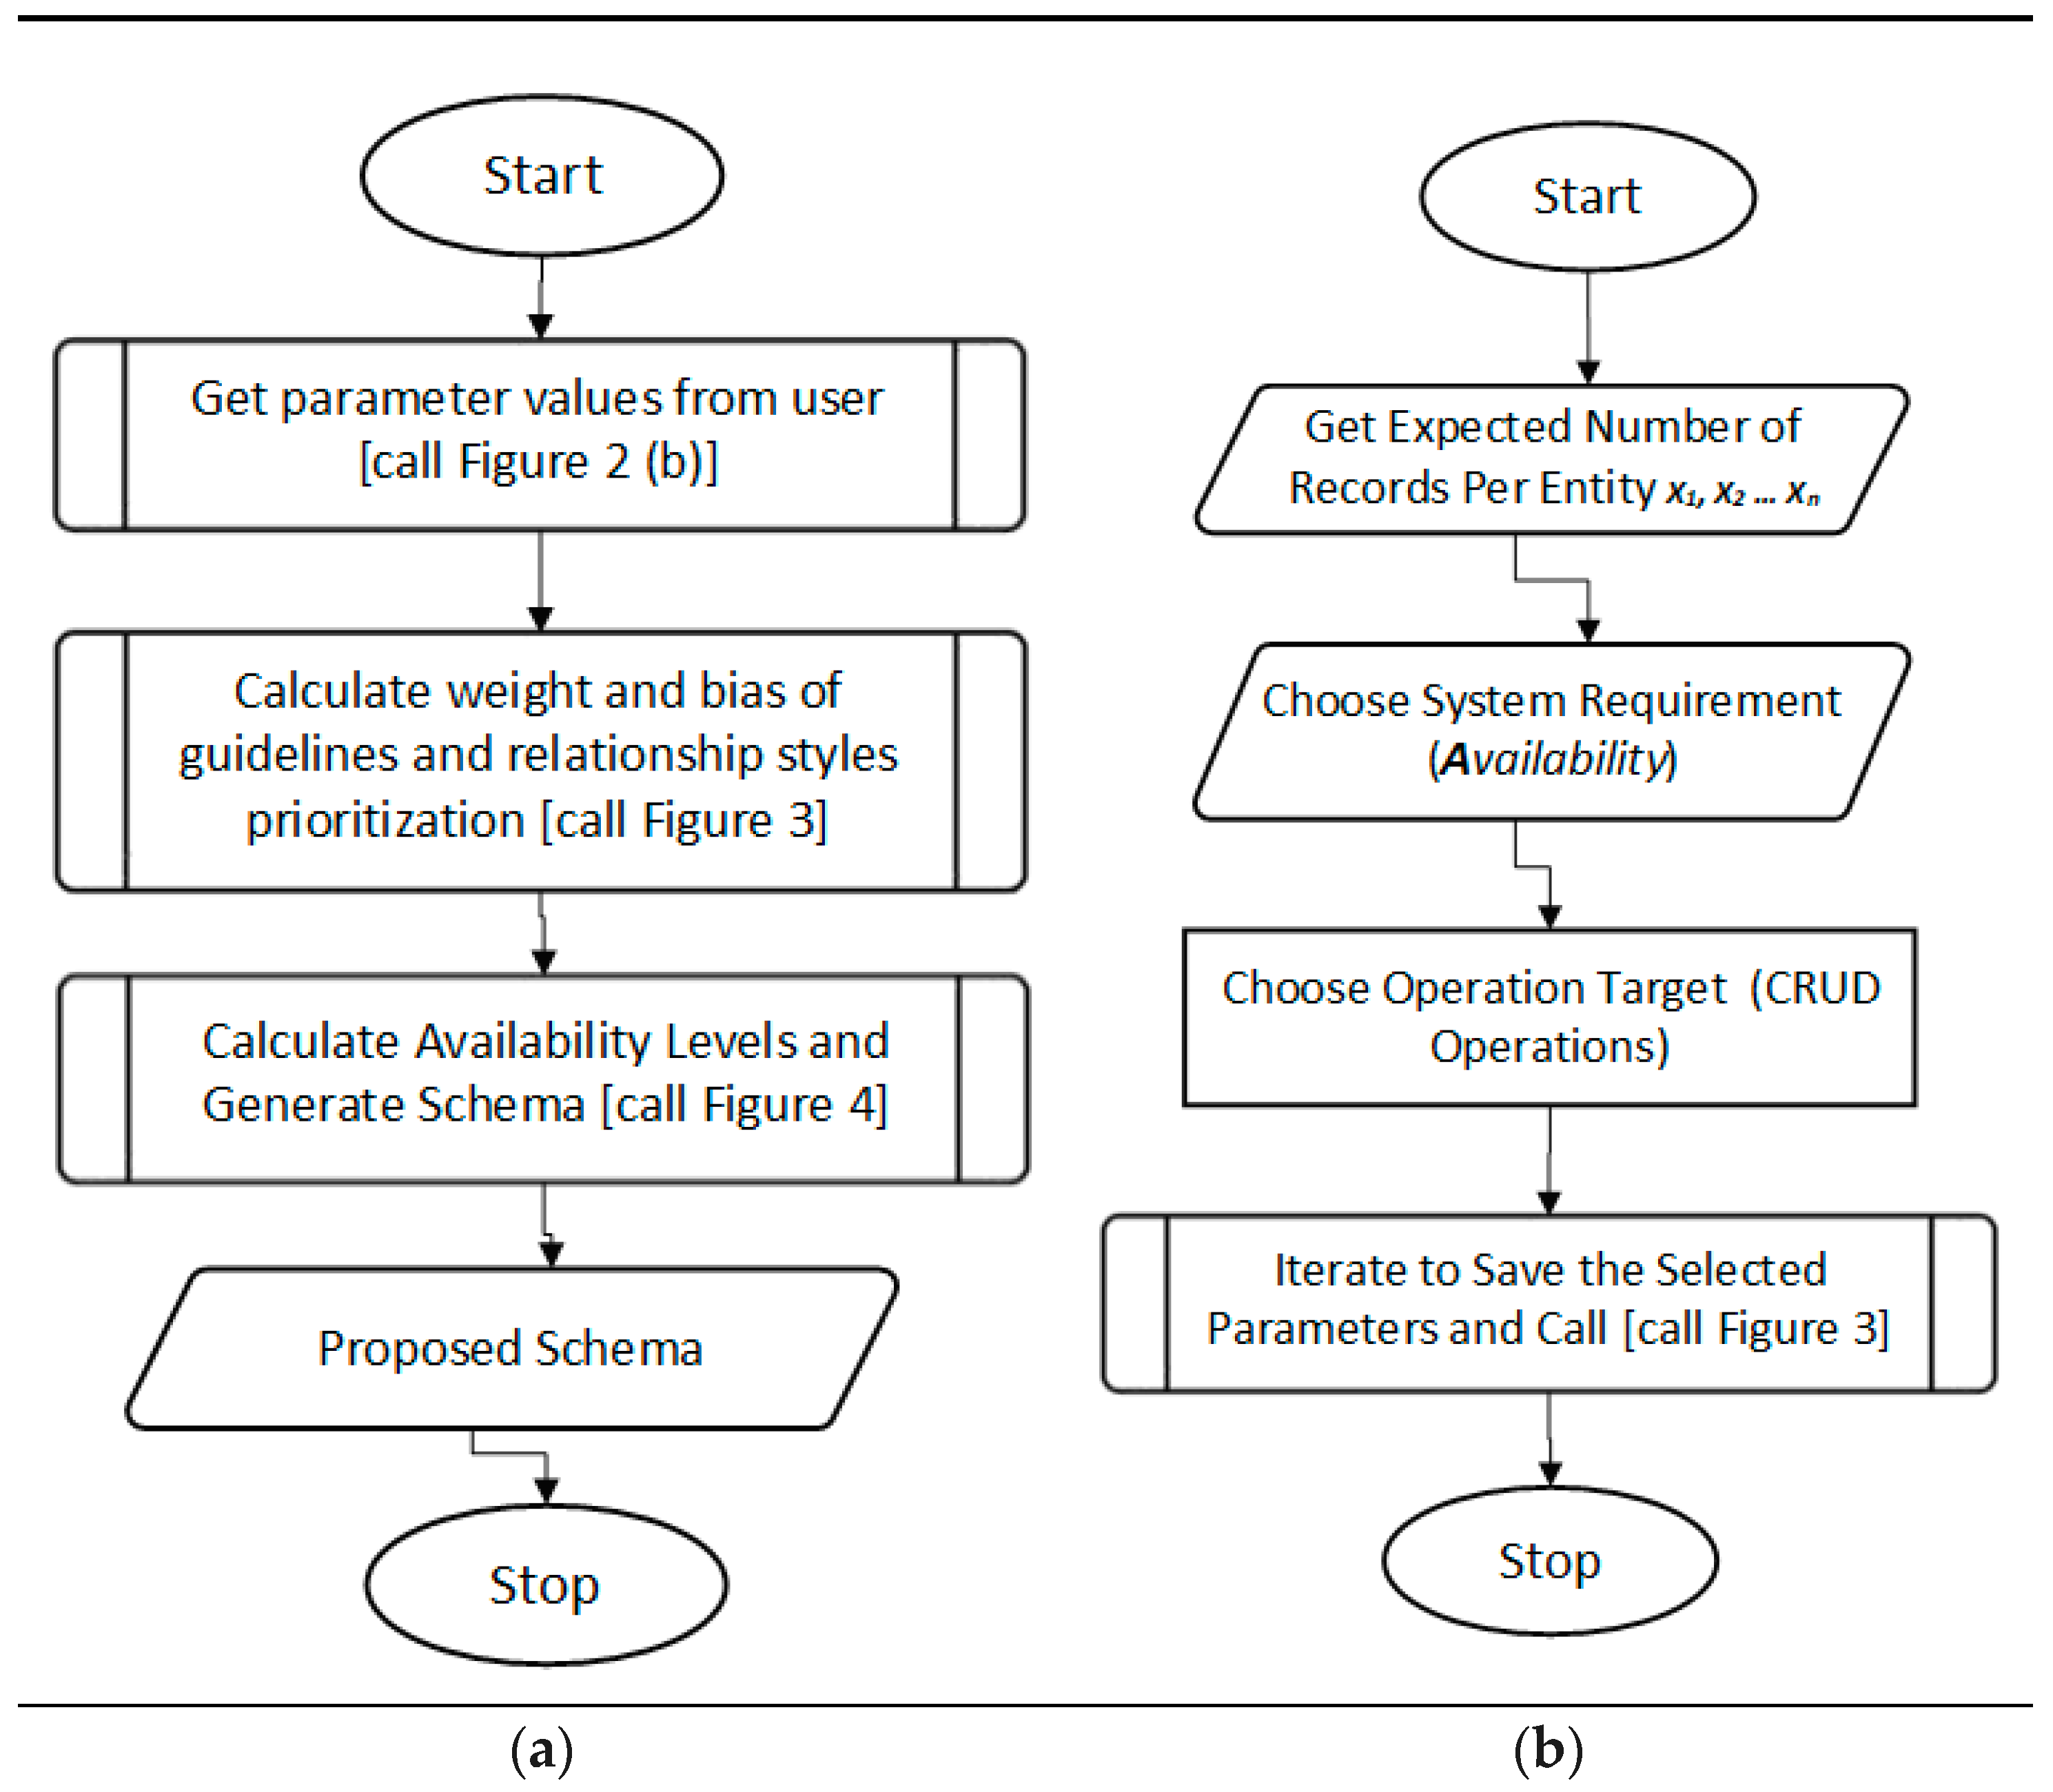
Figure 3.
Requirements computation process.

Figure 4.
Availability computations.
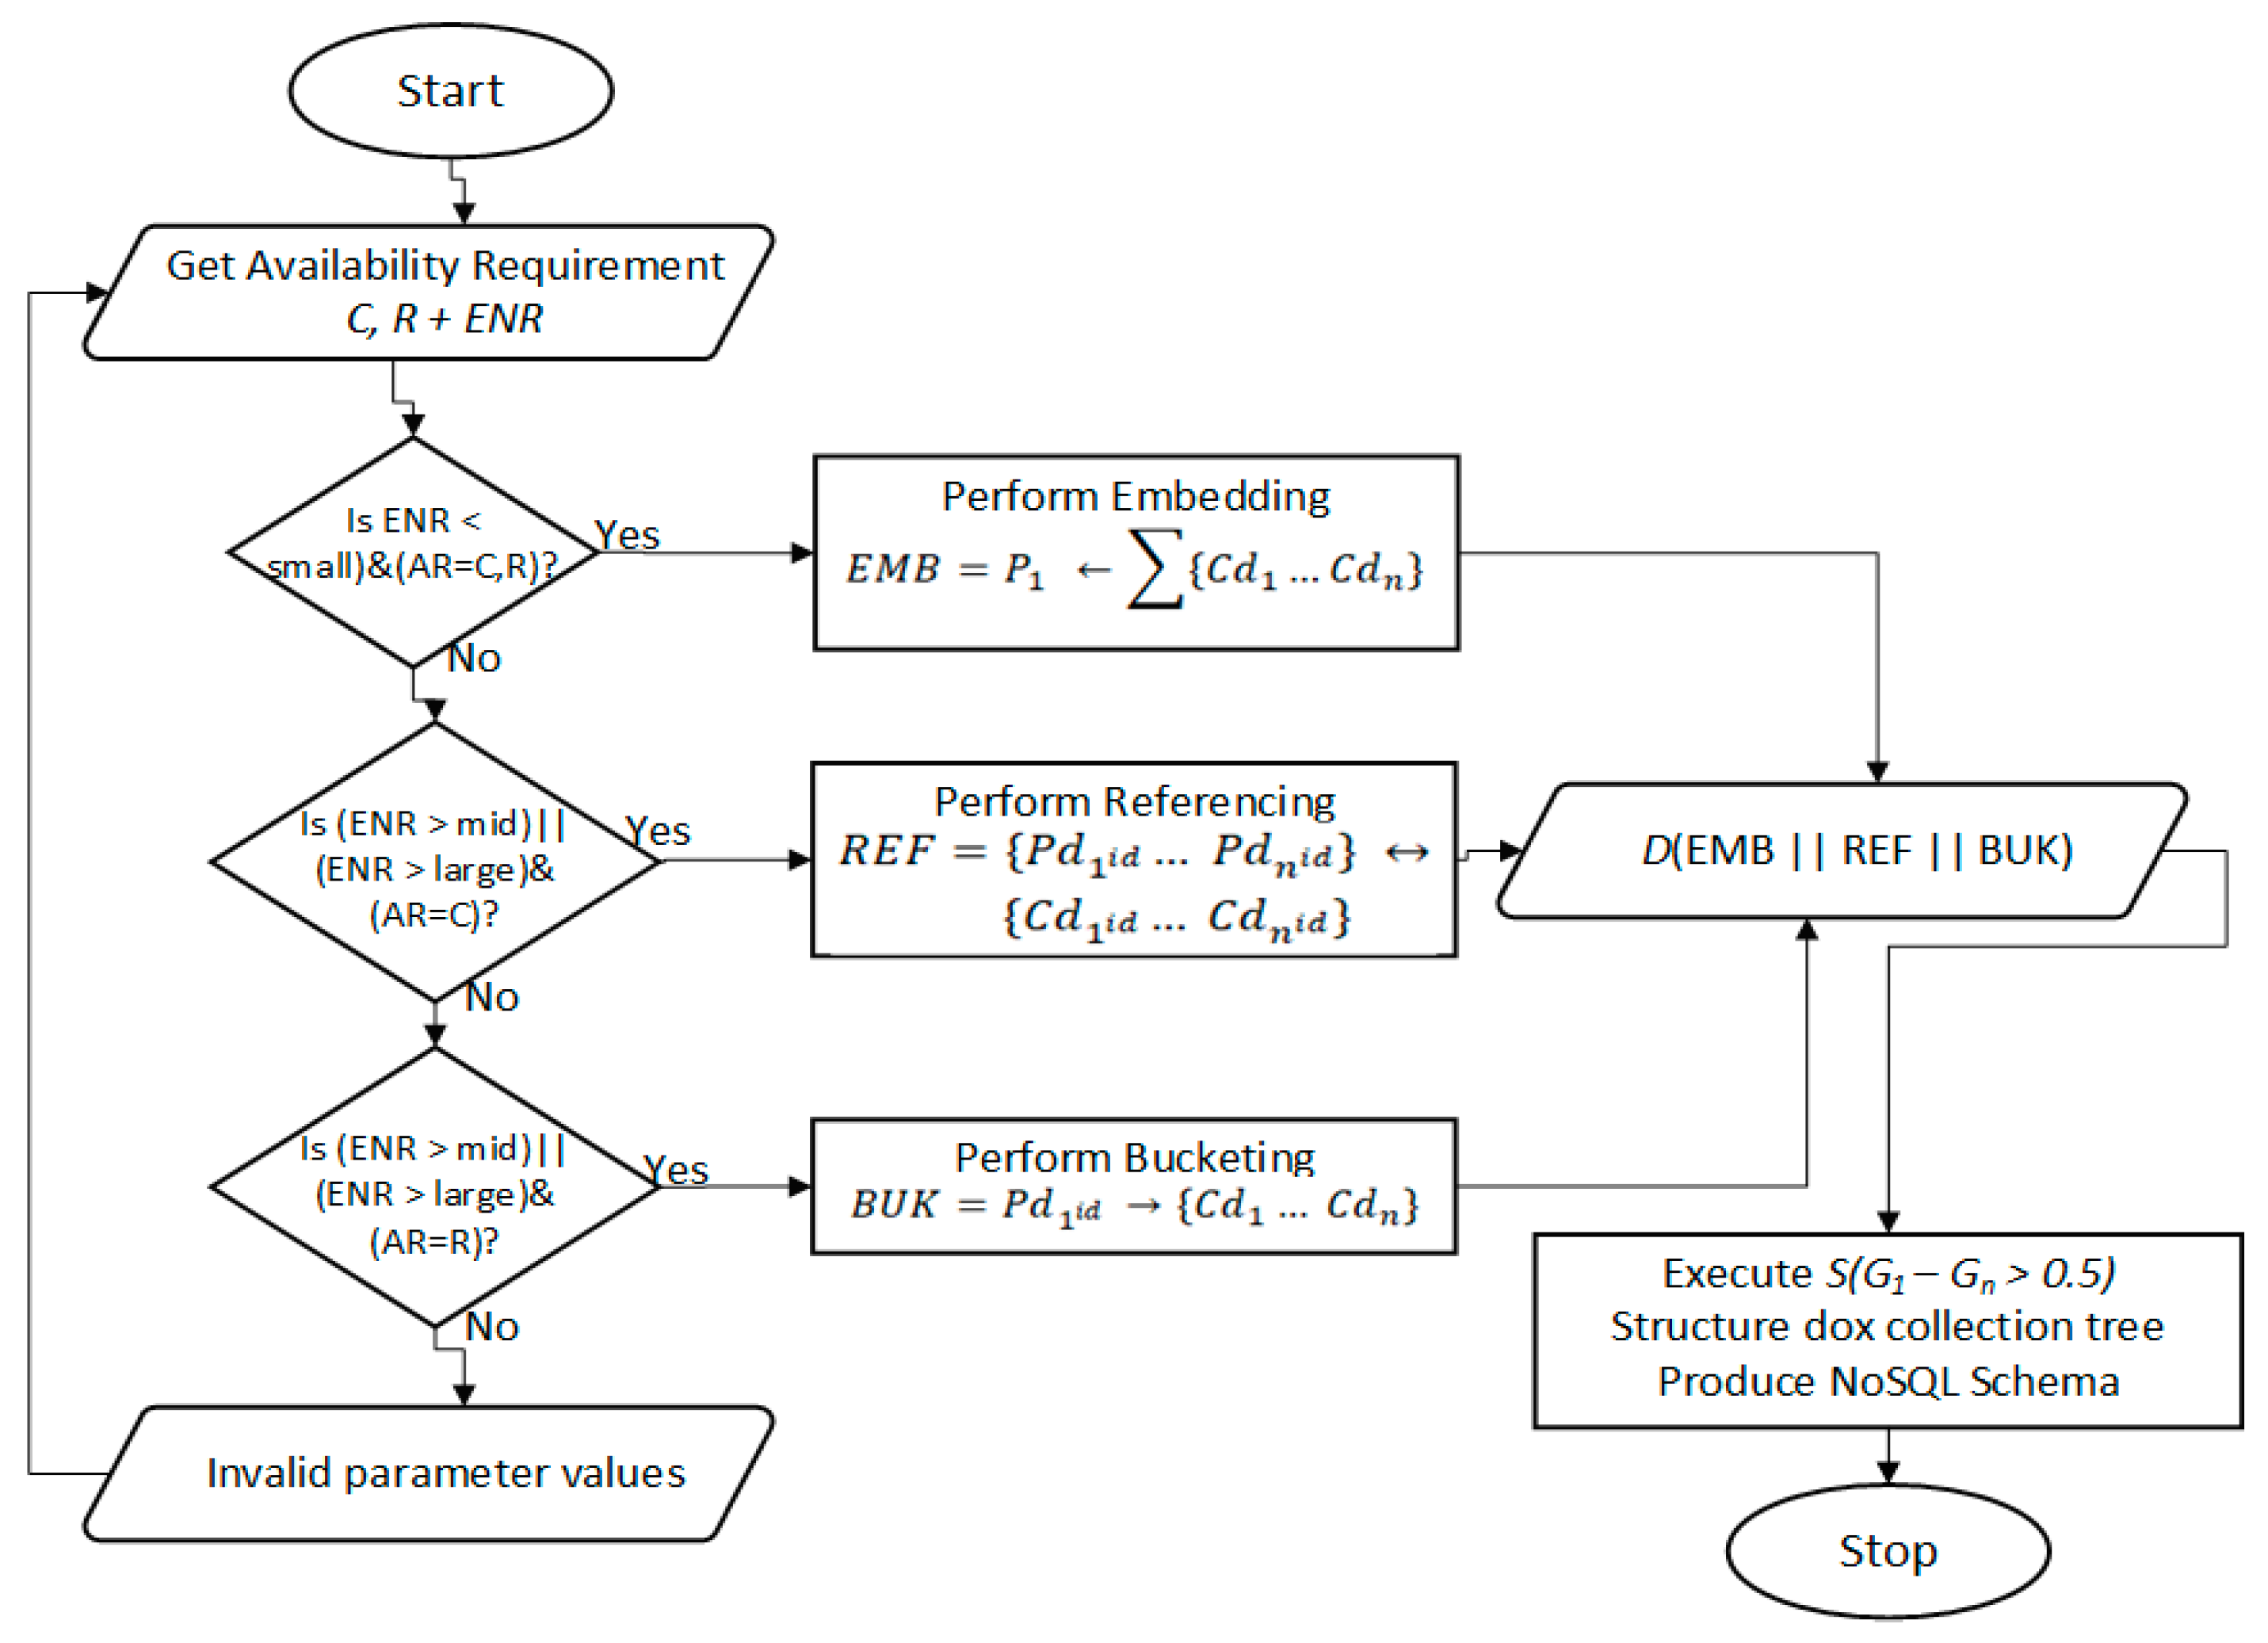
Figure 5.
Sample dataset (schema).

Figure 6.
Prototype system architecture.

Figure 7.
Overview of the MapReduce execution process.
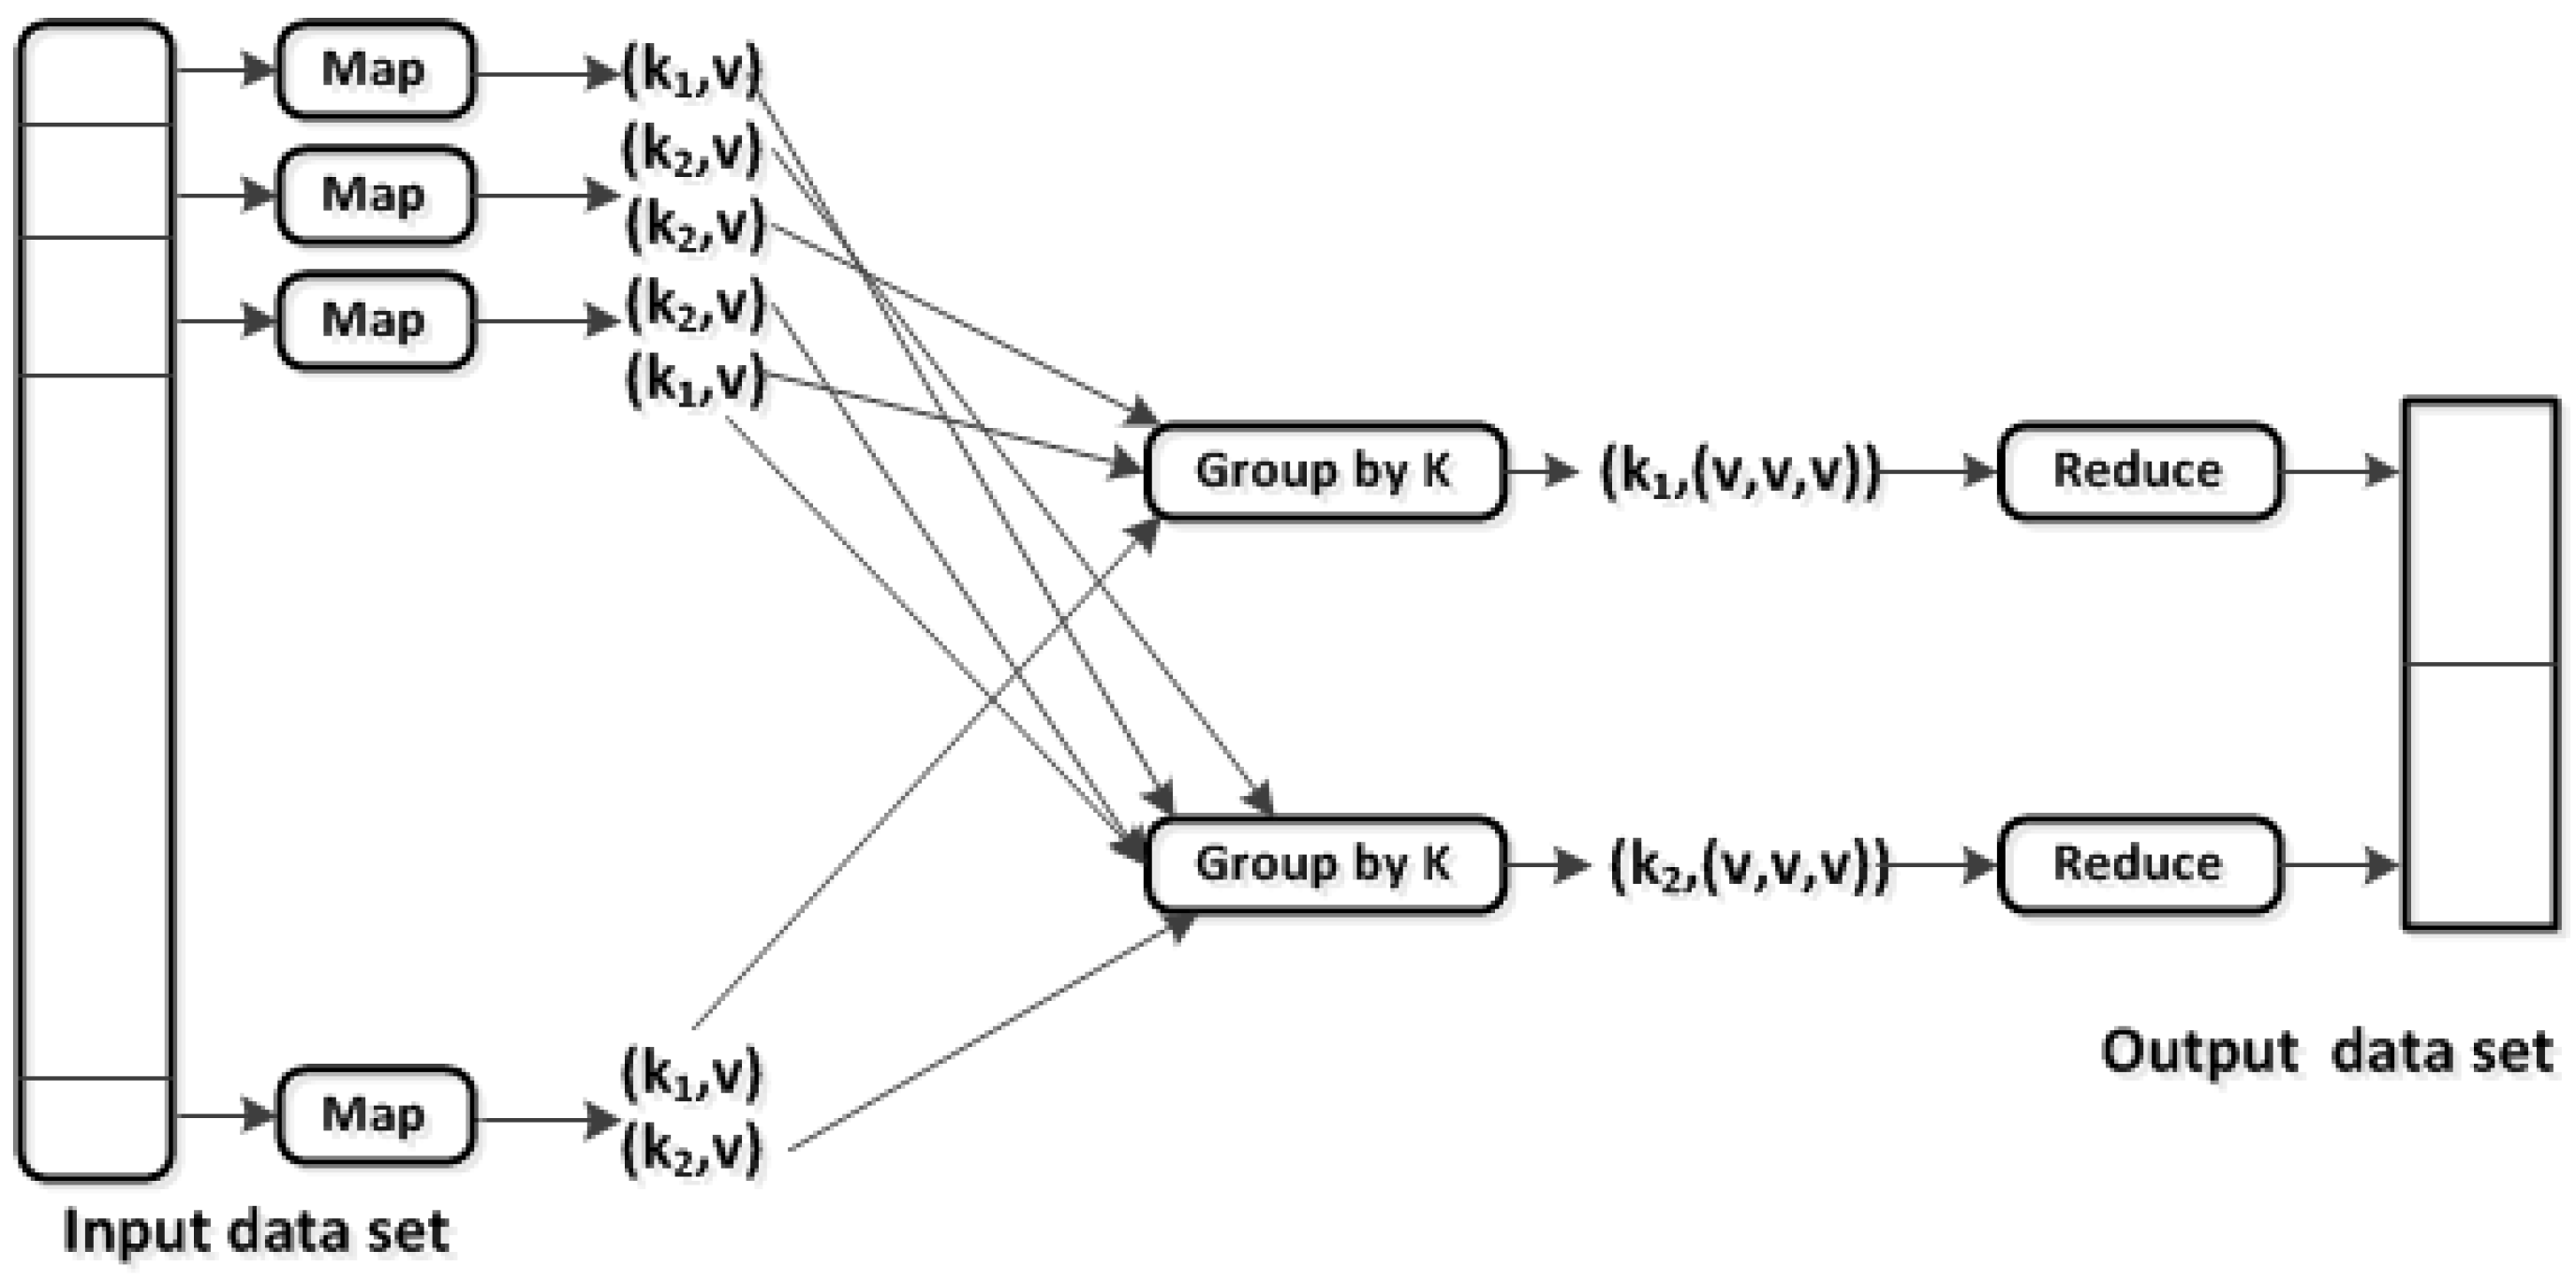
Figure 8.
Preliminary experimental results on execution runtime for (a) read operations on 1:F, 1:M, and 1:S cardinality notations; (b) write operations on 1:F, 1:M, and 1:S cardinality notations; (c) read operations on F:F, M:N, and S:S cardinality notations; (d) write operations on F:F, M:N, and S:S cardinality notations.

Figure 9.
Execution runtime for the Create operation on single-selectivity for the DSP, Expert1, Expert2, and Expert3 schemas.
Figure 9.
Execution runtime for the Create operation on single-selectivity for the DSP, Expert1, Expert2, and Expert3 schemas.

Figure 10.
Execution runtime for the Create operation on drill-down for the DSP, Expert1, Expert2, and Expert3 schemas.
Figure 10.
Execution runtime for the Create operation on drill-down for the DSP, Expert1, Expert2, and Expert3 schemas.

Figure 11.
Execution runtime for the Create operation on rollup for the DSP, Expert1, Expert2, and Expert3 schemas.
Figure 11.
Execution runtime for the Create operation on rollup for the DSP, Expert1, Expert2, and Expert3 schemas.
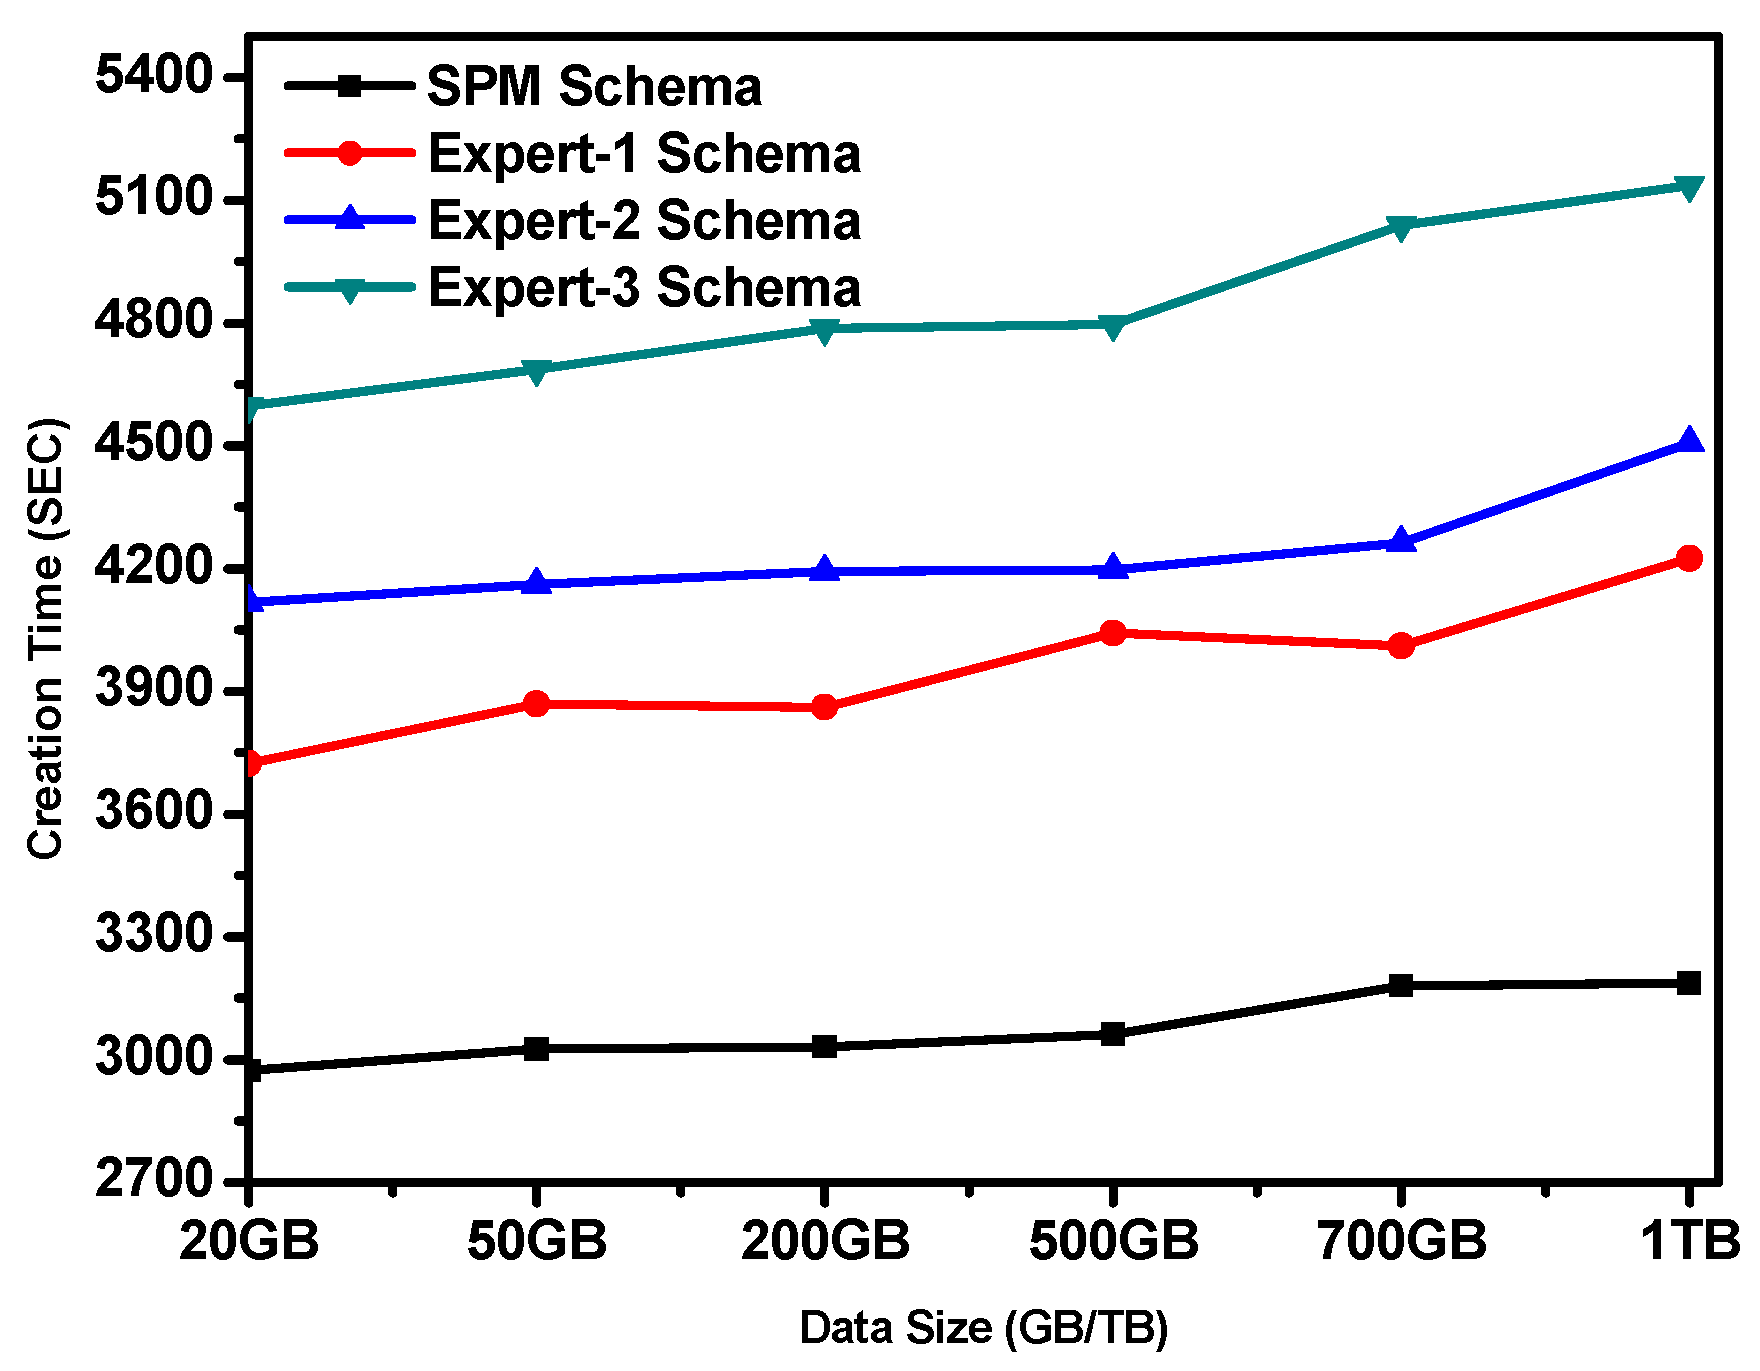
Figure 12.
Execution runtime for the Read operation on single-selectivity for the DSP, Expert1, Expert2, and Expert3 schemas.
Figure 12.
Execution runtime for the Read operation on single-selectivity for the DSP, Expert1, Expert2, and Expert3 schemas.

Figure 13.
Execution runtime for the Read operation on drill-down for the DSP, Expert1, Expert2, and Expert3 schemas (Query 2).
Figure 13.
Execution runtime for the Read operation on drill-down for the DSP, Expert1, Expert2, and Expert3 schemas (Query 2).

Figure 14.
Execution runtime for the Read operation on drill-down for the DSP, Expert1, Expert2, and Expert3 schemas (Query 3).
Figure 14.
Execution runtime for the Read operation on drill-down for the DSP, Expert1, Expert2, and Expert3 schemas (Query 3).

Figure 15.
Execution runtime for the Read operation on rollup for the DSP, Expert1, Expert2, and Expert3 schemas (Query 4).
Figure 15.
Execution runtime for the Read operation on rollup for the DSP, Expert1, Expert2, and Expert3 schemas (Query 4).

Figure 16.
Schema production time of the DSP model against formal methods.
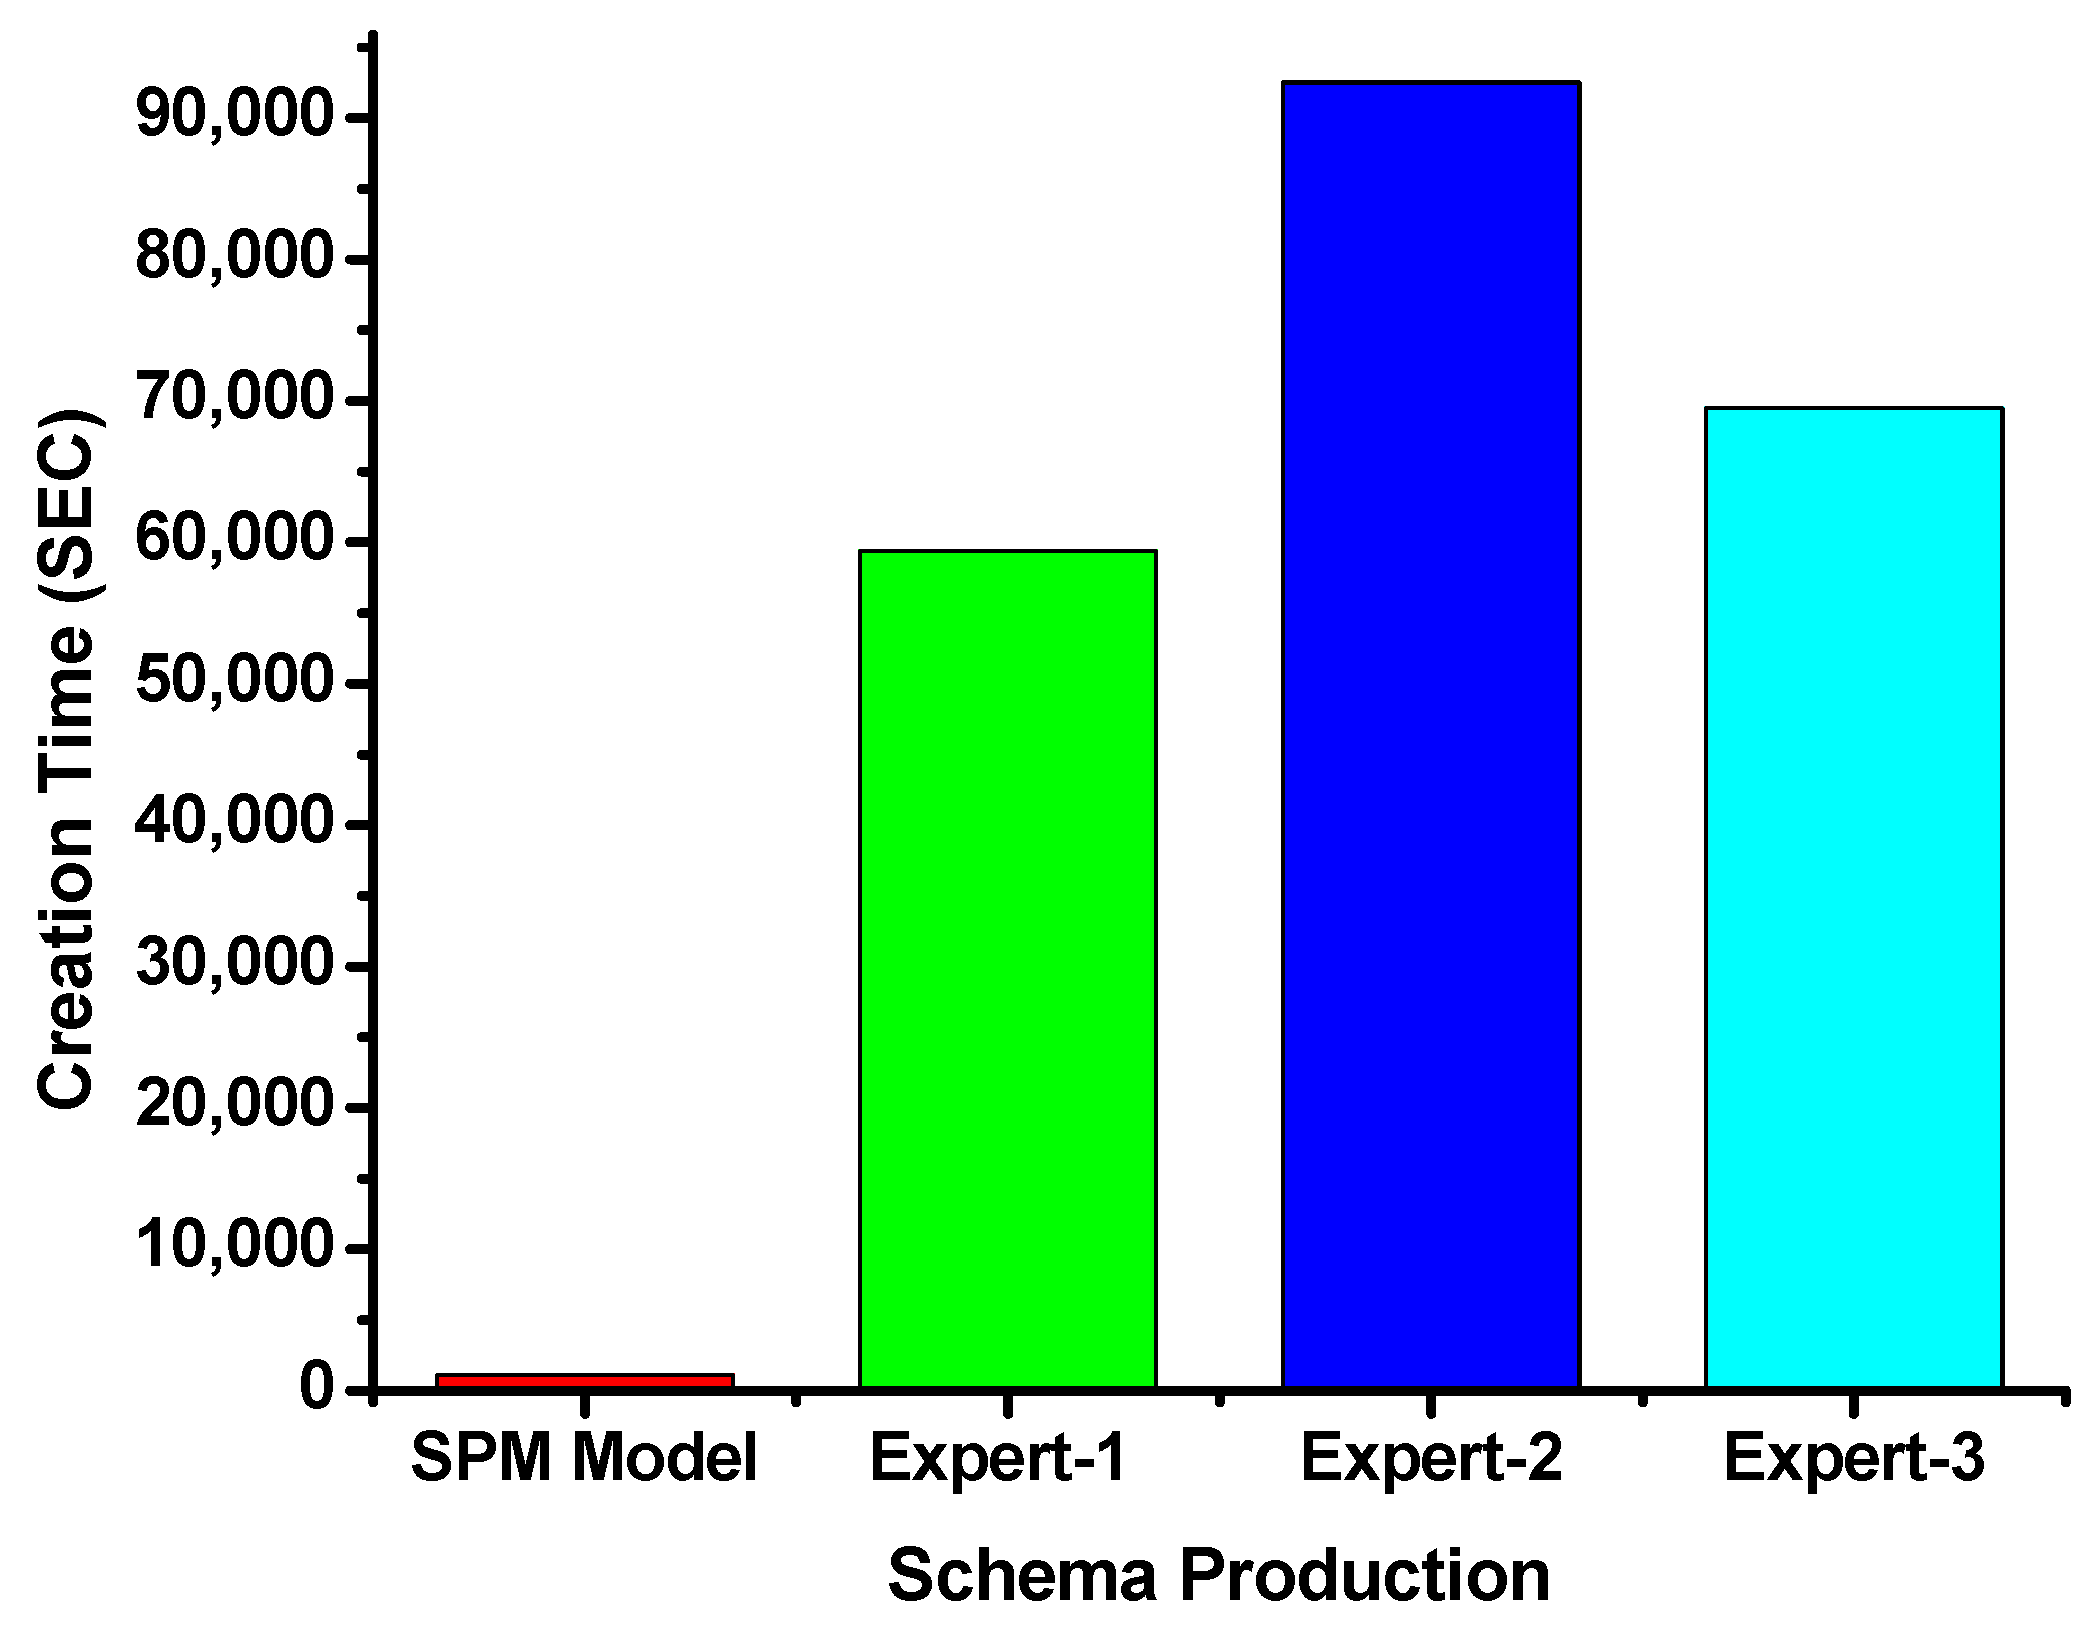
Figure 17.
Schema complexity comparisons between the DSP model against formal methods: (a) number-of-redo’s per document; (b) number-of-redo’s per collection.
Figure 17.
Schema complexity comparisons between the DSP model against formal methods: (a) number-of-redo’s per document; (b) number-of-redo’s per collection.

Figure 18.
Schema complexity comparisons between the DSP model against formal methods: (a) full requirements integration; (b) understandability; (c) reusability; (d) extendibility.
Figure 18.
Schema complexity comparisons between the DSP model against formal methods: (a) full requirements integration; (b) understandability; (c) reusability; (d) extendibility.


Table 1.
SQL and Not so SQL (NoSQL) cardinalities.
| Cardinalities | Notations | Examples | |
|---|---|---|---|
| 1 | One-to-One | 1:1 | Person ←→ Id card |
| 2 | One-to-Few | 1:F | Author ←→ Addresses |
| 3 | One-to-Many | 1:M | Post ←→ Comments |
| 4 | One-to-Squillions | 1:S | System ←→ Logs |
| 5 | Many-to-Many | M:M | Customers←→ Products |
| 6 | Few-to-Few | F:F | Employees ←→ tasks |
| 7 | Squillions-to-Squillions | S:S | Transactions ←→ Logs |
Table 2.
Relationship classification.
| S/N | Styles | Notations |
|---|---|---|
| 1 | Embedding | EMB |
| 2 | Referencing | REF |
| 3 | Bucketing | BUK |
Table 3.
Prioritizing guidelines for read/write performance [70].
Table 3.
Prioritizing guidelines for read/write performance [70].
| Read Operations | Write Operations | ||||
|---|---|---|---|---|---|
| Code | Total Scores | Priority Level | Code | Total Scores | Priority Level |
| G6 | 12 | 1 | G1 | 17 | 1 |
| G1 | 16 | 2 | G6 | 25 | 2 |
| G17 | 30 | 3 | G4 | 28 | 3 |
| G15 | 34 | 4 | G5 | 35 | 4 |
| G2 | 52 | 5 | G7 | 50 | 5 |
| G7 | 54 | 6 | G18 | 70 | 6 |
| G11 | 67 | 7 | G10 | 79 | 7 |
| G9 | 69 | 8 | G11 | 91 | 8 |
| G3 | 76 | 9 | G14 | 93 | 9 |
| G19 | 92 | 10 | G12 | 95 | 10 |
| G5 | 97 | 11 | G8 | 99 | 11 |
| G4 | 106 | 12 | G15 | 101 | 12 |
| G22 | 123 | 13 | G3 | 103 | 13 |
| G8 | I26 | 14 | G9 | 118 | 14 |
| G12 | 129 | I5 | G13 | 125 | 15 |
| G10 | 141 | 16 | G16 | 136 | 16 |
| G13 | I57 | 17 | G2 | 138 | 17 |
| G14 | 161 | 18 | G21 | 152 | 18 |
| G18 | 168 | 19 | G19 | 169 | 19 |
| G23 | 186 | 20 | G23 | 173 | 20 |
| G16 | I87 | 21 | G22 | 190 | 21 |
| G20 | 199 | 22 | G20 | 196 | 22 |
| G21 | 202 | 23 | G17 | 201 | 23 |
Table 4.
Query models for selectivity, drill-down, and roll-up queries.
| Query Models | Model Application | Type | |
|---|---|---|---|
| 1 | QUERYt data WHERE time = Tx WITH Int(T) = Φ | Read, Update | Single selectivity |
| 2 | SaveFew (INTO collection of each node) WITH Int(T) = Φ | Create | Single selectivity |
| 3 | QUERYt data WHERE time >= Tx AND time >= Ty AND Ty-Tx < Δ WITH Int(T) = Φ. | Read, Update | Drill-down query |
| 4 | SaveMany (INTO collection of each node) WITH Int(T) = Φ | Create | Drill-down query |
| 5 | QUERY data WHERE time >= Tx AND time <= Ty AND Ty-Tx > Δ WITH ComNo > Δ OR ComL > Δ IF ComD in (Tx, Ty) WITH Int(T) = Φ | Read, Update | Roll-up query |
| 6 | BulkSave (INTO collection of each node) WITH Int(T) = Φ | Create | Roll-up query |
Table 5.
Data sizes with target records for each category of query.
| Data | Corresponding Records | Number of Target Records | ||
|---|---|---|---|---|
| Insert | Select | Update | ||
| 50 GB | 145,000,000 | 145,000,000 (100%) | 25,000,000 (20%) | 7,250,000 (5%) |
| 100 GB | 290,000,000 | 290,000,000 (100%) | 116,000,000 (40%) | 29,000,000 (10%) |
| 300 GB | 870,000,000 | 870,000,000 (100%) | 435,000,000 (50%) | 174,000,000 (20%) |
| 500 GB | 1,450,000,000 | 1,450,000,000 (100%) | 870,000,000 (60%) | 435,000,000 (30%) |
| 1 TB | 2,900,000,000 | 2,900,000,000 (100%) | 2,030,000,000 (70%) | 1,160,000,000 (40%) |
Table 6.
Execution runtime for the Create operation on single-selectivity for the DSP, Expert1, Expert2, and Expert3 schemas.
Table 6.
Execution runtime for the Create operation on single-selectivity for the DSP, Expert1, Expert2, and Expert3 schemas.
| Data Size | DSP Schema | Expert1 | Expert2 | Expert3 |
|---|---|---|---|---|
| 10 MB | 17 | 498 | 263 | 352 |
| 20 MB | 29 | 529 | 307 | 368 |
| 30 MB | 41 | 553 | 328 | 406 |
| 40 MB | 48 | 599 | 342 | 462 |
| 50 MB | 69 | 717 | 408 | 588 |
| 60 MB | 81 | 767 | 476 | 626 |
Table 7.
Execution runtime for the Create operation on drill-down for the DSP, Expert1, Expert2, and Expert3 schemas.
Table 7.
Execution runtime for the Create operation on drill-down for the DSP, Expert1, Expert2, and Expert3 schemas.
| Data Size | DSP Schema | Expert1 | Expert2 | Expert3 |
|---|---|---|---|---|
| 20 GB | 1079 | 1637 | 1592 | 1711 |
| 50 GB | 1103 | 1656 | 1646 | 1774 |
| 200 GB | 1123 | 1671 | 1674 | 1878 |
| 500 GB | 1134 | 1758 | 1665 | 1912 |
| 700 GB | 1141 | 1853 | 1741 | 2081 |
| 1 TB | 1157 | 1973 | 1879 | 2145 |
Table 8.
Execution runtime for the Create operation on rollup for the DSP, Expert1, Expert2, and Expert3 schemas.
Table 8.
Execution runtime for the Create operation on rollup for the DSP, Expert1, Expert2, and Expert3 schemas.
| Data Size | DSP Schema | Expert1 | Expert2 | Expert3 |
|---|---|---|---|---|
| 20 GB | 2973 | 3724 | 4118 | 4597 |
| 50 GB | 3026 | 3870 | 4162 | 4687 |
| 200 GB | 3032 | 3862 | 4193 | 4786 |
| 500 GB | 3062 | 4042 | 4197 | 4797 |
| 700 GB | 3181 | 4011 | 4263 | 5039 |
| 1 TB | 3188 | 4225 | 4508 | 5137 |
Table 9.
Execution runtime for the Read operation on single-selectivity for the DSP, Expert1, Expert2, and Expert3 schemas (Query 1).
Table 9.
Execution runtime for the Read operation on single-selectivity for the DSP, Expert1, Expert2, and Expert3 schemas (Query 1).
| Data Size | DSP Schema | Expert1 | Expert2 | Expert3 |
|---|---|---|---|---|
| 20 GB | 41 | 387 | 59 | 412 |
| 50 GB | 53 | 378 | 72 | 428 |
| 200 GB | 62 | 412 | 91 | 456 |
| 500 GB | 71 | 425 | 103 | 482 |
| 700 GB | 90 | 451 | 129 | 503 |
| 1 TB | 95 | 491 | 174 | 571 |
Table 10.
Execution runtime for the Read operation on drill-down for the DSP, Expert1, Expert2, and Expert3 schemas (Query 2).
Table 10.
Execution runtime for the Read operation on drill-down for the DSP, Expert1, Expert2, and Expert3 schemas (Query 2).
| Data Size | DSP Schema | Expert1 | Expert2 | Expert3 |
|---|---|---|---|---|
| 20 GB | 446 | 2492 | 1367 | 2466 |
| 50 GB | 449 | 2501 | 1389 | 2575 |
| 200 GB | 478 | 2517 | 1396 | 2691 |
| 500 GB | 486 | 2530 | 1514 | 2677 |
| 700 GB | 514 | 2556 | 1542 | 2876 |
| 1 TB | 519 | 2587 | 1614 | 3174 |
Table 11.
Execution runtime for the Read operation on drill-down for the DSP, Expert1, Expert2, and Expert3 schemas (Query 3).
Table 11.
Execution runtime for the Read operation on drill-down for the DSP, Expert1, Expert2, and Expert3 schemas (Query 3).
| Data Size | DSP Schema | Expert1 | Expert2 | Expert3 |
|---|---|---|---|---|
| 20 GB | 1027 | 4095 | 2634 | 3120 |
| 50 GB | 1037 | 4116 | 2673 | 3141 |
| 200 GB | 1068 | 4314 | 2803 | 3349 |
| 500 GB | 1064 | 4542 | 2948 | 3767 |
| 700 GB | 1190 | 4764 | 3148 | 3889 |
| 1 TB | 1225 | 4937 | 3441 | 4262 |
Table 12.
Execution runtime for the Read operation on the rollup for the DSP, Expert1, Expert2, and Expert3 schemas (Query 4).
Table 12.
Execution runtime for the Read operation on the rollup for the DSP, Expert1, Expert2, and Expert3 schemas (Query 4).
| Data Size | DSP Schema | Expert1 | Expert2 | Expert3 |
|---|---|---|---|---|
| 20 GB | 2355 | 5666 | 5028 | 5922 |
| 50 GB | 2567 | 5977 | 5446 | 6622 |
| 200 GB | 2778 | 5991 | 5957 | 7298 |
| 500 GB | 2785 | 6004 | 6171 | 7838 |
| 700 GB | 2903 | 6330 | 6412 | 8288 |
| 1 TB | 2975 | 6760 | 7270 | 9231 |
Publisher’s Note: MDPI stays neutral with regard to jurisdictional claims in published maps and institutional affiliations. |
© 2020 by the authors. Licensee MDPI, Basel, Switzerland. This article is an open access article distributed under the terms and conditions of the Creative Commons Attribution (CC BY) license (http://creativecommons.org/licenses/by/4.0/).
Share and Cite
MDPI and ACS Style
Imam, A.A.; Basri, S.; Ahmad, R.; Wahab, A.A.; González-Aparicio, M.T.; Capretz, L.F.; Alazzawi, A.K.; Balogun, A.O. DSP: Schema Design for Non-Relational Applications. Symmetry 2020, 12, 1799. https://doi.org/10.3390/sym12111799
AMA Style
Imam AA, Basri S, Ahmad R, Wahab AA, González-Aparicio MT, Capretz LF, Alazzawi AK, Balogun AO. DSP: Schema Design for Non-Relational Applications. Symmetry. 2020; 12(11):1799. https://doi.org/10.3390/sym12111799
Chicago/Turabian StyleImam, Abdullahi Abubakar, Shuib Basri, Rohiza Ahmad, Amirudin A. Wahab, María T. González-Aparicio, Luiz Fernando Capretz, Ammar K. Alazzawi, and Abdullateef O. Balogun. 2020. "DSP: Schema Design for Non-Relational Applications" Symmetry 12, no. 11: 1799. https://doi.org/10.3390/sym12111799
Note that from the first issue of 2016, this journal uses article numbers instead of page numbers. See further details here.