Frequency-Selective Wallpaper for Indoor Interference Reduction and MIMO Capacity Improvement

 , , and
Abstract
:1. Introduction
2. Wallpaper Design
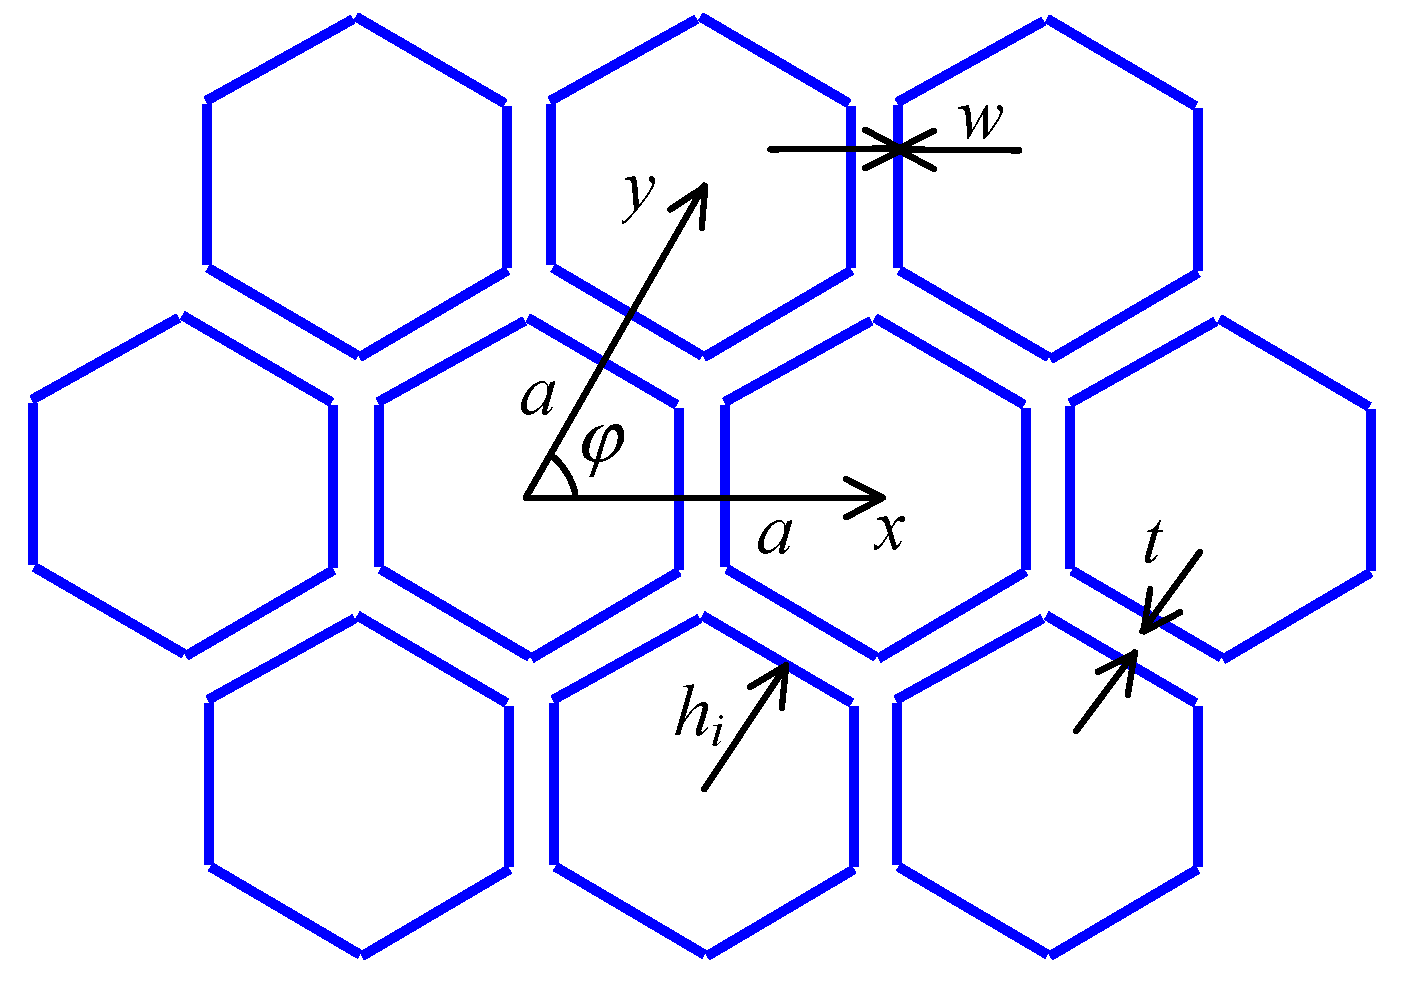
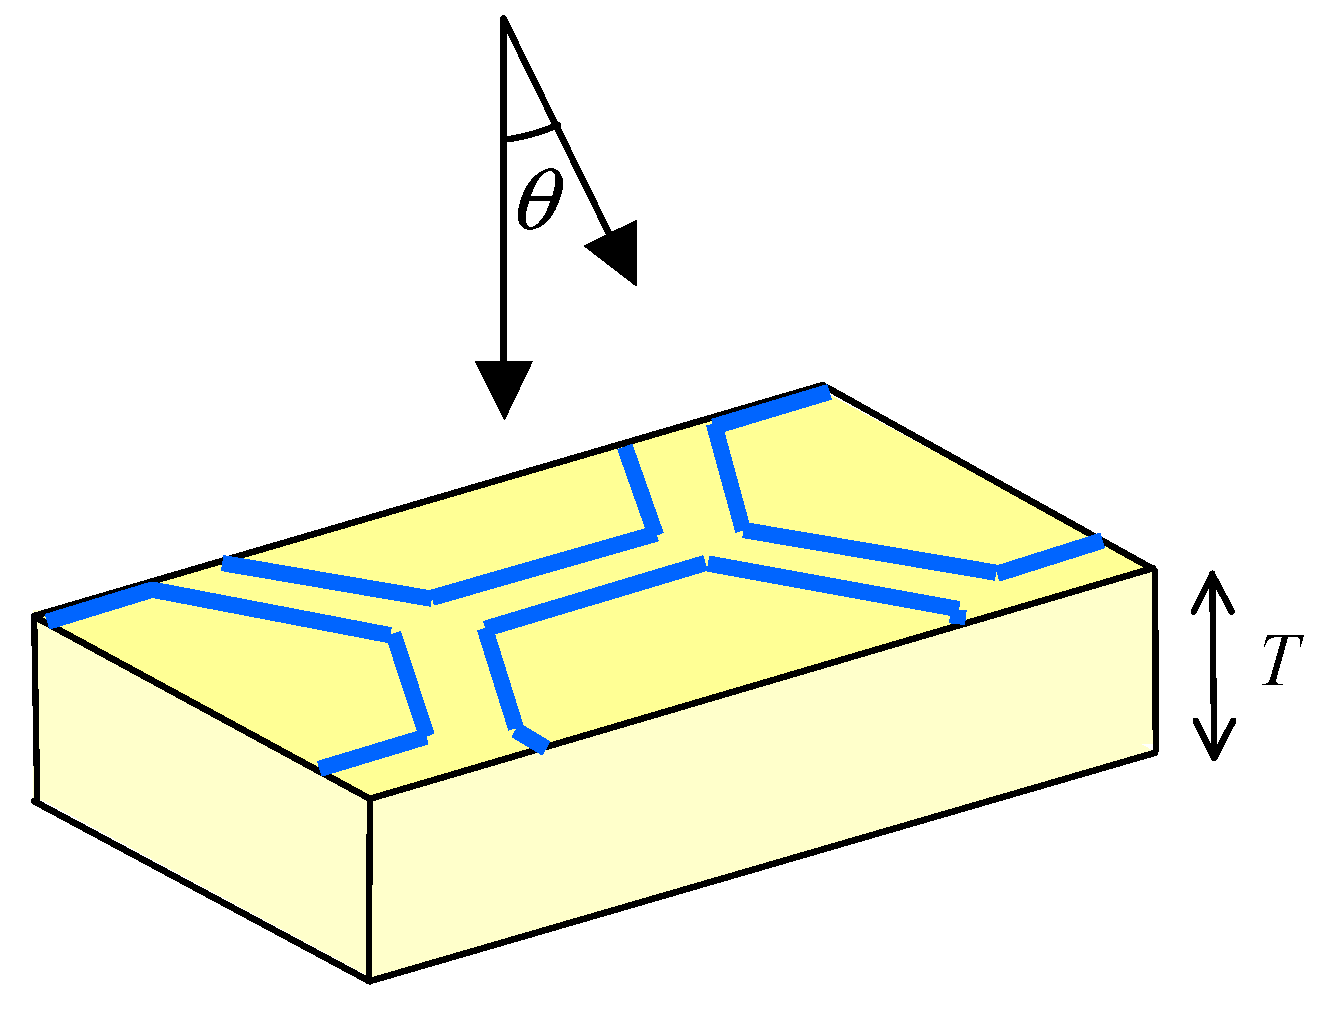
2.1. Frequency-Selective Surfaces
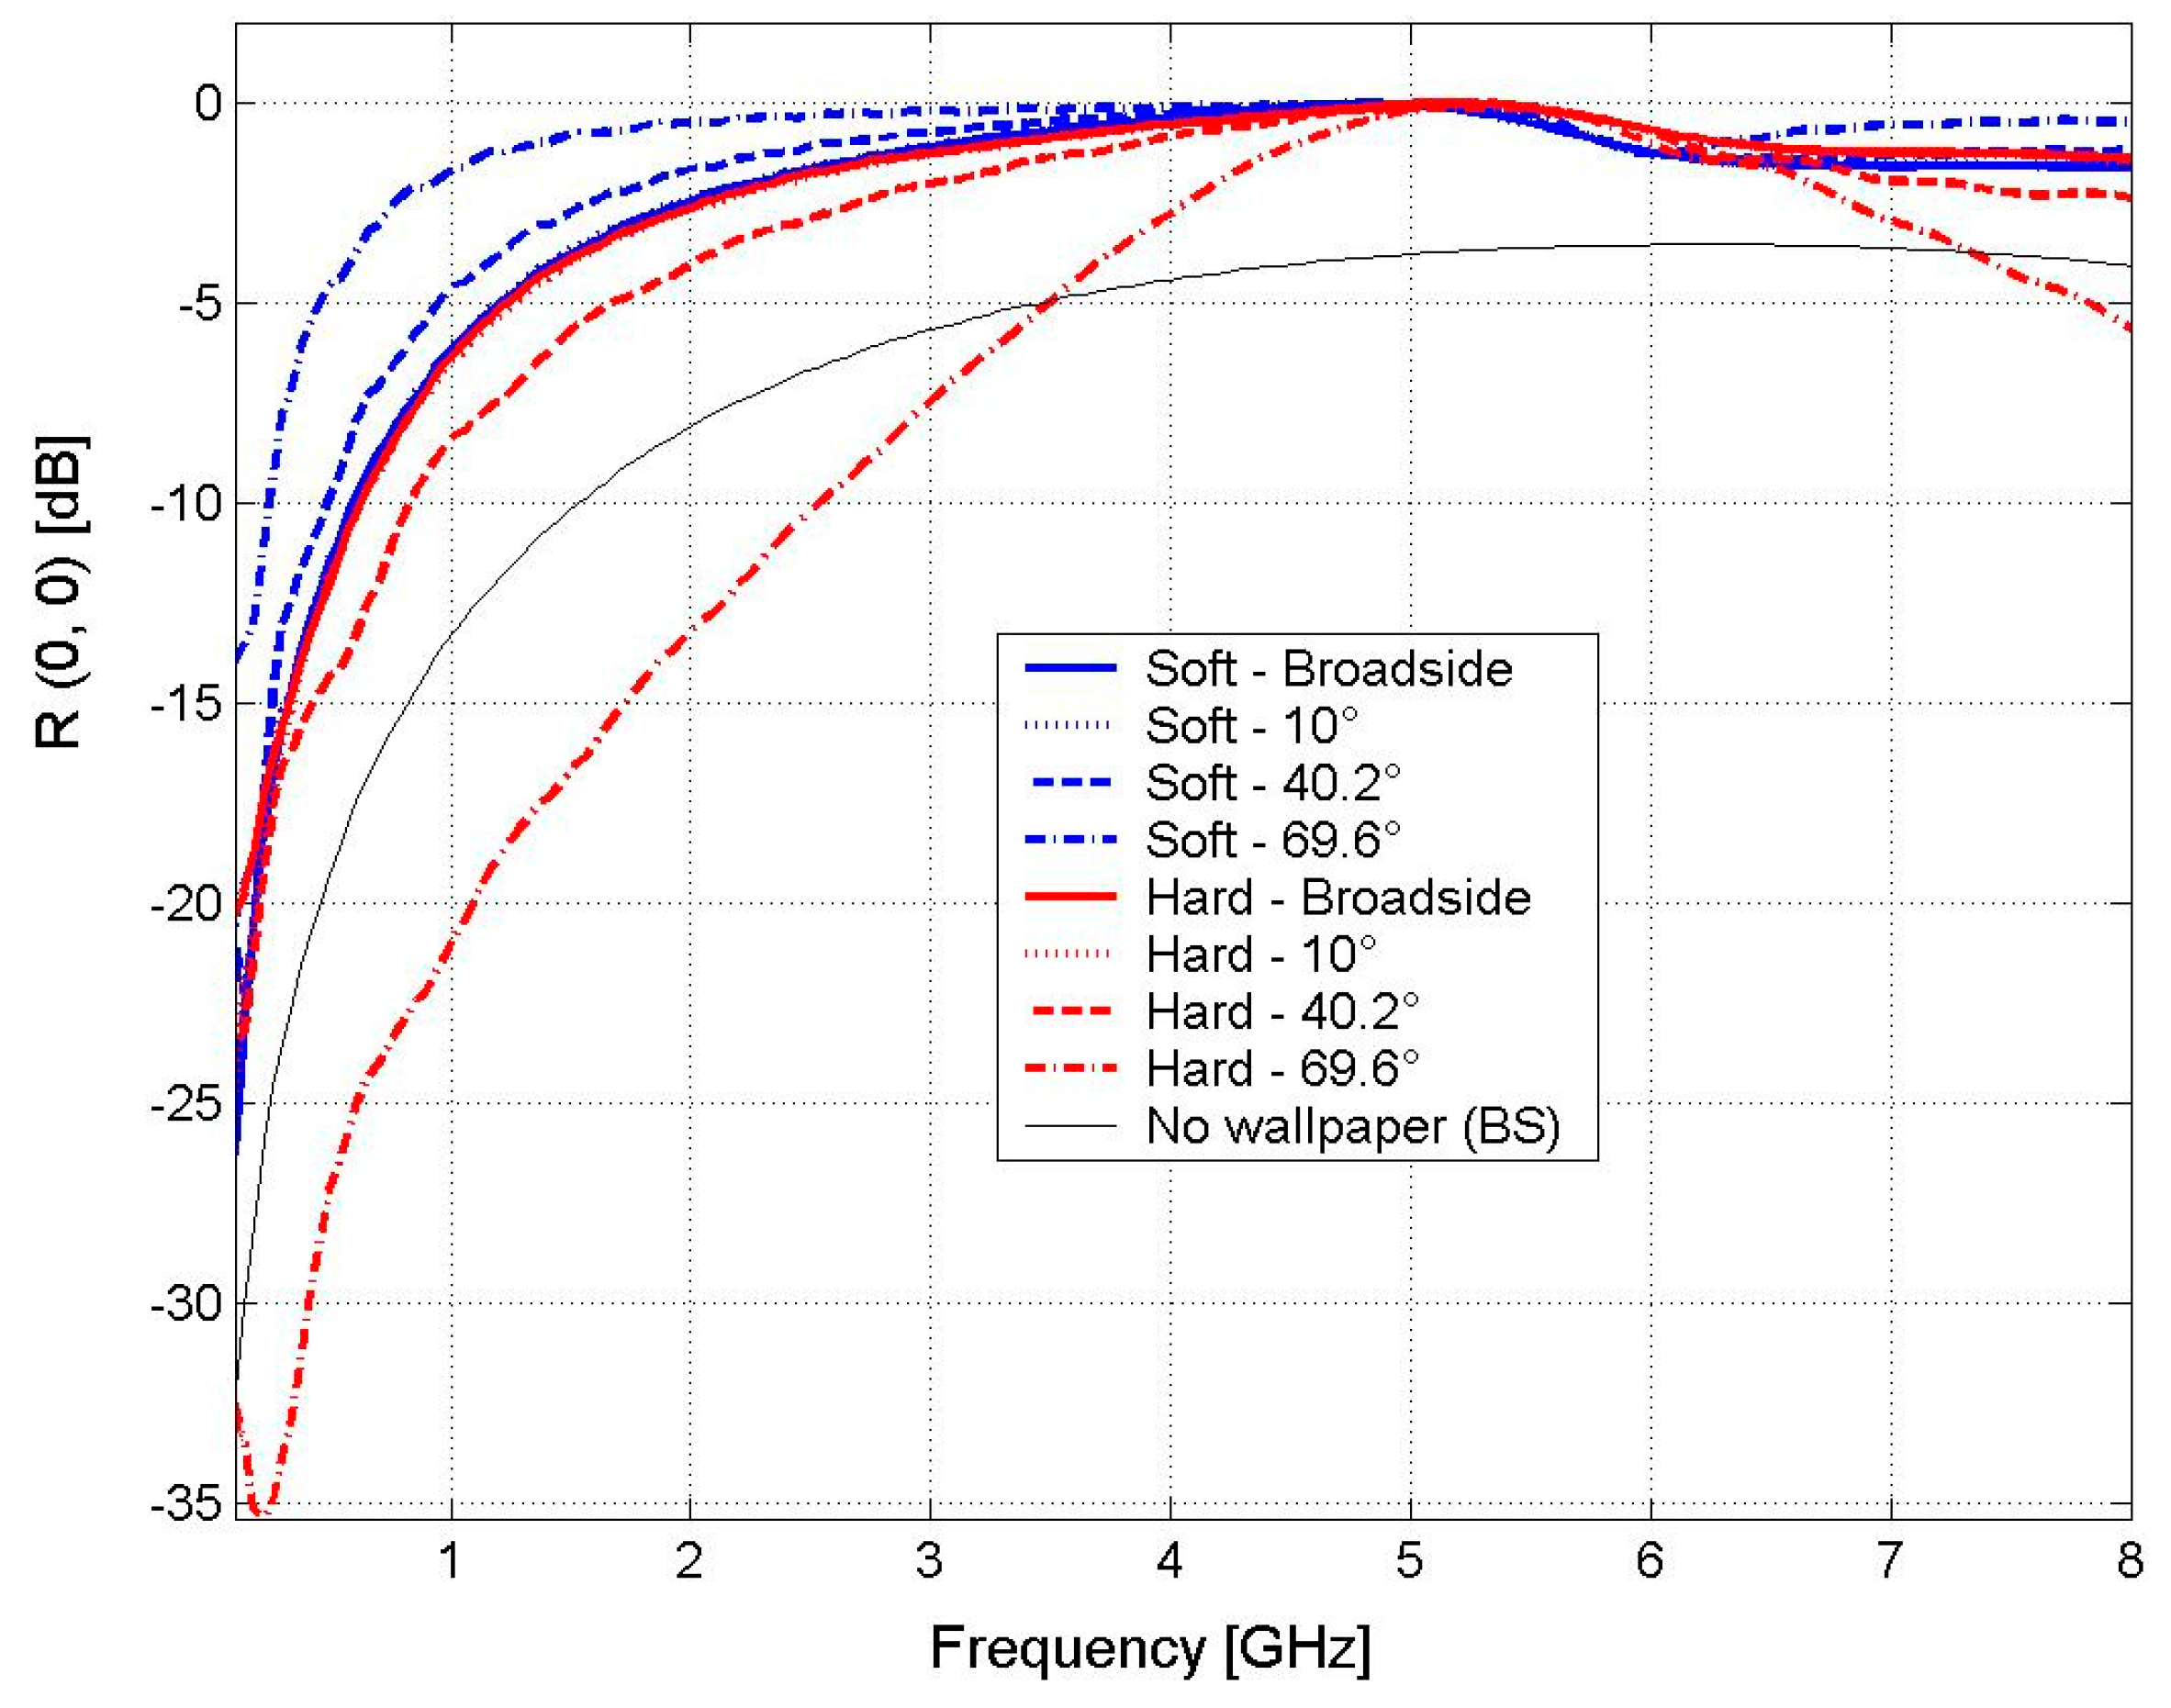
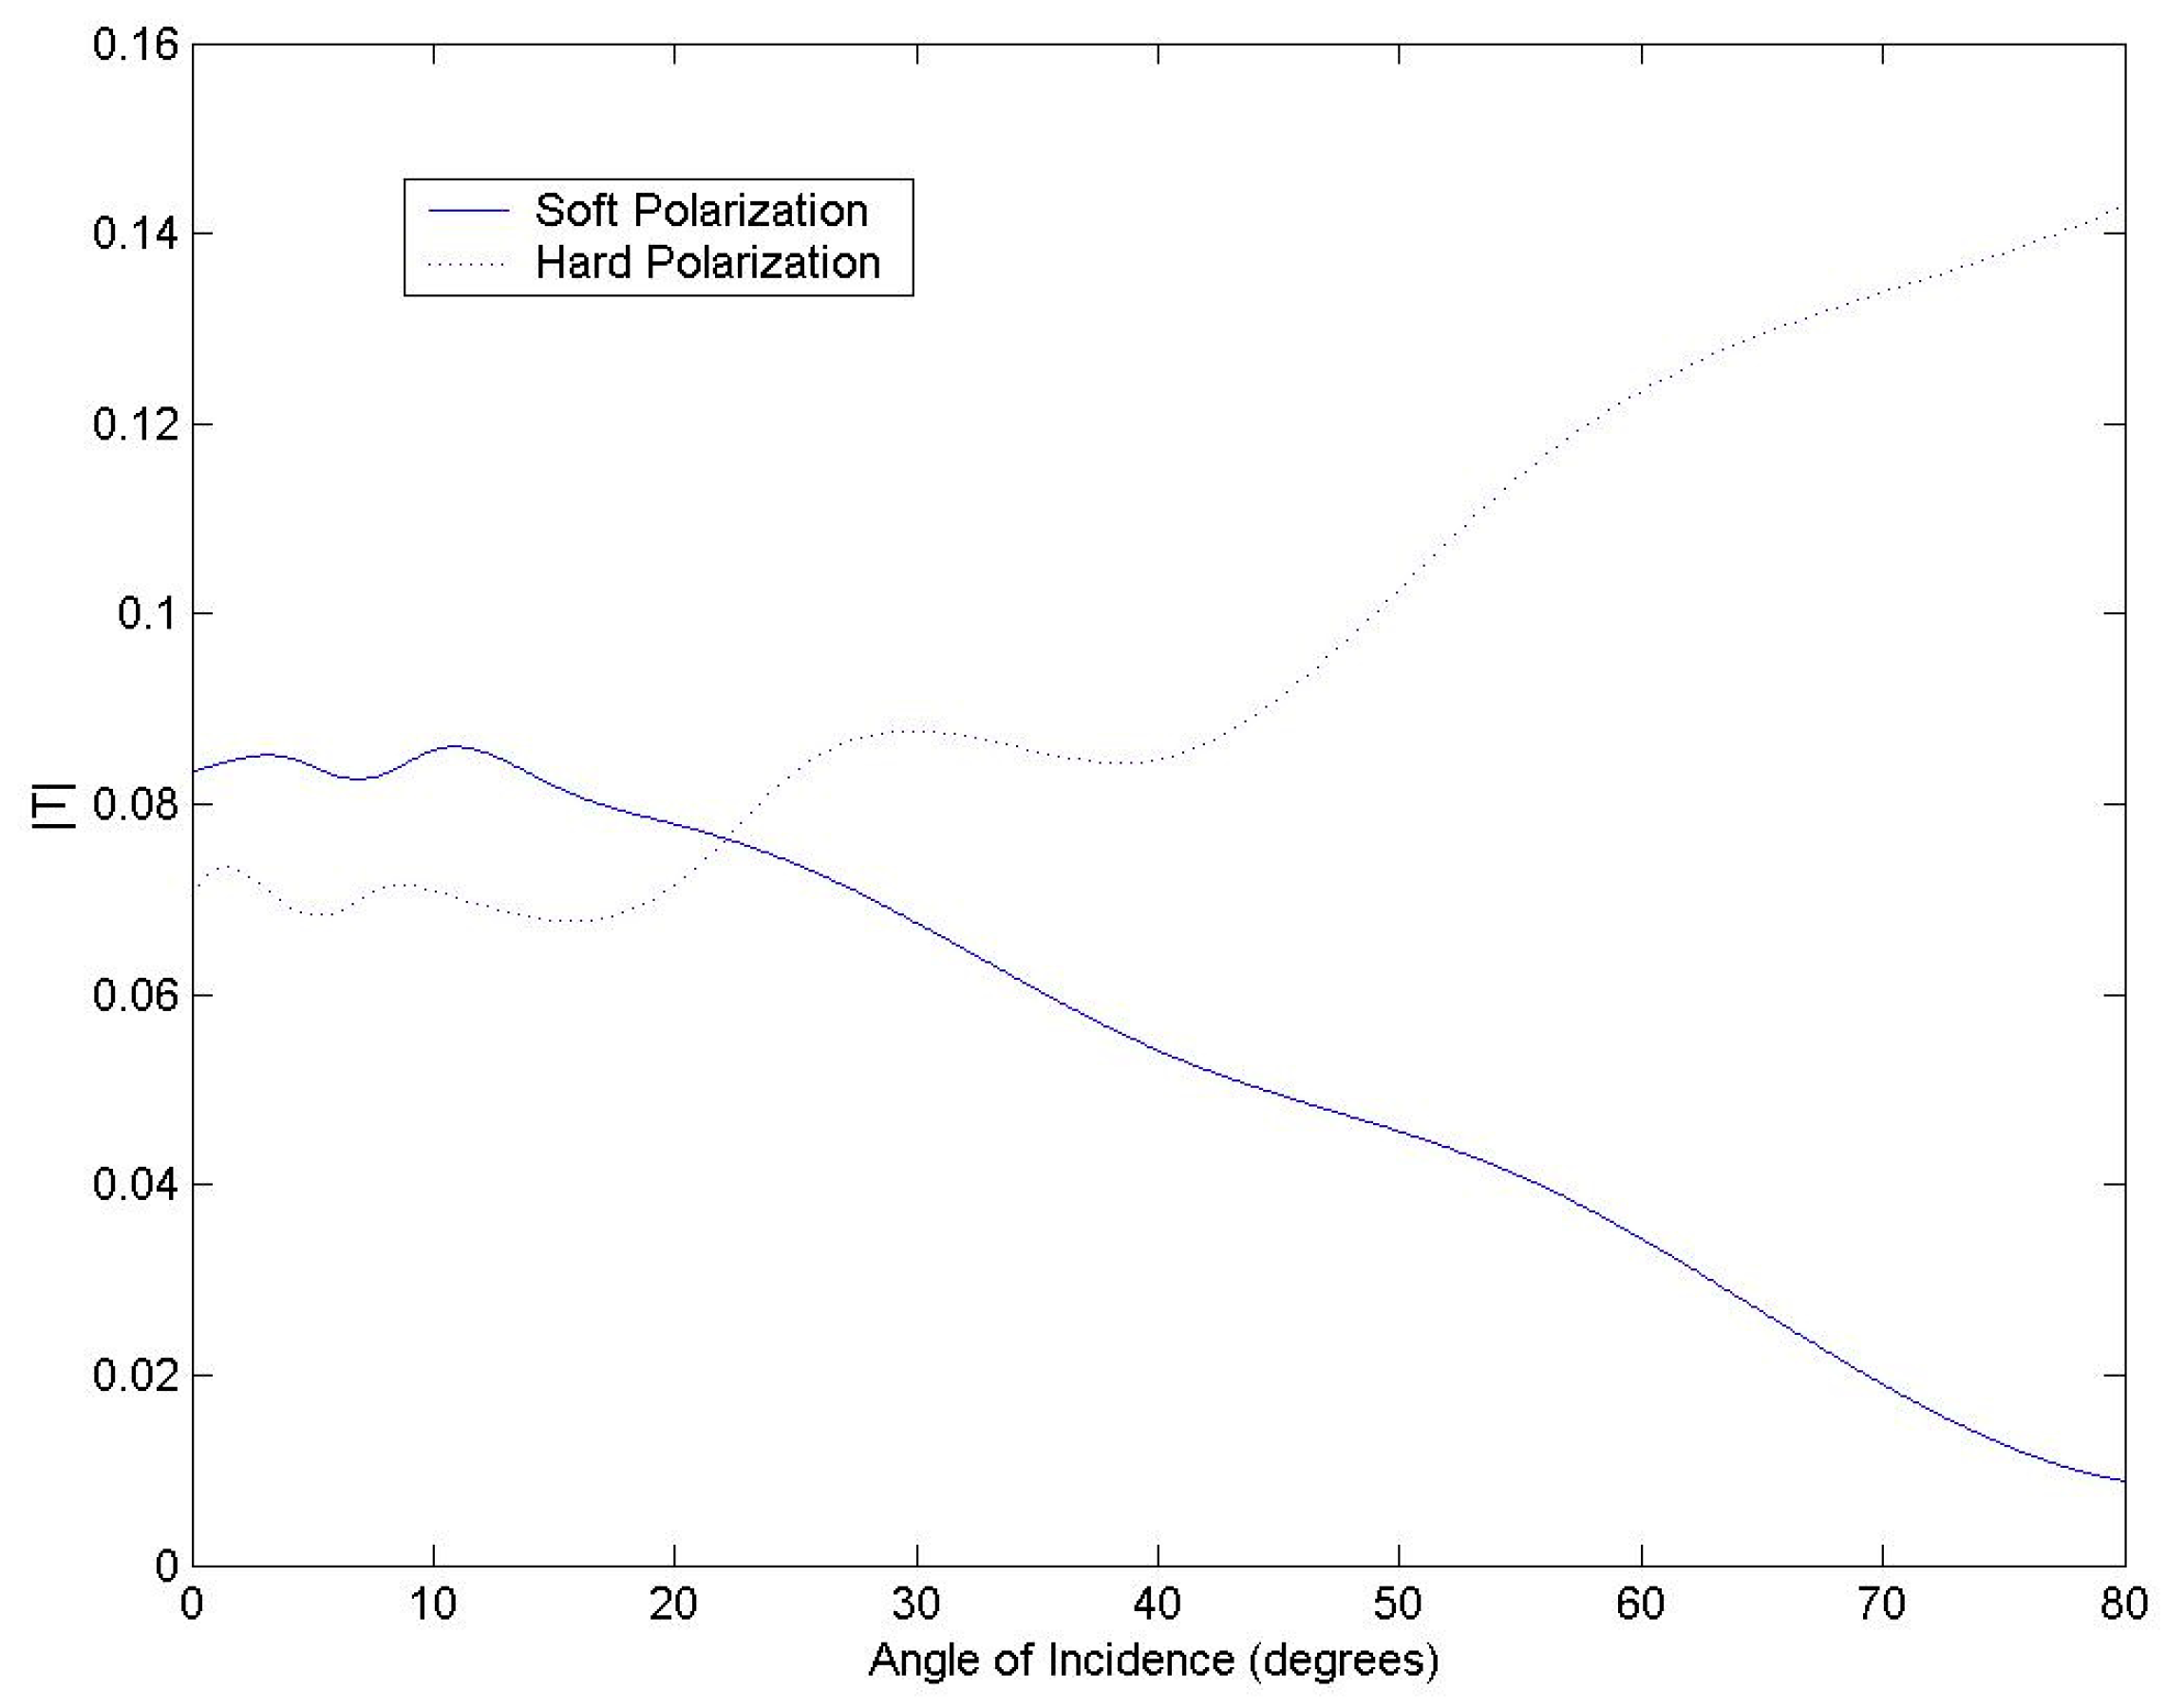
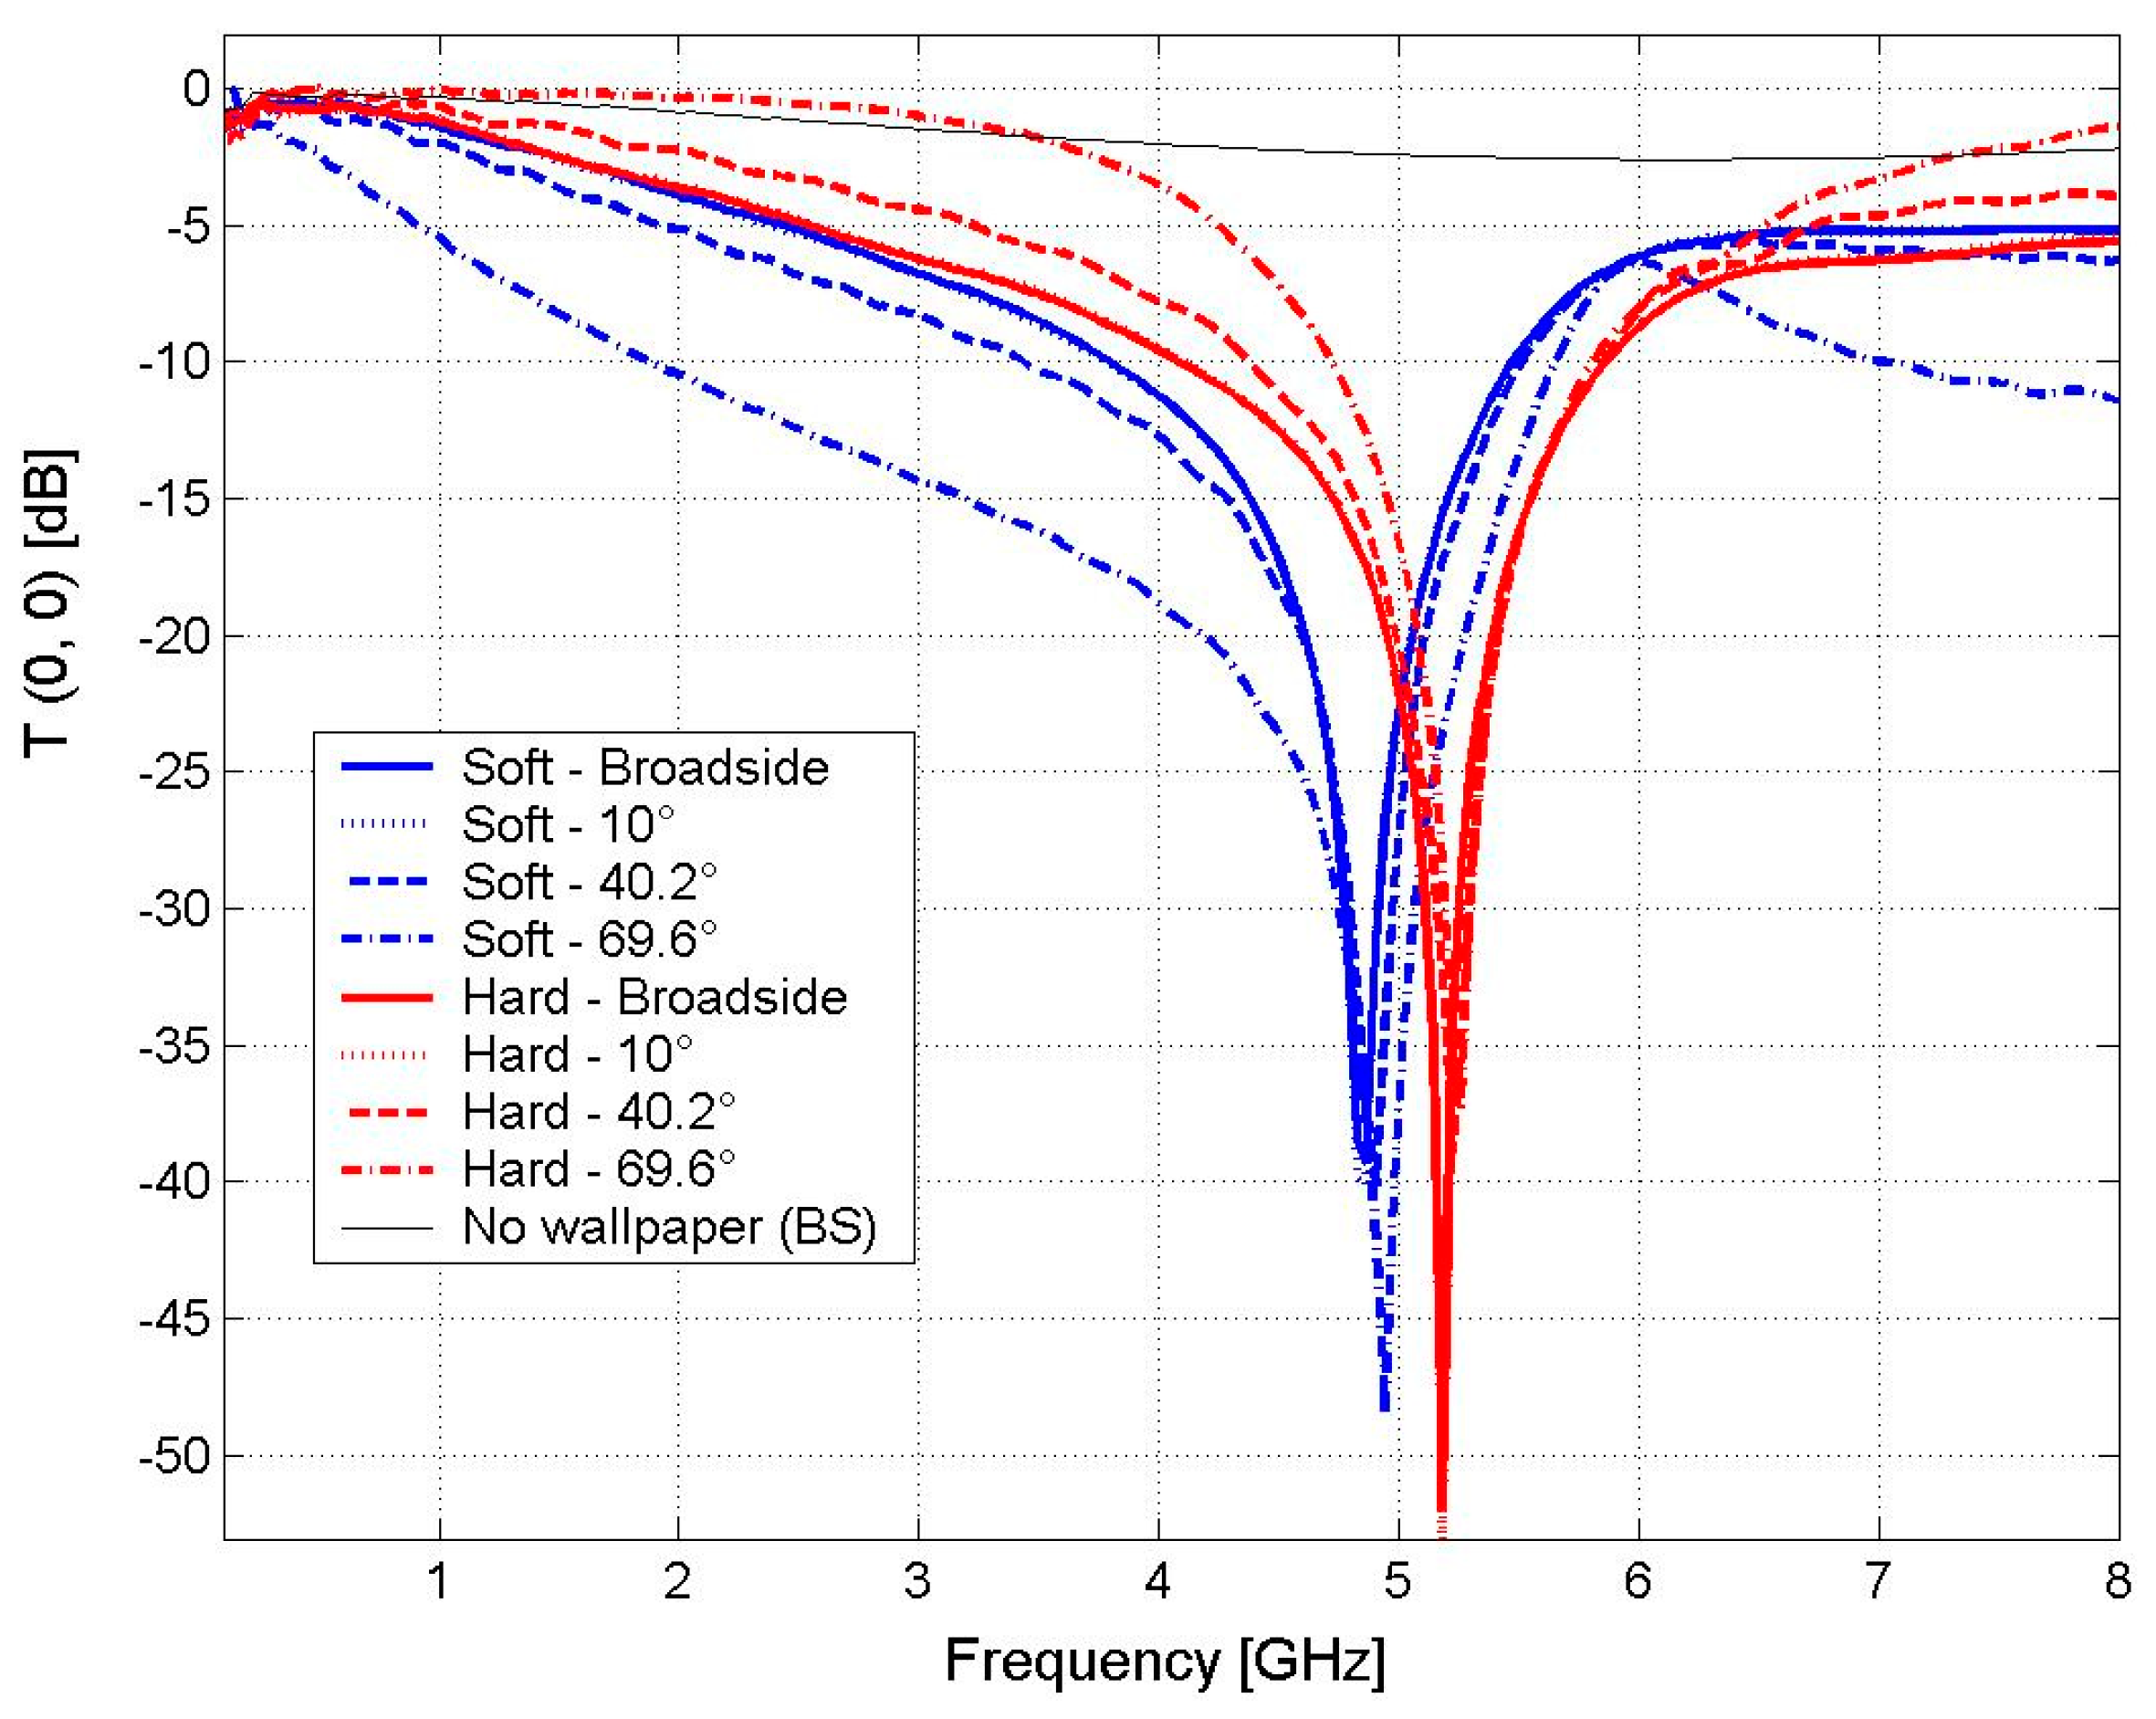
2.2. Wallpaper with Low Transmission at 5 GHz
2.2.1. Wallpaper with Gypsum Wall
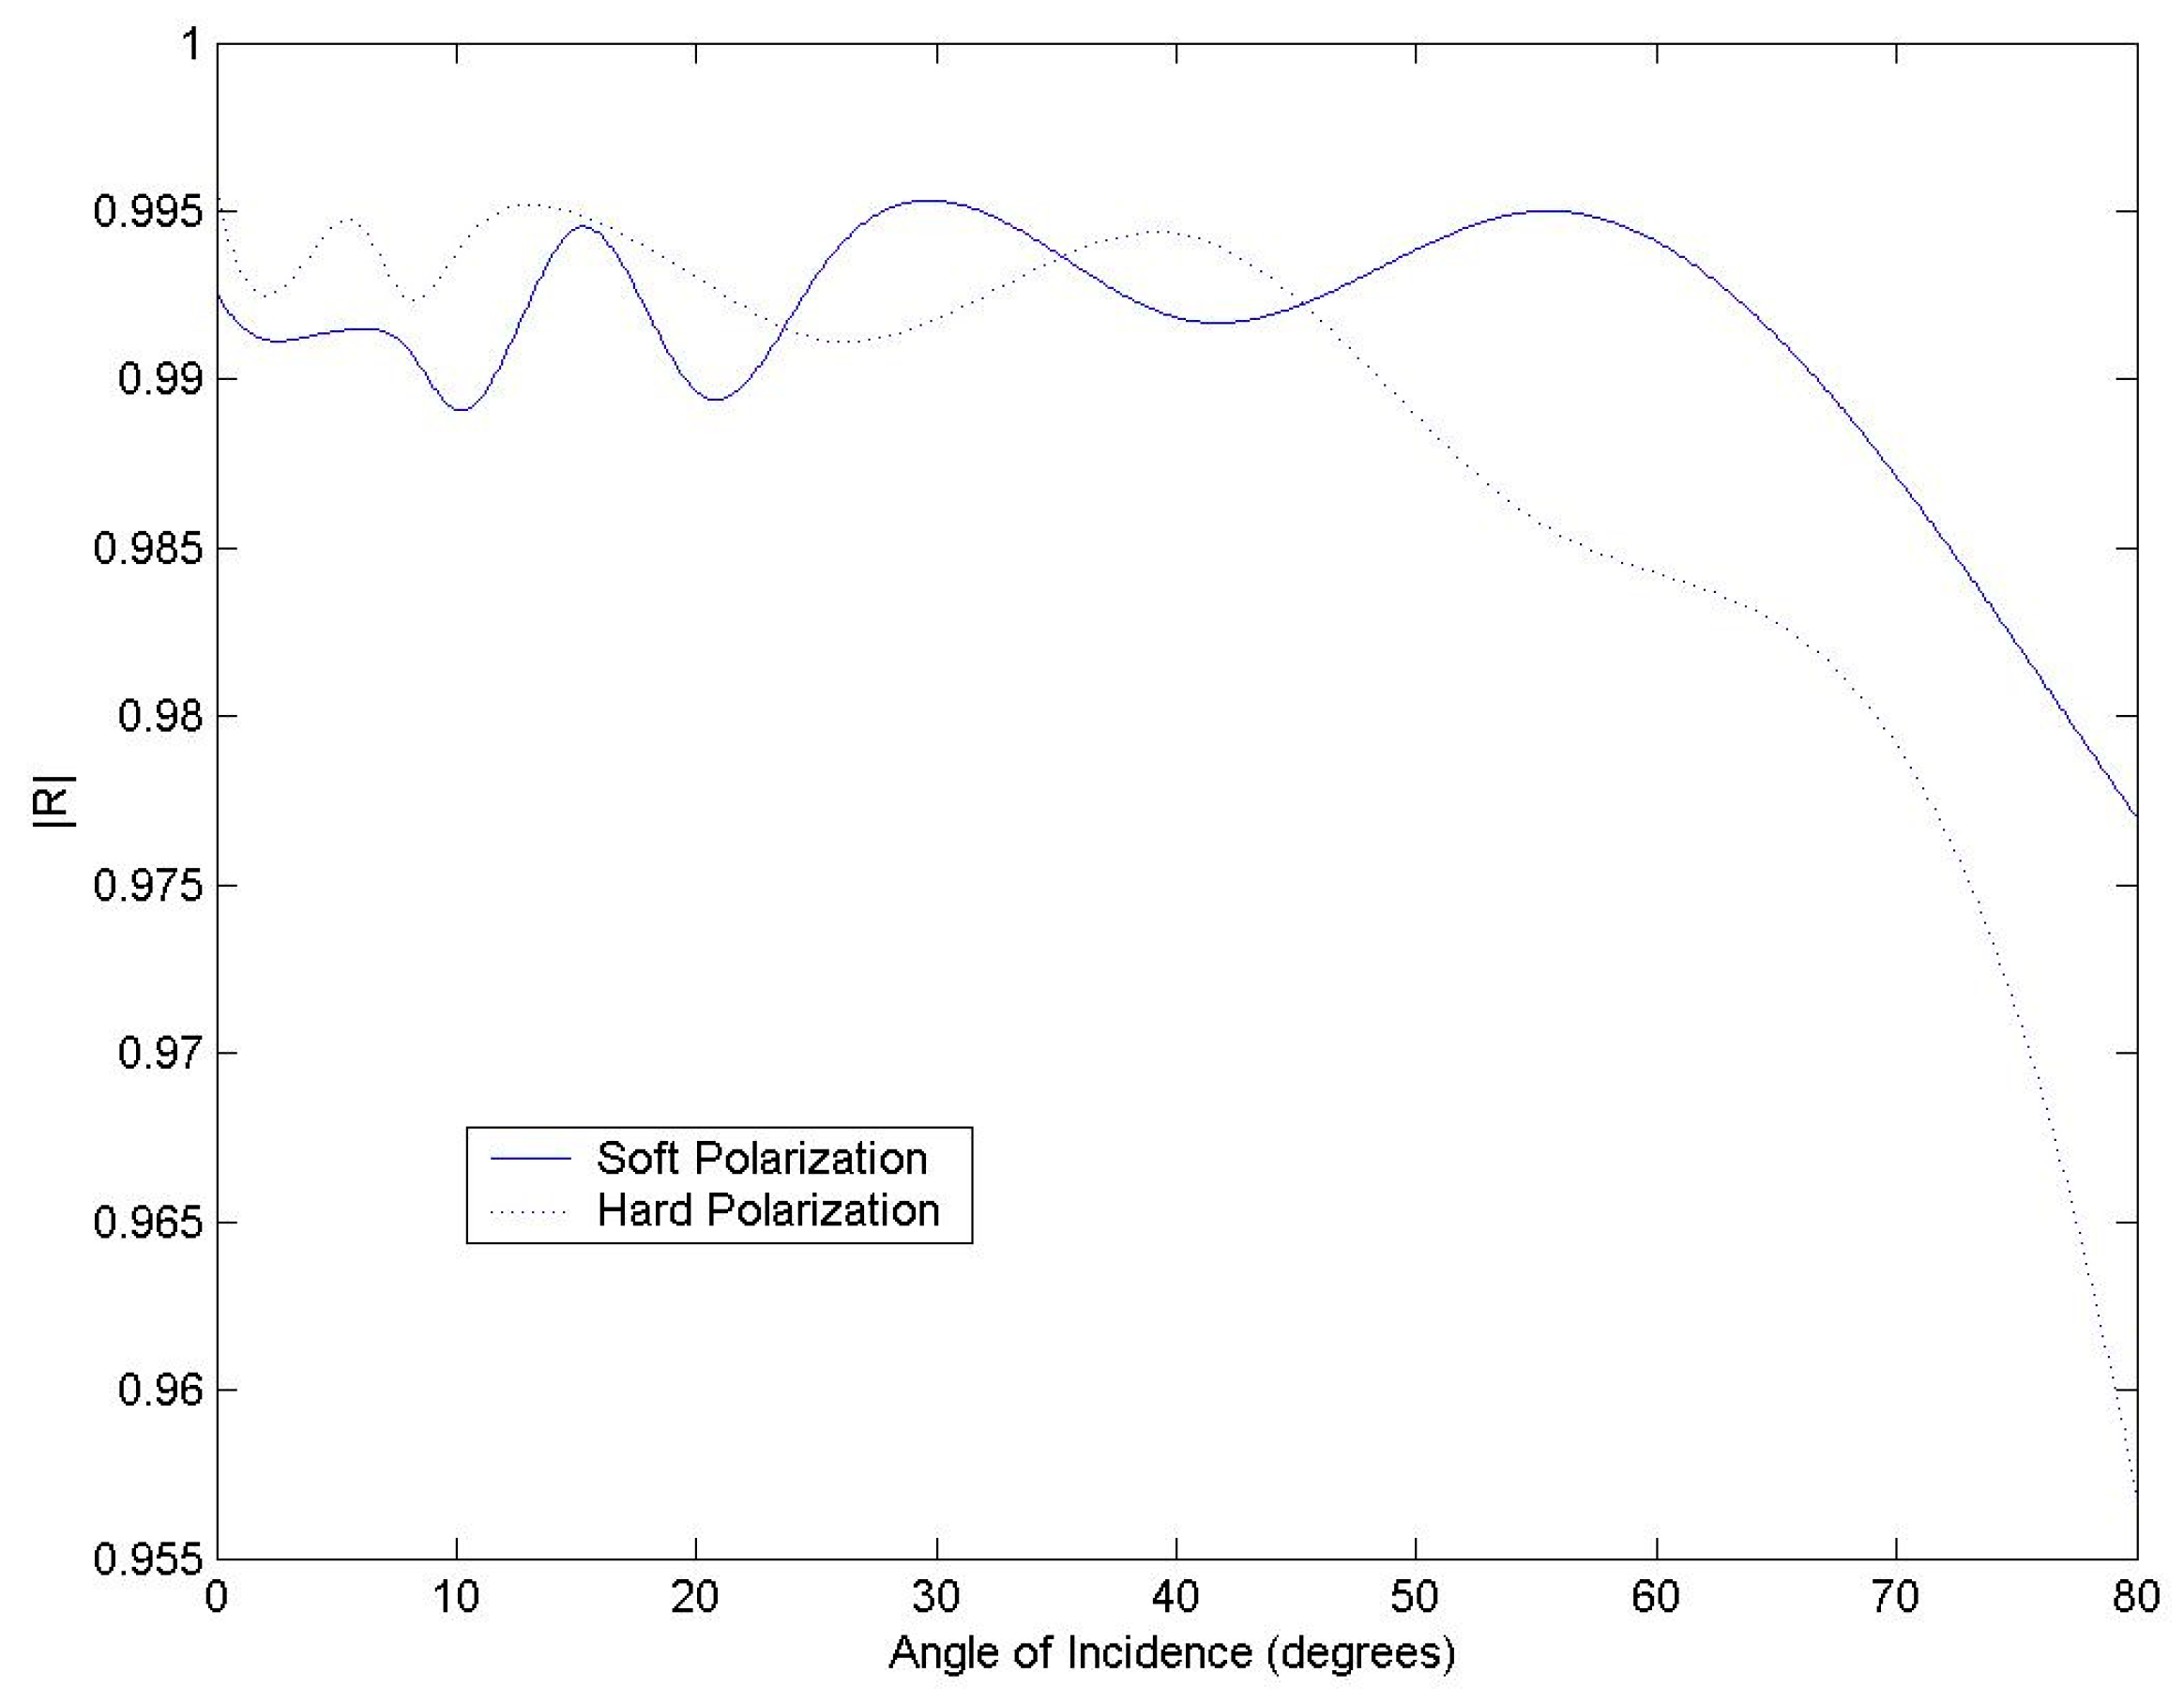
2.2.2. Gypsum Wall Only
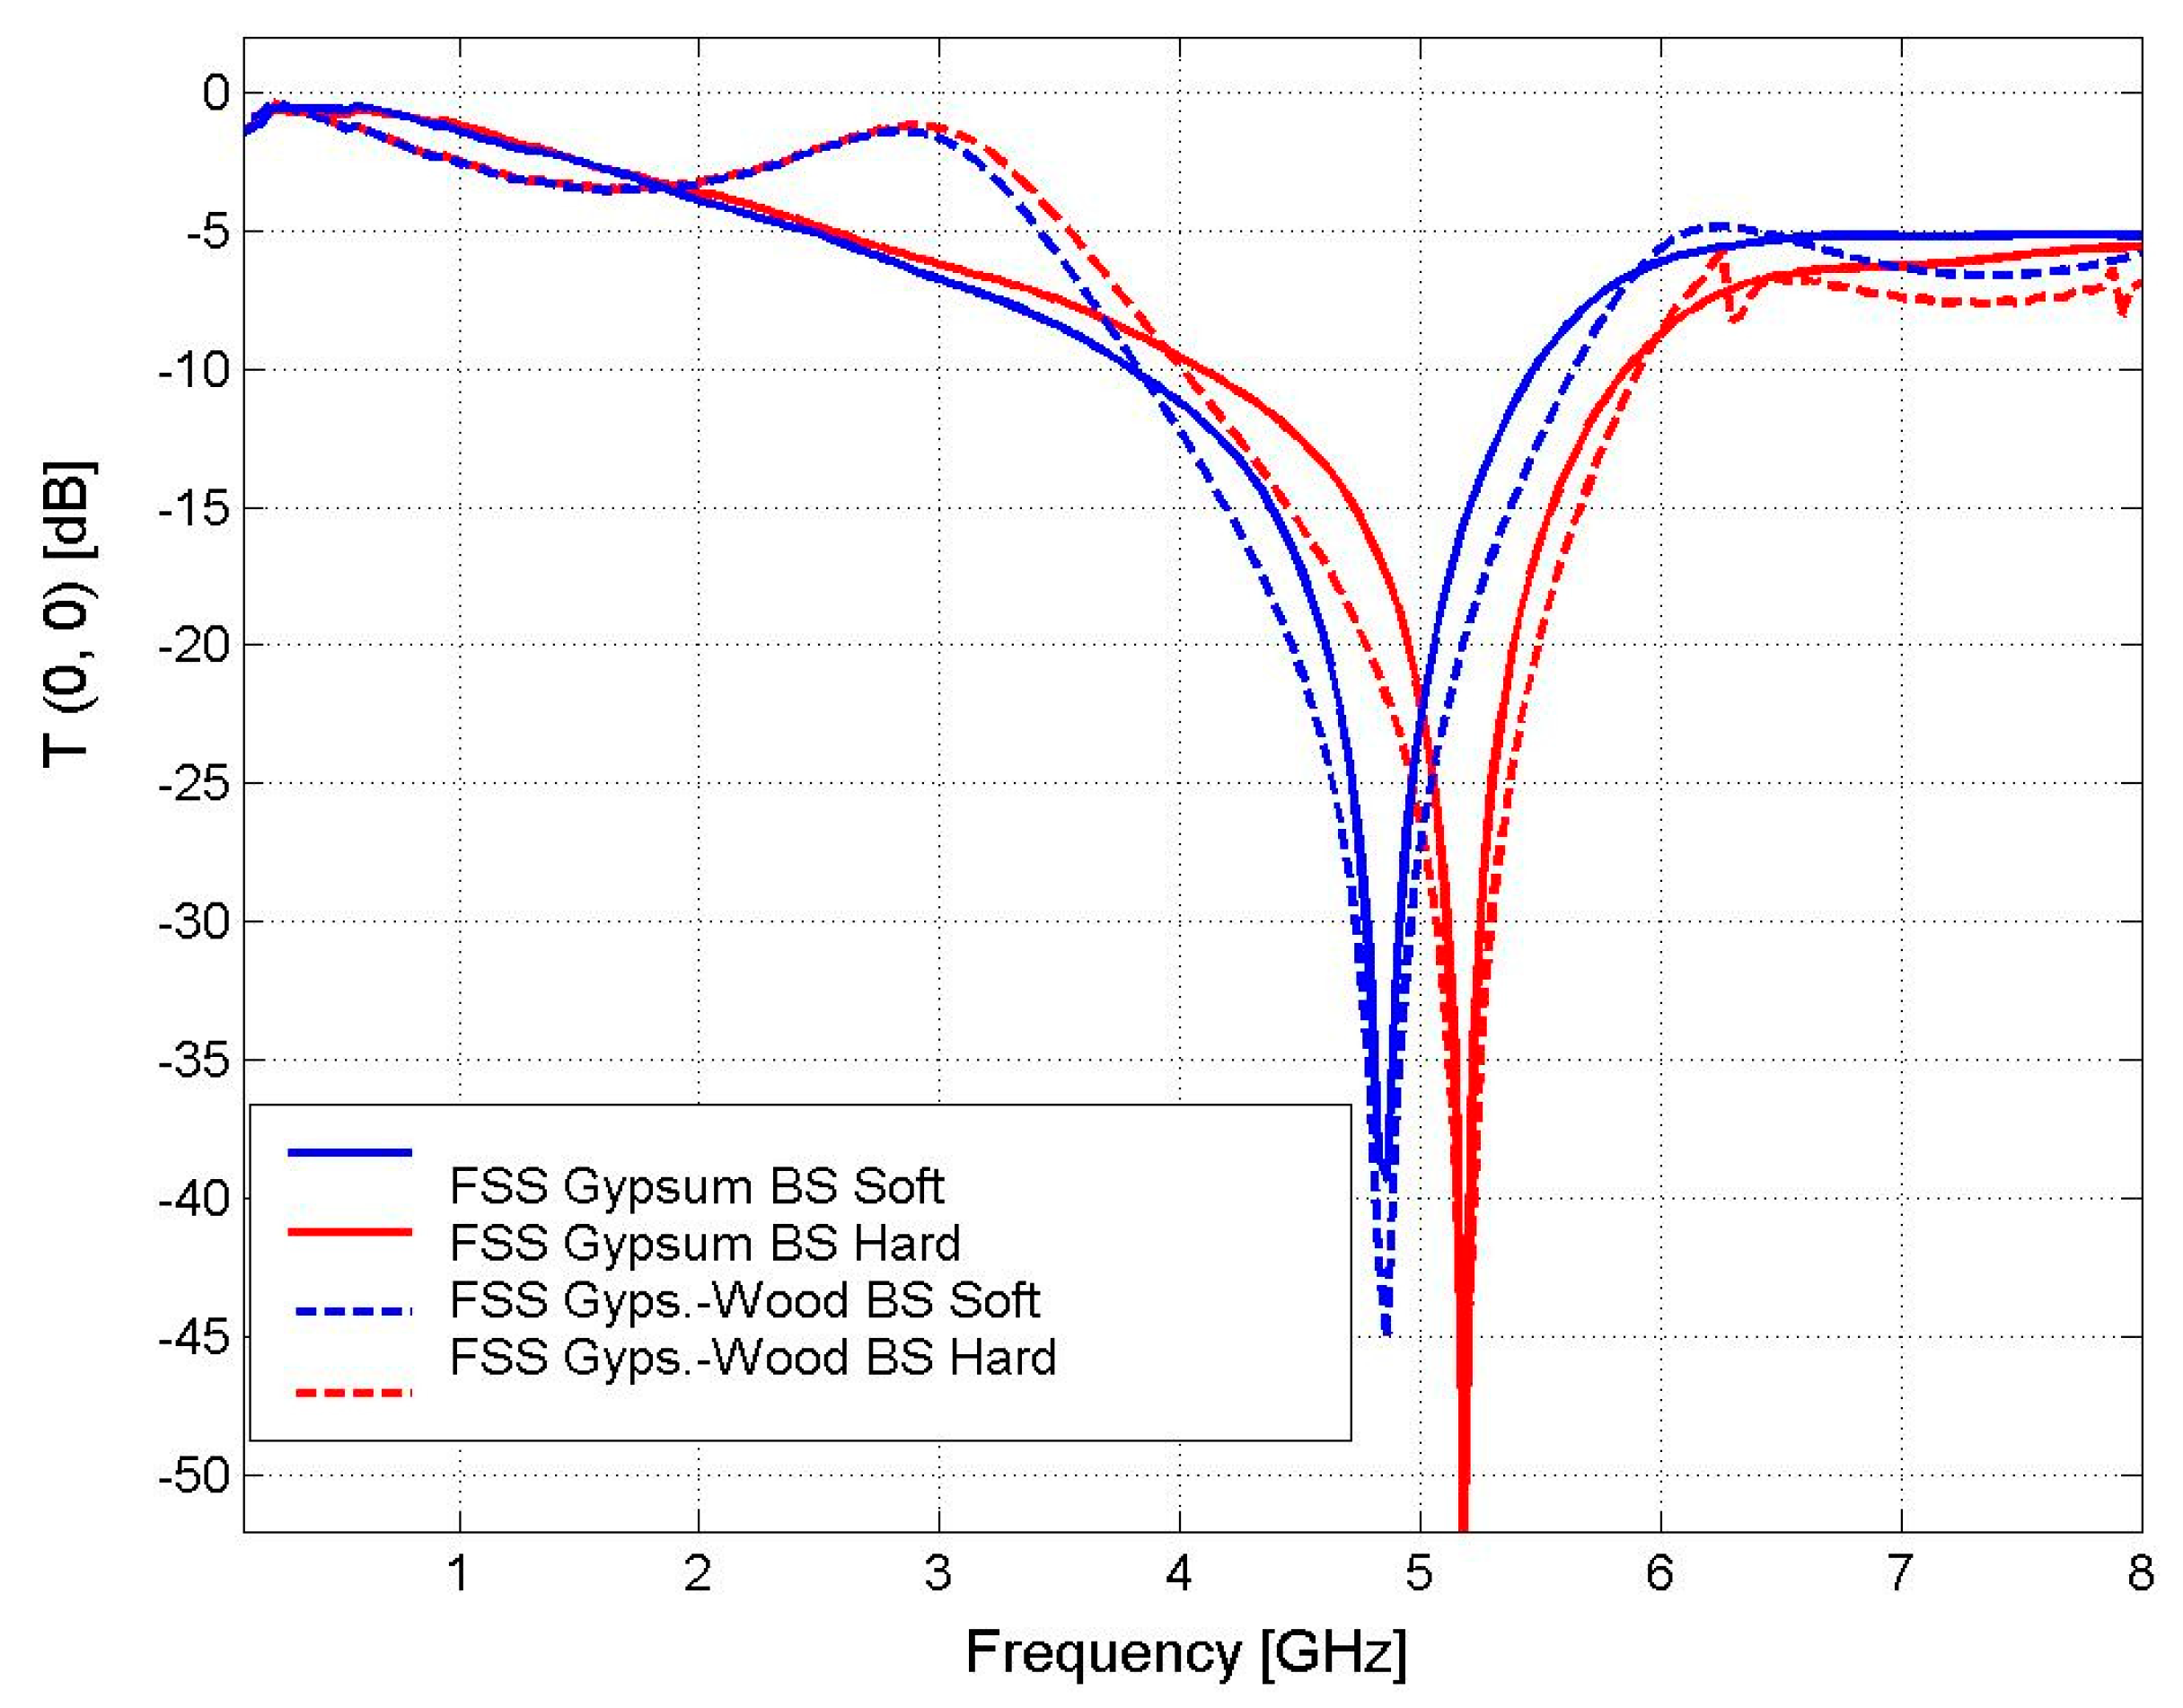
2.2.3. Wallpaper Attached onto Other Structures
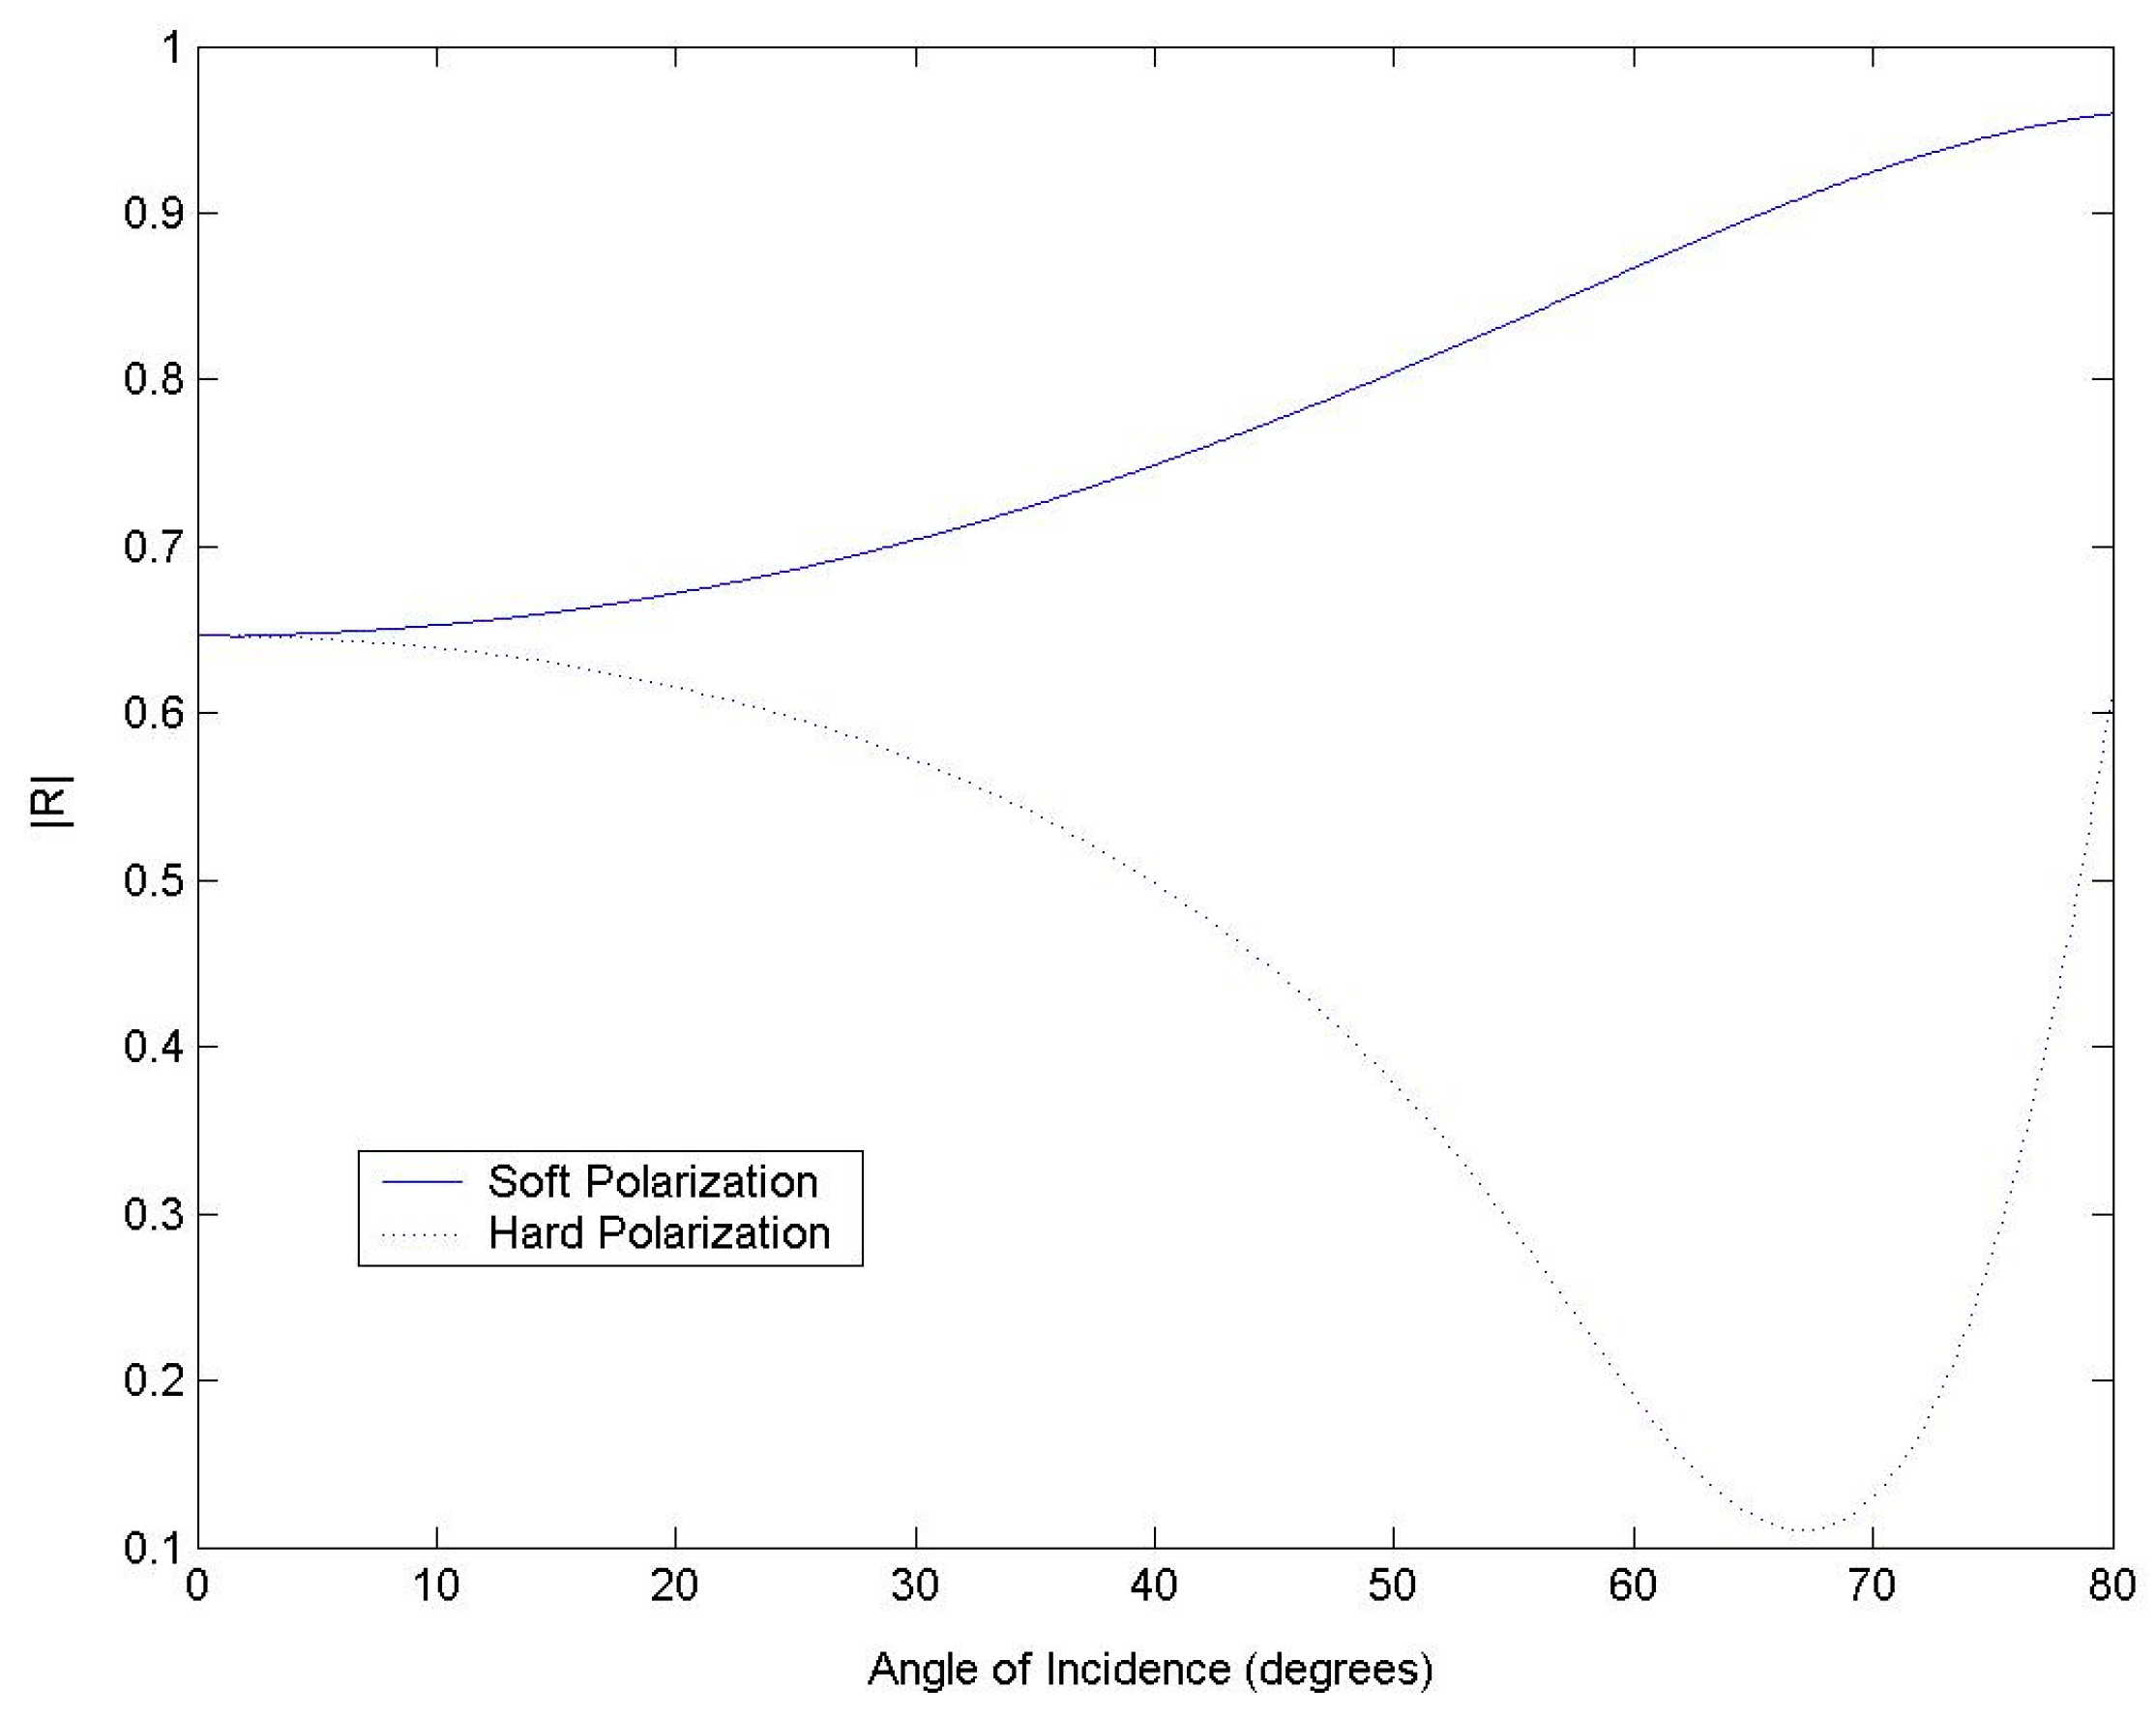
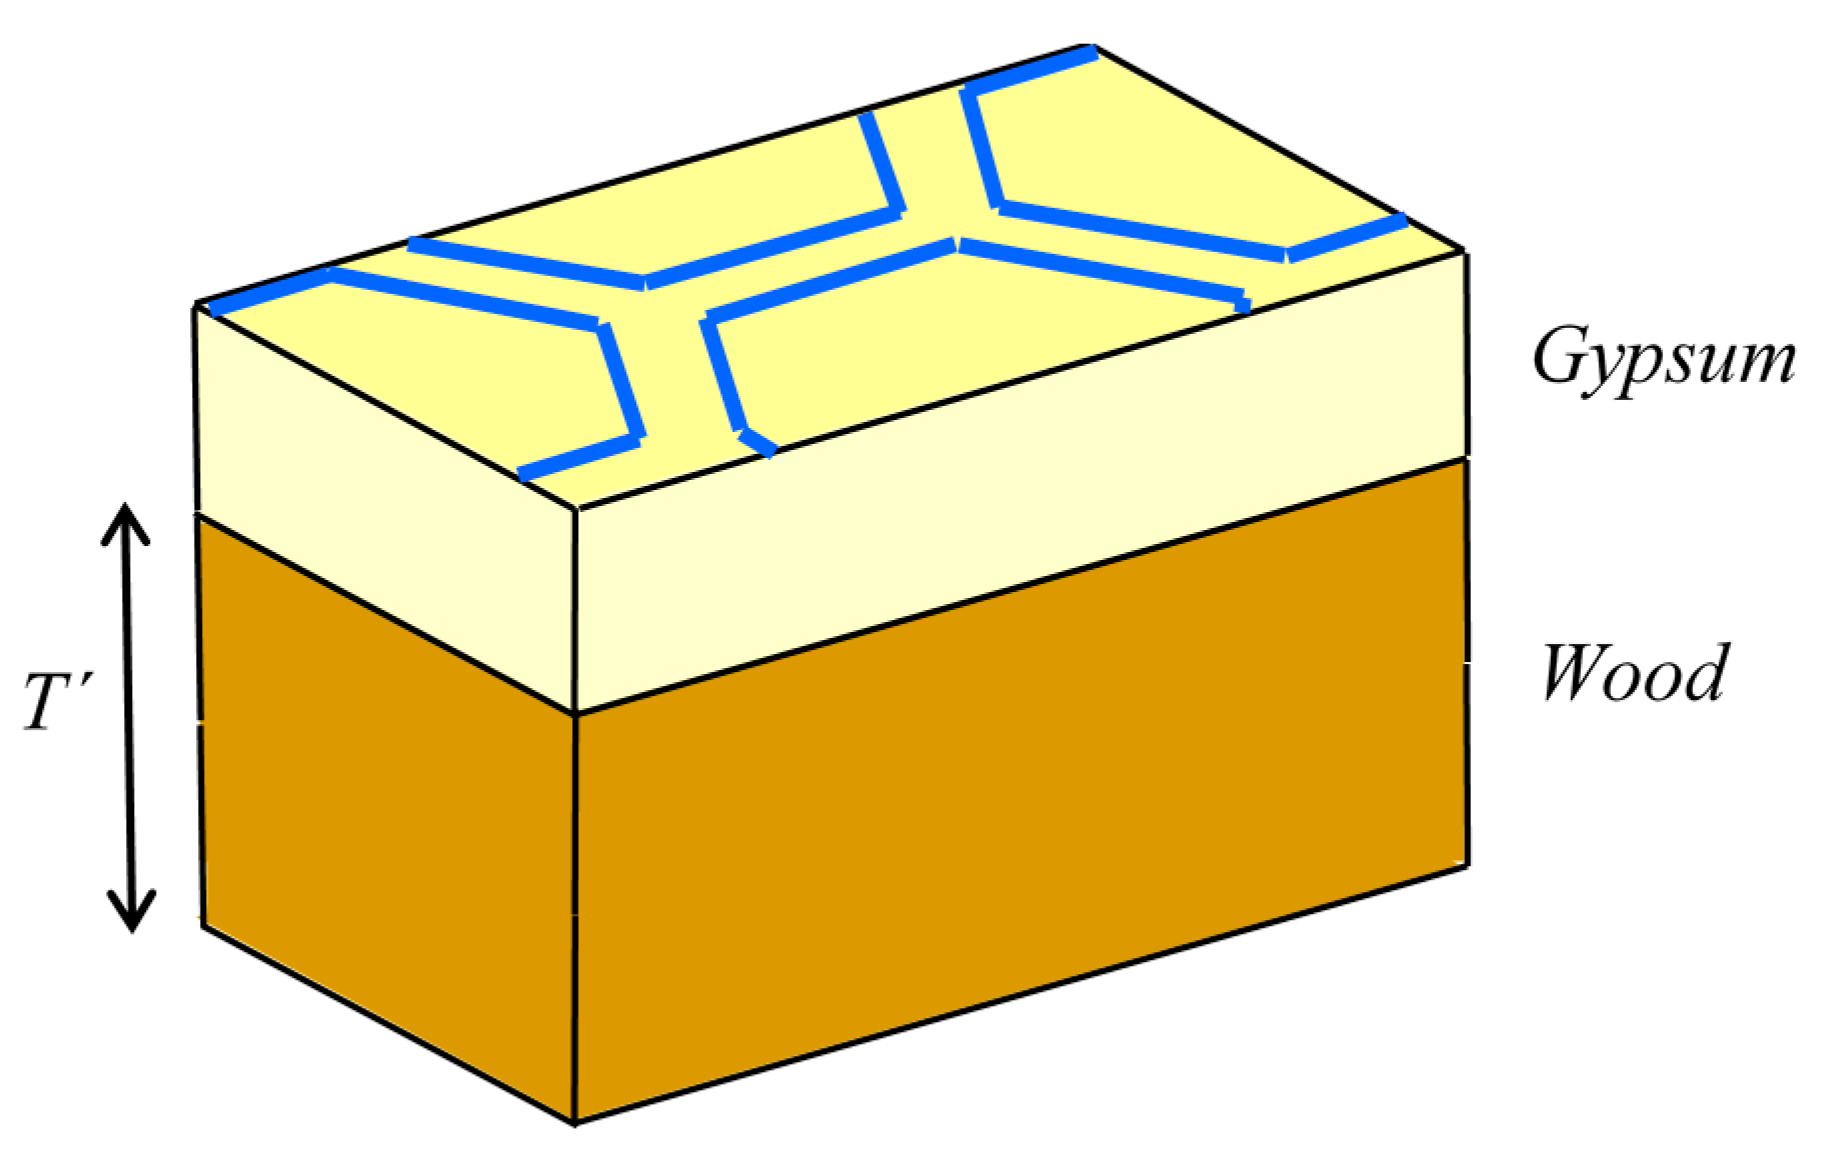
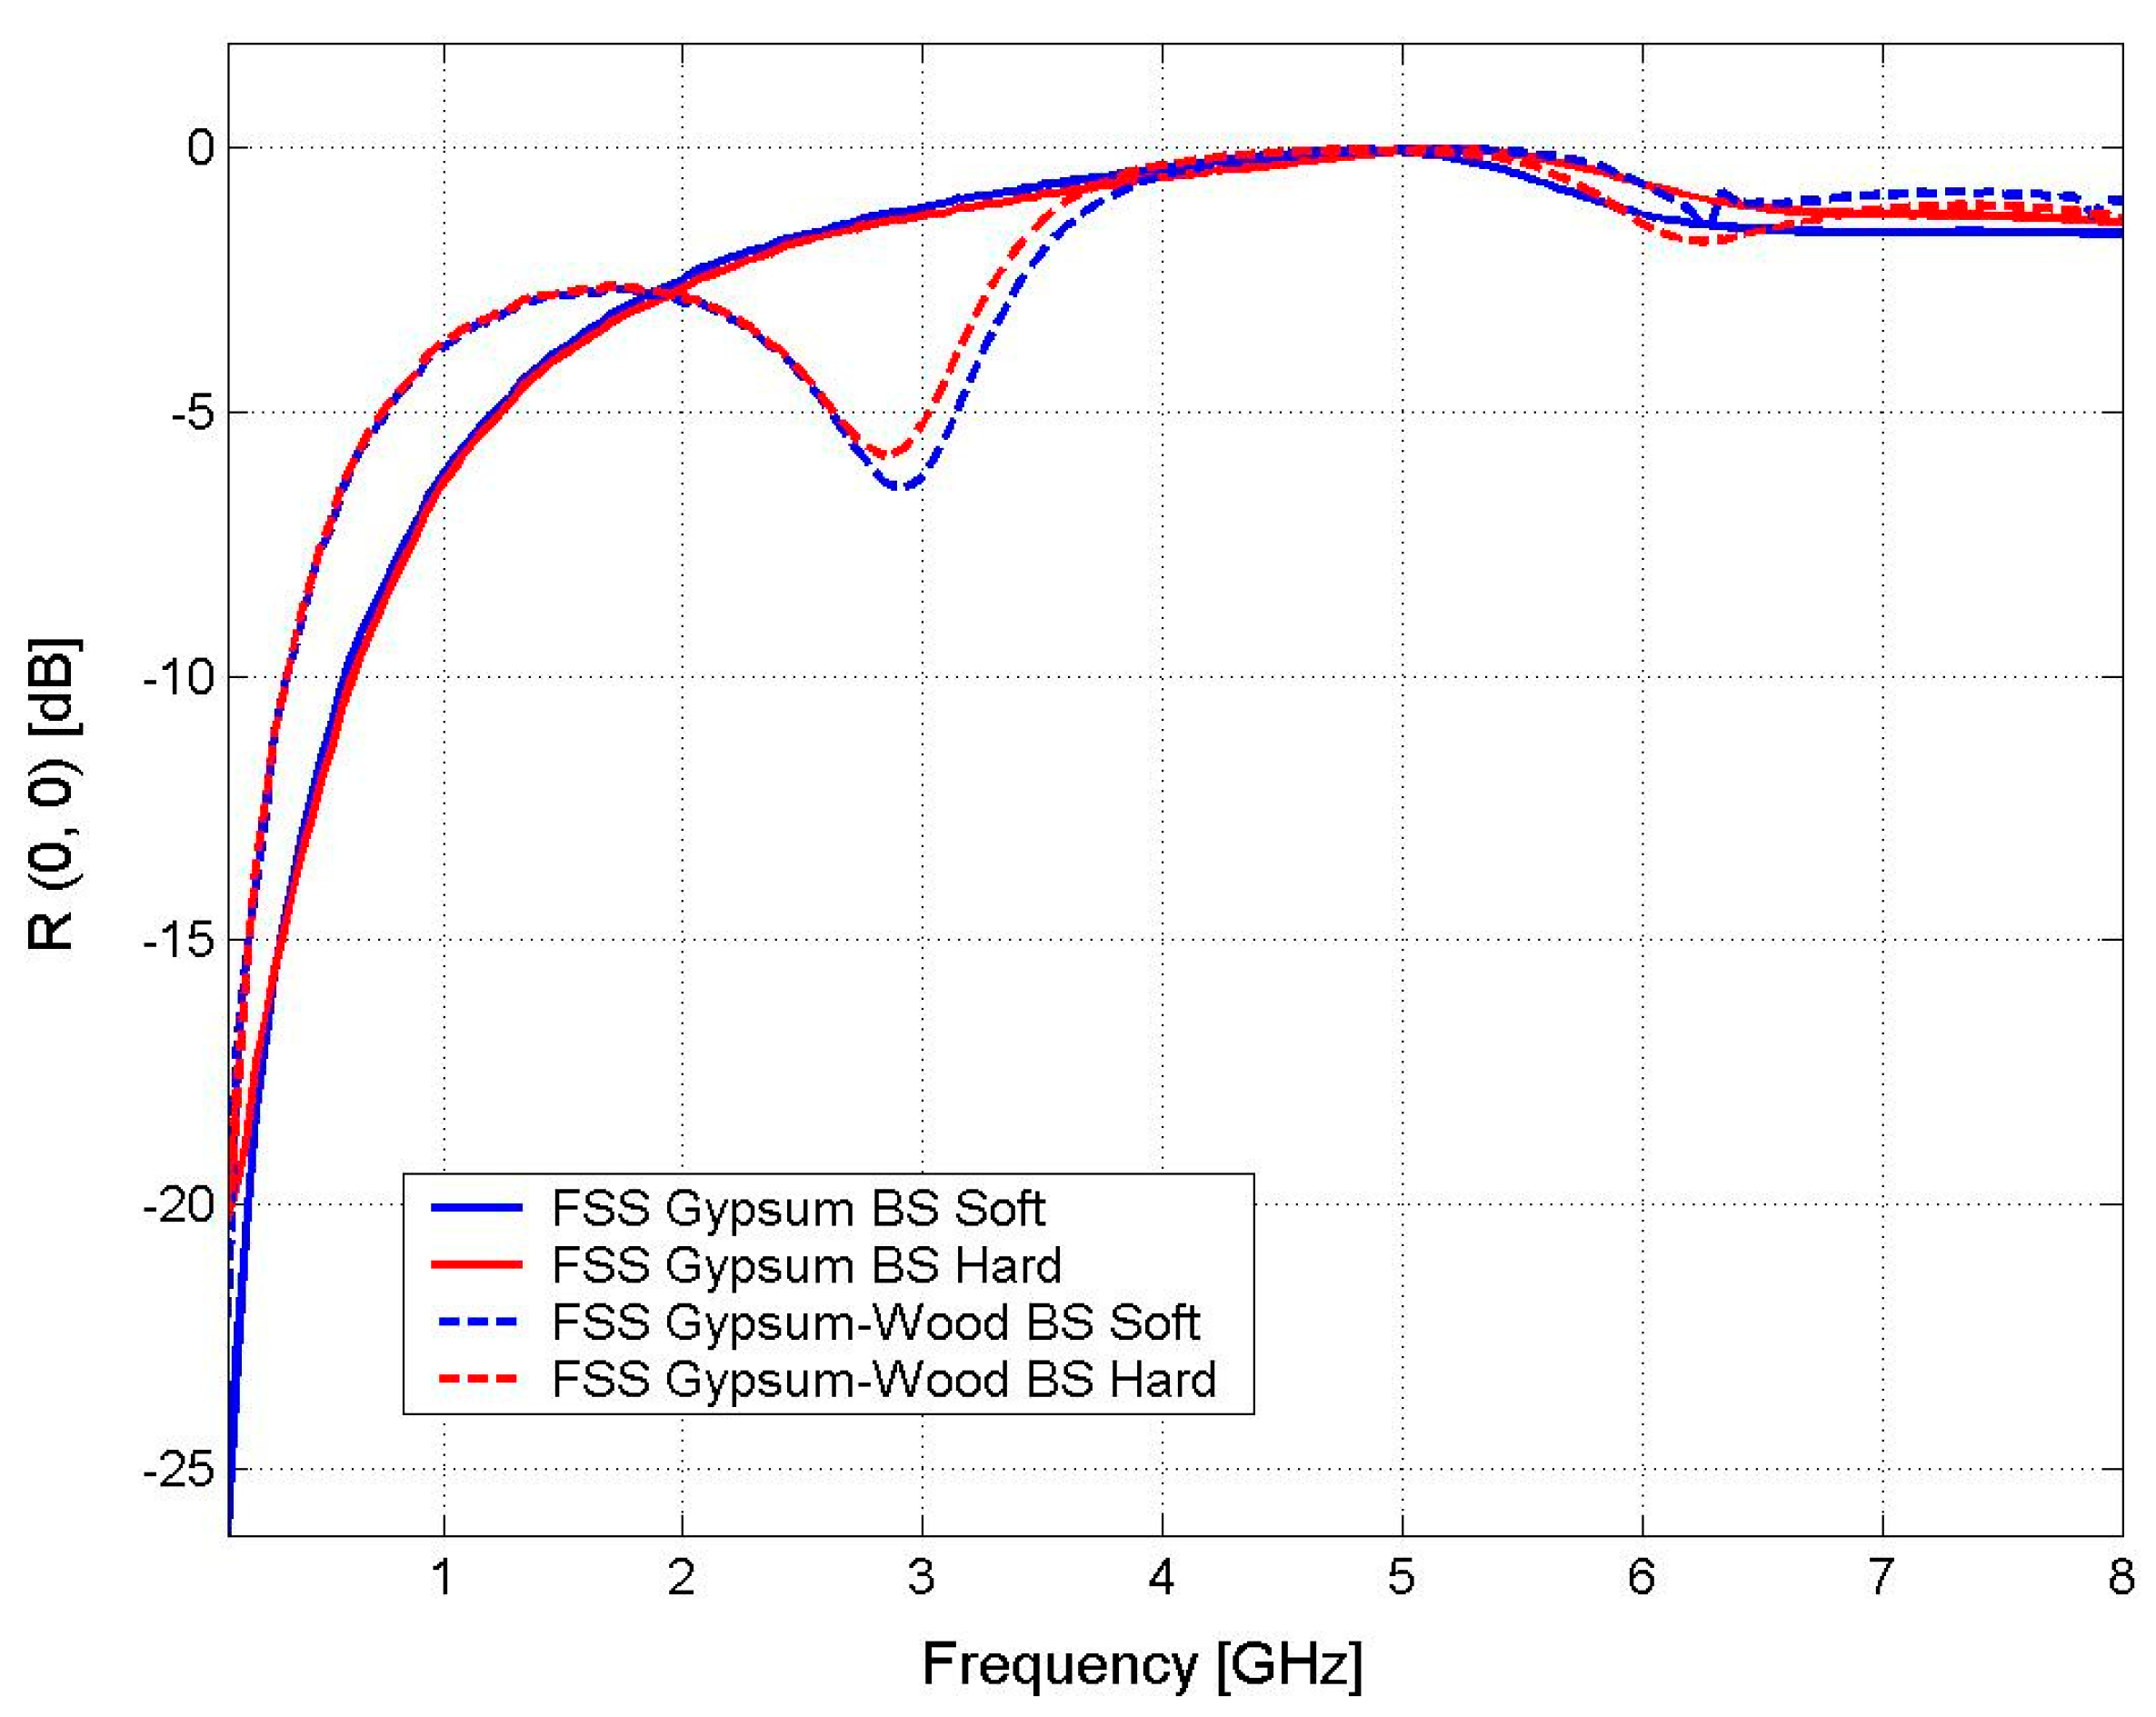
Wallpaper with Gypsum–Wood Wall
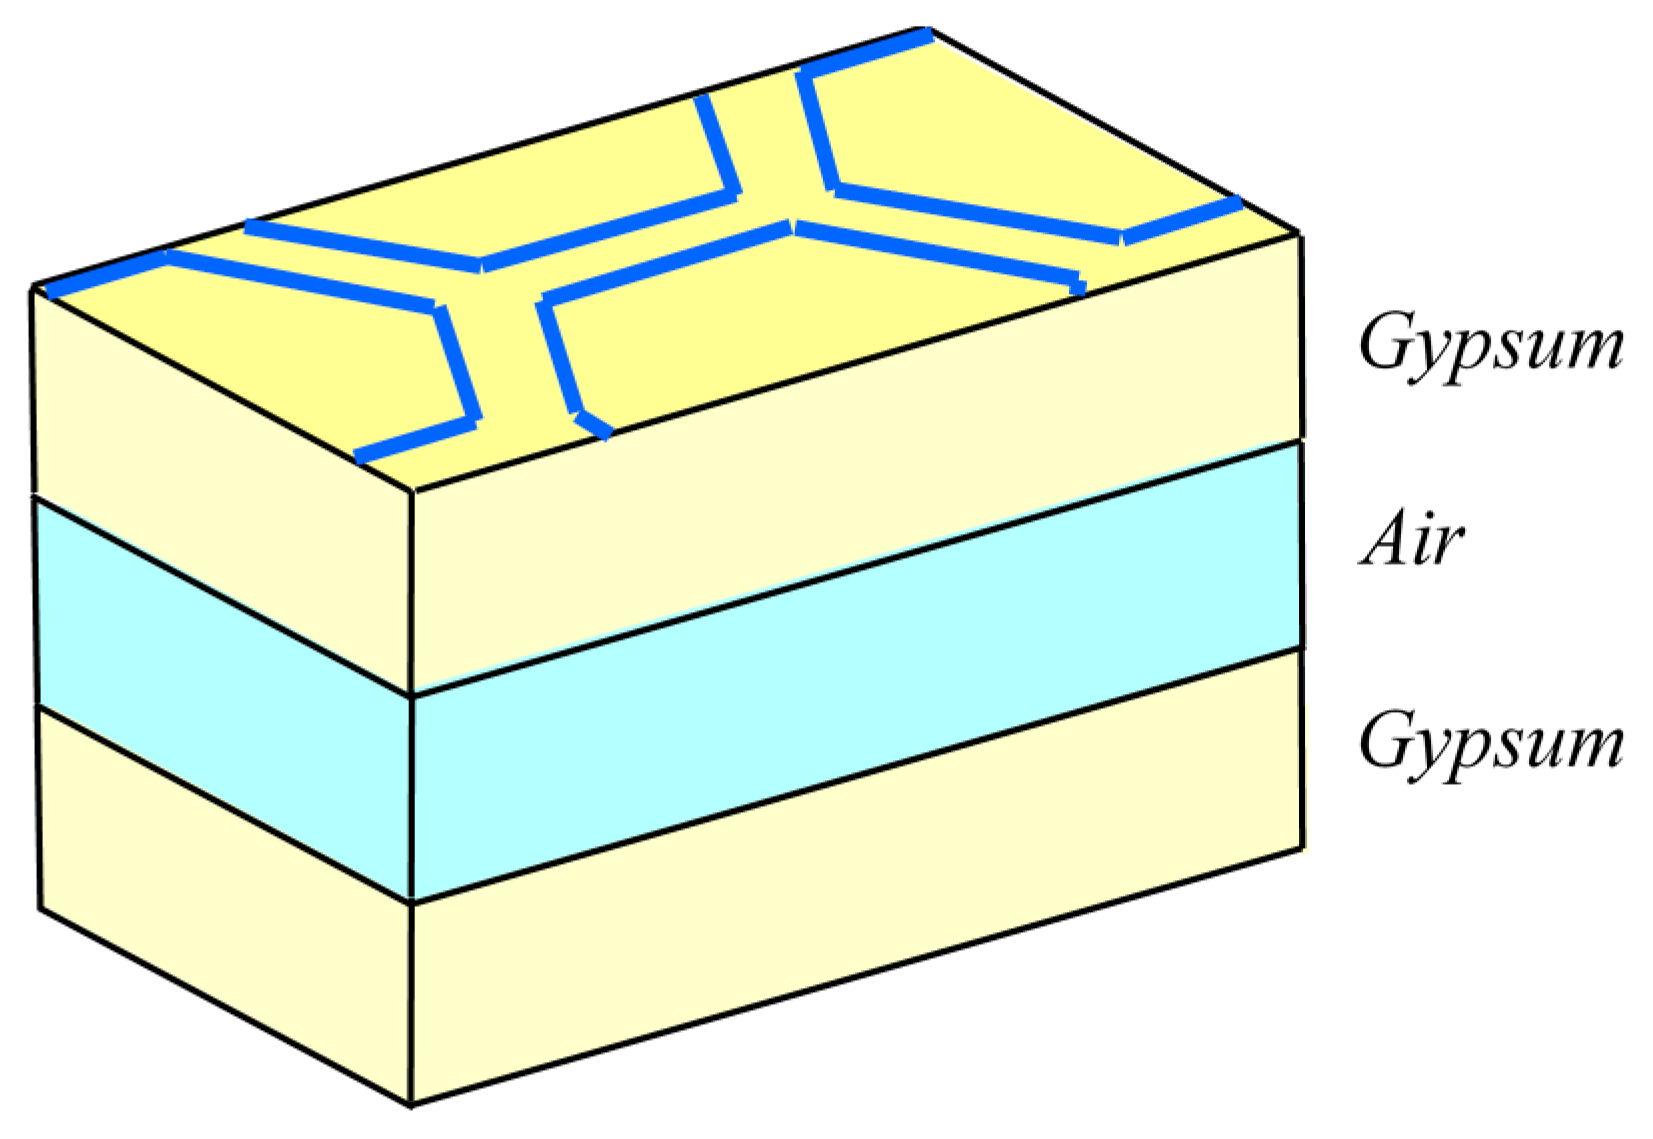
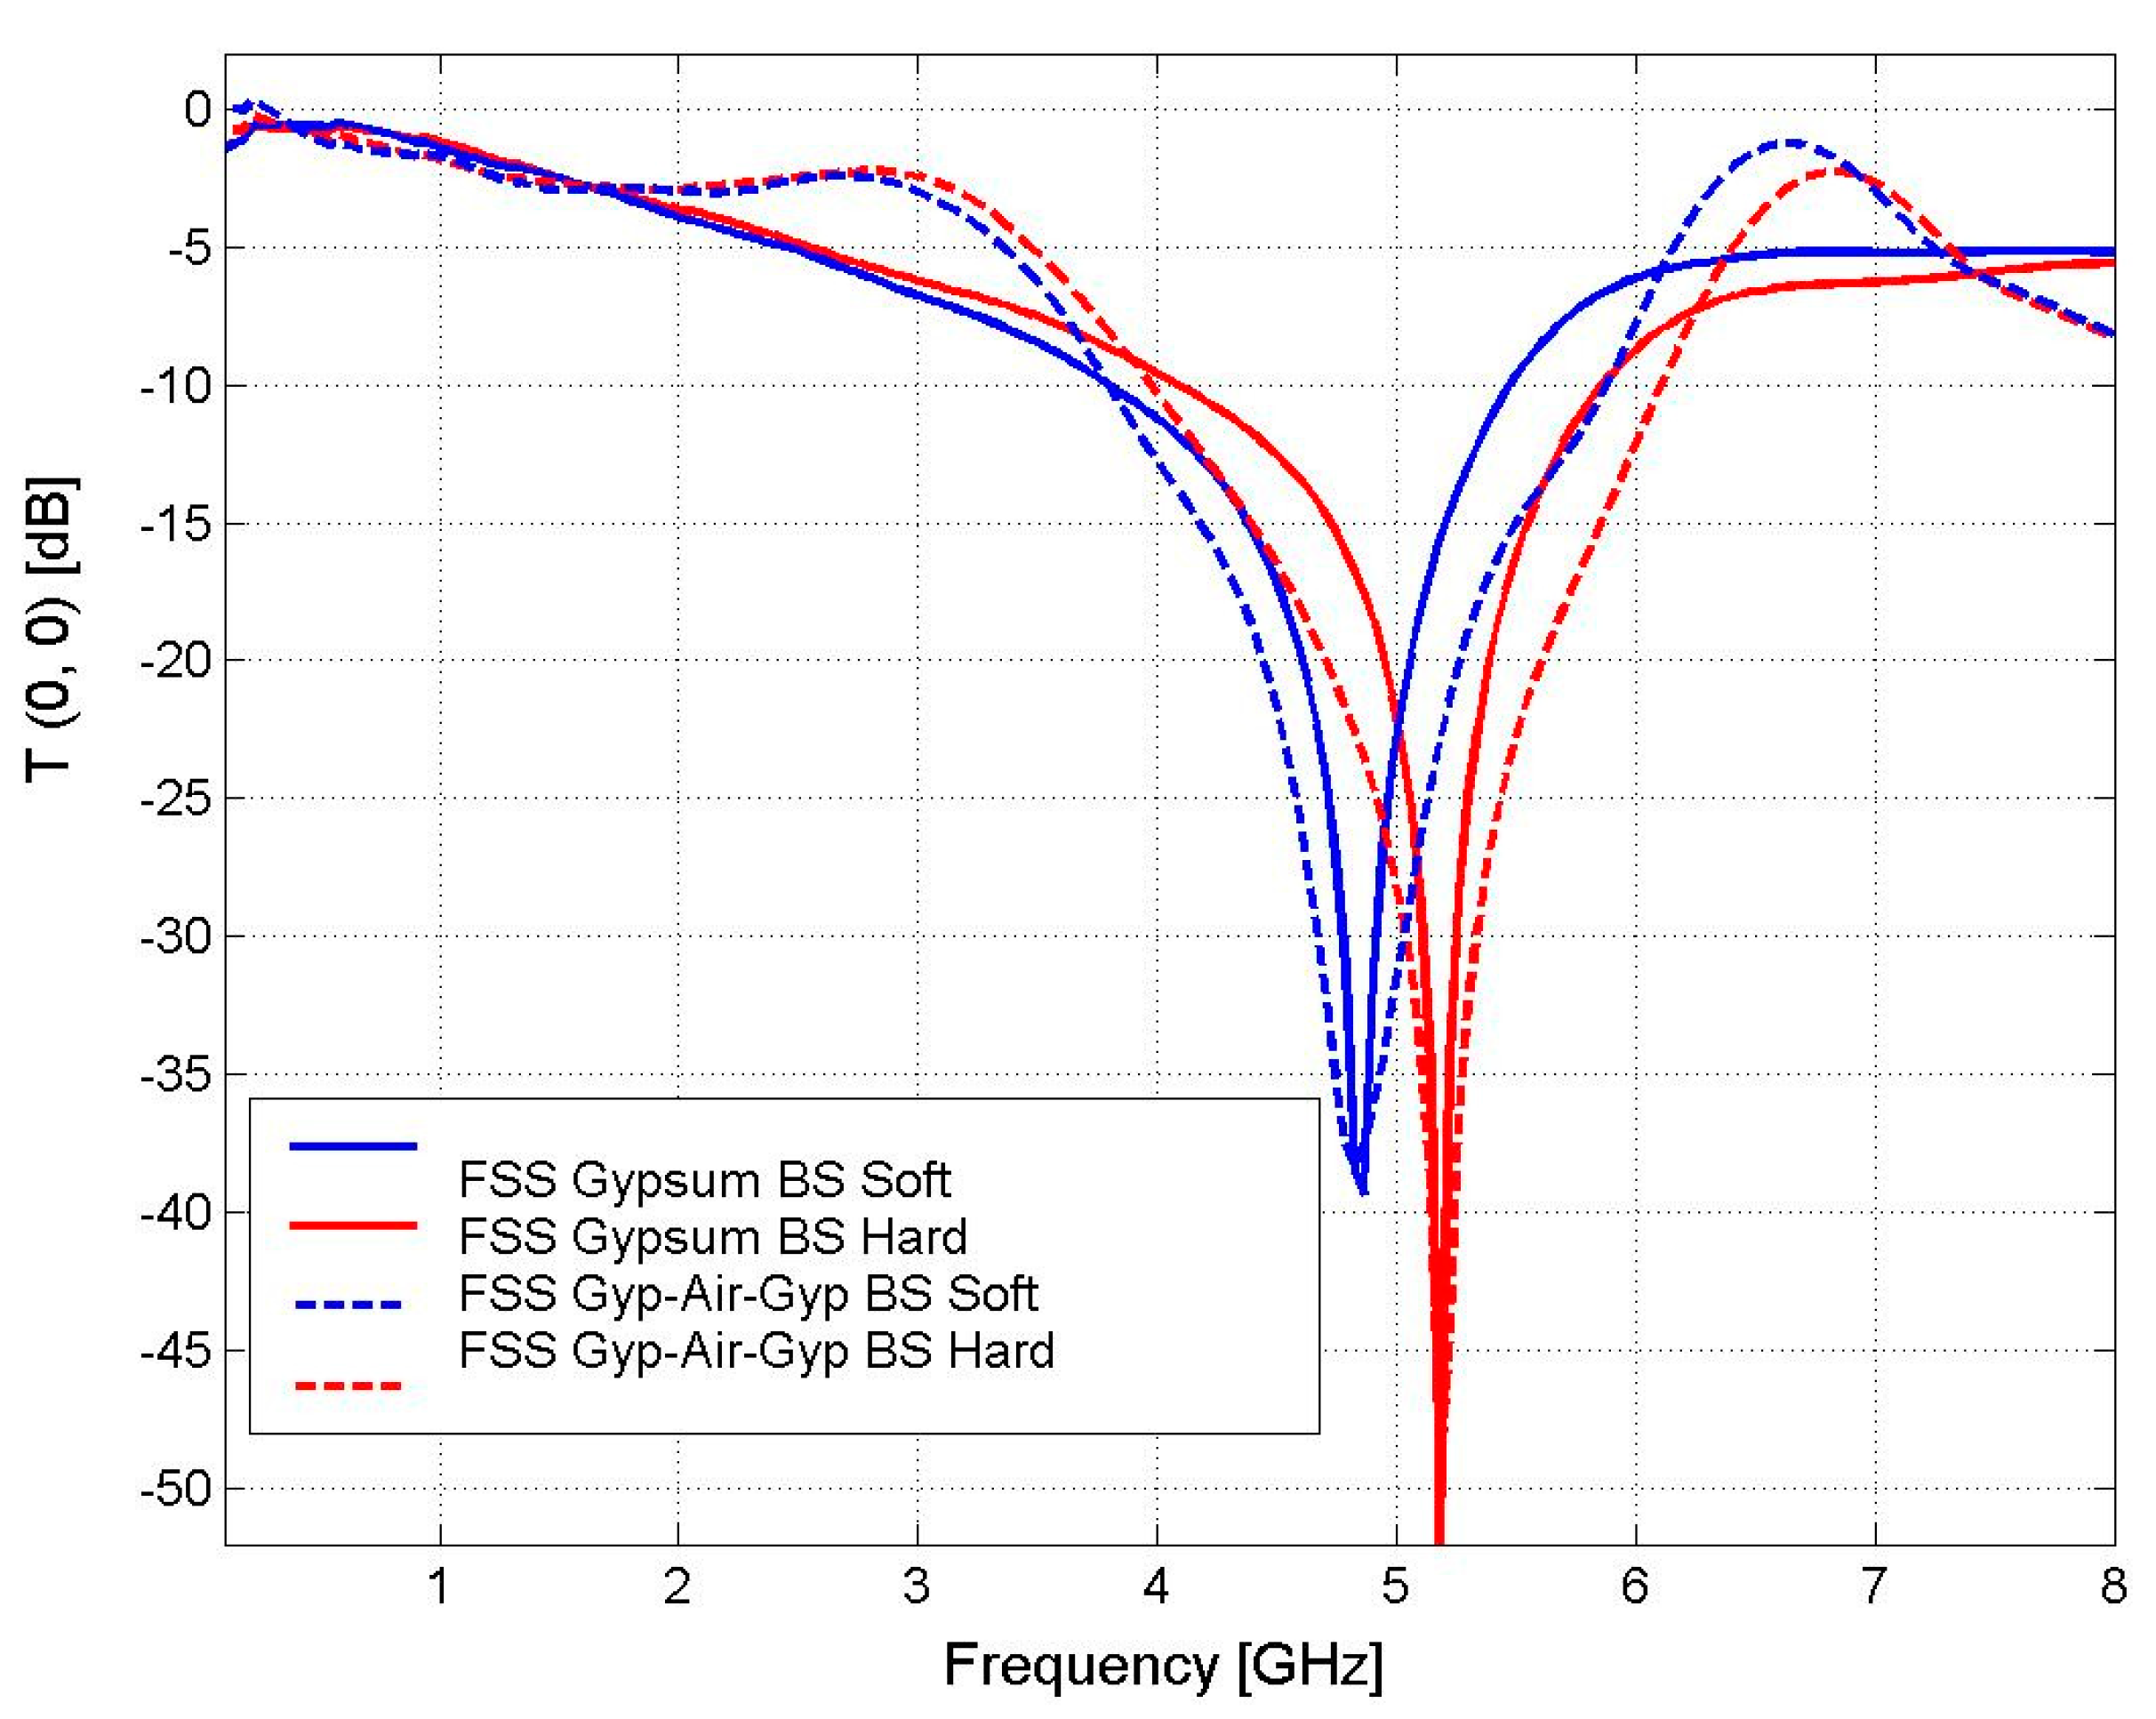
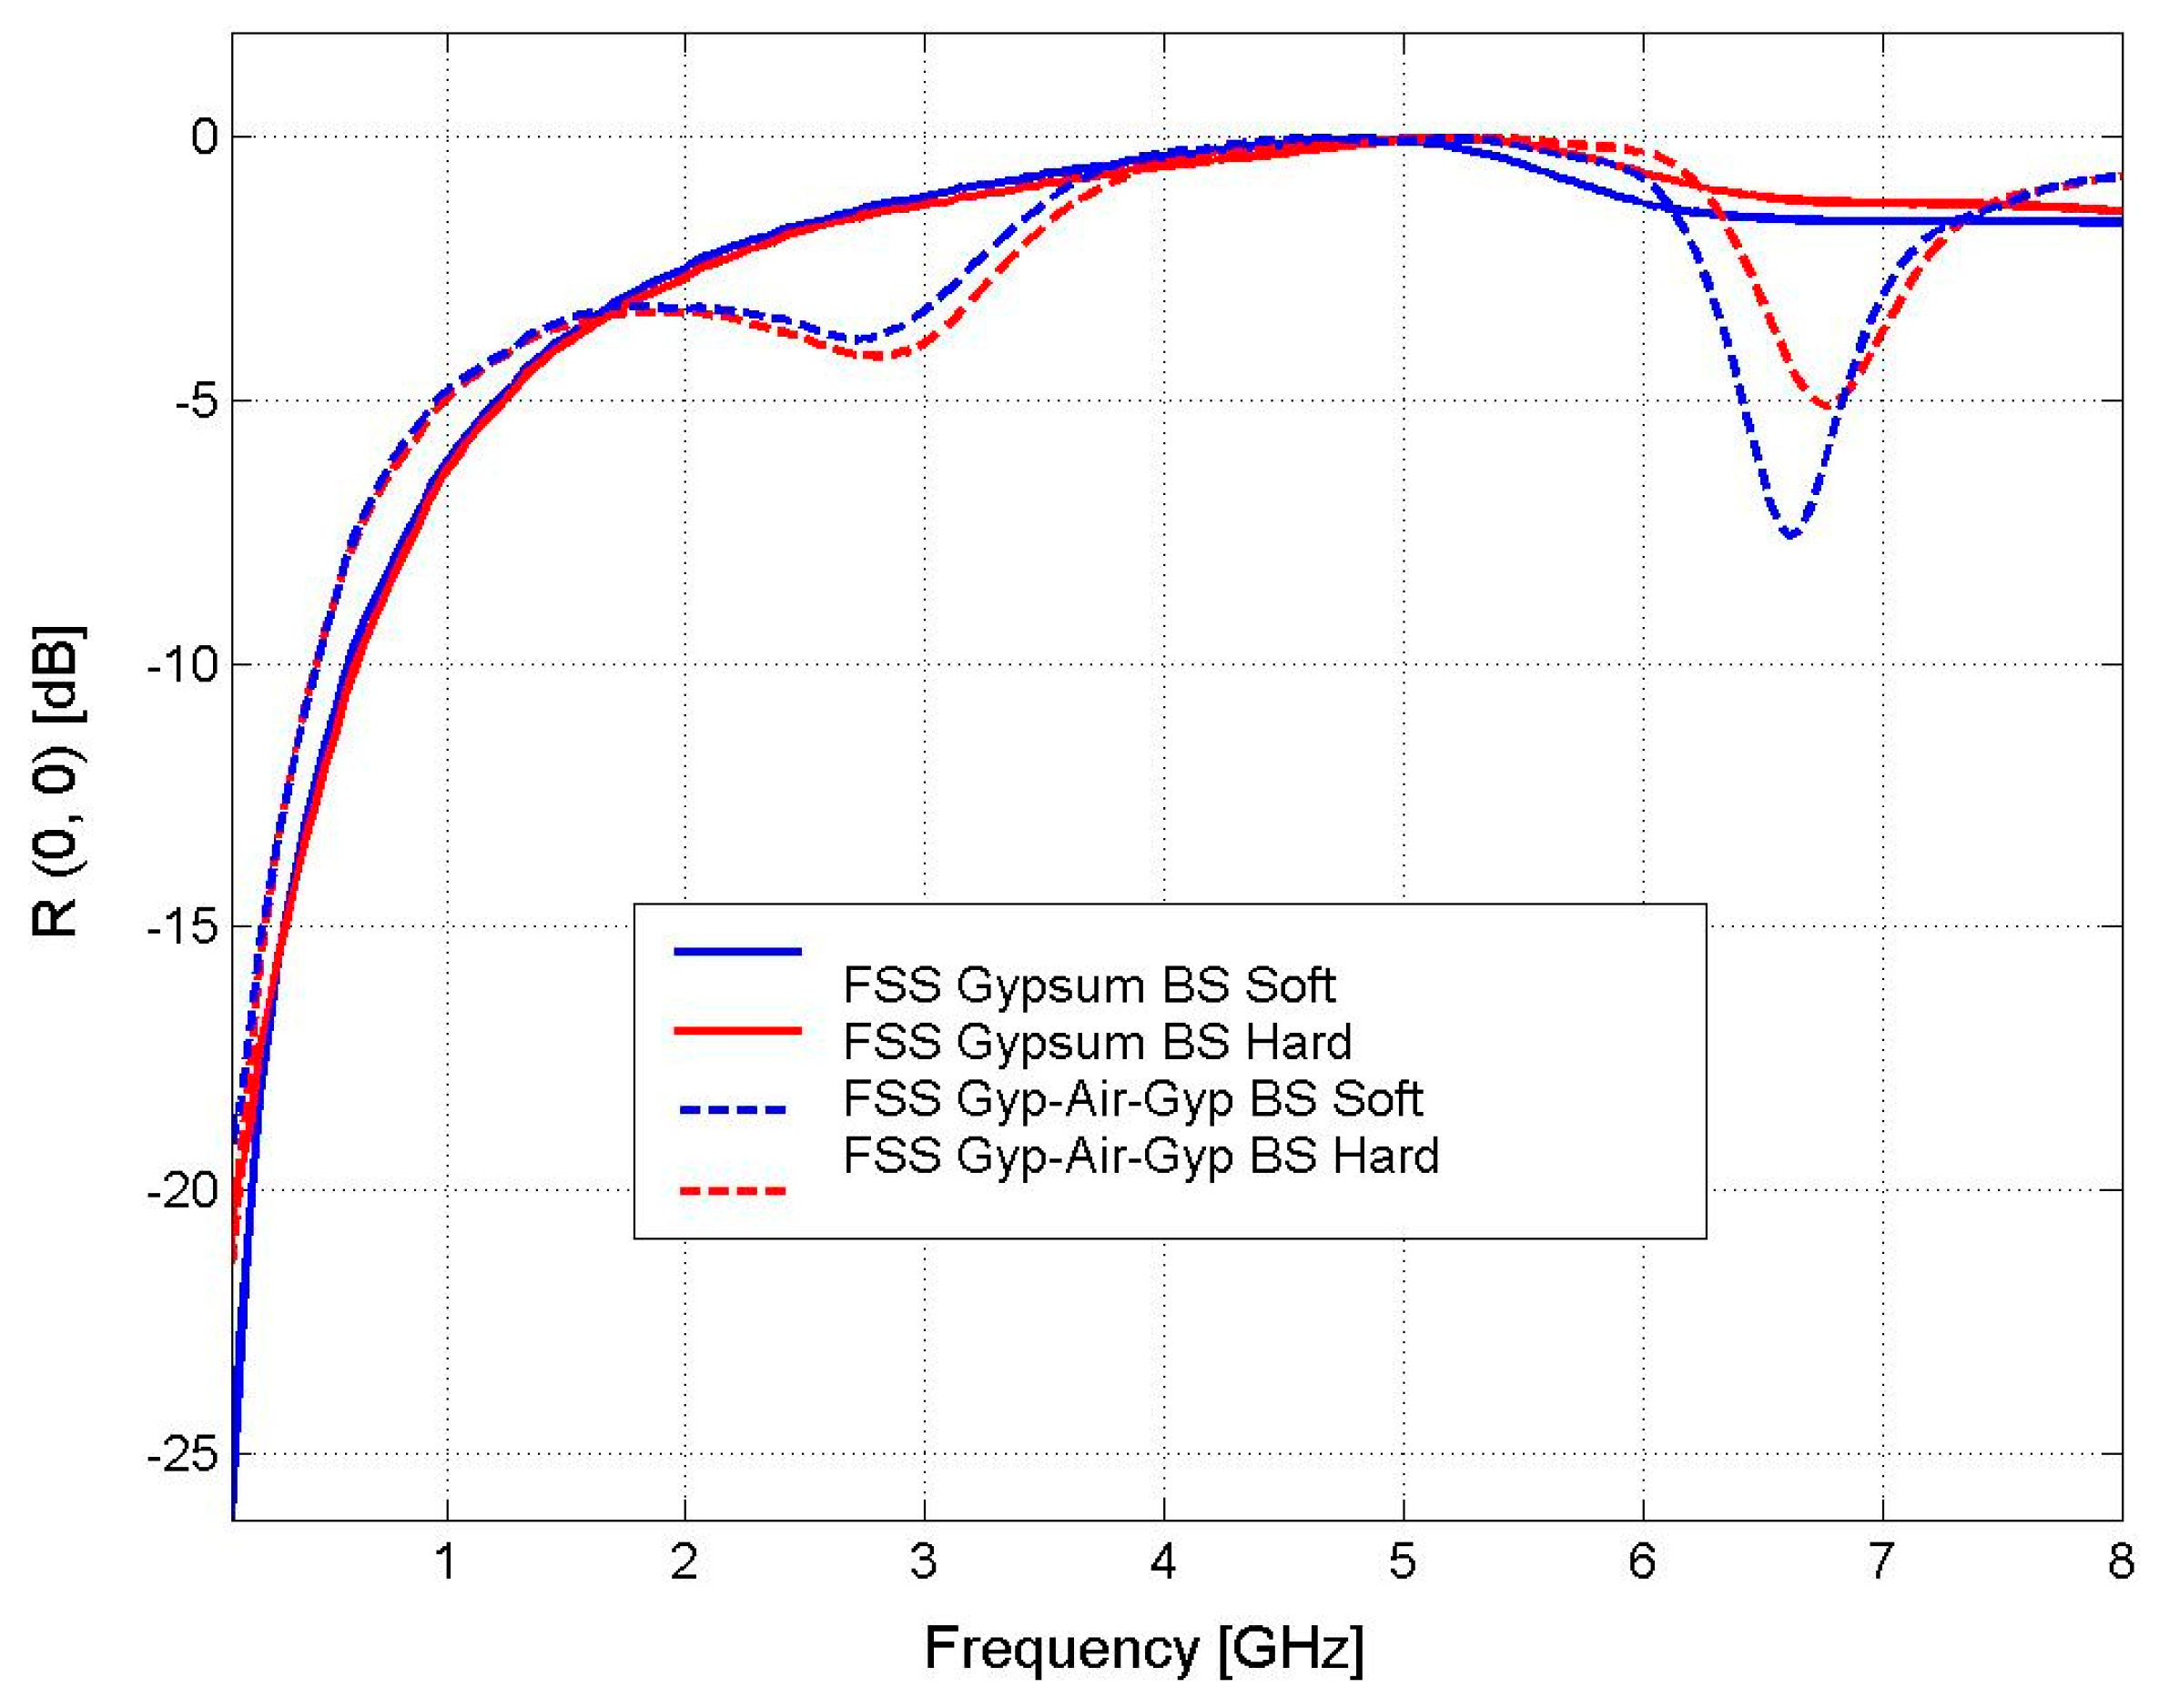
Wallpaper with Gypsum–Air–Gypsum Wall
3. Ray-Launching Method
4. Results and Discussion
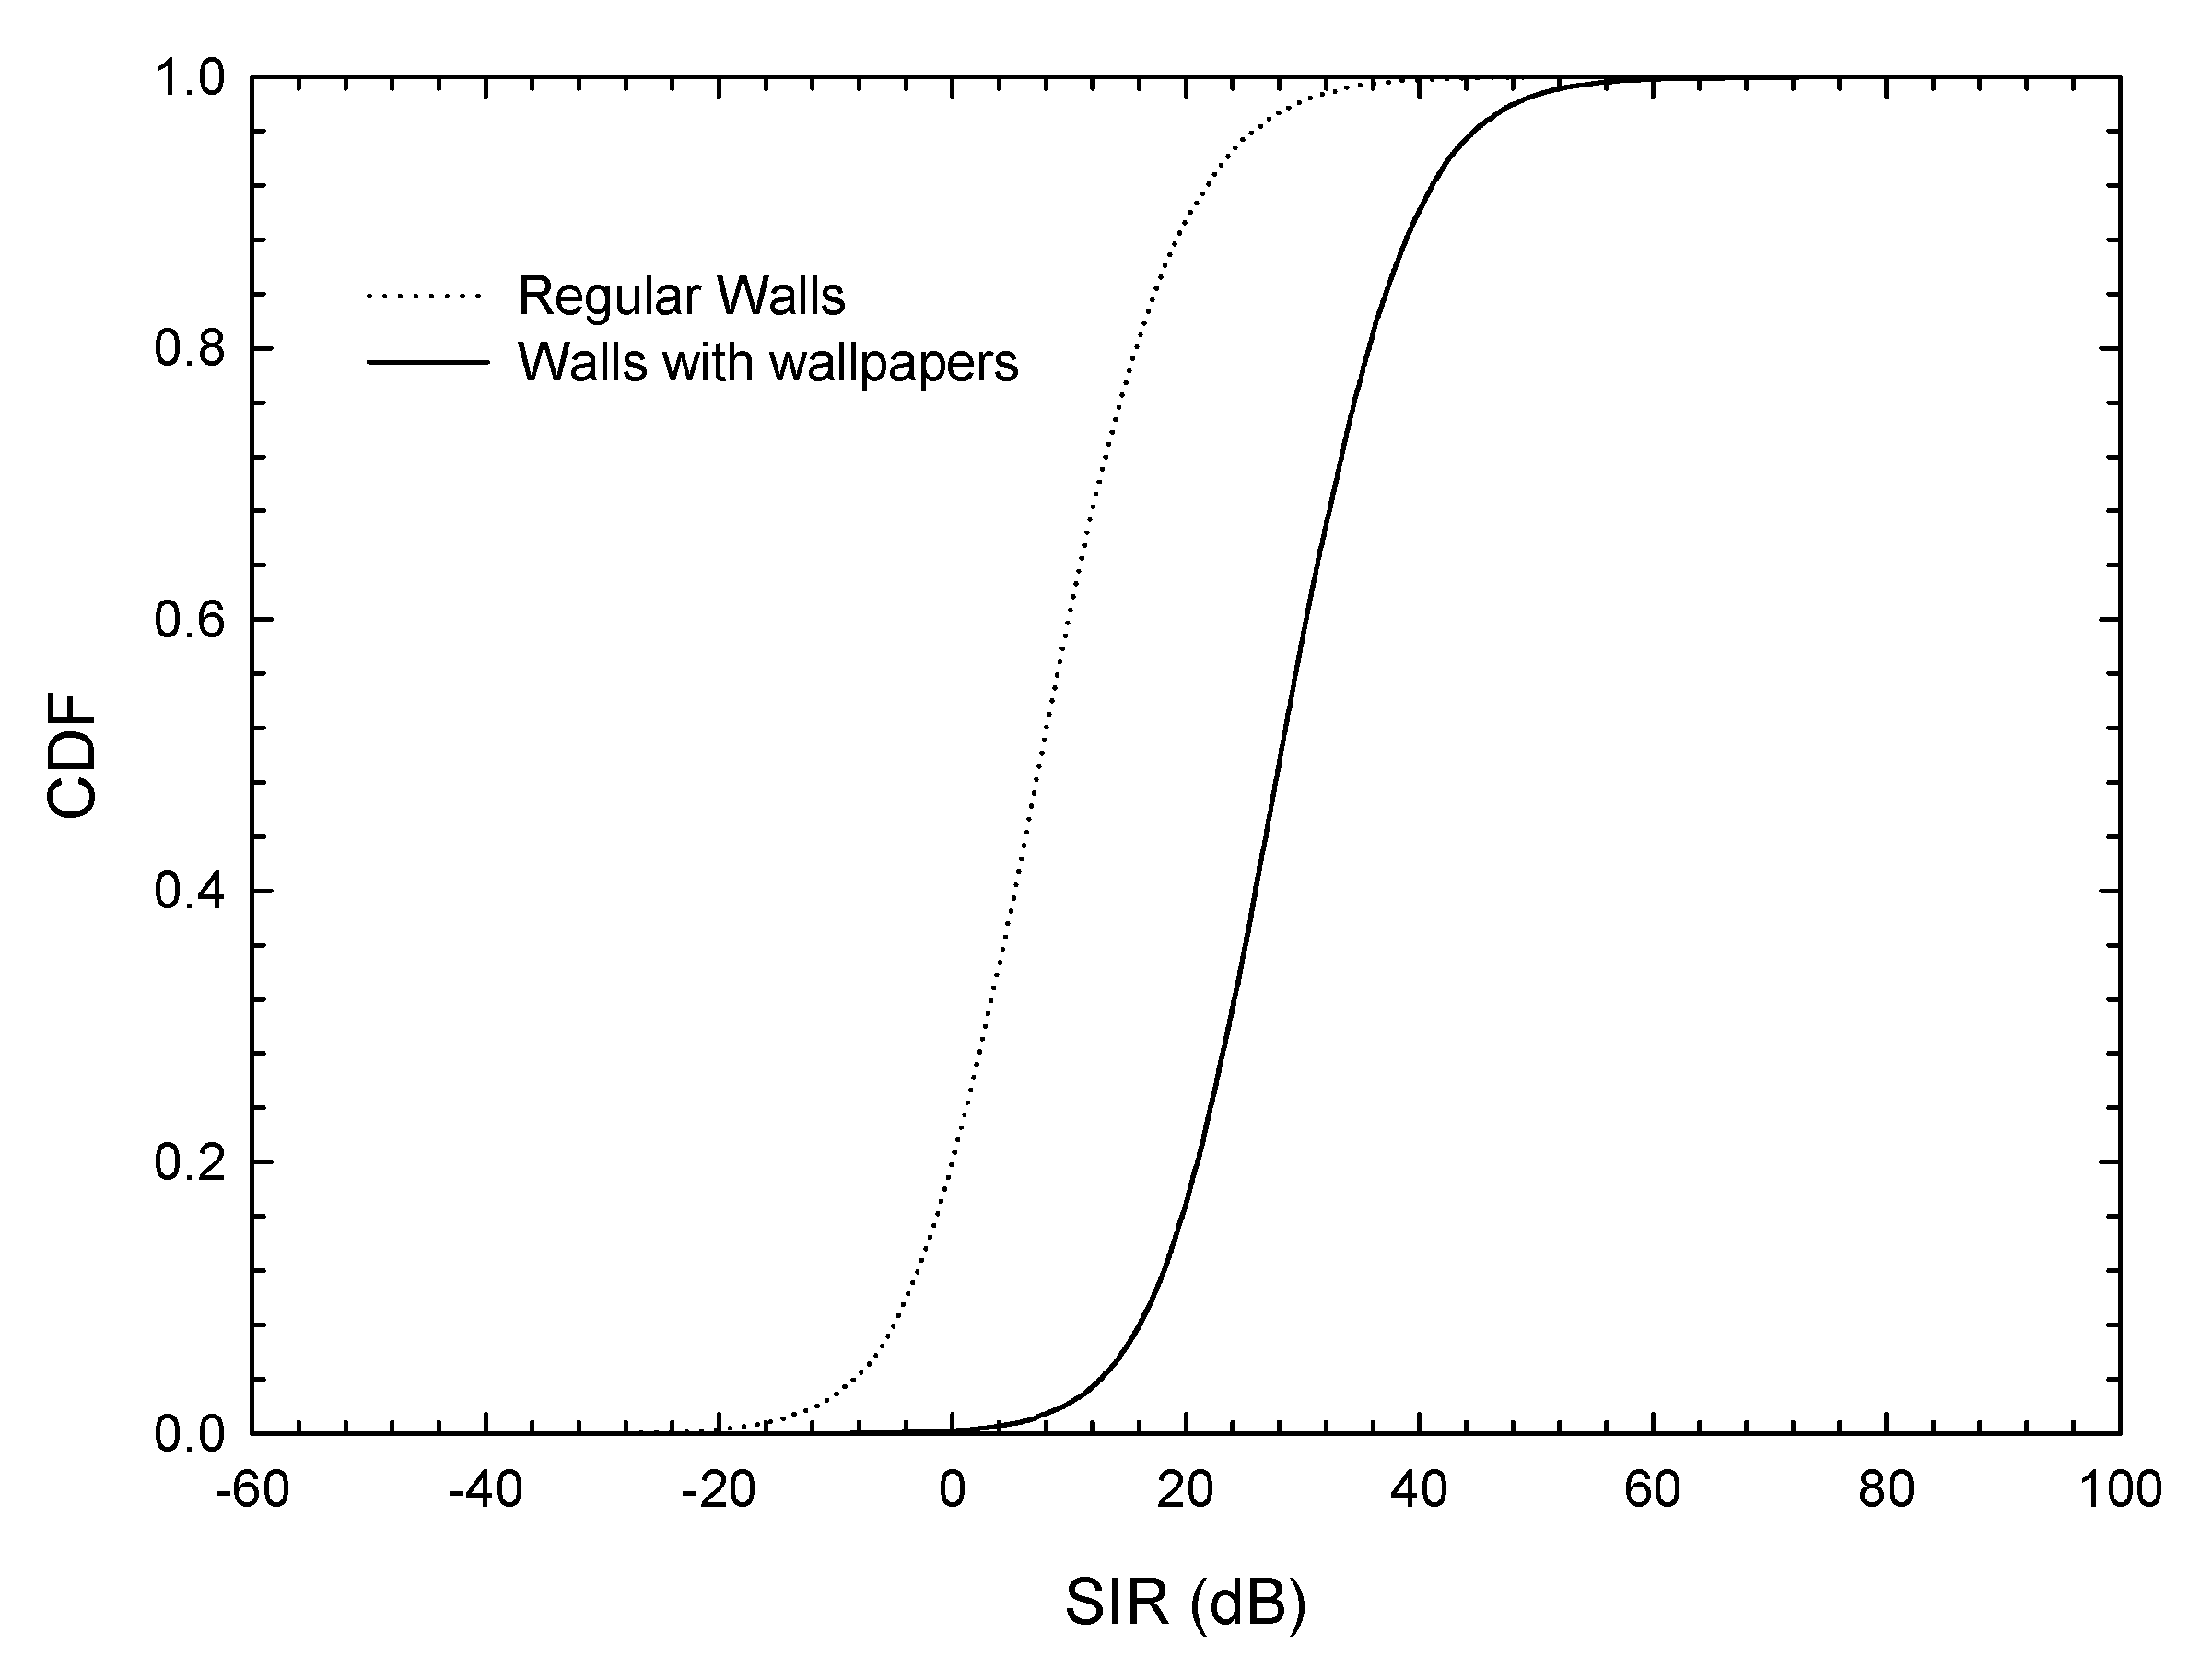
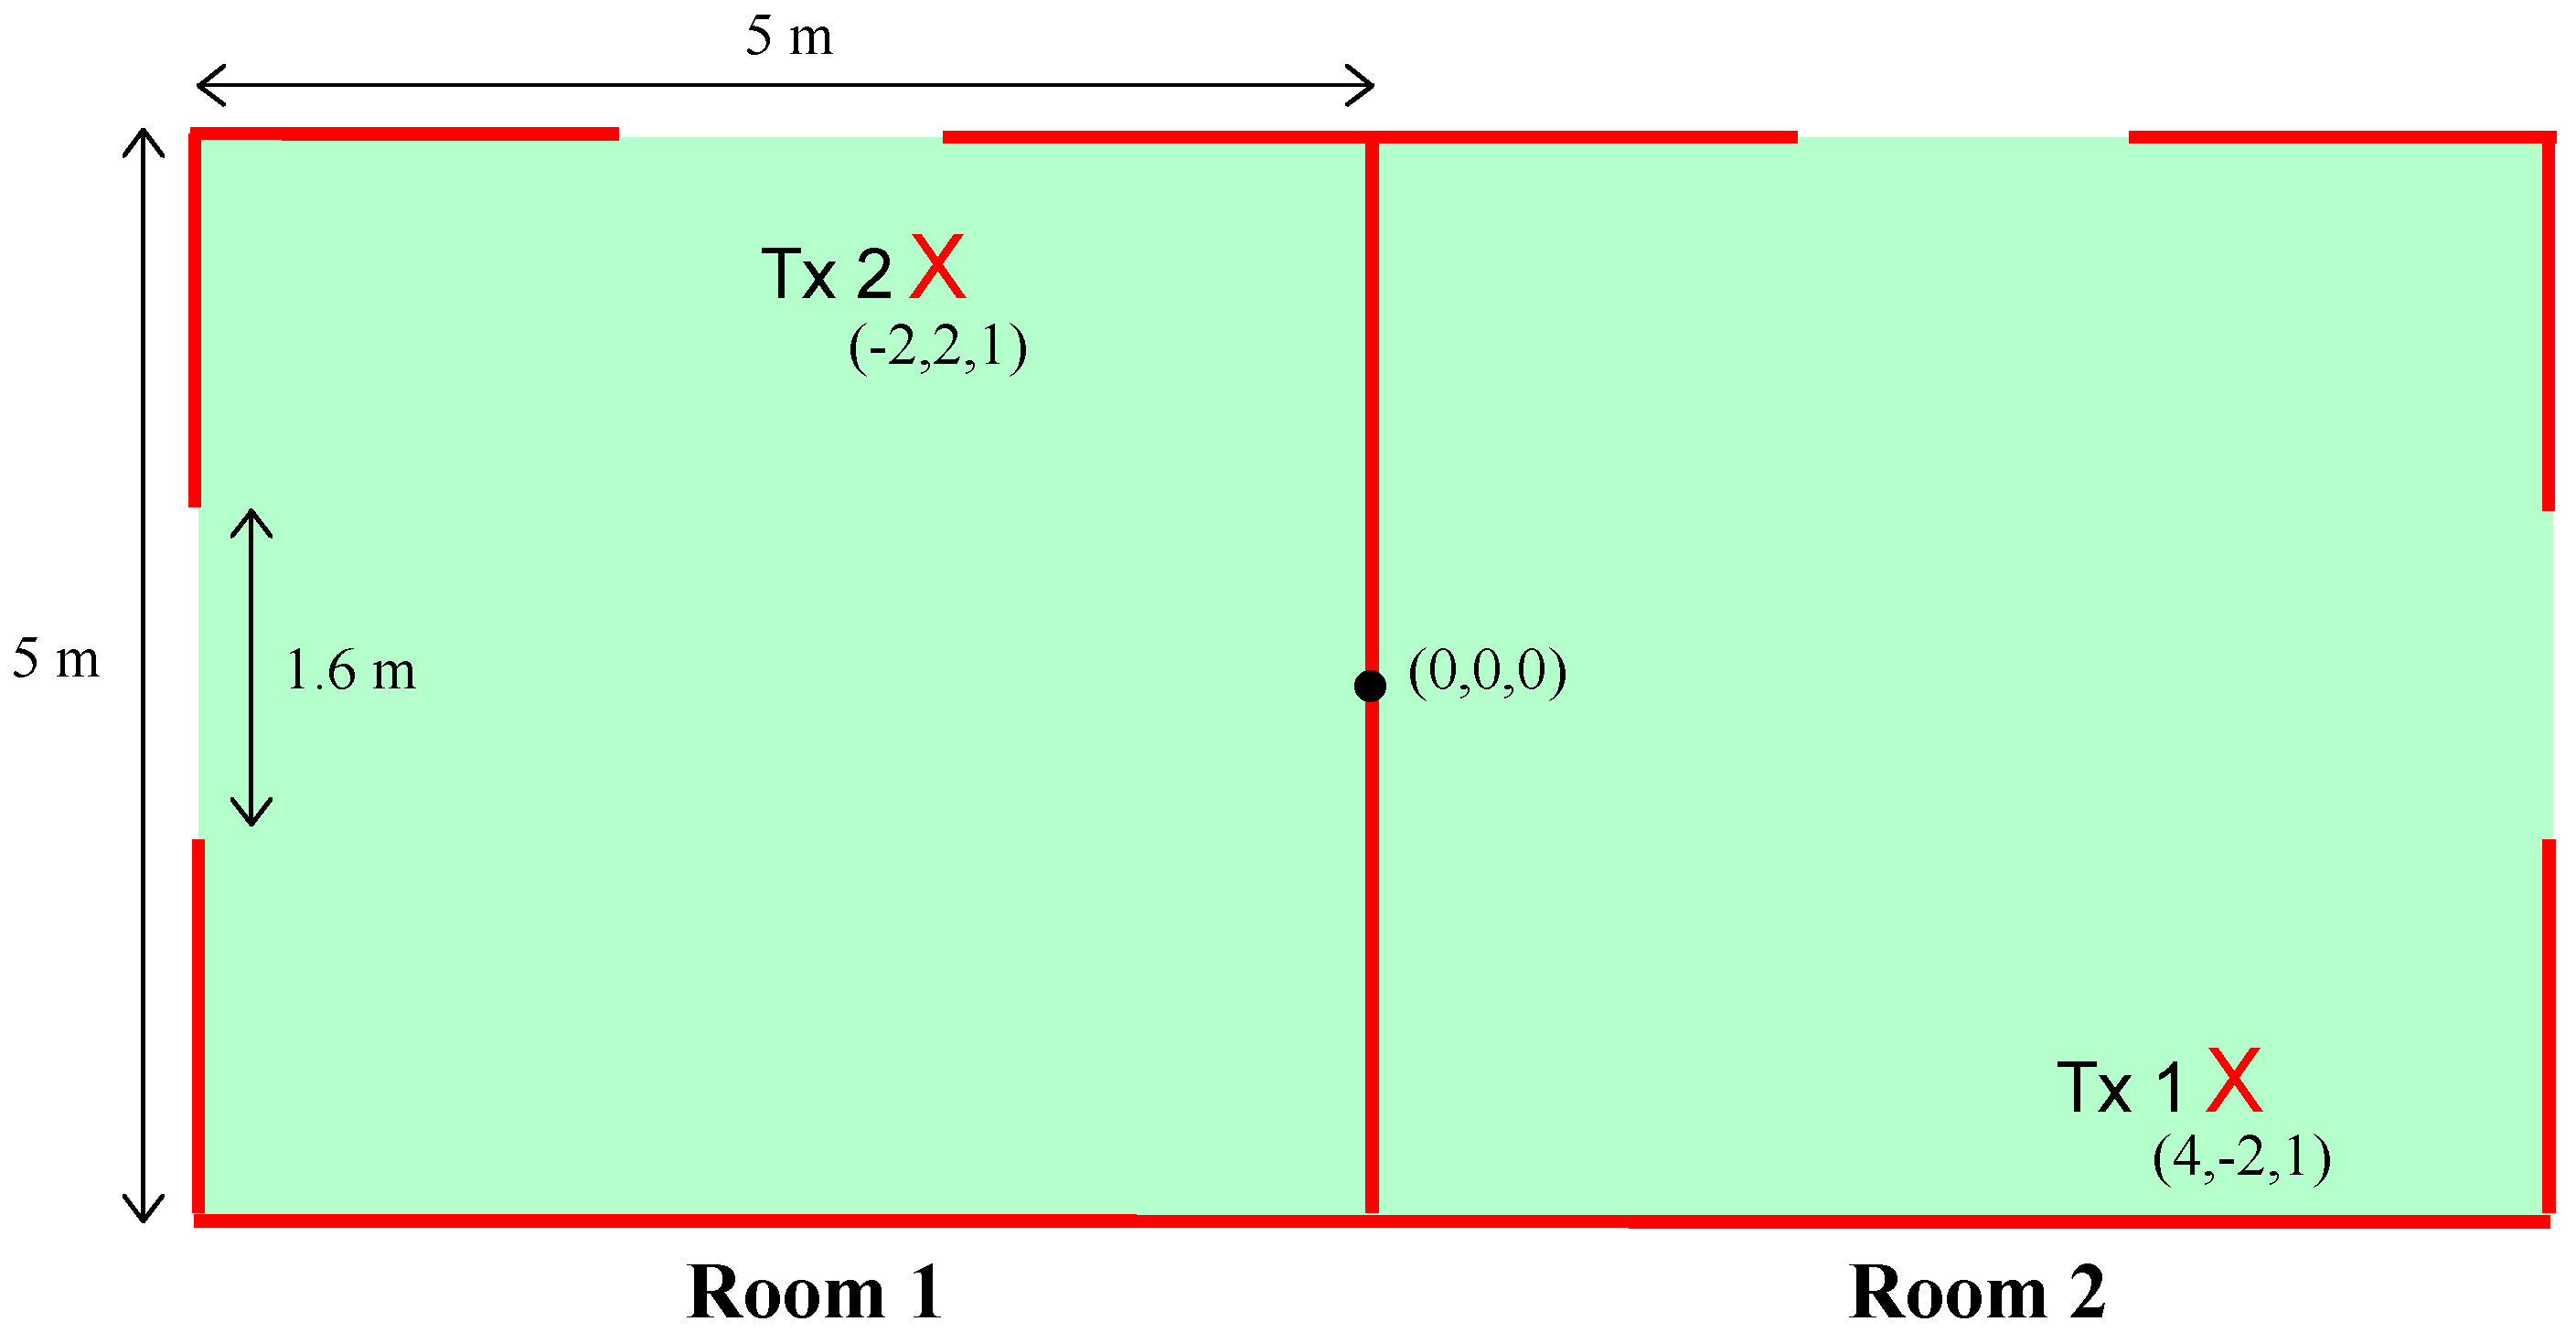
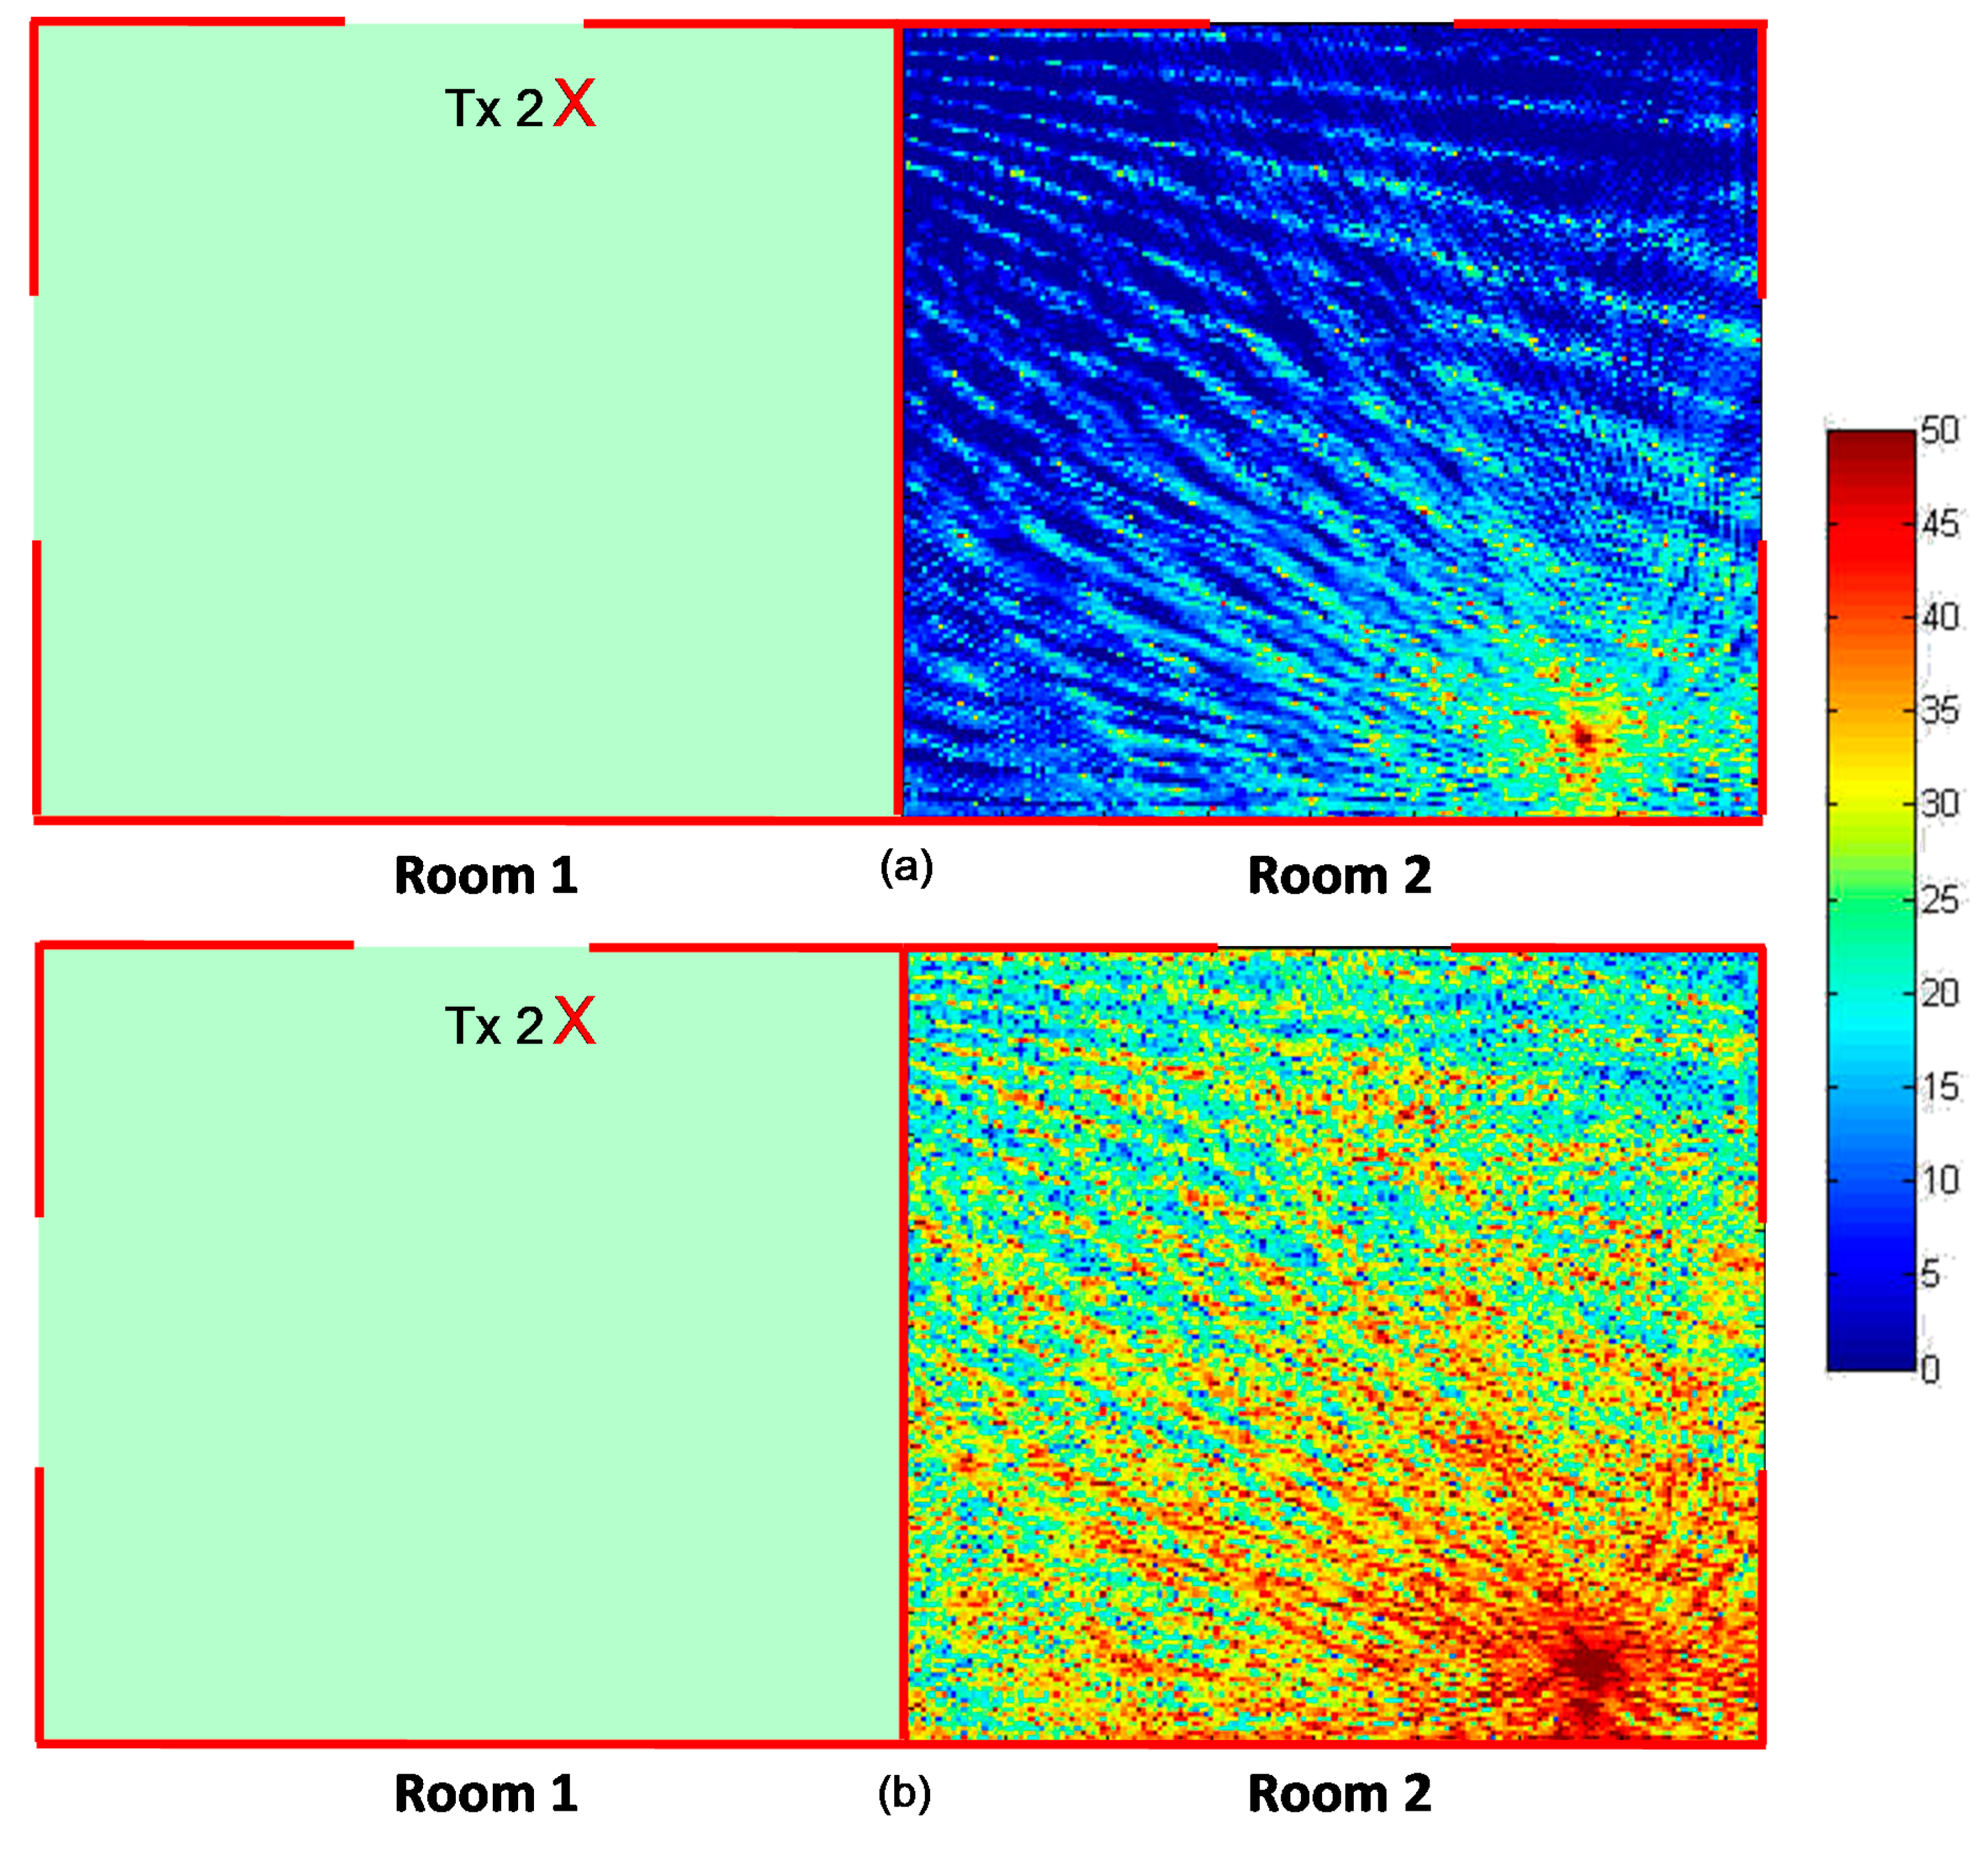
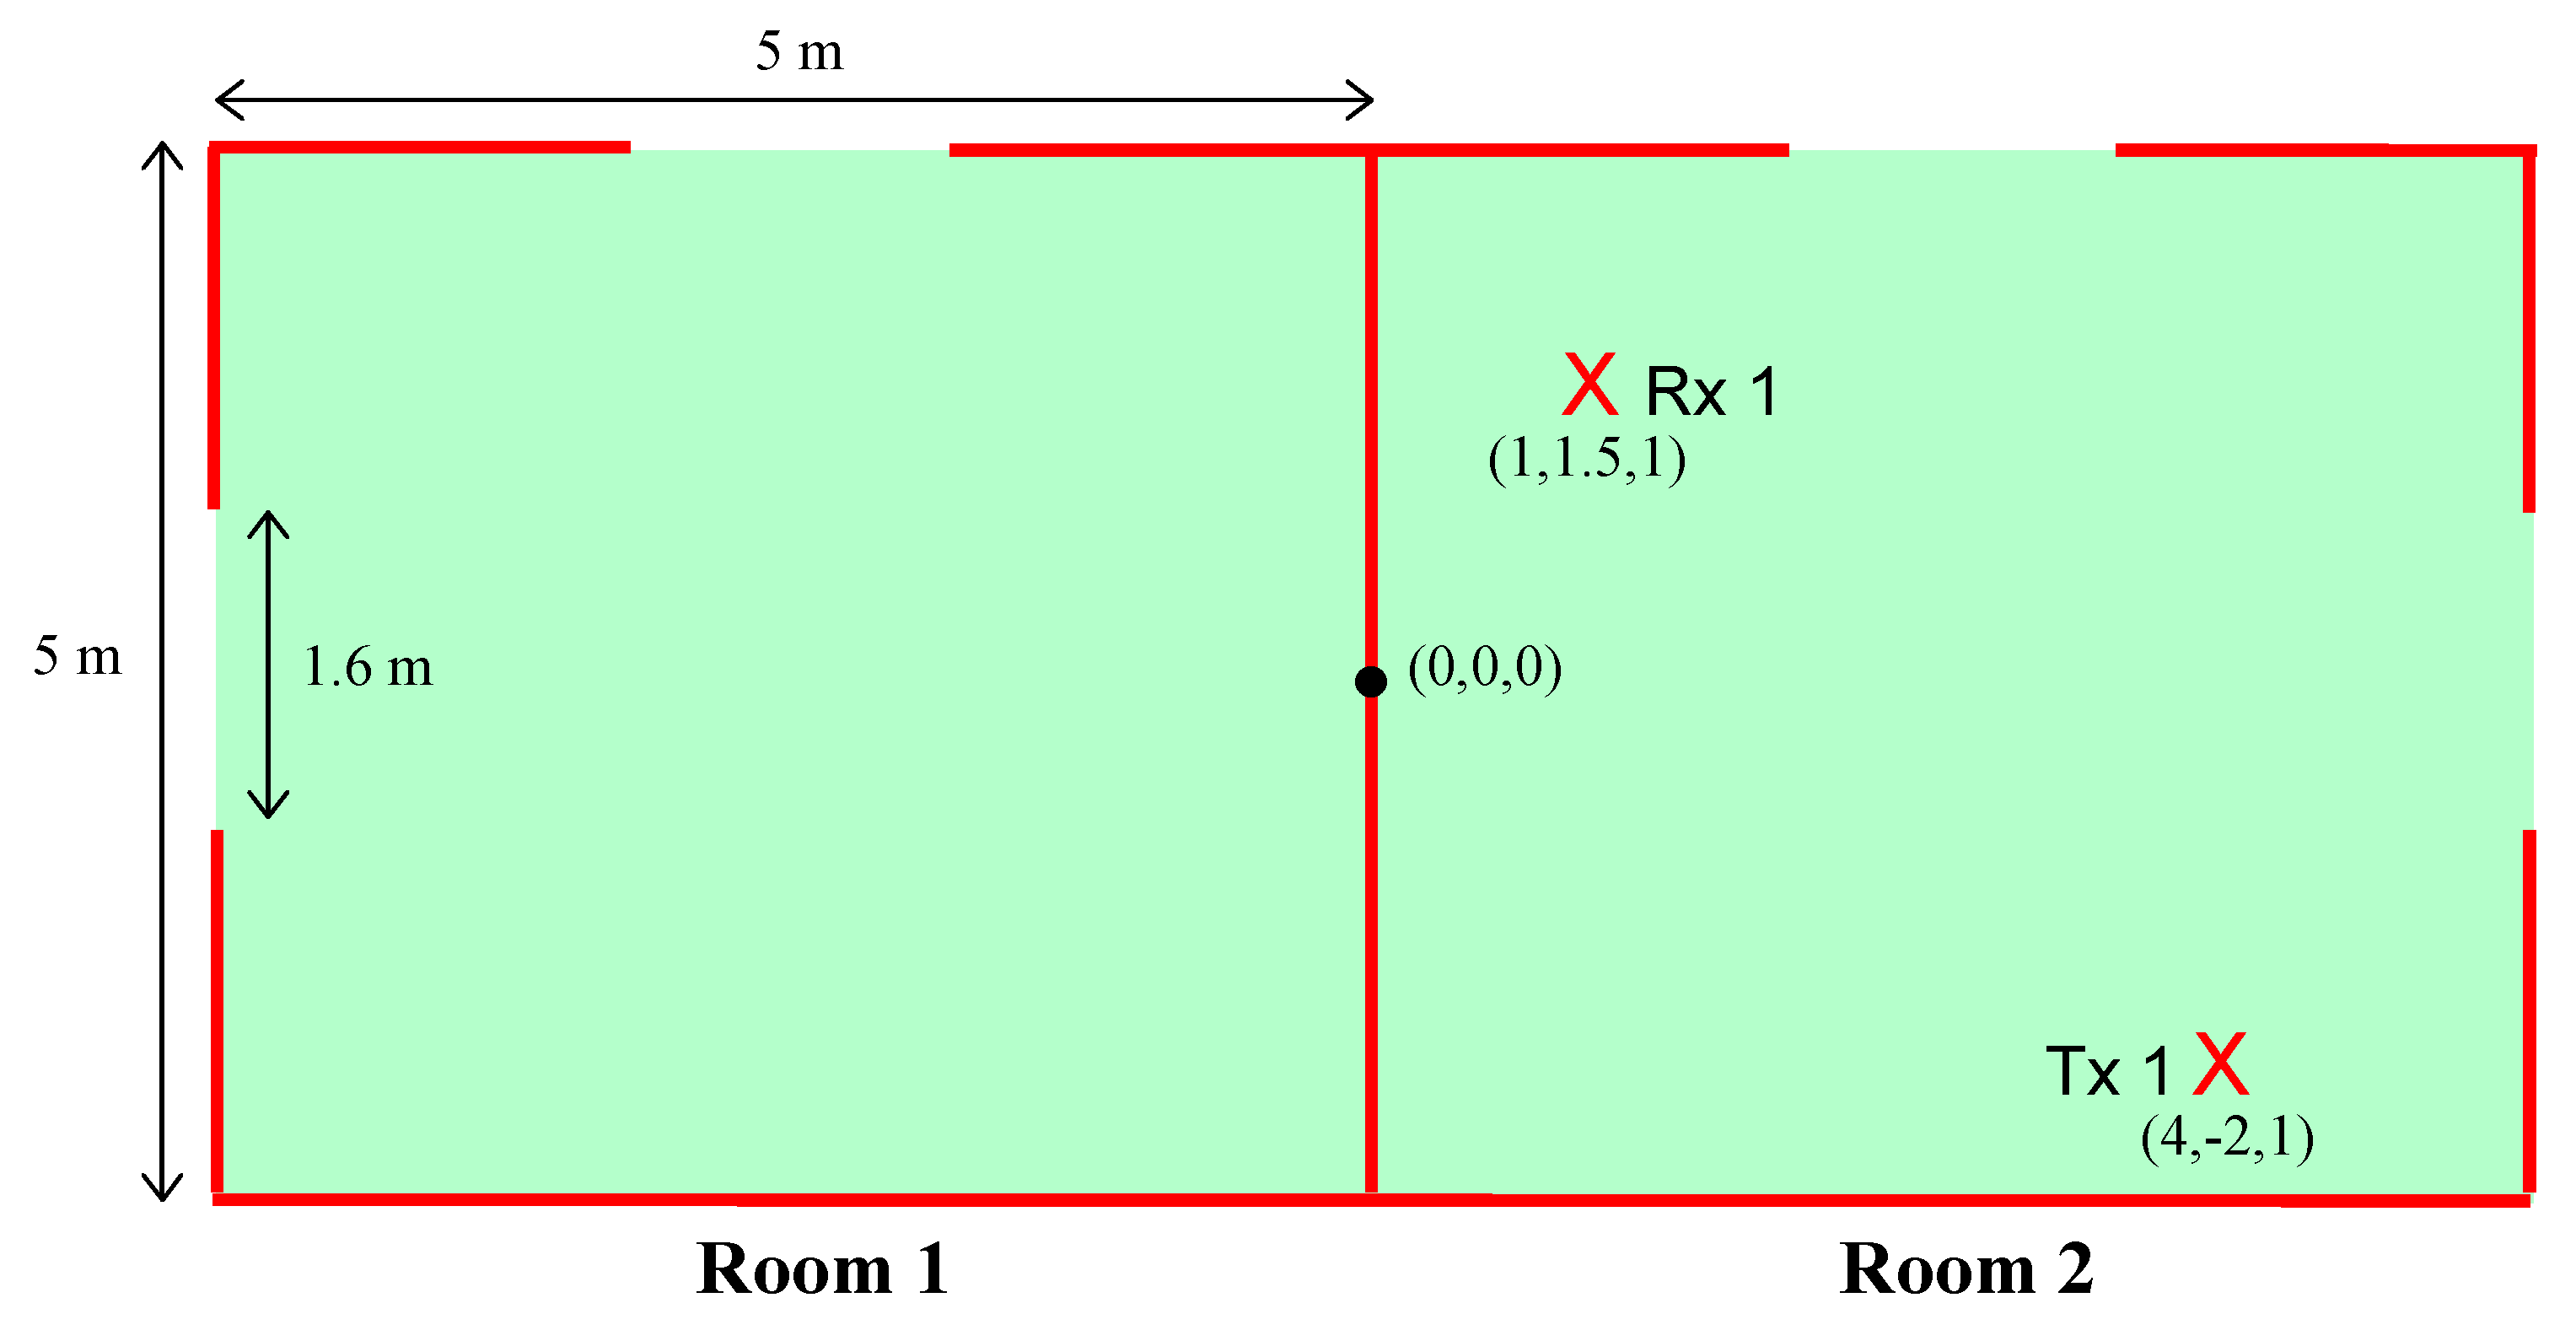
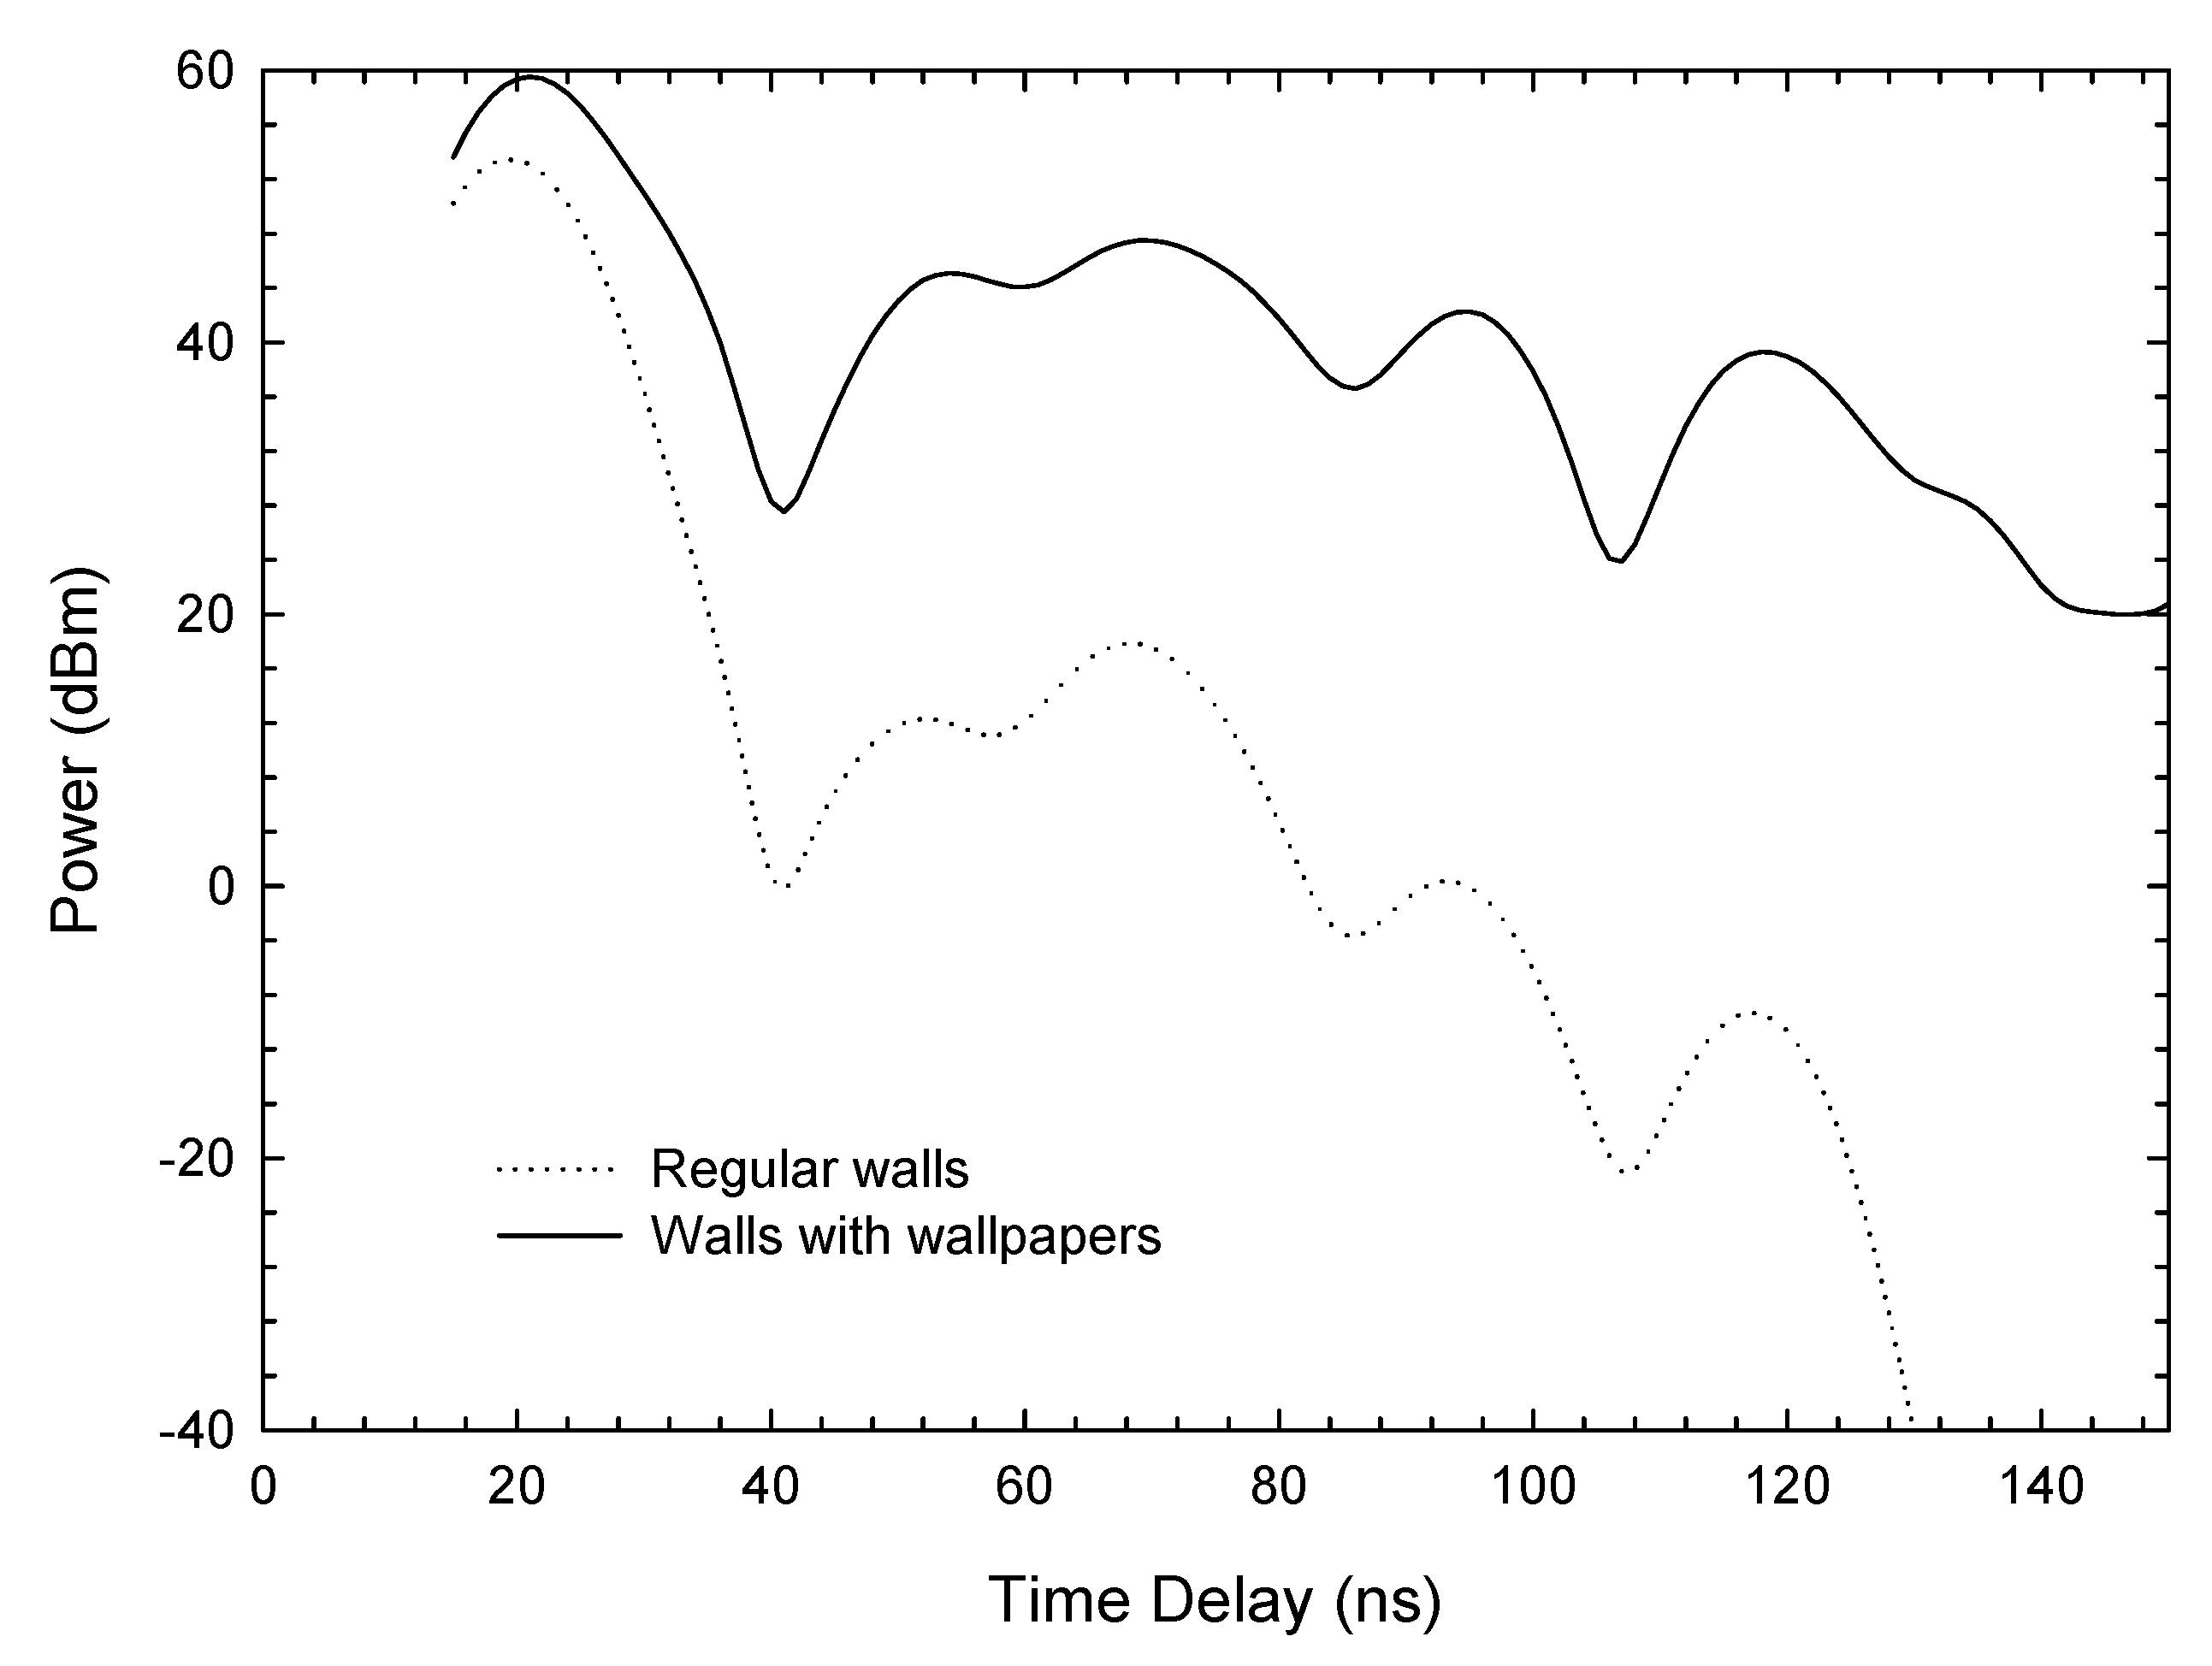
4.1. SISO Case
- Omnidirectional antennas
- Frequency: 5 GHz
- Soft Polarization
- T × 1 and T × 2 bearing a 1 m height
- Number of rays launched: 7200
- Number of considered reflections: 14
- Number of considered reflections of diffracted rays: 4
- Number of considered transmissions: 4
- Number of considered transmissions of diffracted rays: 2.
- Omnidirectional antennas
- Frequency: 5 GHz
- Hard Polarization
- T × 1 and T × 2 bearing a 1 m height
- Number of rays launched: 7200
- Number of considered reflections: 14
- Number of considered reflections of diffracted rays: 4
- Number of considered transmissions: 4
- Number of considered transmissions of diffracted rays: 2.
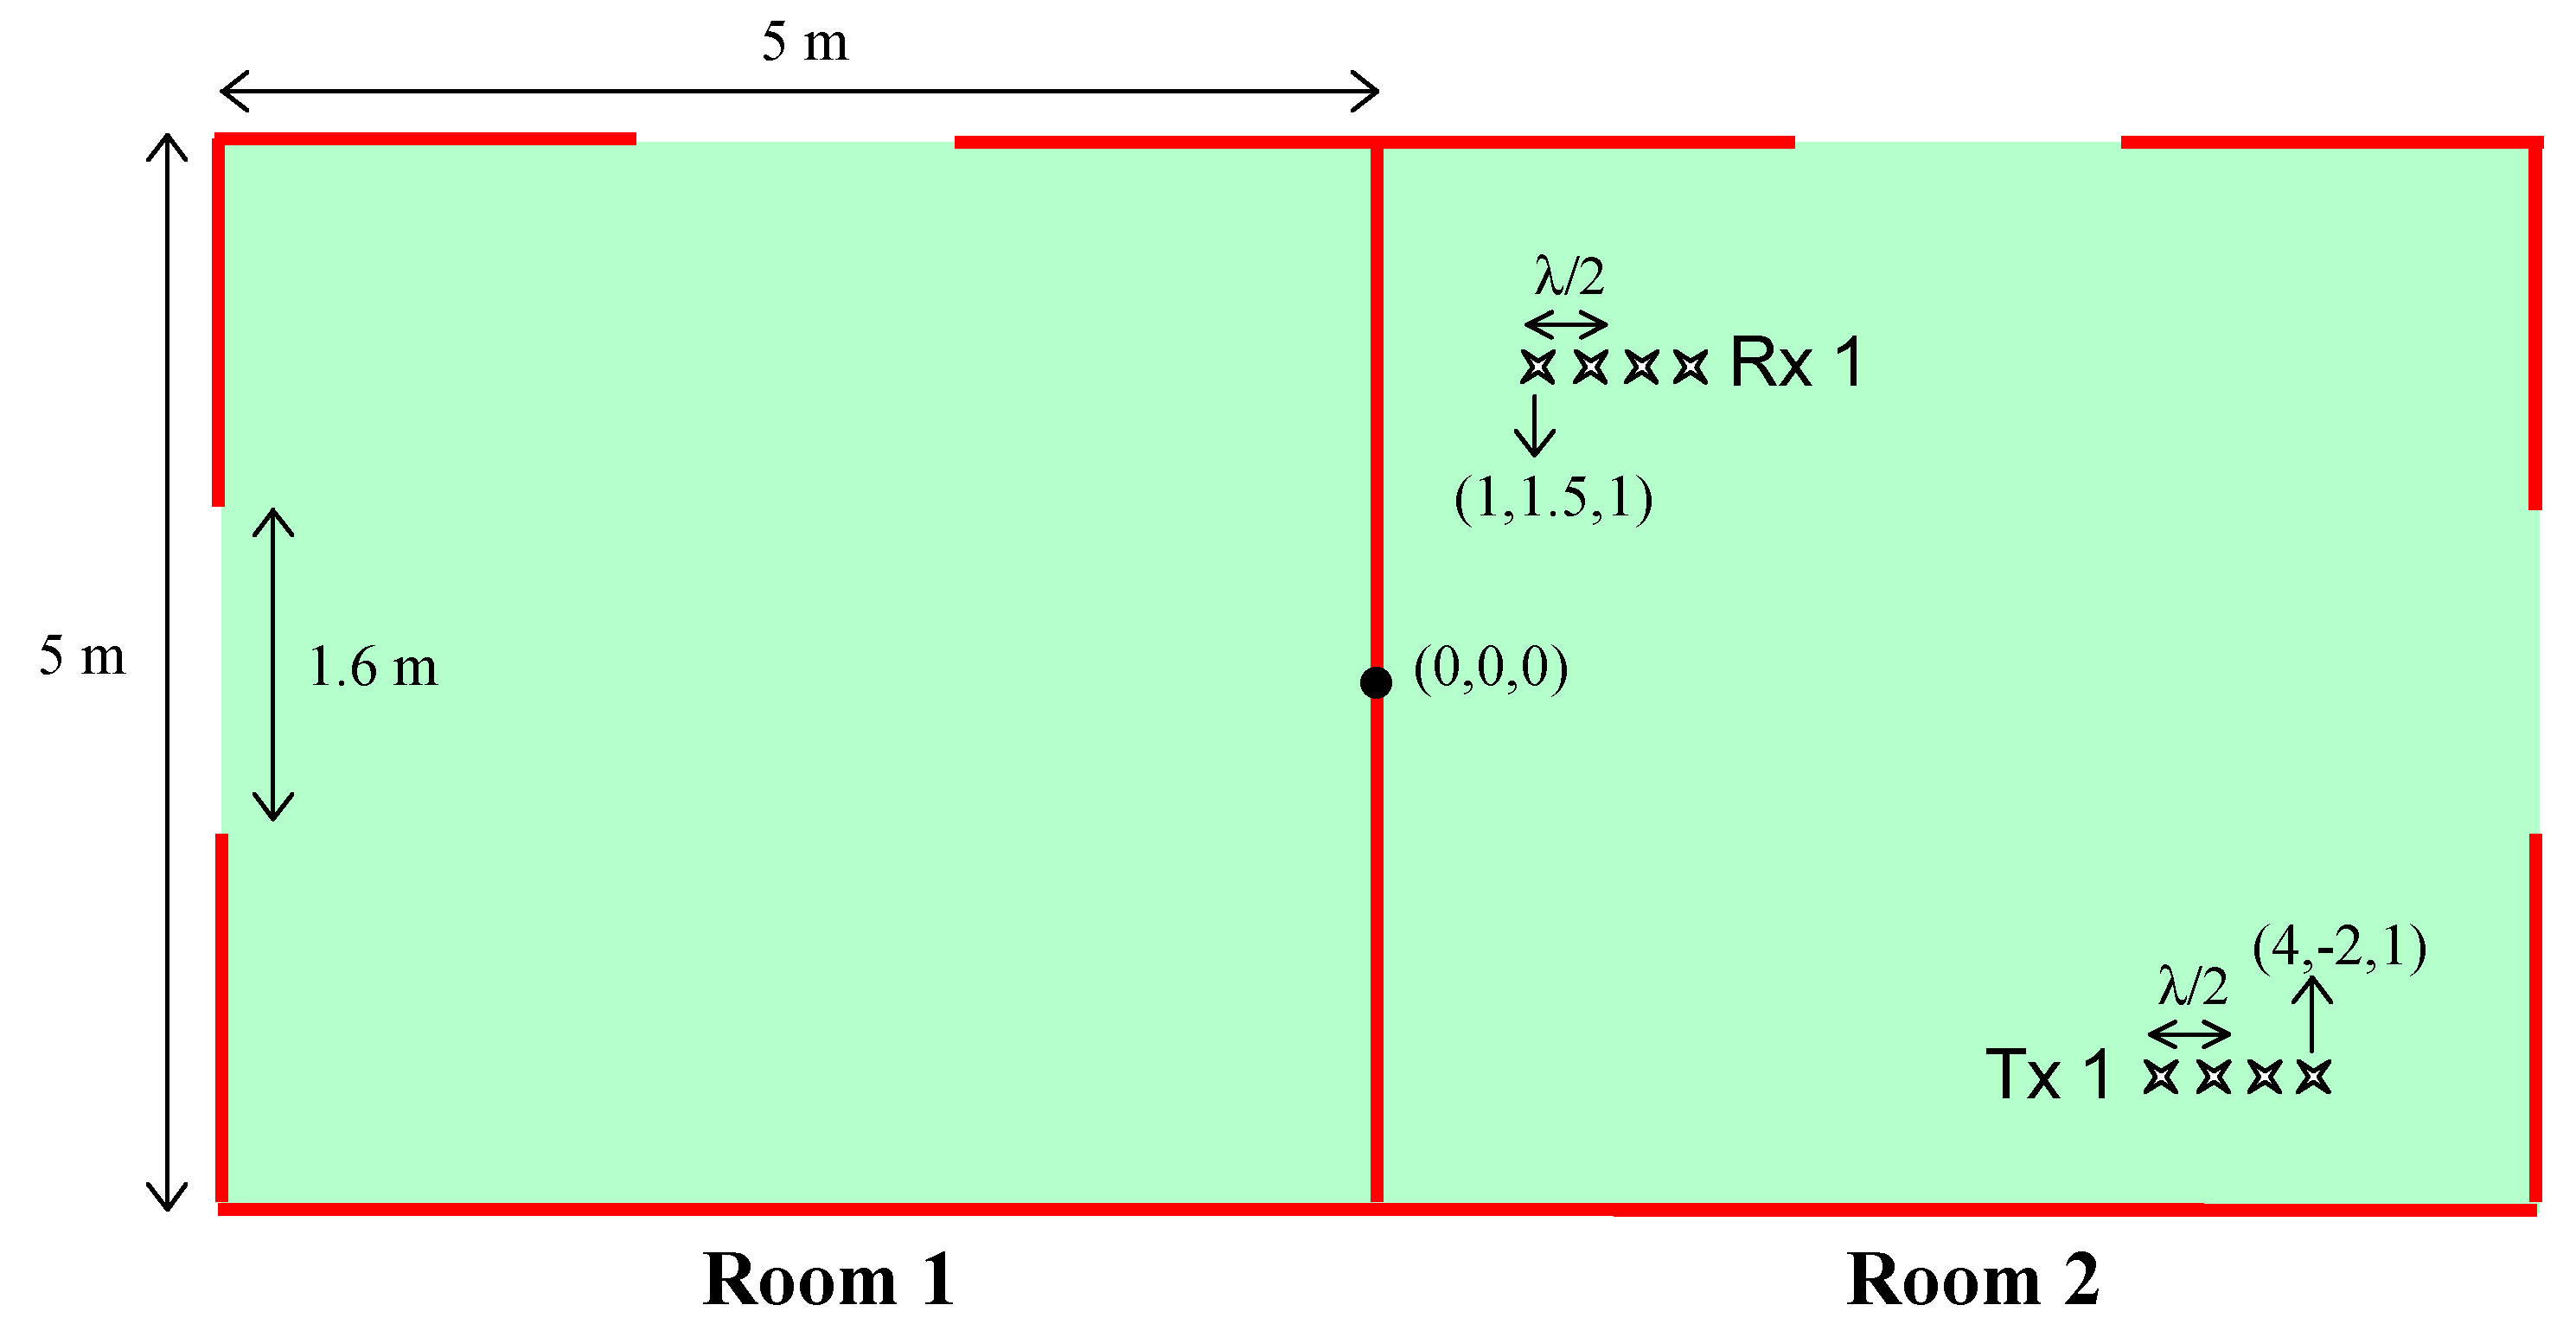
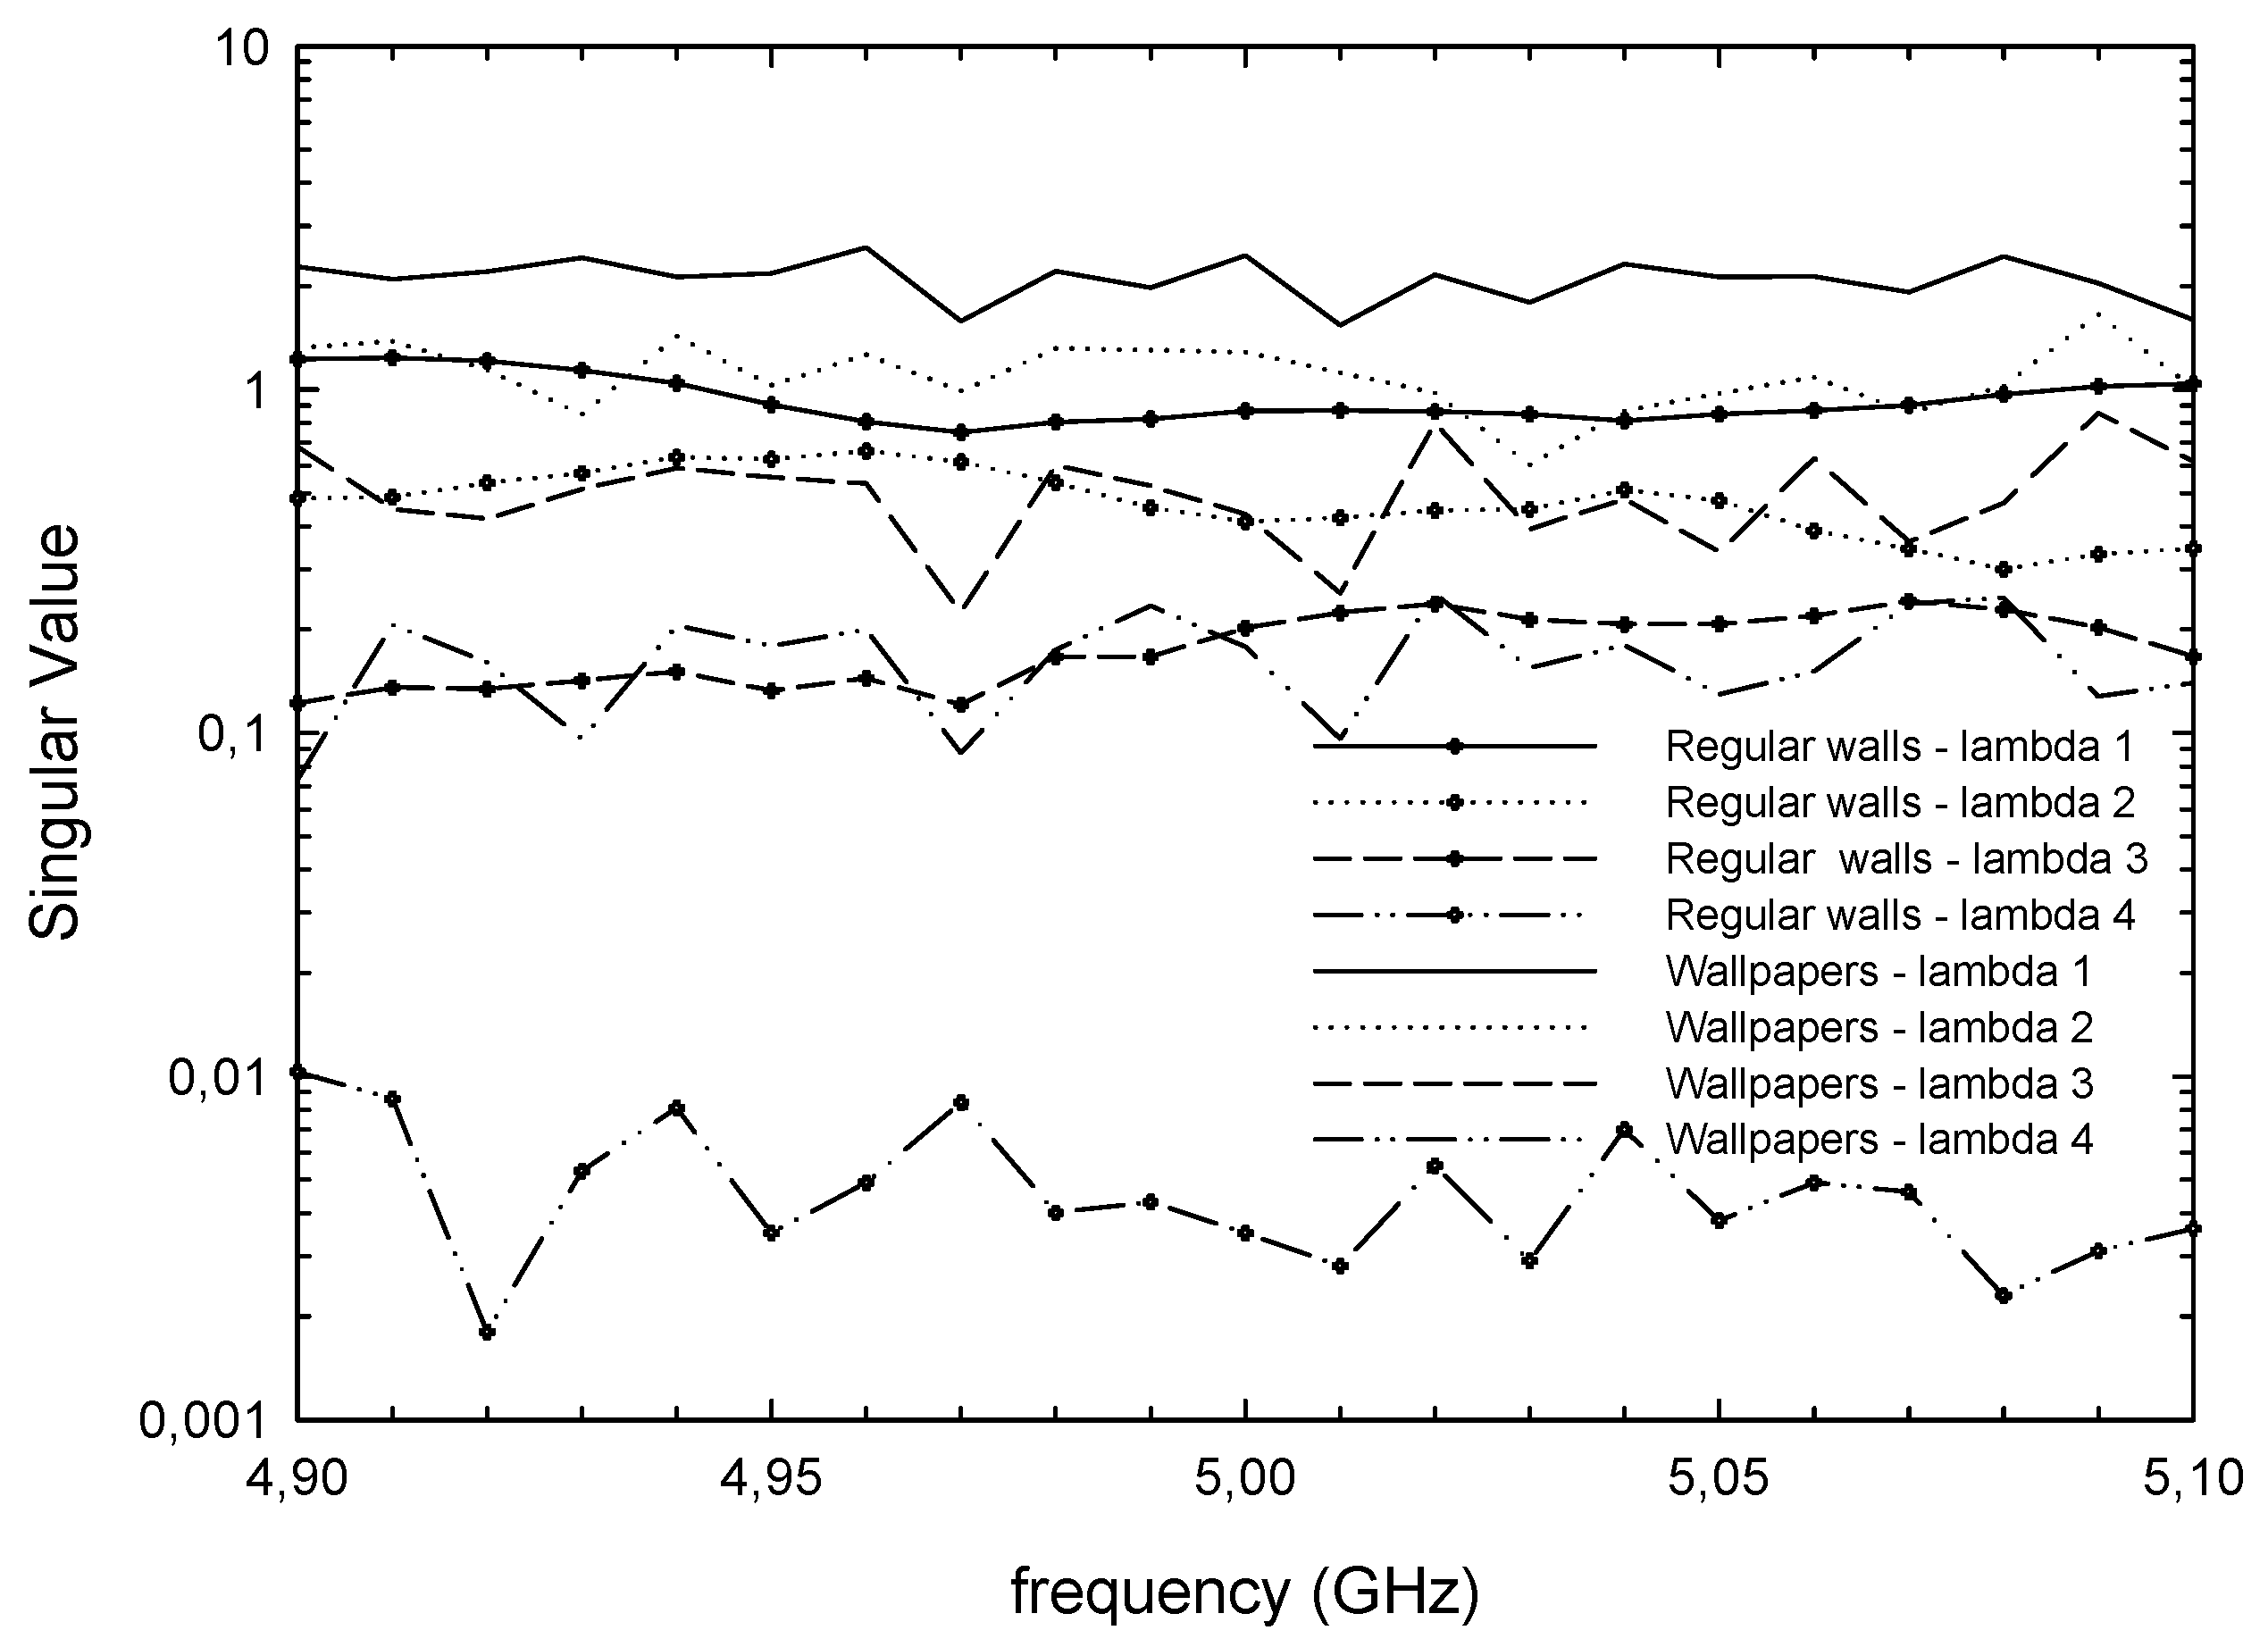
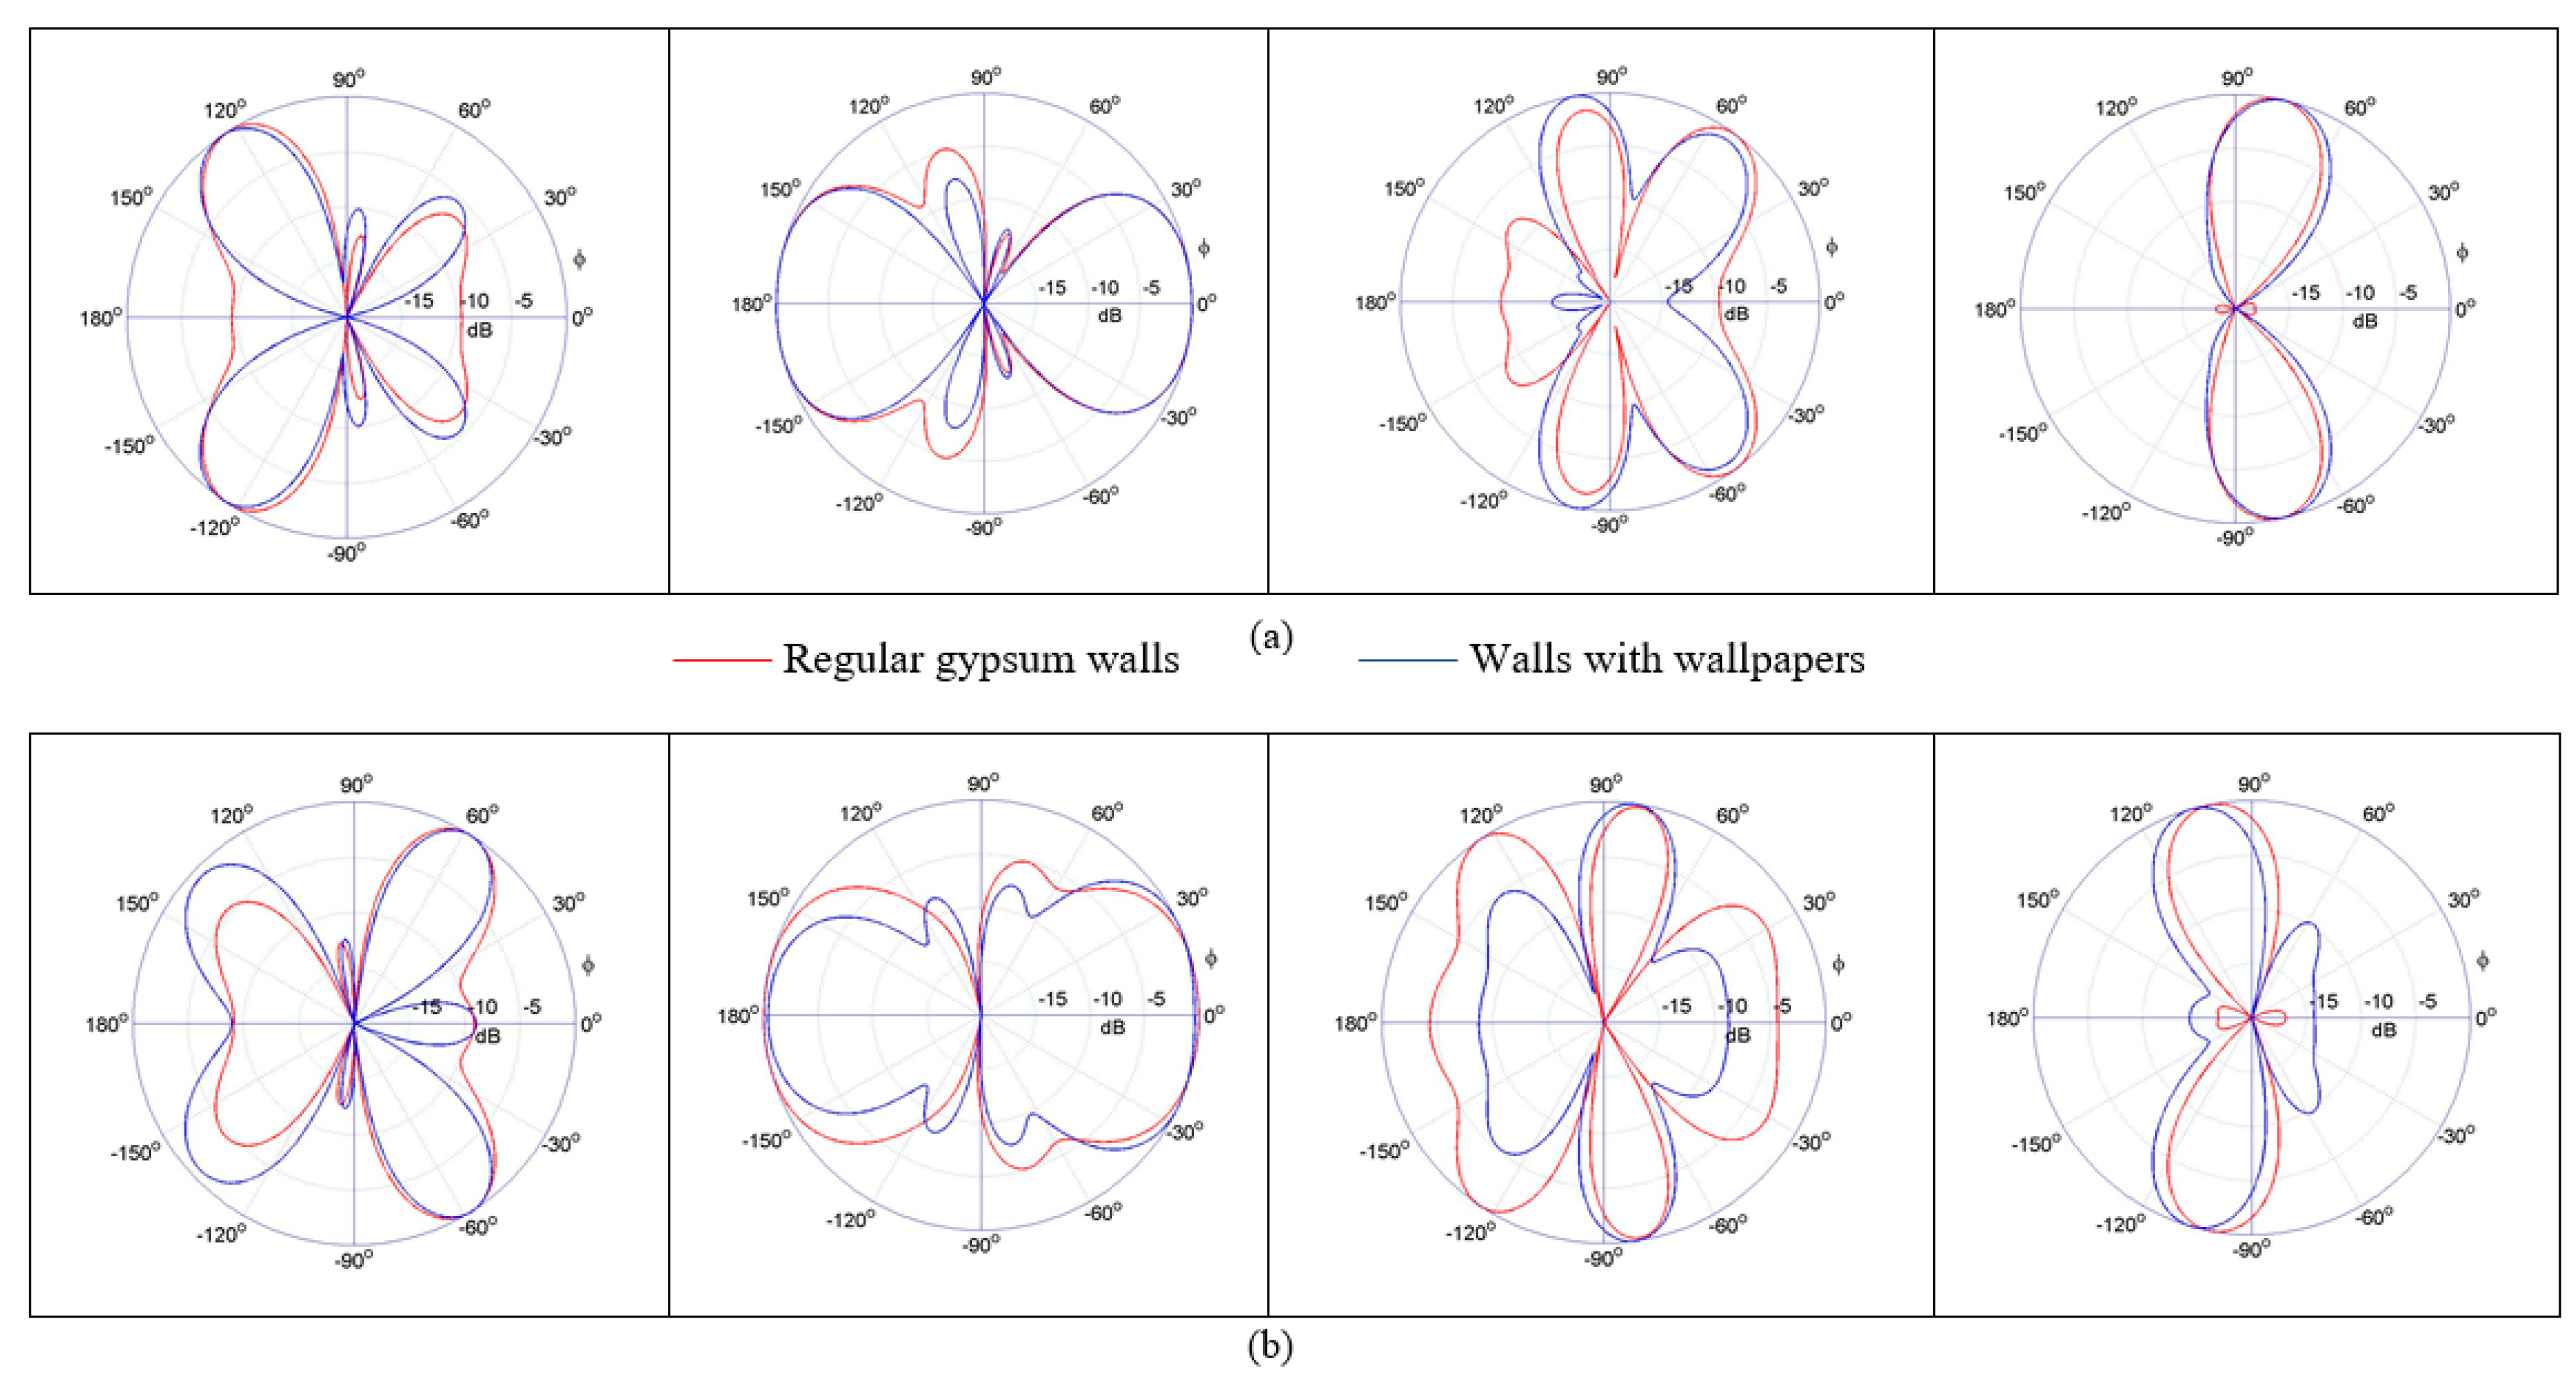
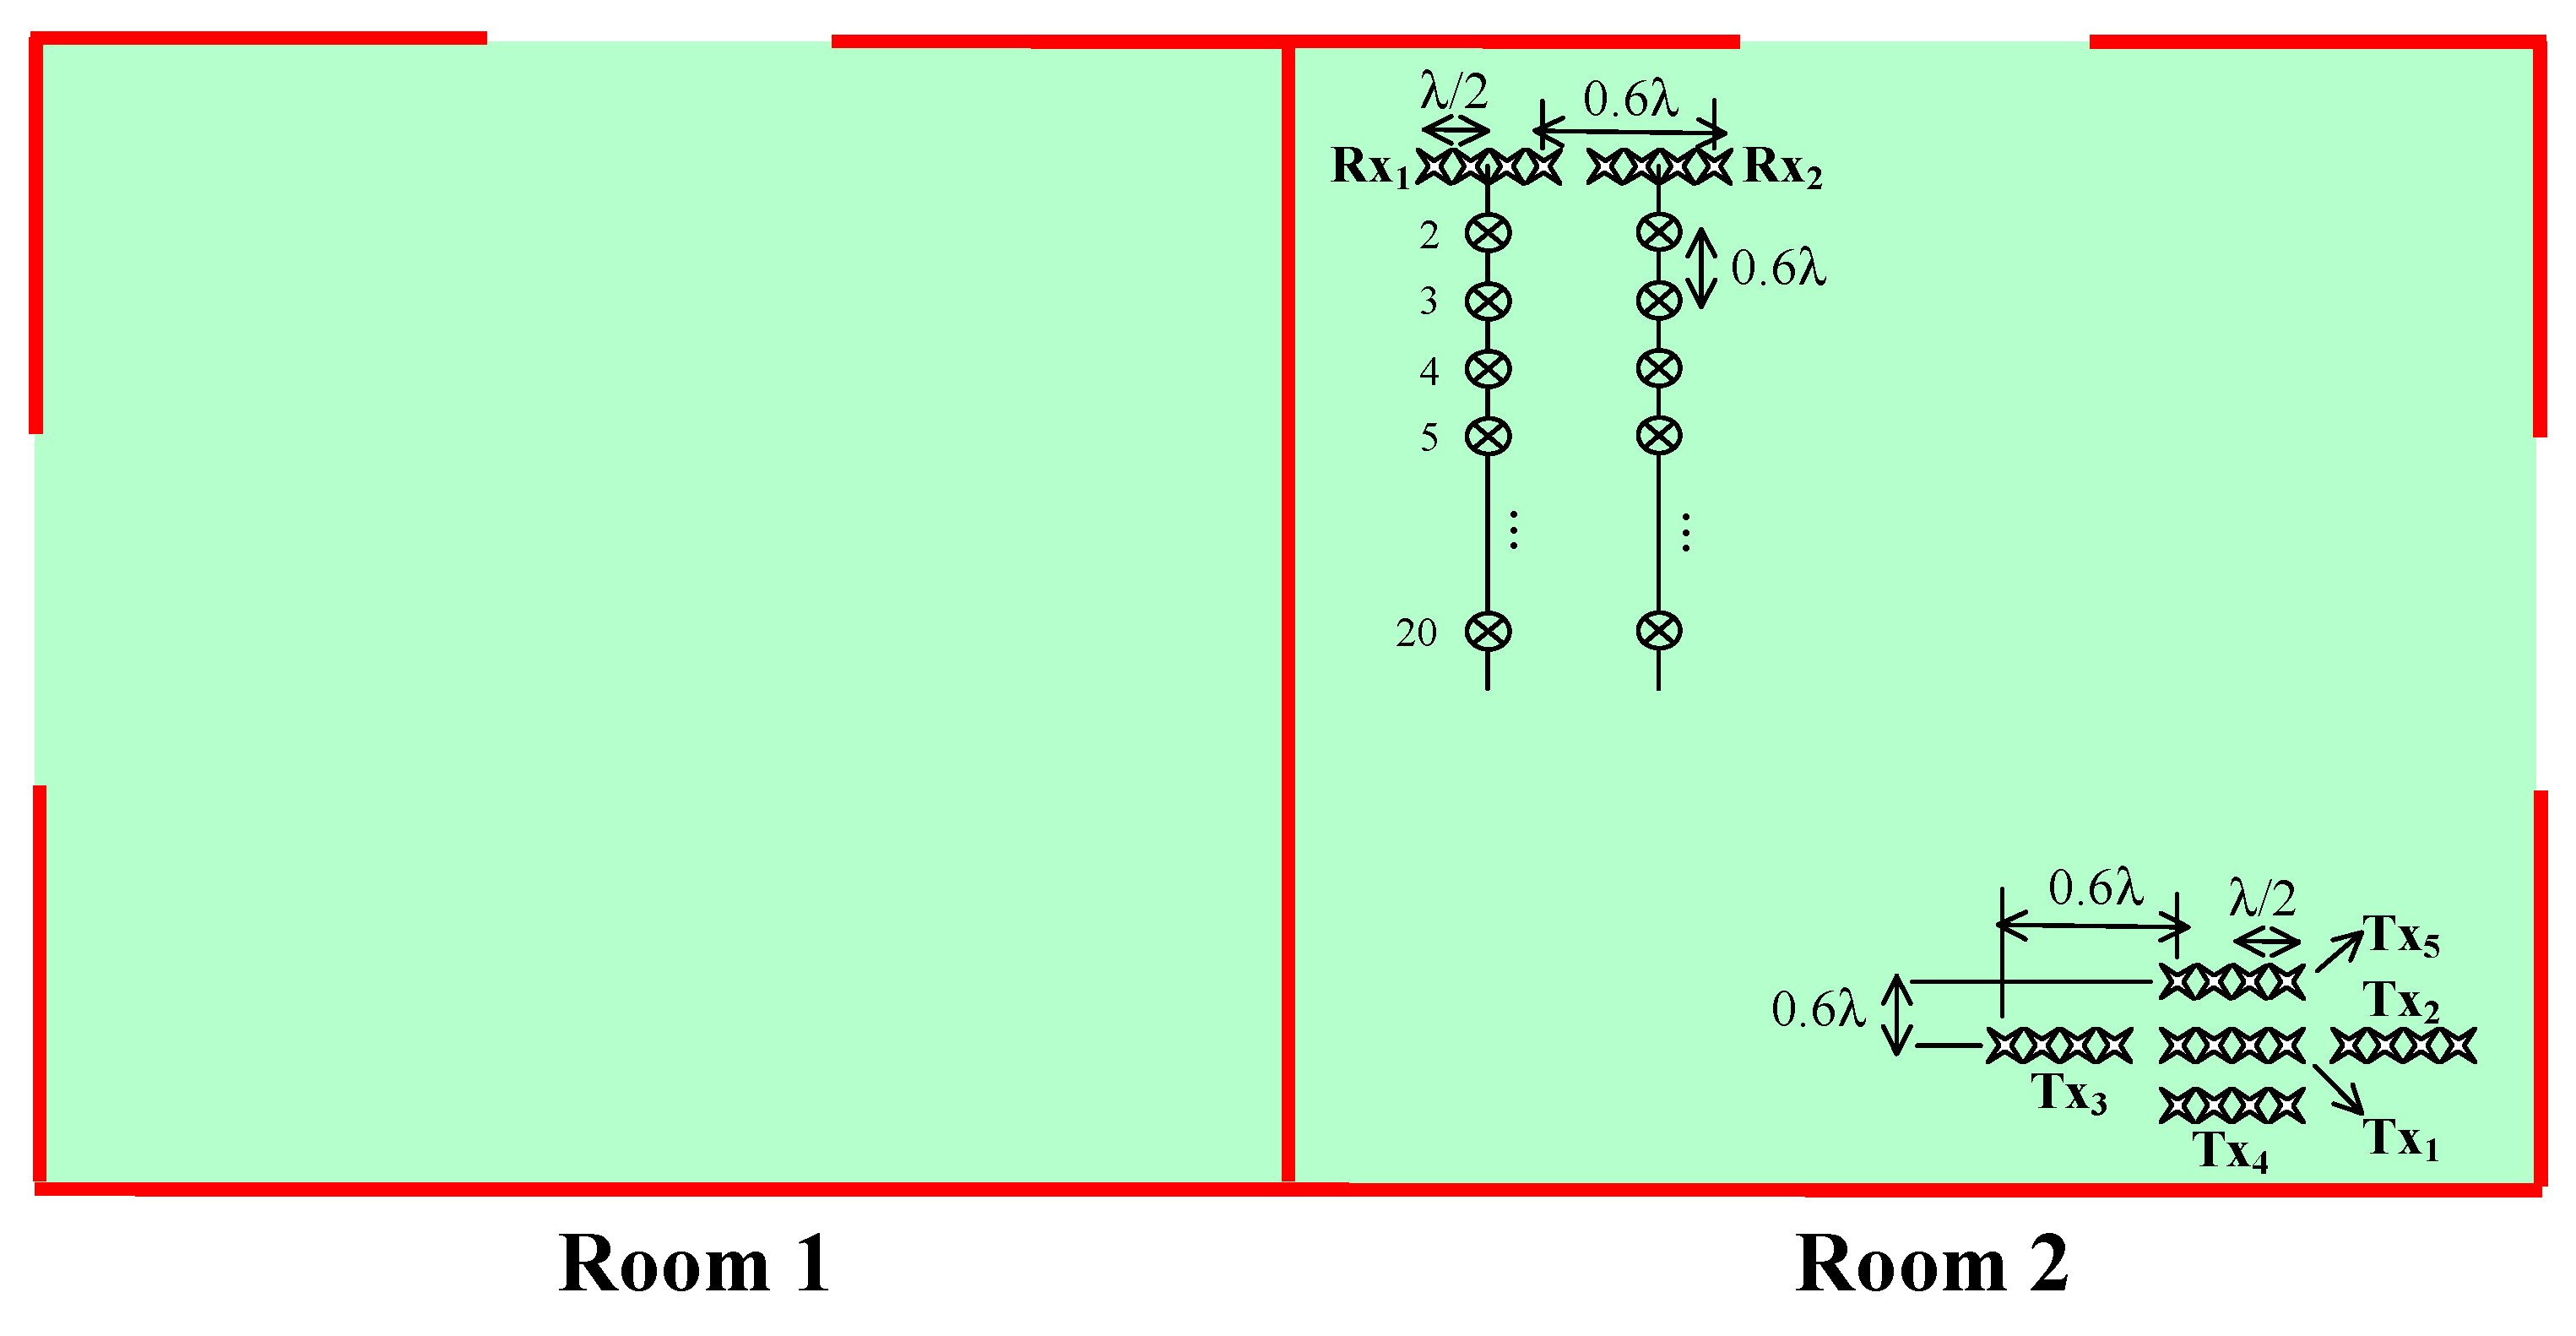
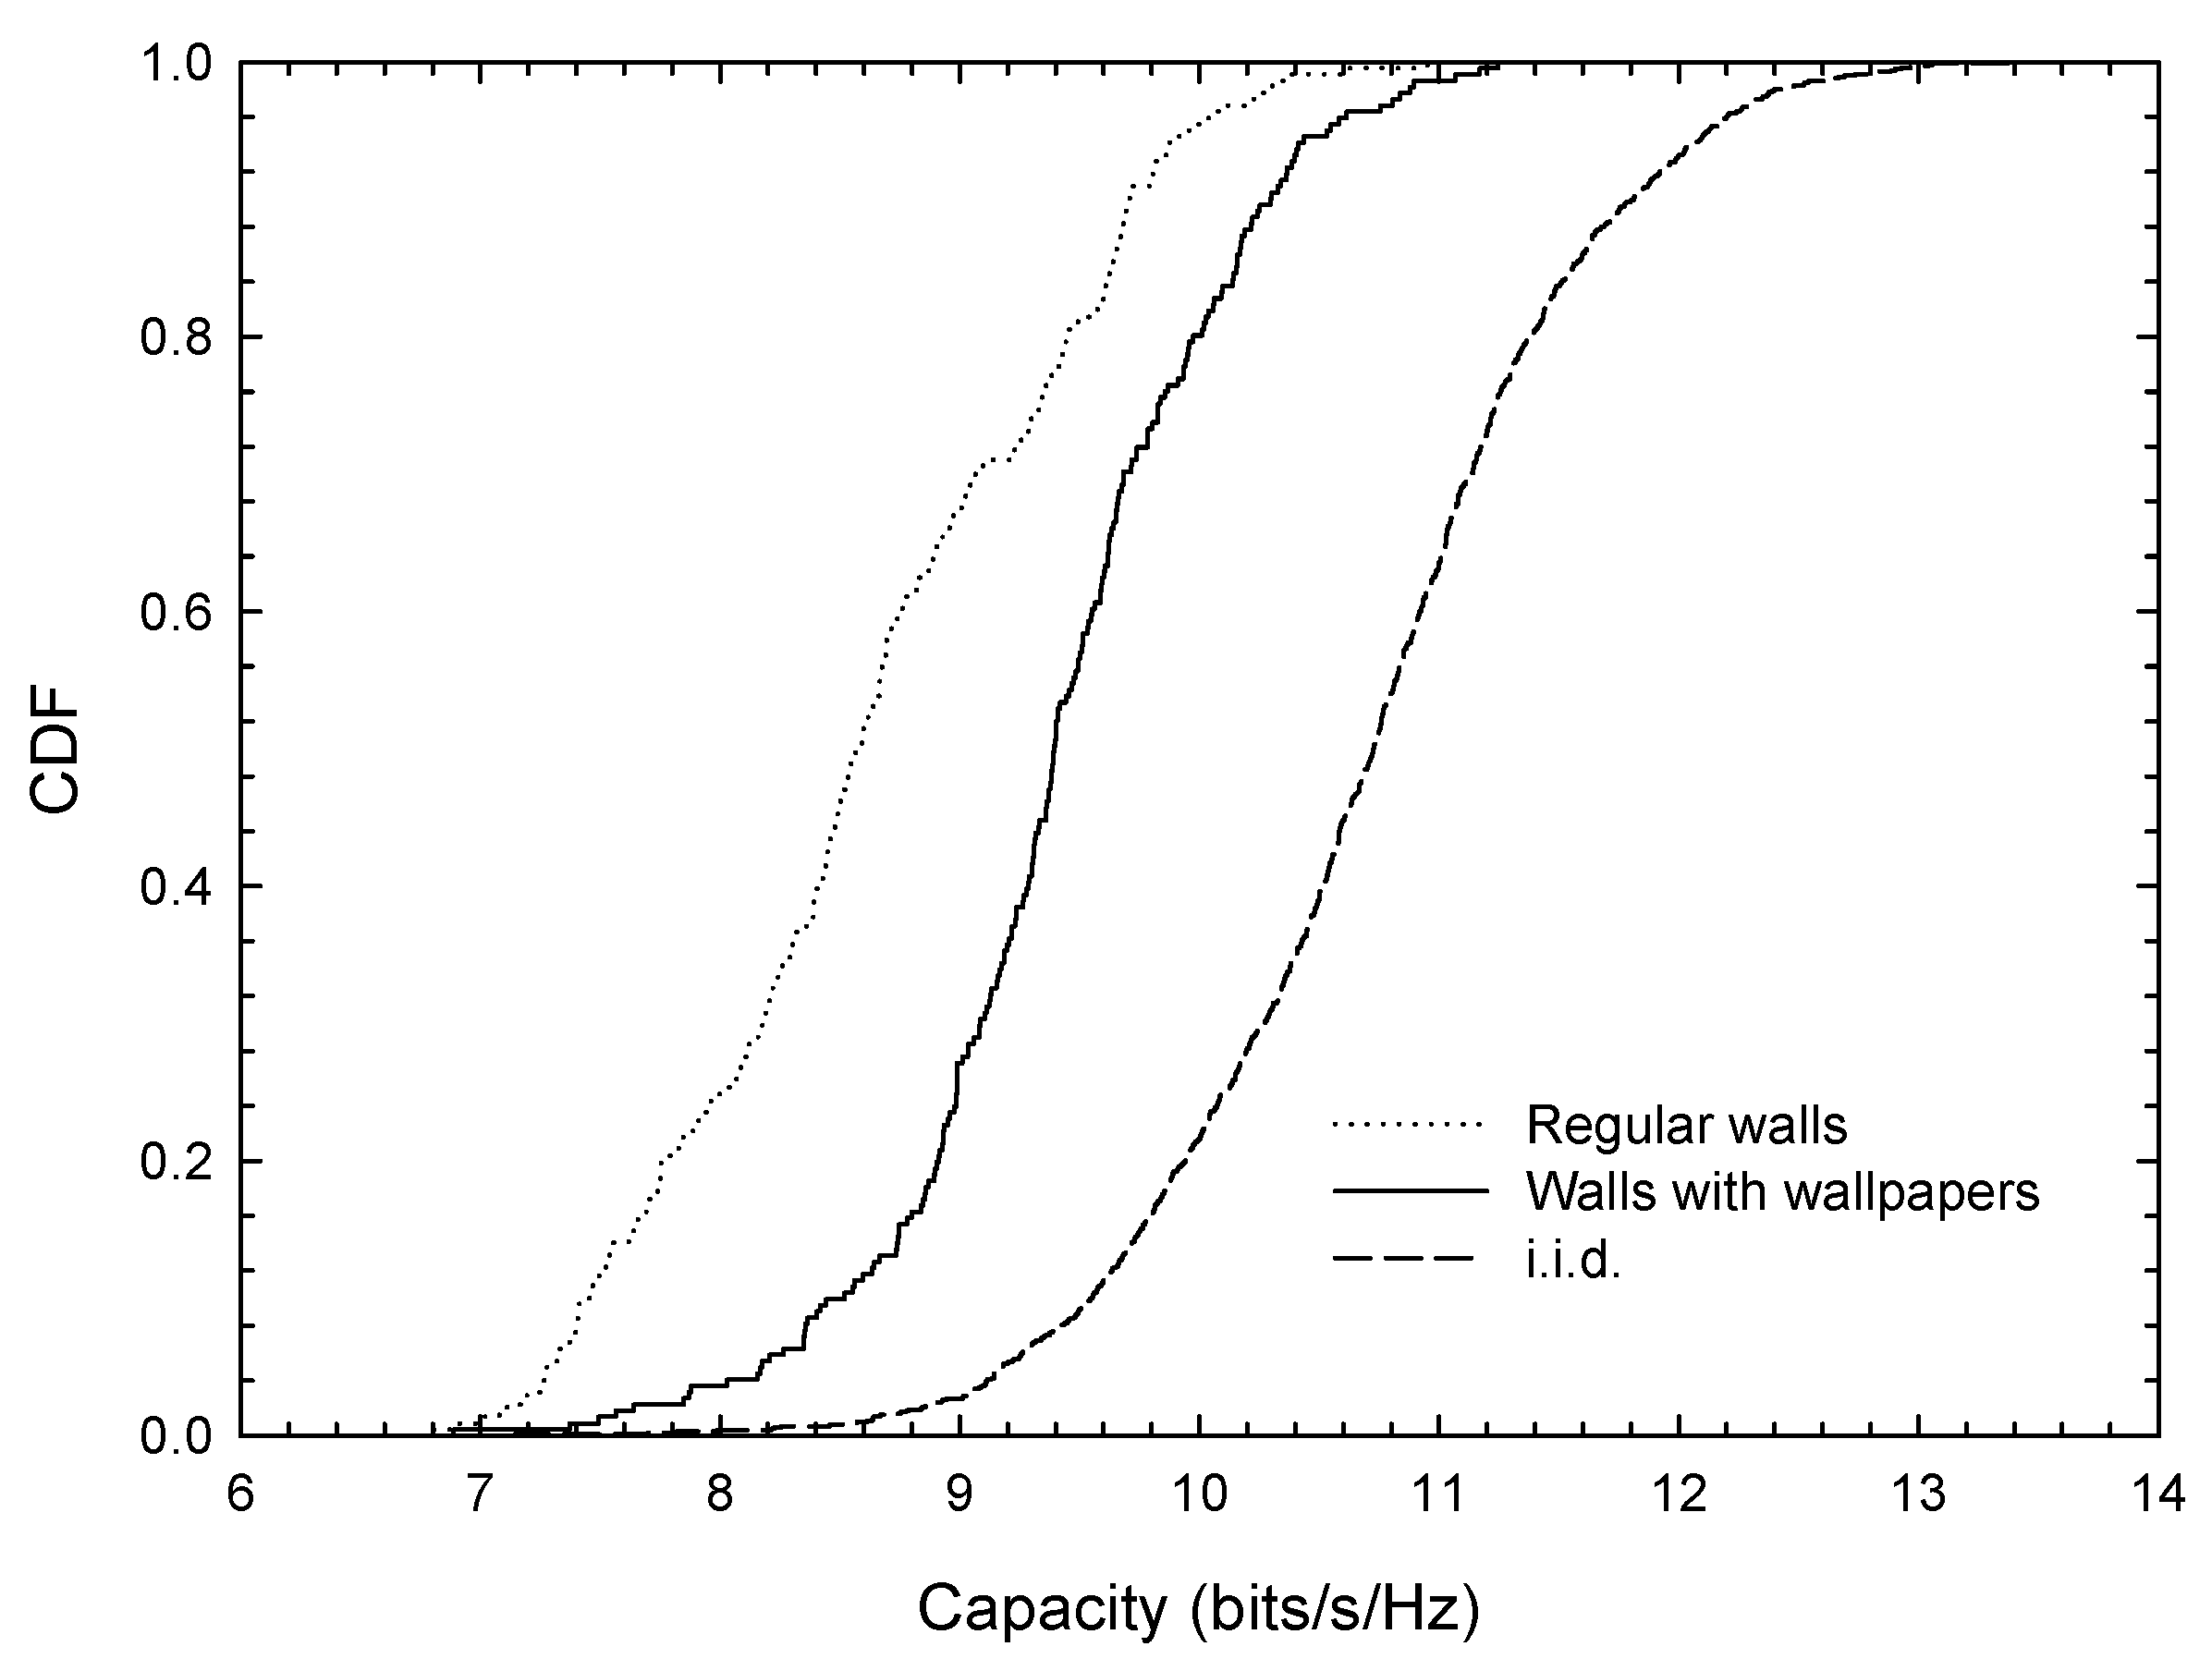
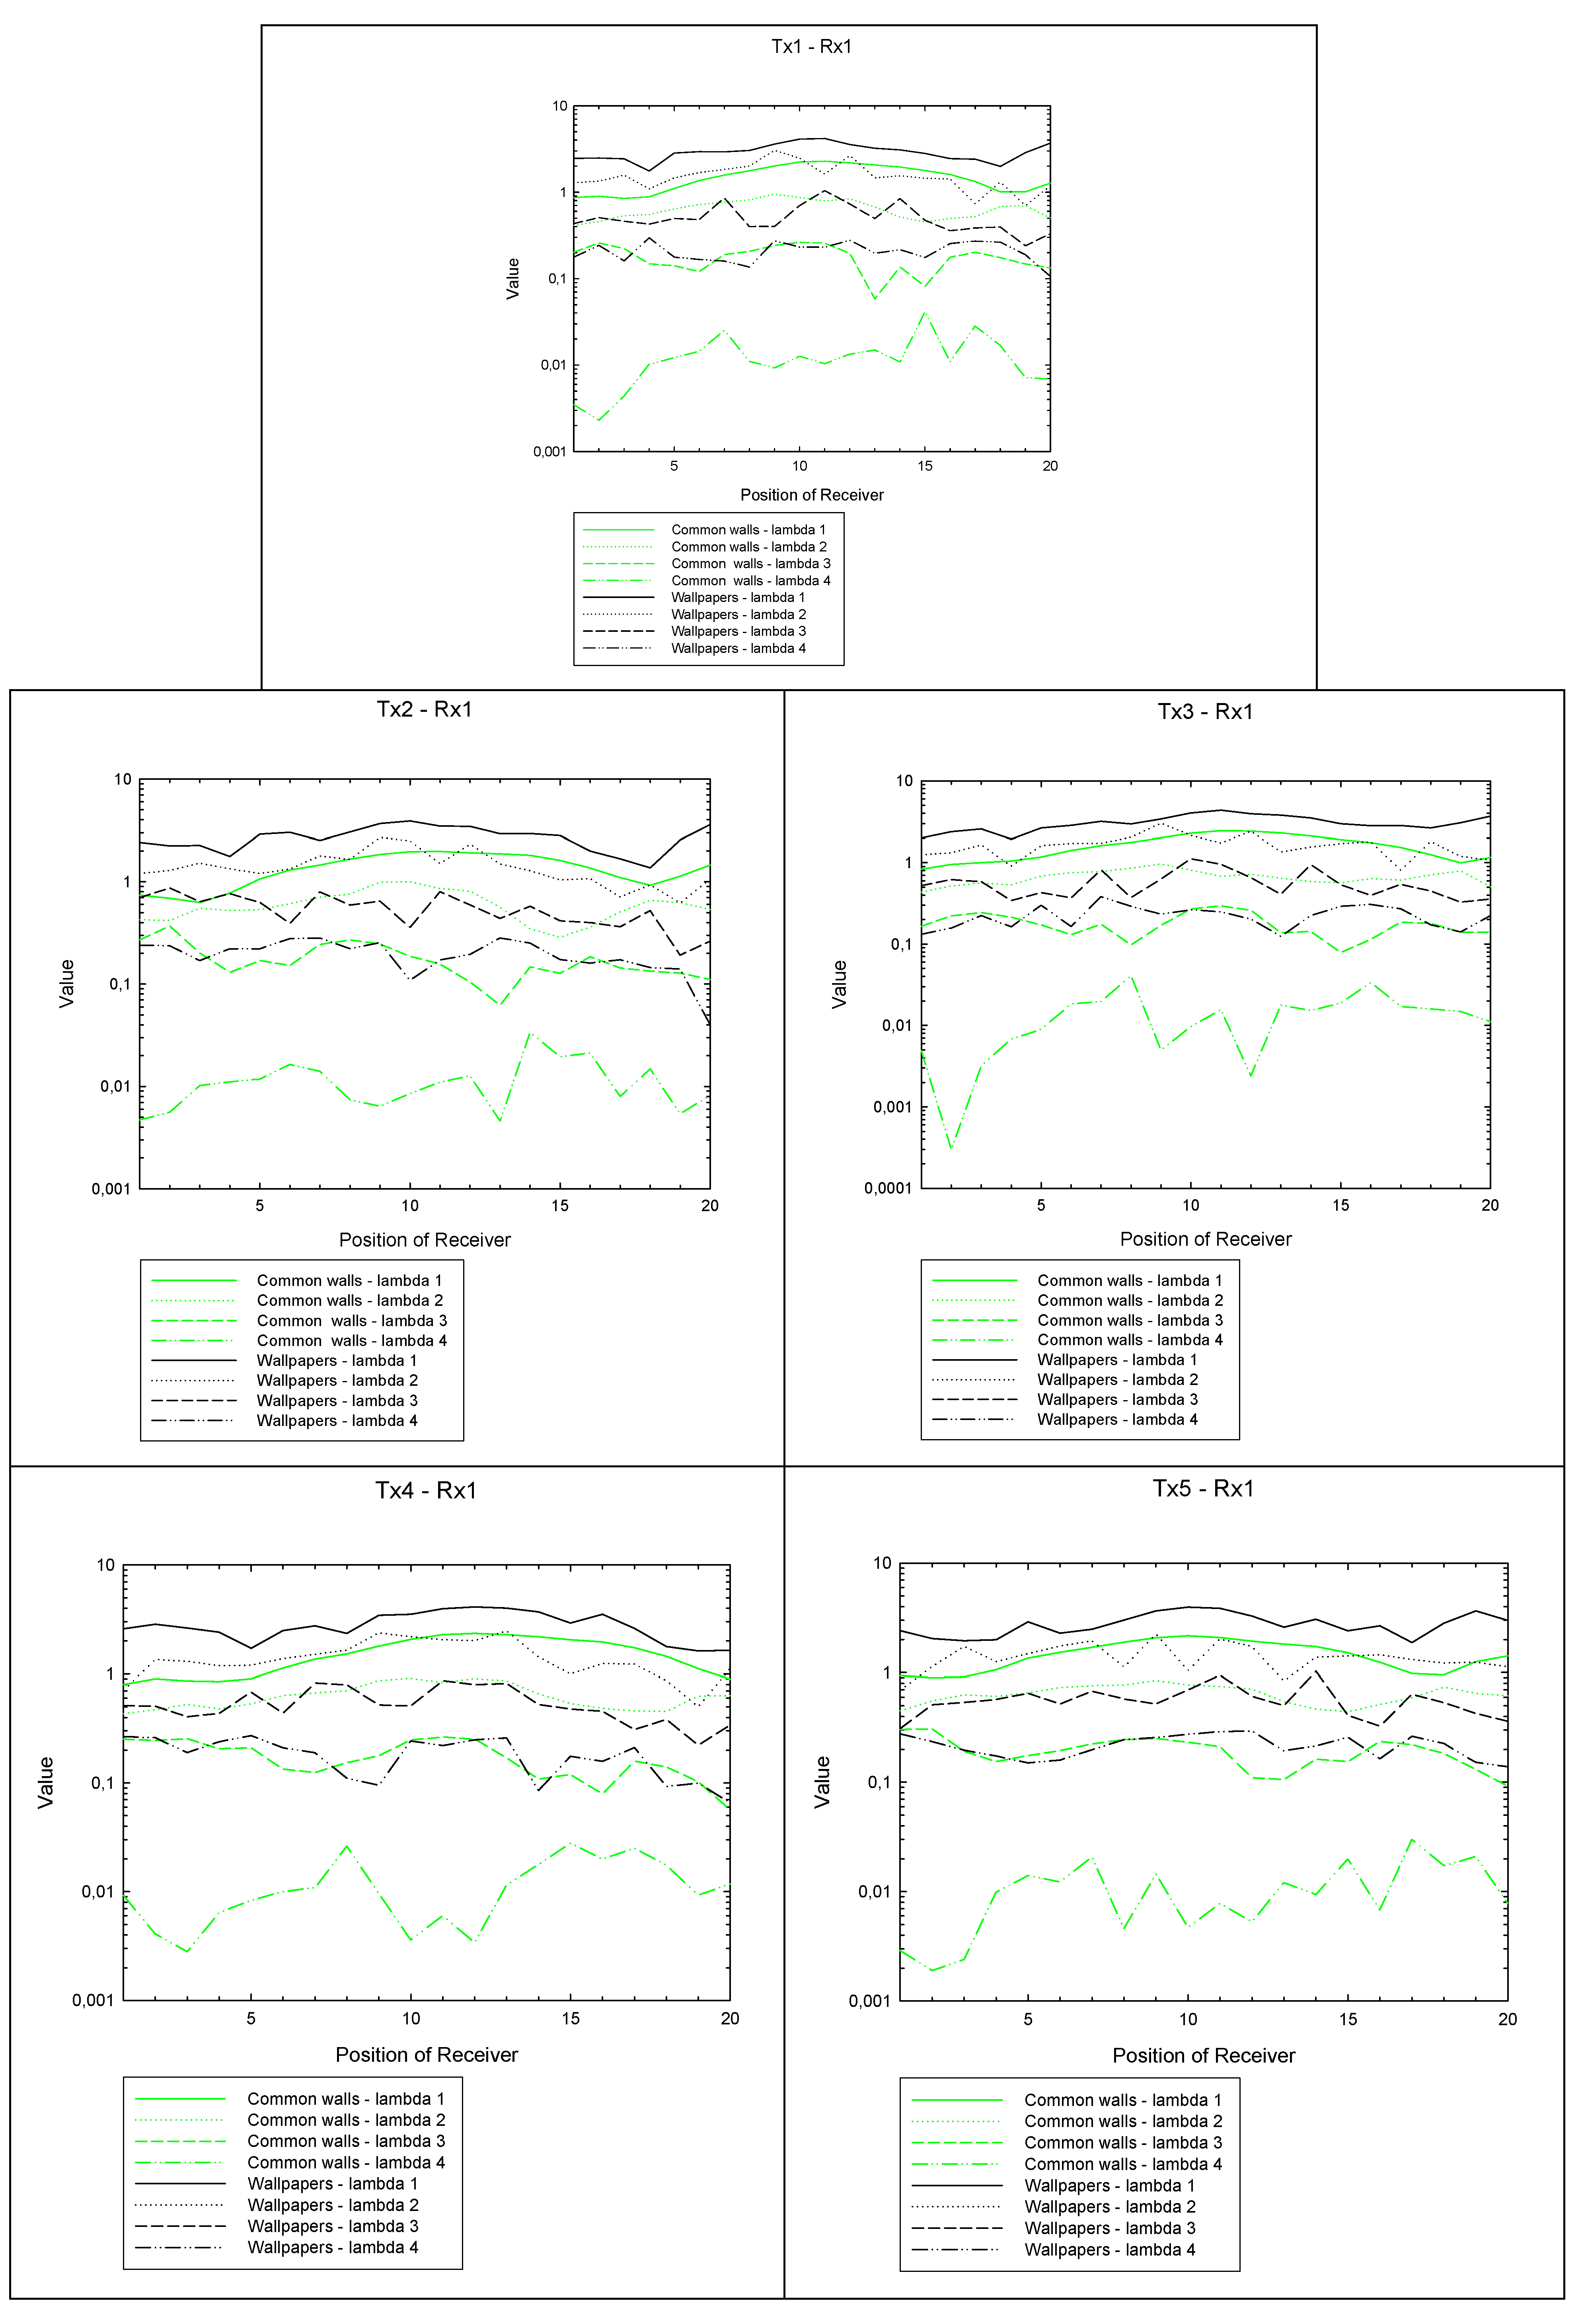
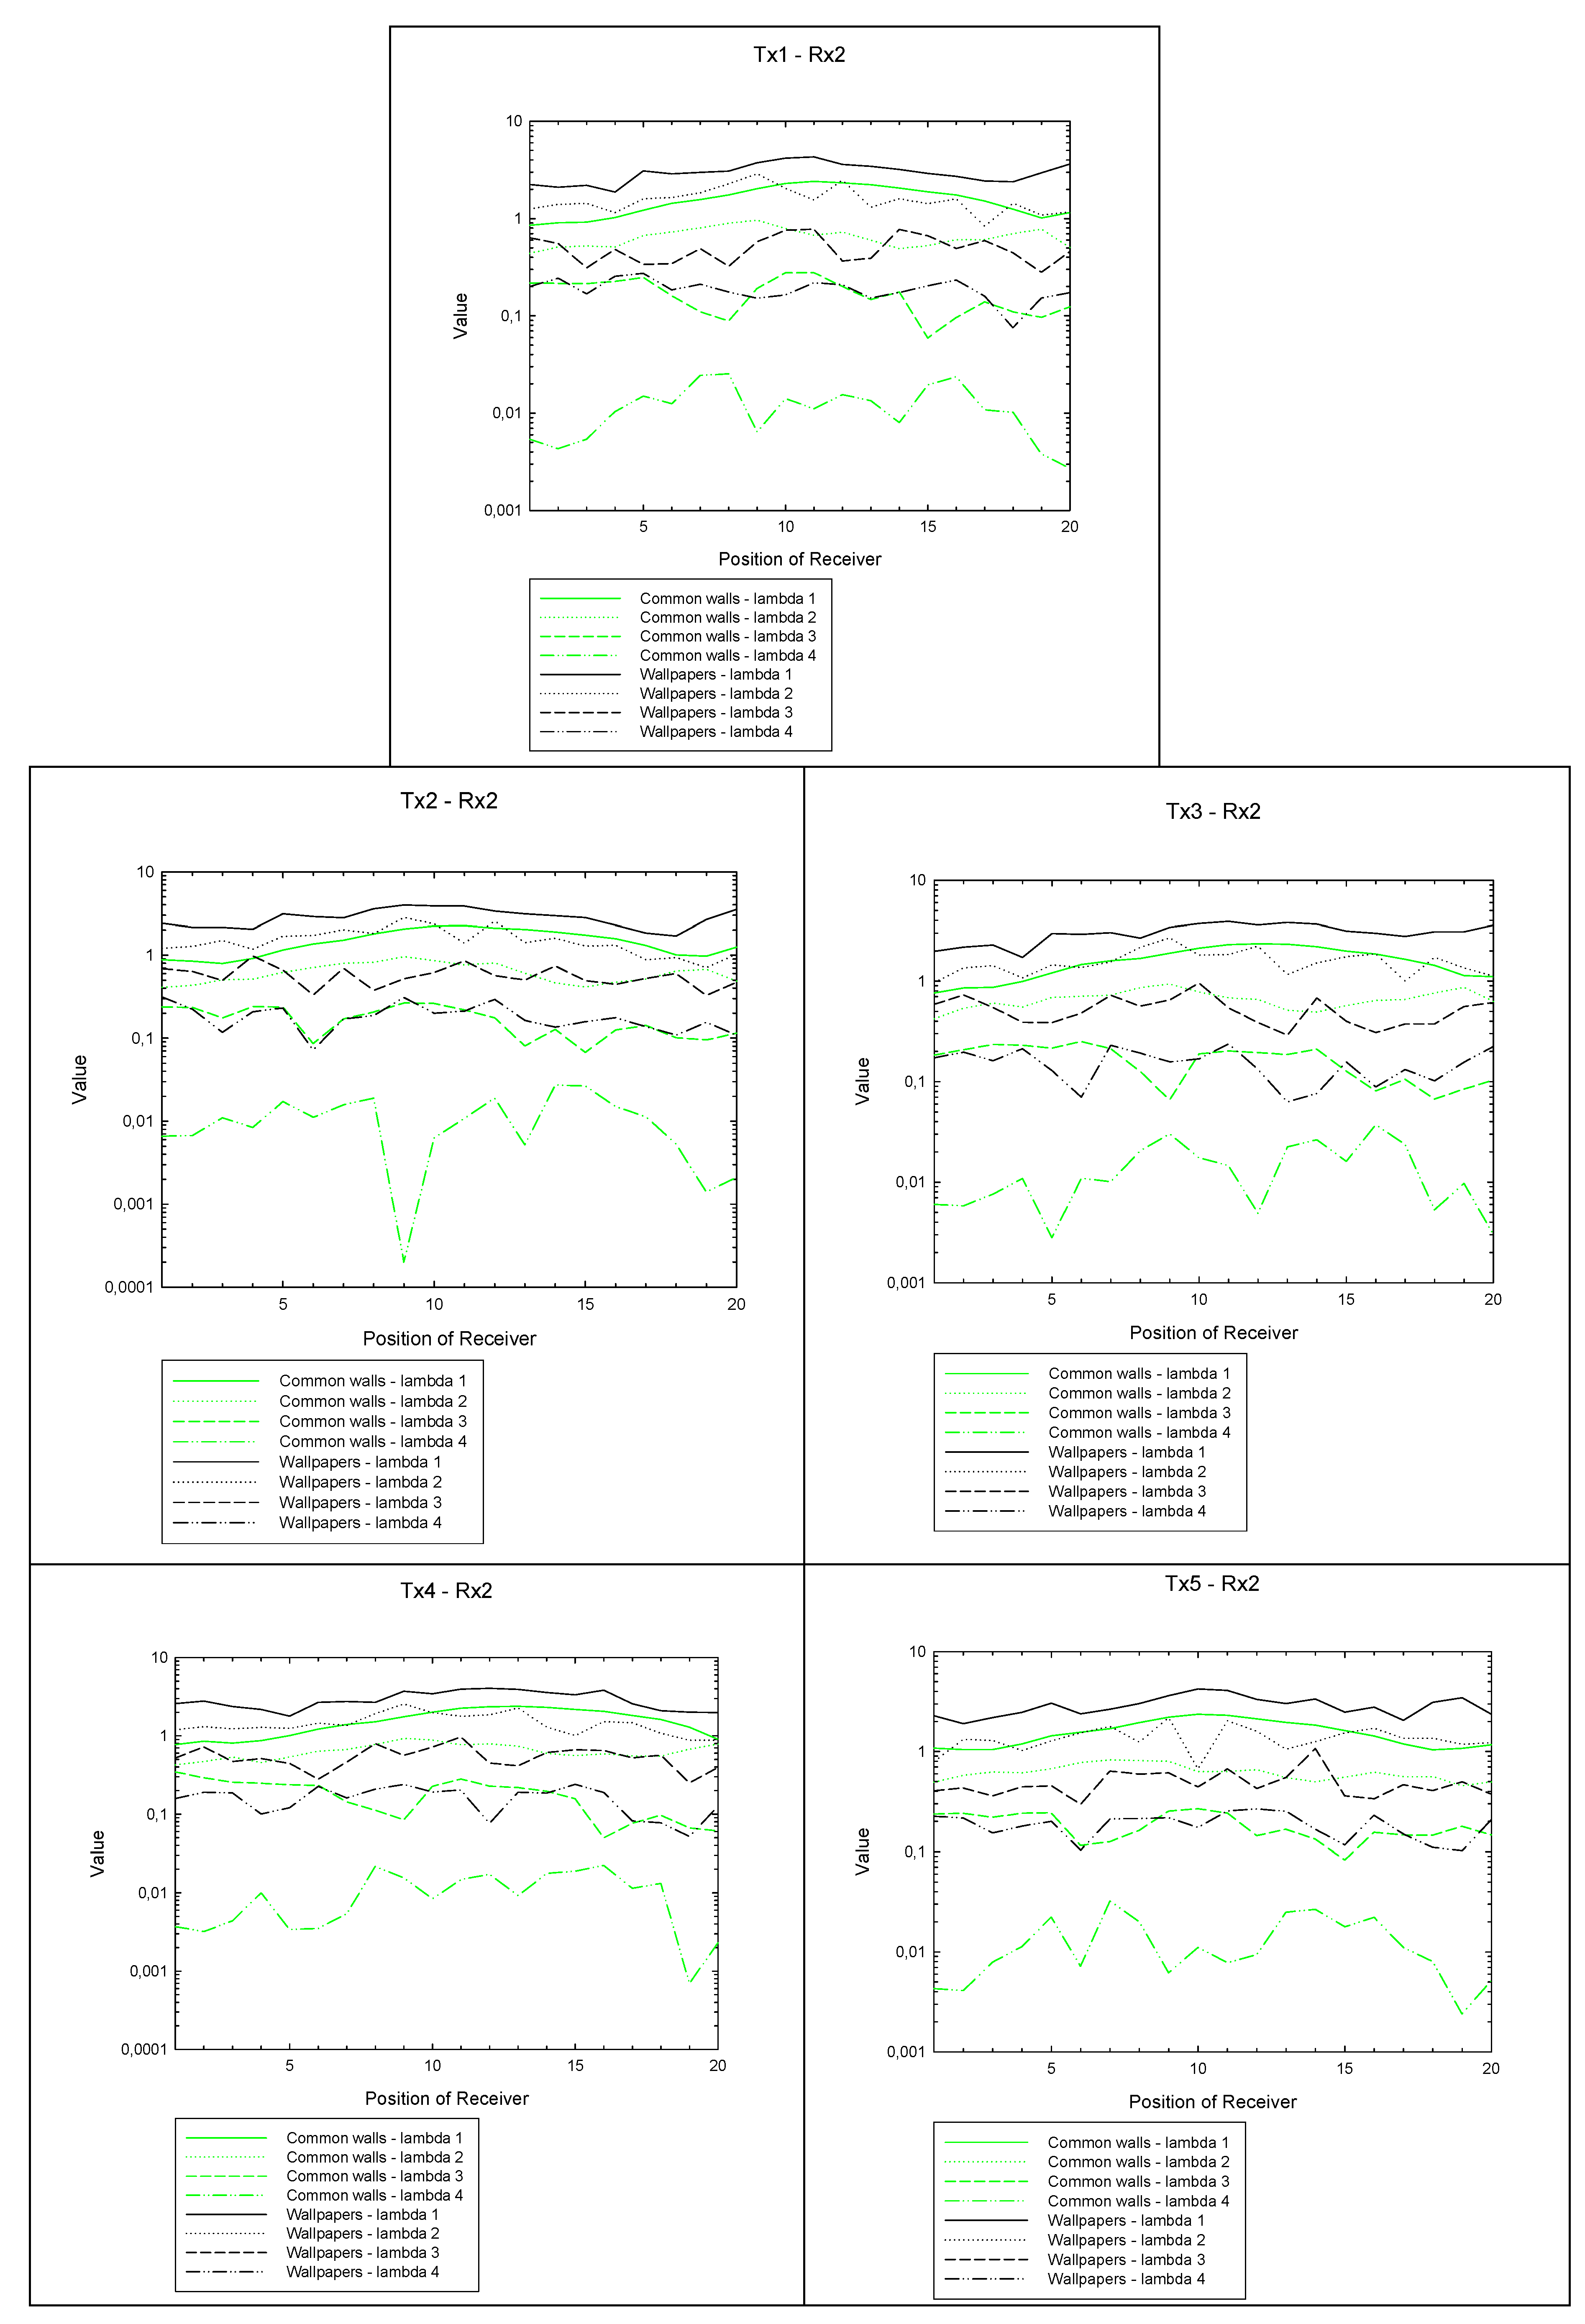
4.2. MIMO Case
- Omnidirectional antennas
- Hard Polarization
- 4 Tx and 4 Rx bearing a 1 m height
- Number of rays launched: 7200
- Number of considered reflections: 9
- Number of considered reflections of diffracted rays: 4
- Number of considered transmissions: 4
- Number of considered transmissions of diffracted rays: 3.
- Omnidirectional antennas
- Frequency: 5 GHz
- Hard Polarization
- Transmitting and receiving antennas bearing a 1 m height
- Number of rays launched: 7200
- Number of considered reflections: 9
- Number of considered reflections of diffracted rays: 4
- Number of considered transmissions: 4
- Number of considered transmissions of diffracted rays: 3.
5. Conclusions
Author Contributions
Funding
Acknowledgments
Conflicts of Interest
References
- Niembro-Martin, A.; De Barros, F.; Eymin-Petot-Tourtollet, G.; Lemaitre-Auger, P.; Pistono, E.; Vuong, T.-P. Metapaper: A frequency selective surface wallpaper for the attenuation of Wi-Fi signals. Eur. Microw. Conf. (EuMC) 2015. [Google Scholar] [CrossRef]
- Sideeq, M.M.; Qasem, N. Smart Wall Based on Active Frequency Selective Wallpaper. In Proceedings of the 1st International Conference on Engineering and Innovative Technology, SU-ICEIT 2016, Salahaddin University-Erbil, Kurdistan, Iraq, 12–14 April 2016. [Google Scholar]
- Qasem, N.; Aldorgam, E.; Alzou’bi, H. Overcoming the Influence of Human Shadowing and Obstacles via Modified Building Using Frequency Selective Wallpapers for 60 GHz. J. Commun. Comput. 2016, 13, 90–101. [Google Scholar] [CrossRef] [Green Version]
- Cho, S.; Hong, I. Reduction of wireless signals in indoor environments by using an active frequency selective wall based on spectrum sensing. Int. J. Commun. Syst. 2017, 30, e3370. [Google Scholar] [CrossRef]
- Döken, B.; Kartal, M. Easily Optimizable Dual-Band Frequency-Selective Surface Design. IEEE Antennas Wirel. Propag. Lett. 2017, 16, 2979–2982. [Google Scholar] [CrossRef]
- Yin, W.; Zhang, H.; Zhong, T.; Min, X. A Novel Compact Dual-Band Frequency Selective Surface for GSM Shielding by Utilizing a 2.5-Dimensional Structure. IEEE Trans. Electromag. Compat. 2018, 60, 2057–2060. [Google Scholar] [CrossRef]
- Cho, S.; Lee, I.; Hong, I. Hong. Frequency Selective Film Design for Building Walls for Blocking Wireless LAN Signal. In Proceedings of the 2018 International Symposium on Antennas and Propagation (ISAP), Busan, Korea (South), 23–26 October 2018; pp. 1–2. [Google Scholar]
- Sung, G.H.; Sowerby, K.W.; Neve, M.J.; Williamson, A.G. A Frequency-Selective Wall for Interference Reduction in Wireless Indoor Environments. IEEE Antennas Propag. Mag. 2006, 48, 29–37. [Google Scholar] [CrossRef]
- Sung, G.H.; Sowerby, K.W.; Williamson, A.G. Modeling a Low-Cost Frequency-Selective Wall for Wireless-Friendly Indoor Environments. IEEE Antennas Wirel. Propag. Lett. 2006, 5, 311–314. [Google Scholar] [CrossRef]
- Telatar, I.E. Capacity of Multi-Antenna Gaussian Channel. Eur. Trans. Telecommun. 1999, 10, 585–595. [Google Scholar] [CrossRef]
- Gustafsson, M.; Karlsson, A.; Pontes Rebelo, A.P.; Widenberg, B. Design of Frequency Selective Windows for Improved Indoor Outdoor Communication. IEEE Trans. Antennas Propag. 2006, 54, 1897–1900. [Google Scholar] [CrossRef] [Green Version]
- Munk, B.A. Frequency Selective Surfaces: Theory and Design; Wiley: New York, Ny, USA, 2000. [Google Scholar]
- Raspopoulos, M.; Stavrou, S. Frequency Selective Buildings Through Frequency Selective Surfaces. IEEE Trans. Antennas Propag. 2011, 59, 2998–3005. [Google Scholar] [CrossRef]
- Balanis, C.A. Advanced Engineering Electromagnetics; John Wiley & Sons, Inc.: New York, NY, USA, 2005; pp. 177–184. [Google Scholar]
- Molina-Garcia-Pardo, J.-M.; Rodríguez, J.-V.; Juan-Llacer, L. Wide-band measurements and characterization at 2.1 GHz while entering in a small tunnel. IEEE Trans. Veh. Technol. 2004, 53, 1794–1799. [Google Scholar] [CrossRef]
- Luebbers, R.J. Finite Conductivity Uniform GTD versus Knife Edge Diffraction in Prediction of Propagation Path Loss. IEEE Trans. Antennas Propag. 1984, 32, 70–76. [Google Scholar] [CrossRef]
- Chuan, C.-N.; Kahn, J.M.; Tse, D. Capacity of Multi-Antenna Array Systems in Indoor Wireless Environments. In Proceedings of the IEEE Global Telecommunications Conference (GLOBECOM 98), Sydney, Australia, 8–12 November 1998. [Google Scholar]
- Foschini, G.J.; Gans, J. On Limits of Wireless Communications in a Fading Environment when using Multiple Antennas. Wirel. Personal Commun. 1998, 6, 311–335. [Google Scholar] [CrossRef]
- Molina-Garcia-Pardo, J.-M.; Rodríguez, J.-V.; Juan-Llacer, L. Parametric spherical wave multiple-input and multiple-output model for ray-based simulations. Radio Sci. 2007, 42. [Google Scholar] [CrossRef]


| Mean | Standard Deviation | ||
|---|---|---|---|
| Lambda1 | 1.5254 | 0.50602 | |
| Regular | Lambda2 | 0.63897 | 0.14742 |
| Walls | Lambda3 | 0.17615 | 0.064675 |
| Lambda4 | 0.012362 | 0.0081471 | |
| Lambda1 | 2.9068 | 0.68067 | |
| Walls with | Lambda2 | 1.5055 | 0.49311 |
| Wallpaper | Lambda3 | 0.53912 | 0.18192 |
| Lambda4 | 0.19102 | 0.061508 |
© 2020 by the authors. Licensee MDPI, Basel, Switzerland. This article is an open access article distributed under the terms and conditions of the Creative Commons Attribution (CC BY) license (http://creativecommons.org/licenses/by/4.0/).
Share and Cite
Rodríguez, J.-V.; Gustafsson, M.; Molina-García-Pardo, J.-M.; Juan-Llácer, L.; Rodríguez-Rodríguez, I. Frequency-Selective Wallpaper for Indoor Interference Reduction and MIMO Capacity Improvement. Symmetry 2020, 12, 695. https://doi.org/10.3390/sym12050695
Rodríguez J-V, Gustafsson M, Molina-García-Pardo J-M, Juan-Llácer L, Rodríguez-Rodríguez I. Frequency-Selective Wallpaper for Indoor Interference Reduction and MIMO Capacity Improvement. Symmetry. 2020; 12(5):695. https://doi.org/10.3390/sym12050695
Chicago/Turabian StyleRodríguez, José-Víctor, Mats Gustafsson, José-María Molina-García-Pardo, Leandro Juan-Llácer, and Ignacio Rodríguez-Rodríguez. 2020. "Frequency-Selective Wallpaper for Indoor Interference Reduction and MIMO Capacity Improvement" Symmetry 12, no. 5: 695. https://doi.org/10.3390/sym12050695