Asymmetrical Velocity Distribution in the Drag-Reducing Channel Flow of Surfactant Solution Caused by an Injected Ultrathin Water Layer

1
College of Energy and Mechanical Engineering, Shanghai University of Electric Power, Shanghai 200090, China
2
Department of Thermal Engineering, Chengde Petroleum College, Chengde 067000, China
*
Authors to whom correspondence should be addressed.
Symmetry 2020, 12(5), 846; https://doi.org/10.3390/sym12050846
Submission received: 29 March 2020
/
Revised: 14 May 2020
/
Accepted: 15 May 2020
/
Published: 21 May 2020
(This article belongs to the Special Issue Symmetry in Fluid Flow)
Abstract
:Although the turbulent intensity is suppressed in the drag-reducing channel flow by viscoelastic additives, the mean velocity distribution in the channel flow is symmetrical and tends to be similar to the laminar flow. In the study of near-wall modulation of the drag-reducing flow with an injected ultrathin water layer, an asymmetrical mean velocity distribution was found. To further investigate this phenomenon and the underlying cause, an experiment was carried out with the water injected from a porous channel wall at a small velocity (~10−4 m/s) into the drag-reducing flow of surfactant solution. The instantaneous concentration and flow fields were measured by using planar laser-induced fluorescence (PLIF) and particle imaging velocimetry (PIV) techniques, respectively. Moreover, analyses on turbulent statistical characteristics and spatial distribution of viscoelastic structures were carried out on the basis of comparison among various flow cases. The results showed that the injected ultrathin water layer under present experimental conditions affected the anisotropy of the drag-reducing flow. The characteristics, such as turbulence intensity, showed the zonal feature in the wall-normal direction. The Reynolds shear stress was enhanced in the near-wall region, and the viscoelastic structure was modified severely due to the redistributed stress. These results may provide experimental supports for the near-wall modulation of turbulence and the exploration of the drag-reducing mechanism by viscoelastic additives.
1. Introduction
The drag reduction effect caused by viscoelastic polymer or surfactant aqueous solution as additives has been successfully applied to many practical engineering problems. It plays a significant role in energy conservation and emission reduction [1,2,3]. In view of the drag reduction phenomenon, although the drag reduction mechanism has not been fully identified at present, the general flow characteristics of viscoelastic drag-reducing flow have been fully recognized in the academic community [4]. The key role of the viscoelasticity of additives has been agreed upon as a consensus [5]. It is generally shown that the distribution of the mean streamwise velocity in the drag-reducing channel flow is changed when compared with the conventional wall turbulence. The overall trend is similar to the laminar flow, and the velocity gradient is more consistent from the wall to the core region in the channel center. However, the mean velocity distribution still retains the symmetry about the channel center in the longitudinal section.
Some researchers have focused on the role and action mechanism of the viscoelastic stress of additives to explore the drag-reducing mechanism by additives. It has been found that the change of viscoelastic stress in the flow can lead to the modification of overall flow structure different from that of conventional turbulence. The modification and instability can be reflected in the flow with viscoelastic fluids passing some obstacles. Tsurumi et al. [6] reported the instability of the viscoelastic drag-reducing flow when it flows through an orifice. Peng [7] found that the viscoelastic stress weakened the asymmetry of the velocity field after the bluff body when the viscoelastic fluid flowed around it. The pressure distribution in the flow field was also changed due to the viscoelastic stress. Zhang et al. [8,9] studied the phenomenon of enhanced heat and mass transfer in the viscoelastic flow induced by the unique viscoelastic stress and elastic turbulence and showed that viscoelastic stress could bring many changes to the traditional flow.
For the near-wall modulation of wall turbulence, Iwamoto et al. [10] found that the suppression of the fluctuation in the near-wall region could cause a larger range of suppression in the turbulent flow, to achieve turbulence control. Fukagata et al. [11] quantified the source of wall friction as the contribution of viscosity, turbulence, and viscoelasticity, and obtained the conclusion that Reynolds shear stress near the wall dominated the friction coefficient based on the stress identity as FIK equation. These studies show that the modulation of near-wall turbulence can have an important effect. Inspired by these studies, the Kawaguchi research group of Tokyo University of Science proposed a near-wall modulation method of injecting a polymer or water layer from the porous channel wall at a low-speed [12]. By adopting this method, Fu et al. [13] analyzed the influence of viscoelastic stress on the drag-reducing flow and found that the change of near-wall concentration of viscoelastic additive resulted in the change of flow structure.
Recently, Okamura et al. [14,15] also studied the effects of injected thin-layer polymer and water on wall turbulence. It was found that there was a big difference between the effects of the injected water layer and polymer layer on drag-reducing flow in the channel. Under the condition of low-speed injection, the water layer had no direct impact on the flow structure. Sugioka et al. [16] studied the effects of injecting a thick water layer through a porous wall and found that the injection with a large flow rate had a strong disturbance on the wall turbulence while the anisotropy did not change. Yu et al. [17] numerically simulated the impact of the near-wall water on the turbulent flow with zonal fluids in the channel. They reported that in the thick water layer, due to the lack of viscoelastic stress, the flow characteristics of Newtonian fluid were completely presented near the channel wall. However, in these studies, there is no description and explanation of the aforementioned asymmetrical flow structure that emerged in the viscoelastic drag-reducing flow.
The symmetrical and asymmetrical structures in the turbulent channel flow are indicated in terms of the mean velocity distribution in the longitudinal section in Figure 1. We attempt to introduce and explain the asymmetrical mean velocity that appeared in the N2NN case, as shown in Figure 1d. This asymmetry is relative to the symmetrical mean velocity, as shown in Figure 1c. It is noted that N is defined as a Newtonian fluid, such as water. NN is non-Newtonian fluid, such as the viscoelastic solution. N2N stands for the case of injecting water to water flow. N2NN represents the case of injecting water into the drag-reducing flow of viscoelastic additives [18].
In this paper, the experimental research method is employed to study the break of velocity symmetry and other characteristics accompanied by the asymmetrical velocity distribution in the viscoelastic drag-reducing flow of a surfactant solution. The mean velocity, velocity gradient, velocity fluctuation, fluorescence image, and Reynolds shear stress distribution in the conventional turbulent and viscoelastic drag-reducing flow were investigated under the influence of the injected ultrathin water layer from the porous channel. The study aimed to clarify the related phenomena and reason for asymmetrical velocity distribution in the viscoelastic drag-reducing flow caused by the injected ultrathin water layer near the wall.
2. Experiments
2.1. Experimental Equipment
The experimental apparatus used in the study is shown in Figure 2. It was a set of circulation loops and contains a solution tank, a centrifugal pump, two buffer boxes, a test section, and an injection subsystem. The test section was a rectangular channel of 6.00 m × 0.50 m × 0.040 m (length × width × height). The half-height h was 0.020 m. A laminated sintered plate composed of stainless steel wire mesh was arranged on one side of the channel, shown as the grey part in Figure 2. This plate works as a unilateral channel wall; its size was 1.65 m × 0.50 m × 0.0017 m (length × width × thickness). The plate was porous, and the mean diameter of the hole is 150 μm. It was connected with a sealed chamber for injecting water into the channel. The injection subsystem was composed of a water tank, a peristaltic pump, and a flow meter to monitor the injection rate.
Two pressure taps were set on the sidewall of the channel, which were 2.30 m and 3.95 m away from the channel inlet, respectively. The locations corresponded to the front and rear ends of the porous wall. The pressure difference was metered by a high-precision pressure gauge, within an error of ±1 Pa. The wall shear stress and wall frictional velocity were calculated based on the obtained pressure difference. In this study, the flow direction along the channel was defined as x-direction, which was also called the streamwise direction. The y-direction was the direction perpendicular to the channel wall, which was also defined as the wall-normal direction. The flow direction along the channel side was z-direction, which is also known as the spanwise direction.
2.2. PIV/PLIF Arrangements
The velocity and concentration fields in the streamwise-wall-normal (x-y) plane in the longitudinal section of the channel were measured by the particle image velocimetry (PIV) and planar laser-induced fluorescence (PLIF) techniques, respectively. The x-y plane is 3.65 m downstream of the channel inlet. The set of the PIV/PLIF measuring system is shown in Figure 3. In the PIV and PLIF tests, we employ a double-pulse laser (New Wave Research Co., Ltd., Fremont, CA, USA Minilase-II/30 Hz), which has an output of 30 mJ/pulse and a wavelength of 532 nm light. A computer with the image processing software of Dynamic Studio ver. 2.30 is employed along with two CCD cameras. The camera resolution is 2048 × 2048 pixels. A synchronizer is also adopted to connect the camera, computer, and laser. These equipment are adopted to evaluate the flow velocity and fluorescence intensity.
2.3. Experimental Conditions
The viscoelastic additive is one kind of surfactant solution. The solution is mixed cetyltrimenthyl ammonium chloride (CTAC) and tap water as a solvent. It is a cationic surfactant solution, and sodium salicylate (NaSal) is added to provide counter ions. The weight concentrations of this solution and the counter ions were uniform and 40 ppm. The value of the relaxation time of this CTAC solution is in the range of 0–0.15 s. The viscosity of this dilute aqueous CTAC solution was same as the kinematic viscosity of the solvent as 0.90 × 10⁻⁶ m2/s. This viscoelastic CTAC solution flowed in the loop, which formed a drag-reducing flow in the channel. The average bulk velocity (Ub) of the channel flow was set as 0.44 m/s. The experimental Reynolds number is 20,000, and the adopted characteristic length was the full height of the channel. The temperature of the CTAC solution was maintained at 25 °C, and the accuracy is ±0.50 °C. This condition was defined as the viscoelastic drag-reducing flow without water injection. For the convenience of comparison, it is also called the condition of the injection rate as 0 L/min.
For the condition of the viscoelastic drag-reducing flow with water injection, the water at 25 °C was pumped from the water tank into the chamber connected with the porous channel wall by the peristaltic pump. It was injected into the drag-reducing channel flow at three different flow rates of 3, 6, and 9 L/min, with the corresponding injecting velocities of 8.90 × 10⁻⁵, 1.80 × 10⁻⁴ and 2.70 × 10⁻⁴ m/s, respectively. The injection rate of 3 L/min was 0.56% of the average flow rate. The injected water formed a water layer near the porous wall. We use an equivalent thickness to quantify the amount of the injected water in terms of the dosing rate and the dosing time, which was 120 s for each measuring case determined by the stable period after injection. The near-wall velocity of the supposed water layer was assumed to be 0.4 Ub, according to the general mean velocity profile. Thus, the equivalent thickness was estimated to be 0.03 h when the dosing rate is 3 L/min. The equivalent thickness was 0.09 h when the dosing rate is 9 L/min. This thickness of the water film at the rate of 3 L/min was 16.5 in y+, which is the non-dimensional wall-normal distance from the porous wall and equals yuτ/ν (ν is the kinematic viscosity of solvent). Actually, because the water layer remains flowing downstream and spreads on a long channel wall rather than only the porous plate, the thickness of the water layer will be smaller than the estimated value. The equivalent thickness of the water layer is finite and thought as ultrathin.
The polyethylene particles were used as PIV tracer particles. The relative density of the particle was 0.92 and the nominal diameter is 20 μm. The fluorescent of Rhodamine-WT was used to dye the injected water evenly at 4 ppm. In the PIV and PLIF tests, the thickness of the emitted laser sheet was around 0.60 mm. For each test condition, 625,000 vectors at each y position in 500 velocity fields were taken for statistical velocity analysis, and 500 PLIF images are also taken for fluorescence intensity and concentration statistical analysis. The PIV images are analyzed using the cross-correlation technique. The velocity fluctuations (u’ and v’) are obtained based on the statistical analysis of acquired instantaneous velocity fields. The Reynolds shear stress can be calculated according to these fluctuations.
3. Results and Discussion
3.1. Asymmetrical Velocity Distribution
Figure 4 shows the distribution of dimensionless streamwise mean velocity (U/Ub) in the longitudinal section of the channel under the same Reynolds number for the viscoelastic drag-reducing flow with and without water layer along with the water flow. For the shown drag-reducing channel flow with the water layer, the relative large injection flow rate of 9 L/min was chosen to reflect the velocity difference more clearly. In the figure, y/h = 0 represents the position of the internal porous wall in the wall-normal direction.
In Figure 4, it can be seen that the mean velocity profile for the water channel flow is typical as the conventional wall turbulence. The velocity has a large gradient in the near-wall region while it tends to be close in the core region of the channel. By contrast, the mean velocity profile shown in red symbols for the drag-reducing flow without the water layer becomes the typical characteristic of the laminar flow. The velocity gradients from the wall to the channel center are approximate. These results are consistent with those reported in all the studies of turbulent drag-reducing flow with viscoelastic additives [4,5]. Furthermore, for the drag-reducing flow case, the mean velocity profile, as shown in the black symbols with an injected water layer, is changed in the near-wall region when compared with the drag-reducing flow without the water layer. The mean velocity distribution becomes asymmetric relative to the channel center under the effect of the injected ultrathin water layer.
The distribution of the mean velocity in the logarithmic layer normalized by the frictional velocity (U+ = U/uτ) for the water flow case and the drag-reducing flow case are shown in Figure 5 to examine the modification of velocity in the near-wall region carefully. The phenomenon of the profiles slightly below the theoretical log-law profile that emerged in the figure, has been validated to be caused by the effect of the permeable and rough wall [19].
From Figure 5, it can be found that the mean velocity profile in the logarithmic layer for the drag-reducing flow with the water layer is declined relative to that for the drag-reducing flow without the water layer. This may cause a varying velocity gradient in the near-wall region, which has also been shown in Figure 4 for the mean velocity normalized by Ub. In addition, it is observed that the slope of the profile in the logarithmic region is increased relative to the water flow case. It is still lower than the slope of Virk’s asymptote, which has also been universally recognized and reported by White et al. [20]. However, the water flow case with and without the water layer has the uniform mean velocity profile, which indicates the water layer itself does not affect the velocity profile. The existing results also showed that the low-speed water injection did not affect the mean velocity profile in [13]. Thus, by comparison, it is speculated that the changed viscoelasticity in the near-wall region of the NN flow case caused by the injected water results in the modification of velocity distribution. The symmetrical mean velocity turns into asymmetrical distribution.
To further illustrate the symmetry of mean velocity and its break caused by the viscoelastic additives, the mean velocity for another drag-reducing flow case formed by injecting viscoelastic polymer solution in a preliminary study [13] is presented in Figure 6 along with the water flow cases under the same conditions. The polymer solution at 50 ppm was injected into the water flow from the porous channel wall. It is also seen that the mean velocity for the drag-reducing flow with the injection of polymer solution shown as the red symbols is modified in the near-wall region. The symmetry about the channel center shown for the N and N2N flow cases is broken by the injected viscoelastic polymer solution.
The fields of velocity gradient in the half longitudinal section of the channel near the porous wall for the non-Newtonian flow without and with the injection of the ultrathin water layer are shown in Figure 7 to observe the whole velocity field further.
It was found that, for the viscoelastic drag-reducing flow, as shown in Figure 7a, the uniform speed-gradient area in the near-wall region extends to the center of the channel (y/h = 1), which was similar to the velocity distribution characteristic of the laminar flow. After the water layer is injected from the porous wall, as shown in Figure 7b, there is an obvious high speed-gradient value near the wall. But the distribution of the velocity gradient is relatively uniform in the range of y/h < 0.8 outside this high-gradient region. Meanwhile, the high-gradient area is in the inclined upward streaky structure, which is similar to that shown in Figure 7a. These results show that under the influence of the injected water layer, the near-wall shear layer indicating by the high-velocity gradient is changed, and the symmetry is broken.
In the following section, more modifications in the near-wall region accompanied by the changes of the velocity distribution will be examined on the basis of the statistical analyses of velocity fluctuations.
3.2. Turbulence Intensity and Anisotropy
Figure 8 shows the distribution of dimensionless turbulence intensity (vrms/uτ) in the wall-normal direction from the porous wall to the channel center for the water flow, drag-reducing flow without and with the injection of water layer at various injection rates. The N2N flow case is with the injection rate of 9 L/min. Figure 9 shows the ratio of wall-normal turbulence intensity (urms/vrms) for the four flow cases to characterize the anisotropy of the flow in the near-wall region.
It can be seen from Figure 8 that for the drag-reducing flow with the water layer, the wall-normal turbulence intensity has an obvious peak value in the range of y/h < 0.2. Meanwhile, the near-wall turbulence intensity increases as the injection rate increases in general. With the increase of the wall-normal distance from y/h = 0.3, the turbulence intensity tends to be consistent. This also shows that the drag-reducing flow with the ultrathin water layer presents obvious zonal characteristics and structures, as described in reference [18]. The turbulence intensity changes obviously in the near-wall region while it appears the same as the NN flow without water layer outside this region. In addition, under the condition of an injection rate of 3 L/min, the peak value of the turbulence intensity appears at y/h = 0.040, which moves to the center of the channel with the increase of the injection rate, i.e., the thickened water layer.
The ratio of intensity shown in Figure 9 can reflect the degree of anisotropy in the flow case. It can be seen from the figure that the anisotropy of drag-reducing flow is strengthened when compared with the pure water channel flow and N2N flow case. In particular, for the N2NN flow case, the anisotropy increases obviously in the near-wall region from y/h = 0 to y/h = 0.1. This indicates that the near-wall turbulence in viscoelastic drag-reducing flow tends to be dominated by the fluctuation in the streamwise direction. This result is consistent with the possible mechanism of drag reduction effect caused by anisotropic characteristics advocated in reference [21]. Thus, this anisotropy caused by the injected water layer may bring certain enlightenment to the near-wall modulation of turbulence.
However, in our previous study for the N2N flow case with injection from the porous channel wall, it is also found that the injected water layer affects the turbulence intensity, but it does not affect the distribution of turbulence fluctuation, i.e., the anisotropy, although the injection rate is large. Figure 10 shows the ratios of streamwise to wall-normal turbulence intensity for the water flow without and with the injection of water layer at 18 L/min and 27 L/min [16]. It shows that the ratios in the near-wall region from y/h = 0 to y/h = 0.2 are relatively large and limited in 4 due to the influence of the wall boundary when compared with the ratio as 1 from y/h = 0.2 in the core region. This indicates once again that the Newtonian water layer in the water flow may not affect the turbulence anisotropy.
3.3. Discussion of the Possible Cause
The typical visual injected water layer obtained by the PLIF technique is shown in Figure 11a to illustrate the near-wall modification in the channel. This typical water layer is for the drag-reducing flow case with water injection at 9 L/min. The fluorescent region denotes the existing injected dyed water. Although the water diffuses to the location around y/h = 0.2, as shown in Figure 11a, the main water layer is found to locate in the region of y/h = 0.1. This can also be validated from the quantitative concentration distribution, as shown in Figure 11b. In the figure, CCTAC/C0 is a non-dimensional concentration deduced from 1 − Cwater/C0. The Cwater responds to the mean fluorescence intensity at the wall-normal location, and C0 is the largest fluorescence intensity near the wall [22].
It can be seen from Figure 11a that there is a wavy interface between the injected water layer and the main CTAC solution along the flow direction. The injected water forms a striped structure, in which there are viscoelastic solutions with unexcited fluorescence. From Figure 11b, it can be found that with the increase of injection rate, the concentration of CTAC solution at the same wall-normal position is lower, and the water layer is wider. The maximum value of the average concentration gradient exists near the wall at y/h = 0.1, which indirectly reflects the presence of a boundary of the ultrathin water layer at this location.
Therefore, under the experimental conditions, the stable viscoelastic fluid region coexists with the injected ultrathin water layer. The injected water layer causes the redistribution of the viscoelastic solution near the wall, which changes the viscoelasticity and reduces the modified distribution of stress near the porous wall. These may be the main reason for the asymmetrical velocity distribution emerged in the N2NN flow case.
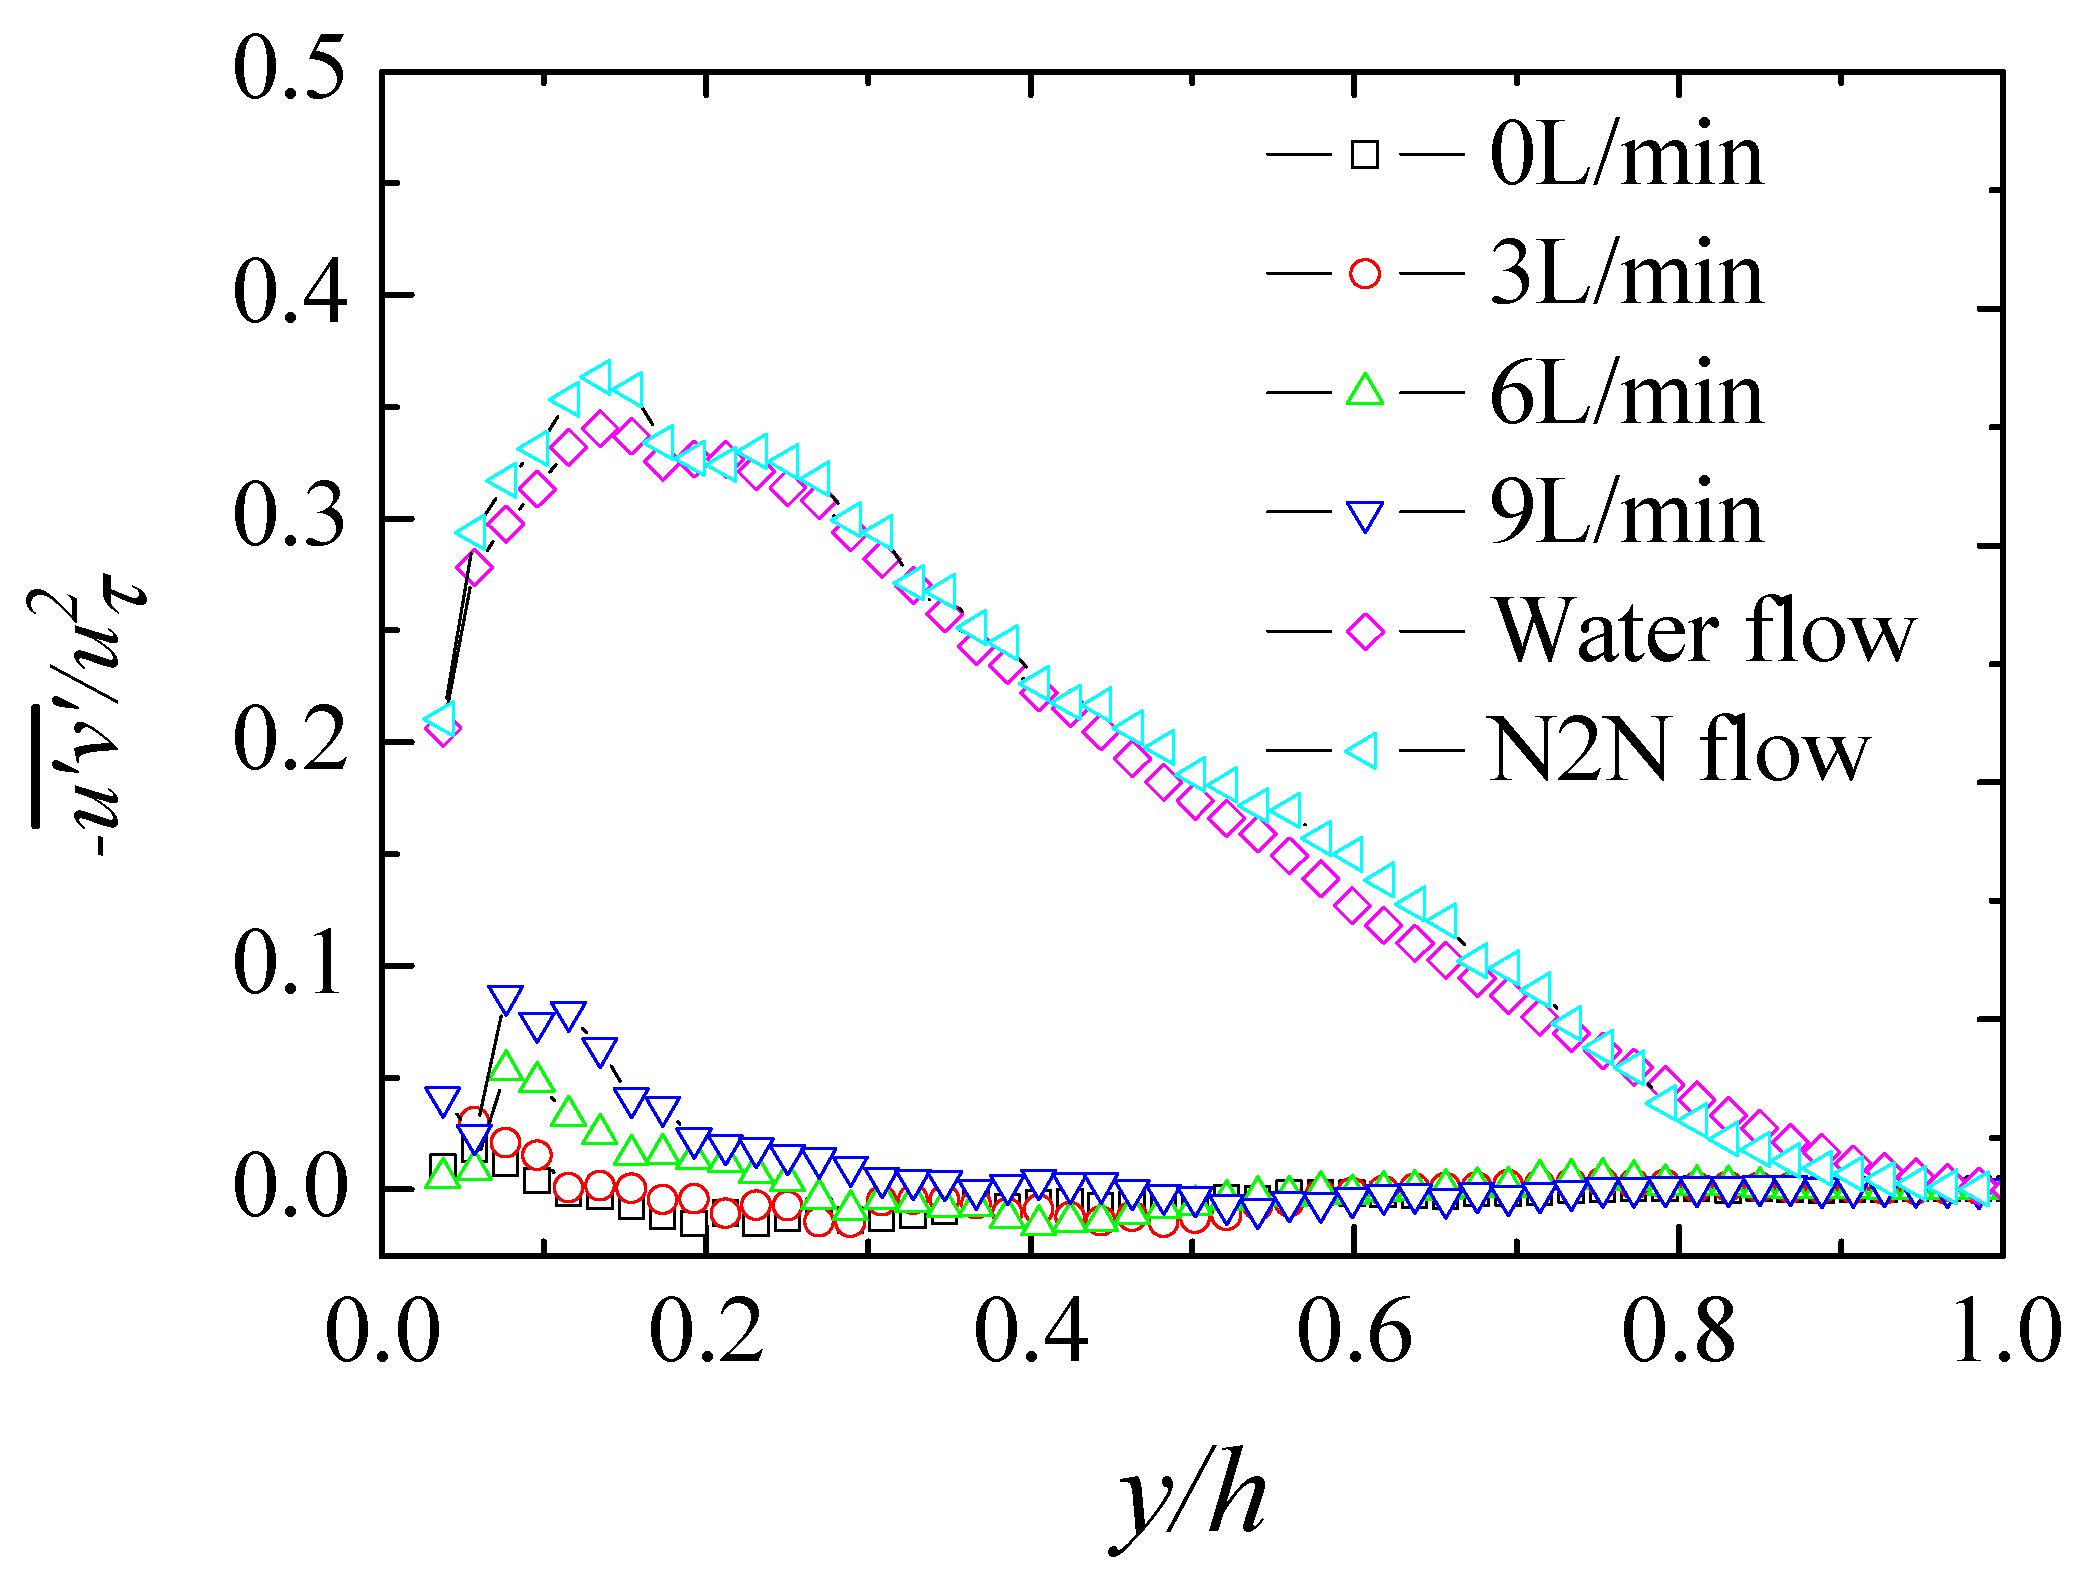
In our previous study, the modification of viscoelastic stress and its contribution to the enhanced drag reduction effect was reported [18]. Here, the near-wall Reynolds shear stress distribution in the measured N and NN flow cases are reexamined. Figure 12 shows the distribution of Reynolds shear stress in the wall-normal direction for the N and NN flow with the water layer injected at various rates. The Reynolds shear stress () shown in the figure is normalized by the square of the frictional velocity.
It can be seen from Figure 12 that in the NN flow without water layer, the Reynolds shear stress at different positions is greatly reduced relative to the water flow and N2N flow case and its value is close to zero, which conforms to the general characteristics of the drag-reducing flow with viscoelastic additives [23]. However, the Reynolds shear stress for the N2NN flow case increases slightly within the range of y/h < 0.40 and increases with the increase of the injection rate. It can be verified that the injected water layer reduces the near-wall viscoelasticity of the NN flow from the other perspective. Consequently, the relaxation characteristic of a near-wall viscoelastic solution is changed, leading to the modification of velocity distribution. Accordingly, the redistributed stress plays a key role in the break of the symmetry for the mean velocity distribution in the drag-reducing channel flow. A physical hypothesis that the redistributed stress causes the modification of the hairpin eddy structure, leading to the redistribution of velocity, may contribute to explain the relationship between the redistributed Reynolds stress and the mean velocity distribution.
It is worth noting that the adopted Re = 20,000 is adopted in the present study because the obtained drag reduction effect is stable and moderate. It indicates the experimental condition in general. We conducted measurements at other Reynolds number (Re = 30,000, 40,000) for the N2NN flow case. The similar asymmetric velocity in the channel and the corresponding drag reduction enhancement were also obtained [18]. The stress distribution for all the NN flow cases will be modified due to the injected solution.
4. Conclusions
In this paper, the ultrathin water layer is applied to the viscoelastic drag-reducing flow of CTAC surfactant solutions to study the emerged asymmetrical velocity distribution in the longitudinal section of the channel experimentally. The related phenomena and reasons are investigated. The main conclusions are as follows:
- Under the experimental conditions, the injected ultrathin water layer breaks the symmetry of the mean velocity distribution about the channel centerline. The normalized velocity in the logarithmic layer is descended, and the near-wall structure of the shear layer indicted by the velocity gradient is modified in the viscoelastic drag-reducing flow with the water layer when compared with the case without water layer.
- The injected water layer leads to the enhancement of turbulence fluctuation intensity. The turbulence anisotropy in the drag-reducing flow with the injected water layer is also promoted while it does not change in the water flow with the injection of the water layer. The change of the viscoelastic solution near the wall plays a key role.
- Under the influence of the ultrathin water layer, the viscoelastic drag-reducing flow presents the zonal characteristics of layers of water and viscoelastic solution in the wall-normal direction with a wavy boundary. The redistributed viscoelastic solution in the near-wall region causes the modification of stress distribution. The near-wall Reynolds shear stress is increased in the drag-reducing flow. This redistributed stress results in the break of the symmetric velocity and the related structure.
This work focuses on the asymmetric velocity distribution in the turbulent drag-reducing channel flow of a surfactant solution with an injected ultrathin water layer. An experimental observation was carried out from the views of turbulence statistics and visual observation. The possible cause of the asymmetry is speculated based on the validation of the redistributed stress in the near-wall region combined with the study on the water flow case. Future work will take account of the complicated role of distributed viscoelastic stress on flow structure. The intrinsic relaxation property of the viscoelastic solution should be considered. This asymmetric phenomenon should be paid attention to its application in the practical modulation and heat and mass transfer enhancement of turbulence. For example, in the drag-reducing flow of a surfactant solution, the accompanied heat transfer is suppressed due to the weakened turbulence. It can be enhanced locally when the solution is injected from the local wall and changes the near-wall stress distribution. In the field of microfluidics, the slight velocity and stress modulation caused by water injection can work as an interesting control method of the flow process.
Author Contributions
Conceptualization and methodology, Z.F.; formal analysis, Z.F. and X.L.; writing-original draft preparation, X.L.; writing-review and editing, Z.F. and K.Z. All authors have read and agreed to the published version of the manuscript.
Funding
The study was funded by the National Natural Science Foundation of China (No. 51606114) and Science and Technology Commission of Shanghai Municipality (No. 19020500900).
Acknowledgments
The authors appreciate Yasuo Kawaguchi for his guidance on this work partly finished at Tokyo University of Science.
Conflicts of Interest
The authors declare no conflict of interest.
References
- Toms, B. Some observations on the flow of linear polymer solutions through straight tubes at large Reynolds numbers. In Proceedings of the 1st International Congress on Rheology, Amsterdam, The Netherlands, 17 January 1948; pp. 135–141. [Google Scholar]
- Luo, Y.; Wang, L.; Green, L.; Song, K.; Wang, L.; Smith, R. Advances of drag-reducing surface technologies in turbulence based on boundary layer control. J. Hydrodyn. 2015, 27, 473–487. [Google Scholar] [CrossRef]
- Burger, E.; Chorn, L.; Perkins, T. Studies of drag reduction conducted over a broad range of pipeline conditions when flowing Prudhoe bay crude oil. J. Rheology 1980, 24, 603–626. [Google Scholar] [CrossRef]
- Fu, Z.; Kawaguchi, Y. A short review on drag-reduced turbulent flow of inhomogeneous polymer solutions. Adv. Mech. Eng. 2015, 5, 432949. [Google Scholar] [CrossRef] [Green Version]
- White, C.; Mungal, M. Mechanics and prediction of turbulent drag reduction with polymer additives. Annu. Rev. Fluid Mech. 2008, 40, 235–256. [Google Scholar] [CrossRef]
- Tsurumi, D.; Tsukahara, T.; Kawaguchi, Y. Experimental analysis of turbulent structure of viscoelastic fluid flow in downstream of two-dimensional orifice. In Proceedings of the Seventh International Symposium on Turbulence Heat and Mass Transfer, Palermo, Italy, 24–27 September 2012. [Google Scholar]
- Peng, S. Numerical Study of Flows over Bluff Bodies in Viscoelastic Fluid; Huazhong University of Science and Technology: Wuhan, China, 2018. [Google Scholar]
- Zhang, H.; Li, F.; Cao, Y.; Kunugi, T.; Yu, B. Direct numerical simulation of elastic turbulence and its mixing-enhancement effect in a straight channel flow. Chin. Phys. B 2013, 22, 24703. [Google Scholar] [CrossRef]
- Li, D.; Zhang, H.; Cheng, J.; Li, X.; Li, F.; Qian, S. Numerical simulation of heat transfer enhancement by elastic turbulence in a curvy channel. Microfluid. Nanofluidics 2017, 21, 21–25. [Google Scholar] [CrossRef]
- Iwamoto, K.; Fukagata, K.; Kasagi, N.; Suzuki, Y. Friction drag reduction achievable by near-wall turbulence manipulation at high Reynolds numbers. Phys. Fluids 2005, 17, 73–76. [Google Scholar] [CrossRef] [Green Version]
- Fukagata, K.; Iwamoto, K.; Kasagi, N. Contribution of Reynolds stress distribution to the skin friction in wall-bounded flows. Phys. Fluids 2002, 14, 73–76. [Google Scholar] [CrossRef] [Green Version]
- Motozawa, M.; Ishitsuka, S.; Iwamoto, K.; Ando, H.; Senda, T.; Kawaguchi, Y. Experimental investigation on turbulent structure of drag reducing channel flow with blowing polymer solution from the wall. Flow Turbul. Combust. 2012, 88, 121–141. [Google Scholar] [CrossRef]
- Fu, Z.; Otsuki, T.; Motozawa, M.; Kurosawa, T.; Yu, B.; Kawaguchi, Y. Experimental investigation of polymer diffusion in the drag-reduced turbulent channel flow of inhomogeneous solution. Int. J. Heat Mass Transf. 2014, 77, 860–873. [Google Scholar] [CrossRef]
- Okamura, Y.; Sugioka, H.; Kawaguchi, Y. Enhancement of Turbulent Shear Stress and Mass Transfer in Wall Turbulence accompanied with wall blowing. In Proceedings of the ASME 2016 Fluids Engineering Division Summer Meeting collocated with the ASME 2016 Heat Transfer Summer Conference and the ASME 2016 14th International Conference on Nanochannels, Microchannels, and Minichannels, Washington DC, USA, 10–14 July 2016. [Google Scholar]
- Okamura, Y.; Kurose, T.; Kawaguchi, Y. Modification of near-wall turbulent structure in channel flow by dosing a small amount of polymer solution. In Proceedings of the ASME Fluids Engineering Division Summer Meeting, Hawaii, HI, USA, 30 July–3 August 2017. [Google Scholar]
- Sugioka, H.; Fu, Z.; Tsukahara, T.; Kawaguchi, Y. PIV-PLIF Experiment on modification of turbulent scalar diffusion near the wall by uniform blowing. In Proceedings of the ASME Joint Fluids Engineering Conference, Seoul, Korea, 26–31 July 2015. [Google Scholar]
- Yu, B.; Li, F.; Kawaguchi, Y. DNS of drag-reducing turbulent channel flow with coexisting Newtonian and non-Newtonian fluid. Fluids Eng. 2005, 127, 929–935. [Google Scholar] [CrossRef]
- Fu, Z.; Iwaki, Y.; Motozawa, M.; Tsukahara, T.; Kawaguchi, Y. Characteristic turbulent structure of a modified drag-reduced surfactant solution flow via dosing water from channel wall. Int. J. Heat Fluid Flow 2015, 53, 135–145. [Google Scholar] [CrossRef]
- Suga, K.; Matsumura, Y.; Ashitaka, Y.; Tominaga, S.; Kaneda, M. Effects of wall permeability on turbulence. Int. J. Heat Fluid Flow 2010, 31, 974–984. [Google Scholar] [CrossRef]
- White, C.; Dubief, Y.; Klewicki, J. Re-examing the logarithmic dependence of the mean velocity distribution in polymer drag reduced wall-bounded flow. Phys. Fluids 2012, 24, 021701. [Google Scholar] [CrossRef]
- Jovanovic, J.; Frohnapfel, B.; Durst, F.; Koskinen, J.; Koskinen, K. On the mechanism responsible for turbulent drag reduction by dilute addition of high polymers: Theory, experiments, simulations, and predictions. Fluids Eng. 2006, 128, 118–130. [Google Scholar] [CrossRef]
- Iwaki, Y.; Motozawa, M.; Tsukahara, T.; Kawaguchi, Y. Enhanced drag reduction in surfactant flow by dosing water from the wall: Investigation of turbulent statistics by PIV and PLIF. In Proceedings of the 8th World Conference on Experimental Heat Transfer, Fluid Mechanics, and Thermodynamics, Lisbon, Portugal, 16–20 June 2013. [Google Scholar]
- Xi, L. Turbulent drag reduction by polymer additives: Fundamentals and recent advances. Phys. Fluids 2019, 31, 121302. [Google Scholar]
Figure 1.
Schematics of turbulent flow cases of (a) N, (b) NN, (c) N2N, and (d) N2NN in the channel.
Figure 1.
Schematics of turbulent flow cases of (a) N, (b) NN, (c) N2N, and (d) N2NN in the channel.


Figure 2.
Schematics of the experimental setup.

Figure 3.
Schematics of PIV and PLIF measuring system.
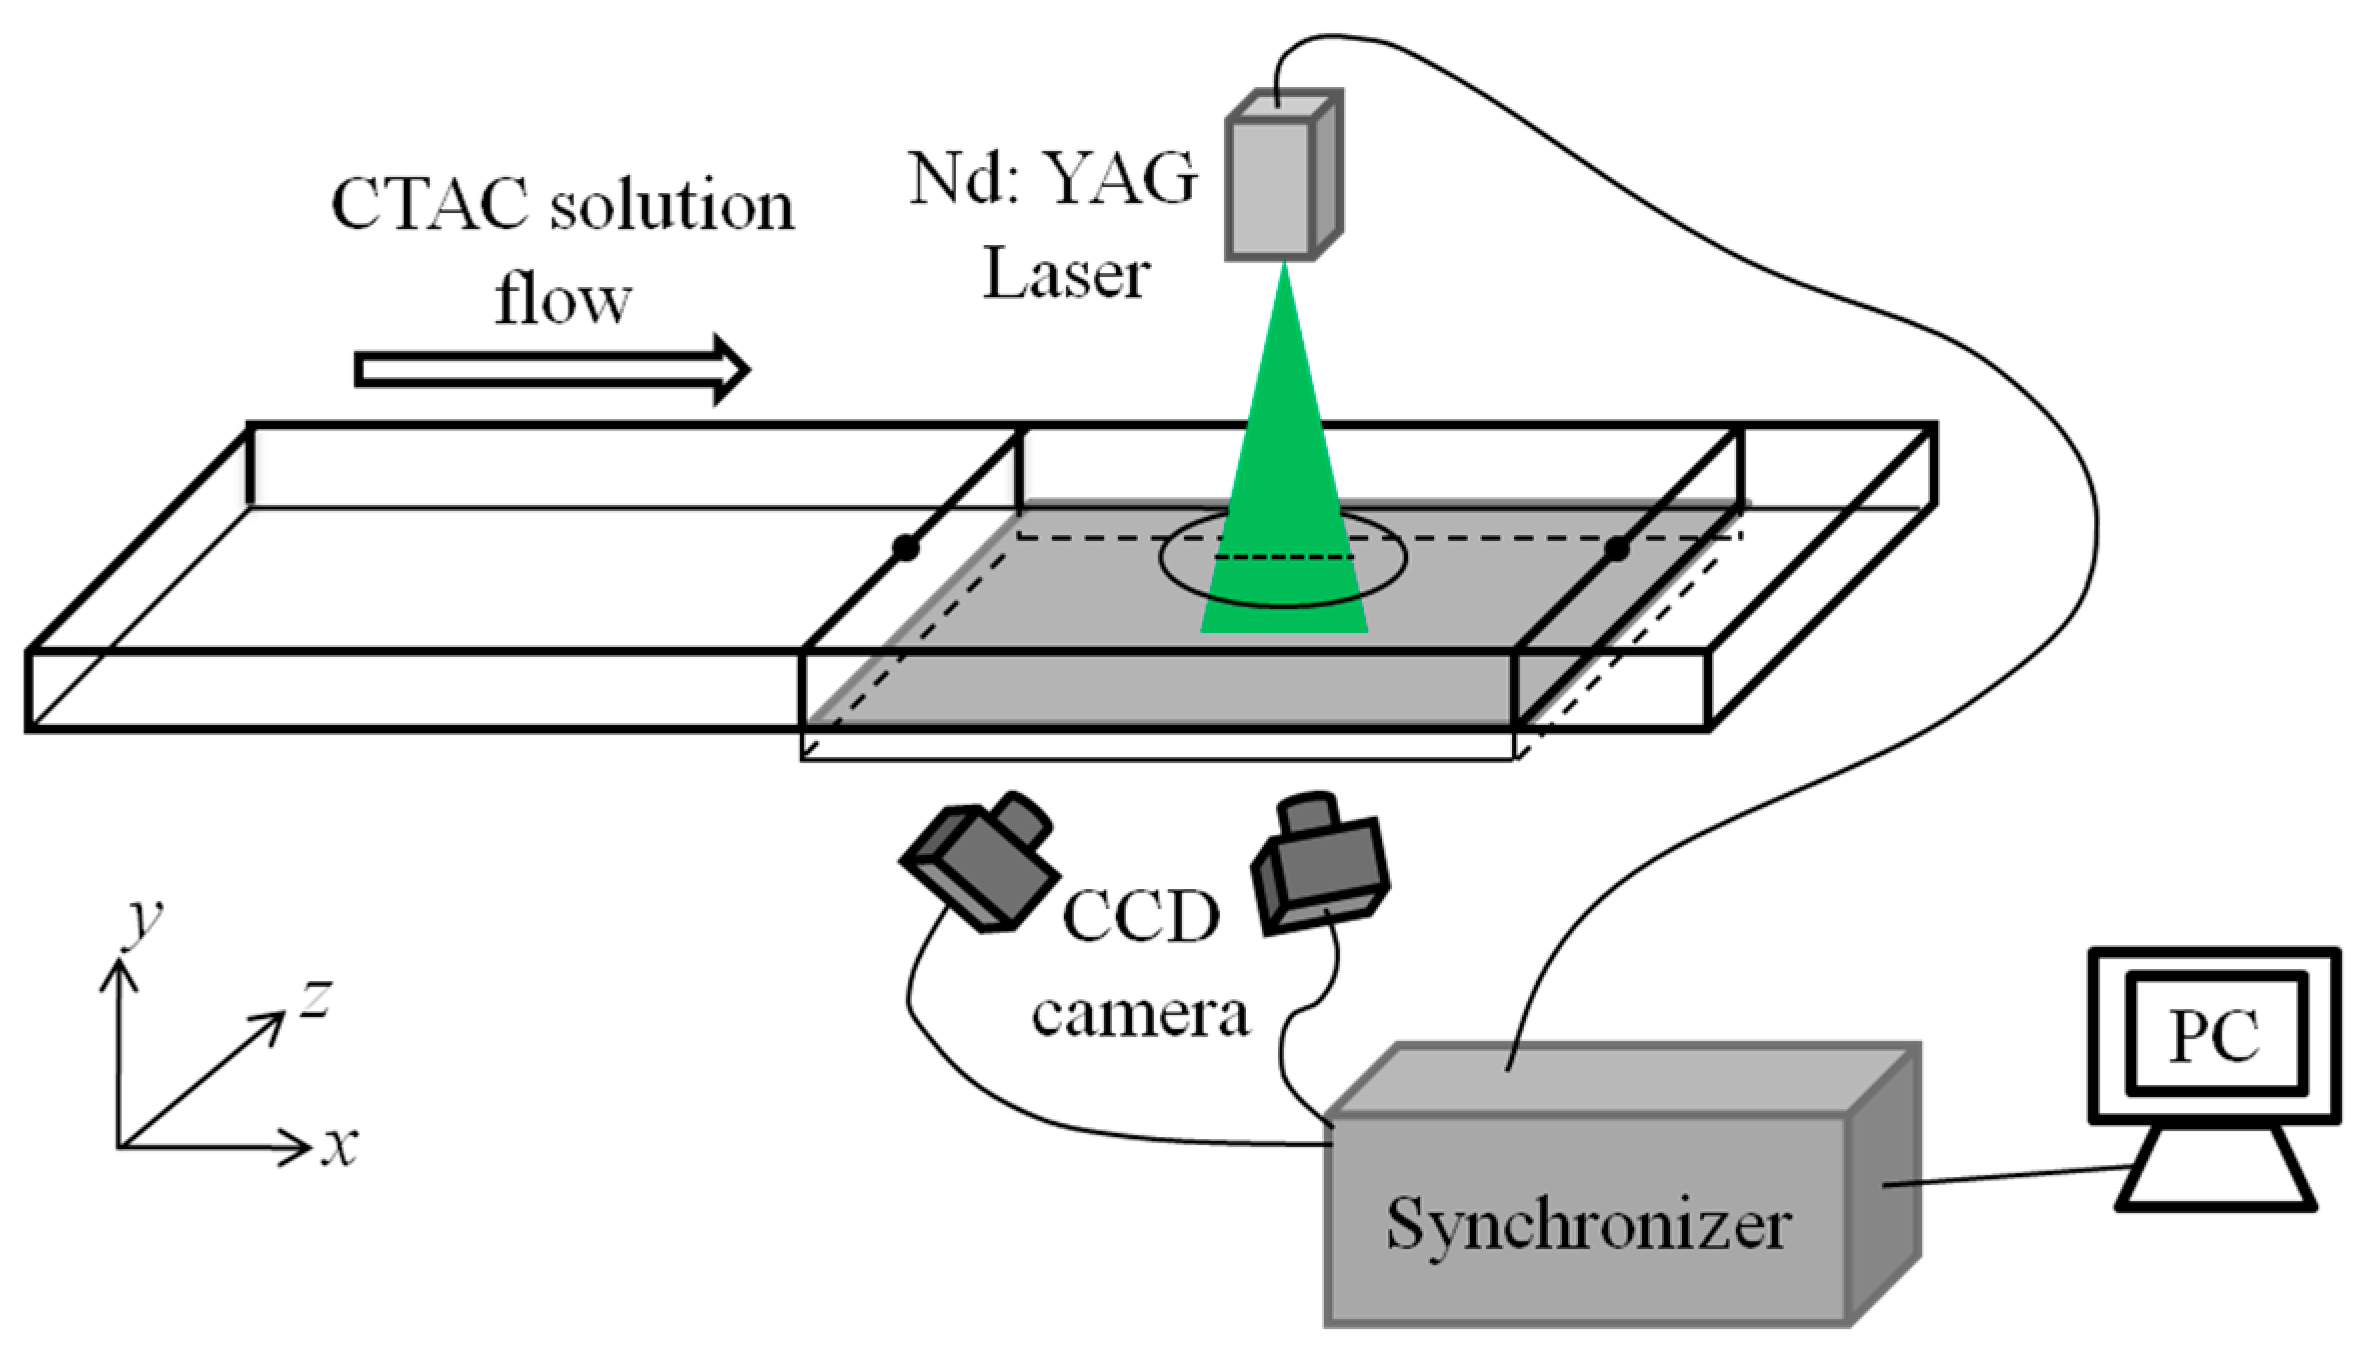
Figure 4.
Distributions of mean velocities in the longitudinal section of the channel for different flow cases.
Figure 4.
Distributions of mean velocities in the longitudinal section of the channel for different flow cases.
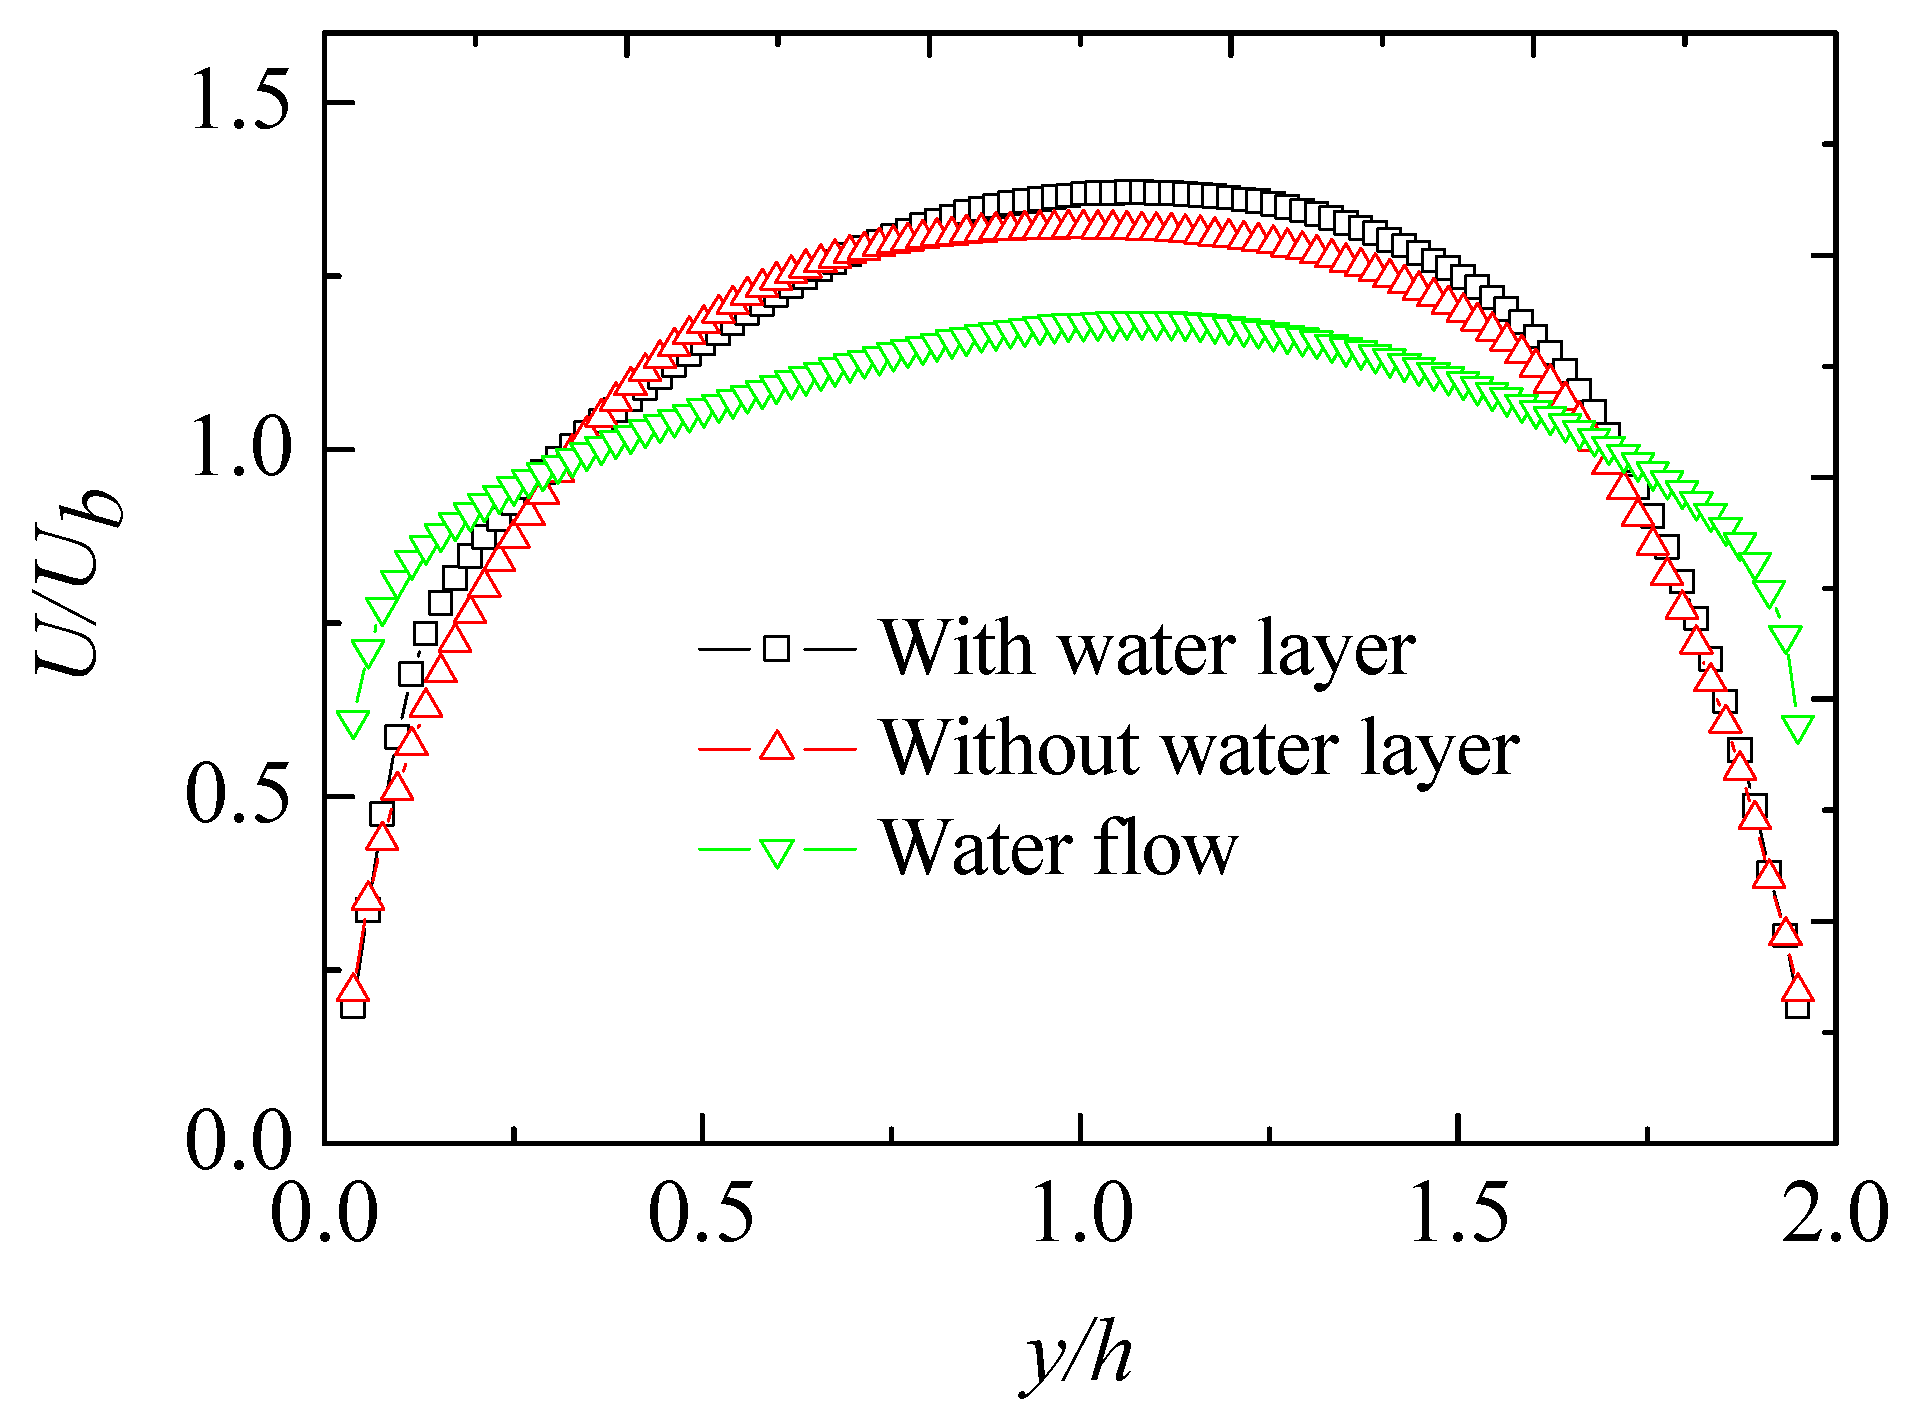
Figure 5.
Distributions of mean streamwise velocities in the logarithmic layer for different flow cases.
Figure 5.
Distributions of mean streamwise velocities in the logarithmic layer for different flow cases.

Figure 6.
The mean velocities of the water flow cases with injecting 50 ppm polymer solution, without and with the injection of water.
Figure 6.
The mean velocities of the water flow cases with injecting 50 ppm polymer solution, without and with the injection of water.

Figure 7.
Instantaneous fields of streamwise velocity gradients (in s−1) for the drag-reducing flow (a) without water layer and (b) with water layer.
Figure 7.
Instantaneous fields of streamwise velocity gradients (in s−1) for the drag-reducing flow (a) without water layer and (b) with water layer.

Figure 8.
Wall-normal turbulence intensities for different flow cases.

Figure 9.
Ratios of streamwise turbulence intensity to wall-normal intensity for different flow cases.
Figure 9.
Ratios of streamwise turbulence intensity to wall-normal intensity for different flow cases.

Figure 10.
Ratios of streamwise turbulence intensity to wall-normal intensity for water flow cases.

Figure 11.
PLIF measurements for the N2NN flow case about (a) typical instantaneous PLIF images and (b) concentration distribution.
Figure 11.
PLIF measurements for the N2NN flow case about (a) typical instantaneous PLIF images and (b) concentration distribution.


Figure 12.
Reynolds shear stress distributions in wall-normal direction for various flow cases.
© 2020 by the authors. Licensee MDPI, Basel, Switzerland. This article is an open access article distributed under the terms and conditions of the Creative Commons Attribution (CC BY) license (http://creativecommons.org/licenses/by/4.0/).
Share and Cite
MDPI and ACS Style
Fu, Z.; Liang, X.; Zhang, K. Asymmetrical Velocity Distribution in the Drag-Reducing Channel Flow of Surfactant Solution Caused by an Injected Ultrathin Water Layer. Symmetry 2020, 12, 846. https://doi.org/10.3390/sym12050846
AMA Style
Fu Z, Liang X, Zhang K. Asymmetrical Velocity Distribution in the Drag-Reducing Channel Flow of Surfactant Solution Caused by an Injected Ultrathin Water Layer. Symmetry. 2020; 12(5):846. https://doi.org/10.3390/sym12050846
Chicago/Turabian StyleFu, Zaiguo, Xiaotian Liang, and Kang Zhang. 2020. "Asymmetrical Velocity Distribution in the Drag-Reducing Channel Flow of Surfactant Solution Caused by an Injected Ultrathin Water Layer" Symmetry 12, no. 5: 846. https://doi.org/10.3390/sym12050846
Note that from the first issue of 2016, this journal uses article numbers instead of page numbers. See further details here.