Risk Assessment of Seaplane Operation Safety Using Bayesian Network

1
School of Management, Wuhan University of Technology, Wuhan 430070, Hubei, China
2
School of Transportation, Wuhan University of Technology, Wuhan 430070, Hubei, China
*
Authors to whom correspondence should be addressed.
Symmetry 2020, 12(6), 888; https://doi.org/10.3390/sym12060888
Submission received: 4 May 2020
/
Revised: 26 May 2020
/
Accepted: 28 May 2020
/
Published: 30 May 2020
Abstract
:Seaplanes have become popular tourism and transportation tools with the ability of take-off and land on water. Recent seaplane accidents are highlighting the need for safety analysis of the seaplane operation process, which includes the sequential stages of water-taxiing, take-off, flight, and landing. This paper proposes a novel approach to modeling the risk of seaplane operation safety using a Bayesian network (BN). The rough risk factors that may cause seaplane accidents are identified by historical data, literature review, and interviews with experts. Based on the identification result, a risk evaluation indicator system is constructed and screened by the Delphi method. The structure of the proposed BN is derived from the indicator system. The parameter of the BN is obtained by expert experience and parameter learning from statistical data. The BN model is validated with an out-of-sample test demonstrating nearly 95% prediction accuracy of the accident severity level. The model is then applied to conduct diagnosis inference and sensitivity analysis to identify the key risk factors for seaplane operation accidents. The result shows that the four most critical risk factors are mental barrier, mechanical failure, visibility, and improper emergency disposal. It provides an early warning to take appropriate preventive and mitigative measures to enhance the overall safety of the seaplane operation process.
1. Introduction
The seaplane is a kind of fixed-wing aircraft able to take off from and land on water (Commission Regulation (EU) No 965/2012). It can be classified into the two types, water only and amphibious, according to take-off and landing patterns. Due to thisunique ability, seaplanes are quite suitable for short-distance travel in a broad range of scenarios [1] and have become popular tourism and transportation tools. In recent years, however, the frequent seaplane accidents causing significant social and economic losses have brought attention to the safety issues of seaplanes. On 20 July 2016, a nine-seat seaplane crashed into a bridge in Shanghai’s Jinshan District, killing five people onboard and injuring the other five. An investigation showed that management failure and lack of qualifications were the main causes of the accident. On 14 May 2019, a deadly mid-air collision of two seaplanes in Alaska killed six people and injured ten. The investigation by the National Transportation Safety Board (NTSB) reported that the seaplane safety could be improved by applying advanced crash prevention technology. This paper focuses on the risk assessment of the seaplane operation process, which will be helpful for authorities and operators to find critical risk factors and develop effective measures to reduce seaplane accidents.
The difficulty of risk assessment for seaplane operation safety exists in the enormous risk factors [2] and their complex and uncertain interrelations [3,4]. Risk factors are closely associated with the whole operation process, which includes the sequential stages of water-taxiing, take-off, flight (initial climb, en route, and approach), and landing. The seaplane operation process starts and ends in water aerodromes [5,6] and is a visual flight, which distinguishes seaplanes from land aircraft. Seaplanes have no brakes; once a seaplane casts off or is untied, wind will keep the seaplane in constant motion, making the seaplane different from a ship. Seaplane pilots should do their best to maintain balance and ensure operation safety. Furthermore, wind has a significant impact on the direction of the seaplane, and weather conditions may limit the visibility of the pilot. Both the maritime sector and the civil aviation authorities are responsible for supervising seaplanes, which brings great challenges for seaplane administration [2].
Researchers have dedicated their efforts to understanding and analyzing the safety risks of seaplane operation. References [7,8] identified the risk factors of seaplane-ship collision by using human engineering theory. By applying approaches including decision-making trial, evaluation laboratory, and interpretative structural modeling, they established a four-level hierarchical structure model of the risk factors. Reference [9] designed the three-dimensional structure for the management mode of seaplane navigation safety based on the Hall 3D structure in system engineering. Reference [10] analyzed the conflict risks of the seaplane runway on the water aerodrome by using the fault tree method and the Bayesian network (BN) method. Their research indicated that the meteorological factor and the hydrological one are the most sensitive factors leading to the runway conflict. However, these researches on safety analysis of seaplane operation mainly focused on asingle accident event and analysis of specific operation stages. There is lack of systematic risk identification and assessment for the entire seaplane operation process.
There are some risk and safety analysis techniques widely used to reduce accidents: fault tree [11,12], event tree [13,14], bow-tie [15,16], and Bayesian network [17,18,19,20,21]. Compared to other techniques, Bayesian network (BN) has strong applicability in obtaining the probability when data are inaccurate, incomplete, or subjective and in dealing with uncertainty through probabilistic values [12]. Further, it is possible for BN to perform probability updating and sequential learning [18], which means BN can be used to do risk analysis with a temporal dimension. Due to these advantages, the BN approach is adopted in this paper to evaluate the safety risks of the seaplane operation process.
This paper aims to build a practical Bayesian network (BN) model for risk assessment of seaplane operation. The complicated risk factors are classified into four categories: pilot, aircraft, environment, and management. The risk factors causing seaplane accidents are identified according to historical data, literature review, and interviews with experts. With a screening approach, we construct an indicator system with 4 second-level risk factors and 18 third-level risk factors. The structure of the indicator system is used to build the structure of the BN model. Expert experience and statistical data are used to determine the prior probabilities and the conditional probability table of the BN model. The structure and the probability parameters together define the BN model. The model is validated with an out-of-sample test, which demonstrates approximately 95% prediction accuracy of the accident severity level. The validated model is then applied to conduct diagnosis inference and sensitivity analysis to identify the key risk factors for seaplane operation accidents. Results show that the four most critical risk factors are mental barrier, mechanical failure, visibility, and improper emergency disposal. These results provide an early warning to take appropriate preventive and mitigative measures to enhance the overall safety of the seaplane operation process.
The rest of the paper is organized as follows. Section 2 reviews the main research methodology. Section 3 presents the proposed approach for seaplane operation safety risk modeling, including risk identification, construction and screening of the indicator system, establishment of the BN model, and BN validation test. Section 4 applies the BN model to do diagnosis inference and sensitivity analysis. Section 5 discusses the principle contributions of this paper and Section 6 offers concluding remarks.
2. Research Methodology
This paper uses the approaches of statistical analysis, expert interview, Delphi method to identify and screen risk factors and Bayesian network (BN) to establish the BN model.
2.1. Statistical Analysis
Official accident reports play an essential role in risk factor analysis because the reports are written by an accident investigation board and usually present valuable and detailed information about the causes and results of accidents [22]. We collected and analyzed a total of 28 seaplane accident reports during 2010–2016 from a government website (https://www.ntsb.gov/investigations/AccidentReports/Pages/aviation.aspx). The statistics of the accidents indicate that collision is the most typical accident type in seaplane operation.
2.2. Expert Interview
The purpose of the expert interview is to obtain risk factors from the practice of seaplane operation. In this paper, we designed a series of questions and interviewed five experts with different backgrounds related to seaplane research and practical experience, as shown below:
Expert 1: An academic expert in aviation safety management.
Expert 2: An academic expert in ship sailing safety.
Expert 3: A safety manager from the general aviation industry in China who has investigated the current development of seaplanes in the US and Canada.
Expert 4: An experienced seaplane pilot from the general aviation industry in China.
Expert 5: A technical manager from the general aviation industry in China.
2.3. Delphi Method
This paper constructs a rough indicator system based on risk factors identified from statistical analysis, literature review and expert interview. However, not all indicators are important. It is necessary to screen the indicators and obtain a convincing indicator system. Here we use the Delphi method which has been considered as a popular qualitative analysis technique to screen indicator systems. The Delphi method, proposed as an expert opinion survey method in the 1950s [23], is a systematic and interactive research approach forobtaining the opinions of a group of experts on a specific topic. In the method, the selected experts are asked to participate in two or more rounds of structured surveys. Anonymous response, iterative and controlled feedback, and statistical group response are the main characteristics of the Delphi method [24].
In this paper, the five experts mentioned in “Expert interview” were asked to participate in the questionnaire survey due totheir experience and knowledge. Two rounds of structured surveys were performed in this paper. The first aimed to screen the preliminary indexes according to their expert opinions. The second was to screen indexes by degree of importance calculated by expert rating. The expert rating scale for the operation safety risk assessment of the seaplane is based on the five-point Likert scale, where 5 means most important, 4 means important, 3 means generally important, 2 means not too important, and 1 means not important. Arithmetic mean value and variation coefficient value are the main matrix of screening indicators.
where is the arithmetic mean value of the th index, is the number of experts who participated in the evaluation of the th index, and represents the rating value of the th expert on the th index. A higher value of means that an index is more important.
where is the variation coefficient value of the th index, which reflects the relative discrete degree of expert evaluation results. A lower value of means an index has better convergence.
Based on the result of a consultation with the experts, this study sets and as the screening criteria.
2.4. Bayesian Network
BN is a widely used tool for modeling complex systems, particularly in the absence of accessible data [25]. On the other hand, as a probabilistic inference method, it has advantages in that it usesprobability theory to deal with uncertainties. Here the BN model is selected to assess the operation safety risks of seaplanes because this risk assessment work is an activity that requires inference from incomplete, inaccurate, or uncertain knowledge and information.
Combined with probability theory and graph theory, a BN is a directed acyclic graph (DAG) that includes a certain number of nodes and edges [26,27,28]. DAG reflects the causal dependency and causal inference between nodes. For an edge connecting two nodes, the node it starts from is called a parent node and the node it ends at is called a child node. For example, if an edge from X2 to X4 exists, X2 is the parent node and X4 is the child node. A node that edges only start from is called a root node, which means a root node cannot be regarded as a child node for any edges. Root nodes are presented within a prior probability table. The remaining nodes have their conditional probability distributions and are presented within a conditional probability table. It should be noted that the probability of a parent node will affect the conditional probability of its child node(s).
In BN, the network structure can be regarded as a qualitative part of the model, whereas the probability parameters represent the quantitative aspect of the model [29]. The joint probability distribution of a set of random variables based on the conditional independence and the chain rule [26], is included in the network as:
where is the joint probability distribution and as the parent set of variable . A simple BN with a set of dependent random variables is illustrated in Figure 1 and the joint probability distribution is expressed as:
DAG represents the qualitative relationship of the BN. The conditional probability table (CPT) is used to describe the quantitative relationship in DAG for discrete random variables. The Bayes theory is the basis of BN, which can be expressed as:
where is the evidence, is the prior probability before considering any evidence, is the posterior probability (given evidence of , the likelihood of ), is the conditional probability which represents how likely the evidence is true. is the normalization factor [28].
3. Proposed Approach for Seaplane Operation Safety Risk Modeling
3.1. Risk Identification
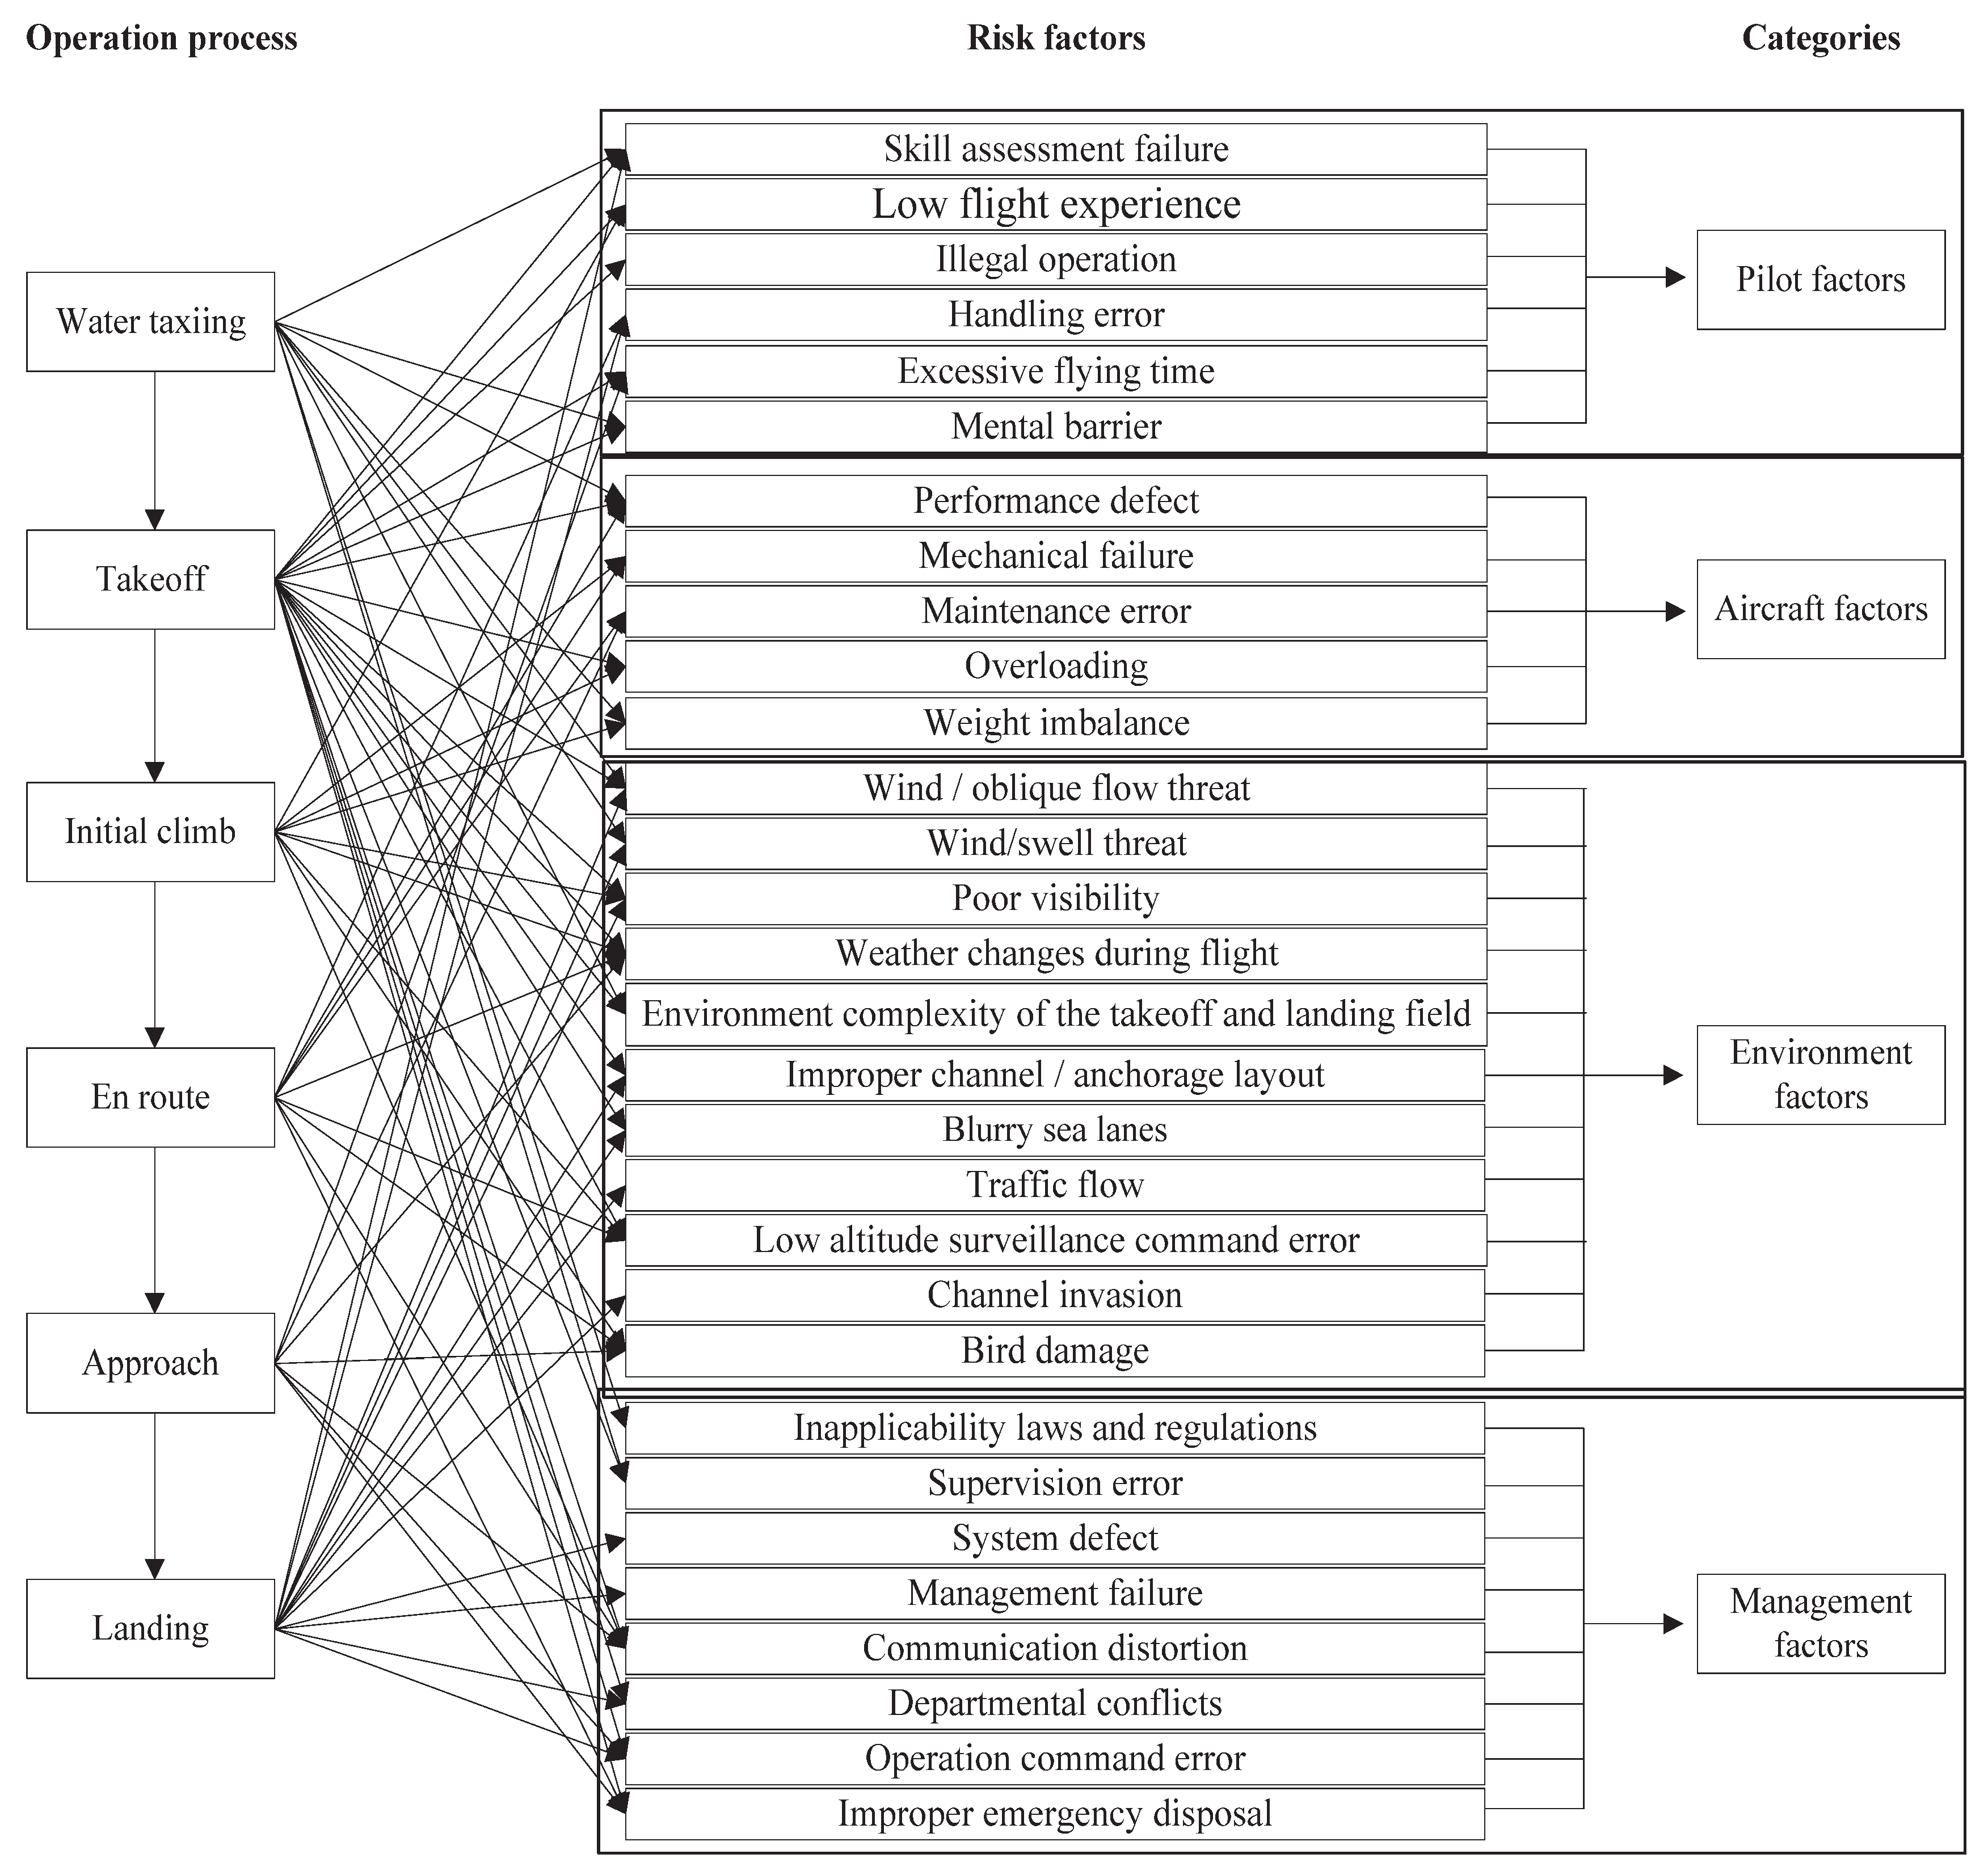
The goal of risk identification is to obtain all possible risk factors affecting the seaplane operation safety for analysis. Three sources, historical data, literature review, and interviews with experts are used to identify the risk factors. The SHEL model [30] is adopted to help identify risk factors from four categories: pilot risk, aircraft risk, environmental risk, and management risk. For most risk factors, they can be mapped to the four categories obviously. For other factors whose categories are not clear, we classify them by discussing with experts. We identified 30 main risk factors from the three sources. They are listed as follows (refer to Table A1 for a description of risk factors and Figure A1 for which operation stage they occur at):
- (1)
- Identified 12 risk factors by historical data
Pilot skill error, illegal operation, lack of experience, handling error, mental barrier, performance defect, weight imbalance, visibility, environmental complexity of the takeoff and landing field, communication distortion, supervision error, and system loss.
- (2)
- Identified 16 risk factors by literature review
Excessive flying time [31], mechanical failure [32], maintenance error [33], wind/oblique flow threat [34], wind/swell threat [34], weather changes during flight [35], bird damage [36], inapplicability of laws and regulations [32] and management failure [37], lack of experience [38], handling error [39,40], mental barrier [41], performance defect [42], visibility [34,35], environmental complexity of the takeoff and landing field [40], communication distortion [43], andsupervision error [37].
- (3)
- Identified 21 risk factors by interviews with experts
Skill assessment failure, low flight experience, mental barrier, overloading, weight imbalance, maintenance error, wind/oblique flow, visibility, wind/swell, improper channel/anchorage layout, blurry sea lanes, traffic flow, low-altitude surveillance command error, channel invasion, bird damage, weather changes during flight, communication distortion, inapplicability of laws and regulations, departmental conflicts, operational command error, and improper emergency disposal.
3.2. Construction and Screening of the Indicator System
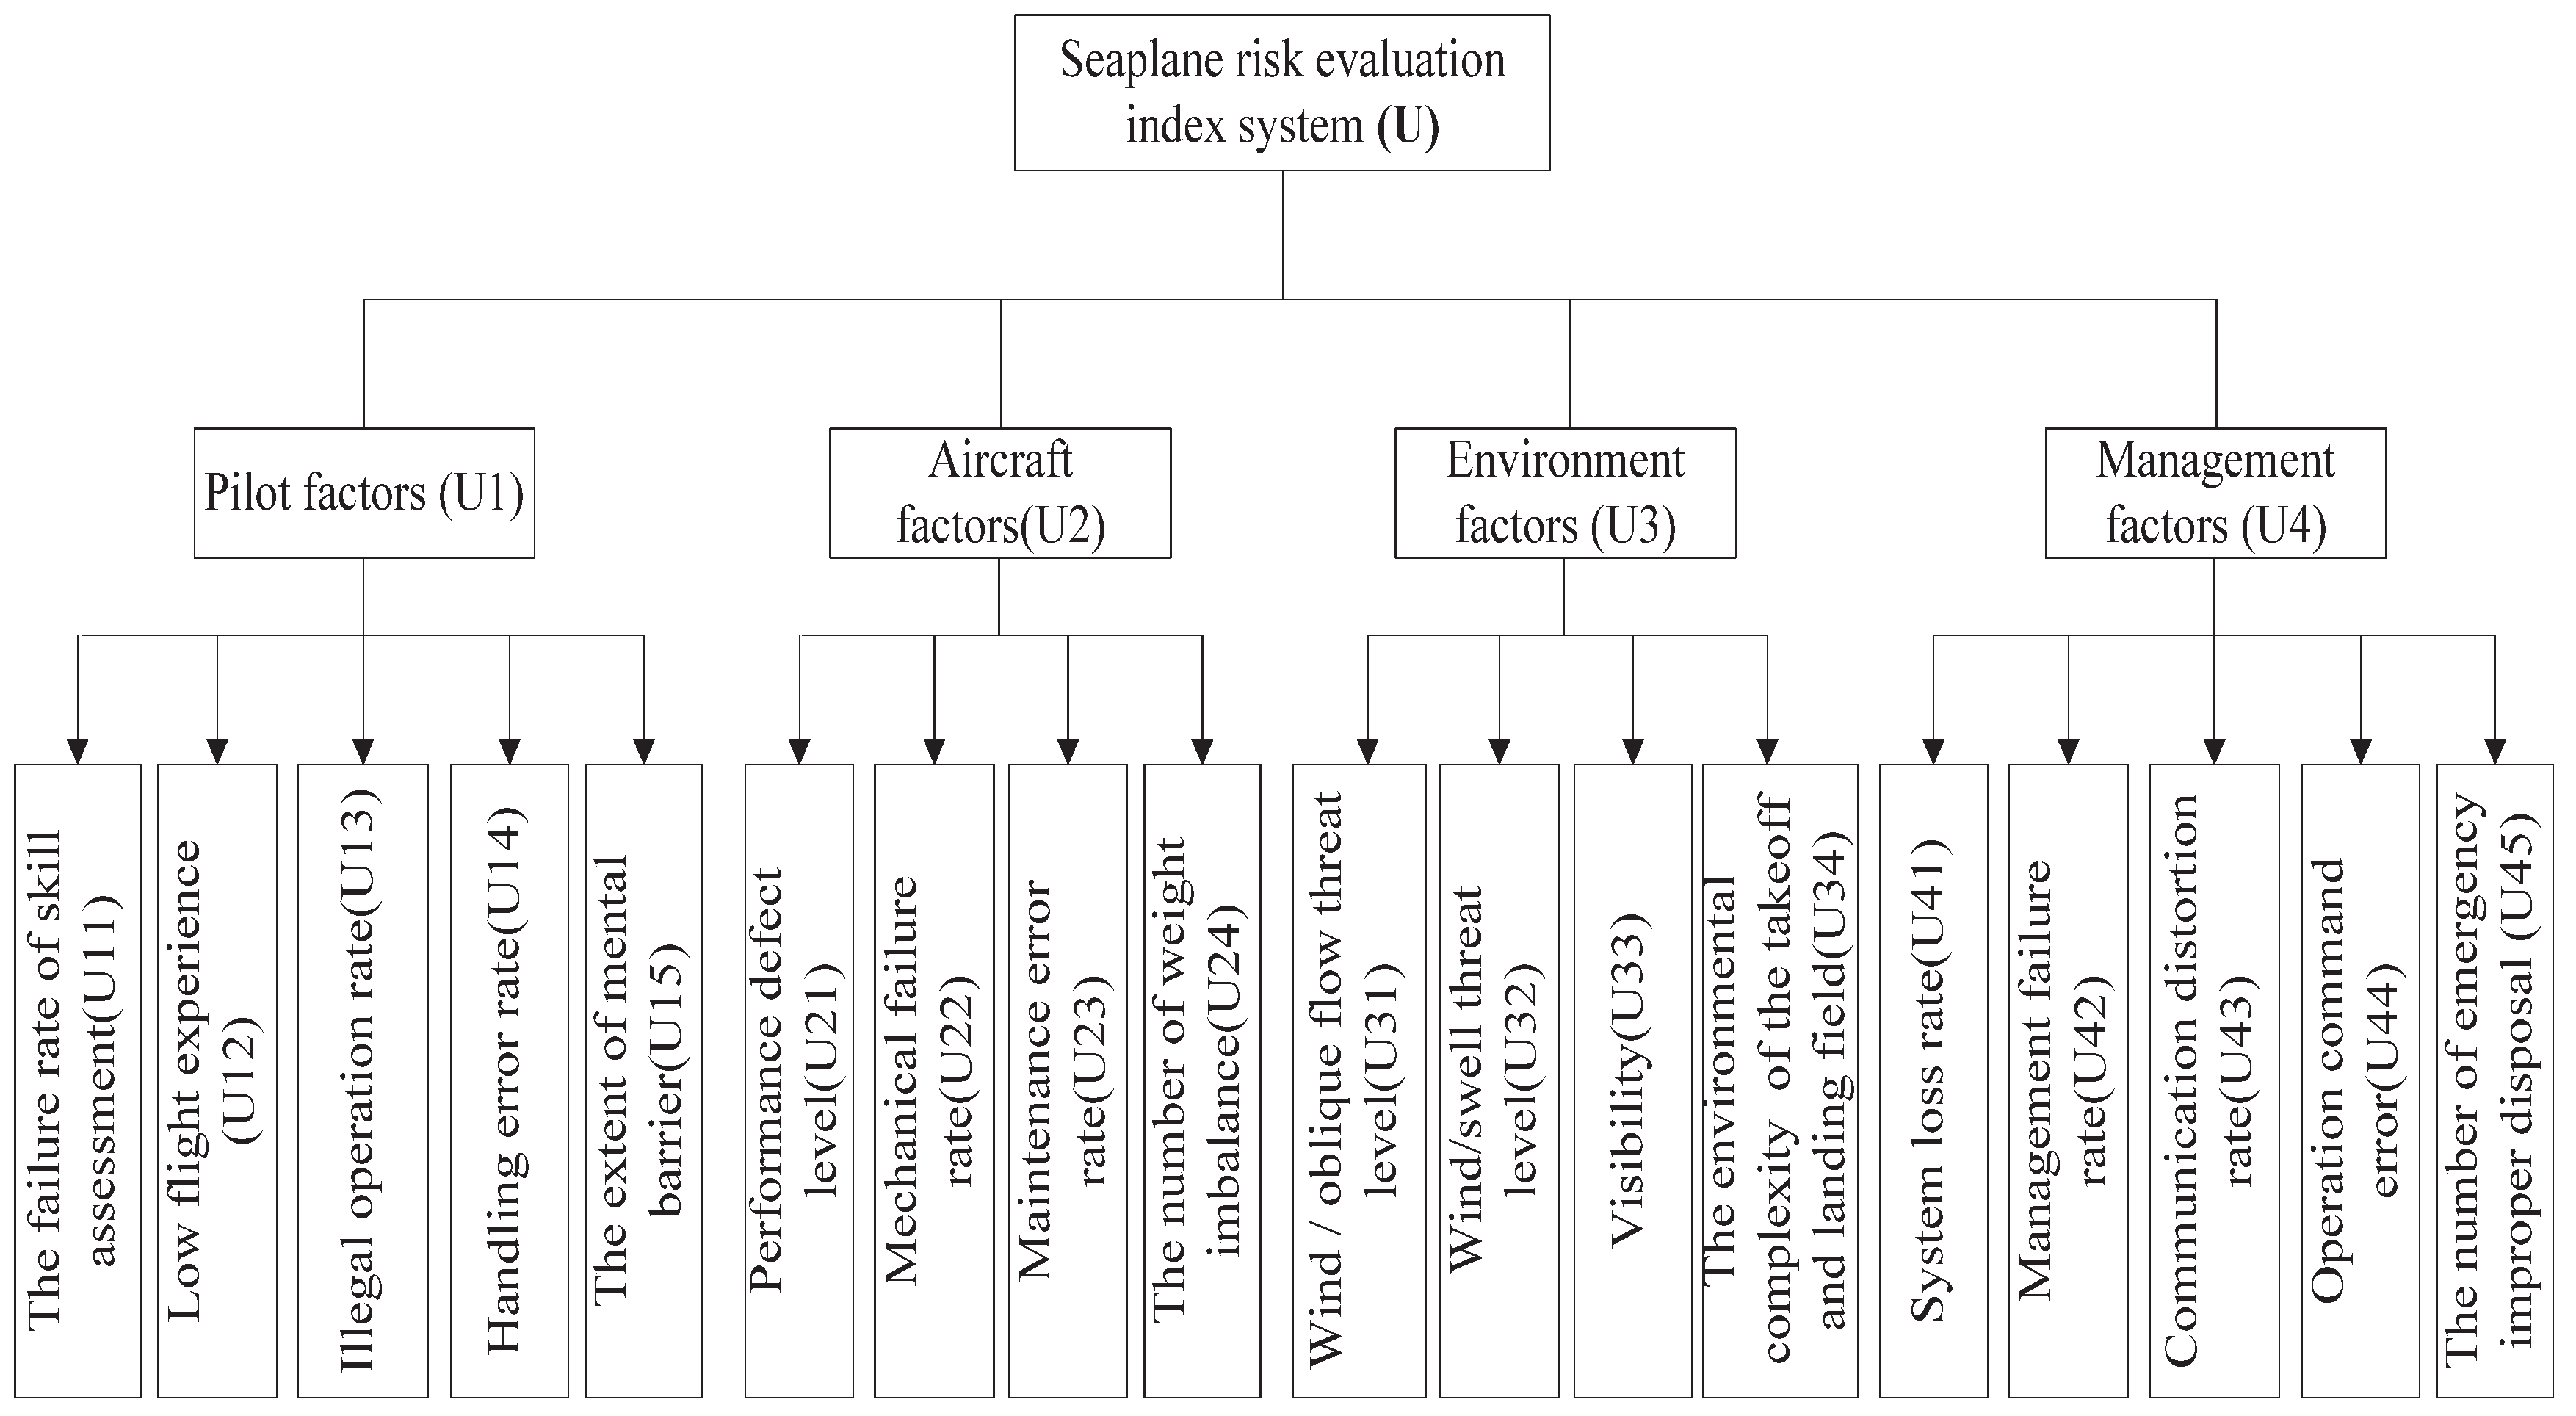
The indicator system must reflect the entire process of the seaplane operation safety risk. Hence, it should meet scientific, systematic, targeted, and practical principles. Risk factors are the foundation of constructing an indicator system, which serves as the macroscopic reflection of the risk factors. This study constructs an indicator system including 4 second-level indicators and 30 third-level indicators derived from the result of risk identification. The Delphi method is then used to screen the indicator system. Statistical results of arithmetic mean value and variation coefficient value are presented in Table 1.
In the “Note” column in Table 1, an asterisk (*) means that the corresponding risk factor meets the requirements of and while a blank space indicates that the factor does not satisfy the requirements. After eliminating the factors which may not be important, we obtain 18 basic indicators in total. Finally, an indicator system with 4 second-level indicators and 18 third-level indicators is constructed, as shown in Figure 2.
3.3. Establishment of the Bayesian Network
The construction of a Bayesian network (BN) includes the structure aspect and the parameter aspect. The BN structure can be obtained usingthree approaches: manually, automatically, or a combination of both [44]. In this paper we obtain the structure manually according to the three-level indicator system. The BN parameters are composed of the prior probability tables (PPT) and the conditional probability tables (CPT). In this paper we utilize both expert experience and the parameter learning algorithm expectation-maximization (EM) [45]. Hugin 8.4 is used to establish the BN.
First we need to figure out the BN structure. As the classification of risk factors in the above indicator system is relatively independent, the risk factors are drawn layer by layer, which means that the correlation between the factors in the same category is stronger than the correlation between the factors in the third level. Therefore, this study does not consider the possible weak correlation between the factors in the third level when constructing the BN structure [46]. The BN structure is shown in Figure 3.
There are 18 root nodes, 4 intermediate nodes and 1 leaf node in the BN structure. The single leaf node (U) represents seaplane accidents. It has three states of “minor”, “substantial”, and “destroyed”, which describe the severity levels of accidents. The seaplane accidents are mainly prevented by fouraspects of measures: pilot (U1), aircraft (U2), environmental (U3), and management (U4). Each measure has two states,“yes” and “no”, where “yes” means the measure works and “no” means failure. The measures include the prevention of the basic risk events (U11, U12, …, U45). These events are represented by root nodes with two states, where “yes” indicates the risk event happens and “no” means safety.
Based on the above structure, the BN parameters are obtained by two steps. First the PPT and the CPT are directly elicited by the same five experts mentioned in Section 3.2. The problem scope, the elicitation process, and the fundamental theory of BN were introduced in detail to each expert to guarantee that they understood the objective of this process [32]. A consensus on the BN parameters was reached in the end. The second step is parameter learning. We adopt a random statistical method to gather information on 110 seaplane accidents during 2010–2016 from the Aviation Safety Network database, which includes the 28 accidents from the reports mentioned in Section 3.1. Of the 110 accidents, 87 are input into the parameter learning algorithm EM to obtain the final PPT and CPT (the remaining 23 were used for validation testing in Section 3.4). It should be noted that without the first step the parameter learning can also work. However, the expert experience in the first step provides the prior knowledge for the parameter learning and thus makes the BN model more accurate and practical.
The established BN is shown in Figure 4. It is obvious that the occurrence probability of minor accidents (0.4847) or destroyed accidents (0.3380) is greater than that of substantial accidents (0.1773). As for the risk factors leading to accidents, aircraft factors play the most important role with an occurrence probability of 0.3551, followed by pilot factors with 0.2385, environmental factors with 0.2000, and management factors with 0.0682. It can be seen that pilot factors and aircraft factors are the key risk factors of seaplane accidents, which is in accordance with the risk factor research on aviation aircraft accidents [47,48].
3.4. BN Validation Test
The remaining 23 of the 110 seaplane accidents referred to in Section 3.3 are used to test the accuracy of the BN model. In the total accident data and the test data, 17% of required data are missing, namely, for each accident case, on average, 17% of the nodes in BN have an unknown state. This is mainly due to some risk factors not being included in the accident reports. Similar to the validation process employed by Sheehan et al. (2019), the out-of-sample test is performed for each of the 23 accident cases, where the accident severity level is predicted using the constructed BN model. The prediction severity level is assumed to be the state forecasted with the highest probability. The test result for 10 cases is shown in Table 2. The prediction state (in bold) is compared with the actual state from each accident case. It is predicted accurately in 22 out of 23 accident cases, which is nearly 95% accuracy.
4. Application of the BN model
With the Bayesian network (BN) model, the diagnosis inference and the sensitivity analysis can be conducted to analyze the causal relationship of risk factors that cause accidents, as well as to identify the key risk factors from the categories of pilot, aircraft, environmental, and management.
4.1. Diagnosis Inference
The BN model can be applied to diagnose the most likely risk factors when a result such as an accident happens. In this section we analyze the following two scenarios: when different severity levels of accidents happen and when different categories of measures fail. The index of change rate is used here to indicate how a given result affects the occurrence probability of a risk factor. It is calculated as follows:
We adopt the real value instead of the absolute value. Thus, a positive change rate represents an increase in the occurrence possibility of the risk factor while a negative rate represents a decrease when evidence is found.
For the first scenario, the states of seaplane accidents (U) are set to “minor”, “substantial”, and “destroyed”, respectively, to observe the occurrence probability of the state “yes” for all the other nodes, as shown in Table 3. The result shows that in minor and substantial accidents, the order of the most possible risk factors causing the accidents is: environment (U3) > aircraft (U2) > management (U4) > pilot (U1). However, in destroyed accidents, the order is completely opposite: pilot (U1) > management (U4) > aircraft (U2) > environment (U3). As for the change rate, in minor accidents, the change rates of the risk factors system loss (U41), failure of skill assessment (U11), and wind/oblique flow threat (U31) are greater than those of other risk factors. On the other hand, the risk factors visibility (U33), mechanical failure (U22), aircraft performance defect (U21), and environmental complexity of the take-off and landing field (U34) are more prominent in substantial accidents. The risk factors mental barrier (U15), improper emergency disposal (U45), mechanical failure rate (U22), and operation command error rate (U44) are responsible for destroyed accidents.
For the second scenario, the states of pilot risk (U1), aircraft risk (U2), environmental risk (U3), and management risk (U4) are set to “yes” and “no” respectively.
- (1)
- Diagnosis inference for pilot factors
Table 4 illustrates the occurrence probabilities of casual risk factors under the assumption that pilot risk occurs. We can say that with a small increase in the probability of U1, the occurrence probability of U15 increases the most, which means that mental barrier is the key risk factor for pilot risk.
- (2)
- Diagnosis inference for aircraft factors
Table 5 illustrates the probability of casual risk factors under the assumption that aircraft risk occurs. The posterior probabilities of the third-level indicators of aircraft increase fast and the change rates of mechanical failure(U21) and performance defect (U22) ranked in front, which means they become the main risk factors.
- (3)
- Diagnosis inference for environmental factors
The diagnosis inference result for environmental factors is shown in Table 6. When the environmental risk appears, the change rates of probabilities are more than 100%, which illustrates that all risk factors affect the environmental risk significantly and that visibility (U34) is the key factor.
- (4)
- Diagnosis inference for management factors
The probability distribution of risk factors causing management risk is presented in Table 7. When management risk exists, the change rate of improper emergency disposal (U45) reaches the top ranking of 724.35%, which means it is the most important risk factor for management risk.
4.2. Sensitivity Analysis
In this section the BN model is applied to identify the most important risk factors causing a seaplane accident. The sensitivity value of the node Ui to the node U (top event) is calculated as follows:
Given that no uniform criteria areused to judge the change in percentage caused by each risk factor, the change in percentage is judged subjectively in relation to other risk factors. The judgment results are highly relevant to decision makers. However, by selecting relatively more important risk factors, decision makers can develop efficient measures to prevent accidents [46].
In the first scenario, the influence of various risk factors on seaplane operation safety can be determined through sensitivity analysis, as shown in Figure 5. The sensitivity values of pilot (U1), aircraft (U2), and management (U4) are larger than that of environment (U3) in minor accidents. Risk factors such as mechanical failure (U22), aircraft performance defect (U21), pilot’s mental barrier (U15), improper emergency disposal (U45), operation command error (U44), and visibility (U33) are also sensitive to minor accidents. Aircraft (U2) and environment (U3), including mechanical fault (U22), visibility (U33), and aircraft performance defect (U21), are more sensitive to substantial accidents. Pilot (U1), management (U4), and aircraft (U2) factors are more sensitive to destroyed accidents compared with environmental (U3) factors, and the sensitivity value of mental barrier (U15), mechanical failure (U22), improper emergency disposal (U45), and performance defect (U21) are highlighted. The results of sensitivity analysis verify the diagnosis inference results to some extent, though large differences appear between sensitivity analysis and diagnosis inference for the risk factors of minor accidents.
- (1)
- Sensitivity analysis for pilot factors
Sensitivity analysis for pilot factors shows that the sensitivity value of mental barrier ranks first at 0.47, followed by handling error at 0.33 and illegal operation at 0.27. The sensitivity value of low flight experience is 0.2, which is close to that of skill assessment failure at 0.19. The result is consistent with the diagnosis inference, which demonstrates the key risk factors of the pilot.
- (2)
- Sensitivity analysis for aircraft factors
The sensitivity analysis result indicates that mechanical failure is the most sensitive factor among aircraft factors, with a sensitivity value of 0.65. The next sensitivityfactors are performance defect at 0.52 and weight imbalance at 0.36. The sensitivity of maintenance error is weak at 0.33.
- (3)
- Sensitivity analysis for environmental factors
The results illustrate that visibility has the highest sensitivity at 0.51, followed by the complexity of the landing field environment at 0.45. The sensitivity values of wind/oblique flow threat and wind/swell threat are 0.33 and 0.30, respectively.
- (4)
- Sensitivity analysis for management factors
The sensitivity analysis result shows that improper emergency disposal reaches a maximum of 0.51, followed by operation command at 0.46. The sensitivity values of communication distortion and management failure are 0.31 and 0.27, respectively, and system loss has the minimum sensitivity at 0.18.
5. Discussion
The Bayesian network (BN) approach is adopted in this paper to evaluate the safety risk of the seaplane operation process. Before the construction of the BN model, the main risk factors causing seaplane accidents are identified and screened fromhistorical data, literature review, interviews with experts, and the Delphi method. An indicator system with 4 second-level indicators and 18 third-level indicators is obtained, which helps build the structure of the BN model. The parameters of the BN model are determined by expert experience and parameter learning from87 accident cases. An out-of-sample validation test by 23 accident cases shows that the BN model is able to predict the accident severity level with 95% accuracy. Then the validated BN model is applied to conduct diagnosis inference and sensitivity analysis for various scenarios. It is found that the four most critical risk factors of seaplane operation are mental barrier, mechanical failure, visibility, and improper emergency disposal.
The identified risk factors causing seaplane accidents are classified into four categories: pilot, aircraft, environment, and management. The classification approach (the SHEL model) is common in the research field of seaplane safety or the broader general aviation safety. However, this research has identified some risk factors which are not covered by previous research [2,8,10]. The risk factors illegal operation (U13) identified by historical data and operation command error (U44) identified by interviews with experts are included in the BN network. According to the results of diagnosis inference (Table 3) and sensitivity analysis (Figure 5), they have an intermediate impact on the seaplane accidents in relation tothe other risk factors, which means they should not be ignored. The risk factors identified in this paper could be used by the community of seaplane/general aviation risk analysis research as a reference.
The prior probability tables (PPT) and the conditional probability tables (CPT) are obtained by both expert experience and parameter learning in this paper. Expert opinions are valuable in determining these probabilistic parameters as they provide practical prior knowledge, which is used by previous work [10] to construct their BN models of seaplane risk assessment. Parameter learning from case data is preferred by risk assessment research in other fields [49], which is also a popular approach to construct a BN model. However, seaplane accident data are not organized well for risk assessment. We collected and analyzed 110 accident reports in detail for this research. For parameter learning, 87 accident cases were used, and 23 cases for the validation test. We believe the BN network constructed with both expert opinions and accident data could provide more practical risk analysis results.
Based on the BN model, diagnosis inference and sensitivity analysis are carried out to identify the most critical risk factors. By diagnosis inference, it is found that in minor and substantial accidents, aircraft and environment are the key factors leading to accidents, whereas in destroyed accidents, pilot and management are the main risk factors for seaplane accidents, which is consistent with practice. For pilot factors, mental barrier and handling error are the main risk factors; mechanical failure and performance defect play important roles in aircraft risk; environmental complexity of the take-off and landing field and visibility are the main environmental factors; and improper emergency disposal and operational command error are the key factors in management risk. By sensitivity analysis, the key factors affecting the seaplane safety risk. The parameter variation in the analysis is the variation of the occurrence probability of risk factors from 0% (state = “no”) to 100% (state = “yes”), and we observe how this variation affects the occurrence probability of an accident. The four risk factors which influence the accident the most are mental barrier, mechanical failure, visibility, and improper emergency disposal. These results can be useful for seaplane operators to take targeted and effective measures to improve seaplane operation safety.
6. Conclusions
This paper proposes a novel risk assessment approach for seaplane operation safety using Bayesian network (BN). The BN model is constructed according to historical accident data and experts in the seaplane field. It is validated by predicting the severity level of actual accidents with 95% accuracy. Diagnosis inference and sensitivity analysis are performed to find key risk factors in particular scenarios for decision making purposes. The result shows that the four most critical risk factors are mental barrier, mechanical failure, visibility, and improper emergency disposal. It provides an early warning to take appropriate preventive and mitigative measures to enhance the overall safety of seaplane operation process.
The future directions of this research are as follows. Firstly, the structure of the BN model could be improved to better reflect the casual relationships of nodes by structure learning from much more accident data. Secondly, other safety analysis methods such as system dynamics could be combined with BN to study the relationships among risk factors. Finally, the BN model will be applied to more practical scenarios for validation and modification.
Author Contributions
“conceptualization, Q.X. and F.L.; methodology, Q.X.; software, Q.X.; validation, Q.X., F.L. and Y.L.; formal analysis, Q.X.; investigation, Q.X. and F.L.; resources, F.L..; data curation, Q.X.; writing—original draft preparation, Q.X.; writing—review and editing, Y.L.; visualization, Y.L.; supervision, F.L.; project administration, F.L.; funding acquisition, F.L.” All authors have read and agreed to the published version of the manuscript.
Funding
This research was funded by National Natural Science Foundation of China, grant number 71271163, and Humanities and Social Sciences Fund of the Ministry of Education of China, grant number 18YJA630076.
Acknowledgments
Great gratitude is extended to the experts for their opinion on the risk identification, index screening and BN building.
Conflicts of Interest
The authors declare no conflict of interest. The funders had no role in the design of the study; in the collection, analyses, or interpretation of data; in the writing of the manuscript, or in the decision to publish the results.
Appendix A
1. The Description of Risk Factors

Table A1.
Risk factors for seaplane operation safety.
| Operation safety risk of the seaplane | Risk Category | Risk Factor | Description |
| Pilot risk | Skill assessment failure | The skill of the pilot does not meet the requirements | |
| Low flight experience | Water flight experience is low | ||
| Illegal operation | Pilots do not operate seaplanes in accordance with the regulations | ||
| Handling error | Pilots inadvertently mishandle the seaplane | ||
| Excessive flying time | The pilot’s standard flight time is exceeded | ||
| Mental barrier | The psychological problem of the pilot | ||
| Aircraft risk | Performance defect | Problems in the production of the seaplane | |
| Mechanical failure | Mechanical problems of the seaplane | ||
| Maintenance error | Poor maintenance of the seaplane | ||
| Overloading | The weight carried by the seaplane exceeds the specified maximum weight standard | ||
| Weight imbalance | The weight distribution of the seaplane is uneven | ||
| Environmental risk | Wind/oblique flow threat | Crosswind and oblique flow | |
| Wind/swell threat | Wind wave and swell wave | ||
| Poor visibility | The maximum distance that can be seen is limited | ||
| Weather changes during flight | Weather changes during the flight of the seaplane | ||
| Environmental complexity of the take-off and landing field | Water environment and airspace near the landing field | ||
| Improper channel/anchorage layout | Improper take-off and landing routes / improper location of seaplane | ||
| Blurry sea lanes | Water taxiway and runway logo are fuzzy | ||
| Traffic flow | The number of ships, motorboats, etc. near the landing field of a seaplane for a specific period | ||
| Low-altitude surveillance command error | Low-altitude airspace surveillance and command error | ||
| Channel invasion | An event that adversely affects the safety of the waterway | ||
| Bird hazard | The impact of birds around the landing site on the operational safety of seaplanes | ||
| Management risk | Inapplicability laws and regulations | Lack of regulations, or the existing laws and regulations do not apply | |
| Supervision error | Regulators are unaware of any possible safety problems in the operation of the seaplane | ||
| System loss | Lack of an internal system for developing the seaplane business | ||
| Management failure | The manager commits an error in coordinating the work of each stage of a seaplane | ||
| Communication distortion | Information changes, including loss, misleading, delay, etc. during the seaplane operation process | ||
| Departmental conflicts | Conflicts between departments due to cross responsibilities | ||
| Operation command error | During the operation process, the on-site command department delivers the wrong message | ||
| Improper emergency disposal | The emergency disposal is improper when a sudden condition occurs during the operation of a seaplane |
2. Risk Factors of the Operation Process
Figure A1.
Risk factors of the operation process.

References
- Gobbi, G.; Smrcek, L.; Galbraith, R.; University of Glasgow; Barry Lightening; Malta, H.A.; Sträter, B.; Sträter Consulting; Majka, A.; Rzsezow University. 2011 Report on Current Strength and Weaknesses of Existing Seaplane/Amphibian Transport System as well as Future Opportunities Including Workshop Analysis; Technical Report FUSETRA (Future Seaplane Traffic); European Union: Glasgow, UK, 8 September 2011. [Google Scholar]
- Guo, G.; Xu, Y.; Wu, B. Overview of current progress and development of seaplane safety management. In Proceedings of the 2016 IEEE International Conference on Intelligent Transportation Engineering (ICITE), Singapore, 20–22 August 2016; pp. 58–63. [Google Scholar]
- Xiao, Q.; Luo, F. GT-SEM model for safety risk mechanism of amphibious seaplane during taking off and landing. China Saf. Sci. J. 2019, 29, 158–163. [Google Scholar]
- Xiao, Q.; Luo, F. Safety Risk Evolution of Amphibious Seaplane During Takeoff and Landing—Based on Complex Network. Complex Syst. Complex. Sci. 2019, 16, 19–30. [Google Scholar]
- Voloshchenko, V.Y. Seadrome: Increasing the safety of takeoff and landing operations in the seaplane basin. Russ. Aeronaut. (Iz VUZ) 2016, 59, 271–276. [Google Scholar] [CrossRef]
- Xiao, Q.; Luo, F. Discussion on the construction problem of civil seadrome. Agro Food Ind. Hi-Tech. 2017, 28, 3596–3599. [Google Scholar]
- Weng, J.; Zhou, Y. Analysis of Risk Factors and Safety Countermeasures of Collision between Seaplanes and Vessels Based on ISM Theory. ICTIS 2013 2013, 6, 2282–2288. [Google Scholar]
- Weng, J.J.; Zhou, Y. Analysis of risk factors of seaplane-vessel collision based on the integration of DEMATEL and ISM. Navig. China 2013, 36, 70–75. [Google Scholar]
- Weng, J.J.; Zhou, Y.; Su, W. Study on the Management Mode of Seaplane Navigation Safety. Adv. Mater. Res. 2014, 1030, 2634–2638. [Google Scholar] [CrossRef]
- Zhang, P.K.; Luo, F. FTA-BN modeling of runway conflict risk mechanism at water aerodrome. China Saf. Sci. J. 2018, 28, 177–182. [Google Scholar]
- Lindhe, A.; Rosen, L.; Norberg, T.; Bergstedt, O. Fault tree analysis for integrated and probabilistic risk analysis of drinking water systems. Water Res. 2009, 43, 1641–1653. [Google Scholar] [CrossRef]
- Khakzad, N.; Khan, F.; Amyotte, P.R. Safety analysis in process facilities: Comparison of fault tree and Bayesian network approaches. Reliab. Eng. Syst. Saf. 2011, 96, 925–932. [Google Scholar] [CrossRef]
- Kalantarnia, M.; Khan, F.; Hawboldt, K. Dynamic risk assessment using failure assessment and Bayesian theory. J. Loss Prev. Process Ind. 2009, 22, 600–606. [Google Scholar] [CrossRef]
- Neri, A.; Aspinall, W.P.; Cioni, R.; Bertagnini, A.; Baxter, P.J.; Zuccaro, G.; Woo, G. Developing an Event Tree for probabilistic hazard and risk assessment at Vesuvius. J. Volcanol. Geotherm. Res. 2008, 178, 397–415. [Google Scholar] [CrossRef]
- Khakzad, N.; Khan, F.; Amyotte, P.R. Dynamic risk analysis using bow-tie approach. Reliab. Eng. Syst. Saf. 2012, 104, 36–44. [Google Scholar] [CrossRef]
- Ferdous, R.; Khan, F.; Sadiq, R.; Amyotte, P.R.; Veitch, B. Handling and updating uncertain information in bow-tie analysis. J. Loss Prev. Process. Ind. 2012, 25, 8–19. [Google Scholar] [CrossRef]
- Cai, B.; Liu, Y.-H.; Liu, Z.; Tian, X.; Zhang, Y.; Ji, R. Application of Bayesian Networks in Quantitative Risk Assessment of Subsea Blowout Preventer Operations. Risk Anal. 2012, 33, 1293–1311. [Google Scholar] [CrossRef]
- Khakzad, N.; Khan, F.; Amyotte, P.R. Quantitative risk analysis of offshore drilling operations: A Bayesian approach. Saf. Sci. 2013, 57, 108–117. [Google Scholar] [CrossRef]
- Bhandari, J.; Abbassi, R.; Garaniya, V.; Khan, F. Risk analysis of deepwater drilling operations using Bayesian network. J. Loss Prev. Process. Ind. 2015, 38, 11–23. [Google Scholar] [CrossRef]
- Baksh, M.; Abbassi, R.; Garaniya, V.; Khan, F. A network based approach to envisage potential accidents in offshore process facilities. Process. Saf. Prog. 2016, 36, 178–191. [Google Scholar] [CrossRef]
- Abaei, M.M.; Abbassi, R.; Garaniya, V.; Chai, S.; Khan, F. Reliability assessment of marine floating structures using Bayesian network. Appl. Ocean Res. 2018, 76, 51–60. [Google Scholar] [CrossRef]
- Mazaheri, A.; Montewka, J.; Nisula, J.; Kujala, P. Usability of accident and incident reports for evidence-based risk modeling—A case study on ship grounding reports. Saf. Sci. 2015, 76, 202–214. [Google Scholar] [CrossRef]
- Dalkey, N.; Helmer, O. An experimental application of the Delphi method to the use of experts. Manag. Sci. 1963, 9, 458–467. [Google Scholar] [CrossRef]
- Hsu, C.C.; Sandford, B.A. The Delphi technique: Making sense of consensus. Pract. Assess. Res. Eval. 2007, 12, 1–8. [Google Scholar]
- Pitchforth, J.; Mengersen, K. A proposed Validation Framework for Expert Elicited Bayesian Networks; Pergamon Press, Inc.: Oxford, UK, 2013. [Google Scholar]
- Pearl, J. Markov and Bayesian networks: Two graphical representations of probabilistic knowledge. Probabilistic Reason. Intell. Syst. 1988, 3, 77–141. [Google Scholar]
- Trucco, P.; Cagno, E.; Ruggeri, F.; Grande, O. A Bayesian belief network modeling of organizational factors in risk analysis: A case study in maritime transportation. Reliab. Eng. Syst. Saf. 2008, 93, 845–856. [Google Scholar] [CrossRef]
- Zhang, G.; Thai, V.V. Expert elicitation and Bayesian Network modeling for shipping accidents: A literature review. Saf. Sci. 2016, 87, 53–62. [Google Scholar] [CrossRef]
- Darwiche, A. Modeling and Reasoning with Bayesian Networks; Cambridge University Press: Cambridge, UK, 2009. [Google Scholar]
- Edwards, E. Man and machine: Systems for safety. In Proceedings of British Airline Pilots Associations Technical Symposium; British Airline Pilots Associations: London, UK, 1972; pp. 21–36. [Google Scholar]
- A Latorella, K.; Prabhu, P.V. A review of human error in aviation maintenance and inspection. Int. J. Ind. Ergon. 2000, 26, 133–161. [Google Scholar] [CrossRef]
- Sotiralis, P.; Ventikos, N.; Hamann, R.; Golyshev, P.; Teixeira, A. Incorporation of human factors into ship collision risk models focusing on human centred design aspects. Reliab. Eng. Syst. Saf. 2016, 156, 210–227. [Google Scholar] [CrossRef]
- Herrera, I.A.; Nordskag, A.O.; Myhre, G.; Halvorsen, K. Aviation safety and maintenance under major organizational changes, investigating non-existing accidents. Accid. Anal. Prev. 2009, 41, 1155–1163. [Google Scholar] [CrossRef] [Green Version]
- Merrick, J.R.W.; Mazzuchi, T.A.; Harrald, J.R. Modeling risk in the dynamic environment of maritime transportation. In Proceedings of the Simulation Conference, 2001 Proceedings of the Winter, 2001, Arlington, VA, USA, 9–12 December 2001; pp. 1090–1098. [Google Scholar]
- Liu, Q.; Han, D.; Chen, Y.; Zhang, W. Research on navigation risk evolution in three gorges dam area based on system dynamics. China Saf. Sci. J. 2016, 26, 19–23. [Google Scholar]
- Coccon, F.; Zucchetta, M.; Bossi, G.; Borrotti, M.; Torricelli, P.; Franzoi, P. A Land-Use Perspective for Birdstrike Risk Assessment: The Attraction Risk Index. PLoS ONE. 2015, 10, e0128363. [Google Scholar] [CrossRef] [Green Version]
- Holloway C, M.; Johnson C, W. Distribution of causes in selected, U.S. aviation accident reports between 1996 and 2003. In Proceedings of the 22nd International System Safety Conference, Provdence, Rhode Island, 2–6 August 2004. [Google Scholar]
- Bazargan, M.; Guzhva, V.S. Impact of gender, age and experience of pilots on general aviation accidents. Accid. Anal. Prev. 2011, 43, 962–970. [Google Scholar] [CrossRef] [PubMed]
- Mcfadden, K.L. Risk models for analyzing pilot-error at US airlines: a comparative safety study. Comput. Ind. Eng. 2003, 44, 581–593. [Google Scholar] [CrossRef]
- Dambier, M.; Hinkelbein, J. Analysis of 2004 German general aviation aircraft accidents according to the HFACS model. Air Med. J. 2006, 25, 265–269. [Google Scholar] [CrossRef] [PubMed]
- Li, H.; SunR, S.; Liu, J.Q. Establishment of risk evaluation model for pilot safety based on comprehensive quality. J. Saf. Sci. Technol. 2013, 12, 155–159. [Google Scholar]
- Liang, G.-F.; Lin, J.-T.; Hwang, S.-L.; Wang, E.M.-Y.; Patterson, P. Preventing human errors in aviation maintenance using an on-line maintenance assistance platform. Int. J. Ind. Ergon. 2010, 40, 356–367. [Google Scholar] [CrossRef]
- Chang, Y.-H.; Shao, P.-C.; Chen, H.J. Performance evaluation of airport safety management systems in Taiwan. Saf. Sci. 2015, 75, 72–86. [Google Scholar] [CrossRef]
- Neil, M.; Fenton, N.; Nielson, L. Building large-scale Bayesian networks. Knowl. Eng. Rev. 2000, 15, 257–284. [Google Scholar] [CrossRef] [Green Version]
- Madsen, A.L.; Lang, M.; Kjærulff, U.B.; Jensen, F. Quantitative Approaches to Reasoning and Uncertainty; Springer: Berlin/Heidelberg, Germany, 2003; pp. 594–605. [Google Scholar]
- Afenyo, M.; Khan, F.; Veitch, B.; Yang, M. Arctic shipping accident scenario analysis using Bayesian Network approach. Ocean Eng. 2017, 133, 224–230. [Google Scholar] [CrossRef]
- Kelly, D.; Efthymiou, M.; Efthymiou, M. An analysis of human factors in fifty controlled flight into terrain aviation accidents from 2007 to 2017. J. Saf. Res. 2019, 69, 155–165. [Google Scholar] [CrossRef]
- Rao, A.H.; Marais, K. A state-based approach to modeling general aviation accidents. Reliab. Eng. Syst. Saf. 2020, 193, 106670. [Google Scholar] [CrossRef]
- Sheehan, B.; Murphy, F.; Mullins, M.; Ryan, C. Connected and autonomous vehicles: A cyber-risk classification framework. Transp. Res. Part A Policy Pr. 2019, 124, 523–536. [Google Scholar] [CrossRef]
Figure 1.
A sample of a Bayesian network.

Figure 2.
Seaplane risk evaluation indicator system.

Figure 3.
Bayesian network structure of the seaplane.

Figure 4.
The Bayesian network for seaplane operation safety risk assessment.

Figure 5.
Result of risk factor sensitivity analysis.

Table 1.
Expert statistical result of seaplane operation safety risk indicators.
| First Level | Second Level | Third Level | Arithmetic Mean | Variation Coefficient | Note |
|---|---|---|---|---|---|
| Operation safety risk of the seaplane | Pilot factor | Failure rate of skill assessment | 4.6 | 0.17 | * |
| Low flight experience | 5 | 0.00 | * | ||
| Illegal operation rate | 4.8 | 0.08 | * | ||
| Handling error rate | 4.2 | 0.28 | * | ||
| Excessive hours of flying time | 3.4 | 0.14 | |||
| Extent of mental barrier | 4.6 | 0.11 | * | ||
| Aircraft factor | Performance defect level | 4.2 | 0.18 | * | |
| Mechanical failure rate | 4.2 | 0.18 | * | ||
| Maintenance error rate | 4.4 | 0.18 | * | ||
| Frequency of overloading incidents | 3.4 | 0.14 | |||
| Frequency of weight imbalance incidents | 4.4 | 0.18 | * | ||
| Environmental factor | Wind / oblique flow threat level | 4.4 | 0.11 | * | |
| Wind/swell threat level | 4.8 | 0.08 | * | ||
| Visibility | 3.6 | 0.33 | * | ||
| Number of weather changes during flight | 3.4 | 0.24 | |||
| Environmental complexity of the takeoff and landing field | 4.2 | 0.10 | * | ||
| Improper channel / anchorage layout | 2.6 | 0.39 | |||
| Blurry degree of sea lanes | 3.2 | 0.23 | |||
| Traffic flow | 2.2 | 0.45 | |||
| Number of low-altitude surveillance errors | 2.8 | 0.47 | |||
| Number of channel invasions | 2.6 | 0.39 | |||
| Degree of bird hazard | 2.8 | 0.42 | |||
| Management factor | Degree of inapplicability of laws and regulations | 2.8 | 0.27 | ||
| Failure rate of regulatory oversight | 3.2 | 0.23 | |||
| System loss rate | 3.6 | 0.22 | * | ||
| Management failure rate | 3.8 | 0.20 | * | ||
| Communication distortion rate | 4.2 | 0.10 | * | ||
| Frequency and intensity of departmental conflicts | 3.2 | 0.23 | |||
| Operation command error rate | 4.0 | 0.22 | * | ||
| Number of improper emergency disposals | 4.6 | 0.17 | * |
Table 2.
Out-of-sample test result for 10 accident cases.
| Test Data | ||||||||||||||
|---|---|---|---|---|---|---|---|---|---|---|---|---|---|---|
| Case | U1 | U11 | U12 | U13 | U14 | U15 | U2 | U21 | U22 | U23 | U24 | U3 | U31 | U32 |
| 1 | N/A | yes | no | no | yes | no | N/A | yes | no | no | no | N/A | no | no |
| 2 | N/A | no | no | no | no | no | N/A | no | no | no | no | N/A | yes | no |
| 3 | N/A | no | yes | no | no | no | N/A | no | no | no | no | N/A | no | no |
| 4 | N/A | no | no | no | no | no | N/A | no | no | yes | no | N/A | no | no |
| 5 | N/A | no | no | no | yes | no | N/A | no | no | no | no | N/A | no | no |
| 6 | N/A | no | no | no | no | no | N/A | no | no | yes | no | N/A | no | no |
| 7 | N/A | no | no | no | no | no | N/A | yes | no | no | no | N/A | no | yes |
| 8 | N/A | yes | no | no | no | no | N/A | no | yes | no | no | N/A | no | no |
| 9 | N/A | no | no | yes | no | no | N/A | no | no | no | no | N/A | no | no |
| 10 | N/A | no | no | no | no | no | N/A | no | yes | no | no | N/A | no | no |
| Test Data | Validation Data | |||||||||||||
| actual | prediction probability | |||||||||||||
| case | U33 | U34 | U4 | U41 | U42 | U43 | U44 | U45 | U | minor | substantial | destroyed | ||
| 1 | no | yes | N/A | no | no | no | yes | no | destroyed | 0.1509 | 0.1711 | 0.6780 | ||
| 2 | no | no | N/A | no | no | yes | no | no | destroyed | 0.2722 | 0.2133 | 0.5144 | ||
| 3 | no | yes | N/A | no | no | no | no | no | destroyed | 0.3071 | 0.2088 | 0.4841 | ||
| 4 | no | no | N/A | no | no | no | no | no | minor | 0.5844 | 0.1767 | 0.2389 | ||
| 5 | no | no | N/A | no | no | no | no | no | substantial | 0.2769 | 0.6085 | 0.1146 | ||
| 6 | no | no | N/A | no | no | no | no | no | minor | 0.5844 | 0.1767 | 0.2389 | ||
| 7 | no | no | N/A | no | no | no | no | no | substantial | 0.2102 | 0.3864 | 0.4052 | ||
| 8 | no | no | N/A | no | no | no | no | no | minor | 0.4278 | 0.2336 | 0.2386 | ||
| 9 | no | no | N/A | no | no | no | no | no | minor | 0.6222 | 0.1118 | 0.2660 | ||
| 10 | no | no | N/A | no | no | yes | no | no | destroyed | 0.3240 | 0.2241 | 0.4519 | ||
Table 3.
Probability distribution of the nodes.
| Node | Prior Probability P(State=Yes) | Posterior Probability and Change Rate P(State = Yes) | |||||
|---|---|---|---|---|---|---|---|
| Minor | Change Rate% | Substantial | Change Rate% | Destroyed | Change Rate% | ||
| U1 | 0.2385 | 0.0801 | –66.42 | 0.2513 | 5.37 | 0.4589 | 92.41 |
| U11 | 0.2184 | 0.1896 | –13.19 | 0.2207 | 1.05 | 0.2585 | 18.36 |
| U12 | 0.0805 | 0.0674 | –16.27 | 0.0815 | 1.24 | 0.0986 | 22.48 |
| U13 | 0.2184 | 0.1773 | –18.82 | 0.2217 | 1.51 | 0.2756 | 26.19 |
| U14 | 0.2069 | 0.1601 | –22.62 | 0.2107 | 1.84 | 0.2720 | 31.46 |
| U15 | 0.0115 | 0.0068 | –40.87 | 0.0119 | 3.48 | 0.0180 | 56.52 |
| U2 | 0.3551 | 0.1748 | –50.77 | 0.4756 | 33.93 | 0.5506 | 55.05 |
| U21 | 0.2069 | 0.1389 | –32.87 | 0.2523 | 21.94 | 0.2806 | 35.62 |
| U22 | 0.2644 | 0.1650 | –37.59 | 0.3308 | 25.11 | 0.3721 | 40.73 |
| U23 | 0.0460 | 0.0346 | –24.78 | 0.0535 | 16.30 | 0.0583 | 26.74 |
| U24 | 0.0230 | 0.0166 | –27.83 | 0.0273 | 18.70 | 0.0299 | 30.00 |
| U3 | 0.2000 | 0.1096 | –45.20 | 0.2863 | 43.15 | 0.2844 | 42.20 |
| U31 | 0.1264 | 0.1059 | –16.22 | 0.1460 | 15.51 | 0.1456 | 15.19 |
| U32 | 0.0460 | 0.0384 | –16.52 | 0.0532 | 15.65 | 0.0530 | 15.21 |
| U33 | 0.0460 | 0.0331 | –28.04 | 0.0582 | 26.52 | 0.0580 | 26.08 |
| U34 | 0.2184 | 0.1753 | –19.73 | 0.2596 | 18.86 | 0.2586 | 18.40 |
| U4 | 0.0682 | 0.0233 | –65.84 | 0.0827 | 21.26 | 0.1251 | 83.43 |
| U41 | 0.0345 | 0.0303 | –12.17 | 0.0358 | 3.77 | 0.0397 | 15.07 |
| U42 | 0.0805 | 0.0660 | –18.01 | 0.0851 | 5.71 | 0.0988 | 22.73 |
| U43 | 0.0003 | 0.0002 | –33.33 | 0.0003 | 0.00 | 0.0003 | 0.00 |
| U44 | 0.0230 | 0.0157 | –31.74 | 0.0253 | 10.00 | 0.0322 | 40.00 |
| U45 | 0.0345 | 0.0224 | –35.07 | 0.0384 | 11.30 | 0.0497 | 44.06 |
Table 4.
Diagnosis inference result for pilot factors.
| Factor Description | Prior Probability | Posterior Probability | Change Rate % |
|---|---|---|---|
| U11 | 0.2184 | 0.3569 | 63.42 |
| U12 | 0.0805 | 0.1432 | 77.89 |
| U13 | 0.2184 | 0.4161 | 90.52 |
| U14 | 0.2069 | 0.4319 | 108.75 |
| U15 | 0.0115 | 0.0340 | 195.65 |
Table 5.
Diagnosis inference result for aircraft factors.
| Factor Description | Prior Probability | Posterior Probability | Change Rate% |
|---|---|---|---|
| U21 | 0.2069 | 0.4501 | 117.54 |
| U22 | 0.2644 | 0.6198 | 134.42 |
| U23 | 0.0460 | 0.0865 | 88.04 |
| U24 | 0.0230 | 0.0459 | 99.57 |
Table 6.
Diagnosis inference result for environmental factors.
| Factor Description | Prior Probability | Posterior Probability | Change Rate% |
|---|---|---|---|
| U31 | 0.1264 | 0.3079 | 143.59 |
| U32 | 0.0460 | 0.1129 | 145.43 |
| U33 | 0.0460 | 0.1595 | 246.74 |
| U34 | 0.2184 | 0.5999 | 174.68 |
Table 7.
Diagnosis inference result for management factors.
| Factor Description | Prior Probability | Posterior Probability | Change Rate% |
|---|---|---|---|
| U41 | 0.0345 | 0.1205 | 249.28 |
| U42 | 0.0805 | 0.3800 | 372.05 |
| U43 | 0.0003 | 0.0014 | 366.67 |
| U44 | 0.0230 | 0.1744 | 658.26 |
| U45 | 0.0345 | 0.2844 | 724.35 |
© 2020 by the authors. Licensee MDPI, Basel, Switzerland. This article is an open access article distributed under the terms and conditions of the Creative Commons Attribution (CC BY) license (http://creativecommons.org/licenses/by/4.0/).
Share and Cite
MDPI and ACS Style
Xiao, Q.; Luo, F.; Li, Y. Risk Assessment of Seaplane Operation Safety Using Bayesian Network. Symmetry 2020, 12, 888. https://doi.org/10.3390/sym12060888
AMA Style
Xiao Q, Luo F, Li Y. Risk Assessment of Seaplane Operation Safety Using Bayesian Network. Symmetry. 2020; 12(6):888. https://doi.org/10.3390/sym12060888
Chicago/Turabian StyleXiao, Qin, Fan Luo, and Yapeng Li. 2020. "Risk Assessment of Seaplane Operation Safety Using Bayesian Network" Symmetry 12, no. 6: 888. https://doi.org/10.3390/sym12060888
Note that from the first issue of 2016, this journal uses article numbers instead of page numbers. See further details here.