Developing a Strategy to Improve Handling Behaviors of a Medium-Size Electric Bus Using Active Anti-Roll Bar


1
Department of Vehicle Engineering, National Taipei University of Technology, Taipei 10608, Taiwan
2
College of Mechatronic Engineering, Guangdong University of Petrochemical Technology, Maoming 525000, China
*
Author to whom correspondence should be addressed.
Symmetry 2020, 12(8), 1334; https://doi.org/10.3390/sym12081334
Submission received: 15 June 2020
/
Revised: 2 August 2020
/
Accepted: 6 August 2020
/
Published: 10 August 2020
(This article belongs to the Special Issue Selected Papers from IIKII 2020 Conferences II)
Abstract
:Electric vehicles are a major trend in research and development in the automobile industry. A vehicle’s handling ability is changed when the structure of the power system is altered, which is more obvious in medium-sized buses with higher load and a longer body whose body stiffness is relatively less stiff. In this context, flexible multi-body dynamic modeling, instead of rigid body modeling, is used to reflect the stiffness effects of the vehicle body and chassis systems. A control strategy is developed with an active variable stiffness anti-roll bar to improve vehicle handling characteristics by using the flexible body dynamic simulation with consideration of the step and single sinusoidal steering input tests. Through simulation, it was learned that the proposed control strategy could reduce the time of stabilization by 54.08% and suppress undesired handling behaviors in the step steering input test. Moreover, at high speed, the original unsteady condition became stabilized with little sacrifice in yaw velocity. In the single sinusoidal steering input test, the time of stabilization could be reduced by 8.43% and with 14.6% less yaw angle changes in the improved design. The overall handling was improved.
1. Introduction
Internal combustion engine vehicles have been developed for many years, and most of the techniques used in passenger cars nowadays are based on internal combustion engine vehicles. However, factors such as the oil crisis and the rise of environmental conservation awareness have led the vehicle industry towards energy-saving and carbon-reducing development. In addition to improving the efficiency of the internal combustion engine and to developing hybrid electric vehicles, the advantages of electric vehicles, like zero-emission and zero pollution, have become the focus of research and development of various vehicle manufacturers. Most electric vehicles only replace the power systems with electric motors, but the differences in the engine power curve, the increase of overall battery load, and the shifts of the center of gravity configuration, etc. can change the vehicle steering characteristics and may directly affect the vehicles’ handling behaviors. This research focused on the control strategy development of a set of active anti-roll bars to improve vehicle handling characteristics by using the flexible body dynamic simulation. With the help of simulation, the development time and number of iterations could be significantly reduced.
Ambrósio et al. [1] proposed a flexible multi-body dynamic simulation method for vehicle research, and used ANSYS to build a flexible vehicle body for simulation. The final result was greatly different from the rigid body model. In their study, the road bump scenario showed that the flexible model had much higher accelerations and a more uneven response than the rigid model. Moreover, in the directional response of handling, quantified by the time required for lateral acceleration, the rigid body model had a higher tendency to oversteer. The flexible model had a slightly slower response than that of the rigid model which could quickly develop the maximum lateral acceleration for the turning situation. The differences between flexible and rigid models in terms of lateral position and acceleration could be up to 20%. Oversteer in general was not desired since the vehicle became difficult to drive at higher speeds. Suh et al. [2] performed a dynamic stress analysis on a vehicle frame, which imported a flexible body model into a multi-body mechanical model for stress analysis, and the analysis results showed that the accuracy of flexible body model was improved by 14.42% compared to rigid bodies Ma et al. [3] used HyperWorks to build a flexible body model of the car shell, which integrated into the ADAMS multi-body dynamics software for comfort simulation analysis, and its result was afterward compared with the result from actual experiment. In terms of lateral acceleration, the results of flexible body model are much closer to the measured results than those of the rigid body model. Gonçalves et al. [4] optimized the comfort and handling of a flexible multi-body dynamic model of a car body, using the spring stiffness and damping coefficient of the suspension system as variable parameters, and optimizing the comfort by the driving performance index. Mirone [5] established a flexible body model of a go-kart frame. After verification, a multi-body dynamic simulation with fixed circle test was performed, and the rigidity of the frame was changed numerically. The results confirmed the argument that frame rigidity affected vehicle handling performance. Shiiba et al. [6] performed a constant-speed pulse steering test on a baseline model and on the same baseline model but with added structural members to increase the rigidity of the frame. These two frames had yaw rate and steady state gain differences numerically and experimentally. Guo et al. [7] used a numerical calculation to simulate a quarter car suspension model, and controlled hysteresis damping with an adaptive neural control system to improve vehicle comfort. Azadi et al. [8] established a rigid-flexible multi-body dynamic model and designed a body dynamic control system. Their results concluded that the flexible body model was more realistic than rigid bodies, and was more suitable for dynamic control.
Zhang et al. [9] used the AGC-ViewerG stereo observation system to test the closed-loop handling characteristics of the vehicle. They put forward that the vehicle visualized experimental system could observe the vehicle dynamics, and measuring the values of the experiments, which could save the cost and improve the quality of the experiments. Angel et al. [10] designed a control system and a control logic through the optimization method to control the air spring and magnetorheological damper parameters in order to improve vehicle handling and comfort. Darling et al. [11] established a prototype active anti-roll bar control system to control its damping solenoid valve with a simple control system. A Ford Fiesta Mark II was used as the platform for the active roll control study. With limited changes to the existing system and the active components had to be accommodated within a very limited envelope. Its actuator connected the anti-roll bar to the suspension tie rods. As a result, in the circular steering test, the prototype vehicle demonstrated excellent steady state and dynamic roll cancellation within the lateral acceleration range of 0.5 g. The comparison between the active and passive roll response is quite dramatic with body roll being reduced by over 80%.
Cronje et al. [12] designed an active anti-roll bar to improve the handling performance of off-road vehicles, and used the commercial software, ADAMS, to establish a multi-body dynamic simulation, and verified the initial model through actual experiments. After improvement, the roll angle was much lower than the original model. Vu et al. [13] used numerical calculations to simulate a heavy vehicle with an active anti-roll bar, and used a secondary linear regulator to find the best control strategy based on lateral load transfer to improve rollover of heavy vehicles. Danesin et al. [14] designed an active rolling control system to increase vehicle handling and comfort. The roll stiffness of the front and the rear axle was changed based on vehicle lateral acceleration, and the simulation results were verified by actual vehicle experiment. Struss and Urbach [15] designed a set of variable stiffness anti-roll bars. They used a device which was a fluid coupling filled with an electrorheological fluid that could be actuated for varying the torsional stiffness of the portion of the anti-roll bar. At least one sensor senses a vehicle characteristic and generates a signal indicative of the sensed vehicle characteristic.
In the earlier research, not many focused on developing control strategy to improve handling utilizing flexible multi-body models with active variable stiffness/damping anti-roll bar, especially not much for medium-size electric buses nor for electric buses. In a highly dense population area, medium-size buses are one common mass transportation system. A medium-size electric bus is used as the target vehicle. The longer vehicle body become less stiff, and the rigid body model relatively would not be a perfect fit for this less stiff type of vehicle. Since it is an electric vehicle, the power system and the load distribution are not the same as the regular gasoline engine vehicles. It is different from commonly seen cases. Based on earlier study, there can be more than 20% differences between rigid body and flexible body in lateral position and lateral acceleration [1], and flexible body model was more realistic than rigid body one [8]. Therefore, in this research, a multi-body dynamic simulation of the coupling flexible body for a medium-size electric bus was carried out and a set of control strategy for the active anti-roll bar system was proposed, under the premise that the movement such as the pitch of Y-axis, the vertical displacement of Z-axis, and the vibration of suspension system caused by road surface were not affected. The objective is to study the handling performance of this medium-size electric bus and to improve the vehicle stability by reducing the severe oversteering and unstable condition. The proposed control strategy was based on the steering characteristics to provide a quick response in order to adjust the stiffness and damping of the anti-roll bar. The system was designed to alter the roll stiffness and the damping coefficient of the suspension system during different steering maneuvers.
2. Research Background
This study used the finite element vehicle body built by Lin [16] and the flexible multi-body dynamic chassis model built by Yang [17], and incorporated both models into the commercial software, HyperWorks. All the rest model build, and settings of material properties for all components and boundary conditions were done in HyperWorks/Optistruct, and then utilized the Craig-Bampton substructure modal method [18,19] to create the flexible bodies which were then fed into HyperWorks/MotionView to set up all the joints and connections for all of the parts, as well as the tire model and the pseudo-road for the flexible multi-body dynamic analyses. The analyses were performed using HyperWorks/MotionSolve.
2.1. Specifications of the Simulation Model
2.2. Flexible Body Model
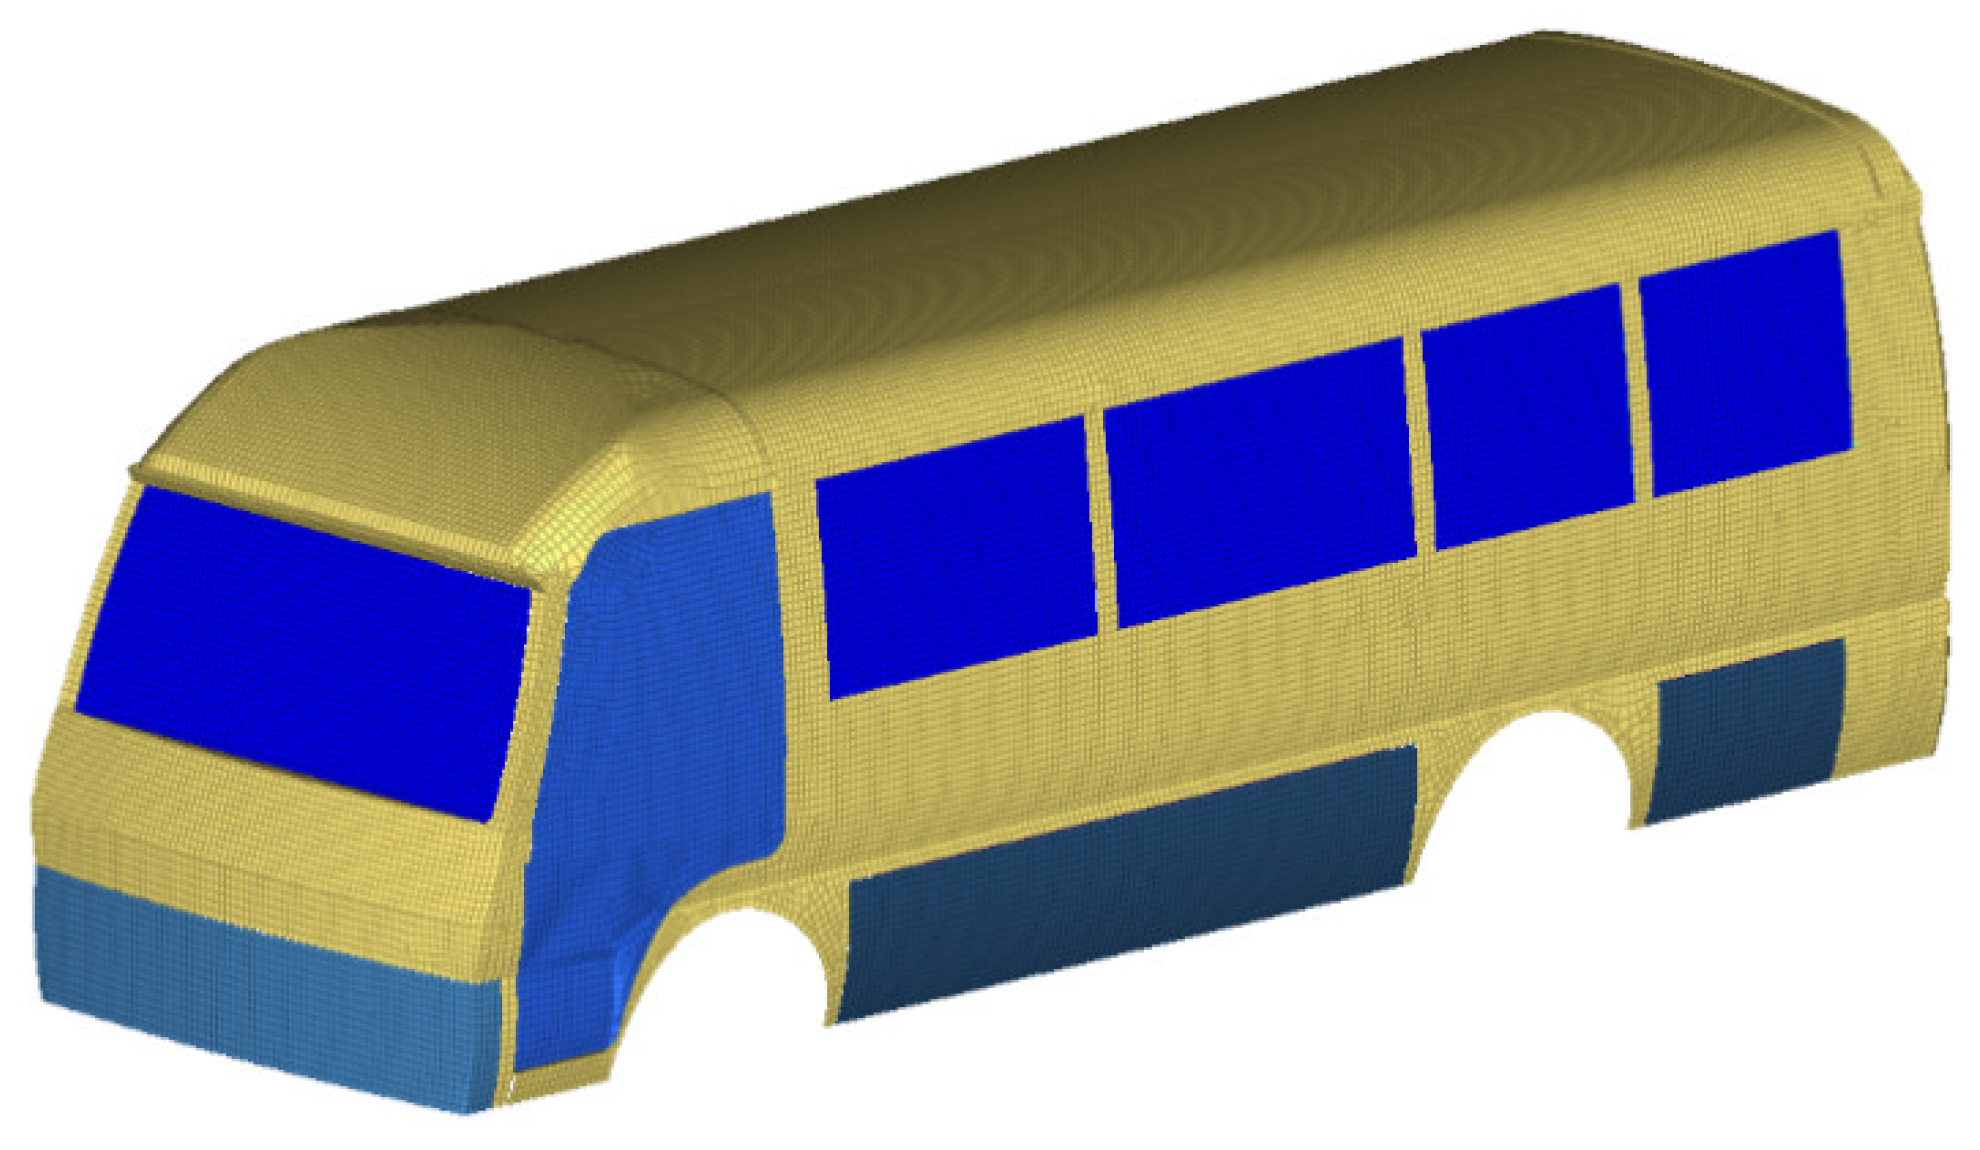
The vehicle was mainly constructed from the vehicle body, powertrain/power, and chassis system. The vehicle body included body frame, floor panels, body panels, seats, interior/exterior trim items and front/rear bumpers. All vehicle body components used fixed joints to connect to the body frame. Therefore, the whole vehicle body was treated as one flexible body which was then decked onto the chassis main frame, shown in Figure 2. The rest chassis components and powertrain/power systems were mounted to the chassis frame.
In this study, flexible bodies were used in the multi-body dynamic analysis. In order to account for the flexibility of bodies, the Craig–Bampton substructure modal method was used. This method reduced the degrees of freedom of the finite element model to the interface degrees of freedom and a set of normal modes, and significantly reduced the analysis time. The interface points were the connecting, constrained or force applied points. The chassis main frame had twelve interface points which the body or chassis components mounted on. This study used the medium-size electric bus with a non-integrated type of chassis, which was body on frame type of vehicle structure. The forces and interaction were through the interface points. The whole vehicle body was treated as one flexible body, and only global body normal modes were chosen for the flexible multibody dynamic analyses. The local modes of body components were not included. The flexible body model contained all the components of the body and the frame, and the global modes, such as torsion and bending modes. In the modal analysis, no damping or constrains were applied. The chassis main frame, body frame, and body panels are presented in Figure 2, Figure 3 and Figure 4, respectively.
2.3. The Multi-Body Dynamic Model of the Chassis
The construction of the chassis includes the transmission system, the steering system, the suspension system, and the tires. The vehicle model used in this research was a non-integrated type chassis, and its components were installed on the chassis rails.
2.3.1. Transmission System
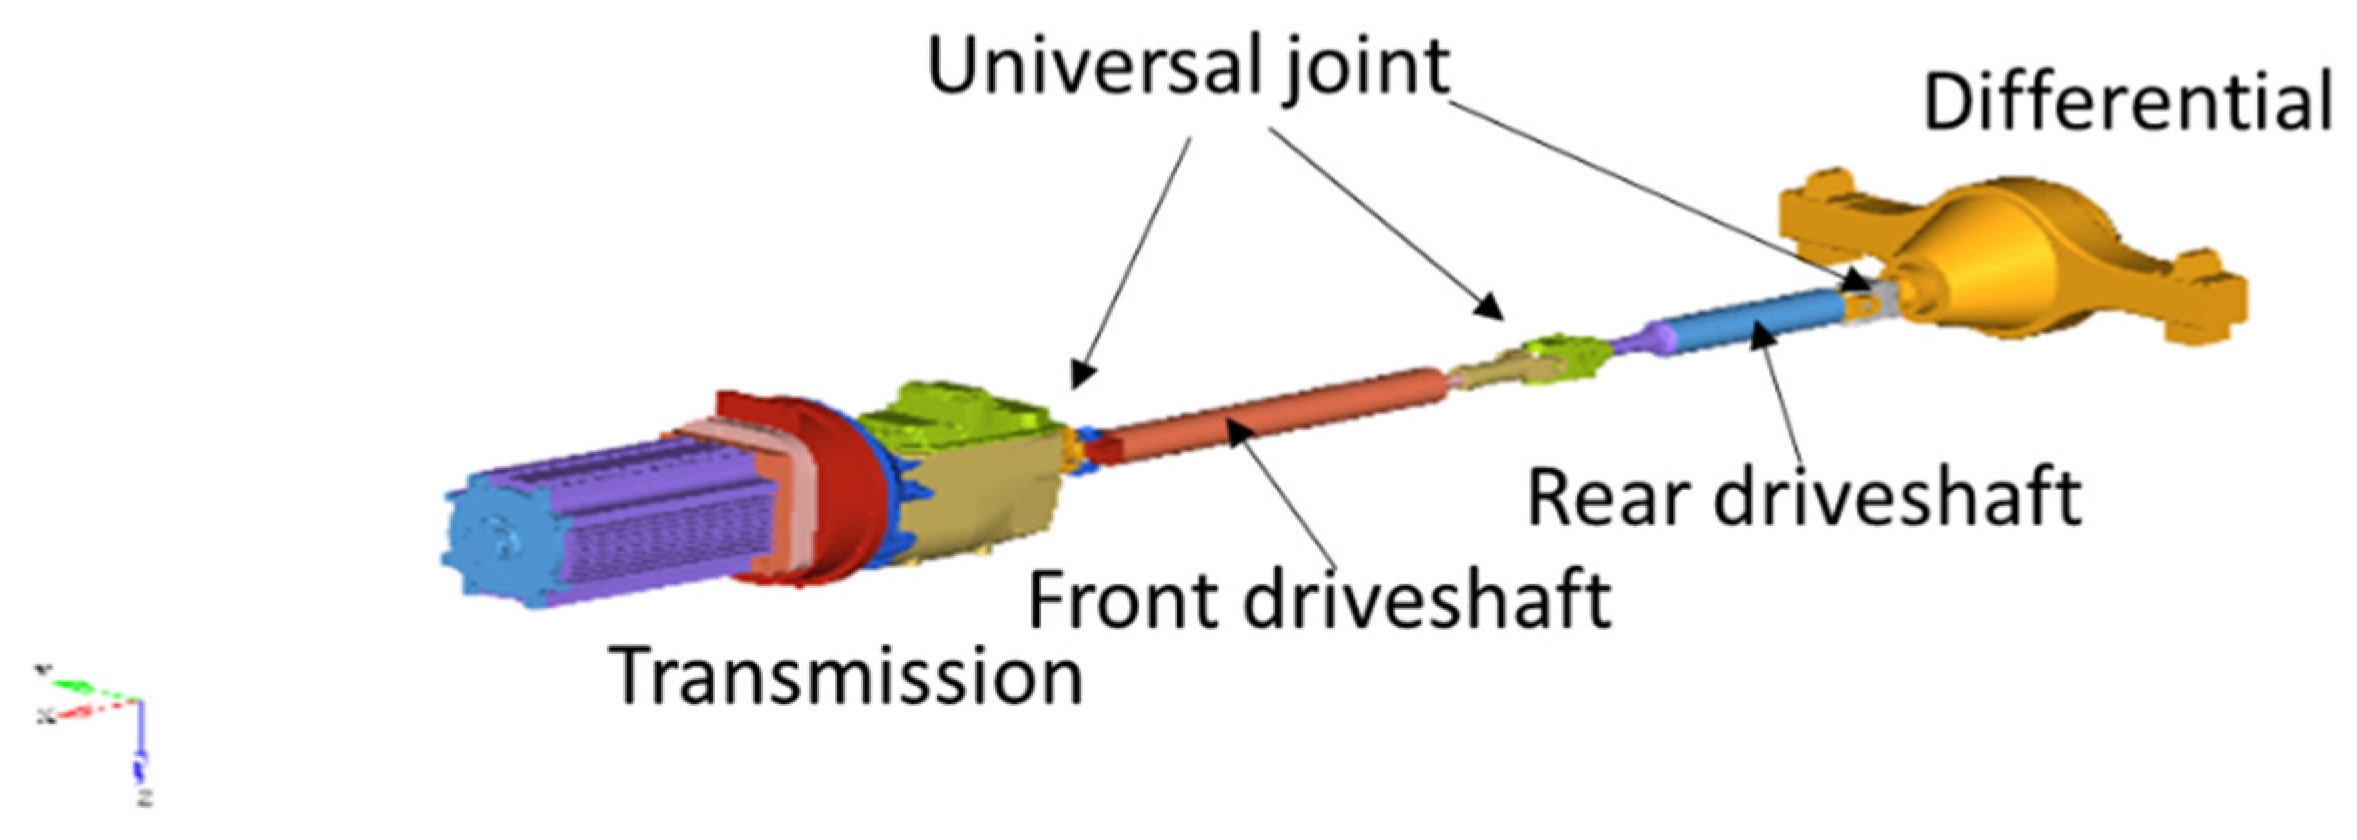
Based on the research purpose, the test was focused on the vehicle response in different steering maneuvers, and the vehicle motion in the lateral direction was measured. To prevent the interference from longitudinal motion, the longitudinal motion of vehicle was carried out at a fixed speed. The driveline system provided a steady torque to maintain the vehicle speed, and the variation of powertrain output was not included the modeling. Without considering the vibration changes in power transmission, the construction could be simplified. The universal joint was a standard connection applied in the long driving shafts of buses and trucks. As the same joint applied in the target electric bus, the universal joint was retained to connect the transmission and the differential so that the vibration of the suspension system could be truly simulated during the test. In the test, the drive shaft drove the rear wheels directly with a speed command. The simulation results of the handling characteristic were obtained without considering the influence of the transmission system. The transmission system construction is shown in Figure 5, and the connections of the transmission components are shown in Table 2.
2.3.2. Steering System
The steering system used in the simulation test was the pitman arm steering system, which had a four-bar double swing mechanism, was often used in steering system with integral front suspension, and conformed to Ackermann steering geometry. The steering force in the simulation test was entered by the rotational joint between the gearbox, fixed to the chassis rail, and the pitman arm. The construction of the steering system and connection methods of the components are shown in Figure 6 and Table 3, respectively.
2.3.3. Suspension System
The leaf spring used in this simulation test was built up by beam element, which was able to endure the force and deform. Each steel plate was divided into eight equal pieces. Each beam element was connected to each other by a fixed joint, and its center point was connected to the axle in a fixed way. The front end was connected to the spring hanger, which was connected to the beam. The rear end was first connected to the spring shackle, and then connected to the chassis rail with the spring hanger. The suspension system included the displacement in longitudinal direction. The side friction between the upper and lower steel plates was not included in the simulation. The leaf spring was made of AISI5160 manganese steel; its mechanical properties were shown in Table 4. After simulation measurement, the equivalent vertical stiffness of the front and rear leaf spring was 490.15 N/mm and 146.96 N/mm, respectively. The upper ends of the four shock absorbers were connected to the chassis beam by rotational joints, and the lower end was connected to the front and rear axles by rotational joints. All of the shock absorbers were vertically installed between the chassis rail and the axle. The upper and lower components of the shock absorbers were connected to each other by cylindrical joints, as shown in Figure 7 and Table 5. According to the mass-spring-damper system, the damping ratio was set to 0.7, and the damper values of front and rear suspension were 315 Ns/mm and 525 Ns/mm, respectively. The parameters are shown in Table 6.
2.4. Model of the Tires and Road Surface
HyperWorks/MotionView built-in LIALA/HTIRE tire model was used and calculated with the COSIN road modeling to simulate the behavior of tire during driving such as longitudinal slip, lateral slip, and tire deformation delay, which might seriously affect the handling characteristic of the vehicle. The effective diameter of the tire was calculated to be 627 mm, the cornering stiffness of the front wheel was 57,502.1 N/rad, and the cornering stiffness of the rear wheel was 84,293.6 N/rad.
2.5. Model of the Anti-Roll Bar
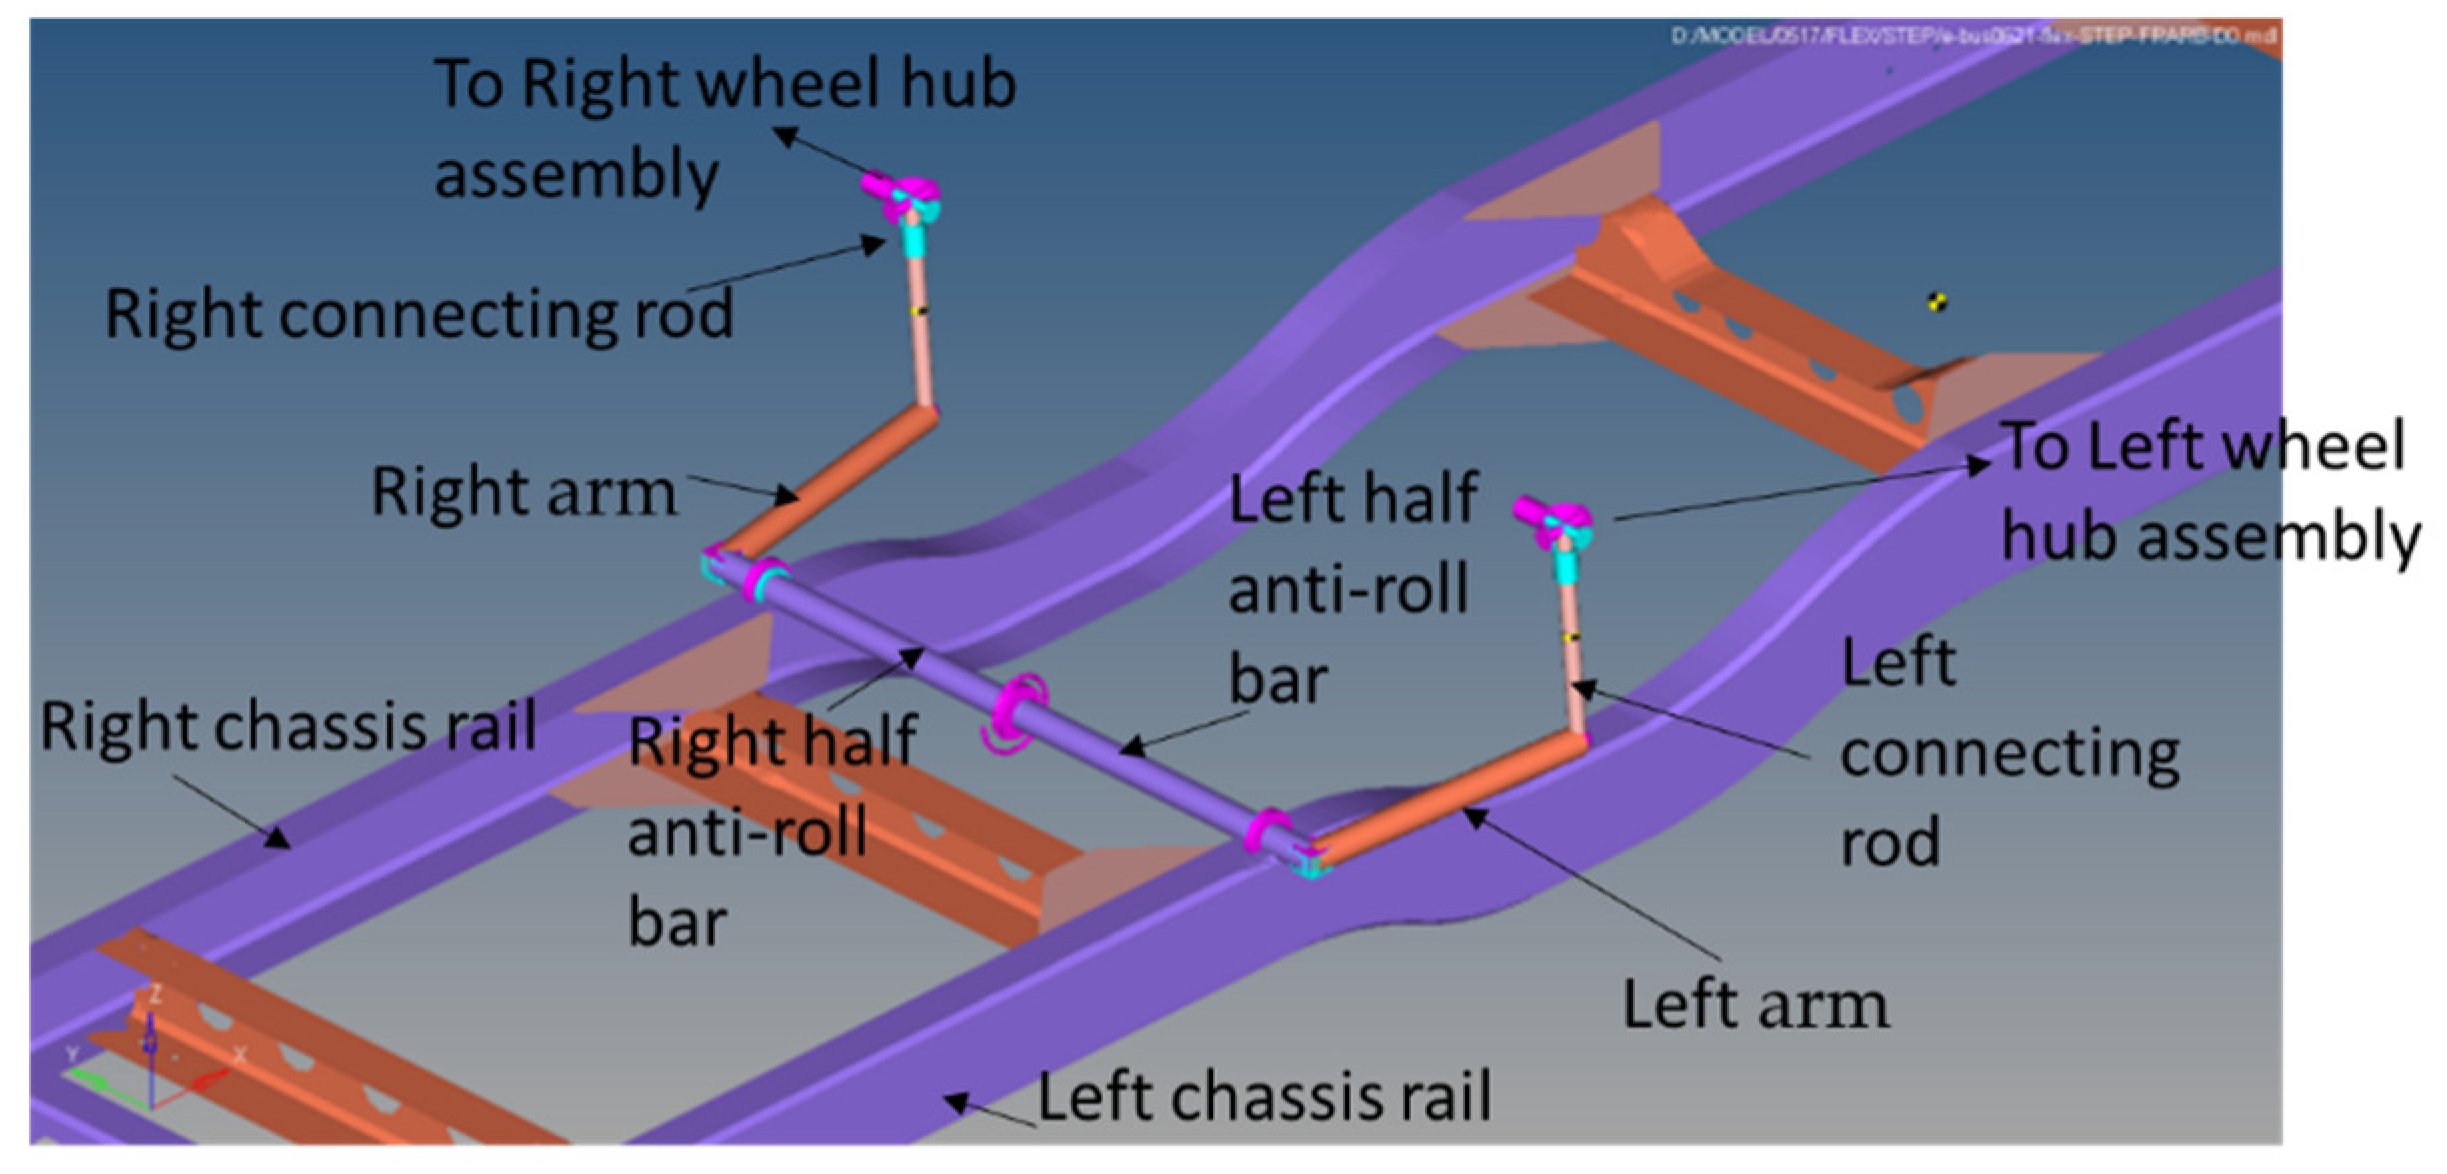
The anti-roll bar was modeled with right/left connecting rods, right/left arms, right/left half anti-roll bars and torsion spring. The torsion spring was used to simulate the controllable variable stiffness of anti-roll bar, located at the center of the anti-roll bar. One end of the connecting rod was connected to the wheel hub assembly using universal joint, and the other end was ball-joined with the arm of the anti-roll bar. The arm then was connected to the half anti-roll bar using fixed joint. The right half anti-roll bar and left anti-roll bar were joined using revolute joint with torsional spring damper. Each half anti-roll bar was hold in place to the chassis rail using revolute joints which allowed the anti-roll bars to rotate with respect to the vehicle chassis and to transform vertical displacement into angular displacement. Two sets of anti-roll bars were used, one at the front of the vehicle and the other at the rear, as shown in Figure 8 and Figure 9. Table 7 shows the part connection of the anti-roll bar.
Based on the vehicle configuration, the anti-roll bar was mounted 468.5 mm forward of the wheel hub, and its diameter was 18 mm, made of manganese steel, as shown in Table 4. The angle of twist, ∅, could be calculated as shown in Equation (1). From Equation (1), the torsional stiffness could be derived as shown in Equation (2), where T was the torque, G was the shear modulus, L was the length of the bar, and J was the cross section’s polar moment of inertia, shown in Equation (3). The torsional stiffness of the anti-roll bar of the vehicle was calculated to be mm/rad.
2.6. Simulation Testing Method
Two kinds of handling characteristic tests were simulated in this research; one was the step steering input test by reference to ISO7401 [21], the other was the input open-loop test of single sinusoidal steering by reference to ISO/TR8725 [22]. Data for the vehicle’s handling characteristics were obtained to numerically compare and analyze the characteristics such as lateral acceleration, yaw velocity, roll angle, and steering characteristic.
2.6.1. Step Steering Input Test
According to the test specification of ISO7401, the testing vehicle must reach the specified speed before inputting the turn signal. The step steering input test is carried out at different speeds, each with incremental interval of 20 km/h. At the same time, the yaw velocity must be in a balanced state within +/−0.5 deg/s. When the turn signal is inputted, the time taken to increase from 10% of the maximum value to 90% must be less than 0.15 s, and the angle of the acceleration pedal is fixed during the test, as shown in Figure 10. This type of test is to simulate the condition whereby a fixed steering angle is suddenly turned, and to evaluate the dynamic stability and steady state performance of the vehicle. It is expected that after the turn signal input, the vehicle path should be a circle with a fixed radius, and the yaw velocity should be a fixed value while vehicle is at a constant speed.
The total simulation time of this test was 50 s. Because the structure and load of the real vehicle were not symmetrical, the suspension system had unsymmetrical deformation and induced unsymmetrical lateral forces on tires. The vehicle had a constant lateral force when the steering was at neutral. A 0.15 degree of steering angle was entered between the 5th and 6th second in order to adjust for the small yaw angle and to keep the vehicle straight continuously up to the 15th second. At the 15th second, a 28-degree steering angle was entered with transition time 0.15 s, and maintained this steering angle until the end of the test, as shown in Figure 10. The vehicle was tested at speeds of 40, 60, and 80 km/h, as shown in Figure 11. In this research, the vehicle was a medium-size electric vehicle with rear-wheel drive. The speed signal was inputted to the rear wheels with angular speeds of 35.436, 53.153, and 70.871 rad/s respectively. The vehicle was not yet stabilized until the 5th second. Therefore, the speed signal was input at the 5th second, and the vehicle was accelerated until the 9th second to reach the target speed, and then maintained the same speed until the end of the test.
2.6.2. Single Sinusoidal Steering Input Test
The speed input specification is the same as the former test as in the test of ISO/TR8725 [23]. The specified vehicle speed must be reached before inputting the turn signal, and the yaw velocity must be balanced. The main difference between the step and single sinusoidal steering input tests is the turn signal. The turn signal is entered with a complete sinusoidal signal at a frequency of 0.5 Hz, allowing a +/−5% error at the first peak of the turn signal. The acceleration pedal is fixed during the test. This type of test is used to simulate the condition of vehicle lane changing with a sinusoidal steering signal suddenly applied, and to evaluate the dynamic peak values of the vehicle during turning and the time of stabilization and all other steady-state performances after the steering returns back to neutral. As a result of the test, the vehicle path should be a single lane change path. After the steering angle returns to the neutral position, the yaw rate will return to zero, and the yaw angle will remain unchanged.
The total simulation time of this test was 30 s. Since the structure and load of this real vehicle were not symmetrical, the suspension system had unsymmetrical deformation and induced unsymmetrical lateral forces on tires. A 0.15-degree steering angle was inputted at the 5th to 6th second to keep the vehicle straight continuously up to the 15th second. After the vehicle was stable, at the 15th second, a single sinewave steering angle input with a frequency of 0.5 Hz and an amplitude of 19.5 degrees was entered. At the 17th second, the end of the steering input cycle, the steering was returned to 0.15 degrees to keep the vehicle straight and maintained that angle until the end of the test. The steering gear angle displacement is shown in Figure 12. The vehicle was tested at speeds of 40, 60, and 80 km/h, as shown in Figure 13.
3. Active Anti-Roll Bar (AARB) Control Strategy
The object of this research is to improve vehicle handling characteristics by developing a control strategy to an active anti-roll bar (AARB), in flexible-body dynamic analysis simulating vehicle hardware tests. Vehicle handling characteristics refer to vehicles’ responses to steering commands and to their environmental inputs that affect vehicles’ direction of motion. Undesired or unexpected handling behavior can cause traffic accidents. Two basic issues in vehicle handling: one is the control of the vehicle direction of motion; the other is the ability to stabilize its direction of motion. Especially, instability in rolling has seriously effects on the handling characteristic of the whole vehicle. Therefore, a set of control strategy for active anti-roll bar system was designed to adjust the roll stiffness and the damping coefficient of the whole suspension system, without or with little effect on the vehicle pitch, in Y-axis, the vertical displacement, in Z-axis, or other movement of suspension system. In this paper, the step steering input test and single sinusoidal steering input test were used for vehicle’s handling characteristic study.
The objective is to improve vehicle handling performance by adjusting the stiffness and damping of the anti-roll bars to reduce the roll angle of the vehicle, to have better control of vehicle direction and to have shorter responding time. The data of lateral acceleration, yaw velocity, roll angle, steering characteristic, and the time of stabilization are all observed. The control strategy is based on the steer characteristics. The design intend is to bring large understeer or large oversteer to be closer to the acceptable range since they are generally better in control within that range. Especially for some dangerous oversteering conditions, the proposed design could help to improve the condition. When oversteer occurred, the strategy is to increase the front rolling stiffness, reducing load shifting to the front outer wheel, increasing the front inner tire traction. That increases the front slip angle, reducing the slip angle differences between the front and rear wheels, reducing vehicle roll angle, and increase the vehicle stability. When the vehicle is understeer too much, the strategy is to increase the rear rolling stiffness, reducing load shifting to the rear outer wheel, increasing the rear inner tire traction, increasing the rear slip angle. The control process is shown in Figure 14, where “” is the subtracting value of the front slip angle and rear slip angle. In the first state, when a < −1°, it is large oversteering. The front anti-roll bar will be activated, and the rear anti-roll bar will be deactivated. In the second state, a > 1°, it is large understeering. The front anti-roll bar will be deactivated and the rear anti-roll bar will be activated. In the third state, when −1° ≤ a ≤ 1°, the steering characteristic is considered acceptable, and the front and rear anti-roll bar systems are both deactivated.
While the vehicle turning, the larger steering angle it was, the larger the lateral force of the tire was subjected to, and the larger rolling angle which was caused by the centrifugal force. When under the same steering angle, a higher vehicle speed would cause a larger instant overshoot and larger stable value in tire lateral force, similarly that caused a larger rolling angle due to the centrifugal force. Therefore, in this study both steering angle and vehicle speed were considered to set the torsional stiffness of the active anti-roll bars, as shown in Equations (4) and (5). and were the torsional stiffness of the front and rear anti-roll bars, respectively, where was the steering angle, was the vehicle speed, and and were magnified factors. The values of and were critical. If they were too high, the torsional stiffness values of the anti-roll bars would become too high and that would cause the tire to lift when the vehicle rolled. If they were set too low, the torsional stiffness values of the anti-roll bars would become too low and the anti-roll bars would lose their purpose for improving vehicle handling. In this study, , , values which are chosen based on the baseline values of and . The damping value was set as 0.7 which was commonly used for the system.
4. Results
4.1. Analysis of the Step Steering Input Test
In the step steering input test, the first 10 s were used to keep the vehicle straight with constant velocity, which was not part of the steering behavior study. The steering angle was turned at the 15th second, therefore the results were recorded starting at the 10th second. This studied vehicle was a medium-size electric bus. Since this chassis system response was within 10 Hz, a low pass filter 10 Hz was used to filter out noise. The time of stabilization was to measure the time entering to and maintaining within the 2% variation range relative to the final converged steady state average value. The total simulation time was 50 s. To easily distinguish between without AARB and with AARB, the locally zoomed-out plot was shown as well.
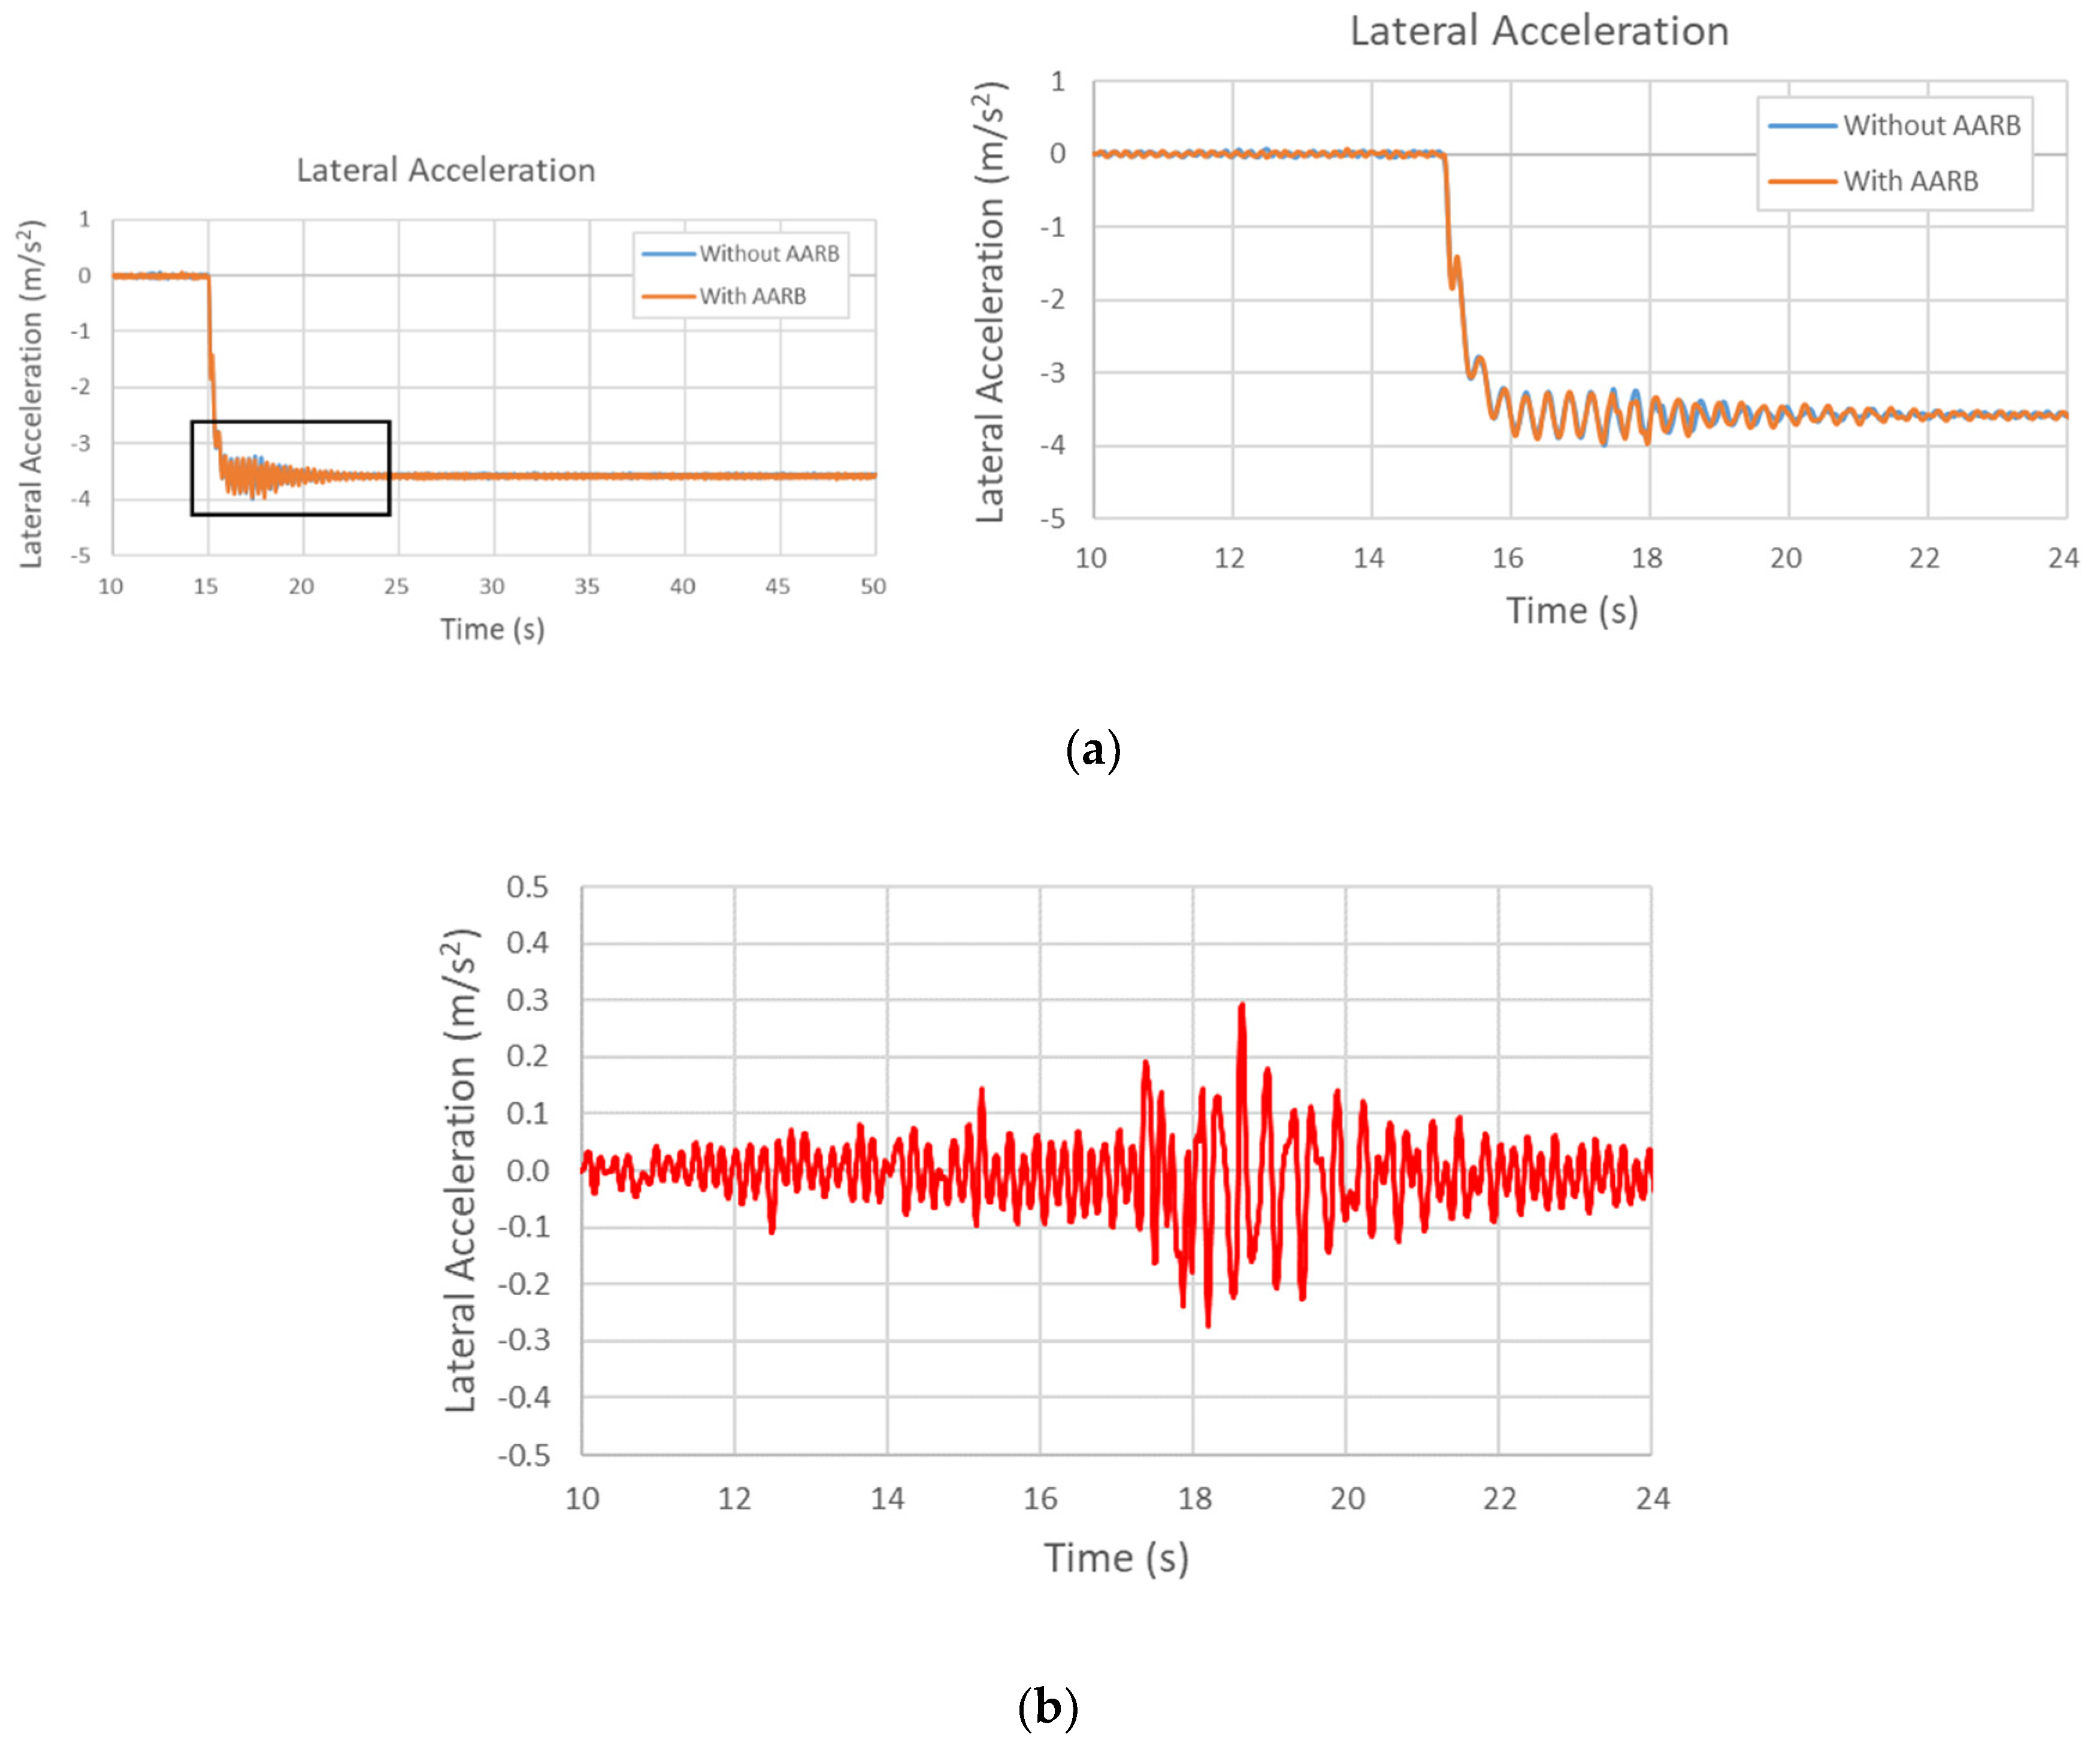
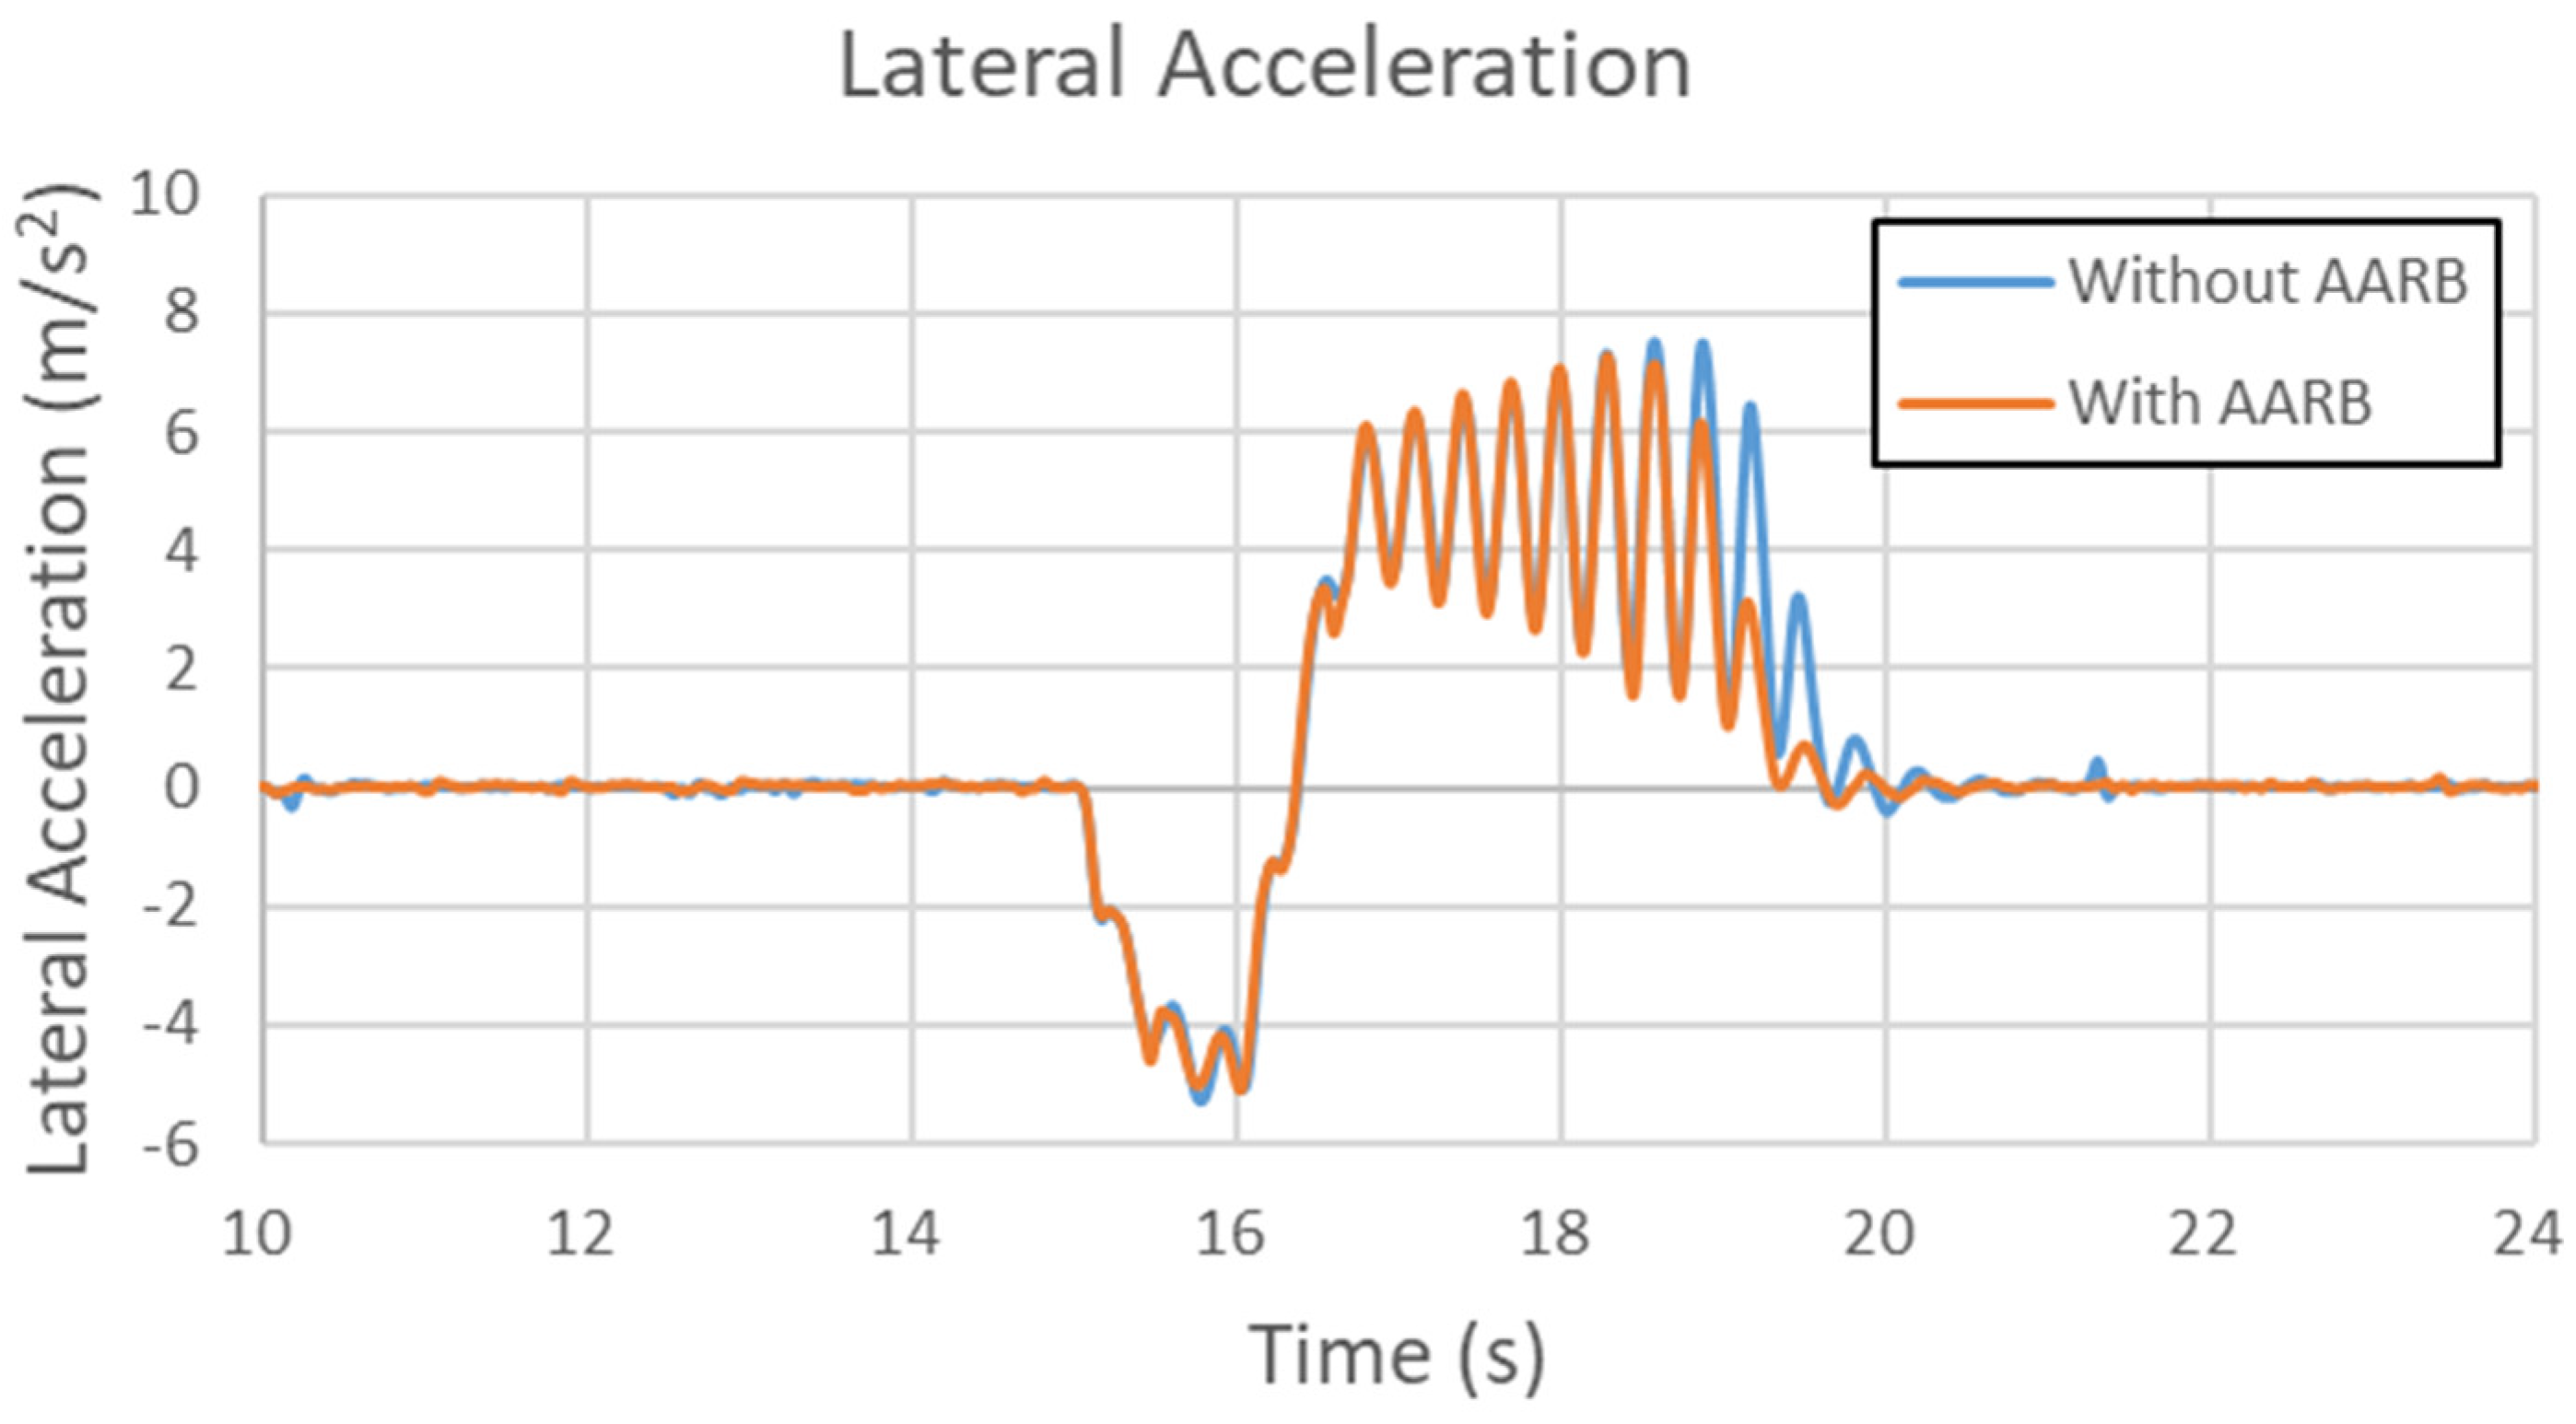
Figure 15, Figure 16, Figure 17 and Figure 18 are the results of the 40 km/h step steering input test. Figure 15a is the lateral acceleration in the 40 km/h step steering input test. The left one shows the whole simulation time frame. To be easily seen the differences between with AARB and without AARB, the locally zoomed-out plot is shown at the right. Figure 15b shows the lateral acceleration difference between with and without AARB, where the maximum difference is within 0.3 m/s2. The steering was turned at the 15th second. The maximum difference happened after the steering was turned, and in the transition to the stable state. At the end, the two had about 0.01 m/s2 difference in the final lateral acceleration. The time taken to reach steady state was around the 21.23 s for the case without AARB, which took about 6.23 s after the steering turned. For the case with AARB, the time to reach the steady state was around the 21.83 s, which took about 6.83 s after the steering turned.
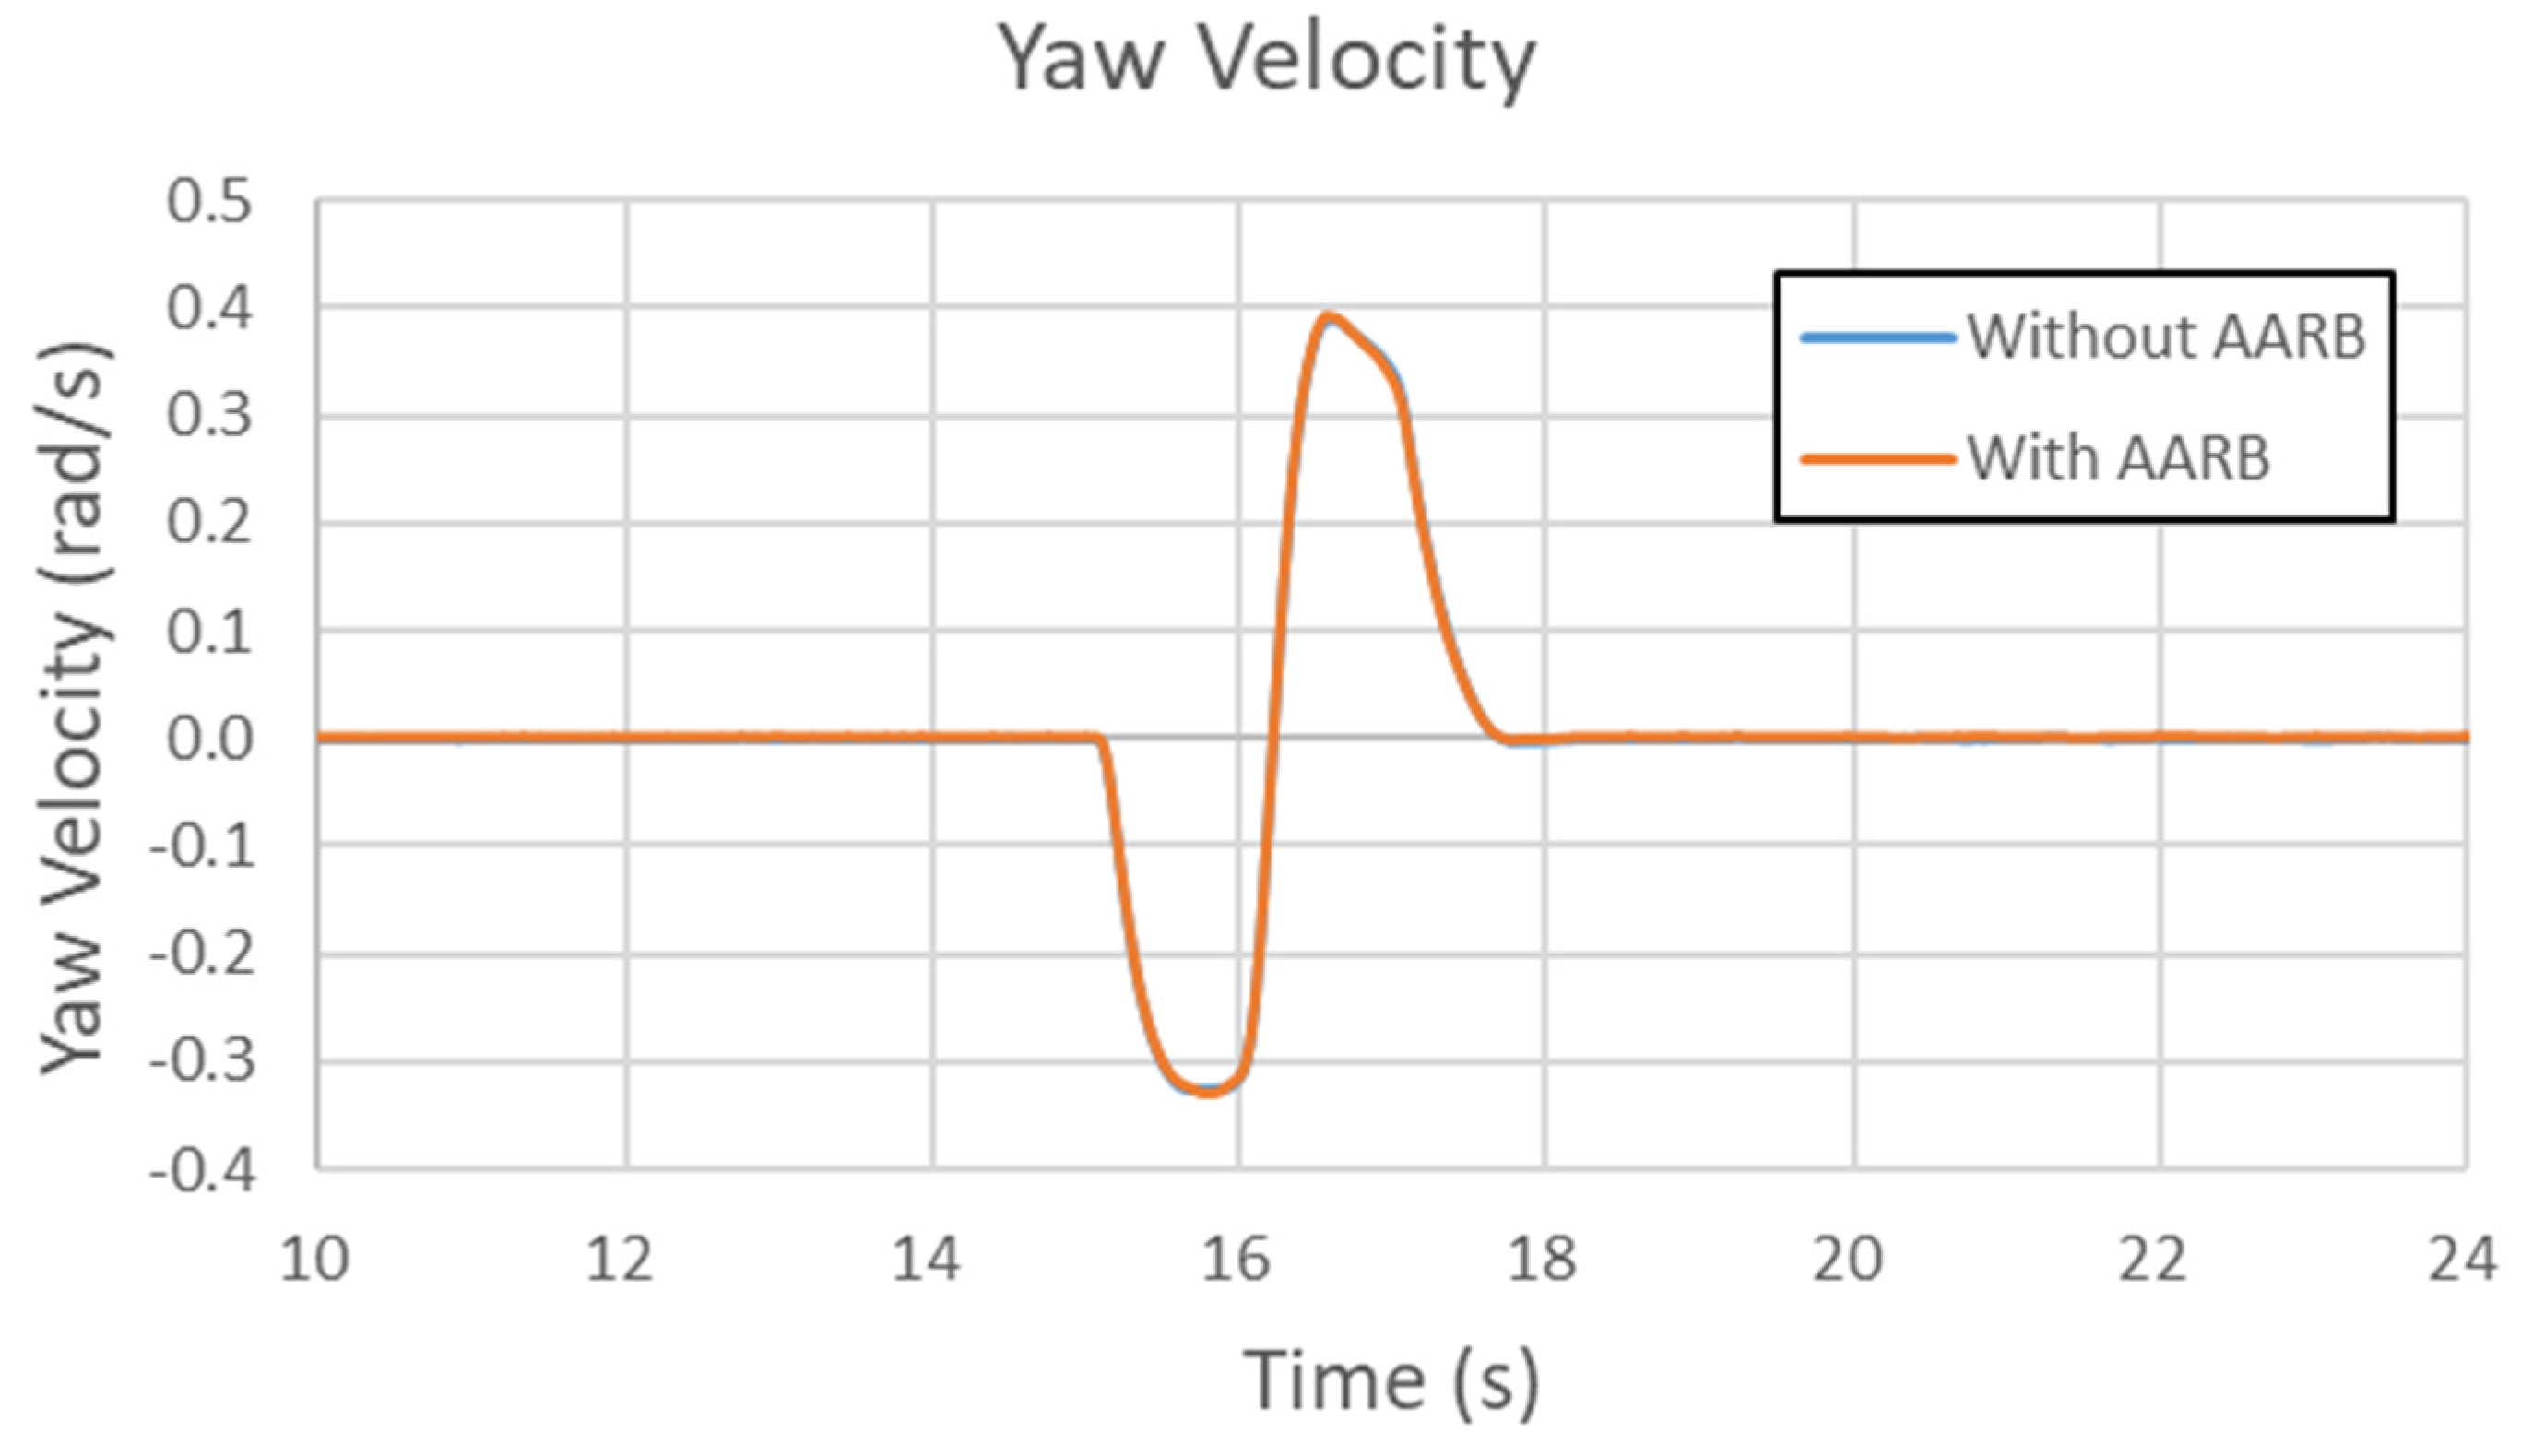
Figure 16a is the yaw velocity in the 40 km/h step steering input test. The left one shows the whole simulation time frame. The right one has the local area zoomed out. Figure 16b shows the yaw velocity differences between with and without AARB, where the maximum difference is within 0.0025 rad/s. Over the 50 s, the difference between the cases with and without AARB kept around 0.002 rad/s in yaw velocity. The both yaw velocity values remained in balanced state. The time taken to reach steady state was around the 15.87 s for the case without AARB, which took about 0.87 s after the steering turned. For the case with AARB, the time taken to reach steady state was around the 15.85 s, which took about 0.85 s after the steering turned.
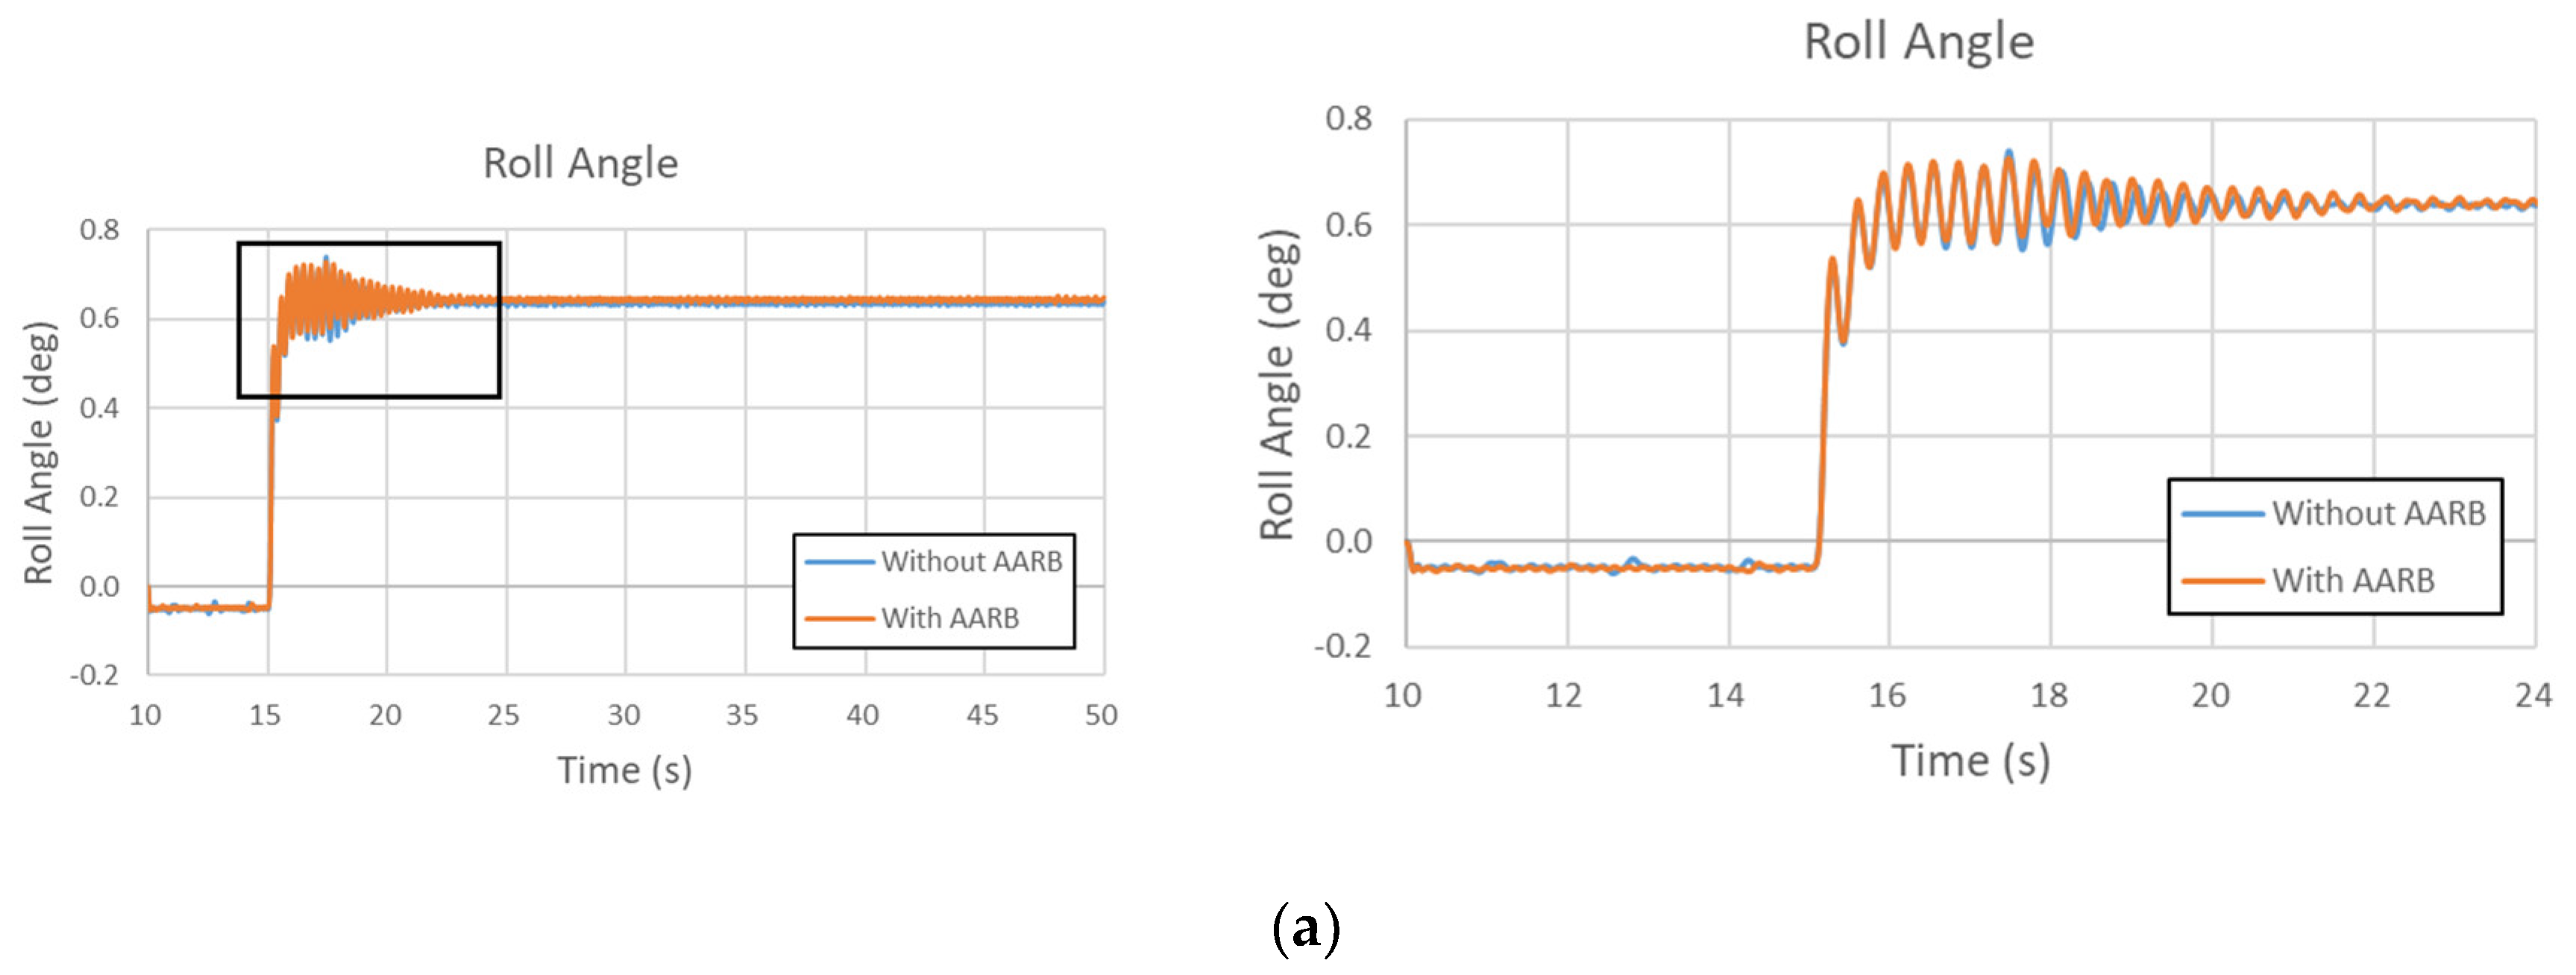
Figure 17a is the roll angle in the 40 km/h step steering input test. The left one shows the whole simulation time frame. The right one has the local area zoomed out. Figure 17b shows the roll angle differences between with and without AARB, where the maximum difference is within 0.035 degrees. Over the 50 s, the final difference between the cases with and without AARB kept around 0.006 degree in roll angle. The time taken to reach steady state was around the 21.22 s for the case without AARB, which took about 6.22 s after the steering turned. For the case with AARB, the time taken to reach steady state was around the 21.84 s, which took about 6.84 s after the steering turned.
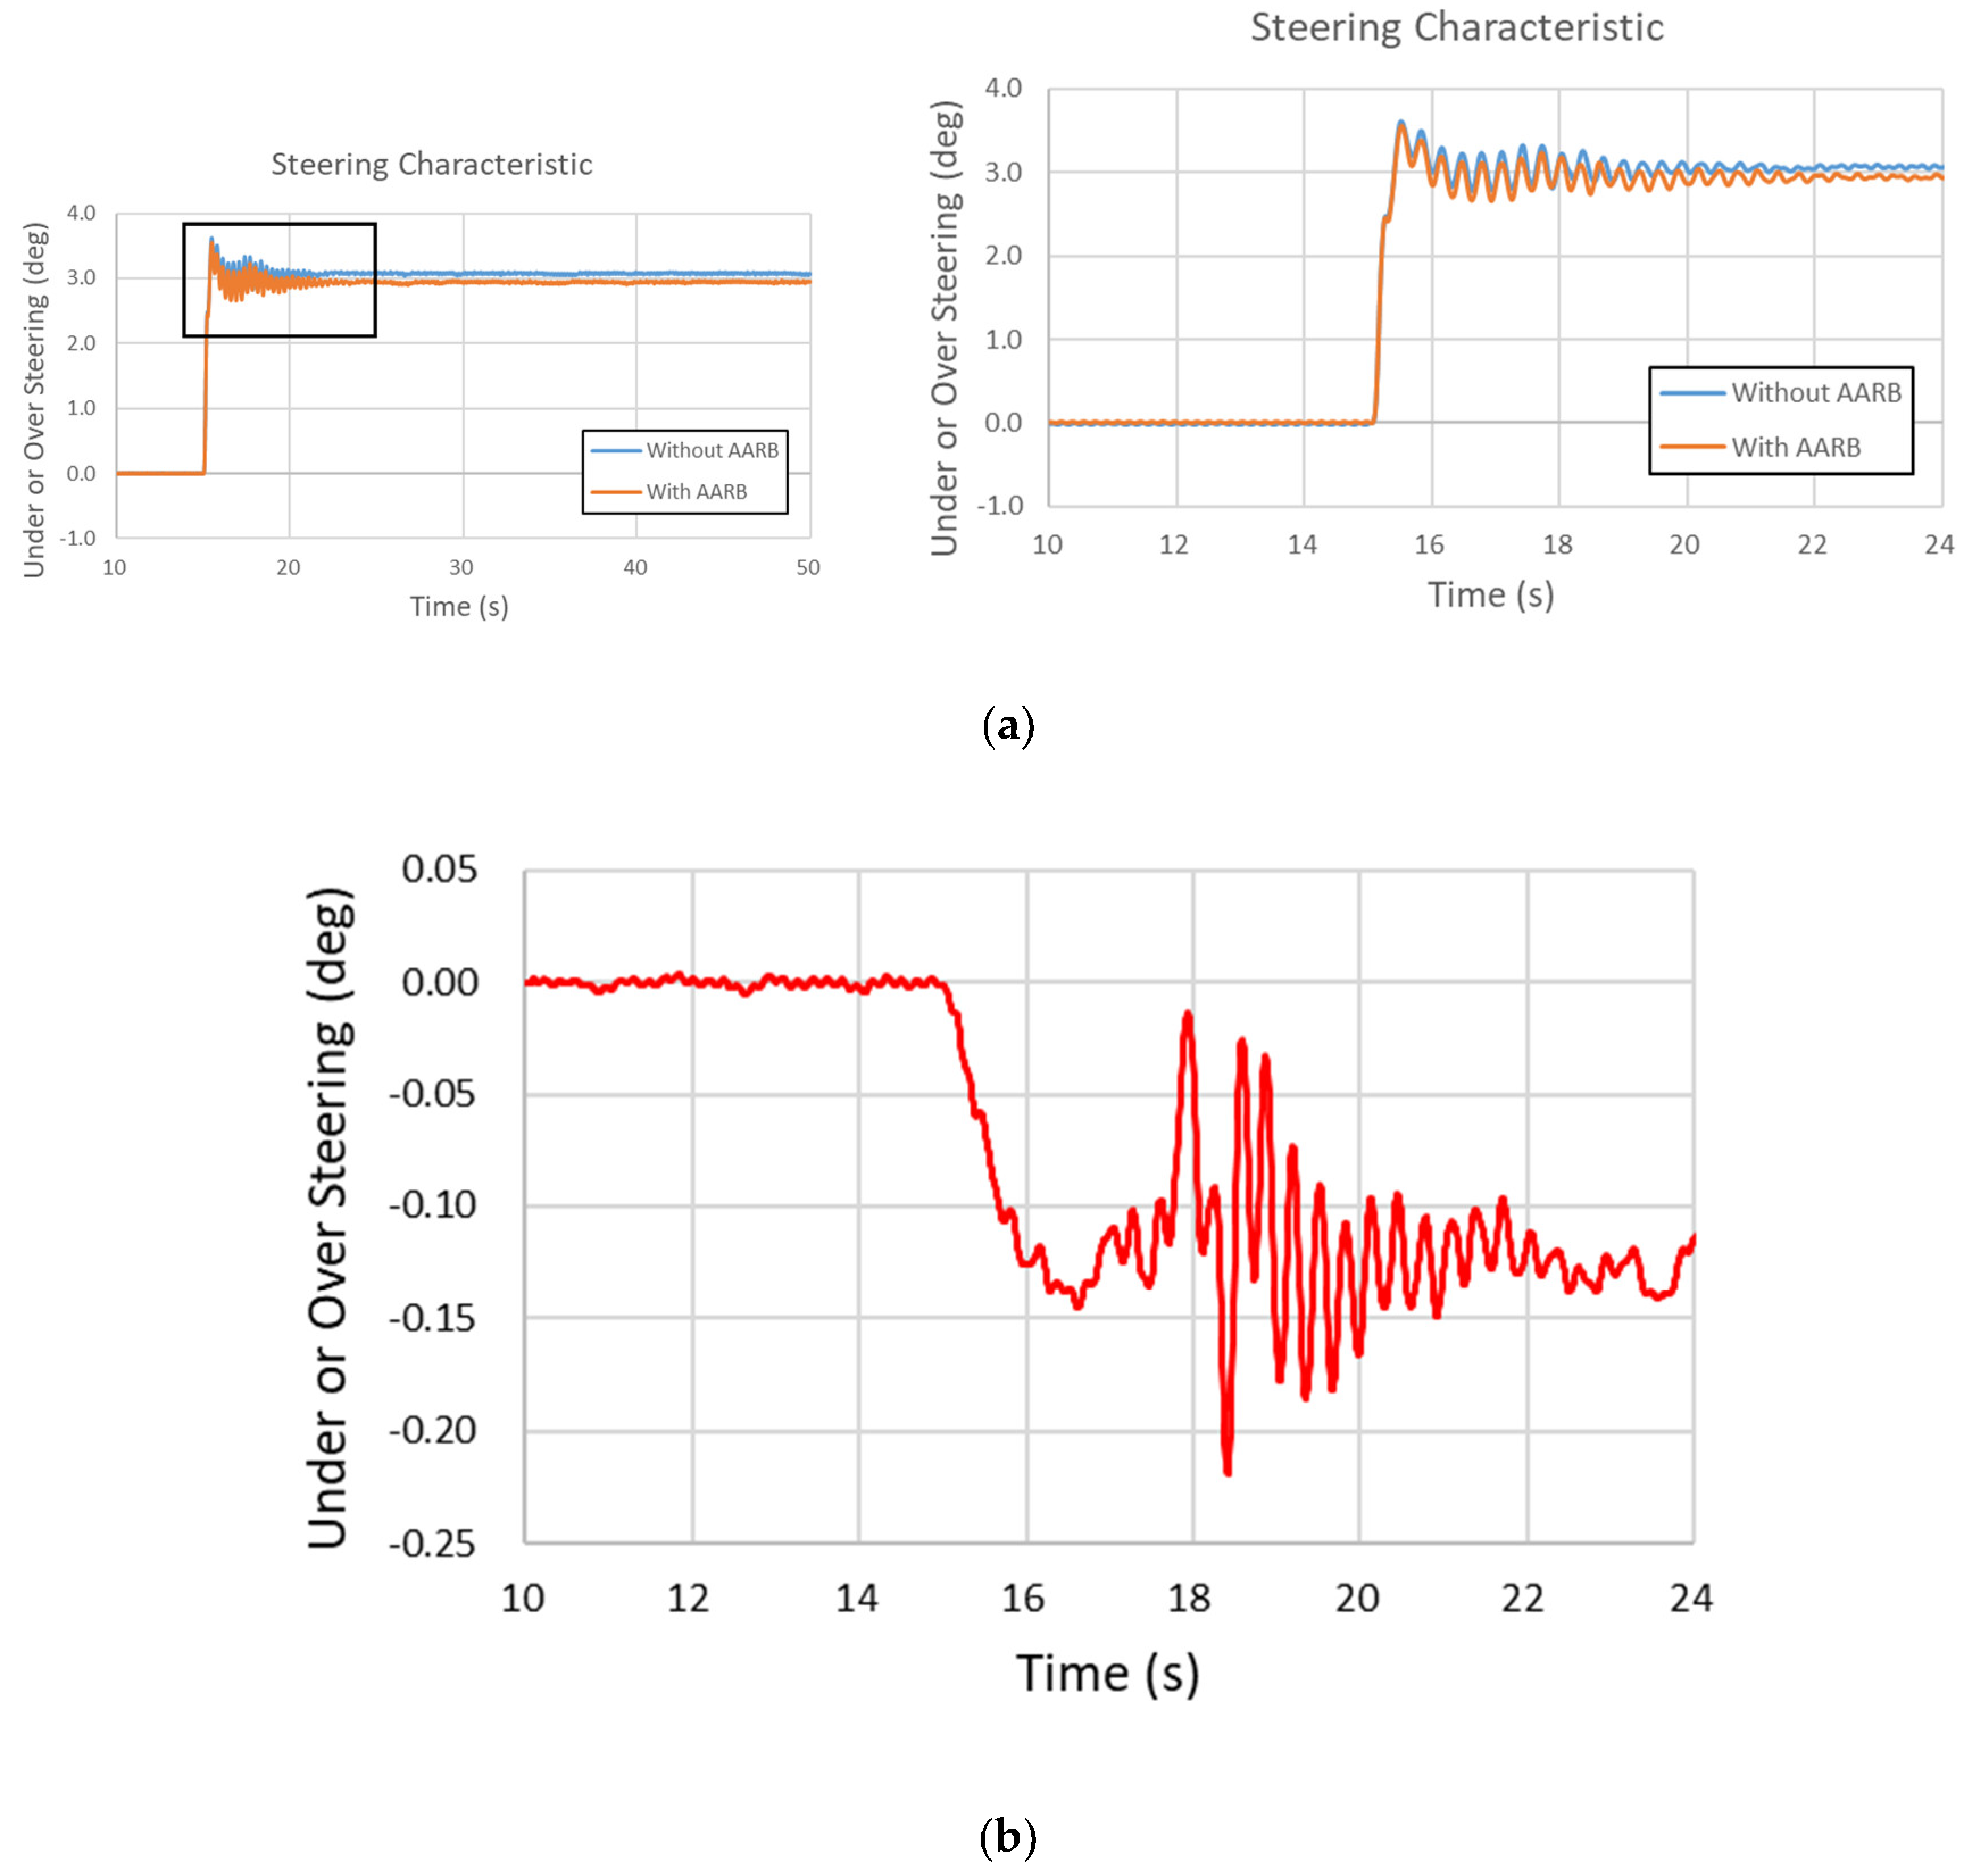
Figure 18a is the steering characteristic in the 40 km/h step steering input test. The left one shows the data of the whole simulation time. The right one has the local area zoomed out. Figure 18b shows the differences between with and without AARB, where the maximum difference is within 0.22 degrees. Over the 50 s, the final value difference between the cases with and without AARB was around −0.12 degrees. The time taken to reach the steady state was around the 20.39 s for the case without AARB, which took about 5.39 s after the steering turned. For the case with AARB, the time taken to reach steady state was around the 21.13 s, which took about 6.13 s after the steering turned.
The comparisons of the data in the 40 km/h step steering input test were summarized in Table 8. The differences between the cases with AARB and without AARB were 0.28% changes in lateral acceleration, −0.6% in yaw velocity, 0.94% in roll angle, and −3.91% in steering characteristic. When the vehicle velocity was 40 km/h, the differences between the cases with AARB and without AARB were not significant. From the simulation results, the rear anti-roll bar stiffness was increased. The roll angle increased by 0.94% caused the front slip angle decreased, but the rear slip angle did not significantly increase, and the yaw velocity was reduced by 0.6%. The difference between the front and rear slip angles was decreased. The steering characteristic of understeering was reduced by 3.91%.
Table 9 lists the stabilization time required from steering turned to vehicle stabilized. To distinguish the time differences, data were presented with two digits after decimal point. The stabilization time differences between the cases with AARB and without AARB for lateral acceleration, yaw velocity, roll angle, steering characteristic, and the total time of stabilization were 9.63%, −2.30%, 9.97%, −13.73%, and 9.79%, respectively. The total stabilization time was used to select the longest time within each case. The stabilization time for steering characteristic had bigger differences between the cases with AARB and without AARB, which was around 13.73%. The one for yaw velocity was the relatively smallest one.
Figure 19, Figure 20, Figure 21 and Figure 22 are the results of the 60 km/h step steering input test. Figure 19 is the lateral acceleration in the 60 km/h step steering input test. The left one shows the whole simulation time frame. To be easily seen the differences between with AARB and without AARB, the locally zoomed-out plot is shown at the right. The maximum difference is within 0.4 m/s2. At the end, the two had about 0.14 m/s2 difference in the final lateral acceleration. The time taken to reach steady state was around the 48.50 s for the case without AARB, which took about 33.50 s after the steering turned. For the case with AARB, the time taken to reach steady state was around the 29.30 s, which took about 14.30 s after the steering turned.
Figure 20 is the yaw velocity in the 60 km/h step steering input test. The left one shows the whole simulation time frame. The right one has the local area zoomed out. The maximum difference in yaw velocity between with and without AARB is within 0.025 rad/s. Over the 50 s, the difference between the cases with and without AARB kept around 0.009 rad/s in yaw velocity. The time taken to reach steady state was around the 23.64 s for the case without AARB, which took about 8.64 s after the steering turned. For the case with AARB, the time taken to reach steady state was around the 20.51 s, which took about 5.51 s after the steering turned.
Figure 21 is the roll angle in the 60 km/h step steering input test. The left one shows the whole simulation time frame. The right one has the local area zoomed out. The maximum roll angle difference between with and without AARB is within 0.18 degree. Over the 50 s, the final difference between the cases with and without AARB kept around -0.098 degree in roll angle. The time taken to reach steady state was around the 48.67 s for the case without AARB, which took about 33.67 s after the steering turned. For the case with AARB, the time taken to reach steady state was around the 30.46 s, which took about 15.46 s after the steering turned.
Figure 22 is the steering characteristic in the 60 km/h step steering input test. The left one shows the data of the whole simulation time. The right one has the local area zoomed out. The maximum difference between with and without AARB is within 0.9 degree. Over the 50 s, the final value difference between the cases with and without AARB was around −0.45 degree. The time taken to reach steady state was around the 47.37 s for the case without AARB, which took about 32.37 s after the steering turned. For the case with AARB, the time taken to reach steady state was around the 28.97 s, which took about 13.97 s after the steering turned. From each figure, it can be seen that the stabilized time of the vehicle was significantly shortened with the AARB.
The comparisons of the data in the 60 km/h step steering input test were summarized in Table 10. The differences between the cases with AARB and without AARB were −3.49% changes in lateral acceleration, −3.63% in yaw velocity, −13.74% in roll angle, −22.5% in steering characteristic. These differences between the cases with AARB and without AARB become much more significant than the cases shown in 40 km/h. From the simulation results, the front anti-roll bar stiffness was increased. The roll angle was effectively reduced by 13.74%. The steering characteristic of oversteering was suppressed by 22.5%, and therefore the lateral acceleration of the vehicle was reduced by 3.49%, and the yaw velocity was reduced by 3.63%.
Table 11 listed the stabilization time required from steering turned to vehicle stabilized. The stabilization time differences between the cases with AARB and without AARB for lateral acceleration, yaw velocity, roll angle, steering characteristic, and the total stabilization time were −57.31%, −36.23%, −54.08%, −56.84%, and −54.08%, respectively. The stabilization time for vehicle lateral acceleration had bigger difference between the cases with AARB and without AARB, which was around 57.31%. The one for yaw velocity was the relatively smallest one.
Figure 23, Figure 24, Figure 25, Figure 26 and Figure 27 are the results of the 80 km/h step steering input test. Figure 23 is the lateral acceleration in the 80 km/h step steering input test. The left one shows the whole simulation time frame. To be easily seen the differences between with AARB and without AARB, the locally zoomed-out plot is shown at the right. The case without AARB was not stable with oscillation magnitude of +/−4 m/s2 with respect to mean value −3.76 m/s2. At the end, the case with AARB had lateral acceleration around −3.91 m/s2. The time to reach steady state was around the 36.77 s for the case with AARB, which took about 21.77 s after the steering turned.
Figure 24 is the yaw velocity in the 80 km/h step steering input test. The left one shows the whole simulation time frame. The right one has the local area zoomed out. The case without AARB was not stable with oscillation between −0.1 and −0.3 rad/s with respect to mean value −0.183 rad/s. At the end, the case with AARB had a yaw velocity around −0.181 rad/s. The time taken to reach steady state was around the 28.33 s for the case with AARB, which took about 13.33 s after the steering turned.
Figure 25 is the roll angle in the 80 km/h step steering input test. The left one shows the whole simulation time frame. The right one has the local area zoomed out. The case without AARB was not stable with oscillation between −0.5 and 2 degrees with respect to mean value 0.707 degrees. At the end, the case with AARB had roll angle around 0.555 degree. The time taken to reach steady state was around the 36.91 s for the case with AARB, which took about 21.91 s after the steering turned.
Figure 26 is the steering characteristic in the 80 km/h step steering input test. The left one shows the data of the whole simulation time. The right one has the local area zoomed out. The case without AARB was not stable with oscillation between −1.3 and −2.5 degrees with respect to mean value −1717 degrees. At the end, the case with AARB had steering characteristic angle around −1.81 degree. The time taken to reach steady state was around the 25.94 s for the case with AARB, which took about 10.94 s after the steering turned.
From each figure, it can be observed that the case without AARB continued oscillating. The instability of the vehicle was caused by the rolling dynamic. However, for the case with AARB was stabilized after the turn signal was inputted. It can be found that the roll angle was stable and under control, so the lateral acceleration, the yaw velocity, and the steering characteristic were all stable.
The comparisons of the data in the 80 km/h step steering input test were summarized in Table 12. Since the case without AARB continued oscillating, the average mean was calculated and used as a reference. The behaviors were quite different between the cases with AARB and without AARB and become much more significant than the cases shown in 40 km/h and in 60 km/h. With the active anti-roll bar, the front anti-roll bar stiffness was increased to effectively reduce the roll angle. The steering characteristic of oversteering was suppressed and effectively preventing the possible danger of inner wheel from lifting off the ground.
Table 13 listed the time of stabilization for 80 km/h step steering input test. Since the vehicle was not stabilized for the case without AARB, only the time of stabilization for the case with AARB was recorded. The time of stabilization for lateral acceleration, yaw velocity, roll angle, steering characteristic, and total were 21.77, 13.33, 21.91, 10.91, and 21.91 respectively.
Figure 27 shows the tire force and the body force distribution at the 17th second for the cases with and without AARB. In the case with AARB, more vehicle body parts were subjected to deformation, while it was not seen much in the case without AARB. The adjustment in the anti-roll bar stiffness and the deformation in body helped in balancing the stiffness between the chassis system and the body, and reducing the roll angle, stabilizing the vehicle, and preventing vehicle from large oversteering or inner wheel lifting condition.
Table 14 summarized the steering characteristic for the step steering input tests under different speeds. The case of 40 km/h was understeering. The baseline case, without AARB, had the final steering characteristic angle +3.07. The one with AARB had the steering characteristic angle +2.95. The understeering condition was reduced 0.12 degree, but the time of stabilization was increased by 0.61 s. The case of 60 km/h was oversteering. The baseline case, without AARB, had the final steering characteristic angle −2.0. The one with AARB had the steering characteristic angle −1.55. The oversteering condition was reduced 0.45 degree which was about 22.5% changes, and the time of stabilization was reduced by 18.21 s which was about 54.08% improvement. The case of 80 km/h was oversteering. The baseline case, without AARB, was not stabilized. The vehicle traveled at 80 km/h with a sudden steering turn, its steering characteristic continued changing, and was not stabilized. That was an unwanted and dangerous condition. While the proposed control strategy with AARB, the vehicle could be stabilized in 21.91 s with the steering characteristic angle −1.81. The oversteering condition was well under control.
Figure 28 shows the paths of the cases with AARB for the step steering input test. They are all circular. The path was recorded in Table 15. Comparing the difference between before and after the improvement, the diameter was increased by 1.57% in the 40 km/h test, increased by 4.01% in the 60 km/h test but decreased by 2.65% in n the 80 km/h test. For 80 km/h case, since the original baseline was not stable, the average yaw velocity would not be suitable for comparison. For 40 and 60 km/h cases, it could be seen that the smaller yaw velocity, the larger the path diameter, in a general sense. However, it was not quite completely inversely proportional. Coupling effects altered the number a little. The yaw motions created the lateral accelerations which led roll motions. The roll motions affected the yaw response by changing the tire corning forces due to the lateral load shifting [23].
4.2. Analysis of the Single Sinusoidal Steering Input Test
In the single sinusoidal steering input test, the first 10 s were used to keep the vehicle straight and up to the required speed, which was not part of the steering behavior study. The steering angle was turned between the 15th second and 17th second, therefore the results were recorded starting at the 10th second. Since this chassis system response is within 10 Hz, a low pass filter 10 Hz was used to filter out noise. For those final average steady state values are close to zero, the time of stabilization is to measure the time entering to and maintaining within the 2% of the peak values; and for those the final average steady state values are not zero, the time of stabilization is to measure the time entering to and maintaining within the 2% variation range relative to the final converged average steady state values. The total time of the simulation test was 30 s. Since the steering input was completed by the 17th second, most of the data remained the same after 24th second. The following figures depicted data from the 10th to 24th second.
Figure 29, Figure 30, Figure 31 and Figure 32 are the results of the 40 km/h single sinusoidal steering input for lateral acceleration, yaw velocity, roll angle, and steering characteristic, respectively. The maximum lateral acceleration difference between with and without AARB is within 0.15 m/s2., as shown in Figure 29. In Figure 30, the two curves are almost identical. The maximum difference in yaw velocity is within 0.0025 rad/s. Figure 31 shows the roll angle data in the 40 km/h single sinusoidal steering input test. The maximum roll angle difference between with and without AARB is within 0.06 degree. There were small oscillations around the peaks. Figure 32 depicts the steering characteristic. The maximum difference between with and without AARB is within 0.05 degree. There are not many differences between the one with AARB and without AARB, except around the peak area with little discrepancy.
Table 16 summarized the time of stabilization in the 40 km/h single sinusoidal steering input test, which was the time after steering turn completed to the time vehicle stabilized. The stabilization time differences between the cases with AARB and without AARB for lateral acceleration, yaw velocity, roll angle, steering characteristic, and the total stabilization time were all 0%, since these two data sets were almost the same.
Figure 33, Figure 34, Figure 35 and Figure 36 are the results of the 60 km/h single sinusoidal steering input for lateral acceleration, yaw velocity, roll angle, and steering characteristic, respectively. The maximum lateral acceleration difference between with and without AARB is within 0.35 m/s2., as shown in Figure 33. In Figure 34, the two curves are almost identical. The maximum difference in yaw velocity is within 0.007 rad/s. Figure 35 shows the roll angle data in the 60 km/h single sinusoidal steering input test. The maximum roll angle difference between with and without AARB is within 0.08 degree. There were small oscillations around the peaks. Figure 36 depicts the steering characteristic. The maximum difference between with and without AARB is within 0.13 degrees. It was understeer, then oversteer, and then understeer, and oversteer again. The peaks in the second cycle were bigger than the ones in the first cycle. Even so, there were not many differences between the one with AARB and without AARB, except around the peak area with little discrepancy in the lateral acceleration and roll angle.
Table 17 summarizes the time of stabilization in the 60 km/h single sinusoidal steering input test, which was the time after steering turn completed to the time vehicle stabilized. The stabilization time differences between the cases with AARB and without AARB for lateral acceleration, yaw velocity, roll angle, steering characteristic, and the total stabilization time were −8.08%, 0%, −2.75%, −1.56%, and −2.75%, respectively. The total stabilization time was to choose the longest time within each case. The lateral acceleration had bigger difference between the cases with AARB and without AARB, which was around −8.08%. The yaw velocity difference was the relatively smallest one, which is 0.
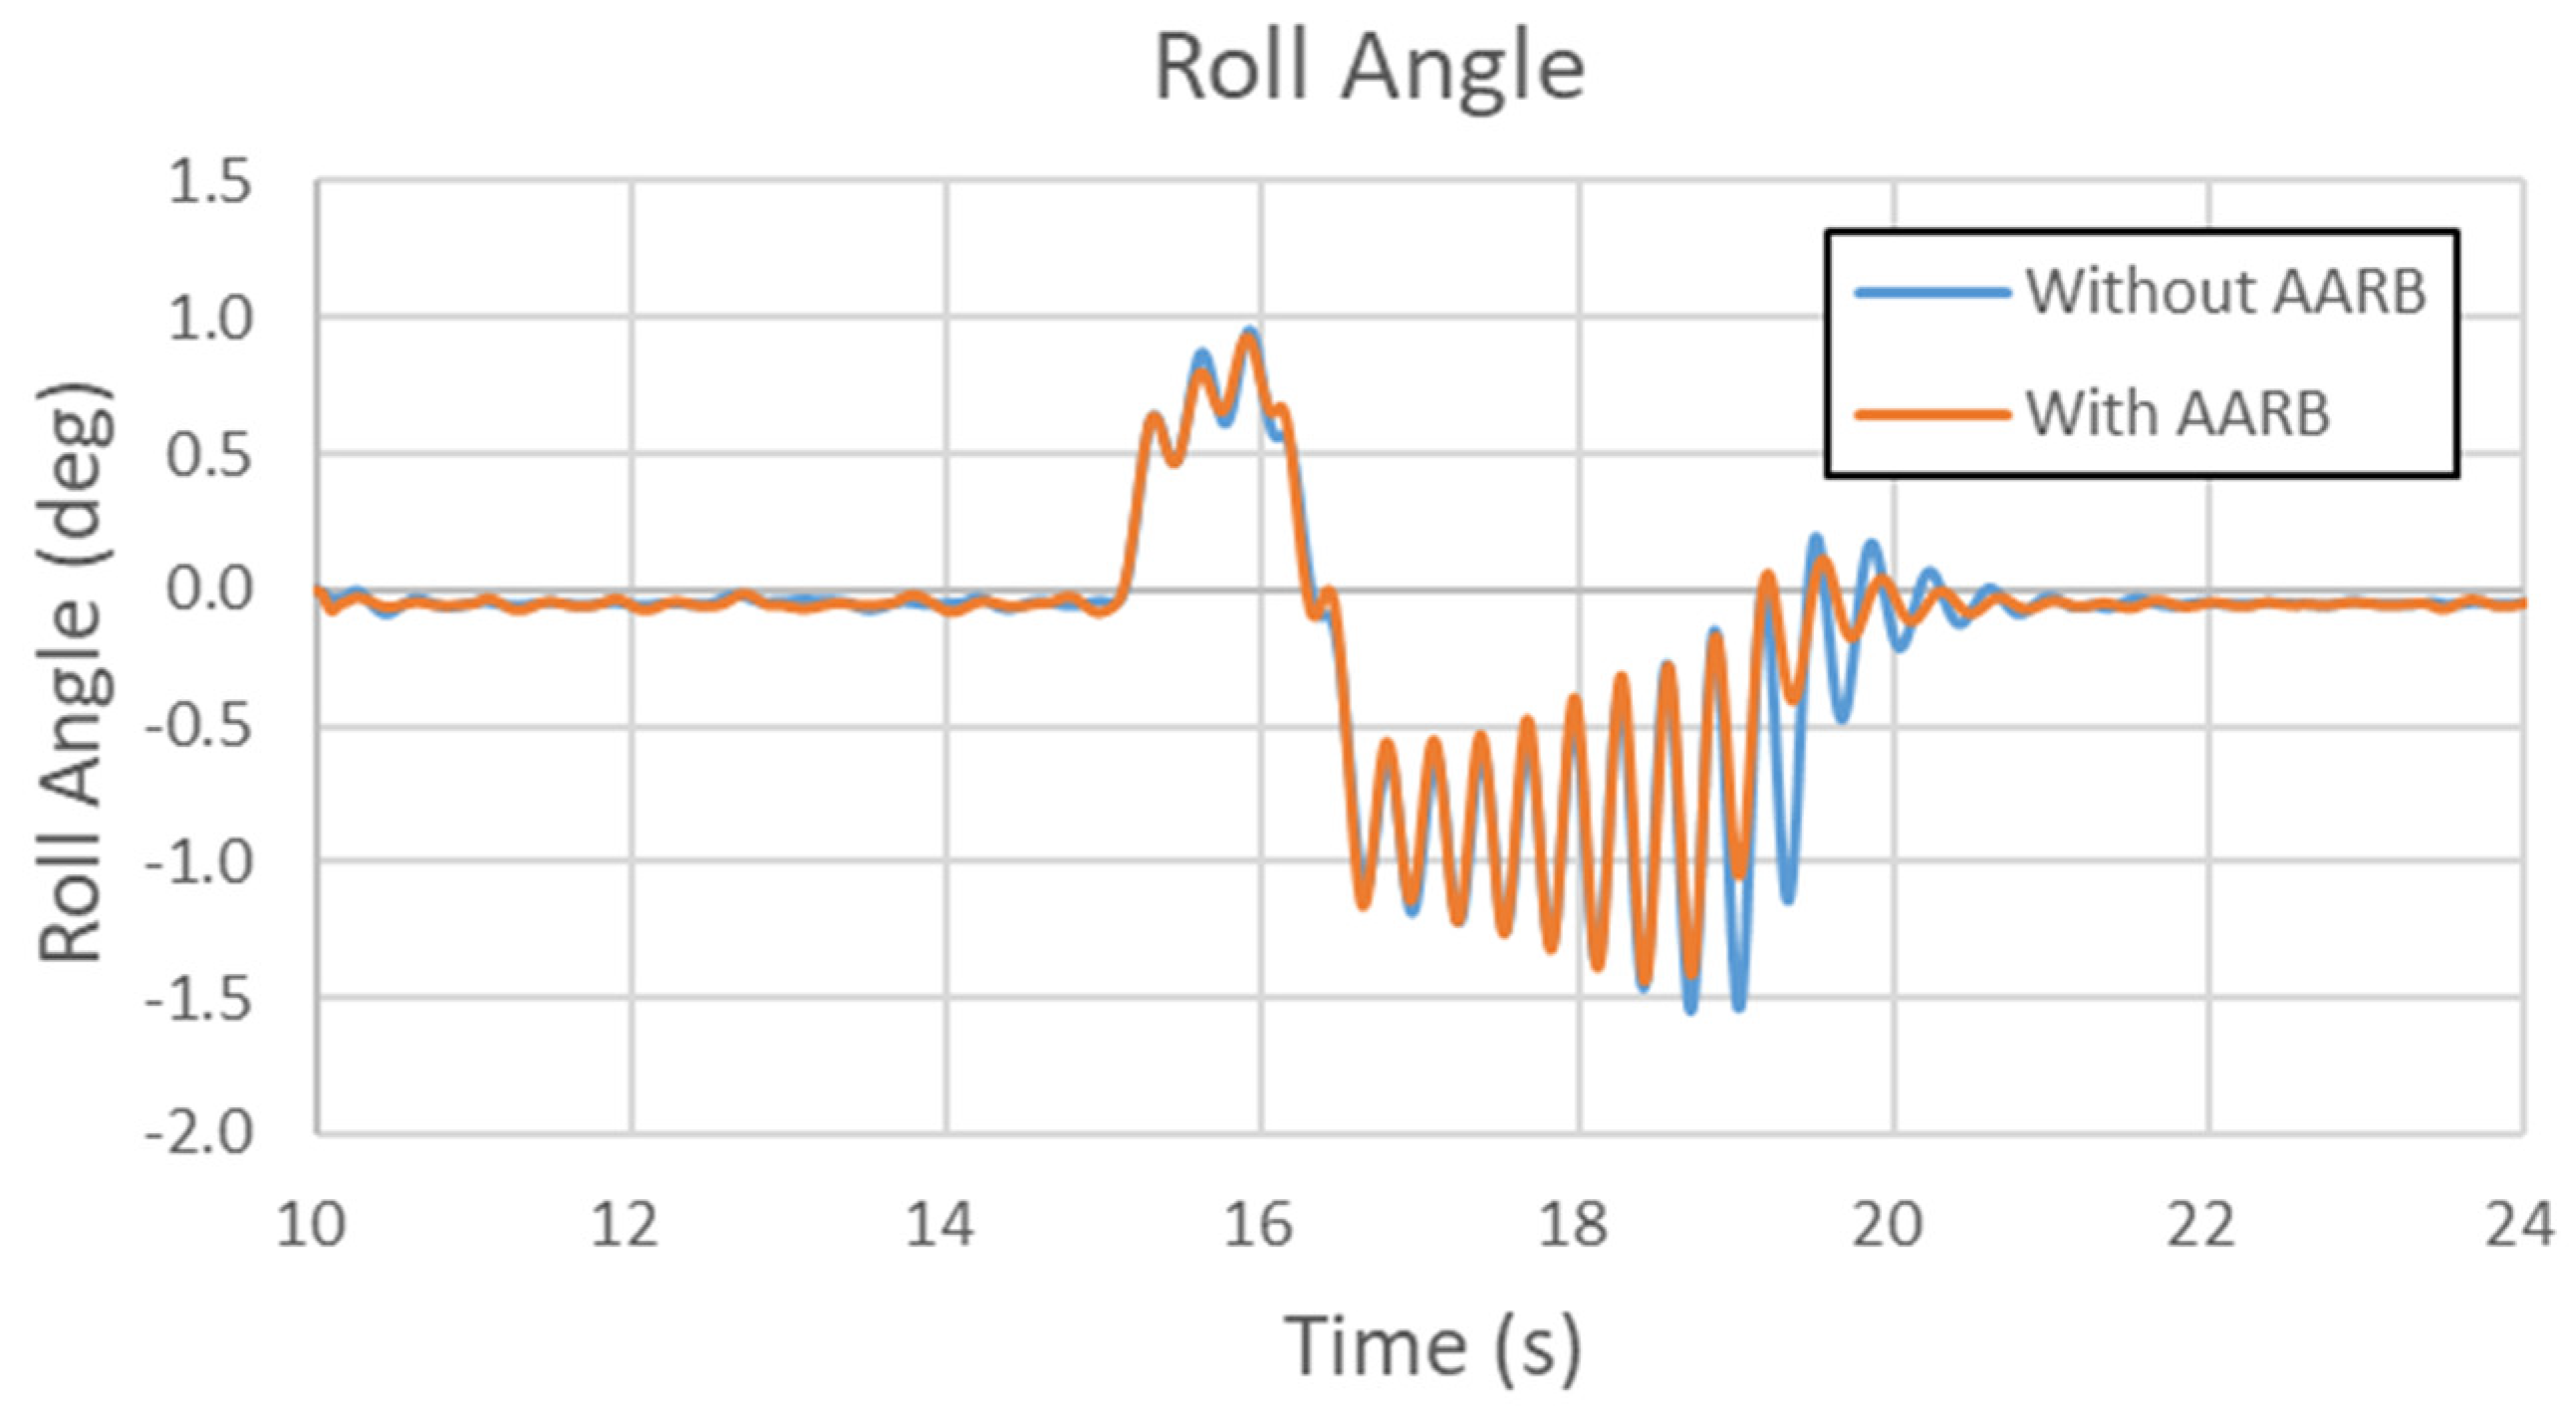
Figure 37, Figure 38, Figure 39 and Figure 40 are the results of the 80 km/h single sinusoidal steering input for lateral acceleration, yaw velocity, roll angle, and steering characteristic, respectively. Figure 37 shows the data of lateral acceleration. There is obvious oscillation during the steering returning period. The case with AARB was stabilized faster than the case without AARB. The maximum lateral acceleration difference between with and without AARB was −3.5 m/s2. In Figure 38, it compared the yaw velocity data. The two curves were almost identical during the first half cycle. The discrepancy could be seen in the 2nd half cycle. The maximum difference in yaw velocity is within 0.05 rad/s. It can be clearly seen that the stabilization time of the yaw velocity was shorter, and the yaw velocity was smaller at the first peak but larger at the second peak for the case with AARB. Figure 39 shows the roll angle data in the 80 km/h single sinusoidal steering input test. The patterns are very similar to the lateral acceleration but opposite in signs. There is obvious oscillation during the steering returning period. The maximum roll angle difference between with and without AARB is about 0.8 degree. The roll angle was reduced, and its stabilization time was reduced since the vibration was suppressed. Figure 40 depicts the steering characteristic. The maximum difference between with and without AARB is within 0.45 degree. It was understeer, then oversteer, and then understeer, and oversteer again. The peaks in the second cycle were bigger and sharper than the ones in the first cycle.
Table 18 summarized the time of stabilization in the 80 km/h single sinusoidal steering input test, which was the time after steering turn completed to the time vehicle stabilized. The stabilization time differences between the cases with AARB and without AARB for lateral acceleration, yaw velocity, roll angle, steering characteristic, and the total stabilization time were −8.99%, −10.84%, −8.43%, −10.56%, and −8.43%, respectively. The total stabilization time was to choose the longest time within each case. The time of stabilization for yaw velocity had bigger difference between the cases with AARB and without AARB, which was around –10.84%. The difference for roll angle stabilization time was the relatively smallest one.
Figure 41 shows the tire force and the body force distribution at the 16th second for the cases with and without AARB. These two cases were very similar, with very minor differences in the body deformation and stress distribution. However, the body structure with AARB did have little more body get deformed to distribute the loads passed on. That helped the system to stabilize a little faster.
Table 19 summarized the total stabilization time in the single sinusoidal steering input tests. There was no significant difference in the 40 km/h and 60 km/h cases. In the 80 km/h case, due to the active anti-roll bar intervention, the vehicle rolling dynamic was controlled, and the time of stabilization was reduced. The danger of the inner wheel lifting was also inhibited.
As can be seen in Figure 42, although there is no significant change in the yaw velocity at the medium and low speed, there is a difference in the yaw angle between before the turn signal input (first fifteen seconds) and the end of the test (at 30 s), as recorded in Table 20. The yaw angle differences in percentage between with AARB and without AARB for the cases of 40, 60, and 80 km/h are increased by 16.7%, decreased by 10%, and decreased by 14.6%, respectively.
5. Conclusions
The objective of this research is to improve the handling performance of a medium-size electric bus by establishing a flexible multi-body dynamic simulation model with the proposed control strategy used to adjust the stiffness of the anti-roll bars. The control strategy is based on the steer characteristics. When huge oversteer occurred, the strategy is used to increase the front rolling stiffness, reducing load shifting to the front outer wheel, and increasing the front inner tire traction. When the vehicle is understeer too much, the strategy is to increase the rear rolling stiffness, reducing load shifting to the rear outer wheel, increasing the rear inner tire traction, increasing the rear slip angle. This research used HyperMesh and MotionView software under the Hyperworks computer engineering analysis system to build a rigid-flexible coupling medium-size electric bus model. Two types of open-loop testing method, namely a step steering input test and single sinusoidal steering input test, were established according to ISO7401 and ISO/TR8725, respectively. Under the same steering signal, the simulation test was performed at speeds of 40, 60, and 80 km/h to observe the vehicle dynamic and to improve the handling characteristic based on the proposed control strategy with active anti-roll bar system (AARB). The following results could be obtained by the simulation test of this research:
- (1)
- In the step steering input test, for this medium-size electric bus, understeering occurred at 40 km/h and oversteering occurred at 60 and 80 km/h in both the original case without AARB and the improved case with AARB. In the original case, the time of stabilization for 40 km/h was 6.23 s. The time of stabilization for 60 km/h was 33.67 s. However, for a speed of 80 km/h, the steering characteristic continued changing and was unstable, where the inner wheel lifting occurred which is unwanted unsteady situation.
- (2)
- In the single sinusoidal steering input test of the original vehicle model, the time of stabilization increased with the increase of the vehicle speed. In the 80 km/h test, the steady state restored within three to four seconds after the turn signal ended, and the unsteady situation of the inner wheel lifting also occurred.
- (3)
- After the improvement made with the active anti-roll bar system designed by this research, most of the data changed during the step steering input test. In the 40 km/h step steering input test, the yaw velocity reduced 0.002 rad/s, which was about 0.60%; the understeering characteristic was effectively suppressed by 0.12 degree, which is about 3.91%; and the total time of stabilization increased by 0.61 s, which is about 9.79%. In the 60 km/h case, the yaw velocity reduced 0.009 rad/s, which was about 3.63%; the oversteering characteristic was effectively suppressed by 0.45 degree, which was about 22.5%; and the total stabilization time reduced 18.21 s, which is about 54.08%. In the 80 km/h case, the phenomenon of the inner wheel lifting, occurred in the original vehicle, was effectively suppressed and altered the original unstable and dangerous condition to stable. Since the original vehicle is not stable in the 80 km/h step steering input test, an average mean of each performance value was calculated for comparison. In comparison with the mean of original design, the design with active anti-roll bar had a lower yaw velocity than the original one by 1.09%. The diameter of the circle path was reduced by 2.65%.
- (4)
- With the active anti-roll bar design, there was no significant difference from the original one in the yaw velocity and the total stabilization time for the 40 km/h single sinusoidal steering input test. The yaw angle changed between the steering turned and the end of test. In the original design, the change of yaw angle was 0.6 degree, while it was 0.7 degree in the proposed design, increased 0.1 degree, which was about 16.7% to the baseline value. In the test of 60 km/h, there was no significant difference in the yaw velocity and the total stabilization time. In the original design, the change of yaw angle was 4.0 degrees, while it was 3.6 degrees in the proposed design, reduced by 0.4 degrees, which was about 10%. In the test of 80 km/h, the time of stabilization was reduced by 8.43%. In the original design, the change of yaw angle was 26.0 degrees, while it was 22.2 degrees in the proposed design, reduced by 3.8 degrees, which was about 14.6%.
The proposed control strategy with active anti-roll bar helped to improve the handling performance of the medium-size electric bus. The vehicle can have better control in terms of direction and a shorter stabilization time in response to the steering input, especially preventing from the dangerous unstable condition. Further enhancement study including other types of suddenly turning or driving behaviors can be carried out in the near future.
Author Contributions
Conceptualization, H.-Y.H.; methodology, T.-S.L.; software, H.-Y.H. and J.-S.C.; validation, J.-S.C. and T.-S.L.; investigation, H.-Y.H.; project administration, J.-S.C. All authors have read and agreed to the published version of the manuscript.
Funding
This research received no external funding.
Conflicts of Interest
The authors declare no conflict of interest.
References
- Ambrósio, J.A.C.; Gonçalves, J.P.C. Complex Flexible Multibody Systems with Application to Vehicle Dynamics. Multibody Syst. Dyn. 2001, 6, 163–182. [Google Scholar] [CrossRef]
- Suh, K.H.; Lee, Y.K.; Yoon, H.S. Dynamic Stress Analysis of a Vehicle Frame by Flexible Multibody Dynamics Simulation. In Proceedings of the SAE 2001 World Congress, Detroit, MI, USA, 5–8 March 2010. [Google Scholar]
- Ma, T.; Zuo, A.; Wang, D.; Chen, S.; Dong, J. Ride Comfort Analysis of Commercial Vehicle Using Flexible Multi-body and Finite Element Methods. In Proceedings of the 2010 International Conference on Mechanical and Electrical Technology, Singapore, 10–12 September 2010; pp. 295–299. [Google Scholar]
- Gonçalves, J.P.C.; Ambrósio, J.A.C. Road vehicle modeling requirements for optimization of ride and handling. Multibody Syst. Dyn. 2005, 13, 3–23. [Google Scholar]
- Mirone, G. Multi-body elastic simulation of a go-kart: Correlation between frame stiffness and dynamic performance. Int. J. Automot. Technol. 2010, 11, 461–469. [Google Scholar] [CrossRef]
- Shiiba, T.; Ashari, M.F.B.; Yano, M.; Takada, Y. Evaluations of the Racing Kart Dynamic Behavior with Flexible Multibody Dynamic Analysis. In Proceedings of the ASME 2011 International Design Engineering Technical Conferences and Computers and Information in Engineering Conference, Washington, DC, USA, 28–31 August 2011; Volume 4, pp. 609–615. [Google Scholar]
- Guo, D.L.; Hu, H.Y.; Yi, J.Q. Neural Network Control for a Semi-Active Vehicle Suspension with a Magnetorheological Damper. J. Vib. Control. 2004, 10, 461–471. [Google Scholar] [CrossRef]
- Azadi, S.; Vaziri, M.; Hoseini, M. Vehicle dynamic control of a passenger car applying flexible body model. Veh. Syst. Dyn. 2010, 48, 587–617. [Google Scholar] [CrossRef]
- Zhang, J.Y.; Wang, S.F. The virtual experiment on vehicle handling stability. In Proceedings of the 2007 14th Asia Pacific Automotive Engineering Conference, Hollywood, CA, USA, 5–8 August 2007. [Google Scholar]
- Angel, L.M.; Antonio, J.N.; Jose’, M.C.; Publio, P. A Semi-Active Vehicle Suspension Based on Pneumatic Springs and Magnetorheological Dampers. J. Vib. Control. 2010, 24, 808–821. [Google Scholar]
- Darling, J.; Hickson, L.R. An Experimental Study of a Prototype Active Anti-Roll Suspension System. Veh. Syst. Dyn. 2007, 29, 309–329. [Google Scholar] [CrossRef]
- Cronje’, P.H.; Els, P.S. Improving off-road vehicle handling using an active anti-roll bar. J. Terramechanics 2010, 47, 179–189. [Google Scholar] [CrossRef] [Green Version]
- Vu, V.; Sename, O.; Dugard, L.; Gáspár, P. Active anti-roll bar control using electronic servo valve hydraulic damper on single unit heavy vehicle. IFAC-PapersOnLine 2016, 49, 418–425. [Google Scholar] [CrossRef]
- Danesin, D.; Krief, P.; Sorniotti, A.; Velardocchia, M. Active Roll Control to Increase Handling and Comfort. SAE Trans. 2003, 1007–1017, SAE paper 2003-01-0962. [Google Scholar]
- Struss, F.J.; Urbach, B.A. Variable Stiffness Anti-Roll Bar. U.S. 122571, 24 July 1998. [Google Scholar]
- Lin, Y.L. Vibration Reduction of Electric Bus Driveline System. Master’s Thesis, National Taipei University of Technology, Taipei, Taiwan, 2014. [Google Scholar]
- Yang, C.N. Simulation and Analysis of Steering Test with Flex-Body Dynamics Model. Master’s Thesis, National Taipei University of Technology, Taipei, Taiwan, 2015. [Google Scholar]
- Craig, R.R.; Bampton, M.C. Coupling of Substructures for Dynamic Analysis. AIAA J. 1968, 6, 1313–1319. [Google Scholar] [CrossRef]
- Krattiger, D.; Wu, L.; Zacharczuk, M.; Buck, M.; Kuether, R.J.; Allen, M.S.; Tiso, P.; Brake, M.R. Interface Reduction for Hurty/Craig-Bampton Substructured Models: Review and Improvements. Mech. Syst. Signal Process. 2019, 114, 579–603. [Google Scholar] [CrossRef] [Green Version]
- Medium Bus RAC-300. Available online: www.racev.com.tw/product/k5 (accessed on 29 October 2019).
- ISO 7401:2011 Road Vehicles—Lateral Transient Response Test Methods—Open-Loop Test Methods. Available online: Iso.org/standard/54144.html (accessed on 29 October 2019).
- ISO/TR 8725:1988 Road vehicles—Transient Open-Loop Response Test Method with One Period of Sinusoidal Input. Available online: Iso.org/standard/16128.html (accessed on 29 October 2019).
- Gillespie, T. Fundamentals of Vehicle Dynamics; SAE: Warrendale, PA, USA, 1992. [Google Scholar]
Figure 1.
A medium-sized eclectic bus.

Figure 2.
Vehicle chassis main frame.

Figure 3.
Vehicle body frame.

Figure 4.
Vehicle body panels.

Figure 5.
Transmission system construction.

Figure 6.
Steering system construction.

Figure 7.
Suspension system construction.

Figure 8.
Front anti-roll bar construction.

Figure 9.
Rear anti-roll bar construction.

Figure 10.
Steering input signal in the step steering test.

Figure 11.
Vehicle speeds in the step steering test.

Figure 12.
Steering gear input signal for the single sinusoidal steering test.

Figure 13.
Vehicle speeds in the single sinusoidal steering test.

Figure 14.
The control process of the active anti-roll bar (AARB).

Figure 15.
(a) Lateral acceleration in the 40 km/h step steering input test. (b) The differences of lateral acceleration between two simulations (with AARB and Without AARB).
Figure 15.
(a) Lateral acceleration in the 40 km/h step steering input test. (b) The differences of lateral acceleration between two simulations (with AARB and Without AARB).

Figure 16.
(a) Yaw velocity in the 40 km/h step steering input test. (b) The differences of yaw velocity between the two simulations (with and without AARB).
Figure 16.
(a) Yaw velocity in the 40 km/h step steering input test. (b) The differences of yaw velocity between the two simulations (with and without AARB).

Figure 17.
(a) Roll angle in the 40 km/h step steering input test. (b) The differences of roll angle between the two simulations (with and without AARB).
Figure 17.
(a) Roll angle in the 40 km/h step steering input test. (b) The differences of roll angle between the two simulations (with and without AARB).


Figure 18.
(a) Steering characteristic in the 40 km/h step steering input test. (b) The differences of Steering characteristic between the two simulations (with and without AARB).
Figure 18.
(a) Steering characteristic in the 40 km/h step steering input test. (b) The differences of Steering characteristic between the two simulations (with and without AARB).

Figure 19.
Lateral acceleration in the 60 km/h step steering input test.

Figure 20.
Yaw velocity in the 60 km/h step steering input test.

Figure 21.
Roll angle in the 60 km/h step steering input test.

Figure 22.
Steering characteristic in the 60 km/h step steering input test.

Figure 23.
Lateral acceleration in the 80 km/h step steering input test.

Figure 24.
Yaw velocity in the 80 km/h step steering input test.

Figure 25.
Roll angle in the 80 km/h step steering input test.

Figure 26.
Steering characteristic in the 80 km/h step steering input test.

Figure 27.
Tire force and body force distribution in the 80 km/h step steering input test (t = 17 s).
Figure 27.
Tire force and body force distribution in the 80 km/h step steering input test (t = 17 s).

Figure 28.
Paths of each speed in the step steering input test generated after improving.

Figure 29.
Lateral acceleration in the 40 km/h single sinusoidal steering input test.

Figure 30.
Yaw velocity in the 40 km/h single sinusoidal steering input test.

Figure 31.
Roll angle in the 40 km/h single sinusoidal steering input test.

Figure 32.
Steering characteristic in the 40 km/h single sinusoidal steering input test.

Figure 33.
Lateral acceleration in the 60 km/h single sinusoidal steering input test.

Figure 34.
Yaw velocity in the 60 km/h single sinusoidal steering input test.

Figure 35.
Roll angle in the 60 km/h single sinusoidal steering input test.

Figure 36.
Steering characteristic in the 60 km/h single sinusoidal steering input test.

Figure 37.
Lateral acceleration in the 80 km/h single sinusoidal steering input test.

Figure 38.
Yaw velocity in the 80 km/h single sinusoidal steering input test.

Figure 39.
Roll angle in the 80 km/h single sinusoidal steering input test.

Figure 40.
Steering characteristic in the 80 km/h single sinusoidal steering input test.

Figure 41.
Tire force and body force distribution in the 80 km/h single sinusoidal steering input test (t = 16 s).
Figure 41.
Tire force and body force distribution in the 80 km/h single sinusoidal steering input test (t = 16 s).

Figure 42.
The yaw angle changes in the single sinusoidal steering input tests.


Table 1.
Vehicle specifications [20].
Table 1.
Vehicle specifications [20].
| Parameters | RAC-300 |
|---|---|
| Dimensions L*W*H (mm mm mm) | 7000 × 2135 × 2603 |
| Wheel Base (mm) | 3800 |
| Curb Weight (N) | 58,958 |
| Vehicle Load (N) | 16,579 |
| GVWR (N) | 75,537 |
| Front Axle Load (N) | 30,794 |
| Rear Axle Load (N) | 44,773 |
| Passengers (seat/stand) | 19 + 1/10 |
| Top Speed (km/h) | >100 |
| Max. Climbing Angle (%) | >30% (full load) |
| Charging Time (h) | 6–7 h (30 Kw) |
| Battery Type | Yttrium Lithium Battery |
| Battery Capacity (kWh) | 107 |
| Motor Type | AC Induction Air-cooled |
| Motor Power (kW) | Rated 75/Peak 150 |
| Motor Torque (Nm) | Rated 284.5/Max 706 |
| Front/Rear Axle | 2500/5000 |
| Braking Systems | Air Brake + WABCO ABS |
| Assisted Braking | Regenerative Braking |
| Gearbox | 6-Speed MT |
| Vehicle Operating System | BMS/VCU |
Table 2.
Connections table of the transmission system components.
| Component 1 | Component 2 | Connect Method |
|---|---|---|
| Transmission | Front driveshaft | Y-Z Universal joint |
| Front driveshaft | Rear driveshaft | Y-Z Universal joint |
| Rear driveshaft | Differential | Y-Z Universal joint |
Table 3.
Connections table of the steering system components.
| Component 1 | Component 2 | Connect Method |
|---|---|---|
| Steering gearbox output | Pitman arm | Y rotational joint |
| Pitman arm | Drag link | Y-Z Universal joint |
| Drag link | Left steering arm | Y-Z Universal joint |
| Left steering arm | Left Tie rod | Z rotational joint |
| Left tie rod | Left wheel hub | Z rotational joint (left-front Kingpin) |
| Right steering arm | Right tie rod | Z rotational joint |
| Right tie rod | Right wheel hub | Z rotational joint (right-front Kingpin) |
Table 4.
Mechanical properties of AISI5160.
| Materials Properties | AISI5160 Manganese Steel |
|---|---|
| Elastic coefficient E (MPa) | 205,000 |
| Poisson’s ratio | 0.29 |
| Yield strength (MPa) | 275 |
Table 5.
Connections table of the suspension system components.
| Component 1 | Component 2 | Connect Method |
|---|---|---|
| Chassis rail | Front leaf spring hanger | Fixed joint |
| Front leaf spring hanger | Leaf spring 1 | Y rotational joint |
| Leaf spring n (n = 1–31) | Leaf spring n + 1 | Fixed joint |
| Leaf spring 29 | Wheel hub | Fixed joint |
| Leaf spring 32 | Leaf spring shackle | Y rotational joint |
| Leaf spring shackle | Rear leaf spring hanger | Y rotational joint |
| Rear leaf spring hanger | Chassis rail | Fixed joint |
| Chassis rail | Shock absorbers damping cylinder | Y rotational joint |
| Shock absorbers damping cylinder | Shock absorbers piston rod | Z cylindrical joint (damper) |
| Shock absorbers piston rod | Wheel hub | Y rotational joint |
Table 6.
Parameters of the suspension system components.
| Equivalent vertical stiffness of the front leaf spring | 490.15 N/mm |
| Equivalent vertical stiffness of the rear leaf spring | 146.96 N/mm |
| Damping coefficient of the front shock absorbers | 315 Ns/mm |
| Damping coefficient of the rear shock absorbers | 525 Ns/mm |
Table 7.
Connections of the anti-roll bar components (front axle as the example).
| Component 1 | Component 2 | Connect Method |
|---|---|---|
| Left connecting rod | Left wheel hub assembly | Y-Z universal joint |
| Left arm | Left connecting rod | Ball joint |
| Left half anti-roll bar | Left arm | Fixed joint |
| Left half anti-roll bar | Left chassis rail | Y revolute joint |
| Left half anti-roll bar | Right half anti-roll bar | Y revolute joint (with Torsion spring-damper) |
| Right half anti-roll bar | Right chassis rail | Y revolute joint |
| Right half anti-roll bar | Right arm | Fixed joint |
| Right arm | Right connecting rod | Ball joint |
| Right connecting rod | Right wheel hub assembly | Y-Z universal joint |
Table 8.
Comparisons of the data in the 40 km/h step steering input test.
| Items | Lateral Acceleration (m/s2) | Yaw Velocity (rad/s) | Roll Angle (deg) | Steering Characteristic (deg) |
|---|---|---|---|---|
| Without AARB (A) | −3.58 | −0.335 | 0.637 | +3.07 |
| With AARB (B) | −3.59 | −0.333 | 0.643 | +2.95 |
| Difference (BA)/A100 (%) | +0.28 | −0.60 | +0.94 | −3.91 |
Table 9.
Stabilization time comparison for 40 km/h step steering input test.
| Stabilization Time | Lateral Acceleration Stabilization Time (s) | Yaw Velocity Stabilization Time (s) | Roll Angle Stabilization Time (s) | Steering Characteristic Stabilization Time (s) | Total Stabilization Time (s) |
|---|---|---|---|---|---|
| Without AARB (A) | 6.23 | 0.87 | 6.22 | 5.39 | 6.23 |
| With AARB (B) | 6.83 | 0.85 | 6.84 | 6.13 | 6.84 |
| Difference (BA)/A100 (%) | 9.63 | −2.30 | 9.97 | 13.73 | 9.79 |
Table 10.
Comparisons of the data in the 60 km/h step steering input test.
| Items | Lateral Acceleration (m/s2) | Yaw Velocity (rad/s) | Roll Angle (deg) | Steering Characteristic (deg) |
|---|---|---|---|---|
| Without AARB (A) | −4.01 | −0.248 | 0.713 | −2.00 |
| With AARB (B) | −3.87 | −0.239 | 0.615 | −1.55 |
| Difference (BA)/A100 (%) | −3.49 | −3.63 | −13.74 | −22.5 |
Table 11.
Stabilization time comparison for 60 km/h step steering input test.
| Stabilization Time | Lateral Acceleration Stabilization Time (s) | Yaw Velocity Stabilization Time (s) | Roll Angle Stabilization Time (s) | Steering Characteristic Stabilization Time (s) | Total Stabilization Time (s) |
|---|---|---|---|---|---|
| Without AARB (A) | 33.50 | 8.64 | 33.67 | 32.37 | 33.67 |
| With AARB (B) | 14.30 | 5.51 | 15.46 | 13.97 | 15.46 |
| Difference (BA)/A100 (%) | −57.31 | −36.23 | −54.08 | −56.84 | −54.08 |
Table 12.
Comparisons of the data in the 80 km/h step steering input test.
| Items | Lateral Acceleration (m/s2) | Yaw Velocity (rad/s) | Roll Angle (deg) | Steering Characteristic (deg) |
|---|---|---|---|---|
| Without AARB Oscillation mean (A) | −3.76 * | −0.183 * | 0.707 * | −1.71 * |
| With AARB (B) | −3.91 | −0.181 | 0.555 | −1.81 |
| Difference (BA)/A100 (%) | 3.99 | −1.09 | −21.50 | 5.85 |
Note: * indicates that the system is not stable, and the values are the system mean for reference.
Table 13.
Stabilization time comparison for 80 km/h step steering input test.
| Stabilization Time | Lateral Acceleration Stabilization Time (s) | Yaw Velocity Stabilization Time (s) | Roll Angle Stabilization Time (s) | Steering Characteristic Stabilization Time (s) | Total Stabilization Time (s) |
|---|---|---|---|---|---|
| Without AARB | NA | NA | NA | NA | NA |
| With AARB | 21.77 | 13.33 | 21.91 | 10.94 | 21.91 |
Table 14.
Comparisons of step steering input test under different speeds.
| Items | V = 40 km/h | V = 60 km/h | V = 80 km/h | |||
|---|---|---|---|---|---|---|
| Steering Characteristic (deg) | Stabilization Time (s) | Steering Characteristic (deg) | Stabilization Time (s) | Steering Characteristic (deg) | Stabilization Time (s) | |
| Without AARB (A) | +3.07 | 6.23 | −2.0 | 33.67 | −1.71 * | NA |
| With AARB (B) | +2.95 | 6.84 | −1.55 | 15.46 | −1.81 | 21.91 |
| Difference (BA)/A100 (%) | −3.91 | 9.79 | −22.5 | −54.08 | 5.85 | NA |
Note: * indicates that the system is not stabilized, and the values are the mean used for reference.
Table 15.
Comparisons of the path diameters before and after the step steering input test.
| Path Diameter | V = 40 km/h Path Diameter (m) | V = 60 km/h Path Diameter (m) | V = 80 km/h Path Diameter (m) |
|---|---|---|---|
| Without AARB (A) | 63.7 | 130.3 | 245.6 |
| With AARB (B) | 64.7 | 135.6 | 239.1 |
| Difference (BA)/A100 (%) | +1.57% | +4.07% | −2.65% |
Table 16.
Stabilization time comparison for 40 km/h single sinusoidal steering input test.
| Stabilization Time | Lateral Acceleration Stabilization Time (s) | Yaw Velocity Stabilization Time (s) | Roll Angle Stabilization Time (s) | Steering Characteristic Stabilization Time (s) | Total Stabilization Time (s) |
|---|---|---|---|---|---|
| Without AARB (A) | 0.71 | 0.74 | 0.97 | 0.34 | 0.97 |
| With AARB (B) | 0.71 | 0.74 | 0.97 | 0.34 | 0.97 |
| Difference (BA)/A100 (%) | 0.00% | 0.00% | 0.00% | 0.00% | 0.00% |
Table 17.
Stabilization time comparison for 60 km/h single sinusoidal steering input test.
| Stabilization Time | Lateral Acceleration Stabilization Time (s) | Yaw Velocity Stabilization Time (s) | Roll Angle Stabilization Time (s) | Steering Characteristic Stabilization Time (s) | Total Stabilization Time (s) |
|---|---|---|---|---|---|
| Without AARB (A) | 0.99 | 0.85 | 1.09 | 0.64 | 1.09 |
| With AARB (B) | 0.91 | 0.85 | 1.06 | 0.63 | 1.06 |
| Difference (BA)/A100 (%) | −8.08% | 0.00% | −2.75% | −1.56% | −2.75% |
Table 18.
Stabilization time comparison for 80 km/h single sinusoidal steering input test.
| Stabilization Time | Lateral Acceleration Stabilization Time (s) | Yaw Velocity Stabilization Time (s) | Roll Angle Stabilization Time (s) | Steering Characteristic Stabilization Time (s) | Total Stabilization Time (s) |
|---|---|---|---|---|---|
| Without AARB (A) | 3.45 | 2.86 | 3.56 | 2.84 | 3.56 |
| With AARB (B) | 3.14 | 2.55 | 3.26 | 2.54 | 3.26 |
| Difference (BA)/A100 (%) | −8.99% | −10.84% | −8.43% | −10.56% | −8.43% |
Table 19.
Comparisons of the total stabilization time of the single sinusoidal steering input tests.
Table 19.
Comparisons of the total stabilization time of the single sinusoidal steering input tests.
| Total Stabilization Time | V = 40 km/h Total Stabilization Time (s) | V = 60 km/h Total Stabilization Time (s) | V = 80 km/h Total Stabilization Time (s) |
|---|---|---|---|
| Without AARB (A) | 0.97 | 1.09 | 3.56 |
| With AARB (B) | 0.97 | 1.06 | 3.26 |
| Difference (BA)/A100 (%) | 0 | −2.75 | −8.43 |
Table 20.
Comparisons of the yaw angle before and after the single sinusoidal steering input tests.
| Yaw Angle | V = 40 km/h Yaw Angle (deg) | V = 60 km/h Yaw Angle (deg) | V = 80 km/h Yaw Angle (deg) |
|---|---|---|---|
| Without AARB (A) | −0.6 | +4.0 | +26.0 |
| With AARB (B) | −0.7 | +3.6 | +22.2 |
| Difference (BA)/A100 (%) | +16.7% | −10% | −14.6% |
© 2020 by the authors. Licensee MDPI, Basel, Switzerland. This article is an open access article distributed under the terms and conditions of the Creative Commons Attribution (CC BY) license (http://creativecommons.org/licenses/by/4.0/).
Share and Cite
MDPI and ACS Style
Hwang, H.-Y.; Lan, T.-S.; Chen, J.-S. Developing a Strategy to Improve Handling Behaviors of a Medium-Size Electric Bus Using Active Anti-Roll Bar. Symmetry 2020, 12, 1334. https://doi.org/10.3390/sym12081334
AMA Style
Hwang H-Y, Lan T-S, Chen J-S. Developing a Strategy to Improve Handling Behaviors of a Medium-Size Electric Bus Using Active Anti-Roll Bar. Symmetry. 2020; 12(8):1334. https://doi.org/10.3390/sym12081334
Chicago/Turabian StyleHwang, Hsiu-Ying, Tian-Syung Lan, and Jia-Shiun Chen. 2020. "Developing a Strategy to Improve Handling Behaviors of a Medium-Size Electric Bus Using Active Anti-Roll Bar" Symmetry 12, no. 8: 1334. https://doi.org/10.3390/sym12081334
Note that from the first issue of 2016, this journal uses article numbers instead of page numbers. See further details here.