
Harris Hawks Optimization with Multi-Strategy Search and Application


1
School of Automation and Information Engineering, Xi’an University of Technology, Xi’an 710048, China
2
Shaanxi Key Laboratory of Complex System Control and Intelligent Information Processing, Xi’an University of Technology, Xi’an 710048, China
3
School of Electronic & Electrical Engineering, Baoji University of Arts and Sciences, Baoji 721016, China
*
Author to whom correspondence should be addressed.
Symmetry 2021, 13(12), 2364; https://doi.org/10.3390/sym13122364
Submission received: 5 November 2021
/
Revised: 26 November 2021
/
Accepted: 30 November 2021
/
Published: 8 December 2021
(This article belongs to the Topic Applied Metaheuristic Computing)
Abstract
:The probability of the basic HHO algorithm in choosing different search methods is symmetric: about 0.5 in the interval from 0 to 1. The optimal solution from the previous iteration of the algorithm affects the current solution, the search for prey in a linear way led to a single search result, and the overall number of updates of the optimal position was low. These factors limit Harris Hawks optimization algorithm. For example, an ease of falling into a local optimum and the efficiency of convergence is low. Inspired by the prey hunting behavior of Harris’s hawk, a multi-strategy search Harris Hawks optimization algorithm is proposed, and the least squares support vector machine (LSSVM) optimized by the proposed algorithm was used to model the reactive power output of the synchronous condenser. Firstly, we select the best Gauss chaotic mapping method from seven commonly used chaotic mapping population initialization methods to improve the accuracy. Secondly, the optimal neighborhood perturbation mechanism is introduced to avoid premature maturity of the algorithm. Simultaneously, the adaptive weight and variable spiral search strategy are designed to simulate the prey hunting behavior of Harris hawk to improve the convergence speed of the improved algorithm and enhance the global search ability of the improved algorithm. A numerical experiment is tested with the classical 23 test functions and the CEC2017 test function set. The results show that the proposed algorithm outperforms the Harris Hawks optimization algorithm and other intelligent optimization algorithms in terms of convergence speed, solution accuracy and robustness, and the model of synchronous condenser reactive power output established by the improved algorithm optimized LSSVM has good accuracy and generalization ability.
1. Introduction
Along with the significant increase in the processing power of computer hardware and software, a large number of excellent meta-heuristics were created in the intelligent computing field [1,2,3,4,5]. Meta-heuristics are a large class of algorithms developed in contrast to optimization and heuristics. Optimization algorithms are dedicated to finding the optimal solution to a problem, but they are often difficult to implement due to the unresolvability of the problem [6,7]. Heuristic algorithms are dedicated to customizing algorithms through intuitive experience and problem information, but are often difficult to generalize due to their specialized nature. Compared to these two algorithms, meta-heuristic algorithms are more general and do not require deep adaptation to the problem, and although they do not guarantee optimal solutions, they can generally obtain optimal solutions under acceptable spatial and temporal conditions, although the degree of deviation from the optimal solution is difficult to estimate [8,9,10,11,12].
The main optimization strategies of meta-heuristic algorithms are summarized as follows: (1) diversification of exploration in a wide range to ensure the global optimal solution; and (2) intensification and exploitation in a local range to obtain an optimal solution as close to the optimal solution as possible [13]. The main difference between various meta-heuristic algorithms is how to strike a balance between the two. Almost all meta-heuristic algorithms have the following characteristics: (1) they are inspired by some phenomena in nature, such as simulated physics, biology, and biological behavior; (2) they use stochastic strategies; (3) they do not use the gradient resolution information of the objective function; and (4) they have several parameters that need to be adapted to the problem, and (5) they have good parallel and autonomous exploration. Meta-heuristic algorithms have been widely used in all aspects of social production and life. Many related research papers are published every year in the fields of production scheduling [14,15], engineering computing [16,17], management decision-making [18,19], machine learning (ML) [20,21], system control [22], and many other disciplines.
P-meta-heuristics are categorized into four main groups [23,24]: (1) simulated physical process algorithm, (2) evolutionary algorithm, (3) simulated swarm intelligence algorithm, and (4) human behavior [25,26,27]. Algorithms for simulating physical processes include simulated annealing (SA) [28], gravitational search algorithm [29] which simulates earth gravity, artificial chemical reaction optimization algorithm [30], heat transfer search, which simulates the heat transfer search process in thermodynamics [31], Gases Brownian motion optimization, which simulates the phenomenon of Brownian motion in physics [32], Henry gas solubility optimization, which simulates Henry gas solubility process [33]; and evolutionary algorithm. In 1975, American professor Holland proposed the genetic algorithm (GA) based on the Darwinian evolutionary theory and the mechanism of superiority and inferiority in nature. GA [34], evolution strategies [35] and differential evolution [36], genetic programming [37], and Biogeography-Based Optimizer [38]; simulated population intelligence algorithms: the Artificial Bee Colony (ABC) algorithm [39] based on the honey bee harvesting mechanisms, Firefly Algorithm based on the flickering behavior of fireflies [40], Beetle Antennae Search algorithm based on the foraging principle of aspen bark beetles [41], Grey Wolf Optimization (GWO) algorithm inspired by the hierarchy and predatory behavior of gray wolf packs [42], and Virus Colony Search algorithm [43], which is based on the proliferation and infection strategies of viruses to survive and reproduce in the cellular environment through host cells. Simulation of human behavior: Tabu Search [44], Socio Evolution and Learning Optimization [45], Teaching Learning Based Optimization [46], and Imperialist Competitive Algorithm [47].
Harris Hawks Optimization (HHO) [24] is a swarm intelligence optimization algorithm proposed by Heidari et al. in 2019 to simulate the prey hunting process of Harris’s hawks in nature. The algorithm was inspired by the three phases of Harris’s hawks’ predatory behavior: search, search-exploitation conversion, and exploitation. The algorithm has a simple principle, fewer parameters, and better global search capability. Therefore, HHO has been applied in image segmentation [48], neural network training [49], motor control [50] and other fields. However, similar to other swarm intelligence optimization algorithms, HHO has the disadvantages of slow convergence speed, low optimization accuracy, and easily falls into local optimum when solving complex optimization problems. For example, the literature [51] used the information exchange mechanism to enhance the population diversity, thus improving the convergence speed of the HHO algorithm with information exchange (IEHHO) algorithm. The limitation of the IEHHO algorithm is how to set the parameters of the proposed algorithm. Zhang et al. [52] introduced an exponentially decreasing strategy to update the energy factor to increase the exploration and exploitation capability obtained by the relatively higher values of escaping energy; Elgamal et al. [53] made two improvements: (1) they applied chaotic mapping in the initialization phase of HHO; and (2) they used the SA algorithm as the current best solution to improve HHO exploitation; Shiming Song et al. [54] applied Gaussian mutation and a dimension decision strategy of the cuckoo search method into this algorithm to increase the HHO’s performance. The mechanism of cuckoo search was useful in improving the convergence speed of the search agents as well as sufficient excavation of the solutions in the search area, while the Gaussian mutation strategy performed well in increasing the accuracy and jumping of the local optimum.
However, according to the no free lunch theory [55], one meta-heuristics algorithm cannot always perform as the best on all operations. The original HHO method could not fully balance the exploration and exploitation phases, which resulted in insufficient global search capability and slow convergence of the HHO method. To alleviate these adverse effects, we propose an improved algorithm model called chaotic multi-strategy search HHO (CSHHO), which introduces chaotic mapping and global search strategy, to solve single-objective optimization problems efficiently.
Here, the initialization phase of HHO is replaced by chaotic mapping, which allows the population initialization phase to be evenly distributed in the upper and lower bounds to enhance the population diversity, simultaneously enabling the population to approach the prey location faster, which accelerates the convergence speed of the algorithm. The adaptive weights are added to the position update formula in the exploration phase of HHO to dynamically adjust the influence of the global optimal solution. In the update phase of the HHO, the optimal neighborhood perturbation strategy is introduced to prevent the algorithm from falling into the local optimal solution and to solve the premature aging phenomenon.
To verify the superior performance of the CSHHO algorithm, this experiment first tests the effect of common chaotic mappings of the HHO algorithm’s performance. The selected chaotic mappings are Sinusoidal, Tent, Kent, Cubic, Logistic, Gauss, and Circle, and the experimental results will show that Gauss chaotic mapping improves the accuracy of the HHO algorithm to the greatest extent. Second, the HHO algorithm based on Gauss chaotic mapping with multi-strategy search is tested. Then, it is compared with other classic and state-of-the-art algorithms on 23 classic test functions and 30 IEEE CEC2017 competition functions to verify the significant superiority of the proposed paradigm over other algorithms by Friedman test and Bonferroni–Holm corrected Wilcoxon signed-rank test. Finally, CSHHO is applied to model the reactive power output problem of a synchronous condenser based on LSSVM. The complete results will show that the effectiveness of the proposed optimizer is better than other models in the experiment.
The remainder of this paper is organized as follows: Section 2 introduces the basic theory and structure of the original HHO algorithm. Section 3 introduces the chaotic operator and Global search strategy to integrate it into the original optimizer. Section 4 conducts a full range of experiments on the proposed method and demonstrates the experimental results. It further discusses the proposed method based on experimental results. Section 5 applies the proposed method to the LSSVM-based synchronous condenser reactive power output problem. Finally, Section 6 summarizes the study and proposes research ideas for the future.
2. Harris Hawks Optimization Algorithm
The HHO algorithm is a swarm intelligence optimization algorithm that is widely used in solving optimization problems. The main idea of the algorithm is derived from the cooperative behavior and chasing strategy of Harris’s hawk when catching prey in nature [24]. In the process of prey capture, the HHO algorithm is divided into two segments according to the physical energy E of the prey at the time of escape: exploration and exploitation phases, as shown in Figure 1. During the exploration phase, Harris’s hawks randomly select a perching location to observe and monitor their prey.
where and denote the position of the prey and the individual position at time t, respectively, and q is a random number between (0, 1), the average individual position:
As the physical capacity of the prey decreases, the exploration phase changes to the exploitation phase, the prey’s physical energy factor E is as follows:
In the exploitation phase, the Harris’s hawk launches a surprise attack on the target prey found in the exploration phase, and the prey tries to escape when it encounters danger. Let the randomly generated prey escape probability be r, when r < 0.5 the prey successfully escapes; when r > 0.5 the prey does not successfully escape. According to the magnitude of r and |E|, four different location update strategies were proposed in the exploitation phase (see Table 1).
According to the position update condition in the HHO algorithm, the position of the Harris hawk is updated continuously, the fitness value was calculated according to the position of the Harris hawk, and if the fitness threshold was reached, the algorithm was finished. Otherwise, the algorithm continued to execute, and if the maximum number of iterations was reached, the algorithm was finished, and the optimal solution was obtained (See Figure 2).
3. HHO Algorithm Based on Multi-Search Strategy
3.1. Reasons for Improving the Basic HHO Algorithm
Harris’s hawks generally gather high in trees to hunt for prey. In the process of hunting for prey, they often hover in a spiral to capture prey; when approaching prey, they rush towards their prey at a faster speed until the distance from the prey is small. They slow down and adjust their body posture to increase the probability of their catching prey [56,57,58]. This mechanism is important in the HHO algorithm. The exploration phase of the basic HHO algorithm uses Equations (1)–(3), where the optimal solution from the previous iteration of the algorithm affected the current solution and caused the algorithm to fall into a local optimum. The search for prey in a linear way led to a single search result. From all iterations of the algorithm, the optimal position of the current algorithm was only updated when the algorithm searched for a better solution than the current one, and the overall number of updates of the optimal position was low, which led to a decrease in the efficiency of the algorithm’s search. In reality, when a Harris’s hawk chases its prey, it hovers and descends in a spiral manner to catch its prey adaptively, showing better agility when hunting.
Here, the optimal neighborhood disturbance strategy was introduced to enhance the convergence speed of the algorithm and avoid premature maturity of the algorithm. The adaptive weighting and variable spiral position update strategies were introduced to enhance the global search capability of the algorithm by simulating the predation process of Harris’s hawks in nature. To make the initial solution generated in the population initialization phase of the HHO algorithm cover the solution space as much as possible, we selected the best chaotic mapping method for HHO among seven commonly used chaotic mapping population initialization methods. It was used as the population initialization method to improve the algorithm. Hence, the above four methods are used to improve the global search capability of the HHO algorithm and to increase the speed of Harris Hawk’s search for the optimal solution.
3.2. Chaotic Mapping
Chaotic is a deterministic stochastic method found in non-periodic, non-convergence and bounded nonlinear dynamic systems. Mathematically, chaotic is the randomness of a simple deterministic dynamic system, and a chaotic system is considered as the source of randomness. The essence of chaotic is obviously random and unpredictable, and it also has regularity [59].
As an important part of the population initialization algorithm, its result directly affects the convergence speed and quality of the algorithm [60,61]. For example, uniform distribution has more complete coverage of solution space than random distribution, and it is easier to obtain good initial solutions. A classical HHO algorithm uses random population initialization operation, which cannot cover the whole solution space. A chaotic sequence has ergodicity, randomness, and regularity in a certain range. Compared with random search, chaotic sequence searches the search space thoroughly with higher probability, which enables the algorithm to go beyond the local optimum and maintain the diversity of the population. Based on the above analysis, to obtain a good initial solution position and speed up the convergence of the population, seven common chaotic mappings Sinusoidal, Tent, Kent, Cubic, Logistic, Gauss, and Circle were selected [62,63,64,65,66,67,68,69] and used to initialize the population of HHO algorithm. The results were analyzed and the optimal one for the HHO algorithm selected as the population initialization method for the improved algorithm. The following were the mathematical formulas of the 10 chaotic mappings:
(1) Sinusoidal chaotic mapping:
where P was the control parameter, here , x0 = 0.7, Equation (14) was written as
(2) Tent chaotic mapping
(3) Kent chaotic mapping
The control parameter , when , the system was Short Period State, was not taken here. When using the chaotic mapping, the initial value had to not be the same as the system parameters , otherwise the system evolved into a periodic system. Here, we took .
(4) Cubic chaotic mapping
The standard Cubic chaotic mapping function was expressed as
where b and c were the influence factors of chaotic mapping. The range of Cubic chaotic mapping was different for different values to b and c. When , the sequence generated by Cubic mapping was chaotic. Also when b = 1,
; when b = 4, . Here, we took b = 4 and c = 3.
(5) Logistic chaotic mapping
when P = 4, the generation number of Logistic chaotic mapping was between (0, 1).
(6) Gauss chaotic mapping
(7) Circle chaotic mapping
The three steps to initialize the population of the HHO using the seven chaotic mappings were:
- Step 1: Randomly generate M Harris hawks in D-dimensional space, i.e., .
- Step 2: Iterate each dimension of each Harris hawk M times, resulting in M Harris hawks.
- Step 3: After all Harris hawk iterations were completed, chaotic mapping (21) was applied to the solution space.
Here, we first proposed the HHO algorithm based on seven different chaotic initialization strategies, respectively, chaotic initialization Harris hawks optimization (CIHHO) algorithm. Obviously, the implementation of CIHHO is basically the same as that of HHO, except that the initialization in Step 2 generates m individual Harris hawks using Equations (14)–(21), and then maps the positions of these m Harris hawks to the search space of the population using Equation (22).
3.3. Adaptive Weight
Inspired by the predation process of the Harris’s hawk hunting strategy, we added an adaptive weight to the position update of Harris’s hawk that changed with the number of iterations. In the early stage of the exploration phase of HHO, the influence of the optimal Harris’s hawk position on the current individual position adjustment was weakened to improve the global search ability of the algorithm in the early stage. As the number of iterations increased, the influence of the optimal Harris’s hawk position gradually increased, so that other Harris hawks could quickly converge to the optimal Harris hawk position and improve the convergence speed of the whole algorithm. According to the variation of the number of updates in the HHO algorithm, the adaptive weight composed of the number of iterations t were chosen as follows:
Such adaptive weight had a property of nonlinear variation between [0, 1], due to the variation property of the cos function between , so that the weights were small at the beginning stage of the exploration phase, but changed slightly faster; at the end of the exploration phase their values were larger, but the speed of change would slow down, so that the convergence of the algorithm was fully guaranteed. The improved HHO algorithm position update formula is:
The position update after the introduction of adaptive weights dynamically adjusted the weight size according to the increase of the number of iterations, so that the randomly selected Harris’s hawk position and the optimal average Harris’s hawk position in the population guide the individual Harris’s hawks differently at different times. As the number of iterations increased, the Harris’s hawk population would move closer to the optimal position, and the larger weights would speed up the movement of Harris’s hawk positions, which accelerated the convergence of the algorithm.
3.4. Variable Spiral Position Update
In the search phase of the HHO algorithm, Harris’s hawk randomly searched for prey in two equal-opportunity strategies based on target location and its own location. However, in nature, Harris’s hawks generally hover in a spiral shape to search for prey. To simulate the real process of prey search in nature, we introduced a variable spiral position update strategy in the search phase of the HHO algorithm, so that the Harris’s hawk would adjust the distance of each position update according to the spiral shape between the target position and its own position (see Figure 3).
In the exploration phase of the HHO algorithm, Equation (1), a constant b was introduced to control the shape of the spiral; if this parameter was set to a constant, each time the Harris’s hawk position updated a different spiral arc for speed adjustment would follow. However, if b was set to a constant value, the spiral movement of the Harris’s hawk would be too singular when searching for prey, and it would follow a fixed spiral line to approach the target every time, which would easily fall into the misconception of local optimal solution and weaken the global exploration ability of the algorithm. To address this, we introduced the idea of variable spiral search to enable the Harris’s hawk to develop more diverse search path strategies for location update and design the parameter b as a variable that changes with the number of iterations to dynamically adjust the shape of the spiral when the Harris’s hawk explores, to increase the ability of the Harris’s hawk to explore unknown areas; thus, improving the global search capability of the algorithm. After combining the adaptive weights, the new spiral position update was created (see Equation (25)).
The b parameter was designed based on the mathematical model of the spiral, and the spiral shape was dynamically adjusted by introducing the number of iterations on the basis of the original spiral model. The b parameter was designed in such a way that the spiral shape changed from large to small as the number of iterations increased. Early in the exploration phase of the HHO algorithm, the Harris’s hawk searches the target with a larger spiral shape, the Harris hawk explores the global optimal solution as much as possible to improve the global optimal search capability of the algorithm; later in the exploration phase of the HHO algorithm, the Harris’s hawk searched the target with a small spiral shape to improve the algorithm’s search accuracy.
3.5. Optimal Neighborhood Disturbance
When updating the position, the Harris’s hawk generally takes the current optimal position as the target of this iteration. In the whole iteration, the optimal position is updated only when there is a better position; thus, the total number of updates was not many, which led to the inefficiency of the algorithm search. In this regard, the optimal neighborhood disturbance strategy was introduced to search the neighborhood of the optimal position randomly to find a better global value, which could not only improve the convergence speed of the algorithm, but also avoided premature maturity of the algorithm. The optimal position generated a random disturbance to increase its search of the nearby space, and the neighborhood disturbance formula was:
where h and g were random numbers uniformly generated between [0, 1]; was the new position generated. For the generated neighborhood positions, a greedy strategy was used to determine whether to keep them, and the formula was:
where was the position adaptation value of x. If the generated position was better than the original position, it would be replaced with the original position to make it the global optimum. Otherwise, the optimal position remained unchanged.
3.6. Computational Complexity
The computational complexity of the population initialization process of the classical HHO algorithm is O(N), and the computational complexity of the updated mechanism was O(T × N) + O(T × N × D), so the computational complexity of the classical HHO algorithm was O(N × (T + TD + 1)), where T was the maximum number of iterations and D the dimension of the specific problem. The computational complexity of the population initialization process of the CSHHO algorithm was O(ND), and the computational complexity of the update mechanism was the same as that of the classical HHO algorithm, so the computational complexity of the CSHHO algorithm was O(N × (T + TD + D)), where T was the maximum number of iterations, and D the dimensionality of the specific problem.
3.7. Algorithm Procedure
Algorithm 1 shows the procedure of the CSHHO optimization algorithm: See Algorithm 1.
| Algorithm 1: CSHHO algorithm |
| Input: The population size N, maximum number of iterations T. |
| Output: The location of rabbit and its fitness value. |
| Using Seven chaotic maps to initialize the population: |
| Through chaotic variables [0, 1], k = 1, 2, …, M. M indicates the initial population dimension and Equations (14)–(21)generate initial chaotic vector; |
| Inverse mapping to get the initial population of the corresponding solution space through Equation (22); |
| While stopping condition is not meet do |
| Calculate the fitness values of hawks; |
| Set as best location of rabbit; |
| For do |
| Update the E using Equation (3); if then |
| ; |
| ; |
| If then |
| ; |
| end |
| if q < 0.5 then |
| ; |
| end |
| end |
| if |E| < 1 then |
| if ≥ 0.5 and |E| ≥ 0.5 then |
| using Equations (4)–(6); |
| end |
| else if r ≥ 0.5 and |E| < 0.5 then |
| using Equation (7); |
| end |
| else if r < 0.5 and E |≥ 0.5 |
| using Equations (8)–(11); |
| end |
| else if r < 0.5and |E| < 0.5 |
| using Equations (12) and (13); |
| end |
| end |
| end |
| Optimal neighborhood disturbance using Equations (27) and (28); |
| ; |
| ; |
| end |
| Return; |
4. Experiments and Discussion
In this section, to test and verify the performance of our optimizer proposed, namely CSHHO, a different category of experiments were designed. According to the randomness of the HHO algorithm, this section used a necessary and acceptable set of test functions to ensure that the superior results of the CSHHO algorithm did not happen by accident. Therefore, this section used two different benchmark test suites: classical 23 well-known benchmark functions [70,71] and standard IEEE CEC 2017 [72]. All experiments were as follows:
Experiment 1: First, seven chaotic mappings were used as the initialization method of HHO population and tested separately. Second, the seven data sets are analyzed, and the optimal chaotic mapping was selected as the population initialization method of the improved algorithm.
Experiment 2: First, on the basis of Experiment 1, a combination test of adaptive weighting mechanism, variable spiral position update and optimal neighborhood disturbance mechanism was executed. Second, we analyzed and compared the CSHHO algorithm with other recently proposed meta-heuristic algorithms such as HHO [24], WOA [38], SCA [73], and Chicken Swarm Optimization (CSO) [74]. Third, we analyzed and compared the CSHHO algorithm with developed advanced variants such as HHO with dimension decision logic and Gaussian mutation (GCHHO) [54] and Hybrid PSO Algorithm with Adaptive Step Search (DEPSOASS) [75] and Gravitational search algorithm with linearly decreasing gravitational constant (Improved GSA) [76] and Dynamic Generalized Opposition-based Learning Fruit Fly Algorithm (DGOBLFOA) [77]. Fourth, based on the third step, the IEEE CEC 2017 was used to perform an algorithm-based accuracy scalability test with test dimensions D = 50, D = 100.
To ensure the fairness of the experiments, the experiments were evaluated using the same parameters, and all population sizes N were set to 30, and dimension D was set to 30; each algorithm on each test instance was performed over 50 independent runs. In each run, the function error value , where F(x) was mean value found at all of the run, and was the optimal value recorded in 23 benchmark functions. The average error (Mean) and standard deviation (Std) of the function error values were considered as two performance metrics for evaluating the performance of the algorithm in all runs. The experimental environment: CPU Intel(R) Xeon(R) CPU E5-2680 v3 (2.50 GHz), RAM 16.00 GB, MATLAB R2019b.
4.1. Benchmark Functions Verification
All experiments were performed using the classical 23 test functions [70,71] to test the performance of each algorithm in terms of convergence speed and search accuracy. These Benchmark functions were divided into three categories, including unimodal (UM) and multi-modal (MM). F1–F7 were the UM functions, which had unique global optimality and were used to test the exploitation performance of optimization algorithms. F8–F23 were the MM functions, which were used to test the exploration performance of the optimization algorithm and LO avoidance potentials. As the complexity of the test functions increased, the tested algorithms were more likely to fall into local optima, and all the test functions were used to evaluate the performance of the tested algorithms in various aspects. The convergence curves and test values of the corresponding test functions are given. Appendix A shows the classical 23 test functions.
IEEE CEC 2017 functions were also used in Experiment 2 to evaluate the scalability of CSHHO, other meta-heuristic algorithms, and developed HHO advanced variants. IEEE CEC 2017 Benchmark functions were classified into four categories, consisting of three UM functions (F1–F3), seven MM functions (F4–F10), 10 hybrid functions (F11–F20), and 10 composite functions (F21–F30). To evaluate the scalability of each algorithm more comprehensively, the dimensions of Benchmark functions were set to D = 50, D = 100, and Table 2 records the corresponding accuracy values. It also shows the function formulas for IEEE CEC 2017.
In addition, to compare the performance of various algorithms, the rank was used to rank the mean values of all the algorithms in the simulation experiment in the order of lowest to highest. The lower the rank, the better the algorithm was compared to other algorithms; conversely, the higher the rank, the worse the algorithm was compared to other algorithms. Wilcoxon signed-rank test [78] was used to detect whether there was a significant performance difference among all algorithms, the p-value was corrected by Bonferroni–Holm correction [79]; moreover, the Friedman test [80] was used to rank the superiority of all the algorithms.
We used the values of the Friedman test to rank all the algorithms involved in the comparison, if the values of the Friedman test were the same, then the rankings were averaged. Here, the Friedman test was performed on the classical 23 test functions, and the test values were recorded in the average ranking values (ARV) column.
4.2. Efficiency Analysis of the Improvement Strategy
First, in the population initialization phase, we selected the Gauss mapping, which had the highest impact on the accuracy of the HHO algorithm, as the population initialization method of CSHHO from seven commonly used chaotic mappings. Second, a global optimization strategy was used to optimize the HHO algorithm, which consisted of three components, including adaptive weight strategy, variable spiral update strategy and optimal neighborhood disturbance strategy. To verify the performance improvement of the HHO algorithm by the two improvements, six algorithms were used for comparison:
- HHO without any modification, i.e., basic HHO;
- WOA without any modification, i.e., basic WOA;
- SCA without any modification, i.e., basic SCA;
- CSO without any modification, i.e., basic CSO;
- HHO with dimension decision logic and Gaussian mutation (GCHHO);
- Hybrid PSO Algorithm with Adaptive Step Search (DEPSOASS);
- Gravitational search algorithm with linearly decreasing gravitational constant (Improved GSA);
- Dynamic Generalized Opposition-based Learning Fruit Fly Algorithm (DGOBLFOA).
4.2.1. Influence of Seven Common Chaotic Mappings on HHO Algorithm
In order to select the best effective chaotic mapping method among seven well-known chaotic mapping methods, which enables us to obtain the best initial solution position and speed up the convergence of the Harris Hawk algorithm population, sinusoidal chaotic mapping, Tent chaotic mapping, Kent chaotic mapping, Cubic chaotic mapping, Logistic chaotic mapping, Gauss chaotic mapping, Circle chaotic mapping were initialized to the population of the HHO algorithm, respectively, forming Sinusoidal-HHO, Tent-HHO, Kent-HHO, Cubic-HHO, Logistic-HHO, Gauss-HHO, Circle-HHO, and we compared the accuracy of these seven algorithms.
Table 3 presents the results of the seven algorithms for 23 classical test functions. The results included Best, Worst, Mean, Rank, and Std for each algorithm run 50 times independently.
Table 4 shows the Bonferroni–Holm corrected probability values p obtained from the Wilcoxon signed-rank test for the seven chaotic mapping HHO algorithms. Symbols “+\=\−” represent the number of algorithms that were better, similar, or worse than Gauss-HHO. The ARV at Table 5 is the value of the Friedman test for the seven chaotic mapping HHO algorithms.
Table 3 shows the data with better experimental results in bold. By analyzing the experimental results, we concluded that under the UM functions (F1–F7), Sinusoidal chaotic mapping achieved optimal results in F3, F5, F7 test functions, Circle chaotic mapping achieved optimal results in F1, F4 test functions, and Sinusoidal chaotic mapping had the most influence on the HHO algorithm, followed by Gauss chaotic mapping and Circle chaotic mapping. Under the MM functions (F8–F23), Gauss chaotic mapping had the most influence on the HHO algorithm. Circle chaotic mapping, Sinusoidal chaotic mapping, Tent chaotic mapping, and Kent chaotic mapping obtained the best results in F21, F15, F20, F13, and F23 test functions, respectively; the results of the seven chaotic mappings were compared in 23 test functions, The Gauss chaotic mapping obtained the most optimal solutions.
Table 4 shows the Bonferroni–Holm correction p-values of Wilcoxon signed rank test with 5% confidence level, “+\=\−”indicates whether Gauss-HHO was worse consistent or better with Circle-HHO, Sinusoidal-HHO, Tent-HHO, Kent-HHO, Cubic-HHO and Logistic-HHO. Analyzing the Bonferroni–Holm corrected p-value of Wilcoxon signed rank test and the value of “+\=\−” in each row of the table, better results were obtained using Gauss-HHO based among the 23 tested functions; the experimental results of HHO algorithms based on seven chaotic mappings, respectively, were evaluated comprehensively using Friedman’s test at Table 5, compared with the other six chaotic mappings population initialization methods. Gauss-HHO obtained the best results in terms of average ranking, indicating that for the HHO optimization algorithm, Gauss chaotic mapping not only had the randomness, ergodicity and initial value sensitivity of the chaotic mapping itself, but also the population initialization of the HHO optimization algorithm using Gauss chaotic mapping. The Gauss chaos map was used to initialize the population of the HHO optimization algorithm, and to obtain a better optimization accuracy.
4.2.2. Comparison with Conventional Techniques
The Gauss mapping was used for population initialization. Then the adaptive weight mechanism, variable spiral position update mechanism, and adaptive neighborhood disturbance mechanism were introduced to form the CSHHO algorithm. In order to verify the effectiveness of the CSHHO algorithm against the emerging swarm intelligence optimization algorithms in recent years. In this subsection, the CSHHO algorithm is compared with recently published meta-heuristics, including HHO [24], WOA [24], SCA [65] and CSO [66] to calculate the average precision mean and stability Std of each algorithm. The performance of CSHHO was tested against other optimization algorithms using a nonparametric test: the Bonferroni–Holm corrected Wilcoxon signed rank test. Finally, the non-parametric test method (i.e., the Friedman test) was used to calculate the ARV values of all the participating algorithms and rank them together. As in Experiment 1, this experiment was also based on the test set of 23 classical test functions (see Table 1). The details of the experiment were consistent with the description at the beginning of this section, and Table 6 shows the detailed experimental results. Additionally, Table 7 gives the corrected Wilcoxon signed-rank test based on the 5% confidence level, the “+\=\−” value: the number of CSHHO results that were worse, similar, better or than the comparison algorithm for each test function run 50 times, the result based on the Friedman test was at table.
The optimal results of the tested algorithms under the current Benchmark function are marked in bold. Analyzing the data in Table 6, CSHHO had a strong optimization capability compared to the traditional optimization algorithms. Under the MM functions (F8–F23), CSHHO obtained good results with the best optimization results under the Benchmarks of F9–F13, F15–F19, F21–F23, and CSHHO explored the most optimal region of the above Benchmark and outperformed the other compared optimization algorithms in terms of search performance. The CSHHO explored the above Benchmark optimal regions and outperformed the other participating optimization algorithms in terms of exploration performance. It tied for first place in Benchmark F9, F11, and F11. This showed that CSHHO had strong exploration ability and LO avoidance potentials.
Table 7 was analyzed to determine if there was a significant difference between the other algorithms and CSHHO. The “+\=\−” column indicates the number of results that are less than, similar to, or greater than CSHHO for each of the HHO, WOA, SCA, and CSO algorithms run 50 times in each test function. CSHHO has 21 test functions with better results than HHO, CSHHO has 22 test functions with better results than WOA, CSHHO has 23 test functions with better results than SCA, CSHHO has 22 test functions with better results than CSO; the results of the corrected 5% confidence level Wilcoxon signed rank test were analyzed. If the p-value was greater than 0.05, the algorithm was considered to be the same as CSHHO; otherwise, it was considered to be significantly different. In most cases the p-values of Wilcoxon signed-rank test < 0.5, indicating that the CSHHO algorithm was significantly different from the other compared algorithms, all results were corrected by Bonferroni–Holm correction; At Table 8, analysis of the Friedman test value showed that the value of CSHHO was 2.57 lower than the traditional optimization algorithm. The CSHHO algorithm’s performance was better than other meta-heuristic algorithms.
Figure 4 shows the convergence curves of CSHHO and the traditional optimization algorithms HHO, WOA, SCA and CSO under 23 Benchmark functions, including the performance under UM functions (F1–F7), MM functions (F8–F23), MM functions (F8–F23). The function error value was defined as, where F(x) was the mean value found at all of iterations, and F(x*) was the optimal value recorded in 23 benchmark functions. Among them, under UM functions (F1–F7), the CSHHO algorithm converged with higher accuracy and converged faster than other algorithms, indicating that the development performance of CSHHO algorithm was improved compared with other algorithms; under MM functions (F8–F23), the CSHHO algorithm converged with higher accuracy and converged faster than other algorithms, indicating that the development performance of CSHHO algorithm was improved compared with other algorithms. From F8–F23 CSHHO algorithm did not fall into the local optimum region and could not escape; in F9, F11, F16 CSHHO converged faster in F12, F13, F17, F19, F21–F23. Although the convergence curve of the CSHHO algorithm was smoother and converged slower in the initial iterations as the algorithm searched further. In F10, F15 the CSHHO algorithm not only explores the dominant region with faster convergence speed, but also leads the rest of the algorithms in terms of search accuracy. Therefore, CSHHO algorithm benefits from Gauss chaotic mapping that enhances the population initialization of the algorithm, as well as adaptive weighting mechanism, variable spiral position updating mechanism and adaptive neighborhood disturbance mechanism that enhance the exploration and exploitation ability of the algorithm, CSHHO is less likely to fall into the current search region and increase the ability to jump out of the local optimal region.
4.2.3. Comparison with HHO Variants
In order to verify the effectiveness of the CSHHO algorithm against HHO variants in recent years, this subsection compares the CSHHO algorithm with the recently published advanced HHO variants: GCHHO and DEPSOASS and Improved GSA and DGOBLFOA, observing the mean accuracy mean and stability Std of each algorithm. Table 9 presents the results of the experiments. Next, using nonparametric tests: the Wilcoxon signed-rank test and the Friedman test were used to synthetically assess the performance differences between CSHHO and GCHHO and DEPSOASS and Improved GSA and DGOBLFOA. The configuration of the experiments is the same as in Section 4.2.2, “+\=\−”: the number of CSHHO results obtained from 50 runs in each test function that are worse, similar, or better than the comparison algorithm. Table 10 presents the results of the Bonferroni–Holm correction of Wilcoxon signed-rank test experiments, Table 11 presents the results of the Friedman test experiments.
Analyzing the data in Table 9, CSHHO has some advantages over the advanced HHO variants: under the UM functions (F1–F7), CSHHO outperforms the other algorithms in F1–F4, F6, F7, which indicates that CSHHO has further enhanced global best-finding capability compared to the advanced HHO variants. Under the MM functions (F8–F23) the CSHHO’s performance outperforms the remaining algorithms in F9, F10, F11, F16, F17, F18, F19, F21, which indicates that CSHHO can explore the peak-to-peak information deeply and effectively to avoid the algorithm from entering the local optimum. In summary, CSHHO has a good ability to develop and explore and avoid local optima.
Table 10 shows the results of the corrected Wilcoxon signed rank test at 5% confidence level and Friedman’s test for CSHHO and GCHHO and DEPSOASS and Improved GSA and DGOBLFOA. The p-values indicate whether the numerical results of the algorithms involved in the comparison are significant compared to CSHHO; if the p-value is greater than 0.05, the numerical results of the algorithm are considered the same as CSHHO; otherwise, it is considered to be significantly different. Analyzing the Bonferroni–Holm corrected p-value column values in Table 10, under the 23 classical test functions, only GCHHO is less different from CSHHO in the F9–F11 and F16–18 test functions, and in the rest of the test functions. Moreover, at Table 11 upon analyzing the results of the Friedman test, the value of CSHHO is 1.70, which is lower than others. The result indicates that CSHHO has an advantage over the above algorithms in optimization.
Figure 5 shows the convergence curves of CSHHO and the variants of the optimization algorithm GCHHO and DEPSOASS and Improved GSA and DGOBLFOA under 23 Benchmark Functions, including the performance under UM functions (F1–F7), MM functions (F8–F23). The function error value is defined as, where is the mean value found at all of iterations, and is the optimal value is recorded in 23 The CSHHO algorithm under UM functions (F1–F7) has improved convergence accuracy in F1–F4, F6, F7 compared to other algorithms, and convergence speed is better than other algorithms in F1, F2, F3, F4, F5, F6, F7; under MM functions (F8–F23), CSHHO algorithm does not fall into the local optimal region and cannot escape, in F9, F10, F11, F16, F17, F18, F19, F21. CSHHO can explore the dominant region well and is ahead of other algorithms in terms of search accuracy. In F9, F10, F11, F12, F13, F21, F22, F23, CSHHO has smooth convergence curves and faster convergence speed. In F16–F20, although the convergence speed of the CSHHO algorithm is slow, the convergence curve does not produce large fluctuations, which indicates that the CSHHO algorithm has good search ability, and it does not fall into local optimum and cannot jump out. Functions. In summary, the CSHHO algorithm’s performance is further improved compared to GCHHO algorithm and other advanced algorithms. Compared to these advanced variants, CSHHO algorithm are effective.
4.2.4. Scalability Test on CSHHO
Dimensional data are an important basis for analyzing the influence of the number of factors to be optimized on the algorithm, and the purpose of the scalability test is to further verify the overall performance and stability of the optimization model. The experimental subjects in this section are CSHHO, HHO. 29 CEC2017 functions [72] based on 50 and 100 dimensions, respectively, are used for scalability experiments. In this experiment, the experimental parameters and the experimental environment are consistent with the previous experiments except that the dimensionality settings are different from the previous experiments, and Table 12 shows the experimental results using Mean and Std.
The best numerical results in CSHHO and HHO are set in bold, and the numerical results of both equivalents are in bold. Under the UM function (F1–F2), the numerical results of CSHHO are overall better than those of HHO, and CSHHO continues to maintain some advantage as the number of dimensions increases; under the MM function test (F3–F9), CSHHO performs better than HHO in 50 and 100 dimensions. The CSHHO’s performance in the 50 and 100 dimensions was generally better than that of HHO in the 50 dimensions in F6 and F7 and in the 100 dimensions in F4. In the hybrid function (F10–F19), CSHHO performs better in the rest of the test sets, except for F11 and F12, where it performs lower than HHO. In the composition function (F20–F29), it still has good ability, and the accuracy in functions F21, F22 and F26 is higher than HHO, and the effect in functions F22, F23, F24, F26 is the same as HHO, and the effect in functions F23 (50 dimensions), F26 (100 dimensions) is lower than HHO. In general, compared with HHO, CSHHO can better balance the exploration and exploitation process as the number of dimensions increases.
5. Engineering Application
In this chapter, the proposed CSHHO is applied to model the reactive power output of a synchronous condenser. Due to the large number of UHV DC transmission projects in the power system, to ensure DC to DC power consumption and peaking demand, the scale of conventional units on the receiving AC grid is reduced, the dynamic reactive power support capability of the system is weakened, and the voltage stability margin is reduced [81]. This requires dynamic reactive power compensation devices to have instantaneous reactive power support characteristics in case of system failure, and the synchronous condenser to have reactive power output characteristics to meet the dynamic reactive power compensation requirements of the grid [82]. Modeling the reactive power support capability of a synchronous condenser is of great theoretical significance and practical value for the reactive power control of converter stations in high-voltage DC transmission systems with synchronous condenser.
The existing research methods for modeling the reactive power output of synchronous condenser are the mathematical analytical model calculation method and the experimental result fitting method [83,84,85,86] and both require large computational effort and have low accuracy, but few papers have studied the application of LSSVM in modeling the reactive power output of synchronous condenser. The advantages of the least squares support vector machine (LSSVM) are that it is less likely to fall into local minima and has high generalization ability [87]. Researchers have used various intelligent optimization algorithms to find the optimal results of kernel function parameters and regularization parameters, including the GA [88], Particle Swarm Optimization Algorithm (PSO) [89], Free Search Algorithm (FS) [90], Ant Colony Optimization Algorithm (ACO) [91], ABC Algorithm [92], GWO algorithm [93] and Backtracking Search Optimization Algorithm (BSA) [94], etc. However, the traditional swarm optimization algorithm is prone to the defects of falling into local optimum and low convergence accuracy in the search process. According to the results above, the CSHHO not only reduces the probability of the algorithm falling into local optimum and improves the convergence accuracy of the algorithm, but also has the advantages of the basic Harris Hawk optimization algorithm: 1. the steadiness of the searching cores; 2. the fruitfulness in the initial iterations; 3. the progressive selection scheme [5].
This paper proposes a CSHHO-LSSVM-based reactive power modeling method based on the numerical characteristics and global search capability of CSHHO. The optimal values of the penalty parameters, kernel function parameters, and loss function parameters of the LSSVM are found by using CSHHO to build the CSHHO-LSSVM model for the reactive power output of the synchronous condenser.
5.1. Principle of LSSVM
Support Vector Machine (SVM) is an ML method based on statistical learning theory, with kernel function as the core, which implicitly maps the data in the original space to the high-dimensional feature space, then finds the linear relationship in the feature space [87].
LSSVM is a regression algorithm that extends the basic SVM. Compared with the SVM algorithm, LSSVM requires fewer parameters and is more stable. LSSVM simplifies the complex constraints, which makes the improved SVM more capable of handling data. Moreover, by setting the error sum of squares as the loss function of the algorithm, LSSVM enhances the performance of regression prediction and improves the prediction accuracy. Simultaneously, the complexity of the algorithm is reduced, which reduces the processing time of the algorithm and provides more flexibility. LSSVM uses a nonlinear model on basis of SVM:
The input data were where denoted the different elements, d denoted the dimension, the expected value of the output, and the total number of inputs. denoted the mapping function. In summary, the LSSVM optimization objective was:
.
where denoted the error, the magnitude of which determined the prediction accuracy; denoted the error vector, denoted the regularization parameter r, which determined the magnitude of the error. Adding a Lagrangian multiplier to Equation (29),, Equation (30) was expressed as:
From the KKT condition, we obtained:
By eliminating the slack variables and weight vectors , the optimization problem was linearized:
where , , was an l × 1 dimensional column vector, . According to the Mercer condition, K denoted a kernel function: . The Radial Basis Function kernel function was chosen for the model:
Therefore, the nonlinear prediction model was expressed by Equation (34):
When predicting with least squares support vector regression models, the penalty factor and radial basis kernel function parameters were the two parameters to be solved.
5.2. Simulation and Verification
The reactive power regulation results of a synchronous condenser based on PSCAD/EMTDC simulation software were used as training samples and test samples. Table 11 shows the main parameters. The data with serial numbers 9, 14, 26 and 35 in Table 11 were taken as the test samples, and the rest were the training samples.
First, the data were preprocessed, and the LSSVM was trained by using CSHHO to find the penalty parameters, kernel function parameters and optimal parameters of the loss function (γ, σ, S), and the LSSVM was predicted by applying the test sample to the LSSVM, and the regression fitted prediction model was output. The algorithm flow is shown in Figure 6. Figure 7 compares the output results of the LSSVM model of the test sample and the CSHHO-LSSVM model were compared with those of the test sample and the errors of the LSSVM model of the test sample and the CSHHO-LSSVM model. The output regression of CSHHO-LSSVM model was better fitted and had higher accuracy and radial basis kernel function parameters.
To verify the generalization ability of the CSHHO-LSSVM model, it was evaluated by absolute deviation, as shown in Table 13. The table shows the absolute deviation range of CSHHO-LSSVM model from 0.0123 to 0.989, indicating that the accuracy of the CSHHO-LSSVM model was high.
From the reactive power and system voltage simulation results of the synchronous condenser in Table 14, Table 15 and Table 16, we can see that the maximum absolute error of the reactive power simulation result of CSHHO-LSSVM model was 0. 989 Mvar, and the maximum absolute error of the system voltage simulation result was 0.0415 kV, which were smaller than the simulation results of LSSVM model, indicating that the CSHHO-LSSVM model had higher accuracy and better regression fitting performance. The LSSVM model was more accurate and had better regression fitting performance.
6. Conclusions
Here, we analyzed the shortcomings of the basic HHO algorithm and applied the chaotic mapping population initialization, adaptive weighting, variable spiral position update and optimal neighborhood disturbance mechanisms to the classical HHO algorithm, in which the Gauss chaotic mapping population initialization increased the coverage of the solution space by the initial solution of the algorithm, the adaptive weighting mechanism sped up the movement of Harris hawk populations to the optimal solution, and the variable spiral position update increased the ability of Harris hawk populations. The optimal neighborhood disturbance mechanism helped the improved algorithm to increase the algorithm’s global search capability and avoided premature maturity. To verify the optimal performance of the four strategies, the experiments were separated into two groups.
First, seven commonly used chaotic mappings were selected for the population initialization of the HHO algorithm, including Sinusoidal, Tent, Kent, Cubic, Logistic, Gauss, and Circle mappings. The HHO algorithm’s performance after population initialization of each of these seven mappings was evaluated. The HHO algorithm’s performance after population initialization of Gauss mapping was significantly better than that of the HHO algorithm after population initialization of other mappings in terms of solution accuracy. Second, based on the results of the first set of experiments, the Gauss mapping was used for population initialization, and adaptive weights, variable spiral position update, and optimal neighborhood disturbance mechanisms were introduced into the algorithm after population initialization. Next, CSHHO was compared with other classical algorithms including WOA, SCA, CSO and advanced algorithms including GCHHO and DEPSOASS and Improved GSA and DGOBLFOA based on 23 classical test functions and the means and standard deviations of all algorithms were analyzed. Subsequently, each algorithm’s performance was evaluated comprehensively using Friedman’s test and the Bonferroni–Holm corrected Wilcoxon signed-rank test with 5% confidence level, where numerical analysis concluded that CSHHO outperformed the other algorithms. In detail, analyzing the experimental results of this work, in the population initialization phase, Gauss chaos mapping had the best results in F2, F6, F12, F17, and F23 test functions, and comparing the results of the remaining six chaotic mappings, Gauss chaos mapping obtained the most optimal solutions; CSHHO algorithm outperformed HHO in 17 benchmark functions out of 23 classical test functions, outperformed WOA in 21 results, SCA in 23 results, and CSO in 22 experiments. It outperformed GCHHO in 9 results. Meanwhile, in the statistical experiments of advanced meta-heuristic and classical meta-heuristic, the ARVs obtained by CSHHO were 1.93 and 2.57, respectively, which were lower than the values obtained by other pairwise meta-heuristics in the same group of experiments. Additionally, dimensional scalability tests were conducted for CSHHO on the IEEECEC2017 dataset, including 50 and 100 dimensions, and the results showed that the improved optimizer effectively handled high-dimensional data with good stability. Meanwhile, in the statistical experiments of advanced meta-heuristic and classical meta-heuristic, CSHHO obtained ARVs of 1.70 and 2.57, respectively, which were lower than the values obtained by other meta-heuristic algorithms in the same set of experiments. Furthermore, dimensional scalability tests were conducted for CSHHO on the IEEE CEC 2017 dataset, including 50 and 100 dimensions, and the results showed that the improved optimizer effectively handled high-dimensional data with excellent stability.
Here, the CSHHO algorithm was also applied to the engineering problem of reactive power output modeling of the synchronous condenser. In view of the defects of the many calculations and low accuracy of the traditional reactive power output modeling method of the synchronous condenser, CSHHO-LSSVM was used to model the reactive power output of the synchronous condenser based on the advantages of LSSVM, which was not easy to fall into local minimum and had strong generalization ability, and CSHHO had high search accuracy and strong global search ability. The excitation current and excitation voltage of the synchronous condenser were used as the input of the LSSVM model, and the reactive power and system voltage were used as the LSSVM model’s output. CSHHO was used to find the optimal values of the penalty parameter, kernel function parameter, and loss function parameter of LSSVM. The experiment showed that the CSHHHO-LSSVM model had better accuracy and better regression fitting performance compared with LSSVM.
In future work, we will try to improve the convergence speed and search accuracy of the algorithm and balance the exploration and exploitation phases of the algorithm to obtain better search performance. Additionally, the next step will be to investigate how CSHHO can be used to solve multi-objective optimization problems. In addition, CSHHO can also be used for evolutionary ML, such as extreme learning machines and parameter tuning of convolution neural networks. Other problems include grid scheduling and 3D multi-objective tracking.
Author Contributions
Methodology, C.W.; resources, S.J.; funding acquisition, S.J., R.G., Y.L. and Q.Z. All authors have read and agreed to the published version of the manuscript.
Funding
This work is supported by the National Natural Science Foundation of China (No. 61871318), the Shaanxi Provincial Key Research and Development Project (No. 2019GY-099) and Open project of Shaanxi Key Laboratory of Complex System Control and Intelligent Information Processing (No. 2020CP10).
Institutional Review Board Statement
The study did not involve human and animals.
Informed Consent Statement
The study did not involve human and animals.
Data Availability Statement
In the paper, all the data generation information has been given in detail in the related chapter.
Acknowledgments
The author thanks the referees for detailed and constructive criticism of the original manuscript.
Conflicts of Interest
The authors declare no conflict of interest.
Appendix A

Table A1.
The classical 23 test functions.
| Function | Dimensions | Range | |
|---|---|---|---|
| unimodal benchmark functions | |||
| 30,100, 500, 1000 | [100, 100] | 0 | |
| 30,100, 500, 1000 | [10, 10] | 0 | |
| 30,100, 500, 1000 | [100, 100] | 0 | |
| 30,100, 500, 1000 | [100, 100] | 0 | |
| 30,100, 500, 1000 | [30, 30] | 0 | |
| 30,100, 500, 1000 | [100, 100] | 0 | |
| 30,100, 500, 1000 | [128, 128] | 0 | |
| multimodal benchmark functions | |||
| 30,100, 500, 1000 | [500, 500] | −418.9829 × n | |
| 30,100, 500, 1000 | [5.12, 5.12] | 0 | |
| 30,100, 500, 1000 | [32, 32] | 0 | |
| 30,100, 500, 1000 | [600, 600] | 0 | |
| 30,100, 500, 1000 | [50, 50] | 0 | |
| 30,100, 500, 1000 | [50, 50] | 0 | |
| fixed-dimension multimodal benchmark functions | |||
| 2 | [−65, 65] | 1 | |
| 4 | [−5, 5] | 0.00030 | |
| 2 | [−5, 5] | −1.0316 | |
| 2 | [−5, 5] | 0.398 | |
| 2 | [−2, 2] | 3 | |
| 3 | [1, 3] | −3.86 | |
| 6 | [0, 1] | −3.32 | |
| 4 | [0, 10] | −10.1532 | |
| 4 | [0, 10] | −10.4028 | |
| 4 | [0, 10] | −10.5363 | |
References
- Kundu, T.; Garg, H. A Hybrid ITLHHO Algorithm for Numerical and Engineering Optimization Problems. Int. J. Intell. Syst. 2021, 36, 1–81. [Google Scholar] [CrossRef]
- Garg, H. A Hybrid GSA-GA Algorithm for Constrained Optimization Problems. Inf. Sci. 2019, 478, 499–523. [Google Scholar] [CrossRef]
- Garg, H. A hybrid PSO-GA algorithm for constrained optimization problems. Appl. Math. Comput. 2016, 274, 292–305. [Google Scholar] [CrossRef]
- Wu, Y. A Survey on Population-Based Meta-Heuristic Algorithms for Motion Planning of Aircraft. Swarm Evol. Comput. 2021, 62, 100844. [Google Scholar] [CrossRef]
- Alabool, H.M.; Alarabiat, D.; Abualigah, L.; Heidari, A.A. Harris hawks optimization: A comprehensive review of recent variants and applications. Neural Comput. Appl. 2021, 33, 8939–8980. [Google Scholar] [CrossRef]
- Vasant, P. Handbook of Research on Artificial Intelligence Techniques and Algorithms; IGI Global: Hershey, PA, USA, 2015. [Google Scholar] [CrossRef]
- Simon, D. Evolutionary Optimization Algorithms: Biologically-Inspired and Population-Based Approaches to Computer Intelligence; John Wiley & Sons Inc.: Hoboken, NJ, USA, 2013; ISBN 978-0-470-93741-9. [Google Scholar]
- Dréo, J. (Ed.) Metaheuristics for Hard Optimization: Methods and Case Studies; Springer: Berlin, Germany, 2006; ISBN 978-3-540-23022-9. [Google Scholar]
- Salcedo-Sanz, S. Modern Meta-Heuristics Based on Nonlinear Physics Processes: A Review of Models and Design Procedures. Phys. Rep. 2016, 655, 1–70. [Google Scholar] [CrossRef]
- Adeyanju, O.M.; Canha, L.N. Decentralized Multi-Area Multi-Agent Economic Dispatch Model Using Select Meta-Heuristic Optimization Algorithms. Electr. Power Syst. Res. 2021, 195, 107128. [Google Scholar] [CrossRef]
- Zhu, M.; Chu, S.-C.; Yang, Q.; Li, W.; Pan, J.-S. Compact Sine Cosine Algorithm with Multigroup and Multistrategy for Dispatching System of Public Transit Vehicles. J. Adv. Transp. 2021, 2021, 1–16. [Google Scholar] [CrossRef]
- Fu, X.; Fortino, G.; Li, W.; Pace, P.; Yang, Y. WSNs-Assisted Opportunistic Network for Low-Latency Message Forwarding in Sparse Settings. Future Gener. Comput. Syst. 2019, 91, 223–237. [Google Scholar] [CrossRef]
- Dhiman, G. SSC: A Hybrid Nature-Inspired Meta-Heuristic Optimization Algorithm for Engineering Applications. Knowl.-Based Syst. 2021, 222, 106926. [Google Scholar] [CrossRef]
- Han, Y.; Gu, X. Improved Multipopulation Discrete Differential Evolution Algorithm for the Scheduling of Multipurpose Batch Plants. Ind. Eng. Chem. Res. 2021, 60, 5530–5547. [Google Scholar] [CrossRef]
- Loukil, T.; Teghem, J.; Tuyttens, D. Solving multi-objective production scheduling problems using meta-heuristics. Eur. J.Oper. Res. 2005, 161, 42–61. [Google Scholar] [CrossRef]
- Li, Q.; Chen, H.; Huang, H.; Zhao, X.; Cai, Z.; Tong, C.; Liu, W.; Tian, X. An Enhanced Grey Wolf Optimization Based Feature Selection Wrapped Kernel Extreme Learning Machine for Medical Diagnosis. Comput. Math. Methods Med. 2017, 1–15. [Google Scholar] [CrossRef]
- Li, Y.; Liu, J.; Tang, Z.; Lei, B. Deep Spatial-Temporal Feature Fusion From Adaptive Dynamic Functional Connectivity for MCI Identification. IEEE Trans. Med. Imaging. 2020, 39, 2818–2830. [Google Scholar] [CrossRef] [PubMed]
- Corazza, M.; di Tollo, G.; Fasano, G.; Pesenti, R. A Novel Hybrid PSO-Based Metaheuristic for Costly Portfolio Selection Problems. Ann. Oper. Res. 2021, 304, 109–137. [Google Scholar] [CrossRef]
- Gaspero, L.D.; Tollo, G.D.; Roli, A.; Schaerf, A. Hybrid Metaheuristics for Constrained Portfolio Selection Problems. Quant. Financ. 2011, 11, 1473–1487. [Google Scholar] [CrossRef]
- Shen, L.; Chen, H.; Yu, Z.; Kang, W.; Zhang, B.; Li, H.; Yang, B.; Liu, D. Evolving Support Vector Machines Using Fruit Fly Optimization for Medical Data Classification. Knowl.-Based Syst. 2016, 96, 61–75. [Google Scholar] [CrossRef]
- Wang, M.; Chen, H.; Yang, B.; Zhao, X.; Hu, L.; Cai, Z.; Huang, H.; Tong, C. Toward an Optimal Kernel Extreme Learning Machine Using a Chaotic Moth-Flame Optimization Strategy with Applications in Medical Diagnoses. Neurocomputing 2017, 267, 69–84. [Google Scholar] [CrossRef]
- Song, J.; Zheng, W.X.; Niu, Y. Self-Triggered Sliding Mode Control for Networked PMSM Speed Regulation System: A PSO-Optimized Super-Twisting Algorithm. IEEE Trans. Ind. Electron. 2021, 69, 763–773. [Google Scholar] [CrossRef]
- Mirjalili, S.; Lewis, A. The whale optimization algorithm. Adv. Eng. Softw. 2016, 95, 51–67. [Google Scholar] [CrossRef]
- Heidari, A.A.; Mirjalili, S.; Faris, H.; Aljarah, I.; Mafarja, M.; Chen, H. Harris hawks optimization: Algorithm and applications. Future Gen. Comput. Syst. 2019, 97, 849–872. [Google Scholar] [CrossRef]
- Dong, W.; Zhou, M. A Supervised Learning and Control Method to Improve Particle Swarm Optimization Algorithms. IEEE Trans. Syst. Man Cybern. Syst. 2017, 47, 1135–1148. [Google Scholar] [CrossRef]
- Mareda, T.; Gaudard, L.; Romerio, F. A Parametric Genetic Algorithm Approach to Assess Complementary Options of Large Scale Windsolar Coupling. IEEE/CAA J. Autom. Sin. 2017, 4, 260–272. [Google Scholar] [CrossRef] [Green Version]
- Jian, Z.; Liu, S.; Zhou, M. Modified cuckoo search algorithm to solve economic power dispatch optimization problems. IEEE/CAA J. Autom. Sin. 2018, 5, 794–806. [Google Scholar]
- Kirkpatrick, S.; Gelatt, C.D.; Vecchi, M.P. Optimization by Simulated Annealing. Science. 1983, 220, 671–680. [Google Scholar] [CrossRef]
- Xing, B.; Gao, W.-J. Gravitational Search Algorithm. In Innovative Computational Intelligence: A Rough Guide to 134 Clever Algorithms; Intelligent Systems Reference Library; Springer International Publishing: Cham, Germany, 2014; Volume 62, pp. 355–364. ISBN 978-3-319-03403-4. [Google Scholar]
- Alatas, B. ACROA: Artificial chemical reaction optimization algorithm for global optimization. Expert Syst. Appl. 2011, 38, 13170–13180. [Google Scholar] [CrossRef]
- Patel, V.K.; Savsani, V.J. Heat transfer search (HTS): A novel optimization algorithm. Inf. Sci. 2015, 324, 217–246. [Google Scholar] [CrossRef]
- Abdechiri, M.; Meybodi, M.R.; Bahrami, H. Gases brownian motion optimization: An algorithm for optimization (GBMO). Appl. Soft Comput. 2013, 13, 2932–2946. [Google Scholar] [CrossRef]
- Hashim, F.A.; Houssein, E.H.; Mabrouk, M.S.; Al-Atabany, W.; Mirjalili, S. Henry gas solubility optimization: A novel physics-based algorithm. Future Gener. Comput. Syst. 2019, 101, 646–667. [Google Scholar] [CrossRef]
- Holland, J.H. Genetic Algorithms. Sci. Am. 1992, 267, 66–72. [Google Scholar] [CrossRef]
- Schneider, B.; Ranft, U. Simulationsmethoden in der Medizin und Biologie; Springer: Berlin/Heidelberg, Germany, 1978. [Google Scholar]
- Yang, X.-S. Differential evolution. In Nature-Inspired Optimization Algorithms. Algorithms; Elsevier: London UK, 2021; Volume 6, pp. 101–109. [Google Scholar]
- Storn, R.; Price, K. Differential evolution–A simple and efficient heuristic for global optimization over continuous spaces. J. Glob. Optim. 1997, 11, 341–359. [Google Scholar] [CrossRef]
- Simon, D. Biogeography-Based Optimization. IEEE Trans. Evol. Comput. 2008, 12, 702–713. [Google Scholar] [CrossRef] [Green Version]
- Karaboga, D.; Akay, B. A comparative study of Artificial Bee Colony algorithm. Appl. Math. Comput. 2009, 214, 108–132. [Google Scholar] [CrossRef]
- Yang, X.S. Firefly algorithm, stochastic test functions and design optimization. Int. J. Bio-Inspired Comput. 2010, 2, 78. [Google Scholar] [CrossRef]
- Jiang, X.; Li, S. BAS: Beetle antennae search algorithm for optimization problems. Int. J. Robot. Control 2018, 1, 1. [Google Scholar] [CrossRef]
- Okwu, M.O. (Ed.) Grey Wolf Optimizer, Metaheuristic Optimization, Nature-Inspired Algorithms Swarm and Computational Intelligence, Theory and Applications; Springer International Publishing: Cham, Switzerland, 2021. [Google Scholar] [CrossRef]
- Li, M.D.; Zhao, H.; Weng, X.W.; Han, T. A novel nature-inspired algorithm for optimization: Virus colony search. Adv. Eng. Softw. 2016, 92, 65–88. [Google Scholar] [CrossRef]
- Glover, F. Tabu search—Part I. ORSA J. Comput. 1989, 1, 190–206. [Google Scholar] [CrossRef] [Green Version]
- Kumar, M.; Kulkarni, A.J.; Satapathy, S.C. Socio evolution & learning optimization algorithm: A socio-inspired optimization methodology. Future Gener. Comput. Syst. 2018, 81, 252–272. [Google Scholar] [CrossRef]
- Rao, R.V.; Savsani, V.J.; Vakharia, D.P. Teaching–learning-based optimization: An optimization method for continuous non-linear large scale problems. Inf. Sci. 2012, 183, 1–15. [Google Scholar] [CrossRef]
- Hosseini, S.; Al Khaled, A. A Survey on the Imperialist Competitive Algorithm Metaheuristic: Implementation in Engineering Domain and Directions for Future Research. Appl. Soft. Comput. 2014, 24, 1078–1094. [Google Scholar] [CrossRef]
- Jia, H.; Peng, X.; Kang, L.; Li, Y.; Jiang, Z.; Sun, K. Pulse coupled neural network based on Harris hawks optimization algorithm for image segmentation. Multimed Tools Appl. 2020, 79, 28369–28392. [Google Scholar] [CrossRef]
- Fan, C.; Zhou, Y.; Tang, Z. Neighborhood centroid opposite-based learning harris hawks optimization for training neural networks. Evol. Intell. 2020, 14, 1847–1867. [Google Scholar] [CrossRef]
- Saravanan, G.; Ibrahim, A.M.; Kumar, D.S.; Vanitha, U.; Chandrika, V.S. Iot Based Speed Control of BLDC Motor with Harris Hawks Optimization Controller. Int. J. Grid Distrib. Comput. 2020, 13, 1902–1919. [Google Scholar]
- Qu, C.; He, W.; Peng, X.; Peng, X. Harris hawks optimization with information exchange. Appl. Math. Model. 2020, 84, 52–75. [Google Scholar] [CrossRef]
- Devarapalli, R.; Bhattacharyya, B. Application of modified harris hawks Optimization in power system oscillations damping controller design. In Proceedings of the 2019 8th International Conference on Power Systems (ICPS), Jaipur, India, 20–22 December 2019. [Google Scholar]
- Elgamal, Z.M.; Yasin, N.B.M.; Tubishat, M.; Alswaitti, M.; Mirjalili, S. An improved harris hawks optimization algorithm with simulated annealing for feature selection in the Medical Field. IEEE Access. 2020, 8, 186638–186652. [Google Scholar] [CrossRef]
- Song, S.; Wang, P.; Heidari, A.A.; Wang, M.; Zhao, X.; Chen, H.; He, W.; Xu, S. Dimension decided harris hawks optimization with gaussian mutation: Balance analysis and diversity patterns. Knowl.-Based Syst. 2021, 215, 106425. [Google Scholar] [CrossRef]
- Wolpert, D.H.; Macready, W.G. No Free Lunch Theorems for Optimization. IEEE Trans. Evol. Comput. 1997, 1, 67–83. [Google Scholar] [CrossRef] [Green Version]
- Bednarz, J.C. Cooperative Hunting Harris’ Hawks (Parabuteo unicinctus). Science 1988, 239, 1525–1527. [Google Scholar] [CrossRef] [PubMed]
- Lefebvre, L.; Whittle, P.; Lascaris, E.; Finkelstein, A. Feeding innovations and forebrain size in birds. Anim. Behav. 1997, 53, 549–560. [Google Scholar] [CrossRef] [Green Version]
- Sol, D.; Duncan, R.P.; Blackburn, T.M.; Cassey, P.; Lefebvre, L. Big brains, Enhanced Cognition, and Response of birds to Novel environments. Proc. Natl. Acad. Sci. USA 2005, 102, 5460–5465. [Google Scholar] [CrossRef] [PubMed] [Green Version]
- Kazimipour, B.; Li, X.; Qin, A.K. A review of population initialization techniques for evolutionary algorithms. In Proceedings of the 2014 IEEE Congress on Evolutionary Computation (CEC), Beijing, China, 6–11 July 2014; pp. 2585–2592. [Google Scholar] [CrossRef]
- Migallón, H.; Jimeno-Morenilla, A.; Rico, H.; Sánchez-Romero, J.L.; Belazi, A. Multi-Level Parallel Chaotic Jaya Optimization Algorithms for Solving Constrained Engineering Design Problems. J. Supercomput. 2021, 77, 12280–12319. [Google Scholar] [CrossRef]
- Alatas, B.; Akin, E. Multi-Objective Rule Mining Using a Chaotic Particle Swarm Optimization Algorithm. Knowl.-Based Syst. 2009, 22, 455–460. [Google Scholar] [CrossRef]
- Arora, S.; Anand, P. Chaotic Grasshopper Optimization Algorithm for Global Optimization. Neural Comput. Appl. 2019, 31, 4385–4405. [Google Scholar] [CrossRef]
- Wang, G.-G.; Guo, L.; Gandomi, A.H.; Hao, G.-S.; Wang, H. Chaotic Krill Herd Algorithm. Inf. Sci. 2014, 274, 17–34. [Google Scholar] [CrossRef]
- Mitić, M.; Vuković, N.; Petrović, M.; Miljković, Z. Chaotic Fruit Fly Optimization Algorithm. Knowl.-Based Syst. 2015, 89, 446–458. [Google Scholar] [CrossRef]
- Kumar, Y.; Singh, P.K. A Chaotic Teaching Learning Based Optimization Algorithm for Clustering Problems. Appl. Intell. 2019, 49, 1036–1062. [Google Scholar] [CrossRef]
- Pierezan, J.; dos Santos Coelho, L.; Mariani, V.C.; de Vasconcelos Segundo, E.H.; Prayogo, D. Chaotic Coyote Algorithm Applied to Truss Optimization Problems. Comput. Struct. 2021, 242, 106353. [Google Scholar] [CrossRef]
- Sayed, G.I.; Tharwat, A.; Hassanien, A.E. Chaotic Dragonfly Algorithm: An Improved Metaheuristic Algorithm for Feature Selection. Appl. Intell. 2019, 49, 188–205. [Google Scholar] [CrossRef]
- Chen, K.; Zhou, F.; Liu, A. Chaotic Dynamic Weight Particle Swarm Optimization for Numerical Function Optimization. Knowl.-Based Syst. 2018, 139, 23–40. [Google Scholar] [CrossRef]
- Anand, P.; Arora, S. A Novel Chaotic Selfish Herd Optimizer for Global Optimization and Feature Selection. Artif. Intell. Rev. 2020, 53, 1441–1486. [Google Scholar] [CrossRef]
- Yao, X.; Liu, Y.; Lin, G. Evolutionary Programming Made Faster. IEEE Trans. Evol. Comput. 1999, 3, 82–102. [Google Scholar] [CrossRef] [Green Version]
- Digalakis, J.G.; Margaritis, K.G. On benchmarking functions for genetic algorithms. Int. J. Comput. Math. 2001, 77, 481–506. [Google Scholar] [CrossRef]
- Chen, H.; Zhang, Q.; Luo, J. An enhanced Bacterial Foraging Optimization and its application for training kernel extreme learning machine. Appl. Soft. Comput. 2020, 86, 105–884. [Google Scholar] [CrossRef]
- Mirjalili, S. SCA: A Sine Cosine Algorithm for Solving Optimization Problems. Knowl.-Based Syst. 2016, 96, 120–133. [Google Scholar] [CrossRef]
- Meng, X.; Liu, Y.; Gao, X.; Zhang, H. A new bio-inspired algorithm: Chicken swarm optimization. In Advances in Swarm Intelligence; Tan, Y., Shi, Y., Coello, C.A.C., Eds.; Springer International Publishing: Cham, Germany, 2014; pp. 86–94. [Google Scholar] [CrossRef]
- Zhang, J.; Chen, J.; Che, L. Hybrid PSO Algorithm with Adaptive Step Search in Noisy and Noise-Free Environments. In Proceedings of the 2020 IEEE Congress on Evolutionary Computation (CEC), Glasgow, UK, 19–24 July 2020; pp. 1–8. [Google Scholar]
- Jordehi, A.R. Gravitational Search Algorithm with Linearly Decreasing Gravitational Constant for Parameter Estimation of Photovoltaic Cells. In Proceedings of the 2017 IEEE Congress on Evolutionary Computation (CEC), Donostia, Spain, 5–8 June 2017; pp. 37–42. [Google Scholar]
- Feng, X.; Liu, A.; Sun, W.; Yue, X.; Liu, B. A Dynamic Generalized Opposition-Based Learning Fruit Fly Algorithm for Function Optimization. In Proceedings of the 2018 IEEE Congress on Evolutionary Computation (CEC), Rio de Janeiro, Brazil, 8–13 July 2018; pp. 1–7. [Google Scholar]
- Demsar, J. Statistical comparisons of classifiers over multiple data sets. J. Mach. Learn. Res. 2006, 7, 1–30. [Google Scholar]
- García, S.; Fernández, A.; Luengo, J.; Herrera, F. Advanced nonparametric tests for multiple comparisons in the design of experiments in computational intelligence and data mining: Experimental analysis of power. Inf. Sci. 2010, 180, 2044–2064. [Google Scholar] [CrossRef]
- Groppe, D.M.; Urbach, T.P.; Kutas, M. Mass univariate analysis of event-related brain potentials/fields I: A critical tutorial review. Psychophysiology 2011, 48, 1711–1725. [Google Scholar] [CrossRef] [PubMed] [Green Version]
- Deliparaschos, K.M.; Nenedakis, F.I.; Tzafestas, S.G. Design and implementation of a fast digital fuzzy logic controller using FPGA Technology. J. Intell. Robot. Syst. 2006, 45, 77–96. [Google Scholar] [CrossRef]
- Sapkota, B.; Vittal, V. Dynamic VAr planning in a large power system using trajectory sensitivities. IEEE Trans. Power Syst. 2010, 25, 461–469. [Google Scholar] [CrossRef]
- Huang, H.; Xu, Z.; Lin, X. Improving performance of Multi-infeed HVDC systems using grid dynamic segmentation technique based on fault current limiters. IEEE Trans. Power Syst. 2012, 27, 1664–1672. [Google Scholar] [CrossRef]
- Yong, T. A discussion about standard parameter models of synchronous machine. Power Syst. Technol. 2007, 12, 47. [Google Scholar]
- Grigsby, L.L. (Ed.) Power system Stability and Control, 3rd ed.; Taylor & Francis: Boca Raton, FL, USA, 2012. [Google Scholar]
- Tian, Z. Backtracking search optimization algorithm-based least square support vector machine and its applications. Eng. Appl. Artif. Intell. 2020, 94, 103801. [Google Scholar] [CrossRef]
- Suykens, J.A.K.; Vandewalle, J. Least squares support vector machine classifiers. Neural Process. Lett. 1999, 9, 293–300. [Google Scholar] [CrossRef]
- Zendehboudi, A. Implementation of GA-LSSVM modelling approach for estimating the performance of solid desiccant wheels. Energy Convers. Manag. 2016, 127, 245–255. [Google Scholar] [CrossRef]
- Chamkalani, A.; Zendehboudi, S.; Bahadori, A.; Kharrat, R.; Chamkalani, R.; James, L.; Chatzis, I. Integration of LSSVM technique with PSO to determine asphaltene deposition. J. Pet. Sci. Eng. 2014, 124, 243–253. [Google Scholar] [CrossRef]
- Zhongda, T.; Shujiang, L.; Yanhong, W.; Yi, S. A prediction method based on wavelet transform and multiple models fusion for chaotic time series. Chaos Solitons Fractals 2017, 98, 158–172. [Google Scholar] [CrossRef]
- Liu, W.; Zhang, X. Research on the supply chain risk assessment based on the improved LSSVM algorithm. Int. J. U-Serv. Sci. Technol. 2016, 9, 297–306. [Google Scholar] [CrossRef]
- Jain, S.; Bajaj, V.; Kumar, A. Efficient algorithm for classification of electrocardiogram beats based on artificial bee colony-based least-squares support vector machines classifier. Electron. Lett. 2016, 52, 1198–1200. [Google Scholar] [CrossRef]
- Yang, A.; Li, W.; Yang, X. Short-term electricity load forecasting based on feature selection and Least Squares Support Vector Machines. Knowl.-Based Syst. 2019, 163, 159–173. [Google Scholar] [CrossRef]
- Adankon, M.M.; Cheriet, M. Support vector machine. In Encyclopedia of Biometrics; Springer: Boston, MA, USA, 2014; Volume 3, pp. 1–9. [Google Scholar] [CrossRef]
Figure 1.
Description of each stage of HHO.
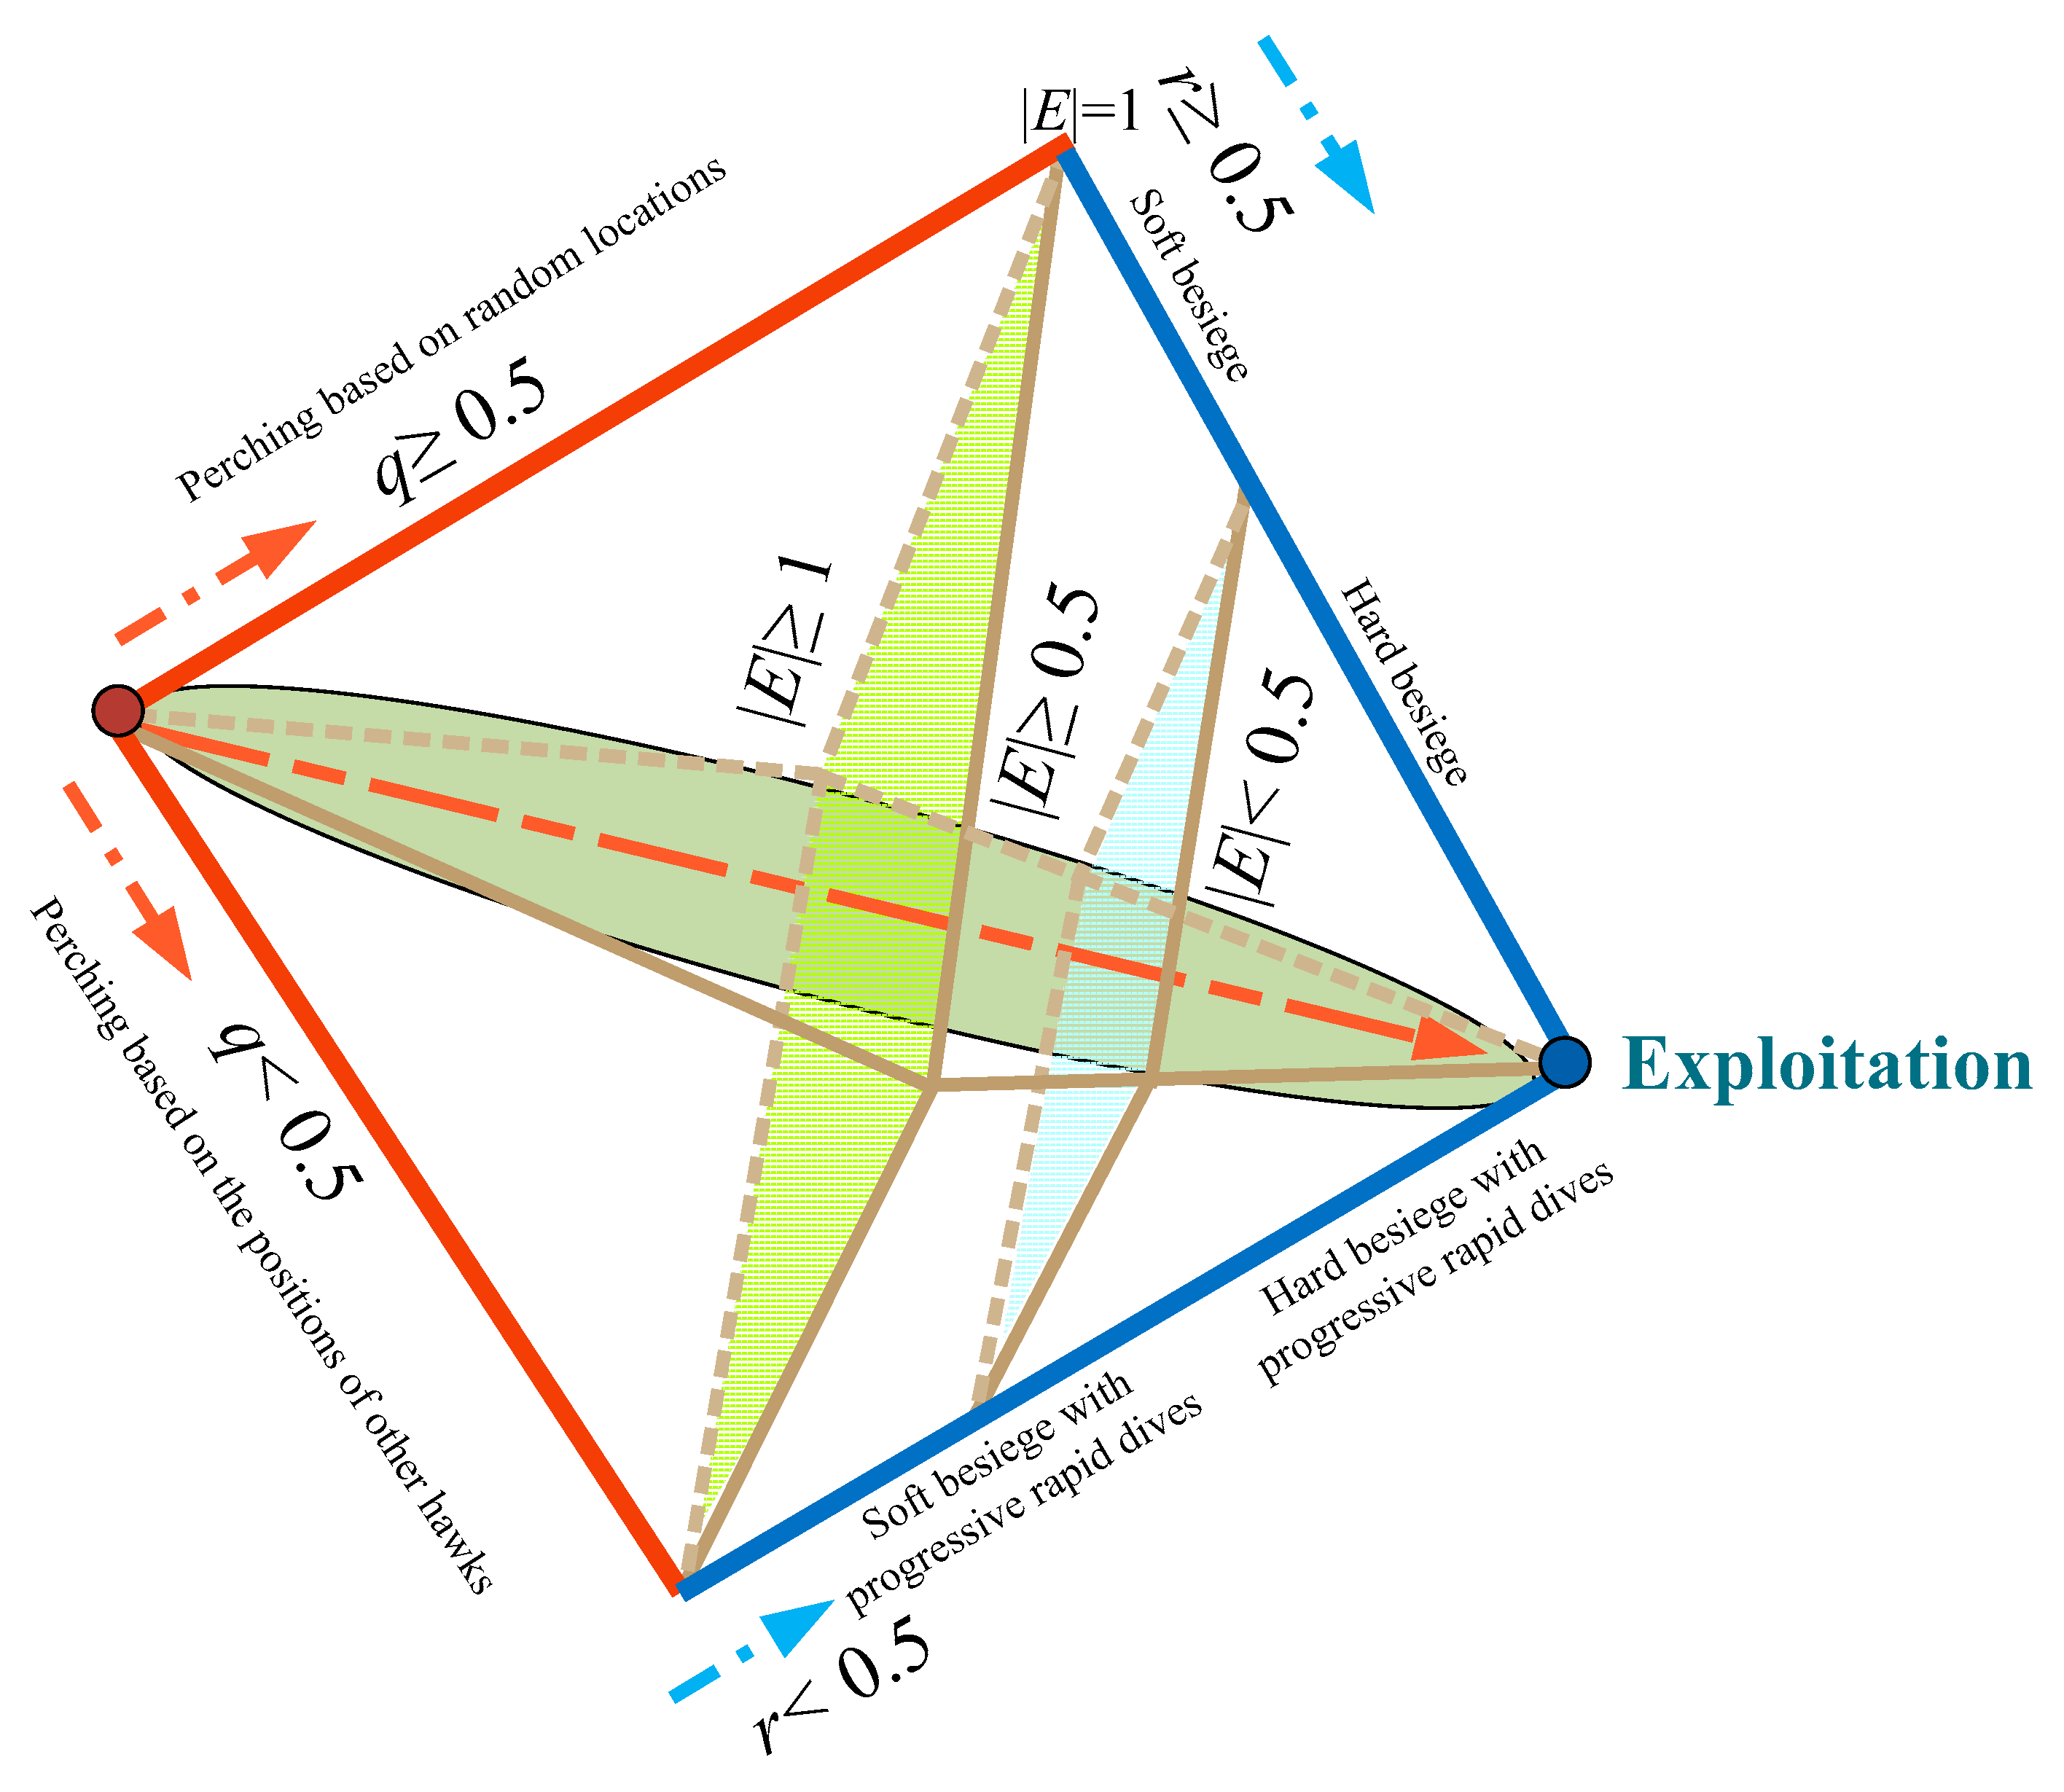
Figure 2.
Flow chart of HHO algorithm.

Figure 3.
Spiral position update.
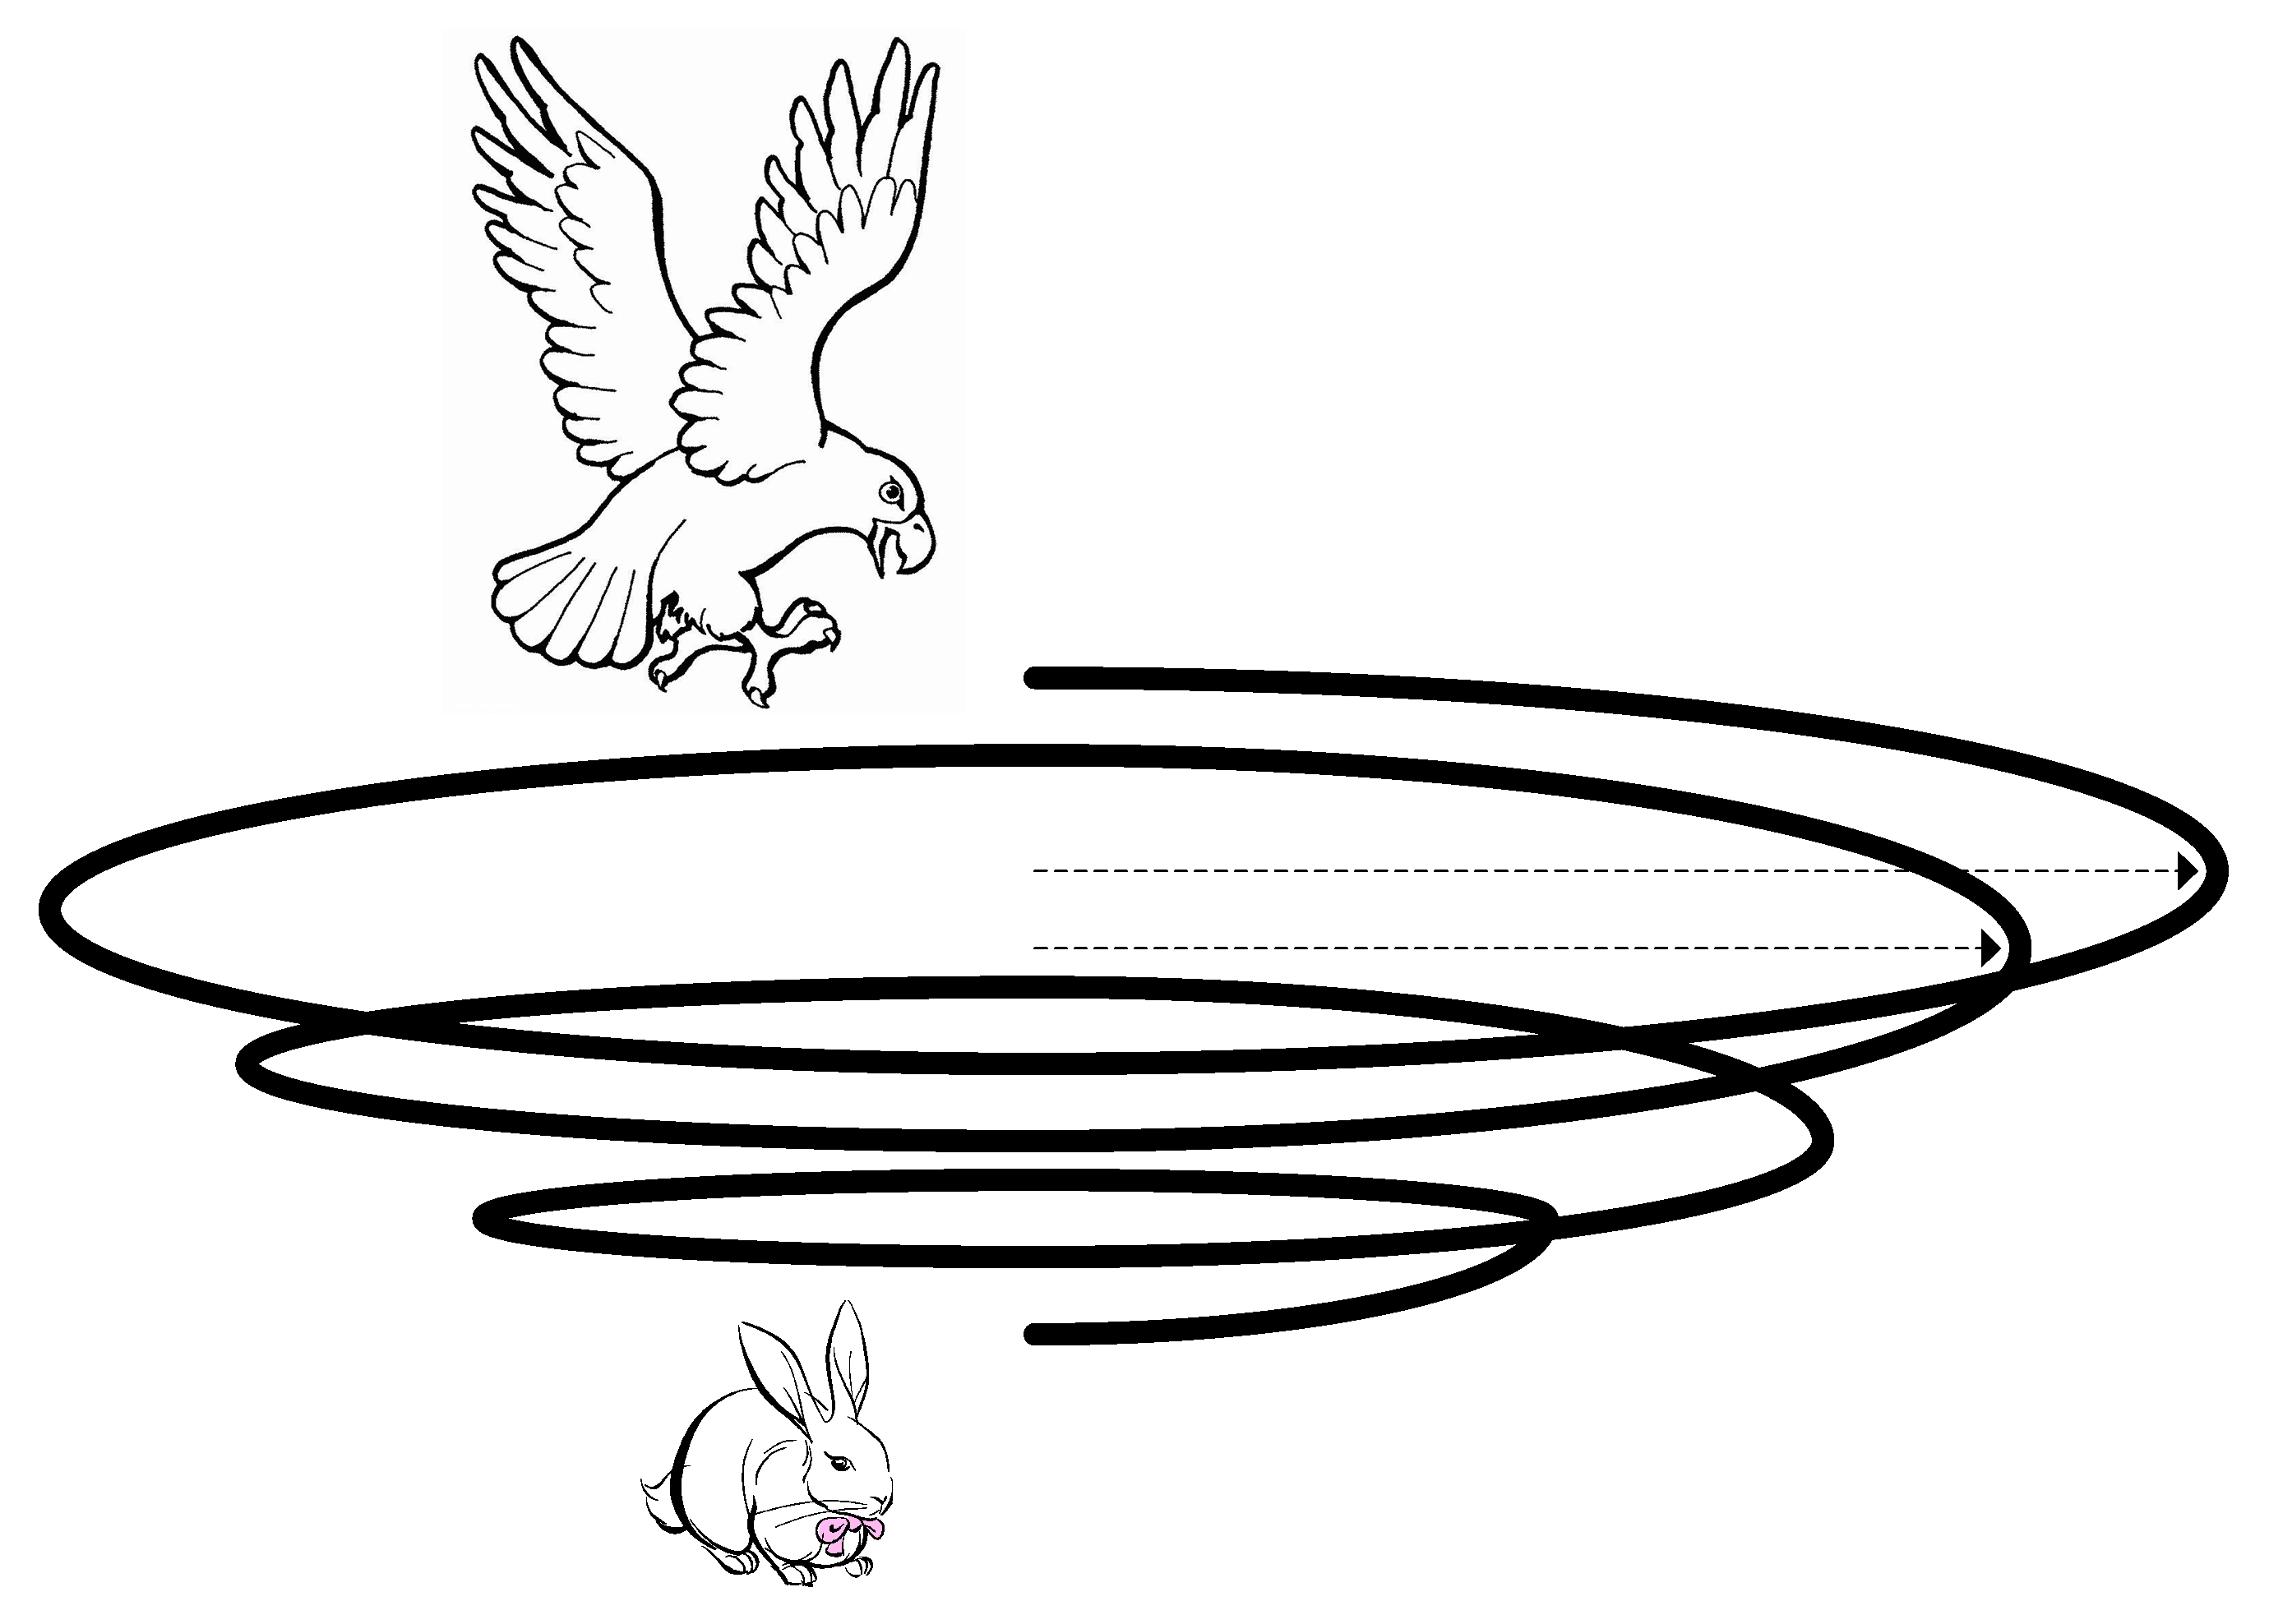
Figure 4.
Convergence curves of CSHHO and the classic meta-heuristic algorithms.


Figure 5.
Convergence curves of CSHHO and the advanced meta-heuristic algorithms.

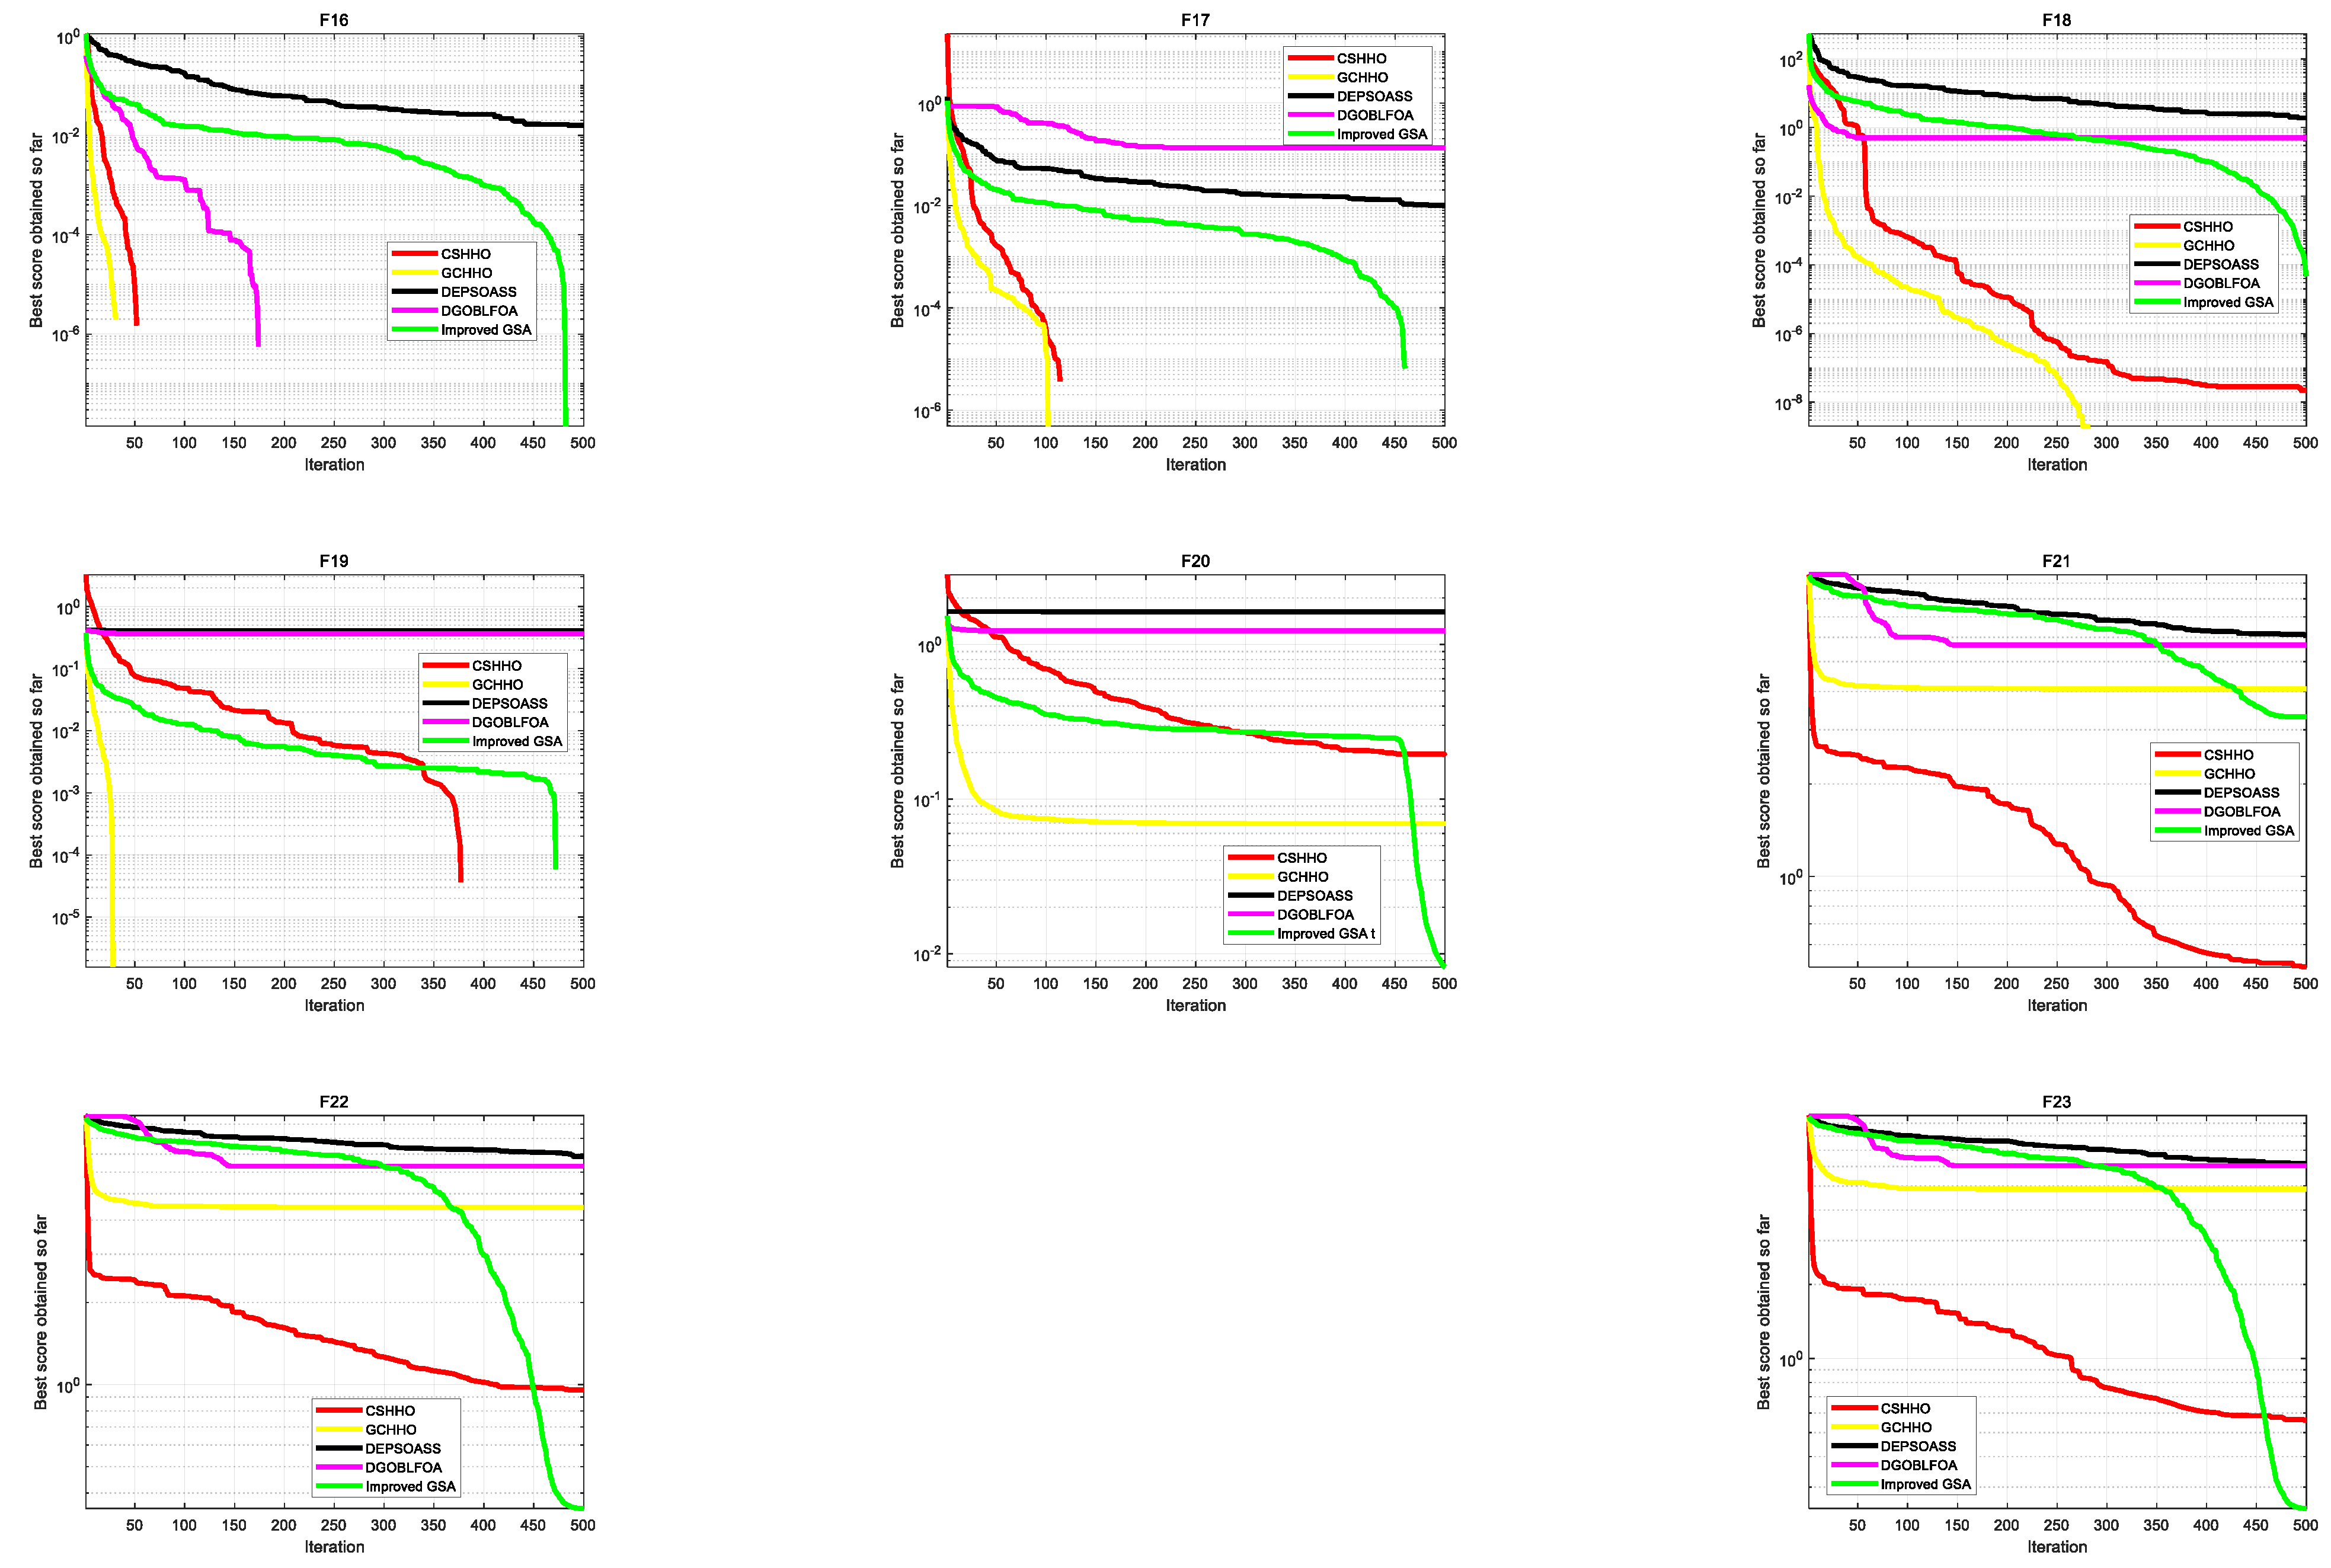
Figure 6.
CSHHO Optimizes Synchronous condenser Reactive Power Output based LSSVM.

Figure 7.
Output and error comparison diagram of LSSVM model and CSHHO-LSSVM model.


Table 1.
Exploitation phase of HHO algorithm.
| Strategy | The value of r and |E| | |
| Soft besiege | r ≥ 0.5 and |E| ≥ 0.5 | |
| (4) | ||
| (5) | ||
| (6) | ||
| Hard besiege | r ≥ 0.5 and |E| < 0.5 | |
| (7) | ||
| Soft besiege with progressive rapid dives | r < 0.5 and |E| ≥ 0.5 | |
| (8) | ||
| (9) | ||
| (10) | ||
| (11) | ||
| Hard besiege with progressive rapid dives | r < 0.5 and |E| < 0.5 | |
| (12) | ||
| (13) | ||
Table 2.
The information of IEEE CEC2017.
| ID | Description | Type | Dimension | Range | Optimum |
|---|---|---|---|---|---|
| F1 | Shifted and Rotated Bent Cigar Function | Unimodal | 30, 50, 100 | [−100, 100] | 100 |
| F2 | Shifted and Rotated Zakharov function | Unimodal | 30, 50, 100 | [−100, 100] | 300 |
| F3 | Shifted and Rotated Rosenbrock’s function | Multimodal | 30, 50, 100 | [−100, 100] | 400 |
| F4 | Shifted and Rotated Rastrigin’s function | Multimodal | 30, 50, 100 | [−100, 100] | 500 |
| F5 | Shifted and Rotated Expanded Scaffer’s F6 function | Multimodal | 30, 50, 100 | [−100, 100] | 600 |
| F6 | Shifted and Rotated Lunacek Bi-Rastrigin function | Multimodal | 30, 50, 100 | [−100, 100] | 700 |
| F7 | Shifted and Rotated Non-Continuous Rastrigin’s function | Multimodal | 30, 50, 100 | [−100, 100] | 800 |
| F8 | Shifted and Rotated Lévy function | Multimodal | 30, 50, 100 | [−100, 100] | 900 |
| F9 | Shifted and Rotated Schwefel’s function | Multimodal | 30, 50, 100 | [−100, 100] | 1000 |
| F10 | Hybrid Function 1 (N = 3) | Hybrid | 30, 50, 100 | [−100, 100] | 1100 |
| F11 | Hybrid Function 2 (N = 3) | Hybrid | 30, 50, 100 | [−100, 100] | 1200 |
| F12 | Hybrid Function 3 (N = 3) | Hybrid | 30, 50, 100 | [−100, 100] | 1300 |
| F13 | Hybrid Function 4 (N = 4) | Hybrid | 30, 50, 100 | [−100, 100] | 1400 |
| F14 | Hybrid Function 5 (N = 4) | Hybrid | 30, 50, 100 | [−100, 100] | 1500 |
| F15 | Hybrid Function 6 (N = 4) | Hybrid | 30, 50, 100 | [−100, 100] | 1600 |
| F16 | Hybrid Function 6 (N = 5) | Hybrid | 30, 50, 100 | [−100, 100] | 1700 |
| F17 | Hybrid Function 6 (N = 5) | Hybrid | 30, 50, 100 | [−100, 100] | 1800 |
| F18 | Hybrid Function 6 (N = 5) | Hybrid | 30, 50, 100 | [−100, 100] | 1900 |
| F19 | Hybrid Function 6 (N = 6) | Hybrid | 30, 50, 100 | [−100, 100] | 2000 |
| F20 | Composition Function 1 (N = 3) | Composition | 30, 50, 100 | [−100, 100] | 2100 |
| F21 | Composition Function 2 (N = 3) | Composition | 30, 50, 100 | [−100, 100] | 2200 |
| F22 | Composition Function 3 (N = 4) | Composition | 30, 50, 100 | [−100, 100] | 2300 |
| F23 | Composition Function 4 (N = 4) | Composition | 30, 50, 100 | [−100, 100] | 2400 |
| F24 | Composition Function 5 (N = 5) | Composition | 30, 50, 100 | [−100, 100] | 2500 |
| F25 | Composition Function 6 (N = 5) | Composition | 30, 50, 100 | [−100, 100] | 2600 |
| F26 | Composition Function 7 (N = 6) | Composition | 30, 50, 100 | [−100, 100] | 2700 |
| F27 | Composition Function 7 (N = 6) | Composition | 30, 50, 100 | [−100, 100] | 2800 |
| F28 | Composition Function 9 (N = 3) | Composition | 30, 50, 100 | [−100, 100] | 2900 |
| F29 | Composition Function 10 (N = 3) | Composition | 30, 50, 100 | [−100, 100] | 3000 |
Table 3.
Results of a comparison with seven chaotic mappings on HHO.
| Benchmark | Circle | Sinusoidal | Tent | Kent | Cubic | Logistic | Gauss | |
|---|---|---|---|---|---|---|---|---|
| F1 | Mean | 4.37 × 10−110 | 2.73 × 10−96 | 7.91 × 10−101 | 3.68 × 10−99 | 8.75 × 10−100 | 7.28 × 10−99 | 1.4 × 10−109 |
| Std | 3.05 × 10−109 | 1.09 × 10−95 | 3.91 × 10−100 | 1.82 × 10−98 | 4.06 × 10−99 | 5.13 × 10−98 | 9.69 × 10−109 | |
| Rank | 1 | 7 | 3 | 5 | 4 | 6 | 2 | |
| Best\Worst | 2.15 × 10−108\6.44 × 10−135 | 4.36 × 10−95\3.01 × 10−115 | 2.21 × 10−99\1.1 × 10−119 | 9.39 × 10−98\3.69 × 10−116 | 2.11 × 10−98\1.4 × 10−116 | 3.63 × 10−97\1.96 × 10−116 | 6.85 × 10−108\1.18 × 10−137 | |
| F2 | Mean | 6.4 × 10−59 | 3.88 × 10−53 | 3.45 × 10−53 | 7.39 × 10−53 | 8.12 × 10−53 | 8.59 × 10−53 | 8.05× 10−61 |
| Std | 3.12 × 10−58 | 1.74 × 10−52 | 1.5 × 10−52 | 4.9 × 10−52 | 5.03 × 10−52 | 4.9 × 10−52 | 2.37× 10−60 | |
| Rank | 2 | 4 | 3 | 5 | 6 | 7 | 1 | |
| Best\Worst | 1.97 × 10−57\5.03 × 10−77 | 1.20 × 10−51\6.33 × 10−60 | 8.88 × 10−52\1.72 × 10−61 | 3.47 × 10−51\1.86 × 10−64 | 3.56 × 10−51\2.76 × 10−68 | 3.4391 × 10−51\3.91 × 10−62 | 1.0834× 10−59\3.80 × 10−68 | |
| F3 | Mean | 2.90 × 10−86 | 2.51 × 10−86 | 5.22 × 10−82 | 5.28 × 10−78 | 3.08 × 10−83 | 9.34 × 10−86 | 7.29 × 10−78 |
| Std | 2.01 × 10−85 | 9.38 × 10−86 | 3.13 × 10−81 | 3.73 × 10−77 | 2.15 × 10−82 | 3.43 × 10−85 | 5.15 × 10−77 | |
| Rank | 2 | 1 | 5 | 6 | 4 | 3 | 7 | |
| Best\Worst | 1.42 × 10−84\8.08 × 10−104 | 3.51 × 10−85\9.55 × 10−104 | 2.18 × 10−80\1.01 × 10−108 | 2.63 × 10−76\5.02 × 10−101 | 1.52 × 10−81\2.2 × 10−107 | 1.90 × 10−84\5.74 × 10−105 | 3.64 × 10−76\1.58 × 10−107 | |
| F4 | Mean | 8.48 × 10−56 | 1.23 × 10−50 | 7.91 × 10−51 | 8.72 × 10−51 | 3.65 × 10−50 | 9.39 × 10−50 | 9.3 × 10−53 |
| Std | 4.24 × 10−55 | 4.28 × 10−50 | 5.22 × 10−50 | 3.6 × 10−50 | 2.4 × 10−49 | 6.51 × 10−49 | 6.49 × 10−52 | |
| Rank | 1 | 5 | 3 | 4 | 6 | 7 | 2 | |
| Best\Worst | 2.64 × 10−54\9.93 × 10−69 | 1.91 × 10−49\1.3 × 10−55 | 3.69 × 10−49\2.77 × 10−59 | 1.97 × 10−49\4.06 × 10−58 | 1.70 × 10−48\2.16 × 10−60 | 4.60 × 10−48\4.39 × 10−58 | 4.59 × 10−51\1.13 × 10−65 | |
| F5 | Mean | 8.55 × 10⁻² | 4.17 × 10⁻² | 5.42 × 10⁻² | 4.65 × 10⁻² | 7.29 × 10⁻² | 4.85 × 10⁻² | 8.33 × 10⁻² |
| Std | 5.63 × 10⁻¹ | 4.90 × 10⁻³ | 9.52 × 10⁻³ | 7.56 × 10⁻³ | 9.62 × 10⁻³ | 8.98 × 10⁻³ | 5.64 × 10⁻¹ | |
| Rank | 7 | 1 | 4 | 2 | 5 | 3 | 6 | |
| Best\Worst | 3.9896\4.3262 × 10⁻⁵ | 0.021867\3.3302 × 10⁻⁶ | 0.048302\8.4348 × 10⁻⁷ | 0.0425\8.3416 × 10⁻⁷ | 0.043385\3.4475 × 10⁻⁵ | 0.051141\6.6967 × 10⁻⁶ | 3.9896\6.6344 × 10⁻⁶ | |
| F6 | Mean | 3.34 × 10⁻⁵ | 7.87 × 10⁻⁵ | 5.47 × 10⁻⁵ | 4.72 × 10⁻⁵ | 6.85 × 10⁻⁵ | 4.45 × 10⁻⁵ | 2.48× 10⁻⁵ |
| Std | 6.12 × 10⁻⁵ | 1.10 × 10⁻⁴ | 9.45 × 10⁻⁵ | 5.54 × 10⁻⁵ | 8.89 × 10−56 | 6.00 × 10⁻⁵ | 3.13× 10⁻⁵ | |
| Rank | 2 | 7 | 5 | 4 | 6 | 3 | 1 | |
| Best\Worst | 3.42 × 10⁻⁴\1.6931 × 10⁻⁸ | 4.27 × 10⁻⁴\7.8651 × 10⁻⁸ | 3.71 × 10⁻⁴\2.4303 × 10⁻⁹ | 3.16 × 10⁻⁴\3.9886 × 10⁻⁸ | 4.33 × 10⁻⁴\1.2627 × 10⁻⁸ | 2.77 × 10⁻⁴\2.6747 × 10⁻⁸ | 1.48× 10⁻⁴\1.1473× 10⁻¹⁰ | |
| F7 | Mean | 1.02 × 10⁻⁴ | 7.60 × 10⁻⁵ | 8.41 × 10⁻⁵ | 9.33 × 10⁻⁵ | 7.99 × 10⁻⁵ | 7.62 × 10⁻⁵ | 9.17 × 10⁻⁵ |
| Std | 9.77 × 10⁻⁵ | 4.66 × 10⁻⁵ | 1.02 × 10⁻⁴ | 9.06 × 10⁻⁵ | 8.17 × 10⁻⁵ | 7.35 × 10⁻⁵ | 8.83 × 10⁻⁵ | |
| Rank | 7 | 1 | 4 | 6 | 3 | 2 | 5 | |
| Best\Worst | 4.09 × 10⁻⁴\1.85 × 10⁻⁶ | 1.92 × 10⁻⁴\1.62 × 10⁻⁶ | 5.44 × 10⁻⁴\1.26 × 10⁻⁶ | 3.88 × 10⁻⁴\4.19 × 10⁻⁶ | 5.07 × 10⁻⁴\1.77 × 10⁻⁶ | 4.39 × 10⁻⁴\8.40 × 10⁻⁷ | 4.36 × 10⁻⁴\1.72 × 10⁻⁶ | |
| F8 | Mean | −1.26 × 10⁴ | −1.26 × 10⁴ | −1.26 × 10⁴ | −1.26 × 10⁴ | −1.25 × 10⁴ | −1.26 × 10⁴ | −1.26 × 10⁴ |
| Std | 52.1 | 0.232 | 0.453 | 0.508 | 0.378 | 0.226 | 30.7 | |
| Rank | 1 | 1 | 1 | 1 | 7 | 1 | 1 | |
| Best\Worst | −1.23 × 10⁴\−1.25 × 10⁴ | −1.25 × 10⁴\−1.25 × 10⁴ | −1.25 × 10⁴\−1.25 × 10⁴ | −1.25 × 10⁴\−1.25 × 10⁴ | −9.90 × 10³\−1.25 × 10⁴ | −1.25 × 10⁴\−1.25 × 10⁴ | −1.23× 10⁴\−1.25 × 10⁴ | |
| F9 | Mean | 0 | 0 | 0 | 0 | 0\0 | 0 | 0 |
| Std | 0 | 0 | 0 | 0 | 0 | 0 | 0 | |
| Rank | 1 | 1 | 1 | 1 | 1 | 1 | 1 | |
| Best\Worst | 0\0 | 0\0 | 0\0 | 0\0 | 0\0 | 0\0 | 0\0 | |
| F10 | Mean | 8.88 × 10⁻¹⁶ | 8.88 × 10⁻¹⁶ | 8.88 × 10⁻¹⁶ | 8.88 × 10⁻¹⁶ | 8.88 × 10⁻¹⁶ | 8.88 × 10⁻¹⁶ | 8.88× 10⁻¹⁶ |
| Std | 1.99 × 10⁻³¹ | 1.99 × 10⁻³¹ | 1.99 × 10⁻³¹ | 1.99 × 10⁻³¹ | 1.99 × 10⁻³¹ | 1.99 × 10⁻³¹ | 1.99× 10⁻³¹ | |
| Rank | 1 | 1 | 1 | 1 | 1 | 1 | 1 | |
| Best\Worst | 8.88 × 10⁻¹⁶\8.88 × 10⁻¹⁶ | 8.88 × 10⁻¹⁶\8.88 × 10⁻¹⁶ | 8.88 × 10⁻¹⁶\8.88 × 10⁻¹⁶ | 8.88 × 10⁻¹⁶\8.88 × 10⁻¹⁶ | 8.88 × 10⁻¹⁶\8.88 × 10⁻¹⁶ | 8.88 × 10⁻¹⁶\8.88 × 10⁻¹⁶ | 8.88× 10⁻¹⁶\8.88 × 10⁻¹⁶ | |
| F11 | Mean | 0 | 0 | 0 | 0 | 0 | 0 | 0 |
| Std | 0 | 0 | 0 | 0 | 0 | 0 | 0 | |
| Rank | 1 | 1 | 1 | 1 | 1 | 1 | 1 | |
| Best\Worst | 0\0 | 0\0 | 0\0 | 0\0 | 0\0 | 0\0 | 0\0 | |
| F12 | Mean | 1.31 × 10⁻⁶ | 2.79 × 10⁻⁶ | 4.21 × 10⁻⁶ | 2.75 × 10⁻⁶ | 4.02 × 10⁻⁶ | 4.18 × 10⁻⁶ | 1.18× 10⁻⁶ |
| Std | 1.49 × 10⁻⁶ | 3.23 × 10⁻⁶ | 8.73 × 10⁻⁶ | 3.36 × 10⁻⁶ | 5.88 × 10⁻⁶ | 5.65 × 10⁻⁶ | 1.52× 10⁻⁶ | |
| Rank | 2 | 4 | 7 | 3 | 5 | 6 | 1 | |
| Best\Worst | 7.06 × 10⁻⁶\5.43 × 10⁻⁹ | 1.46 × 10⁻⁵\2.19 × 10⁻⁸ | 5.17 × 10⁻⁵\1.09 × 10⁻⁸ | 1.75 × 10⁻⁵\2.96 × 10⁻⁹ | 3.25 × 10⁻⁵\2.30 × 10⁻⁹ | 2.80 × 10⁻⁵\5.59 × 10⁻⁹ | 6.68× 10⁻⁶\5.16 × 10⁻¹⁰ | |
| F13 | Mean | 2.66 × 10⁻⁴ | 3.31 × 10⁻⁴ | 3.91 × 10⁻⁵ | 2.56 × 10⁻⁵ | 4.15 × 10⁻⁵ | 2.68 × 10⁻⁵ | 4.62 × 10⁻⁴ |
| Std | 1.55 × 10⁻³ | 2.07 × 10⁻³ | 5.02 × 10⁻⁵ | 4.26 × 10⁻⁵ | 5.82 × 10−54 | 3.68 × 10⁻⁵ | 2.17 × 10⁻³ | |
| Rank | 5 | 6 | 3 | 1 | 4 | 2 | 7 | |
| Best\Worst | 0.010987\1.4769 × 10⁻⁷ | 0.014637\1.0906 × 10⁻⁷ | 0.00023743\4.4639 × 10⁻⁸ | 0.00026746\5.4412 × 10⁻⁷ | 0.00024897\2.9199 × 10⁻¹¹ | 0.00016986\8.1121 × 10⁻⁸ | 0.010987\5.0129 × 10⁻⁸ | |
| F14 | Mean | 1.20 | 9.97 × 10⁻¹ | 9.98 × 10⁻¹ | 1.22 | 1.02 | 1.12 | 1.57 |
| Std | 9.76 × 10⁻¹ | 5.61 × 10⁻¹⁶ | 5.61 × 10⁻¹⁶ | 9.82 × 10⁻¹ | 1.41 × 10⁻¹ | 7.10 × 10⁻¹ | 1.49 | |
| Rank | 5 | 1 | 2 | 6 | 3 | 4 | 7 | |
| Best\Worst | 5.93\9.98 × 10⁻¹ | 9.98 × 10⁻¹\9.98 × 10⁻¹ | 9.98 × 10⁻¹\9.98 × 10⁻¹ | 5.93\9.98 × 10⁻¹ | 1.99\9.98 × 10⁻¹ | 5.93\9.98 × 10⁻¹ | 5.93\9.98 × 10⁻¹ | |
| F15 | Mean | 3.24 × 10⁻⁴ | 3.19 × 10⁻⁴ | 3.22 × 10⁻⁴ | 3.27 × 10⁻⁴ | 3.72 × 10⁻⁴ | 3.28 × 10⁻⁴ | 3.25 × 10⁻⁴ |
| Std | 1.45 × 10⁻⁵ | 1.03 × 10⁻⁵ | 1.70 × 10⁻⁵ | 1.93 × 10⁻⁵ | 2.24 × 10⁻⁴ | 1.79 × 10⁻⁵ | 1.23 × 10⁻⁵ | |
| Rank | 3 | 1 | 2 | 5 | 7 | 6 | 4 | |
| Best\Worst | 3.82 × 10⁻⁴\3.08 × 10⁻⁴ | 3.48 × 10⁻⁴\3.08 × 10⁻⁴ | 3.72 × 10⁻⁴\3.08 × 10⁻⁴ | 3.92 × 10⁻⁴\3.08 × 10⁻⁴ | 1.63 × 10⁻³\3.08 × 10⁻⁴ | 3.86 × 10⁻⁴\3.08 × 10⁻⁴ | 3.95 × 10⁻⁴\3.08 × 10⁻⁴ | |
| F16 | Mean | −1.03 | −1.03 | −1.03 | −1.03 | −1.03 | −1.03 | −1.03 |
| Std | 1.35 × 10⁻¹⁵ | 1.35 × 10⁻¹⁵ | 1.35 × 10⁻¹⁵ | 1.35 × 10⁻¹⁵ | 1.35 × 10⁻¹⁵ | 1.35 × 10⁻¹⁵ | 1.35× 10⁻¹⁵ | |
| Rank | 1 | 1 | 1 | 1 | 1 | 1 | 1 | |
| Best\Worst | −1.03\−1.03 | −1.03\−1.031 | −1.03\−1.03 | −1.03\−1.03 | −1.03\−1.03 | −1.03\−1.03 | −1.03\−1.03 | |
| F17 | Mean | 3.98 × 10⁻¹ | 3.98 × 10⁻¹ | 3.98 × 10⁻¹ | 3.98 × 10⁻¹ | 3.98 × 10⁻¹ | 3.98 × 10⁻¹ | 3.9× 10⁻⁹ |
| Std | 7.97 × 10⁻⁸ | 4.58 × 10⁻⁸ | 2.57 × 10⁻⁷ | 1.65 × 10⁻⁷ | 3.38 × 10⁻⁷ | 7.58 × 10⁻⁸ | 4.17× 10⁻⁸ | |
| Rank | 2 | 2 | 2 | 2 | 2 | 2 | 1 | |
| Best\Worst | 3.97 × 10⁻¹\3.97 × 10⁻¹ | 3.97 × 10⁻¹\3.97 × 10⁻¹ | 3.97 × 10⁻¹\3.97 × 10⁻¹ | 3.97 × 10⁻¹\3.97 × 10⁻¹ | 3.97 × 10⁻¹\0.3.97 × 10−1 | 3.97 × 10⁻¹\0.3.97 × 10−1 | 3.97× 10⁻¹\0.3.97 × 10−1 | |
| F18 | Mean | 3 | 3 | 3 | 3 | 3 | 3 | 3 |
| Std | 1.41 × 10⁻⁸ | 1.31 × 10⁻⁷ | 1.98 × 10⁻⁸ | 5.48 × 10⁻⁸ | 1.41 × 10⁻⁸ | 7.00 × 10⁻⁸ | 4.63× 10⁻⁸ | |
| Rank | 1 | 1 | 1 | 1 | 1 | 1 | 1 | |
| Best\Worst | 3\3 | 3\3 | 3\3 | 3\3 | 3\3 | 3\3 | 3\3 | |
| F19 | Mean | −3.86 | −3.86 | −3.86 | −3.86 | −3.86 | −3.86 | −3.86 |
| Std | 2.09 × 10⁻³ | 2.52 × 10⁻³ | 2.35 × 10⁻³ | 2.43 × 10⁻³ | 1.61 × 10⁻³ | 3.02 × 10⁻³ | 1.32× 10⁻³ | |
| Rank | 1 | 1 | 1 | 1 | 1 | 1 | 1 | |
| Best\Worst | −3.85\−3.86 | −3.85\−3.86 | −3.85\−3.86 | −3.85\−3.86 | −3.86\−3.86 | −3.85\−3.86 | −3.86\−3.86 | |
| F20 | Mean | −3.12 | −3.12 | −3.14 | −3.12 | −3.13 | −3.11 | −3.12 |
| Std | 1.10 × 10⁻¹ | 1.12 × 10⁻¹ | 1.10 × 10⁻¹ | 1.10 × 10⁻¹ | 1.10 × 10⁻¹ | 1.12 × 10⁻¹ | 9.95 × 10⁻² | |
| Rank | 3 | 3 | 1 | 3 | 2 | 7 | 3 | |
| Best\Worst | −2.88\−3.31 | −2.80\−3.30 | −2.89\−3.30 | −2.86\−3.30 | −2.90\−3.30 | −2.82\−3.30 | −2.81\−3.27 | |
| F21 | Mean | −8.77 | −7.05 | −7.04 | −8.75 | −5.36 | −7.03 | −8.45 |
| Std | 2.23 | 2.47 | 2.46 | 2.21 | 1.21 | 2.45 | 2.36 | |
| Rank | 1 | 4 | 5 | 2 | 7 | 6 | 3 | |
| Best\Worst | −5.05\−1.01 × 101 | −5.05\−1.01 × 101 | −5.05\−1.01 × 101 | −5.05\−1.01 × 101 | −5.04\−1.01 × 101 | −5.05\−1.01 × 101 | −5.05\−1.01 × 101 | |
| F22 | Mean | −8.44 | −8.62 | −7.06 | −8.95 | −5.49 | −7.04 | −9.06 |
| Std | 2.54 | 2.45 | 2.55 | 2.32 | 1.38 | 2.53 | 1.26 | |
| Rank | 4 | 3 | 5 | 2 | 7 | 6 | 1 | |
| Best\Worst | −5.08\−1.04 × 101 | −5.07\−1.04 × 101 | −5.08\−1.04 × 101 | −5.09\−1.04 × 101 | −5.08\−1.04 × 101 | −5.08\−1.04 × 101 | −5.09\−1.04× 101 | |
| F23 | Mean | −9.27 | −8.61 | −6.84 | −9.54 | −5.38 | −7.34 | −8.92 |
| Std | 2.23 | 2.53 | 2.52 | 1.95 | 1.33 | 2.63 | 2.4 | |
| Rank | 2 | 4 | 6 | 1 | 7 | 5 | 3 | |
| Best\Worst | −5.12\−1.05 × 101 | −5.123\−1.05 × 101 | −5.12\−1.05 × 101 | −5.12\−1.05 × 101 | −2.41\−1.05 × 101 | −5.13\−1.05 × 101 | −5.12\−1.05 × 101 |
Table 4.
The Bonferroni–Holm corrected P-values of Wilcoxon’s signed-rank test.
| Benchmark | Gauss | Circle | Sinusoidal | Tent | Kent | Cubic | Logistic | ||||||
|---|---|---|---|---|---|---|---|---|---|---|---|---|---|
| Corrected p-Value | +\=\− | Corrected p-Value | +\=\− | Corrected p-Value | +\=\− | Corrected p-Value | +\=\− | Corrected p-Value | +\=\− | Corrected p-Value | +\=\− | ||
| F1 | N/A | 2.12 × 101 | 28\0\22 | 1.043 × 10⁻⁷ | 50\0\0 | 5.40 × 10⁻⁷ | 48\0\2 | 1.04 × 10⁻⁷ | 50\0\0 | 1.08 × 10⁻⁷ | 49\0\1 | 6.77 × 10⁻⁷ | 48\0\2 |
| F2 | N/A | 3.05 × 101 | 26\0\24 | 1.043 × 10⁻⁷ | 50\0\0 | 1.20 × 10⁻⁷ | 49\0\1 | 1.08 × 10⁻⁷ | 49\0\1 | 1.20 × 10⁻⁷ | 48\0\2 | 1.03 × 10⁻⁷ | 50\0\0 |
| F3 | N/A | 3.23 × 101 | 25\0\25 | 3.20 × 101 | 24\0\26 | 2.27 × 101 | 29\0\21 | 2.01 × 100 | 32\0\18 | 6.39 × 100 | 31\0\19 | 8.66 × 100 | 28\0\22 |
| F4 | N/A | 1.64 × 101 | 23\0\27 | 1.02 × 10⁻⁵ | 47\0\3 | 2.74 × 10⁻⁵ | 46\0\4 | 3.24 × 10⁻⁷ | 48\0\2 | 3.71 × 10⁻⁵ | 46\0\4 | 3.61 × 10⁻⁷ | 48\0\2 |
| F5 | N/A | 2.02 × 101 | 30\0\20 | 2.79 × 101 | 27\0\23 | 2.79 × 101 | 27\0\23 | 2.85 × 101 | 26\0\24 | 6.12 × 100 | 31\0\19 | 2.59 × 101 | 28\0\22 |
| F6 | N/A | 2.66 × 101 | 23\0\27 | 4.67 × 10⁻² | 36\0\14 | 8.66 × 100 | 33\0\17 | 1.74 × 100 | 32\0\18 | 2.25 × 10⁻² | 37\0\13 | 6.18 × 100 | 32\0\18 |
| F7 | N/A | 3.34 × 101 | 26\0\24 | 3.13 × 101 | 28\0\22 | 3.22 × 101 | 23\0\27 | 2.72 × 101 | 23\0\27 | 3.26 × 101 | 23\0\27 | 3.12 × 101 | 24\0\26 |
| F8 | N/A | 1.64 × 101 | 20\0\30 | 3.26 × 101 | 24\1\25 | 2.03 × 101 | 21\0\29 | 3.27 × 101 | 24\0\26 | 3.25 × 101 | 28\1\21 | 2.71 × 101 | 20\1\29 |
| F9 | N/A | 2.49 × 101 | 0\50\0 | 2.10 × 101 | 0\50\0 | 1.70 × 101 | 0\50\0 | 1.30 × 101 | 0\50\0 | 9.00 × 100 | 0\50\0 | 5.00 × 100 | 0\50\0 |
| F10 | N/A | 2.40 × 101 | 0\50\0 | 2.00 × 101 | 0\50\0 | 1.60 × 101 | 0\50\0 | 1.20 × 101 | 0\50\0 | 8.00 × 100 | 0\50\0 | 4.00 × 100 | 0\50\0 |
| F11 | N/A | 2.30 × 101 | 0\50\0 | 1.90 × 101 | 0\50\0 | 1.50 × 101 | 0\50\0 | 1.10 × 101 | 0\50\0 | 7.00 × 100 | 0\50\0 | 3.00 × 100 | 0\50\0 |
| F12 | N/A | 3.02 × 101 | 31\0\19 | 3.32 × 10⁻¹ | 33\0\17 | 5.13 × 10⁻¹ | 36\0\14 | 9.84 × 10⁻¹ | 31\0\19 | 1.26 × 10⁻² | 37\0\13 | 6.20 × 10⁻² | 36\0\14 |
| F13 | N/A | 2.84 × 101 | 22\0\28 | 2.91 × 101 | 26\0\24 | 8.84 × 100 | 29\0\21 | 3.15 × 101 | 23\0\27 | 2.71 × 101 | 27\0\23 | 3.29 × 101 | 22\0\28 |
| F14 | N/A | 1.26 × 101 | 2\39\9 | 4.30 × 10⁻¹ | 0\41\9 | 4.30 × 10⁻¹ | 0\41\9 | 1.32 × 101 | 3\39\8 | 1.23 × 100 | 1\40\9 | 4.88 × 100 | 1\40\9 |
| F15 | N/A | 2.49 × 101 | 20\0\30 | 5.13 × 10⁻¹ | 14\0\36 | 1.31 × 101 | 18\0\32 | 2.79 × 101 | 21\0\29 | 1.99 × 101 | 29\0\21 | 2.27 × 101 | 27\0\23 |
| F16 | N/A | 2.20 × 101 | 0\50\0 | 1.80 × 101 | 0\50\0 | 1.40 × 101 | 0\50\0 | 1.00 × 101 | 0\50\0 | 6.00 × 100 | 0\50\0 | 2.00 × 100 | 0\50\0 |
| F17 | N/A | 3.23 × 101 | 10\28\12 | 2.68 × 101 | 11\28\11 | 2.20 × 101 | 12\27\11 | 9.10 × 100 | 20\21\9 | 9.18 × 100 | 22\17\11 | 3.25 × 101 | 8\31\11 |
| F18 | N/A | 3.22 × 101 | 0\48\2 | 3.28 × 101 | 5\42\3 | 3.06 × 101 | 2\45\3 | 3.32 × 101 | 5\42\3 | 3.20 × 101 | 0\48\2 | 2.76 × 101 | 2\45\3 |
| F19 | N/A | 3.28 × 101 | 25\0\25 | 1.32 × 101 | 30\0\20 | 3.23 × 101 | 27\0\23 | 3.26 × 101 | 25\0\25 | 2.92 × 101 | 25\0\25 | 3.24 × 101 | 22\0\28 |
| F20 | N/A | 3.34 × 101 | 25\0\25 | 3.00 × 101 | 23\0\27 | 2.12 × 101 | 20\0\30 | 3.00 × 101 | 23\0\27 | 3.24 × 101 | 24\0\26 | 3.27 × 101 | 24\0\26 |
| F21 | N/A | 2.03 × 101 | 21\0\29 | 2.15 × 100 | 32\0\18 | 2.87 × 10⁻¹ | 37\0\13 | 2.85 × 101 | 28\0\22 | 6.425 × 10⁻⁵ | 40\0\10 | 8.45 × 10⁻² | 38\0\12 |
| F22 | N/A | 2.20 × 101 | 29\0\21 | 1.89 × 101 | 30\0\20 | 4.39 × 10⁻² | 37\0\13 | 2.79 × 101 | 28\0\22 | 3.068 × 10⁻⁷ | 47\0\3 | 1.22 × 10⁻² | 39\0\11 |
| F23 | N/A | 2.75 × 101 | 23\0\27 | 3.05 × 101 | 28\0\22 | 2.31 × 10⁻¹ | 31\0\19 | 3.26 × 101 | 24\0\26 | 9.225 × 10⁻⁶ | 40\0\10 | 1.24 × 100 | 30\0\20 |
Table 5.
Average ranks obtained by each method in the Friedman test.
| Chaotic Mapping | Average Rankings |
|---|---|
| Gauss | 3.50 |
| Circle | 3.74 |
| Sinusoidal | 3.89 |
| Tent | 3.85 |
| Kent | 4.85 |
| Cubic | 4.57 |
| Logistic | 3.61 |
Table 6.
Results of a comparison with classic meta-heuristic algorithms.
| Benchmark | CSHHO | HHO | WOA | SCA | CSO | |
|---|---|---|---|---|---|---|
| F1 | Mean | 1.96 × 10−113 | 1.24 × 10−88 | 6.15 × 10−74 | 2.92 × 10⁻¹³ | 2.82 × 10⁻¹⁹ |
| Std | 1.38 × 10−112 | 8.75 × 10−88 | 2.79 × 10−73 | 1.33 × 10⁻¹² | 7.98 × 10⁻¹⁹ | |
| Rank | 1 | 2 | 3 | 5 | 4 | |
| Best\Worst | 1.44 × 10−138\9.78 × 10−112 | 5.93 × 10−111\6.19 × 10−87 | 1.16 × 10−87\1.85 × 10−72 | 2.12 × 10⁻²⁰\8.05 × 10⁻¹² | 4.81 × 10⁻²⁶\4.63 × 10⁻¹⁸ | |
| F2 | Mean | 1.66 × 10−59 | 1 × 10−49 | 8.97 × 10−51 | 1.04 × 10⁻¹⁰ | 1.05 × 10⁻¹⁸ |
| Std | 1.06 × 10−58 | 4.8 × 10−49 | 4.65 × 10−50 | 2.43 × 10⁻¹⁰ | 2.76 × 10⁻¹⁸ | |
| Rank | 1 | 3 | 2 | 5 | 4 | |
| Best\Worst | 7.47 × 10−58\8.54 × 10−70 | 1.86 × 10−74\1.28 × 10−73 | 4.54 × 10⁴\1.25 × 10⁴ | 2.19 × 10⁻⁴\1.31 × 10⁻³ | 6.13 × 10³\3.20 × 10³ | |
| F3 | Mean | 4.96 × 10−88 | 1.86 × 10−74 | 4.54 × 10⁴ | 0.000219 | 6.13 × 10³ |
| Std | 2.81 × 10−87 | 1.28 × 10−73 | 1.25 × 10⁴ | 1.31 × 10⁻³ | 3.2 × 10³ | |
| Rank | 1 | 2 | 5 | 3 | 4 | |
| Best\Worst | 5.85 × 10−108\1.96 × 10−86 | 4.26 × 10−99\9.05 × 10−73 | 1.81 × 10⁴\7.29 × 10⁴ | 1.75 × 10⁻¹²\9.26 × 10⁻³ | 3.04 × 10²\1.65 × 10⁴ | |
| F4 | Mean | 1.05 × 10−55 | 7.88 × 10−49 | 53.4 | 7.27 × 10⁻⁵ | 21.6 |
| Std | 6.13 × 10−55 | 4.62 × 10−48 | 2.82 × 101 | 1.38 × 10⁻⁴ | 1.28 × 101 | |
| Rank | 1 | 2 | 5 | 3 | 4 | |
| Best\Worst | 1.83 × 10−68\4.25 × 10−54 | 2.8 × 10−58\3.25 × 10−47 | 9.79 × 10⁻¹\8.84 × 101 | 2.56 × 10⁻⁷\6.9 × 10⁻⁴ | 0.0748\4.11 × 101 | |
| F5 | Mean | 8.57 × 10⁻³ | 1.02 × 10⁻² | 2.79 × 101 | 1.11 × 101 | 4.77 × 101 |
| Std | 2.23 × 10⁻² | 1.43 × 10⁻² | 4.98 × 10⁻¹ | 2.78 × 101 | 9.63 × 101 | |
| Rank | 1 | 2 | 4 | 3 | 5 | |
| Best\Worst | 1.29 × 10⁻⁸\0.132 | 1.25 × 10⁻⁵\0.0723 | 26.9\28.8 | 6.48\204 | 27.1\583 | |
| F6 | Mean | 6.73 × 10⁻⁷ | 1.59 × 10⁻⁴ | 0.374 | 0.377 | 3.73 |
| Std | 1.85 × 10⁻⁶ | 2.76 × 10⁻⁴ | 2.44 × 10⁻¹ | 1.42 × 10⁻¹ | 4.16 × 10⁻¹ | |
| Rank | 1 | 2 | 3 | 4 | 5 | |
| Best\Worst | 4.40 × 10⁻¹⁴\8.8 × 10⁻⁶ | 4.85 × 10⁻⁹\0.00181 | 0.0422\1.25 | 0.117\0.627 | 3.05\4.99 | |
| F7 | Mean | 5.98 × 10⁻⁵ | 2.02 × 10⁻⁴ | 3.67 × 10⁻³ | 1.84 × 10⁻³ | 9.11 × 10⁻² |
| Std | 7.15 × 10⁻⁵ | 3.26 × 10⁻⁴ | 3.79 × 10⁻³ | 2.02 × 10⁻³ | 1.82 × 10⁻¹ | |
| Rank | 1 | 2 | 4 | 3 | 5 | |
| Best\Worst | 2.03 × 10⁻⁷\4.65 × 10⁻⁴ | 3.13 × 10⁻⁷\2.10 × 10⁻³ | 9.46 × 10⁻⁶\1.75 × 10⁻² | 6.53 × 10⁻⁵\1.02 × 10⁻² | 2.66 × 10⁻³\1.07 | |
| F8 | Mean | −1.24 × 10⁴ | −1.26 × 10⁴ | −1.04 × 10⁴ | −2.24 × 10³ | −7.12 × 10³ |
| Std | 2.71 × 10² | 9.50 × 101 | 1.67 × 10³ | 1.52 × 10² | 6.62 × 10² | |
| Rank | 2 | 1 | 3 | 5 | 4 | |
| Best\Worst | −1.26 × 10⁴\−1.15 × 10⁴ | −1.26 × 10⁴\−1.19 × 10⁴ | −1.26 × 10⁴\−7.76 × 10³ | −2.61 × 10³\−1.81 × 10³ | −8.89 × 10³\−5.91 × 10³ | |
| F9 | Mean | 0 | 0 | 3.41 × 10⁻¹⁵ | 0.572 | 0.725 |
| Std | 0 | 0 | 1.78 × 10⁻¹⁴ | 2.03 | 3.34 | |
| Rank | 1 | 1 | 3 | 4 | 5 | |
| Best\Worst | 0\0 | 0\0 | 0\1.14 × 10⁻¹³ | 0\1.12 × 101 | 0\2.11 × 101 | |
| F10 | Mean | 8.88 × 10⁻¹⁶ | 8.88 × 10⁻¹⁶ | 4.3 × 10⁻¹⁵ | 5.46 × 10⁻⁸ | 9.39 × 10⁻¹¹ |
| Std | 1.99 × 10⁻³¹ | 1.99 × 10⁻³¹ | 2.68 × 10⁻¹⁵ | 1.41 × 10⁻⁷ | 2.5 × 10⁻¹⁰ | |
| Rank | 1 | 1 | 3 | 5 | 4 | |
| Best\Worst | 8.88 × 10⁻¹⁶\8.88 × 10⁻¹⁶ | 8.88 × 10⁻¹⁶\8.88 × 10⁻¹⁶ | 8.88 × 10⁻¹⁶\7.99 × 10⁻¹⁵ | 6.45 × 10⁻¹¹\7.1 × 10⁻⁷ | 2.82 × 10⁻¹³\1.66 × 10⁻⁹ | |
| F11 | Mean | 0 | 0 | 1.97 × 10⁻² | 9.43 × 10⁻² | 1.22 × 10⁻² |
| Std | 0 | 0 | 7.55 × 10⁻² | 1.56 × 10⁻¹ | 4.49 × 10⁻² | |
| Rank | 1 | 1 | 4 | 5 | 3 | |
| Best\Worst | 0\0 | 0\0 | 0\4.34 × 10⁻¹ | 0\7.65 × 10⁻¹ | 0\2.47 × 10⁻¹ | |
| F12 | Mean | 5.26 × 10⁻⁷ | 9.97 × 10⁻⁶ | 2.69 × 10⁻² | 7.80 × 10⁻² | 229 |
| Std | 1.2 × 10⁻⁶ | 1.36 × 10⁻⁵ | 0.04 | 2.80 × 10⁻² | 1.1 × 10³ | |
| Rank | 1 | 2 | 3 | 4 | 5 | |
| Best\Worst | 1.68 × 10⁻¹¹\5 × 10⁻⁶ | 3.07 × 10⁻⁸\7.06 × 10⁻⁵ | 4.58 × 10⁻³\2.64 × 10⁻¹ | 3.41 × 10⁻²\1.63 × 10⁻¹ | 1.57 × 10⁻¹\7.34 × 10³ | |
| F13 | Mean | 1.64 × 10⁻⁵ | 1.26 × 10⁻⁴ | 5.05 × 10⁻¹ | 2.64 × 10⁻¹ | 5.48 |
| Std | 2.86 × 10⁻⁵ | 2.49 × 10⁻⁴ | 2.57 × 10⁻¹ | 8.66 × 10⁻² | 2.07 × 101 | |
| Rank | 1 | 2 | 4 | 3 | 5 | |
| Best\Worst | 6.14 × 10⁻¹⁰\1.23 × 10⁻⁴ | 3.21 × 10⁻⁷\1.31 × 10⁻³ | 9.14 × 10⁻²\1.19 | 8.80 × 10⁻²\5.17 × 10⁻¹ | 1.38\1.47 × 10² | |
| F14 | Mean | 1.39 | 1.37 | 3.06 | 1.63 | 1.34 |
| Std | 1.23 | 0.796 | 3.15 | 0.935 | 1.45 | |
| Rank | 3 | 2 | 5 | 4 | 1 | |
| Best\Worst | 9.98 × 10⁻¹\5.93 | 9.98 × 10⁻¹\5.93 | 0.9.98 × 10−1\10.8 | 0.9.98 × 10−1\2.98 | 0.9.98 × 10−1\10.8 | |
| F15 | Mean | 3.40 × 10⁻⁴ | 3.60 × 10⁻⁴ | 7.04 × 10⁻⁴ | 9.44 × 10⁻⁴ | 7.90 × 10⁻⁴ |
| Std | 3.39 × 10⁻⁵ | 1.45 × 10⁻⁴ | 4.57 × 10⁻⁴ | 3.72 × 10⁻⁴ | 2.78 × 10⁻⁴ | |
| Rank | 1 | 2 | 3 | 5 | 4 | |
| Best\Worst | 3.14 × 10⁻⁴\5.55 × 10⁻⁴ | 3.08 × 10⁻⁴\1.34 × 10⁻³ | 3.10 × 10⁻⁴\2.25 × 10⁻³ | 3.63 × 10⁻⁴\1.59 × 10⁻³ | 3.19 × 10⁻⁴\1.62 × 10⁻³ | |
| F16 | Mean | −1.03 | −1.03 | −1.03 | −1.03 | −1.03 |
| Std | 1.35 × 10⁻¹⁵ | 1.98 × 10⁻⁸ | 2.4 × 10⁻⁸ | 2.16 × 10⁻⁵ | 2.6 × 10⁻⁶ | |
| Rank | 1 | 2 | 3 | 5 | 4 | |
| Best\Worst | −1.03\−1.03 | −1.03\−1.03 | −1.03\−1.03 | −1.03\−1.03 | −1.03\−1.03 | |
| F17 | Mean | 3.98 × 10⁻¹ | 0.3.98 × 10−1 | 0.398 × 10⁻¹ | 0.399 × 10⁻¹ | 0.398 × 10⁻¹ |
| Std | 1.88 × 10⁻⁸ | 2.62 × 10⁻⁵ | 2.15 × 10⁻⁵ | 7.21 × 10⁻⁴ | 1.86 × 10⁻⁵ | |
| Rank | 1 | 1 | 1 | 1 | 1 | |
| Best\Worst | 3.98 × 10⁻¹\3.98 × 10⁻¹ | 3.98 × 10⁻¹\3.98 × 10⁻¹ | 3.98 × 10⁻¹\3.98 × 10⁻¹ | 3.98 × 10⁻¹\0.401 | 3.98 × 10⁻¹\3.98 × 10⁻¹ | |
| F18 | Mean | 3.00 | 3.00 | 3.00 | 3.00 | 3.00 |
| Std | 1.15 × 10⁻⁷ | 1.01 × 10⁻⁶ | 1.62 × 10⁻⁴ | 5.88 × 10⁻⁵ | 2.09 × 10⁻⁴ | |
| Rank | 1 | 1 | 1 | 1 | 1 | |
| Best\Worst | 3.00\3.00 | 3.00\3.00 | 3.00\3.00 | 3.00\3.00 | 3.00\3.00 | |
| F19 | Mean | −3.86 | −3.86 | −3.85 | −3.85 | −3.86 |
| Std | 1.83 × 10⁻³ | 3.29 × 10⁻³ | 1.71 × 10⁻² | 2.18 × 10⁻³ | 1.01 × 10⁻² | |
| Rank | 1 | 1 | 1 | 1 | 1 | |
| Best\Worst | −3.86\−3.86 | −3.86\−3.85 | −3.86\−3.75 | −3.86\−3.85 | −3.86\−3.8 | |
| F20 | Mean | −3.13 | −3.07 | −3.26 | −3.01 | −3.24 |
| Std | 1.05 × 10⁻¹ | 1.41 × 10⁻¹ | 8.66 × 10⁻² | 1.27 × 10⁻¹ | 7.31 × 10⁻² | |
| Rank | 3 | 4 | 1 | 5 | 2 | |
| Best\Worst | −3.31\−2.74 | −3.30\−2.73 | −3.32\−3.04 | −3.19\−2.59 | −3.32\−3.02 | |
| F21 | Mean | −9.65 | −5.35 | −8.24 | −3.02 | −7.64 |
| Std | 1.38 | 1.18 | 2.54 | 1.83 | 3.02 | |
| Rank | 1 | 4 | 2 | 5 | 3 | |
| Best\Worst | −10.2\−5.02 | −10.1\−5.04 | −10.2\−2.63 | −5.82\−0.497 | −10.2\−2.55 | |
| F22 | Mean | −9.45 | −5.46 | −7.83 | −3.59 | −8.19 |
| Std | 1.94 | 1.29 | \.97 | 1.79 | 2.98 | |
| Rank | 1 | 4 | 3 | 5 | 2 | |
| Best\Worst | −10.4\−5.03 | −10.1\−5.03 | −10.4\−2.76 | −8.23\−0.906 | −10.4\−2.74 | |
| F23 | Mean | −9.97 | −5.04 | −7.59 | −4.1 | −8.05 |
| Std | 1.46 | 1.02 | 3.29 | 1.59 | 3.28 | |
| Rank | 1 | 4 | 3 | 5 | 2 | |
| Best\Worst | −10.5\−5.09 | −9.96\−1.65 | −10.5\−1.67 | −9.42\−0.945 | −10.5\−2.37 |
Table 7.
The Bonferroni-Holm corrected p-values of Wilcoxon’s signed-rank test with classic meta-heuristic algorithms.
Table 7.
The Bonferroni-Holm corrected p-values of Wilcoxon’s signed-rank test with classic meta-heuristic algorithms.
| Benchmark | CSHHO | HHO | WOA | SCA | CSO | ||||
|---|---|---|---|---|---|---|---|---|---|
| Corrected p-Value | +\=\− | Corrected p-Value | +\=\− | Corrected p-Value | +\=\− | Corrected p-Value | +\=\− | ||
| F1 | N/A | 6.80 × 10⁻⁸ | 0\0\50 | 6.50 × 10⁻⁸ | 0\0\50 | 5.89 × 10⁻⁸ | 0\0\50 | 4.84 × 10⁻⁸ | 0\0\50 |
| F2 | N/A | 6.73 × 10⁻⁸ | 0\0\50 | 6.42 × 10⁻⁸ | 0\0\50 | 5.82 × 10⁻⁸ | 0\0\50 | 4.76 × 10⁻⁸ | 0\0\50 |
| F3 | N/A | 1.38 × 10⁻⁶ | 5\0\45 | 6.35 × 10⁻⁸ | 0\0\50 | 5.74 × 10⁻⁸ | 0\0\50 | 4.69 × 10⁻⁸ | 0\0\50 |
| F4 | N/A | 6.65 × 10⁻⁸ | 0\0\50 | 6.27 × 10⁻⁸ | 0\0\50 | 5.67 × 10⁻⁸ | 0\0\50 | 4.61 × 10⁻⁸ | 0\0\50 |
| F5 | N/A | 5.24 × 10⁻¹ | 18\0\32 | 6.20 × 10⁻⁸ | 0\0\50 | 5.59 × 10⁻⁸ | 0\0\50 | 4.53 × 10⁻⁸ | 0\0\50 |
| F6 | N/A | 6.57 × 10⁻⁸ | 0\0\50 | 6.12 × 10⁻⁸ | 0\0\50 | 5.52 × 10⁻⁸ | 0\0\50 | 4.46 × 10⁻⁸ | 0\0\50 |
| F7 | N/A | 4.11 × 10⁻⁴ | 11\0\39 | 4.27 × 10⁻⁸ | 1\0\49 | 4.18 × 10⁻⁸ | 1\0\49 | 4.38 × 10⁻⁸ | 0\0\50 |
| F8 | N/A | 1.22 × 10⁻³ | 35\0\15 | 1.77 × 10⁻⁶ | 8\0\42 | 5.44 × 10⁻⁸ | 0\0\50 | 4.31 × 10⁻⁸ | 0\0\50 |
| F9 | N/A | 3.00 × 100 | 0\50\0 | 4.00 × 100 | 0\48\2 | 6.92 × 10⁻⁷ | 0\8\42 | 8.13 × 10⁻¹ | 0\45\5 |
| F10 | N/A | 3.00 × 100 | 0\50\0 | 3.17 × 10⁻⁶ | 0\15\35 | 5.37 × 10⁻⁸ | 0\0\50 | 4.23 × 10⁻⁸ | 0\0\50 |
| F11 | N/A | 2.00 × 100 | 0\50\0 | 8.13 × 10⁻¹ | 0\45\5 | 1.10 × 10⁻⁷ | 0\3\47 | 3.17 × 10⁻³ | 0\36\14 |
| F12 | N/A | 6.92 × 10⁻⁷ | 5\0\45 | 6.05 × 10⁻⁸ | 0\0\50 | 5.29 × 10⁻⁸ | 0\0\50 | 4.16 × 10⁻⁸ | 0\0\50 |
| F13 | N/A | 1.44 × 10⁻³ | 11\0\39 | 5.97 × 10⁻⁸ | 0\0\50 | 5.21 × 10⁻⁸ | 0\0\50 | 4.08 × 10⁻⁸ | 0\0\50 |
| F14 | N/A | 3.93 × 100 | 6\30\14 | 1.15 × 10⁻² | 6\16\28 | 4.60 × 10⁻³ | 6\2\42 | 3.93 × 100 | 5\38\7 |
| F15 | N/A | 3.57 × 100 | 26\0\24 | 1.81 × 10⁻⁷ | 5\0\45 | 5.14 × 10⁻⁸ | 0\0\50 | 4.18 × 10⁻⁸ | 1\0\49 |
| F16 | N/A | 4.00 × 100 | 0\48\2 | 2.25 × 100 | 0\47\3 | 6.94 × 10⁻⁸ | 0\0\50 | 1.15 × 10⁻² | 0\38\12 |
| F17 | N/A | 3.58 × 10⁻⁵ | 1\17\32 | 2.72 × 10⁻⁶ | 1\11\38 | 5.06 × 10⁻⁸ | 0\0\50 | 3.09 × 10⁻² | 3\32\15 |
| F18 | N/A | 2.96 × 10⁻¹ | 2\36\12 | 6.87 × 10⁻⁸ | 0\0\50 | 6.94 × 10⁻⁸ | 0\0\50 | 5.00 × 10⁻¹ | 2\41\7 |
| F19 | N/A | 3.02 × 10⁻² | 13\0\37 | 1.16 × 10⁻⁴ | 10\0\40 | 5.33 × 10⁻⁸ | 1\0\49 | 6.77 × 10⁻¹ | 21\0\29 |
| F20 | N/A | 2.96 × 10⁻¹ | 19\0\31 | 1.04 × 10⁻⁵ | 41\0\9 | 2.34 × 10⁻⁴ | 13\0\37 | 5.59 × 10⁻⁵ | 38\0\12 |
| F21 | N/A | 2.23 × 10⁻⁷ | 3\0\47 | 1.10 × 100 | 22\0\28 | 4.99 × 10⁻⁸ | 0\0\50 | 2.49 × 10⁻⁴ | 10\0\40 |
| F22 | N/A | 2.59 × 10⁻⁷ | 7\0\43 | 1.54 × 100 | 25\0\25 | 5.33 × 10⁻⁸ | 1\0\49 | 9.79 × 10⁻² | 16\0\34 |
| F23 | N/A | 5.43 × 10⁻⁸ | 2\0\48 | 1.02 × 10⁻¹ | 18\0\32 | 4.91 × 10⁻⁸ | 0\0\50 | 4.73 × 10⁻⁴ | 14\0\36 |
Table 8.
Average rankings obtained by classic meta-heuristic in the Friedman test, and the best result is shown in boldface.
Table 8.
Average rankings obtained by classic meta-heuristic in the Friedman test, and the best result is shown in boldface.
| Chaotic Mapping | Average Rankings |
|---|---|
| CSHHO | 2.57 |
| HHO | 3.67 |
| WOA | 4.74 |
| SCA | 5.96 |
| CSO | 5.00 |
Table 9.
Results of a comparison with the advanced meta-heuristic algorithms.
| Benchmark | CSHHO | GCHHO | DEPSOASS | Improved GSA | DGOBLFOA | |
|---|---|---|---|---|---|---|
| F1 | Mean | 1.96 × 10−113 | 3.91 × 10−97 | 1.45 × 10⁻³ | 2.84 × 101 | 2.88 × 10⁻⁸ |
| Std | 1.38 × 10−112 | 2.55 × 10−96 | 1.45 × 10⁻³ | 2.84 × 101 | 2.88 × 10⁻⁸ | |
| Rank | 1 | 2 | 4 | 5 | 3 | |
| Best\Worst | 9.78 × 10−112\1.44 × 10−138 | 1.80 × 10−95\1.25 × 10−119 | 3.22 × 10⁻³\3.86 × 10⁻⁴ | 4.68 × 101\1.51 × 101 | 1.42 × 10⁻⁶\0.00 × 100 | |
| F2 | Mean | 1.66 × 10−59 | 1.62 × 10−50 | 1.88 × 10⁻¹ | 2.81 × 101 | 2.54 × 10⁻¹ |
| Std | 1.06 × 10−58 | 9.45 × 10−50 | 1.88 × 10⁻¹ | 2.81 × 101 | 2.54 × 10⁻¹ | |
| Rank | 1 | 2 | 3 | 5 | 4 | |
| Best\Worst | 7.47 × 10−58\8.54 × 10−70 | 6.63 × 10−49\3.57 × 10−60 | 2.84 × 10⁻¹\1.19 × 10⁻¹ | 3.46 × 101\1.44 × 101 | 1.03 × 100\8.72 × 10⁻⁴ | |
| F3 | Mean | 4.96 × 10−88 | 1.46 × 10−65 | 5.37 × 10⁻¹ | 3.32 × 10² | 1.18 × 10⁻² |
| Std | 2.81 × 10−87 | 1.01 × 10−64 | 5.37 × 10⁻¹ | 3.32 × 10² | 1.18 × 10⁻² | |
| Rank | 1 | 2 | 4 | 5 | 3 | |
| Best\Worst | 1.96 × 10−86\5.85 × 10−108 | 7.16 × 10−64\1.16 × 10−91 | 1.44 × 100\9.11 × 10⁻² | 5.38 × 10²\1.39 × 10² | 4.66 × 10⁻¹\1.45 × 10⁻²⁴ | |
| F4 | Mean | 1.05 × 10−55 | 1.82 × 10−48 | 3.49 × 10⁻² | 2.31 × 100 | 1.74 × 10⁻⁴ |
| Std | 6.13 × 10−55 | 9.06 × 10−48 | 3.49 × 10⁻² | 2.31 × 100 | 1.74 × 10⁻⁴ | |
| Rank | 1 | 2 | 4 | 5 | 3 | |
| Best\Worst | 4.25 × 10−54\1.83 × 10−68 | 5.94 × 10−47\2.66 × 10−58 | 5.40 × 10⁻²\1.75 × 10⁻² | 2.83 × 100\1.44 × 100 | 8.57 × 10⁻³\1.29 × 10⁻²⁰ | |
| F5 | Mean | 8.57 × 10⁻³ | 7.14 × 10⁻⁴ | 2.76 × 101 | 1.19 × 10⁴ | 2.87 × 101 |
| Std | 2.23 × 10⁻² | 7.02 × 10⁻⁴ | 2.76 × 101 | 1.19 × 10⁴ | 2.87 × 101 | |
| Rank | 2 | 1 | 3 | 5 | 4 | |
| Best\Worst | 1.32 × 10⁻¹\1.29 × 10⁻⁸ | 3.28 × 10⁻³\2.96 × 10⁻⁵ | 2.95 × 101\2.59 × 101 | 2.60 × 10⁴\1.29 × 10³ | 3.20 × 101\2.79 × 101 | |
| F6 | Mean | 6.73 × 10⁻⁷ | 1.20 × 10⁻⁶ | 1.30 × 10⁻³ | 2.83 × 101 | 5.35 × 100 |
| Std | 1.85 × 10⁻⁶ | 1.61 × 10⁻⁶ | 1.30 × 10⁻³ | 2.83 × 101 | 5.35 × 100 | |
| Rank | 1 | 2 | 3 | 5 | 4 | |
| Best\Worst | 8.80 × 10⁻⁶\4.40 × 10⁻¹⁴ | 1.02 × 10⁻⁵\1.47 × 10⁻⁷ | 3.27 × 10⁻³\3.91 × 10⁻⁴ | 4.15 × 101\1.43 × 101 | 6.03 × 100\4.32 × 100 | |
| F7 | Mean | 5.98 × 10⁻⁵ | 1.94 × 10⁻⁴ | 1.26 × 10⁻¹ | 1.04 × 10² | 6.10 × 10⁻¹ |
| Std | 7.15 × 10⁻⁵ | 1.92 × 10⁻⁴ | 1.26 × 10⁻¹ | 1.04 × 10² | 6.10 × 10⁻¹ | |
| Rank | 1 | 2 | 3 | 5 | 4 | |
| Best\Worst | 4.65 × 10⁻⁴\2.03 × 10⁻⁷ | 7.84 × 10⁻⁴\5.01 × 10⁻⁶ | 2.21 × 10⁻¹\7.33 × 10⁻² | 1.52 × 10²\3.44 × 100 | 1.44 × 100\1.01 × 10⁻¹ | |
| F8 | Mean | −1.24 × 10⁴ | −1.25 × 10⁴ | −2.78 × 10³ | −2.70 × 10³ | −3.70 × 10² |
| Std | 2.71 × 10² | 1.67 × 10² | −2.78 × 10³ | −2.70 × 10³ | 1.69 × 10² | |
| Rank | 2 | 1 | 3 | 4 | 5 | |
| Best\Worst | −1.15 × 10⁴\−1.26 × 10⁴ | −1.18 × 10⁴\−1.26 × 10⁴ | −1.79 × 10³\−3.79 × 10³ | −1.74 × 10³\−3.42 × 10³ | −1.79 × 10³\−3.46 × 10³ | |
| F9 | Mean | 0.00 | 0.00 | 3.72 × 101 | 2.54 × 10² | 8.95 × 100 |
| Std | 0.00 | 0.00 | 3.72 × 101 | 2.54 × 10² | 8.95 × 100 | |
| Rank | 1 | 1 | 4 | 5 | 3 | |
| Best\Worst | 0.00\0.00 | 0.00\0.00 | 6.02 × 101\2.00 × 101 | 2.91 × 10²\1.96 × 10² | 2.81 × 101\2.18 × 10⁻³ | |
| F10 | Mean | 8.88 × 10⁻¹⁶ | 8.88 × 10⁻¹⁶ | 3.06 × 10⁻² | 5.11 × 100 | 4.23 × 10⁻² |
| Std | 1.99 × 10⁻³¹ | 1.99 × 10⁻³¹ | 3.06 × 10⁻² | 5.11 × 100 | 4.23 × 10⁻² | |
| Rank | 1 | 1 | 3 | 5 | 4 | |
| Best\Worst | 8.88 × 10⁻¹⁶\8.88 × 10⁻¹⁶ | 8.88 × 10⁻¹⁶\8.88 × 10⁻¹⁶ | 4.31 × 10⁻²\1.67 × 10⁻² | 6.09 × 100\3.64 × 100 | 6.08 × 10⁻¹\8.88 × 10⁻¹⁶ | |
| F11 | Mean | 0.00 × 100 | 0.00 × 100 | 5.90 × 10⁻⁴ | 7.85 × 10⁻¹ | 1.09 × 10⁻⁹ |
| Std | 0.00 × 100 | 0.00 × 100 | 5.90 × 10⁻⁴ | 7.85 × 10⁻¹ | 1.09 × 10⁻⁹ | |
| Rank | 1 | 1 | 4 | 5 | 3 | |
| Best\Worst | 0.00\0.00 | 0.00\0.00 | 1.97 × 10⁻²\2.27 × 10⁻⁵ | 9.59 × 10⁻¹\4.58 × 10⁻¹ | 5.46 × 10⁻⁸\0.00 × 100 | |
| F12 | Mean | 5.26 × 10⁻⁷ | 8.05 × 10⁻⁸ | 9.89 × 10⁻⁶ | 1.29 × 100 | 6.98 × 10⁻¹ |
| Std | 1.20 × 10⁻⁶ | 9.54 × 10⁻⁸ | 9.89 × 10⁻⁶ | 1.29 × 100 | 6.98 × 10⁻¹ | |
| Rank | 2 | 1 | 3 | 5 | 4 | |
| Best\Worst | 5.00 × 10⁻⁶\1.68 × 10⁻¹¹ | 5.02 × 10⁻⁷\5.77 × 10⁻⁹ | 2.58 × 10⁻⁵\4.76 × 10⁻⁶ | 2.32 × 100\6.10 × 10⁻¹ | 1.01 × 100\3.67 × 10⁻¹ | |
| F13 | Mean | 1.64 × 10⁻⁵ | 1.26 × 10⁻⁶ | 1.69 × 10⁻³ | 6.34 × 100 | 2.44 × 100 |
| Std | 2.86 × 10⁻⁵ | 1.48 × 10⁻⁶ | 1.69 × 10⁻³ | 6.34 × 100 | 2.44 × 100 | |
| Rank | 2 | 1 | 3 | 5 | 4 | |
| Best\Worst | 1.23 × 10⁻⁴\6.14 × 10⁻¹⁰ | 6.48 × 10⁻⁶\4.00 × 10⁻⁸ | 1.12 × 10⁻²\6.80 × 10⁻⁵ | 9.67 × 100\2.90 × 100 | 2.88 × 100\1.60 × 100 | |
| F14 | Mean | 1.39 × 100 | 9.98 × 10⁻¹ | 1.52 × 100 | 7.07 × 100 | 4.34 × 100 |
| Std | 1.23 × 100 | 5.61 × 10⁻¹⁶ | 1.52 × 100 | 7.07 × 100 | 4.34 × 100 | |
| Rank | 2 | 1 | 3 | 5 | 4 | |
| Best\Worst | 5.93 × 100\9.98 × 10⁻¹ | 9.98 × 10⁻¹\9.98 × 10⁻¹ | 3.02 × 100\9.98 × 10⁻¹ | 1.55 × 101\1.01 × 100 | 1.18 × 101\9.98 × 10⁻¹ | |
| F15 | Mean | 3.40 × 10⁻⁴ | 3.17 × 10⁻⁴ | 9.62 × 10⁻⁴ | 1.39 × 10⁻³ | 2.61 × 10⁻² |
| Std | 3.39 × 10⁻⁵ | 4.50 × 10⁻⁵ | 9.62 × 10⁻⁴ | 1.39 × 10⁻³ | 2.61 × 10⁻² | |
| Rank | 2 | 1 | 3 | 4 | 5 | |
| Best\Worst | 5.55 × 10⁻⁴\3.14 × 10⁻⁴ | 5.41 × 10⁻⁴\3.07 × 10⁻⁴ | 4.55 × 10⁻³\5.50 × 10⁻⁴ | 3.18 × 10⁻³\1.03 × 10⁻³ | 6.88 × 10⁻²\1.81 × 10⁻³ | |
| F16 | Mean | −1.03 × 100 | −1.03 × 100 | −1.03 × 100 | −1.02 × 100 | −1.03 × 100 |
| Std | 1.35 × 10⁻¹⁵ | 1.35 × 10⁻¹⁵ | −1.03 × 100 | −1.02 × 100 | −1.03 × 100 | |
| Rank | 1 | 1 | 1 | 5 | 1 | |
| Best\Worst | −1.03 × 100\−1.03 × 100 | −1.03 × 100\−1.03 × 100 | −1.03 × 100\−1.03 × 100 | −9.22 × 10⁻¹\−1.03 × 100 | −1.03 × 100\−1.03 × 100 | |
| F17 | Mean | 3.98 × 10⁻¹ | 3.98 × 10⁻¹ | 3.98 × 10⁻¹ | 4.08 × 10⁻¹ | 5.30 × 10⁻¹ |
| Std | 1.88 × 10⁻⁸ | 1.12 × 10⁻¹⁶ | 3.98 × 10⁻¹ | 4.08 × 10⁻¹ | 5.30 × 10⁻¹ | |
| Rank | 1 | 1 | 1 | 4 | 5 | |
| Best\Worst | 3.98 × 10⁻¹³\98 × 10−1 | 3.98 × 10⁻¹\3.98 × 10⁻¹ | 3.98 × 10⁻¹\3.98 × 10⁻¹ | 4.35 × 10⁻¹\3.98 × 10⁻¹ | 1.70 × 100\4.00 × 10⁻¹ | |
| F18 | Mean | 3.00 × 100 | 3.00 × 100 | 3.00 × 100 | 4.91 × 100 | 3.50 × 100 |
| Std | 1.15 × 10⁻⁷ | 0.00 × 100 | 3.00 × 100 | 4.91 × 100 | 3.50 × 100 | |
| Rank | 1 | 1 | 1 | 5 | 4 | |
| Best\Worst | 3.00 × 100\3.00 × 100 | 3.00 × 100\3.00 × 100 | 3.00 × 100\3.00 × 100 | 1.25 × 101\3.01 × 100 | 6.51 × 100\3.01 × 100 | |
| F19 | Mean | −3.86 × 100 | −3.86 × 100 | −3.86 × 100 | −3.45 × 100 | −3.50 × 100 |
| Std | 1.83 × 10⁻³ | 2.24 × 10⁻¹⁵ | −3.86 × 100 | −3.45 × 100 | −3.50 × 100 | |
| Rank | 1 | 1 | 1 | 5 | 4 | |
| Best\Worst | −3.86 × 100\−3.86 × 100 | −3.86 × 100\−3.86 × 100 | −3.86 × 100\−3.86 × 100 | −2.90 × 100\−3.86 × 100 | −2.69 × 100\−3.85 × 100 | |
| F20 | Mean | −3.13 × 100 | −3.25 × 100 | −3.31 × 100 | −1.69 × 100 | −2.09 × 100 |
| Std | 1.05 × 10⁻¹ | 5.88 × 10⁻² | −3.31 × 100 | −1.69 × 100 | −2.09 × 100 | |
| Rank | 3 | 2 | 1 | 5 | 4 | |
| Best\Worst | −2.74 × 100\−3.31 × 100 | −3.20 × 100\−3.32 × 100 | −3.18 × 100\−3.32 × 100 | −6.72 × 10⁻¹\−2.55 × 100 | −1.11 × 100\−3.10 × 100 | |
| F21 | Mean | −9.65 × 100 | −6.07 × 100 | −6.85 × 100 | −4.05 × 100 | −4.49 × 100 |
| Std | 1.38 × 100 | 2.06 × 100 | −6.85 × 100 | −4.05 × 100 | −4.49 × 100 | |
| Rank | 1 | 3 | 2 | 5 | 4 | |
| Best\Worst | −5.02 × 100\−1.02 × 101 | −5.06 × 100\−1.02 × 101 | −2.68 × 100\−1.02 × 101 | −1.99 × 100\−7.93 × 100 | −2.67 × 100\−7.66 × 100 | |
| F22 | Mean | −9.45 × 100 | −5.94 × 100 | −1.01 × 101 | −3.55 × 100 | −4.08 × 100 |
| Std | 1.94 × 100 | 1.97 × 100 | −1.01 × 101 | −3.55 × 100 | −4.08 × 100 | |
| Rank | 2 | 3 | 1 | 5 | 4 | |
| Best\Worst | −5.03 × 100\−1.04 × 101 | −5.09 × 100\−1.04 × 101 | −6.48 × 100\−1.04 × 101 | −1.93 × 100\−7.27 × 100 | −1.67 × 100\−8.98 × 100 | |
| F23 | Mean | −9.97 × 100 | −5.67 × 100 | −1.03 × 101 | −4.34 × 100 | −4.48 × 100 |
| Std | 1.46 × 100 | 1.64 × 100 | −1.03 × 101 | −4.34 × 100 | −4.48 × 100 | |
| Rank | 2 | 3 | 1 | 5 | 4 | |
| Best\Worst | −5.09 × 100\−1.05 × 101 | −5.13 × 100\−1.05 × 101 | −5.42 × 100\−1.05 × 101 | −2.61 × 100\−7.03 × 100 | −2.43 × 100\−9.12 × 100 |
Table 10.
The Bonferroni-Holm corrected p-values of Wilcoxon’s signed-rank test with the advanced meta-heuristic algorithms.
Table 10.
The Bonferroni-Holm corrected p-values of Wilcoxon’s signed-rank test with the advanced meta-heuristic algorithms.
| Benchmark | GCHHO | DEPSOASS | GSA | FOA | |||||
|---|---|---|---|---|---|---|---|---|---|
| Corrected p-Value | +\=\− | Corrected p-Value | +\=\− | Corrected p-Value | +\=\− | Corrected p-Value | +\=\− | ||
| F1 | N/A | 3.07 × 10⁻⁸ | 1\0\49 | 6.57 × 10⁻⁸ | 0\0\50 | 5.06 × 10⁻⁸ | 0\0\50 | 2.99 × 10⁻⁸ | 2\0\48 |
| F2 | N/A | 6.80 × 10⁻⁸ | 0\0\50 | 6.50 × 10⁻⁸ | 0\0\50 | 4.99 × 10⁻⁸ | 0\0\50 | 4.01 × 10⁻⁸ | 0\0\50 |
| F3 | N/A | 6.73 × 10⁻⁸ | 0\0\50 | 6.42 × 10⁻⁸ | 0\0\50 | 4.91 × 10⁻⁸ | 0\0\50 | 3.93 × 10⁻⁸ | 0\0\50 |
| F4 | N/A | 6.65 × 10⁻⁸ | 0\0\50 | 6.35 × 10⁻⁸ | 0\0\50 | 4.84 × 10⁻⁸ | 0\0\50 | 3.85 × 10⁻⁸ | 0\0\50 |
| F5 | N/A | 3.46 × 10⁻¹ | 25\0\25 | 6.27 × 10⁻⁸ | 0\0\50 | 4.76 × 10⁻⁸ | 0\0\50 | 3.78 × 10⁻⁸ | 0\0\50 |
| F6 | N/A | 4.84 × 10⁻³ | 9\0\41 | 6.20 × 10⁻⁸ | 0\0\50 | 4.69 × 10⁻⁸ | 0\0\50 | 3.70 × 10⁻⁸ | 0\0\50 |
| F7 | N/A | 4.72 × 10⁻⁴ | 12\0\38 | 6.12 × 10⁻⁸ | 0\0\50 | 4.61 × 10⁻⁸ | 0\0\50 | 3.63 × 10⁻⁸ | 0\0\50 |
| F8 | N/A | 3.70 × 10⁻¹ | 35\0\15 | 6.05 × 10⁻⁸ | 0\0\50 | 4.53 × 10⁻⁸ | 0\0\50 | 3.55 × 10⁻⁸ | 50\0\0 |
| F9 | N/A | 4.00 × 100 | 0\50\0 | 5.97 × 10⁻⁸ | 0\0\50 | 4.46 × 10⁻⁸ | 0\0\50 | 3.48 × 10⁻⁸ | 0\0\50 |
| F10 | N/A | 4.00 × 100 | 0\50\0 | 5.89 × 10⁻⁸ | 0\0\50 | 4.38 × 10⁻⁸ | 0\0\50 | 4.71 × 10⁻⁸ | 0\2\48 |
| F11 | N/A | 3.00 × 100 | 0\50\0 | 5.82 × 10⁻⁸ | 0\0\50 | 4.31 × 10⁻⁸ | 0\0\50 | 8.59 × 10⁻² | 0\42\8 |
| F12 | N/A | 8.60 × 10⁻¹ | 26\0\24 | 5.74 × 10⁻⁸ | 0\0\50 | 4.23 × 10⁻⁸ | 0\0\50 | 3.40 × 10⁻⁸ | 0\0\50 |
| F13 | N/A | 7.25 × 10⁻⁴ | 36\0\14 | 5.67 × 10⁻⁸ | 0\0\50 | 4.16 × 10⁻⁸ | 0\0\50 | 3.33 × 10⁻⁸ | 0\0\50 |
| F14 | N/A | 3.13 × 10⁻¹ | 6\44\0 | 1.02 × 10⁻⁷ | 2\0\48 | 1.20 × 10⁻³ | 5\1\44 | 1.39 × 10⁻⁷ | 1\0\49 |
| F15 | N/A | 3.99 × 10⁻⁶ | 48\0\2 | 5.59 × 10⁻⁸ | 0\0\50 | 4.08 × 10⁻⁸ | 0\0\50 | 3.25 × 10⁻⁸ | 0\0\50 |
| F16 | N/A | 2.00 × 100 | 0\50\0 | 5.52 × 10⁻⁸ | 0\0\50 | 6.75 × 10⁻⁸ | 0\0\50 | 3.17 × 10⁻⁴ | 0\26\24 |
| F17 | N/A | 8.75 × 10⁻¹ | 4\46\0 | 5.44 × 10⁻⁸ | 0\0\50 | 4.71 × 10⁻⁸ | 0\2\48 | 3.17 × 10⁻⁸ | 0\0\50 |
| F18 | N/A | 8.75 × 10⁻¹ | 4\46\0 | 5.37 × 10⁻⁸ | 0\0\50 | 6.88 × 10⁻⁸ | 0\0\50 | 3.10 × 10⁻⁸ | 0\0\50 |
| F19 | N/A | 6.88 × 10⁻⁸ | 50\0\0 | 5.29 × 10⁻⁸ | 0\0\50 | 3.04 × 10⁻⁷ | 43\0\7 | 3.02 × 10⁻⁸ | 0\0\50 |
| F20 | N/A | 1.10 × 10⁻⁶ | 45\0\5 | 5.21 × 10⁻⁸ | 0\0\50 | 2.99 × 10⁻⁸ | 49\0\1 | 3.08 × 10⁻⁸ | 1\0\49 |
| F21 | N/A | 1.83 × 10⁻⁵ | 13\0\37 | 3.08 × 10⁻⁸ | 2\0\48 | 1.89 × 10⁻³ | 19\0\31 | 3.26 × 10⁻⁸ | 2\0\48 |
| F22 | N/A | 4.72 × 10⁻⁴ | 13\0\37 | 5.14 × 10⁻⁸ | 0\0\50 | 1.55 × 10⁻³ | 44\0\6 | 2.95 × 10⁻⁸ | 0\0\50 |
| F23 | N/A | 2.67 × 10⁻⁷ | 9\0\41 | 3.07 × 10⁻⁸ | 1\0\49 | 2.46 × 10⁻⁵ | 47\0\3 | 2.97 × 10⁻⁸ | 1\0\49 |
Table 11.
Average rankings obtained by advanced meta-heuristic in the Friedman test, and the best result is shown in boldface.
Table 11.
Average rankings obtained by advanced meta-heuristic in the Friedman test, and the best result is shown in boldface.
| Chaotic Mapping | Average Rankings |
|---|---|
| CSHHO | 1.70 |
| GCHHO | 1.83 |
| DEPSOASS | 2.76 |
| GSA | 4.87 |
| FOA | 3.85 |
Table 12.
Experimental results of scalability tests in different dimensions.
| Benchmark | Metric | 50 | 100 | ||
|---|---|---|---|---|---|
| CSHHO | HHO | CSHHO | HHO | ||
| F1 | Mean\Std | 3.49 × 10⁷\1.19 × 10⁸ | 3.30 × 10⁸\9.91 × 10⁷ | 1.08 × 10¹⁰\2.06 × 10⁹ | 1.10 × 10¹⁰\2.09 × 10⁹ |
| F2 | Mean\Std | 9.88 × 10⁴\1.66 × 10⁴ | 1.03 × 10⁵\1.38 × 10⁴ | 2.78 × 10⁵\1.73 × 10⁴ | 2.90 × 10⁵\1.42 × 10⁴ |
| F3 | Mean\Std | 8.65 × 10²\1.16 × 10² | 9.00 × 10²\1.52 × 10² | 2.89 × 10²\4.96 × 10² | 3.01 × 10³\5.84 × 10² |
| F4 | Mean\Std | 8.95 × 10²\2.82 × 101 | 8.96 × 10²\3.47 × 101 | 1.56 × 10³\4.55 × 101 | 1.56 × 10³\5.35 × 101 |
| F5 | Mean\Std | 6.71 × 10²\4.36 × 100 | 6.74 × 10²\4.16 × 100 | 6.85 × 10²\2.82 × 100 | 6.85 × 10²\3.25 × 100 |
| F6 | Mean\Std | 1.84 × 10³\9.07 × 101 | 1.84 × 10³\7.88 × 101 | 3.71 × 10³\1.41 × 10² | 3.69 × 10³\1.46 × 10² |
| F7 | Mean\Std | 1.20 × 10³\3.34 × 101 | 1.20 × 10³\3.11 × 101 | 2.01 × 10³\7.14 × 101 | 2.01 × 10³\6.02 × 101 |
| F8 | Mean\Std | 2.52 × 10⁴\2.86 × 10³ | 2.54 × 10⁴\3.63 × 10³ | 5.24 × 10⁴\5.53 × 10³ | 5.72 × 10⁴\5.52 × 10³ |
| F9 | Mean\Std | 9.41 × 10³\9.83 × 10² | 9.49 × 10³\8.76 × 10² | 2.21 × 10⁴\1.46 × 10³ | 2.28 × 10⁴\2.12 × 10³ |
| F10 | Mean\Std | 1.65 × 10³\1.47 × 10² | 1.66 × 10³\1.21 × 10² | 5.03 × 10⁴\1.59 × 10⁴ | 5.06 × 10⁴\1.06 × 10⁴ |
| F11 | Mean\Std | 2.17 × 10⁸\1.28 × 10⁸ | 1.88 × 10⁸\1.05 × 10⁸ | 1.58 × 10⁹\5.29 × 10⁸ | 1.68 × 10⁹\5.46 × 10⁸ |
| F12 | Mean\Std | 3.82 × 10⁶\1.44 × 10⁶ | 5.20 × 10⁶\4.28 × 10⁶ | 1.75 × 10⁷\7.23 × 10⁶ | 1.62 × 10⁷\6.97 × 10⁶ |
| F13 | Mean\Std | 1.54 × 10⁶\1.01 × 10⁶ | 2.07 × 10⁶\2.53 × 10⁶ | 4.81 × 10⁶\1.82 × 10⁶ | 5.41 × 10⁶\1.64 × 10⁶ |
| F14 | Mean\Std | 6.00 × 10⁵\2.65 × 10⁵ | 6.35 × 10⁵\2.81 × 10⁵ | 3.36 × 10⁶\9.38 × 10⁵ | 4.35 × 10⁶\4.49 × 10⁶ |
| F15 | Mean\Std | 4.38 × 10³\6.23 × 10² | 4.52 × 10³\6.15 × 10² | 8.55 × 10³\1.00 × 10³ | 8.56 × 10³\8.52 × 10² |
| F16 | Mean\Std | 3.78 × 10³\3.76 × 10² | 3.90 × 10³\4.41 × 10² | 6.73 × 10³\7.03 × 10² | 6.84 × 10³\7.62 × 10² |
| F17 | Mean\Std | 5.39 × 10⁵\4.79 × 10⁶ | 4.63 × 10⁶\4.40 × 10⁶ | 5.75 × 10⁶\2.56 × 10⁶ | 6.62 × 10⁶\3.52 × 10⁶ |
| F18 | Mean\Std | 5.82 × 10⁵\6.11 × 10⁵ | 1.12 × 10⁶\7.19 × 10⁵ | 1.20 × 10⁷\4.90 × 10⁶ | 1.55 × 10⁷\6.97 × 10⁶ |
| F19 | Mean\Std | 3.63 × 10²\3.07 × 10² | 3.39 × 10³\3.20 × 10² | 6.05 × 10³\5.46 × 10² | 6.06 × 10³\4.89 × 10² |
| F20 | Mean\Std | 2.46 × 10³\8.32 × 101 | 2.85 × 10³\6.82 × 101 | 4.17 × 10³\1.82 × 10² | 4.13 × 10³\1.86 × 10² |
| F21 | Mean\Std | 1.03 × 10⁴\1.09 × 10³ | 1.14 × 10⁴\1.04 × 10³ | 2.56 × 10⁴\1.24 × 10³ | 2.56 × 10⁴\1.48 × 10³ |
| F22 | Mean\Std | 3.74 × 10³\2.31 × 10² | 3.74 × 10³\1.77 × 10² | 5.35 × 10³\3.78 × 10² | 5.35 × 10³\2.91 × 10² |
| F23 | Mean\Std | 4.20 × 10³\2.15 × 10² | 4.18 × 10³\1.76 × 10² | 7.25 × 10³\5.84 × 10² | 7.25 × 10³\4.62 × 10² |
| F24 | Mean\Std | 3.28 × 10³\6.13 × 101 | 3.30 × 10³\7.30 × 101 | 4.73 × 10³\2.76 × 10² | 4.73 × 10³\2.60 × 10² |
| F25 | Mean\Std | 1.08 × 10⁴\1.79 × 10³ | 1.10 × 10⁴\1.63 × 10³ | 2.85 × 10⁴\2.46 × 10³ | 2.86 × 10⁴\4.26 × 10³ |
| F26 | Mean\Std | 4.44 × 10³\5.43 × 10² | 4.44 × 10³\3.71 × 10² | 5.70 × 10³\1.25 × 10³ | 5.43 × 10³\6.12 × 10² |
| F27 | Mean\Std | 3.82 × 10³\1.43 × 10² | 3.89 × 10³\1.77 × 10² | 5.79 × 10³\4.35 × 10² | 5.86 × 10³\4.88 × 10² |
| F28 | Mean\Std | 6.09 × 10³\7.55 × 10² | 6.38 × 10³\7.33 × 10² | 1.10 × 10⁴\1.01 × 10³ | 1.11 × 10⁴\9.60 × 10² |
| F29 | Mean\Std | 5.23 × 10⁷\1.82 × 10⁷ | 5.25 × 10⁷\1.55 × 10⁷ | 1.52 × 10⁸\6.75 × 10⁷ | 1.54 × 10⁸\7.05 × 10⁷ |
Table 13.
Training samples and test samples.
| Input Sample | Output Sample | ||
|---|---|---|---|
| Excitation Current/A | Exciting Voltage/V | Reactive Power/Mvar | System Voltage/kV |
| 25.488 | 29.267 | 305.0 | 228.4 |
| 23.364 | 26.103 | 261.5 | 228.2 |
| 21.594 | 24.521 | 232.5 | 228.5 |
| 20.154 | 22.939 | 212.5 | 228.5 |
| 19.6824 | 22.148 | 197.5 | 228.6 |
| 18.8328 | 21.159 | 186.4 | 228.6 |
| 18.408 | 20.408 | 177.4 | 228.7 |
| 17.9124 | 19.9728 | 170.2 | 228.75 |
| 17.7 | 19.775 | 163.8 | 228.8 |
| 17.346 | 19.3795 | 158.5 | 228.8 |
| 16.992 | 18.984 | 154.2 | 228.8 |
| 16.7088 | 18.7863 | 150.5 | 228.8 |
| 16.638 | 18.5727 | 147.0 | 228.78 |
| 16.461 | 18.3987 | 144.2 | 228.85 |
| 16.1424 | 17.9715 | 137.4 | 228.84 |
| 15.6822 | 17.402 | 131.1 | 228.9 |
| 15.222 | 17.0065 | 125.0 | 228.9 |
| 14.868 | 16.611 | 118.35 | 229 |
| 14.2308 | 15.9782 | 108.75 | 229 |
| 12.9564 | 14.5346 | 88.5 | 229.1 |
| 12.39 | 13.8425 | 78.3 | 229.1 |
| 11.682 | 12.953 | 67.8 | 229.2 |
| 10.974 | 12.458 | 57.5 | 229.3 |
| 10.3368 | 11.4695 | 47.5 | 229.3 |
| 9.912 | 11.074 | 37.0 | 229.4 |
| 8.9916 | 10.283 | 27.5 | 229.4 |
| 8.4252 | 9.1756 | 17.2 | 229.48 |
| 7.8588 | 8.8592 | 7.5 | 229.5 |
| 7.2924 | 8.3055 | 1.75 | 229.57 |
| 6.9738 | 7.91 | −2.5 | 229.6 |
| 6.372 | 6.9213 | −11.7 | 229.6 |
| 5.8056 | 6.7235 | −21.0 | 229.62 |
| 5.664 | 6.4467 | −30.5 | 229.7 |
| 4.956 | 5.1415 | −39.6 | 229.71 |
| 4.248 | 4.5483 | −48.5 | 229.8 |
| 3.54 | 4.351 | −57.5 | 229.875 |
| 2.832 | 3.164 | −57.5 | 229.875 |
| 2.124 | 2.4521 | −66.5 | 229.9 |
Table 14.
CSHHO-LSSV Model generalization ability verification.
| Prediction Value | Sample Value | Absolute Error | Relative Error | ||
|---|---|---|---|---|---|
| 9 | Reactive Power/MVar | 163.0515 | 163.8 | −0.7485 | −0.4570 |
| System Voltage/kV | 228.7877 | 228.8 | −0.0123 | −0.0054 | |
| 14 | Reactive Power/MVar | 144.5989 | 144.2 | 0.3989 | 0.2766 |
| System Voltage/kV | 228.8882 | 228.85 | 0.0382 | 0.0167 | |
| 26 | Reactive Power/MVar | 28.1322 | 27.6 | 0.5322 | 1.9282 |
| System Voltage/kV | 229.4014 | 229.45 | −0.0486 | −0.0212 | |
| 35 | Reactive Power/MVar | −40.5890 | −39.6 | −0.989 | 2.4975 |
| System Voltage/kV | 229.7915 | 229.75 | 0.0415 | 0.0181 |
Table 15.
Reactive power simulation results comparison.
| Prediction Value | Sample Value | Absolute Error | Relative Error | ||
|---|---|---|---|---|---|
| LSSVM | 9 | 162.9631 | 163.8 | −0.8369 | −0.5128 |
| 35 | −40.8531 | −39.6 | −1.2531 | 3.1649 | |
| CSHHO−LSSVM | 9 | 163.0515 | 163.8 | −0.7485 | −0.4570 |
| 35 | −40.5890 | −39.6 | −0.989 | 2.4975 |
Table 16.
System voltage simulation results comparison.
| Prediction Value | Sample Value | Absolute Error | Relative Error | ||
|---|---|---|---|---|---|
| LSSVM | 9 | 228.6717 | 228.8 | −0.1283 | −0.0561 |
| 35 | 229.8859 | 229.75 | 0.1359 | 0.0591 | |
| CSHHO−LSSVM | 9 | 228.7877 | 228.8 | −0.0123 | −0.0054 |
| 35 | 229.7915 | 229.75 | 0.0415 | 0.0181 |
Publisher’s Note: MDPI stays neutral with regard to jurisdictional claims in published maps and institutional affiliations. |
© 2021 by the authors. Licensee MDPI, Basel, Switzerland. This article is an open access article distributed under the terms and conditions of the Creative Commons Attribution (CC BY) license (https://creativecommons.org/licenses/by/4.0/).
Share and Cite
MDPI and ACS Style
Jiao, S.; Wang, C.; Gao, R.; Li, Y.; Zhang, Q. Harris Hawks Optimization with Multi-Strategy Search and Application. Symmetry 2021, 13, 2364. https://doi.org/10.3390/sym13122364
AMA Style
Jiao S, Wang C, Gao R, Li Y, Zhang Q. Harris Hawks Optimization with Multi-Strategy Search and Application. Symmetry. 2021; 13(12):2364. https://doi.org/10.3390/sym13122364
Chicago/Turabian StyleJiao, Shangbin, Chen Wang, Rui Gao, Yuxing Li, and Qing Zhang. 2021. "Harris Hawks Optimization with Multi-Strategy Search and Application" Symmetry 13, no. 12: 2364. https://doi.org/10.3390/sym13122364
Note that from the first issue of 2016, this journal uses article numbers instead of page numbers. See further details here.