
The Structural Performance of CFRP Composite Plates Assembled with Fiber Bragg Grating Sensors
by
 , , ,
, , ,
Hua-Ping Wang
1,2,* ,
,
Hao Chen
1 ,
,
Cong Chen
1,
Hu-Yuan Zhang
1,
Hao Jiang
3,
Tao Song
1,4 and
Si-Yuan Feng
1,5 1
School of Civil Engineering and Mechanics, Lanzhou University, Lanzhou 730000, China
2
Key Lab of Mechanics on Disaster and Environment in Western China, Lanzhou University, Ministry of Education, Lanzhou 730000, China
3
Institute of Civil Engineering and Architecture in Gansu Province, Lanzhou 730070, China
4
Qingyang Country Garden Project Department, Gansu Biheng Enterprise Management Co., Ltd., Qingyang 745000, China
5
College of Civil Engineering and Architecture, Zhejiang University, Hangzhou 310058, China
*
Author to whom correspondence should be addressed.
Symmetry 2021, 13(9), 1631; https://doi.org/10.3390/sym13091631
Submission received: 10 August 2021
/
Revised: 28 August 2021
/
Accepted: 31 August 2021
/
Published: 5 September 2021
(This article belongs to the Special Issue Symmetry in Applied Mechanics Analysis on Smart Optical Fiber Sensors)
Abstract
:Carbon fiber reinforced polymer (CFRP) composites have been extensively used in airframes, train bodies, and engine blades for their properties of high strength, low weight, and good stability. The in-service structural performance of CFRP composites is always an important point to be investigated for its influence on structural safety. For this reason, CFRP composite plates assembled with fiber Bragg grating (FBG) sensors were developed, and the in-service structural characteristics of the CFRP plates were interpreted by FBG signals measured through time. A theoretical analysis supported by a numerical method has been provided. Experimental testing was conducted to check the proposed sensing technique for the dynamic response identification of the CFRP plate. The curing process of the bilayer CFRP plated inserted with FBGs in series was also explored. The results showed that the surface-attached FBGs in series could accurately characterize the dynamic response of the CFRP plate, and a good agreement between the numerical and testing results was observed. The strain and temperature distributions during the curing process of the bilayer plate indicated that the in-service structural performance of bilayer CFRP plates can be configured by the assembled FBG sensors. This study can support the structural health monitoring of projects by using CFRP composites.
1. Introduction
With the rapid development of advanced functional and composite materials and correlated manufacturing techniques, advanced composite materials (such as carbon fiber reinforced polymer (CFRP)) with a light weight, high strength, strong corrosion resistance, and strong fatigue resistance, are intensively applied to aviation structures, which include civil airplanes, military airplanes, and spacecrafts, thus equipping them with better mechanical properties, lighter weight, longer voyages, and the ability to carry heavier loads. For instance, the proportion of composite materials in J-20 fighters reached 20%, and its application range and proportion could be increased in the future development of advanced military airplanes. In civil airplanes, the proportion of carbon fiber composite materials used in the Boeing 787 has reached 50%, surpassing alloy materials. Promoting the application of carbon fiber composite materials in aviation structures has become an important symbol to judge the advancement of the aviation structure in a country.
Due to the further development of new-type aviation structural design and manufacturing techniques, the design philosophy relying on self-structure safety cannot meet the requirements of safety, stability, and reliability in operation. Therefore, the property and integrity of each component in the life cycles of aviation structures should be considered to evaluate its airworthiness. The key and difficult point is to improve aviation structural performance and safety during flight and fighting. Therefore, the development of a health monitoring system for aviation structures could be a promising choice [1]. It could utilize an advanced sensor integrated in the structure combining information fusion technology, big data processing, mechanics modeling, network communications, and image visualization technology to set up a system for perception, recognition, and control [2,3]. It could be used to configure real-time structural flight attitude online, recognize partial structural damage, and diagnose abnormal failure, which could provide comprehensive structural status information for pilots to make the best reactions and decisions. In addition, it can also provide effective and scientific digital accumulations for maintenance strategy optimization and property upgrading design of aviation structures [4,5,6,7].
Due to the complex electromagnetic countermeasure and multifield (such as heat and force) coupling environment in the aviation industry, current research mainly focuses on the selection of advanced sensors and the correlated application design (such as gyroscope, accelerometer, barometer, pitot tube, piezoelectric and optical fiber sensors, etc.), damage identification and state evaluation algorithms, massive signal data processing technology, and so on [1,3]. Among these, the development of high-precision sensors suitable for monitoring aerospace structures is in high demand.
Compared with electromagnetic sensors, optical fiber sensors have the advantages of absolute measurement, high sensitivity, small size, light weight, adaptability of geometrical shapes, electrical insulation, strong electromagnetic interference, being explosion-proof [4,5], chemical corrosion resistance, wide transmission bandwidth, low loss, long-term stability, and easy wavelength division multiplexing and networking [8]. In view of the advanced properties of optical fibers, in 1985, the U.S. military proposed the innovative technical concept of optical fiber intelligent skin [9]. The aim was to embed optical fiber sensor networks in an aircraft structure envelope to monitor various parameters such as stress and temperature during flight so as to dynamically adjust the aircraft state and obtain the best flight performance. Subsequently, the U.S. Air Force, the Aerospace Center, Boeing, and various U.S. universities and related research institutions invested a lot of manpower and resources to explore its feasibility [10,11,12,13,14]. At the same time, Britain, France, and Canada also carried out research [15]. The research focus expanded from aerospace vehicles to many fields such as civil engineering, ships, automobiles, and medicine, and these soon became research hotspots. At present, the research into optical fiber intelligent structures has achieved an intelligent skin, adaptive wing, optical fiber intelligent sandwich, hollow optical fiber intelligent structure, optical fiber guided missile, and so on [16,17,18,19].
Optical fiber has been assembled with CFRP composites to configure smart CFRP components in recent years [20]. The structural performance or damage state of CFRP laminates can also be examined by using an optical fiber sensor, fiber Bragg grating acoustic emission sensors, ultrasonic testing, nanotube modified adhesive sensing film, and electromagnetic wave testing [21,22,23,24,25,26,27,28]. However, considerable attempts have been conducted with the CFRP plate under static loads. It is thus important to explore the sensing performance of fiber Bragg grating (FBG) sensors with the CFRP plate under dynamic loading.
Given the analysis above, this paper aims to develop a dynamic response monitoring technology for CFRP composite structures based on optical fiber sensing technology. The goal was to combine optical fiber sensing elements with CFRP materials in specific packages and shapes to configure optical fiber composite structures and to develop corresponding damage identification methods so as to realize real-time information characterization and safety assessment of CFRP structures. The basic plan was to examine the dynamic performance of a single-layer CFRP plate with surface-attached FBGs in series and then to characterize the strain and temperature distribution of the bilayer CFRP plate assembled with FBGs in series during the curing process, as shown in Figure 1.
2. Fatigue Performance of Single-Layer CFRP Plate
To explore the dynamic performance of the CFRP plate, a simply supported plate was adopted and a fatigue load was applied, as shown in Figure 2. It intended to provide the theoretical results for comparing with the response measured by the FBGs in series attached on the CFRP plates [29].
2.1. Model Description
A simply supported CFRP plate was adopted for analysis, as shown in Figure 2. h is the the thickness, is the width, and is the length. The elastic modulus of the CFRP material was about , and the density was about . The dynamic load was applied on the midspan with a value of . The frequency of the load was , which could be related to the circular frequency, . The theory of plates was introduced to discuss the vibration response of the CFRP plate under dynamic load. In general, free vibration was considered to obtain the vibration shape function and then the dynamic load was considered in the vibration differential equation.
2.2. Theoretical Study
According to the theory of plates and shells [30], the free vibration differential equation of the plate follows
which can be in simple form
where is a function with respect to , , and ; is the bending stiffness; is the elastic modulus; is the thickness of the plate; is Poisson’s ratio; and is the density of the plate.
The vibration of the plate can be declared by
where is a mode function. Substituting Equation (3) into Equation (2), the mode differential function can be obtained:
where
Equation (4) declares the eigenvalue problem of the vibration governing equation of rectangular plate. is the natural frequency, and is the mode function.
For the rectangular plate, with two sides simply supported ( and ) and two sides without constraints ( and ), the mode function can be primarily determined
where is a function with respect to . According to the theory of plates, the following form can be made:
where , , and . Therefore, the vibration function can be expressed as
For the symmetry of loads and constraints applied on the plate in Figure 3, the mode function should be symmetrical with respect to , which generates and . Therefore, Equation (8) can be simplified as
Considering the simply supported boundary, it had a deflection and bending moment . It can be noted that Equation (9) satisfied the boundary condition. Further considering the free boundary, it yields
Submitting Equation (9) into Equation (10), it yields
Since the constant cannot be 0, the following equation can be obtained:
Substituting and into Equation (12), it provides the natural frequency equation:
The value of can be calculated by solving Equation (13). It also should be noted that a number of values can satisfy the equation, which generates the different-order nature frequency. Therefore, the mode function can be given by
For the plate, can be different values, and numerous vibration modes exist. Since the low-order modes usually inspire the resonance of the plate, careful consideration should be paid to the former modes. Free vibration of the plate can thus be expressed as
where is determined by Equation (13). Based on the analysis, the forced vibration can be further discussed. The vibration governing differential equation can be expressed as
The external excitation may induce several vibration frequencies and modes, and each mode is the possible solution of the governing equation [31,32]. Therefore, the dynamic deflection can be the linear combination of all the possible modes, which can be described by the function series:
where is the normal coordinate, and has the form of . Substituting Equation (16) into Equation (17),
The mode superposition method can be used to calculate the vibration of the plate. However, it is difficult to provide the explicit analytical solution of the plate due to the complicated natural frequency equation. Therefore, the approximate method and numerical method can be used to analyze the vibration response of the plate.
2.3. Analysis on the Calculated Results
A case study was conducted based on the simplified model by using a semianalytical and seminumerical method. The parameters of the plate were 5 cm width, 2 mm thickness, and 50 cm length. The working length was about 36.5 cm. The displacement and strain fields at the first-order mode of the plate under external excitation with 50 Hz frequency are displayed in Figure 4.
It can be noted that both the shape profiles were semi-period, due to the selection of the first-order mode. Displacement and strain had the largest values, and the shape profiles changed periodically with the time. The above results obeyed the mechanical principles, which validated the effectiveness of the numerical solution.
3. Dynamic Analysis on Single-Layer CFRP Plate Attached with FBGs in Series
To check the feasibility and effectiveness of FBGs in series to measure the dynamic response of plates, vibration testing on CFRP plates was carried out. Surface-attached FBGs in series were adopted to measure the distributed strain of the plate in the span direction. FBG signal information was demodulated by the Optical system 200 with a sampling frequency of 100 Hz. It should be noted that since the testing was performed in a small laboratory with a nearly constant temperature, the temperature compensation of the FBG sensors was thus ignored [33,34].
3.1. Testing Description
Two types of CFRP plates were used in the vibration experiments of simply supported plates, as shown in Figure 5 and Figure 6. The relevant dimensional information was as follows: a 50 cm long CFRP plate with a width of 5 cm and a thickness of 2.5 mm was marked as plate1, and a 50 cm long CFRP plate with a width of 10 cm and a thickness of 2.5 mm was marked as plate2. Two FBGs in series were laid on plate1, and each had three FBGs. The numbering marks are shown in Figure 5b. In addition, an epoxy resin packaged FBG sensor, marked as E-Packaged FBG, was placed near the constrained end to detect the effect of the packaging measure of the FBG on the vibration deformation testing.
3.2. Discussion of the Results
In the vibration experiment, the excitation frequency was varied to observe the effect of frequency change on the response of the CFRP plate and the measurement effectiveness of the FBG. The excitation frequencies applied to plate1 were 20 Hz, 30 Hz, and 50 Hz, respectively. Two bare FBGs in series attached on plate1 were separately connected to channel two and channel three of the demodulation device, and the E-packaged FBG was connected to channel four. A simple harmonic force with a frequency of 50 Hz was applied in the middle of plate1 for about 5000 s. After the first loading, the excitation frequency was adjusted to 30 Hz and plate1 was loaded for about 2000 s. After that, the excitation frequency was changed to 20 Hz and the loading time was about 2500 s. The wavelength increments of FBGs with excitation frequencies of 50 Hz, 30 Hz, and 20 Hz are shown in Figure 7, Figure 8, Figure 9, Figure 10, Figure 11 and Figure 12.
It can be seen from Figure 7 that the wavelength increments of the six FBGs with an excitation frequency of 50 Hz changed consistently with slight fluctuation. Internal deformation of the CFRP plate accumulated. Due to the perturbation during the loading process (movement of the restrained iron block), the central wavelengths of Bare-FBG4-plate1, Bare-FBG5-plate1, and Bare FBG6-plate1 did decrease but showed an overall increase after restoring the normal state. The wavelength change of the FBG near the loading point was significantly larger than that of the FBG near the restrained end. That is, the vibration strain at the loading end was larger than at the restrained end, indicating that the measurement was valid.
Figure 8 indicates that the vibration of all six FBGs showed sinusoidal fluctuations, and the amplitude near the loading point was larger than that at the end, which could be attributed to the concentration of energy and load at the loading point.
Figure 9 shows that the wavelength increment changes of the six FBGs with excitation frequency of 30 Hz were highly consistent with smooth fluctuation. No obvious wavelength increment growth was observed. Due to the short loading time, the applied simple harmonic load induced no plastic deformation. In addition, the vibration strain at the middle loading point was larger than that at the restrained end. Figure 10 displays the six FBGs vibrated in a short time of 2 s, and the fluctuation amplitude near the loading point (Bare-FBG3-plate1 and Bare-FBG4-plate1) was larger, which may have been due to excessive vibration energy.
The wavelength increments of the six FBGs in Figure 11 were highly consistent. The wavelength increments of the FBGs fluctuated smoothly and the overall deformation was relatively stable. The strain at the central loading point was larger than that at the restrained end. From Figure 12, it can be seen that the amplitude of the six FBG sensors decreased from the loading point to the two restrained ends. Due to the large amount of energy at the loading point, the vibration presented the form of fluctuating vibration. The FBG near the constraint end vibrated smoothly, with the equilibrium position in slight change.
In the vibration test, the excitation frequencies of plate2 were 20 Hz, 30 Hz, and 50 Hz, respectively. The two bare FBGs in series attached to plate2 were separately connected to channel two and channel three of the demodulation equipment, and the E-packaged FBG was connected to channel four. A simple harmonic force with a frequency of 50 Hz was applied in the middle of plate2 for about 1600 s. For plate2, only the excitation frequency of 50 Hz was taken for analysis, as shown in Figure 13 and Figure 14.
Figure 13 shows that under the simple harmonic force loading with the excitation frequency of 50 Hz, the wavelength increment of FBG sensors had high consistency, and the wavelength increments of FBGs fluctuated increasingly. The vibration strain at the loading point was 4.16 με, which was greater than 3.33 με at the restraint end. Under long-time loading, the dynamic response of CFRP plate near the loading point was obvious, and the wavelength increment was significantly greater than that of the FBG at the constraint end. Figure 14 shows that the wavelength increment changes of the six FBGs in 2 s were highly consistent. The amplitude decreased from the loading point to the two constraint ends, and the vibration presented the form of fluctuating vibration.
3.3. Frequency Domain Analysis
Based on the time domain analysis, the measured data could be further used to check the frequency domain state. The measured strain data in the time domain could be transformed to the frequency domain by using Fast Fourier Transform (FFT). It could be used to validate the measurement accuracy of the FBG sensors. In this study, the Maltab software was used to deal with numerical strain data by using FFT, and Origin was used to deal with the testing data by using FFT. Taking the case of the 5 cm plate as an example, the testing data at one point was adopted for analysis. When the vibration frequency of the load applied on the plate was 30 Hz, the obtained frequency sprectrum by using FFT is shown in Figure 15. It can be noted that the amplitudes had the largest value at the forced vibration frequency, with the ignorance of low frequency ( < 3 Hz).
4. Temperature and Strain Distribution of Bi-Layer CFRP Plate Assembled with FBGs during the Curing Process
Based on the former analysis, FBGs in series can be further embedded into CFRP plates to configure the smart CFRP plate. The sensing performance of the embedded FBGs can be checked during the curing process.
4.1. Sensor Layout
Two FBGs in series were embedded in the bilayer CFRP plate, as shown in Figure 16. The positions of the FBG sensors have been marked. One fiber inscribed with two-point FBGs in one small soft pipe was also been installed for temperature measurement. Epoxy resin was used to hold the embedded FBGs and the two plates. During the curing process, weights were loaded onto the bilayer CFRP plate to ensure compact contact between the embedded FBGs and the plate. The major testing steps are shown in Figure 17. The three FBG sensors were connected to the Optical system 200 for data collection. The temperature and strain variation inside the bilayer CFRP plate was described by the measured FBG data. The fabrication was conducted on 13 June. To characterize the inner strain and temperature distribution of the bilayer plate during the curing process, relatively long-term monitoring was performed. Continuous data collection lasted one week. The major data were collected for about 150 h, as shown in Figure 18, Figure 19 and Figure 20.
4.2. Temperature and Strain Data Interpretation during the Curing Process
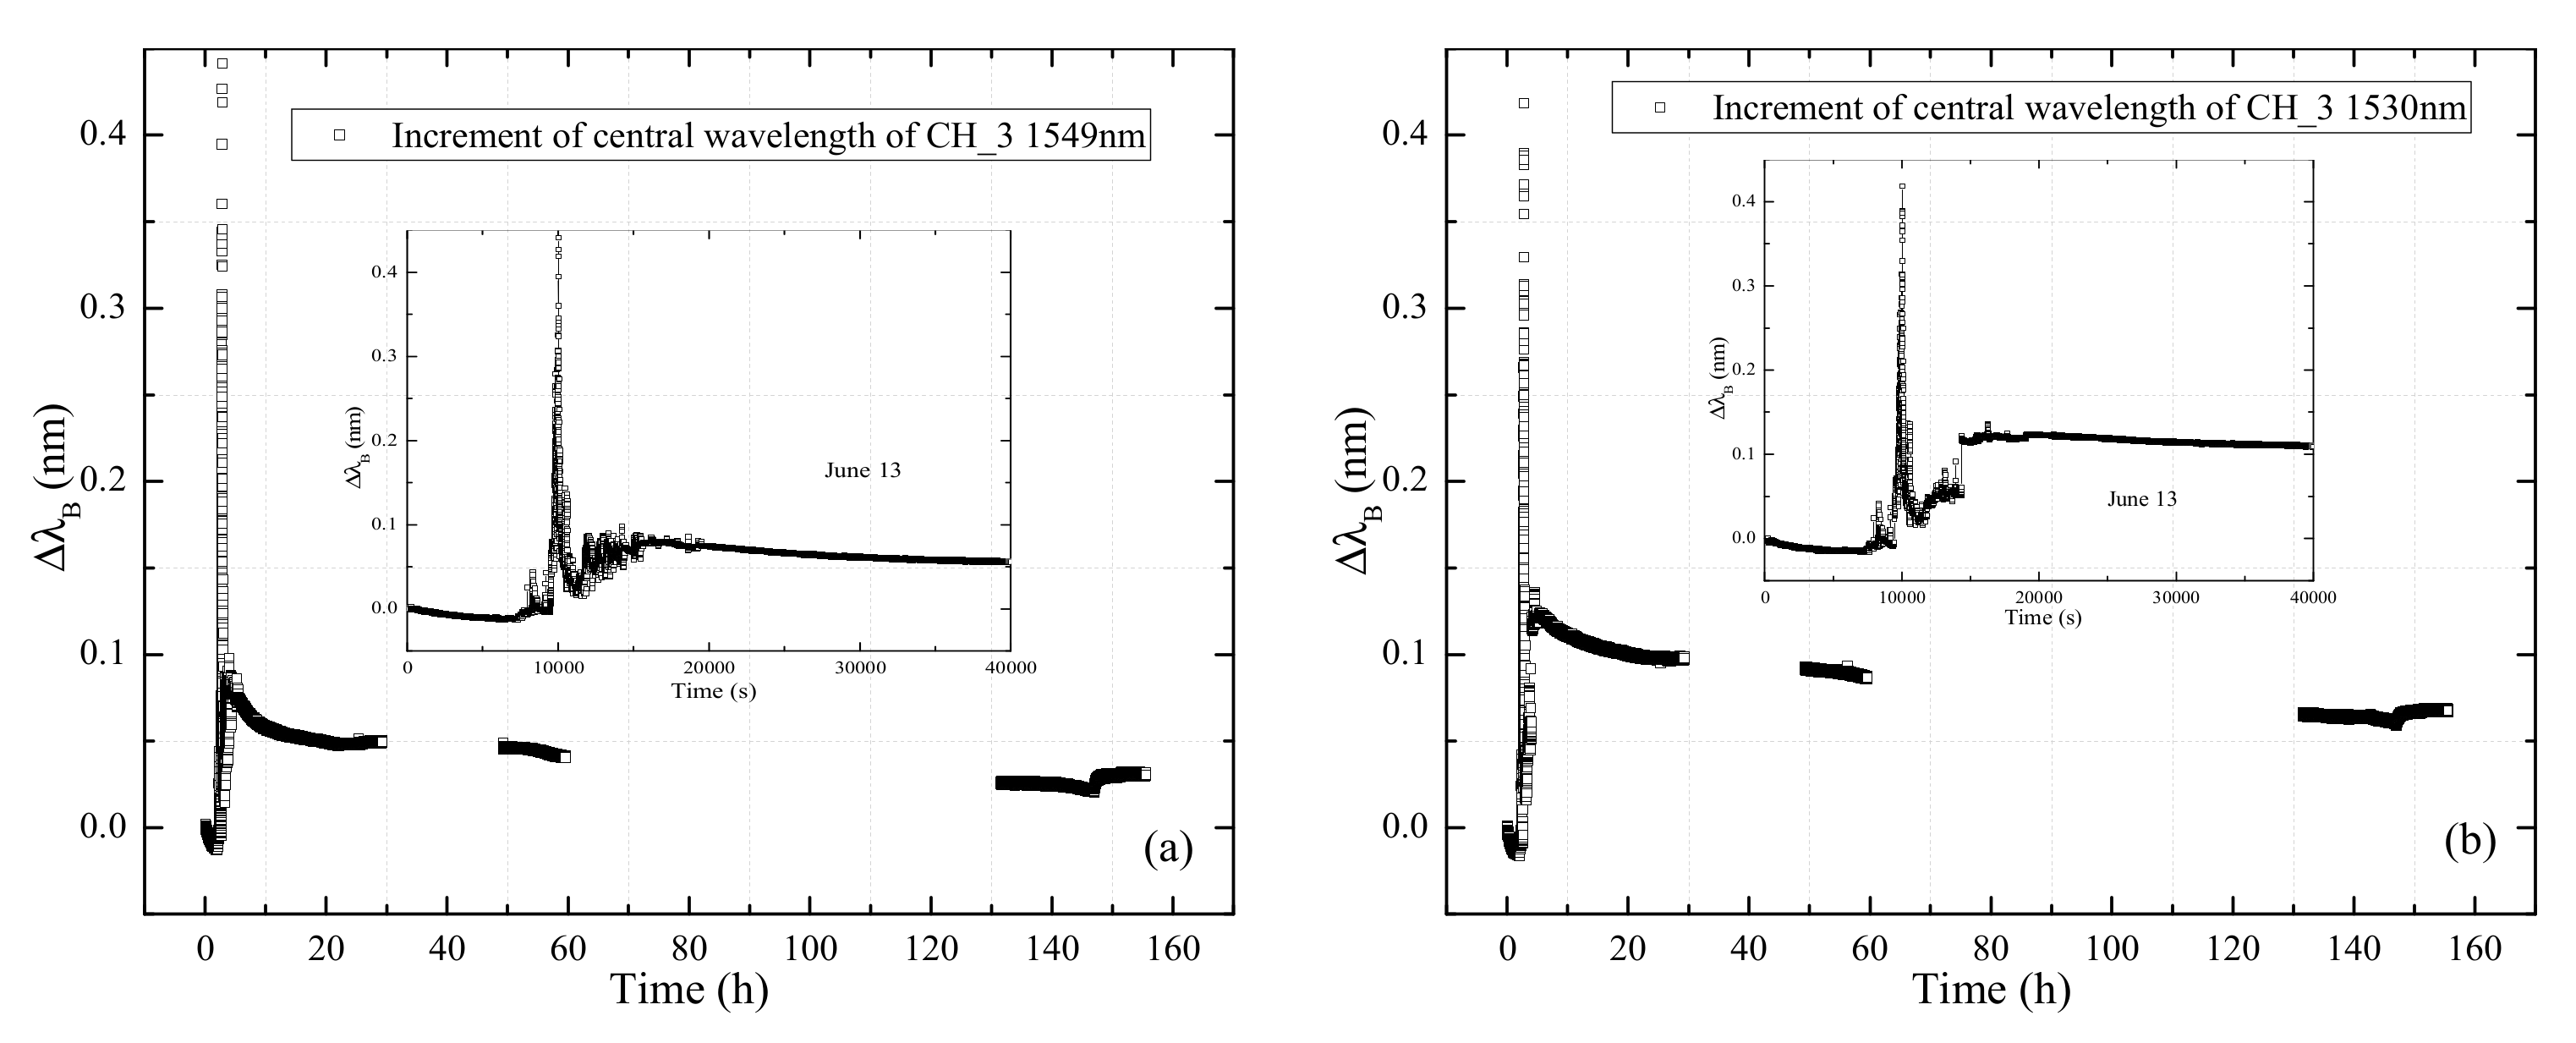
The inner strain and temperature variation of the bi-layer plate embedded with FBGs in series during the curing process has been collected. Wavelength increments of FBGs in series connected to Channel Two (CH_2) follow Figure 18. Wavelength increments of FBGs in series connected to Channel Four (CH_4) follow Figure 19. FBGs for sensing temperature connected to Channel Three (CH_3) follow Figure 20.
Figure 18 shows that the change of the central wavelength increments of four FBGs had high consistency under the curing action. On 13 June, the wavelength increment had an obvious increase, and then gradually decreased. This was because the inserted epoxy resin adhesive generated heat during the curing process, which caused the expansion of the sensing FBGs at an early stage. It should be noted that the applied pressure also contributed to the increase in inner deformation. When the heat dissipated, the bilayer CFRP plate gradually formed, and the intermediate adhesive had shrinkage, which induced the gradual and stable decrease in the inner strain.
In the following 48 h, the wavelength increments of the four FBGs generally experienced a smooth decrease, and finally became stable. It was predicted that the curing process was completed, and the inserted epoxy resin adhesive successfully held the adjacent CFRP layers. The applied pressure was removed on 19 June (around 148 h, as shown in Figure 18), which produced an obvious effect on the signal of FBGs in series. The wavelength increments of the four FBGs at different positions had a sharp increase and decrease, which was due to the redistribution of inner stress inside the bilayer CFRP plate. It also should be noted that when the pressure was removed, the inner stress field inside the plate became stable in about 2 h.
Figure 19 indicates that the wavelength increments of the four FBGs had a sharper increase than that of the four FBGs located in the central axis. The data became stable in about 4 h, and experienced a smooth decrease. The general wavelength increments in Figure 19 are much larger than in Figure 18. When the applied pressure was removed on 19 June (around 148 h, as shown in Figure 19), a different variation tendency was observed. The FBGs in the center had increased deformation, and the FBGs approaching the two ends of the plate had decreased deformation. It indicated that the distribution of inner stress caused by heat and pressure experienced nonuniform variation. Multipoint sensors are required to obtain the stress or strain field.
Figure 20 shows the central wavelength increments of the two FBGs for the temperature variation. The variation of the measured signal characterized the inner temperature distribution in the bilayer plate. The two profiles in Figure 20a,b are nearly the same in 10,000 s, which means that the heat emission of epoxy resin was almost uniform in the plate. At around 15,000 s, the temperature in the center (FBG 1530 nm) kept a relatively high state compared with the temperature approaching the side (FBG 1549 nm). It can be attributed to the slow heat transfer process in the center. When the applied pressure was removed on 19 June (around 148 h, as shown in Figure 20), the profiles of two FBGs had a similar variation tendency. The temperature distribution in the plate can be regarded as uniform after the curing. The final increment value of the FBG in the center was a little larger than that of the FBG approaching the side, which can be attributed to the poor heat transfer, which induced a higher temperature in the center.
Based on the analysis, the embedded FBGs in series and the FBGs just for temperature measurement could characterize the curing process of the bilayer plate with high sensitivity. Temperature variation induced thermal strain can become stable in about 24 h. The strain of the epoxy resin layer in the center was much larger than that approaching the side. It means that nonuniform stress exists in the bilayer CFRP plate during the curing process. How to decrease the preliminary inner strain can be carefully considered.
5. Conclusions
To promote the development of smart optical fiber composite structures in aviation structures, the dynamic performance of a CFRP plate attached with FBGs in series has been studied experimentally. The curing process of the bilayer CFRP plate inserted with FBGs in series has also been investigated. The following conclusions can be drawn from the study:
- (1)
- The time domain analysis indicates that the dynamic response of the CFRP plate can be accurately characterized by the surface-attached FBGs in series. The vibration profiles and the vibration energy dissipation of the CFRP plate can be interpreted by the FBGs in different positions.
- (2)
- The frequency domain analysis validates that the excitation frequency can be accurately reflected from the data measured by the FBGs in series. This conclusion can be further used to judge the damage identification of the CFRP plate.
- (3)
- The temperature and strain variation of the bilayer CFRP plate during the curing process can be clearly interpreted from the signal measured by the inserted FBGs in series and the FBGs without constraint. It means that the inserted FBGs in series have good sensing performance, and the function is similar with the surface-attached FBGs in series.
- (4)
- The heat during the curing process can induce much higher preliminary strain inside the center of the bilayer plate. How to ensure the temperature and strain are uniformly distributed during the curing process of the CFRP plates should be carefully considered.
Author Contributions
Theoretical analysis, validation, writing, H.-P.W.; Writing and translation, H.C. and C.C.; Check, H.-Y.Z. and H.J.; Simulation, T.S.; Data processing, S.-Y.F. All authors have read and agreed to the published version of the manuscript.
Funding
The work described in this paper was supported by the National Natural Science Foundation of China (Grant Nos. 51908263 and 11932008), the Fundamental Research Funds for the Central Universities (Grant No. lzujbky-2020-56), Key Laboratory of Structures Dynamic Behavior and Control (Ministry of Education) in Harbin Institute of Technology (Grant No. HITCE201901) and Provincial Projects (2020-0624-RCC-0013 and JK2021-18).
Institutional Review Board Statement
Not applicable.
Informed Consent Statement
Not applicable.
Data Availability Statement
The data supporting the results reported in the paper can be accessed from the corresponding authors.
Acknowledgments
Special thanks are due to Jinping Ou and Zhi Zhou of Dalian University of Technology, and Youhe Zhou and Ning Huang of Lanzhou University. The findings and opinions expressed in this article are only those of the authors and do not necessarily reflect the views of the sponsors.
Conflicts of Interest
The authors declare no conflict of interest.
References
- Diamanti, K.; Soutis, C. Structural health monitoring techniques for aircraft composite structures. Prog. Aerosp. Sci. 2010, 46, 342–352. [Google Scholar] [CrossRef]
- Zhao, X.; Gao, H.; Zhang, G.; Ayhan, B.; Yan, F.; Kwan, C.; Rose, J.L. Active health monitoring of an aircraft wing with embedded piezoelectric sensor/actuator network: I. Defect detection, localization and growth monitoring. Smart Mater. Struct. 2007, 16, 1208–1217. [Google Scholar] [CrossRef]
- Zhao, X.L.; Qian, T.; Mei, G.; Kwan, C.; Zane, R.; Walsh, C. Active health monitoring of an aircraft wing with embedded piezoelectric sensor/actuator network: II. Wireless approaches. Smart Mater. Struct. 2007, 16, 1218–1225. [Google Scholar] [CrossRef]
- Sante, D.R. Fibre optic sensors for structural health monitoring of aircraft composite structures: Recent advances and applications. Sensors 2015, 15, 18666–18713. [Google Scholar] [CrossRef]
- García, I.; Zubia, J.; Durana, G.; Aldabaldetreku, G.; Illarramendi, M.A.; Villatoro, J. Optical Fiber Sensors for Aircraft Structural Health Monitoring. Sensors 2015, 15, 15494–15519. [Google Scholar] [CrossRef] [PubMed] [Green Version]
- Ou, J.P.; Li, H. Structural Health Monitoring in mainland China: Review and Future Trends. Struct. Health Monit. 2010, 9, 219–231. [Google Scholar] [CrossRef]
- An, Y.H.; Ou, J.P. Experimental and numerical studies on model updating method of damage severity identification utilizing four cost functions. Struct. Control. Health Monit. 2011, 20, 107–120. [Google Scholar] [CrossRef]
- Wang, H.P.; Xiang, P.; Li, X. Theoretical Analysis on Strain Transfer Error of FBG Sensors Attached on Steel Structures Subjected to Fatigue Load. Strain 2016, 52, 522–530. [Google Scholar] [CrossRef]
- Wada, D.; Igawa, H.; Tamayama, M.; Kasai, T.; Arizono, H.; Murayama, H.; Isoda, N.; Katsuta, M. Fiber-optic simultaneous distributed monitoring of strain and temperature for an aircraft wing during flight. Appl. Opt. 2018, 57, 10458–10465. [Google Scholar] [CrossRef] [PubMed]
- Zhao, H.-T.; Wang, Q.-B.; Qiu, Y.; Chen, J.-A.; Wang, Y.-Y.; Fan, Z.-M. Strain transfer of surface-bonded fiber Bragg grating sensors for airship envelope structural health monitoring. J. Zhejiang Univ. A 2012, 13, 538–545. [Google Scholar] [CrossRef]
- Wang, H.P.; Dai, J.G. Strain transfer analysis of fiber Bragg grating sensor assembled composite structures subjected to thermal loading. Compos. Part B Eng. 2019, 162, 303–313. [Google Scholar] [CrossRef]
- Wang, H.P.; Xiang, P.; Jiang, L.Z. Strain transfer theory of industrialized optical fiber-based sensors in civil engineering: A review on measurement accuracy, design and calibration. Sens. Actuators A Phys. 2019, 285, 414–426. [Google Scholar] [CrossRef]
- Huang, N.; Shi, G.L. The significance of vertical moisture diffusion on drifting snow sublimation near snow surface. Cryosphere 2017, 11, 3011–3021. [Google Scholar] [CrossRef] [Green Version]
- Wang, J.Q.; Liu, X.J.; Zhou, Y.H. A high-order accurate wavelet method for solving Schrodinger equations with general nonlinearity. Appl. Math. Mech. 2018, 39, 275–290. [Google Scholar] [CrossRef]
- Baker, A.; Rajic, N.; Davis, C. Towards a practical structural health monitoring technology for patched cracks in aircraft structure. Compos. Part A 2009, 40, 1340–1352. [Google Scholar] [CrossRef]
- Wada, D.; Igawa, H.; Tamayama, M.; Kasai, T.; Arizono, H.; Murayama, H. Flight demonstration of aircraft wing monitoring using optical fiber distributed sensing system. Smart Mater. Struct. 2019, 28, 055007. [Google Scholar] [CrossRef]
- Wang, H.P.; Jiang, L.Z.; Xiang, P. Improving the durability of the optical fiber sensor based on strain transfer analysis. Opt. Fiber Technol. 2018, 42, 97–104. [Google Scholar] [CrossRef]
- Zhang, Y.Z.; Anderson, N.; Bland, S. All-printed strain sensors: Building blocks of the aircraft structural health monitoring system. Sens. Actuators A Phys. 2017, 253, 165–172. [Google Scholar] [CrossRef] [Green Version]
- Higuchi, R.; Okabe, T.; Yoshimura, A.; Tay, T.E. Progressive failure under high-velocity impact on composite laminates: Experiment and phenomenological mesomodeling. Eng. Fract. Mech. 2017, 178, 346–361. [Google Scholar] [CrossRef]
- Wang, H.P.; Ni, Y.Q.; Dai, J.G.; Yuan, M.D. Interfacial debonding detection of strengthened steel structures by using smart CFRP-FBG composites. Smart Mater. Struct. 2019, 28, 115001. [Google Scholar] [CrossRef]
- Junior, P.; Silva, A.G.M.D.; Oliveira, D. CFRP laminate as punching shear reinforcement. Eng. Struct. 2021, 237, 112072. [Google Scholar] [CrossRef]
- Backe, S.; Balle, F.; Hannemann, B.; Schmeer, S.; Breuer, U.P. Fatigue properties of multifunctional metal-and carbon-fibre-reinforced polymers and intrinsic capabilities for damage monitoring. Fatigue Fract. Eng. Mater. Struct. 2019, 42, 143–151. [Google Scholar] [CrossRef] [Green Version]
- Yu, F.M.; Okabe, Y. Linear damage localization in CFRP laminates using one single fiber-optic Bragg grating acoustic emission sensor. Compos. Struct. 2020, 238, 111992. [Google Scholar] [CrossRef]
- Robin, J.; Victor, G. Towards the generation of controlled one-inch impact damage in thick CFRP composites for SHM and NDE validation. Compos. Part B Eng. 2020, 203, 108463. [Google Scholar]
- Cao, H.Y.; Jiang, M.S.; Jia, L.; Ma, M.Y.; Sun, L.; Zhang, L.; Tian, A.Q.; Liang, J.Y. An ultrasonic signal processing method to improve defect depth estimation in composites based on empirical mode decomposition. Meas. Sci. Technol. 2021, 32, 115112. [Google Scholar] [CrossRef]
- Sánchez-Romate, X.F.; García, C.; Rams, J.; Sánchez, M.; Ureña, A. Structural health monitoring of a CFRP structural bonded repair by using a carbon nanotube modified adhesive film. Compos. Struct. 2021, 270, 114091. [Google Scholar] [CrossRef]
- Ni, Q.Q.; Hong, J.; Xu, P.; Xu, Z.Z.; Khvostunkov, K.; Xia, H. Damage detection of CFRP composites by electromagnetic wave nondestructive testing (EMW-NDT). Compos. Sci. Technol. 2021, 210, 108839. [Google Scholar] [CrossRef]
- Yang, X.Y.; Verboven, E.; Ju, B.F.; Kersemans, M. Comparative study of ultrasonic techniques for reconstructing the multilayer structure of composites. NDT&E Int. 2021, 121, 102460. [Google Scholar]
- Wang, H.P.; Song, T.; Yan, J.W.; Xiang, P.; Feng, S.Y.; Hui, D. Improved analytical method for interfacial-slip control design of steel-concrete composite structures. Symmetry 2021, 13, 1225. [Google Scholar] [CrossRef]
- Stephen, P.T.; Woinowsky-Krieger, S. Theory of Plates and Shells, 2nd ed.; McGraw Hill India: New York, NY, USA, 2010. [Google Scholar]
- Ermakov, V.N.; Kruchinin, S.P.; Fujiwara, A. Electronic nanosensors based on nanotransistor with bistability behaviour. In NATO ARW Electron Transport in Nanosystems; Bonca, J., Kruchinin, S.P., Eds.; Springer: Berlin/Heidelberg, Germany, 2008; pp. 341–349. [Google Scholar]
- Repetsky, S.P.; Vyshyvana, I.G.; Nakazawa, Y.; Kruchinin, S.P.; Bellucci, S. Electron transport in carbon nanotubes with adsorbed chromium impurities. Materials 2019, 12, 524. [Google Scholar] [CrossRef] [Green Version]
- Wang, H.P.; Dai, J.G.; Wang, X.Z. Improved temperature compensation of fiber Bragg grating-based sensors applied to structures under different loading conditions. Opt. Fiber Technol. 2021, 63, 102506. [Google Scholar] [CrossRef]
- Wang, H.P.; Jiang, L.Z.; Xiang, P. Priority design parameters of industrialized optical fiber sensors in civil engineering. Opt. Laser Technol. 2018, 100, 119–128. [Google Scholar] [CrossRef]
Figure 1.
Outline of the testing system.
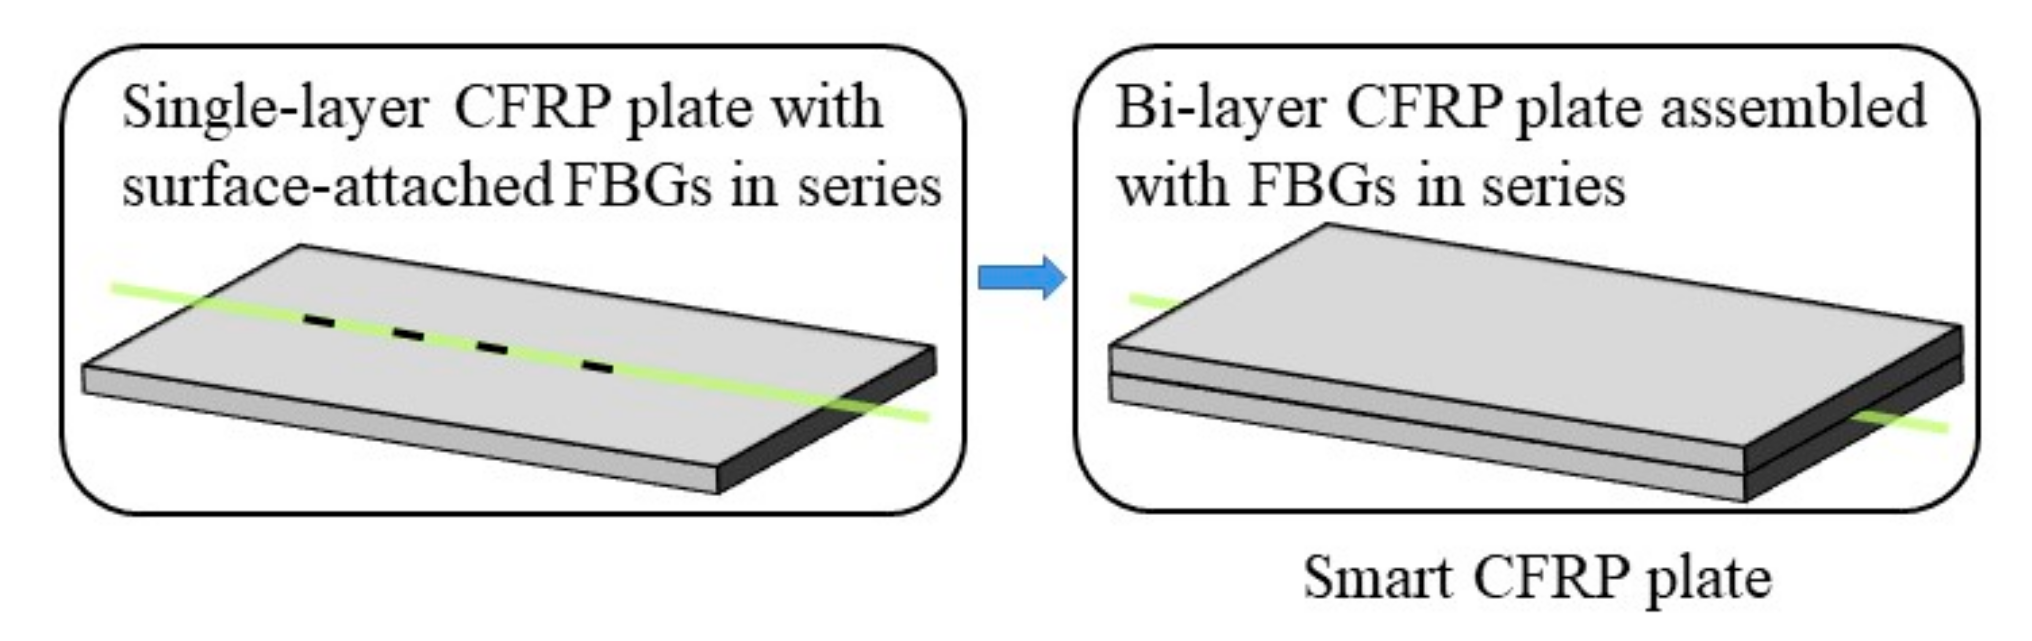
Figure 2.
Simply supported CFRP plate under dynamic load at midspan.
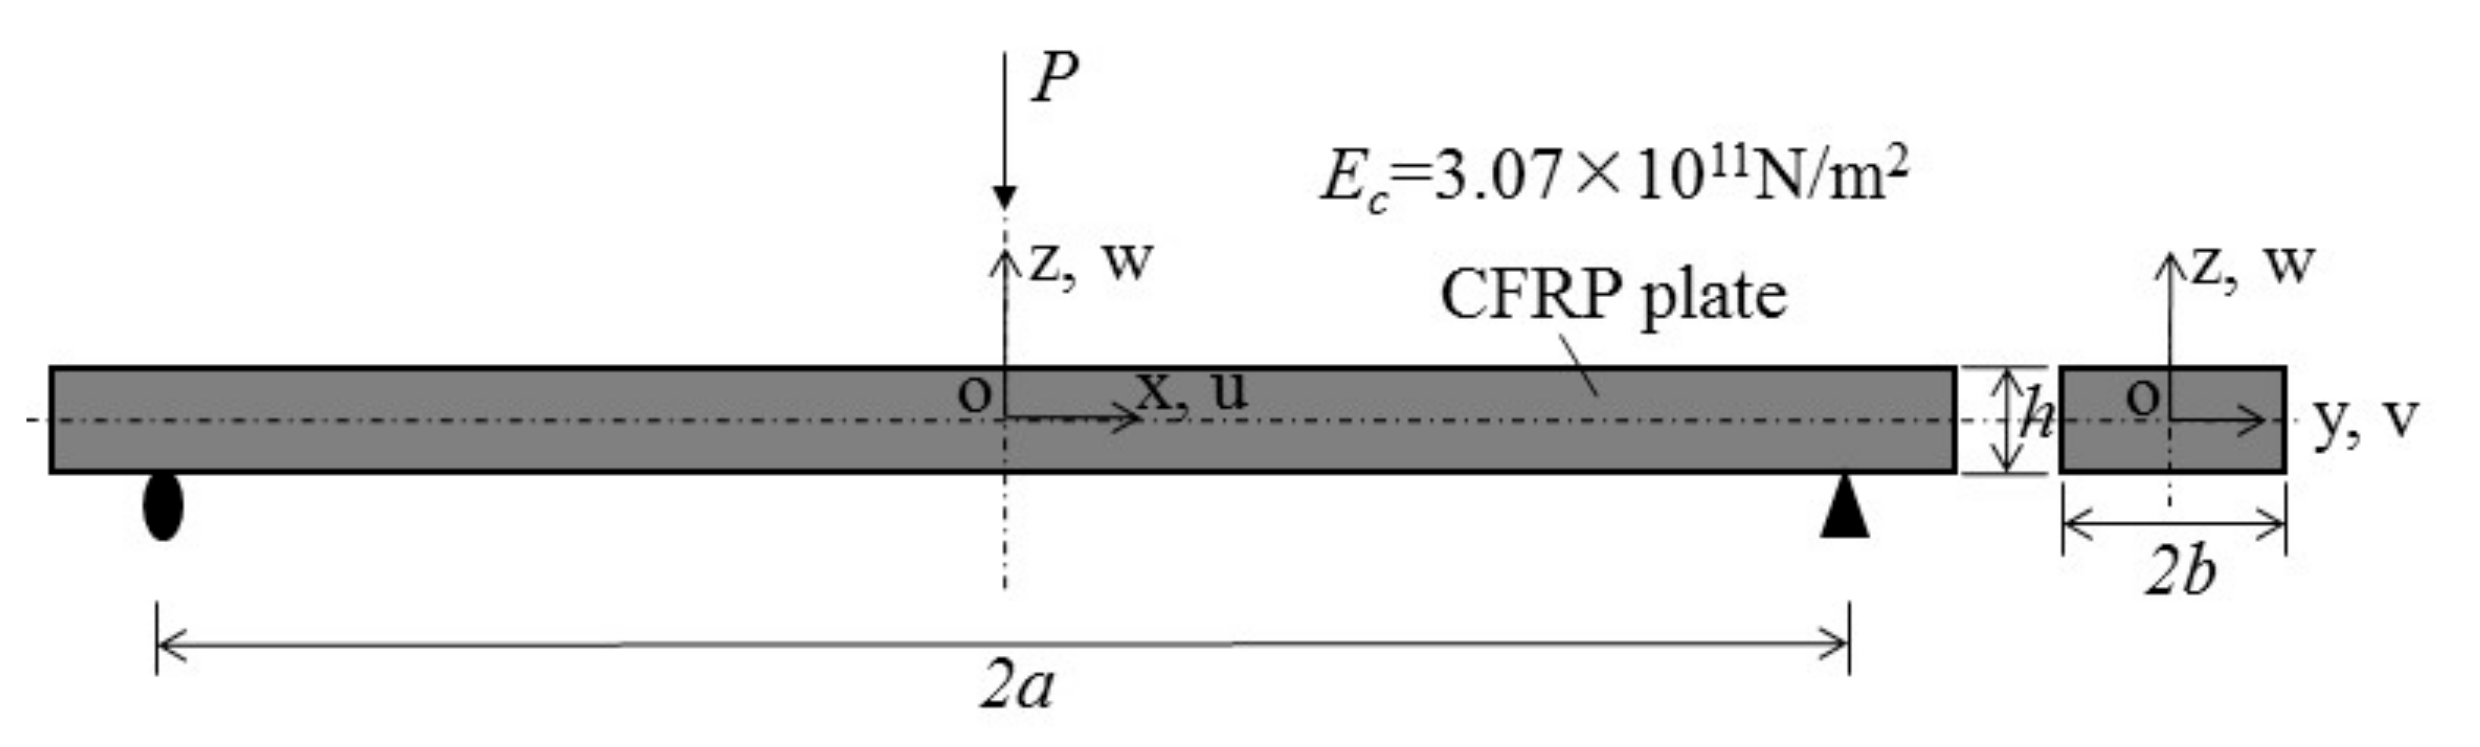
Figure 3.
Constraint and coordination of the CFRP plate.
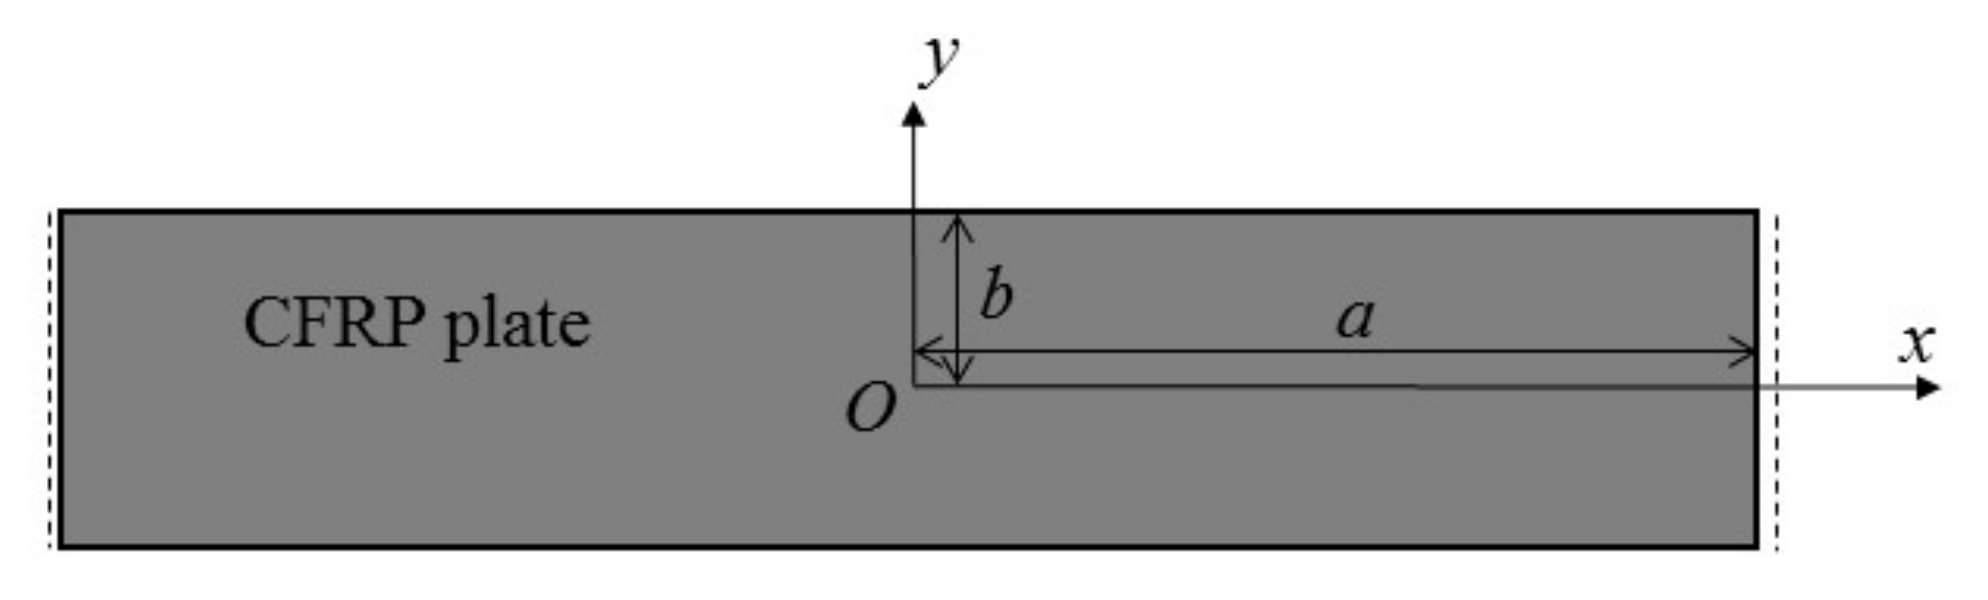
Figure 4.
Displacement and strain distribution of the plate under dynamic load with 𝑓 = 50 Hz.
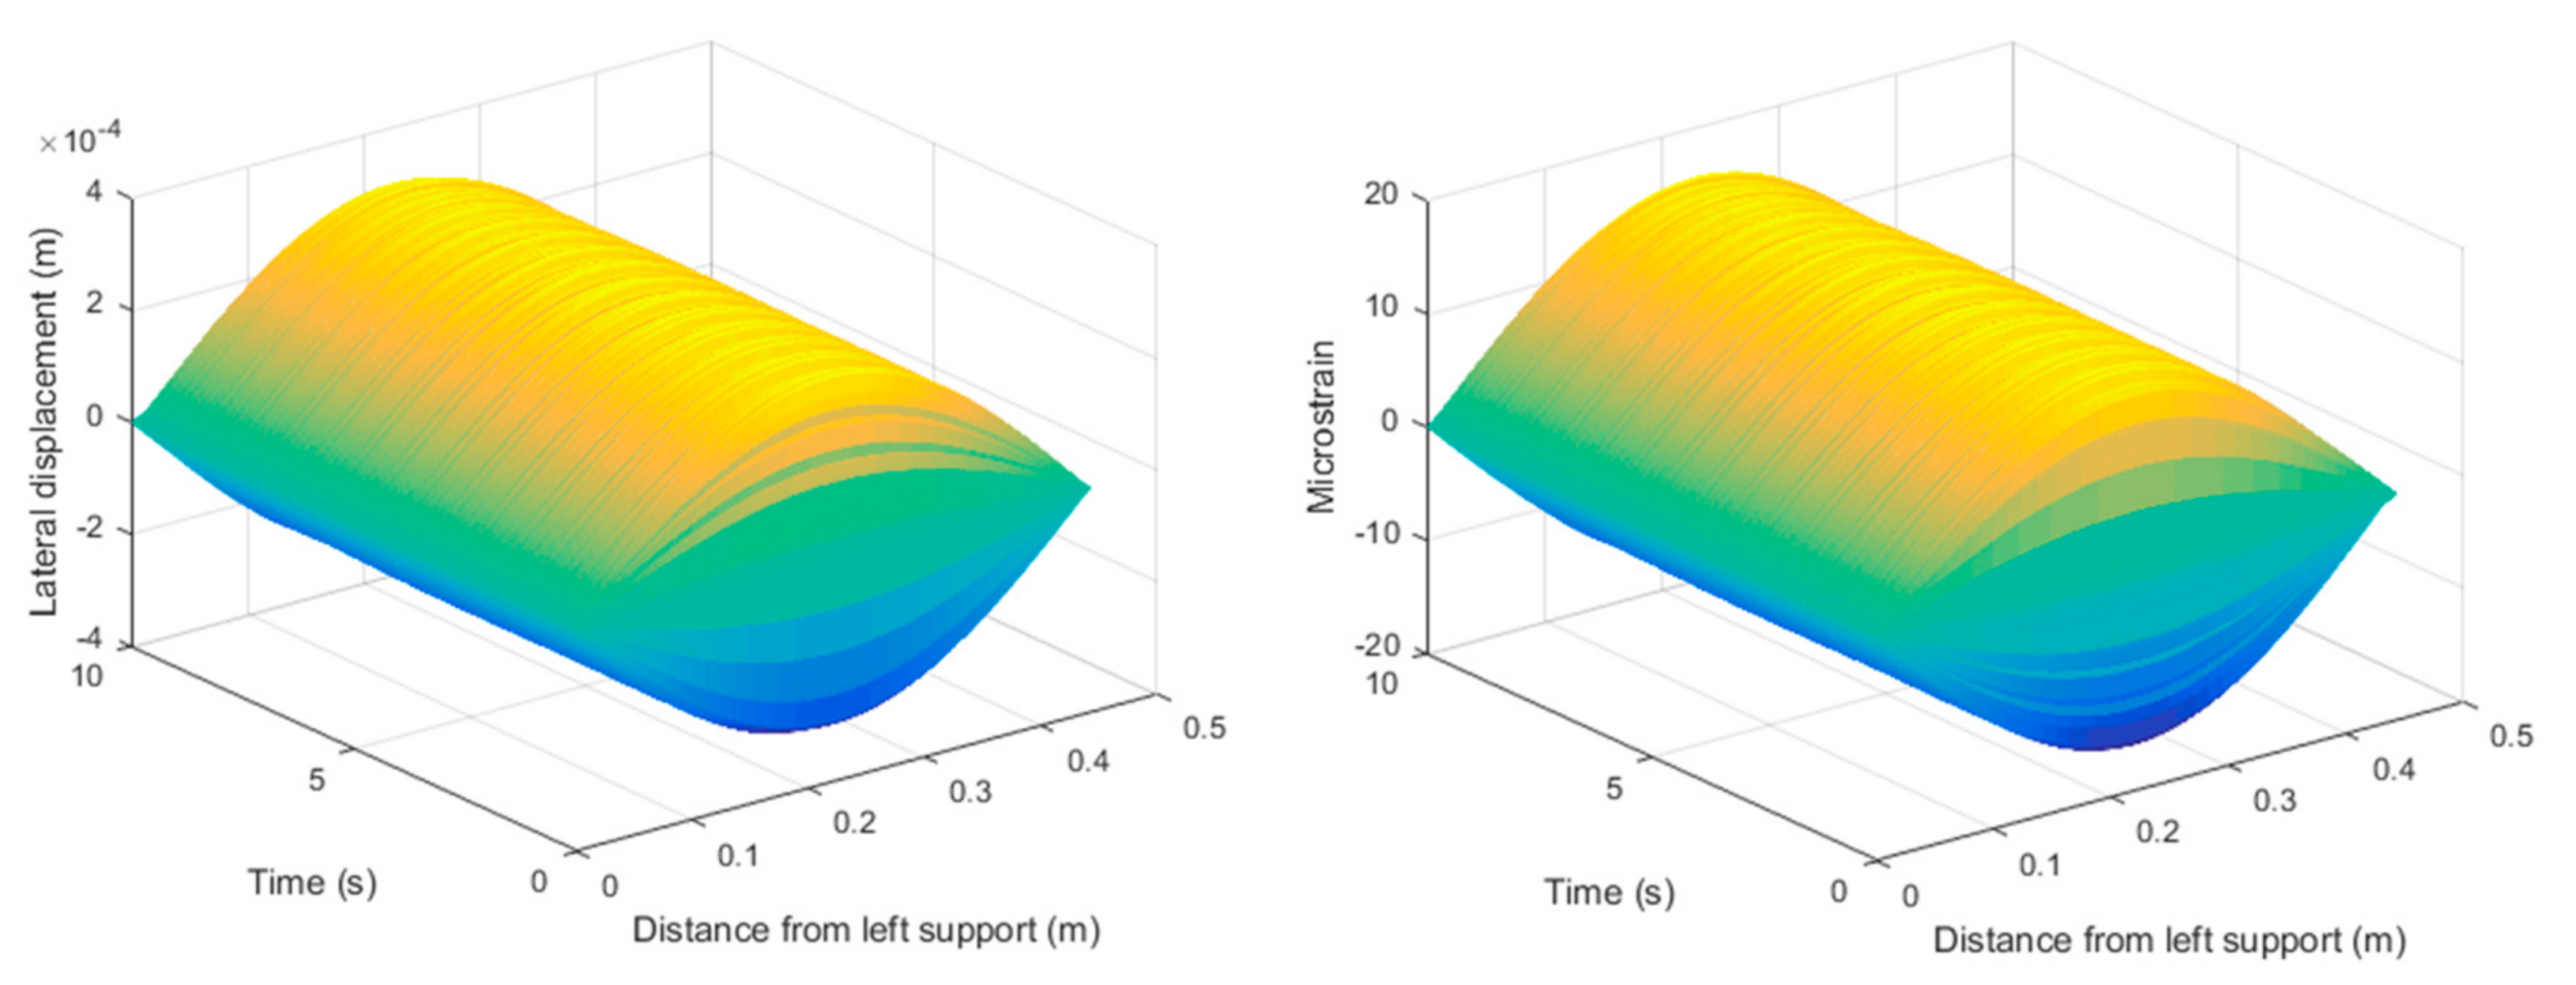
Figure 5.
Setup of plate1: (a) Layout of surface-attached FBGs in series; (b) Position of FBGs in series; (c) Testing photo.
Figure 5.
Setup of plate1: (a) Layout of surface-attached FBGs in series; (b) Position of FBGs in series; (c) Testing photo.
Figure 6.
Setup of plate2: (a) Layout of surface-attached FBGs in series; (b) Position of FBGs in series; (c) Testing photo.
Figure 6.
Setup of plate2: (a) Layout of surface-attached FBGs in series; (b) Position of FBGs in series; (c) Testing photo.
Figure 7.
Central wavelength increment with excitation frequency of 50 Hz: (a) Bare-FBG1-plate1; (b) Bare-FBG2-plate1; (c) Bare-FBG3-plate1; (d) Bare-FBG4-plate1; (e) Bare-FBG5-plate1; (f) Bare-FBG6-plate1.
Figure 7.
Central wavelength increment with excitation frequency of 50 Hz: (a) Bare-FBG1-plate1; (b) Bare-FBG2-plate1; (c) Bare-FBG3-plate1; (d) Bare-FBG4-plate1; (e) Bare-FBG5-plate1; (f) Bare-FBG6-plate1.
Figure 8.
Central wavelength increment in short time with excitation frequency of 50 Hz: (a) Bare-FBG1-plate1; (b) Bare-FBG2-plate1; (c) Bare-FBG3-plate1; (d) Bare-FBG4-plate1; (e) Bare-FBG5-plate1; (f) Bare-FBG6-plate1.
Figure 8.
Central wavelength increment in short time with excitation frequency of 50 Hz: (a) Bare-FBG1-plate1; (b) Bare-FBG2-plate1; (c) Bare-FBG3-plate1; (d) Bare-FBG4-plate1; (e) Bare-FBG5-plate1; (f) Bare-FBG6-plate1.
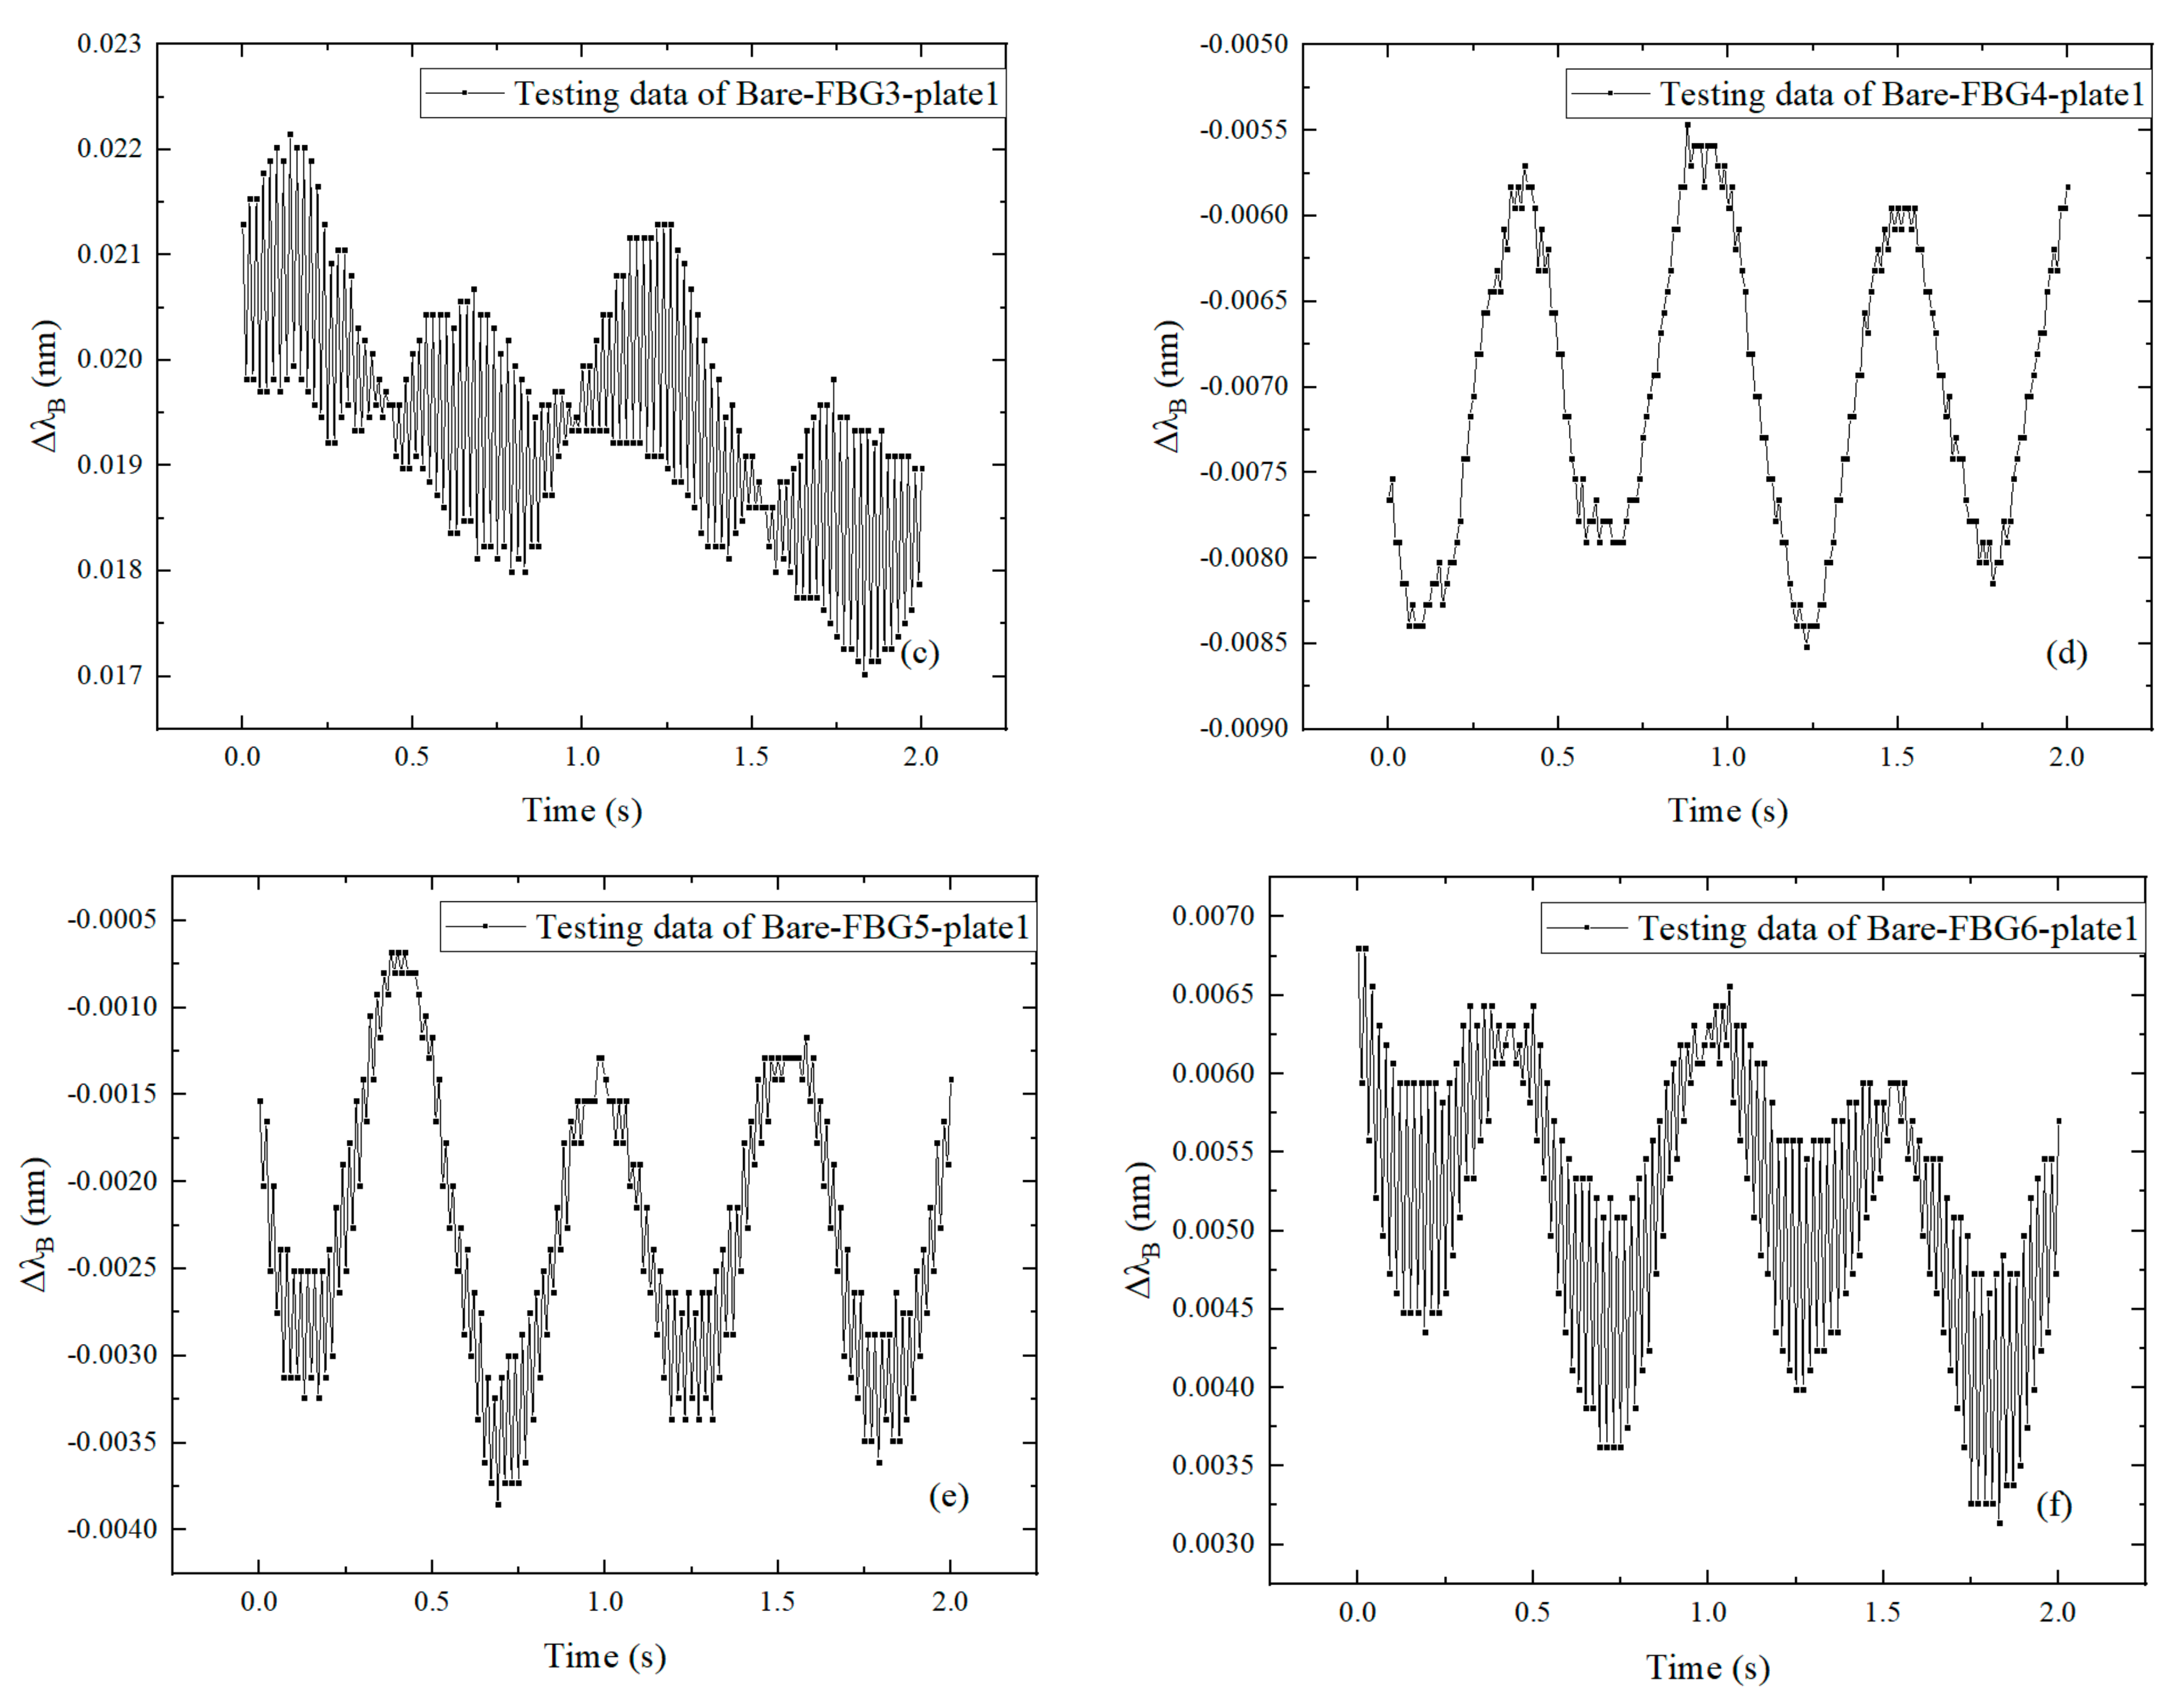
Figure 9.
Central wavelength increment with excitation frequency of 30 Hz: (a) Bare-FBG1-plate1; (b) Bare-FBG2-plate1; (c) Bare-FBG3-plate1; (d) Bare-FBG4-plate1; (e) Bare-FBG5-plate1; (f) Bare-FBG6-plate1.
Figure 9.
Central wavelength increment with excitation frequency of 30 Hz: (a) Bare-FBG1-plate1; (b) Bare-FBG2-plate1; (c) Bare-FBG3-plate1; (d) Bare-FBG4-plate1; (e) Bare-FBG5-plate1; (f) Bare-FBG6-plate1.
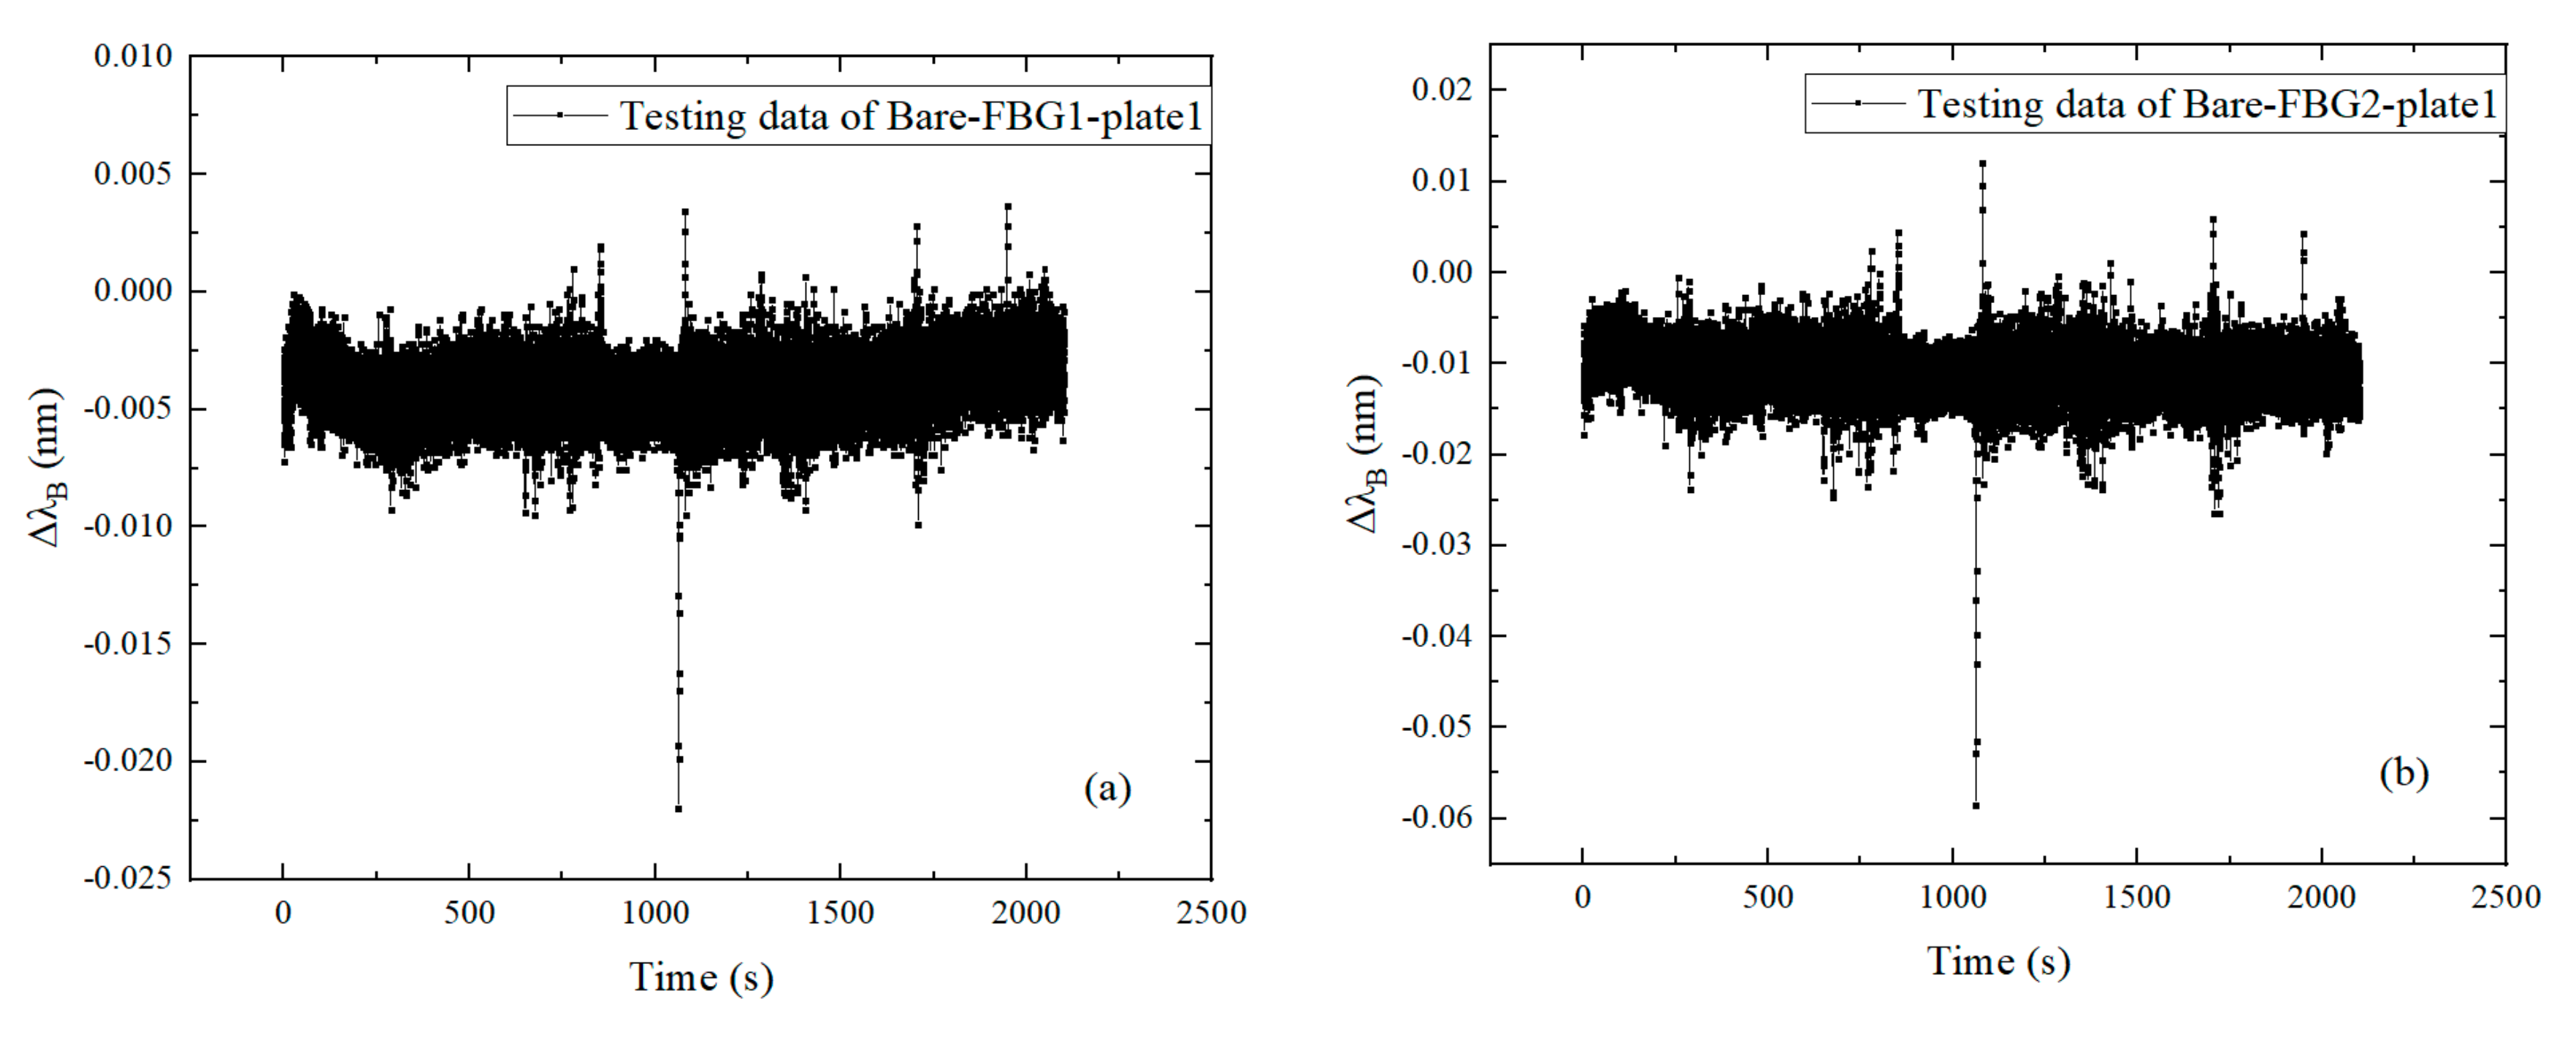
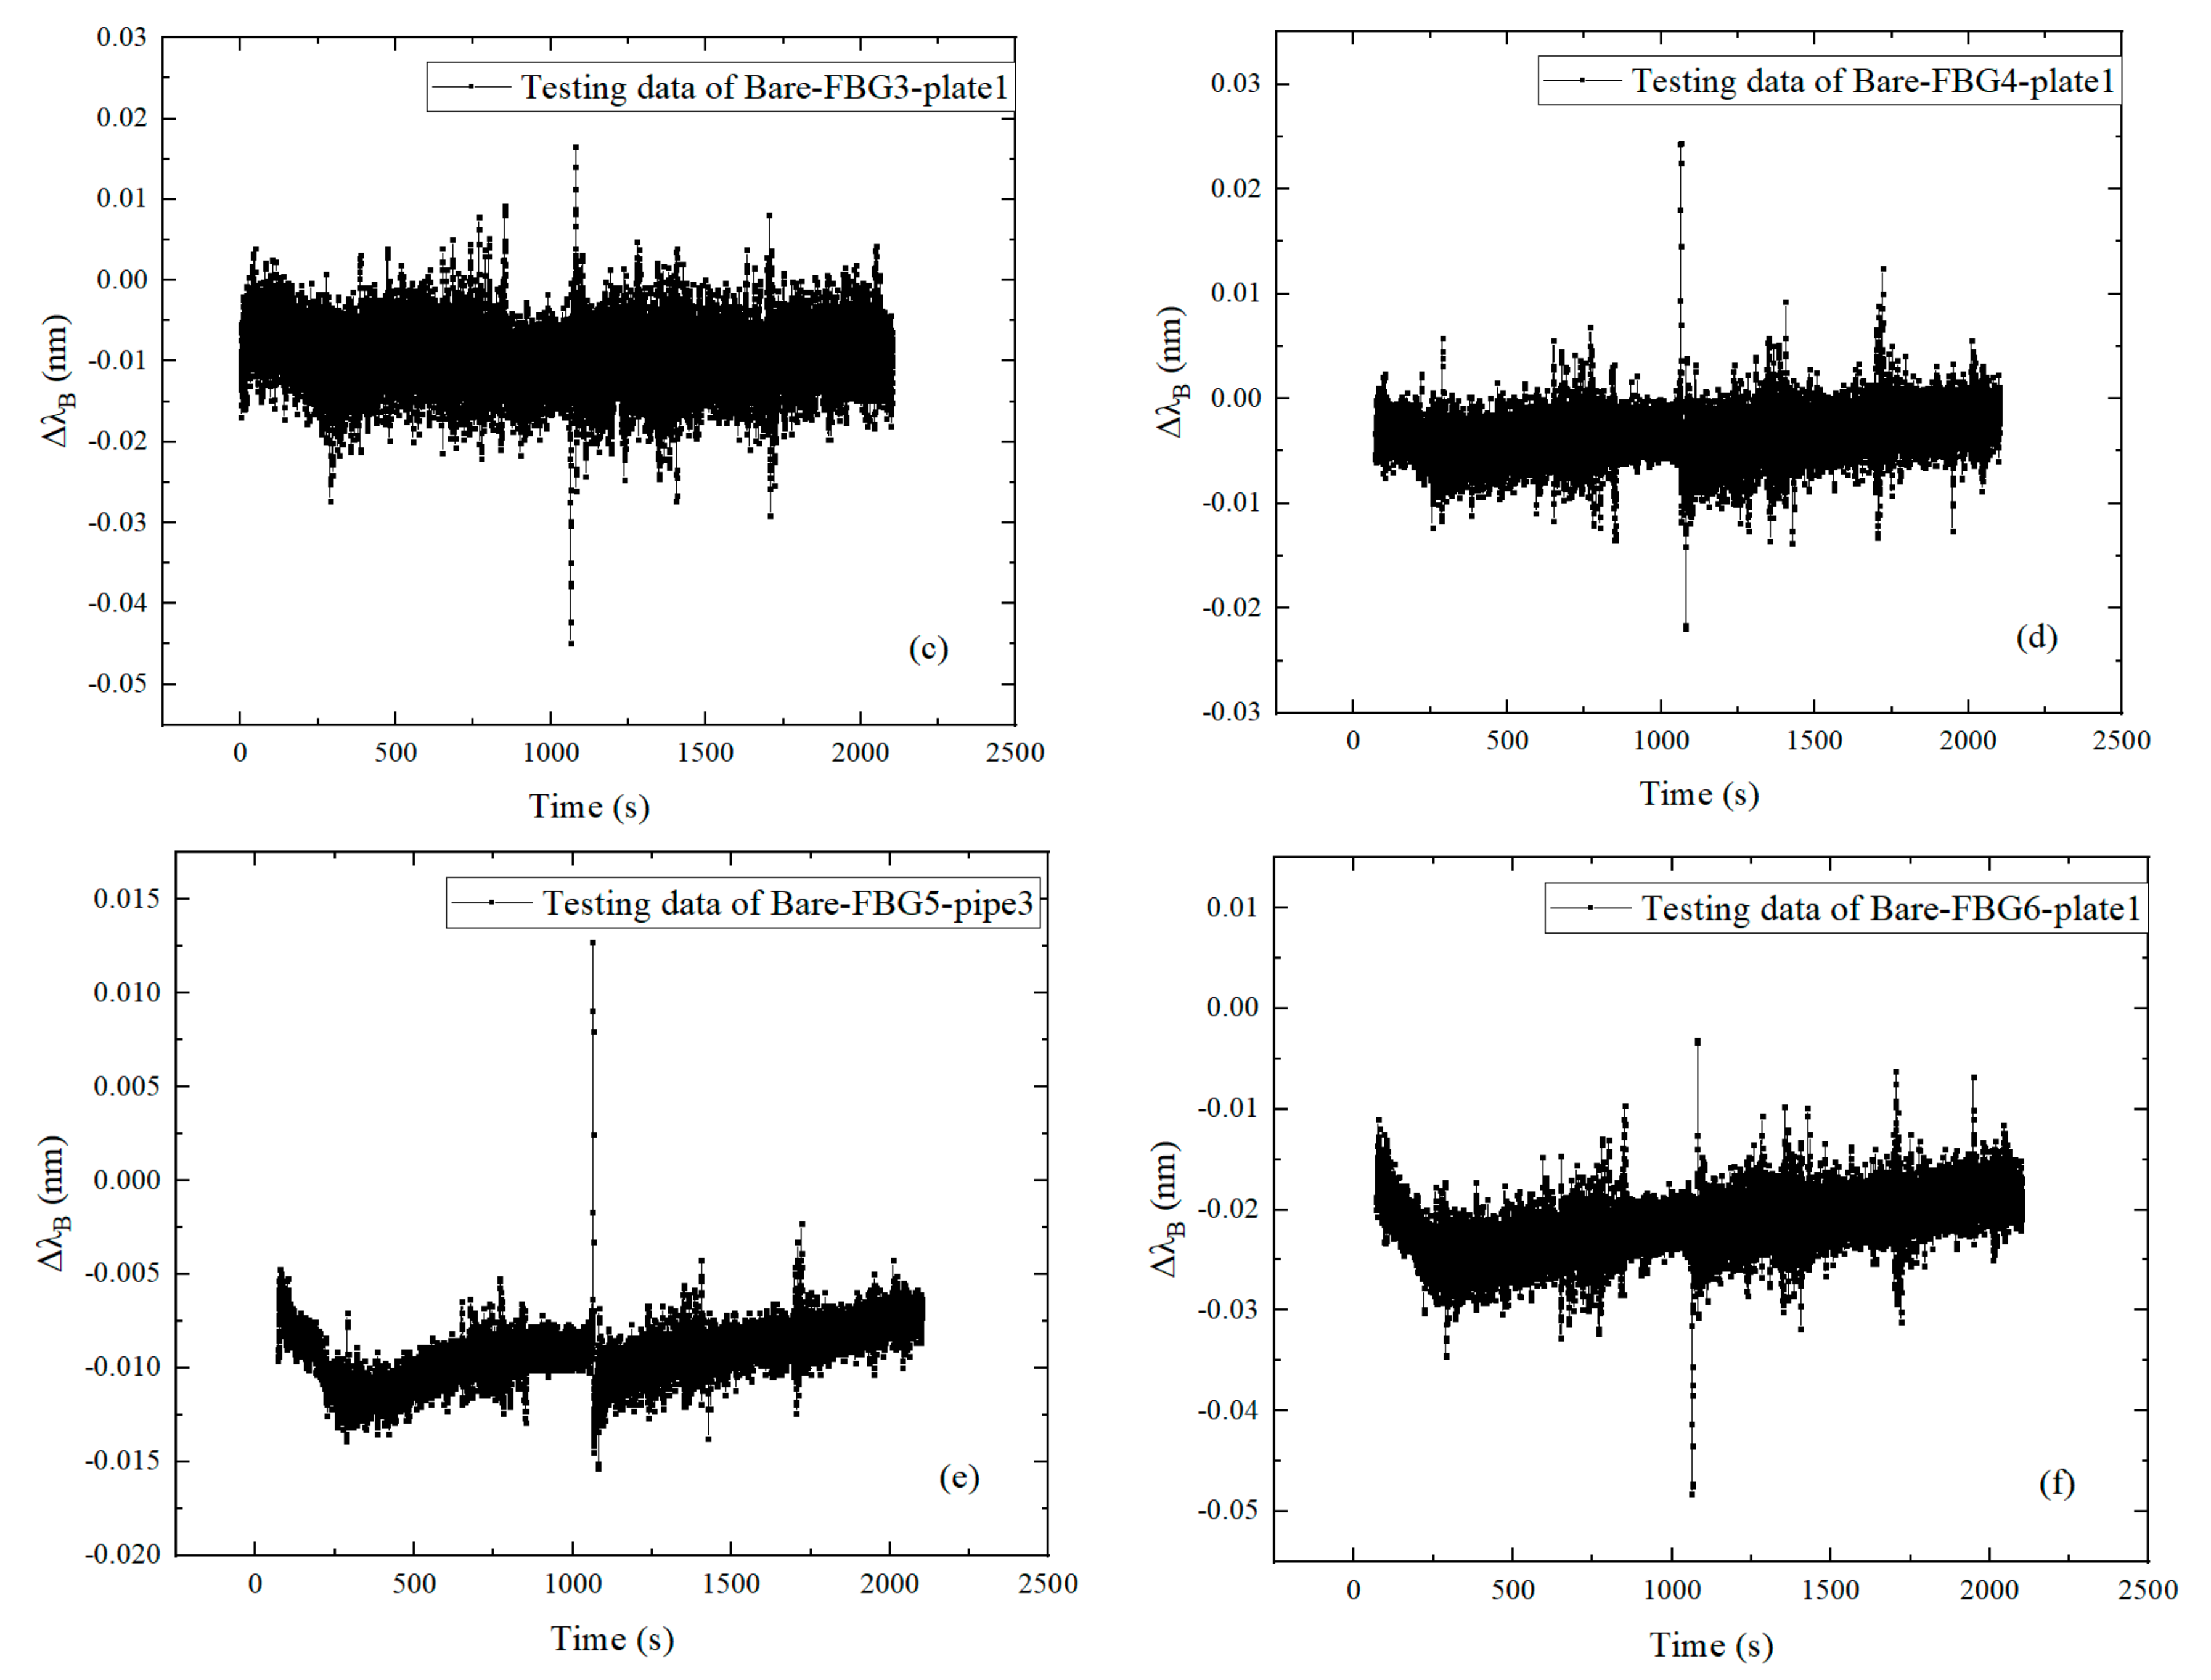
Figure 10.
Relationship of central wavelength increment with excitation frequency of 30 Hz: (a) Bare-FBG1-plate1; (b) Bare-FBG2-plate1; (c) Bare-FBG3-plate1; (d) Bare-FBG4-plate1; (e) Bare-FBG5-plate1; (f) Bare-FBG6-plate1.
Figure 10.
Relationship of central wavelength increment with excitation frequency of 30 Hz: (a) Bare-FBG1-plate1; (b) Bare-FBG2-plate1; (c) Bare-FBG3-plate1; (d) Bare-FBG4-plate1; (e) Bare-FBG5-plate1; (f) Bare-FBG6-plate1.
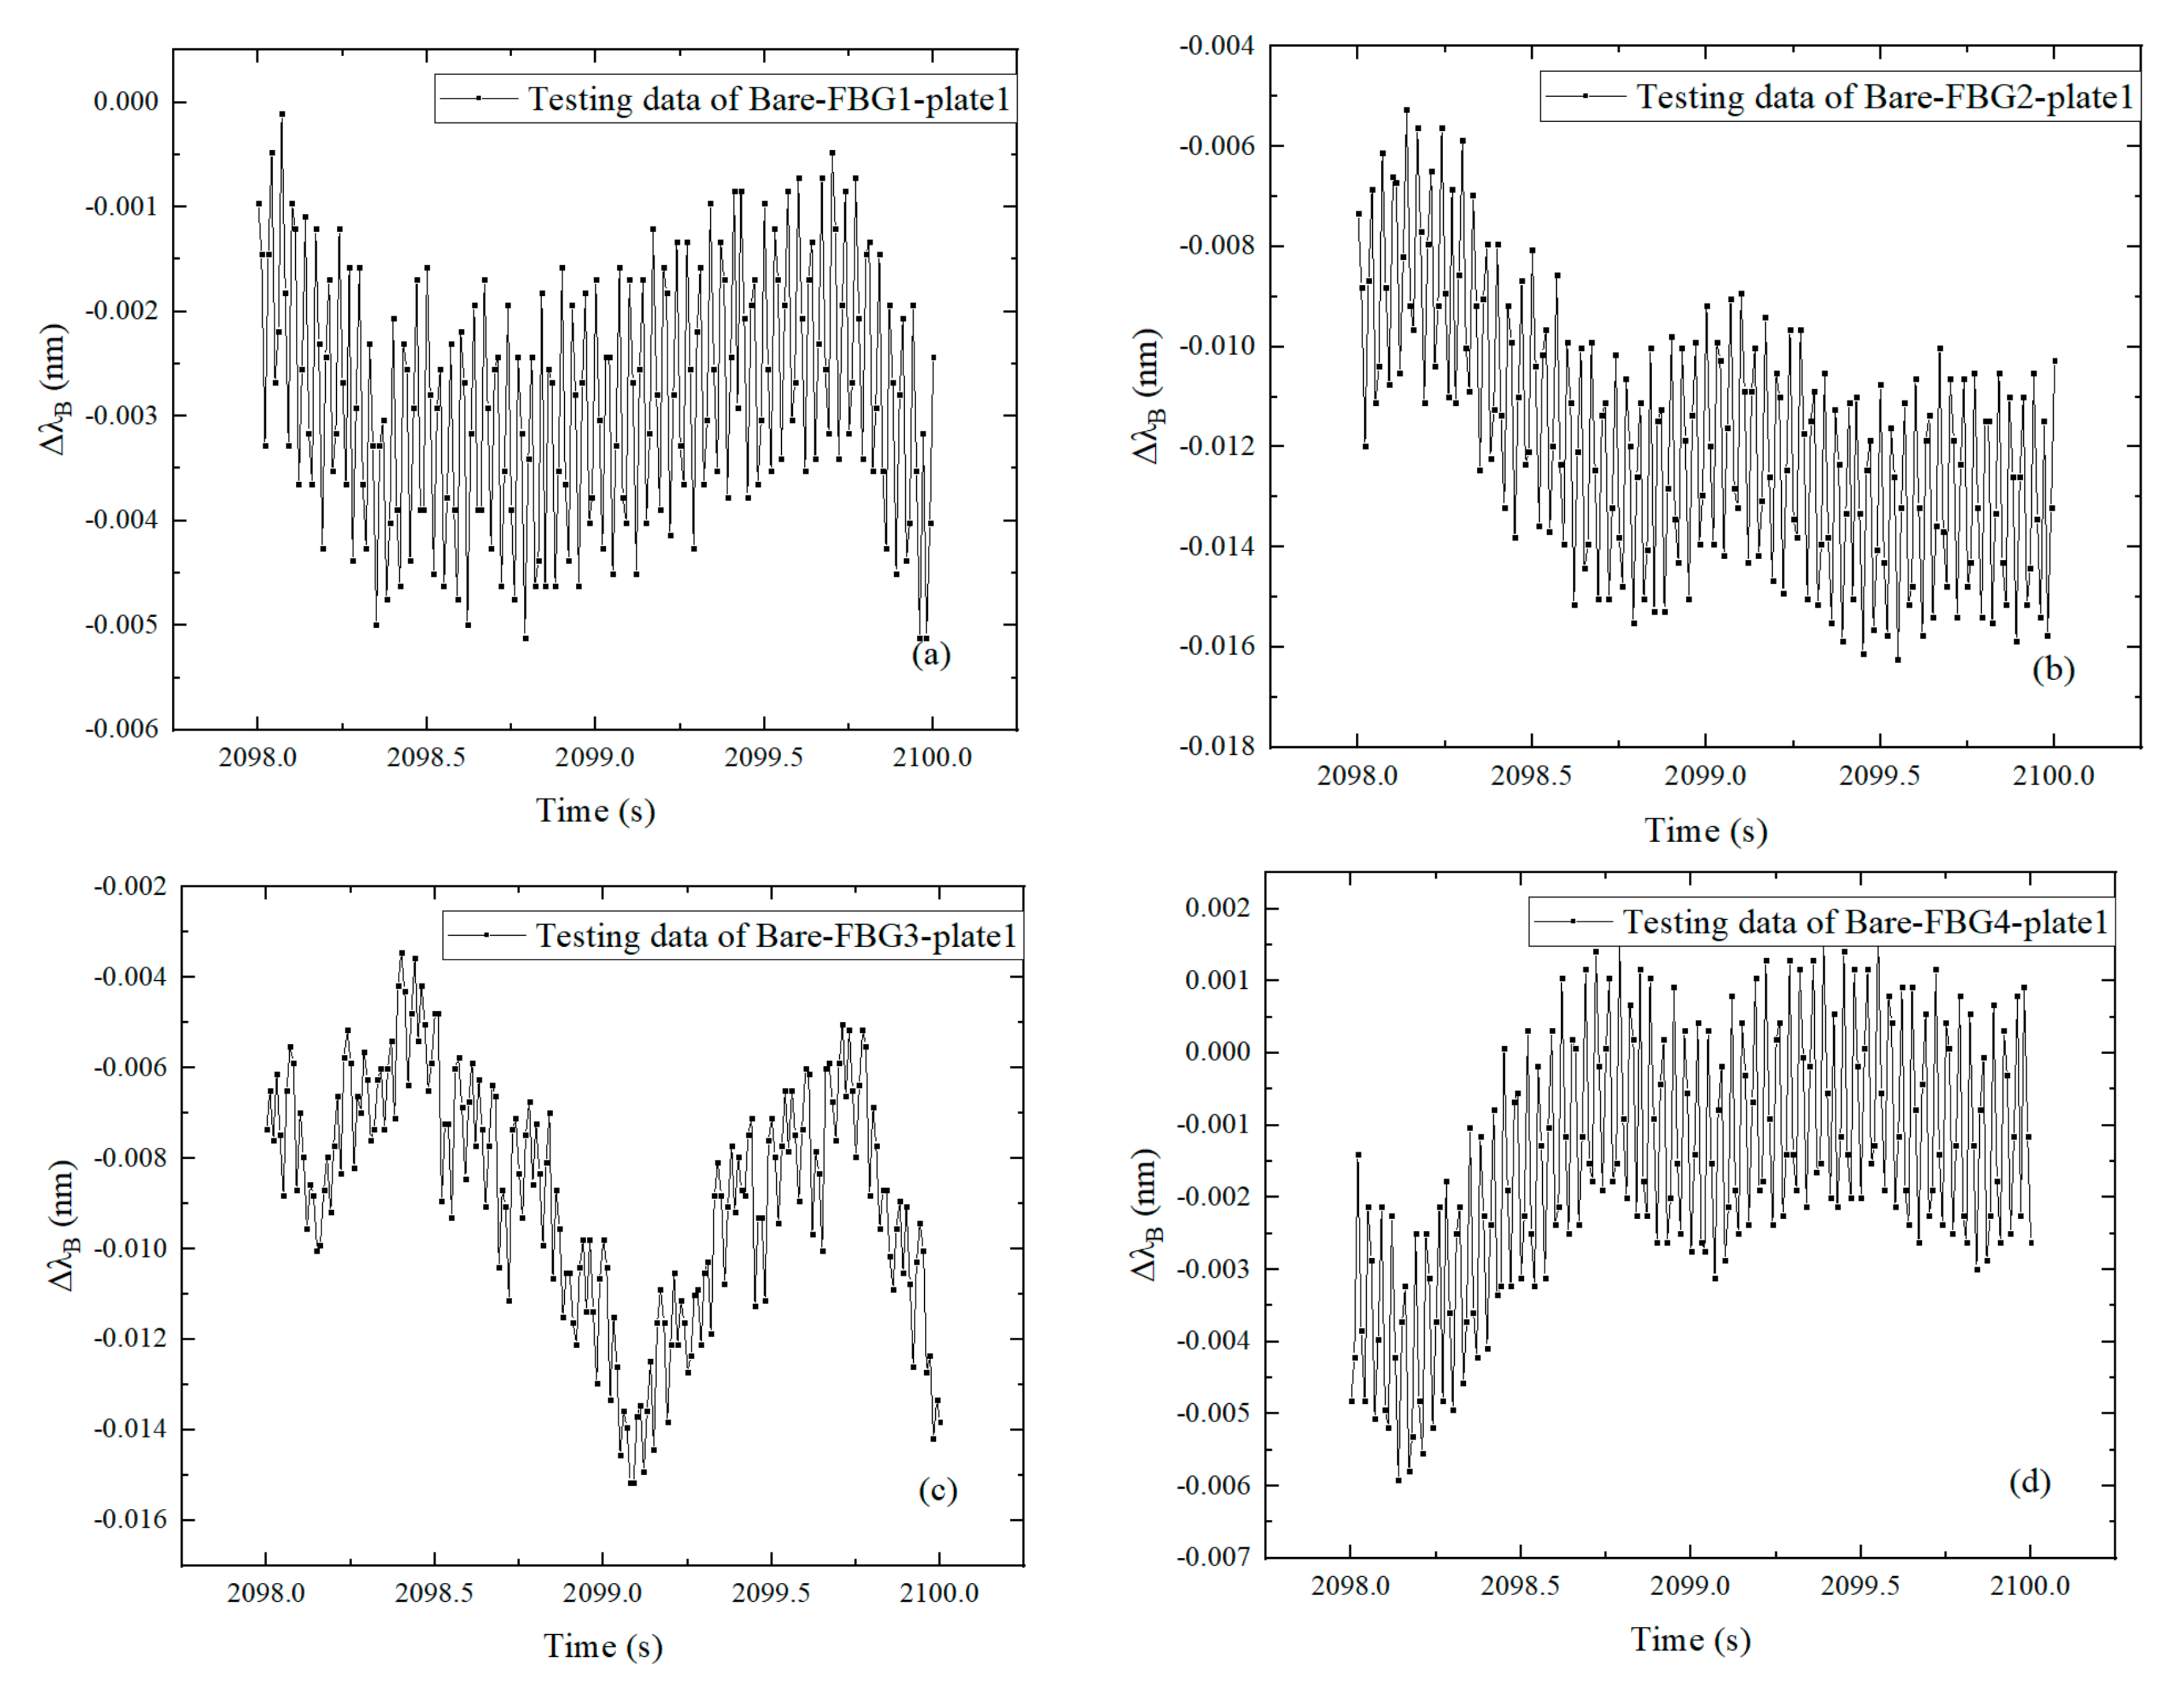
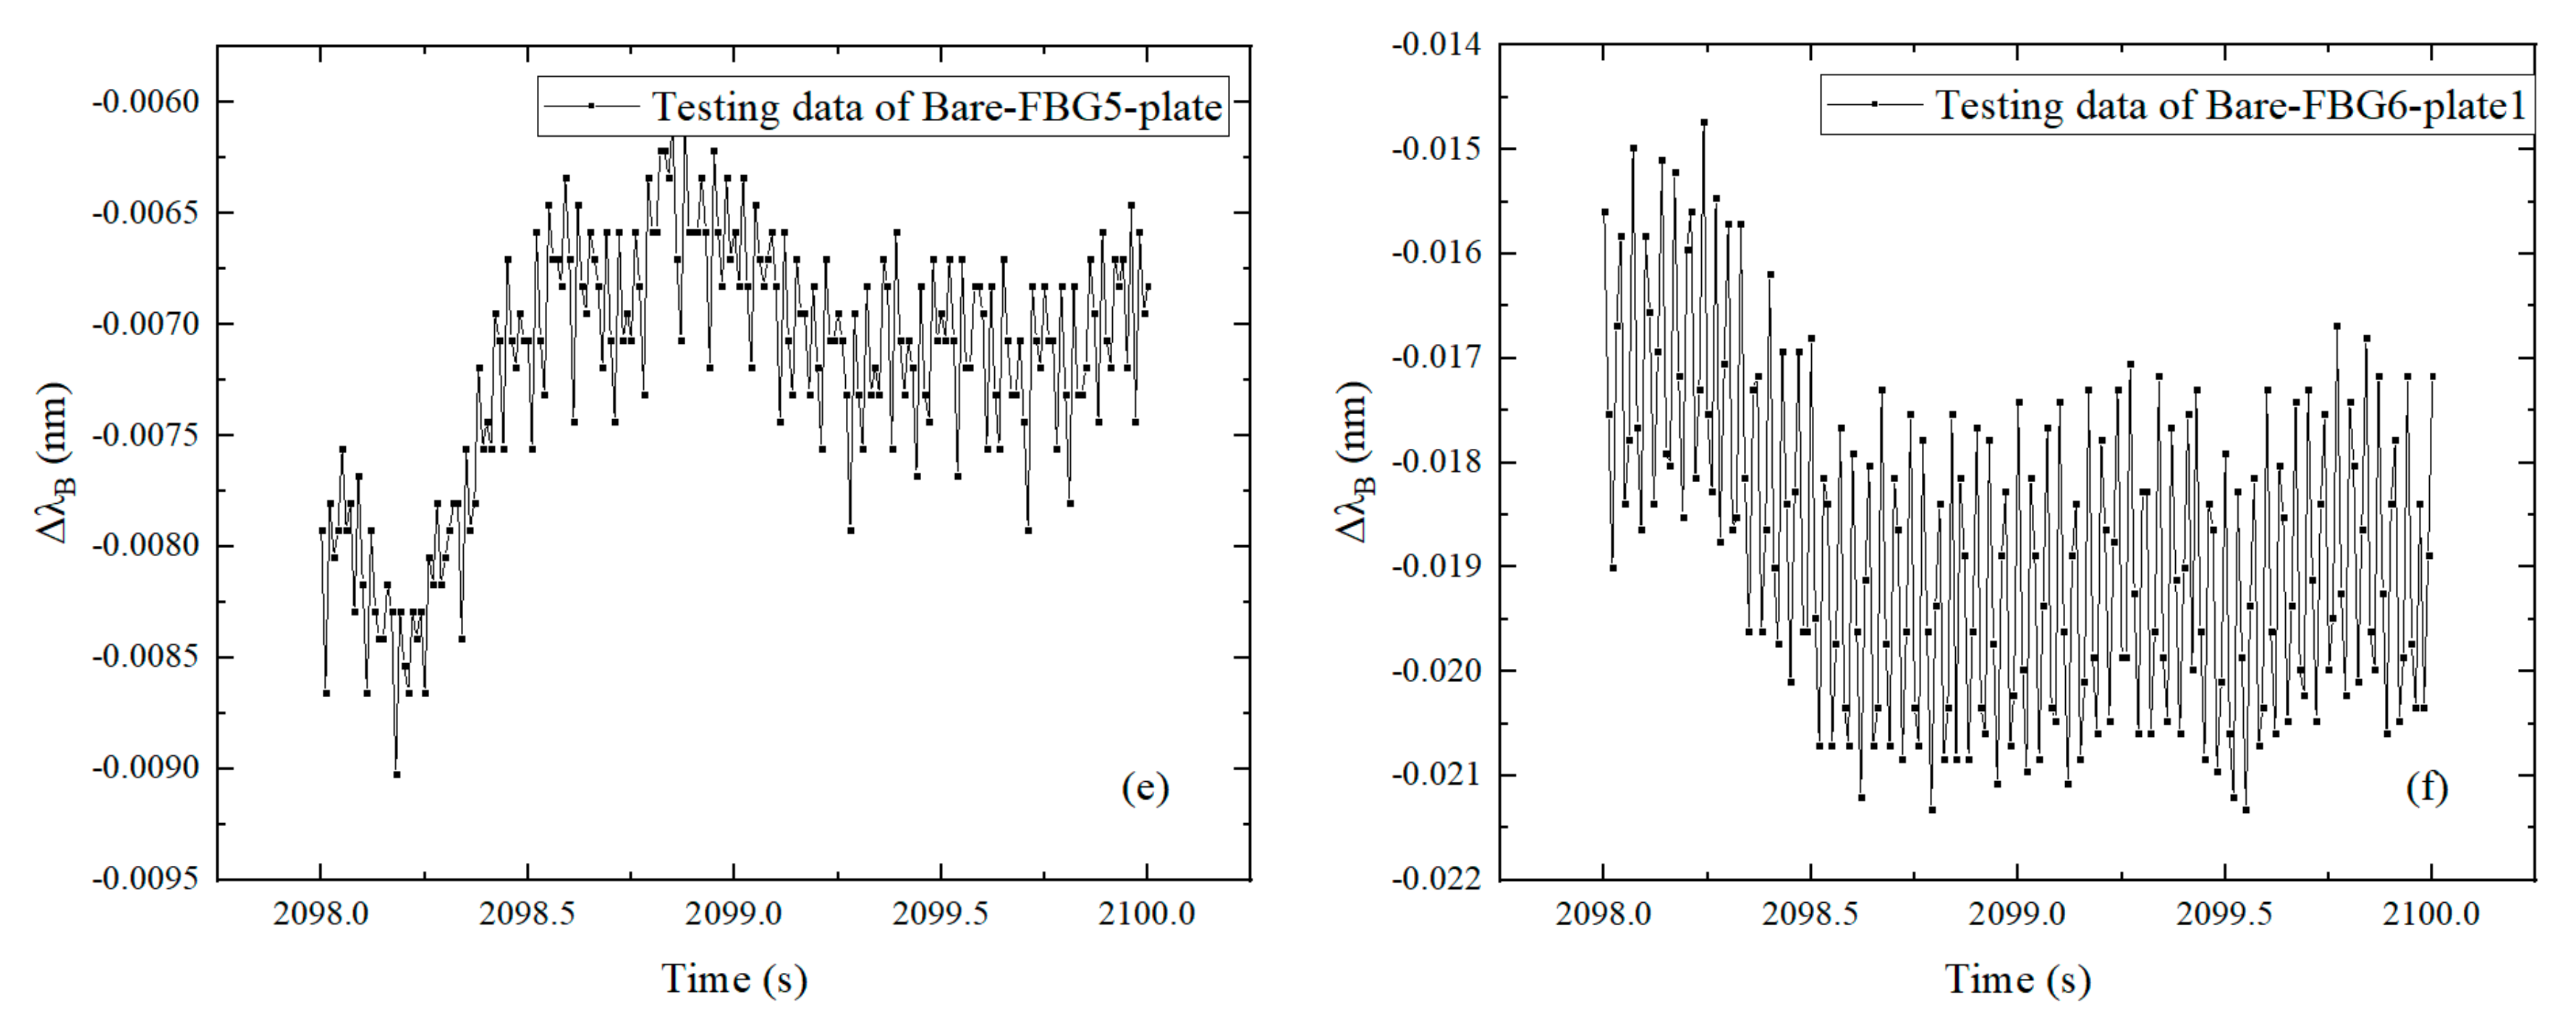
Figure 11.
Central wavelength increment with excitation frequency of 20 Hz: (a) Bare-FBG1-plate1; (b) Bare-FBG2-plate1; (c) Bare-FBG3-plate1; (d) Bare-FBG4-plate1; (e) Bare-FBG5-plate1; (f) Bare-FBG6-plate1.
Figure 11.
Central wavelength increment with excitation frequency of 20 Hz: (a) Bare-FBG1-plate1; (b) Bare-FBG2-plate1; (c) Bare-FBG3-plate1; (d) Bare-FBG4-plate1; (e) Bare-FBG5-plate1; (f) Bare-FBG6-plate1.
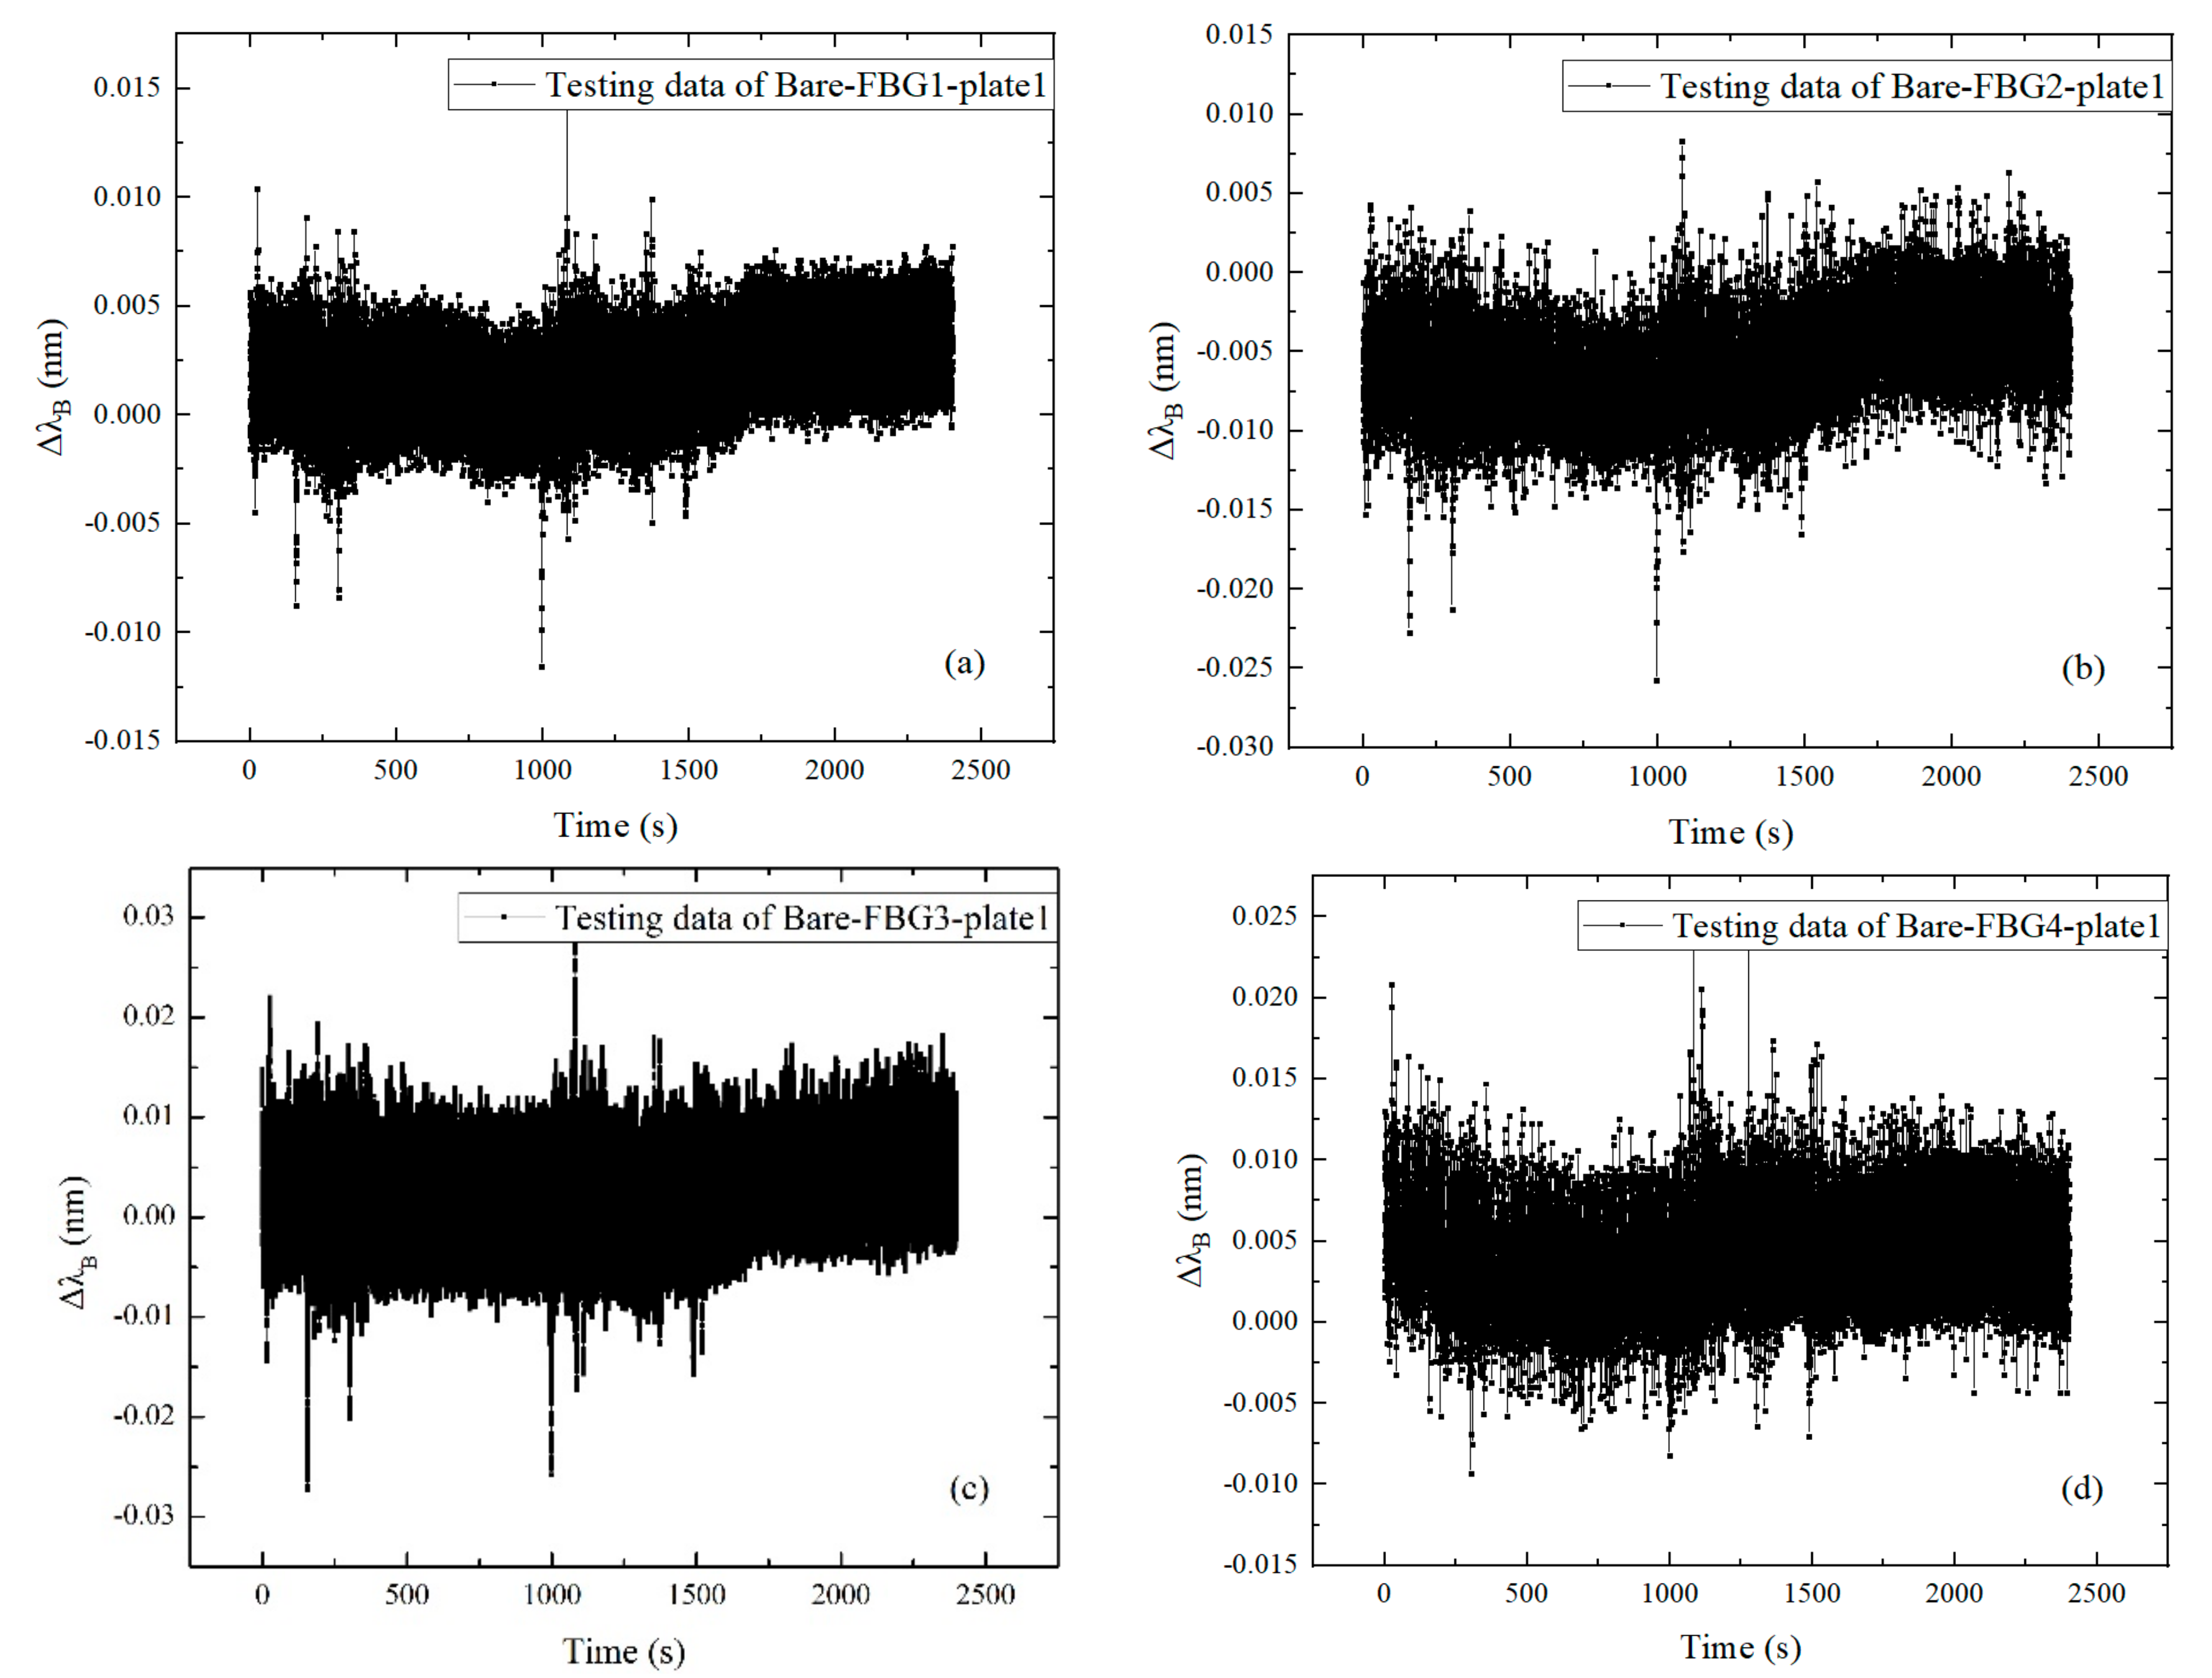

Figure 12.
Central wavelength increment with excitation frequency of 20 Hz: (a) Bare-FBG1-plate1; (b) Bare-FBG2-plate1; (c) Bare-FBG3-plate1; (d) Bare-FBG4-plate1; (e) Bare-FBG5-plate1; (f) Bare-FBG6-plate1.
Figure 12.
Central wavelength increment with excitation frequency of 20 Hz: (a) Bare-FBG1-plate1; (b) Bare-FBG2-plate1; (c) Bare-FBG3-plate1; (d) Bare-FBG4-plate1; (e) Bare-FBG5-plate1; (f) Bare-FBG6-plate1.
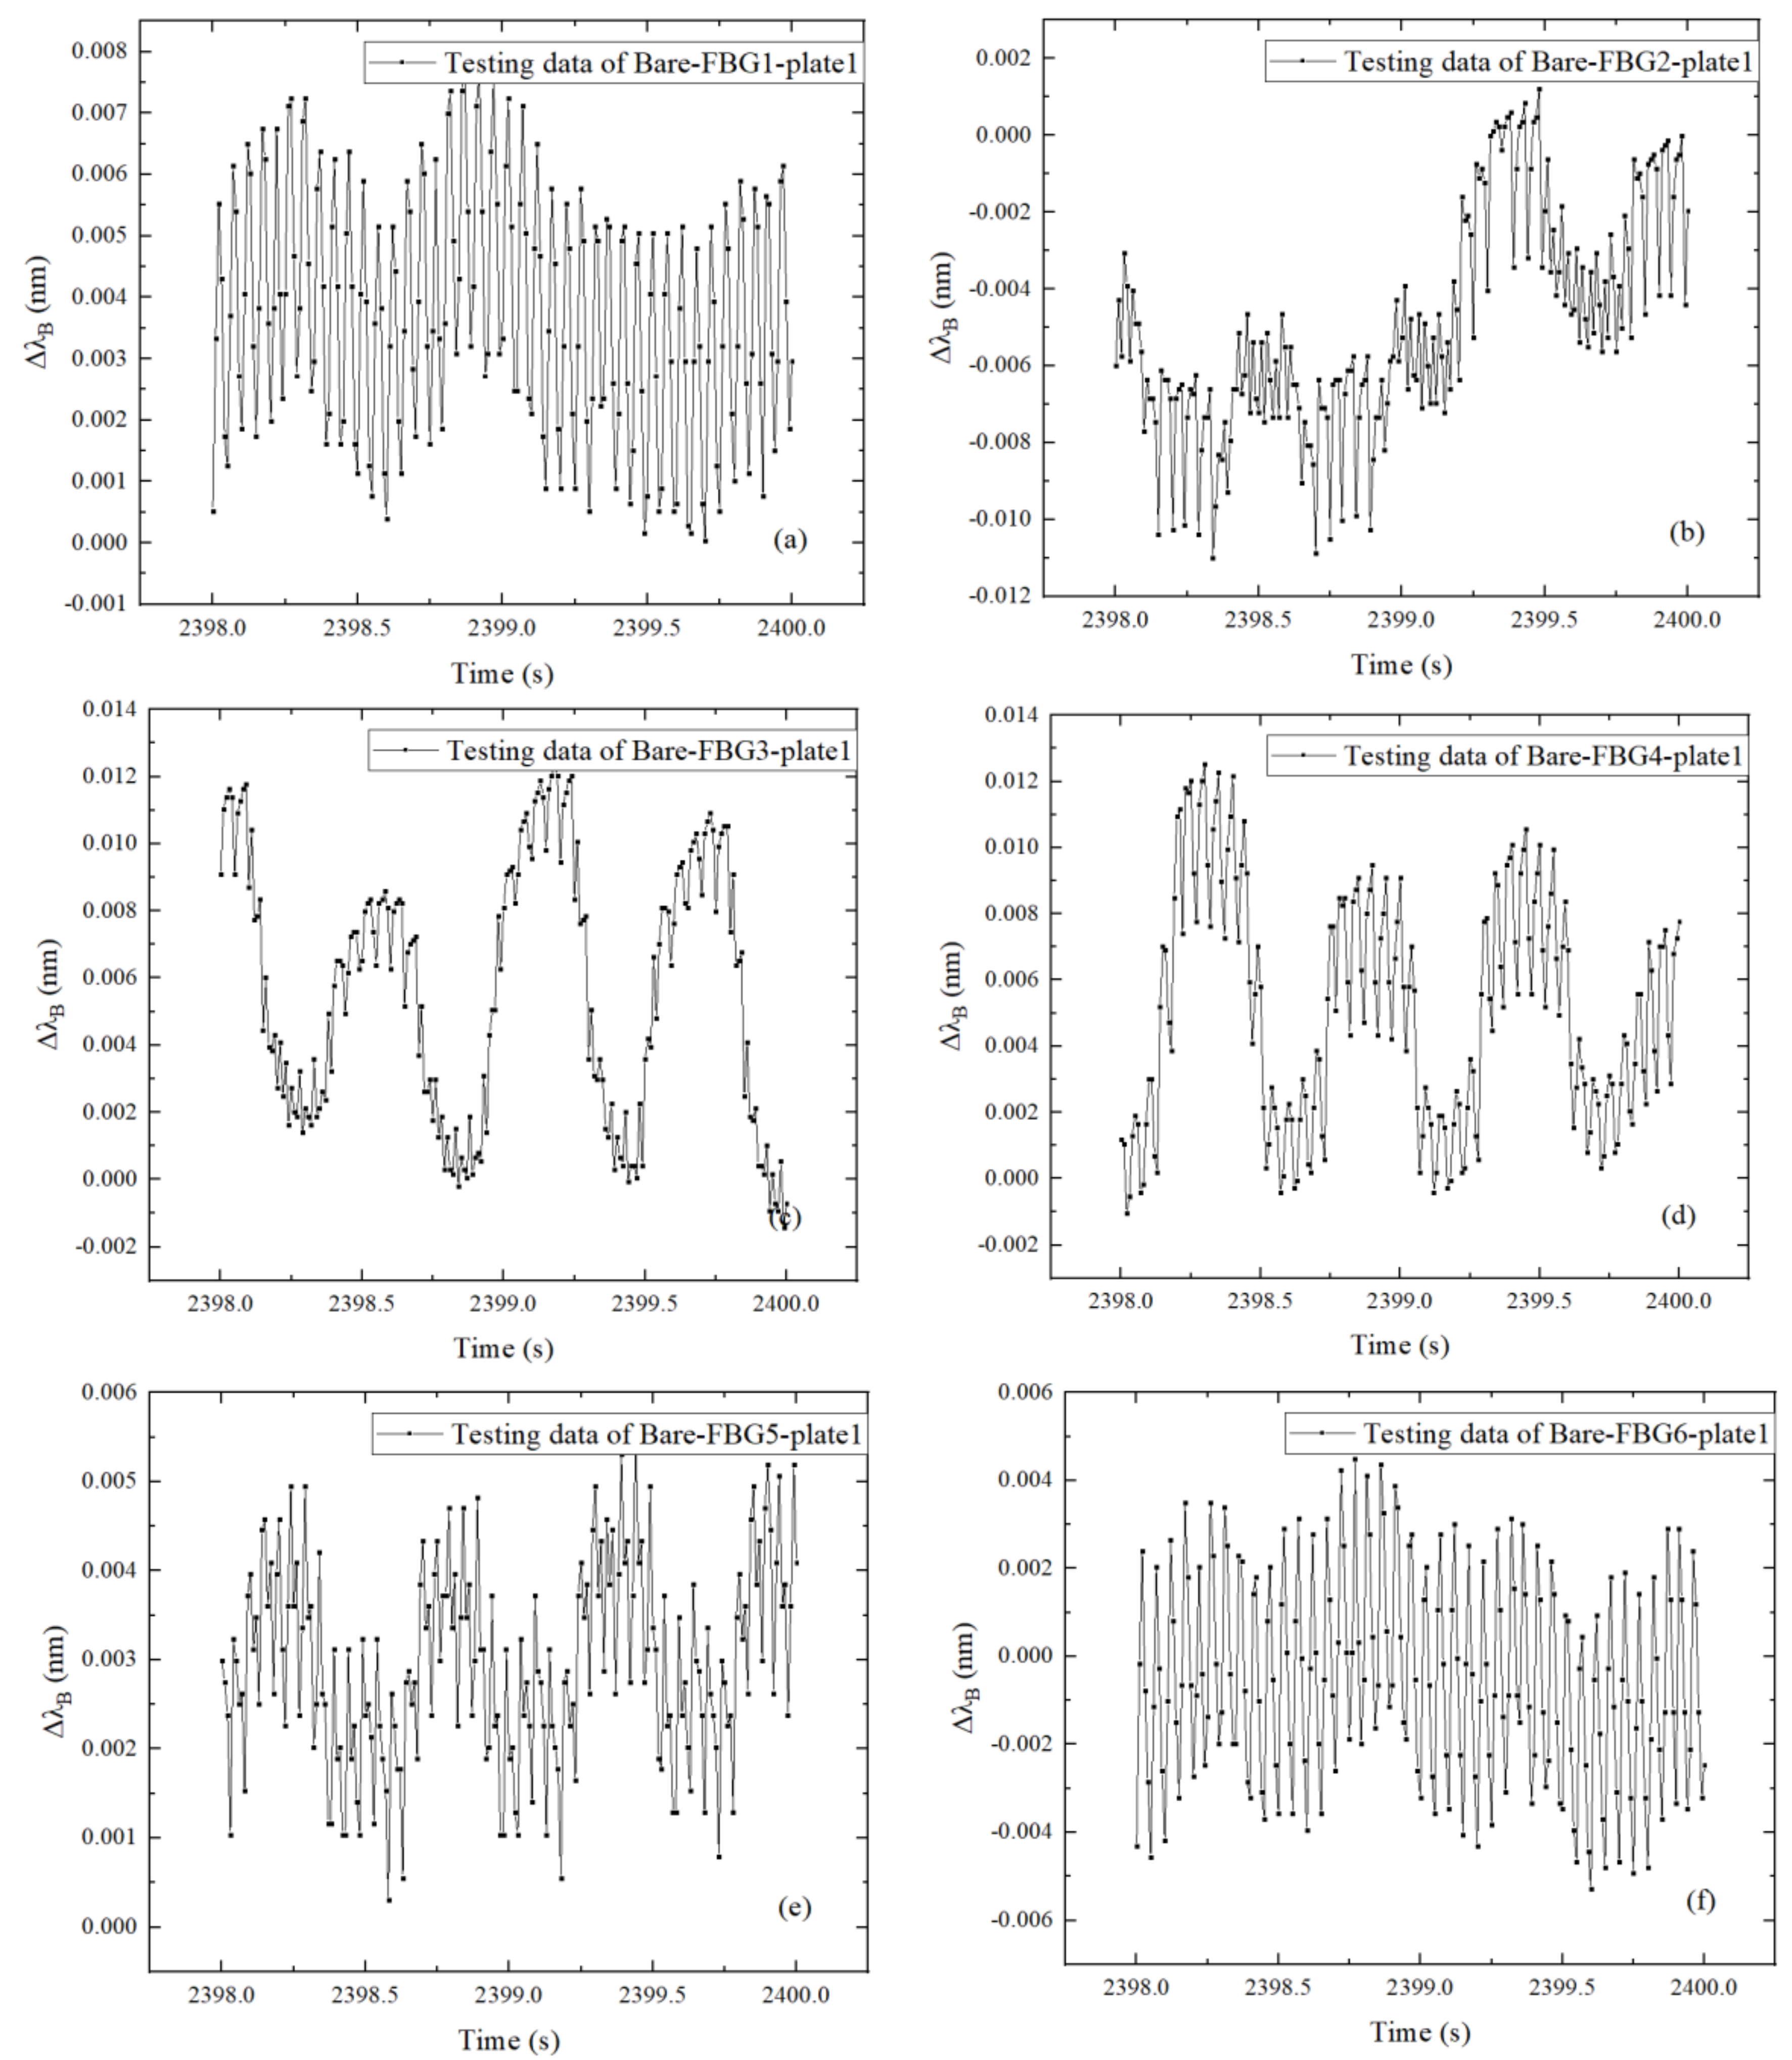
Figure 13.
Central wavelength increment with excitation frequency of 50 Hz: (a) Bare-FBG1-plate2; (b) Bare-FBG2-plate2; (c) Bare-FBG3-plate2; (d) Bare-FBG4-plate2; (e) Bare-FBG5-plate2; (f) Bare-FBG6-plate2.
Figure 13.
Central wavelength increment with excitation frequency of 50 Hz: (a) Bare-FBG1-plate2; (b) Bare-FBG2-plate2; (c) Bare-FBG3-plate2; (d) Bare-FBG4-plate2; (e) Bare-FBG5-plate2; (f) Bare-FBG6-plate2.


Figure 14.
Central wavelength increment with excitation frequency of 50 Hz: (a) Bare-FBG1-plate2; (b) Bare-FBG2-plate2; (c) Bare-FBG3-plate2; (d) Bare-FBG4-plate2; (e) Bare-FBG5-plate2; (f) Bare-FBG6-plate2.
Figure 14.
Central wavelength increment with excitation frequency of 50 Hz: (a) Bare-FBG1-plate2; (b) Bare-FBG2-plate2; (c) Bare-FBG3-plate2; (d) Bare-FBG4-plate2; (e) Bare-FBG5-plate2; (f) Bare-FBG6-plate2.
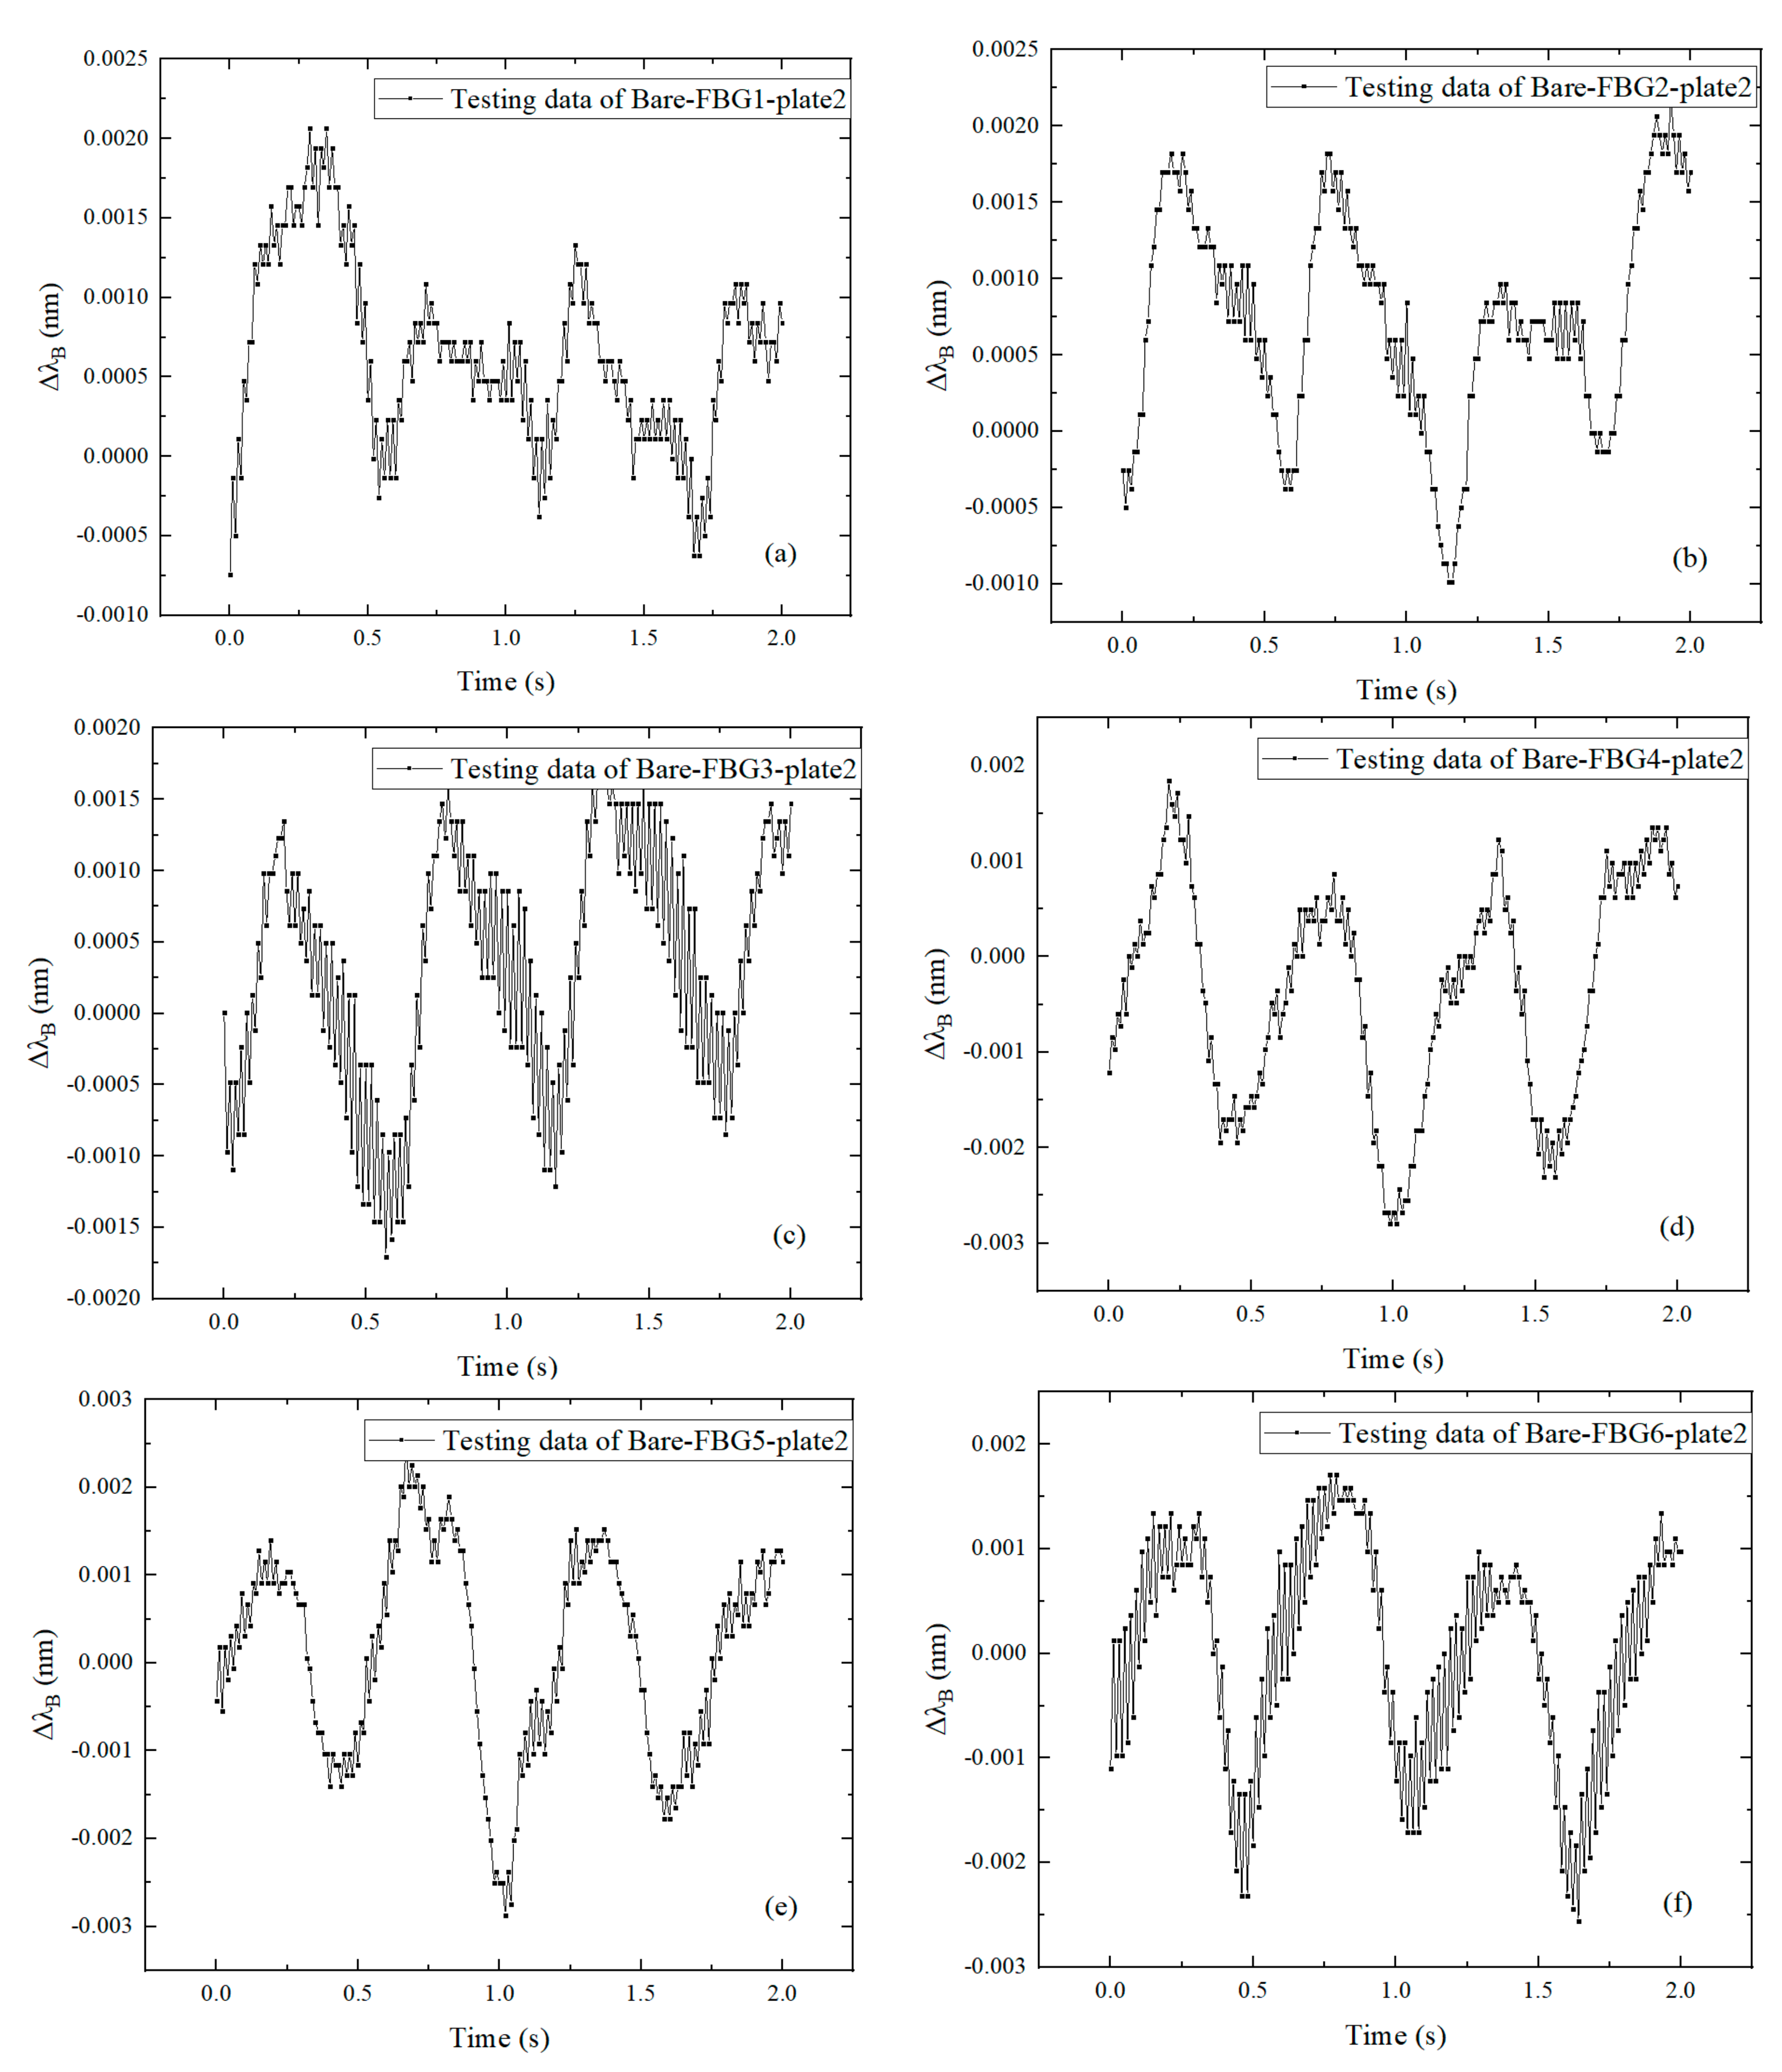
Figure 15.
Spectrums: (a) Theoretical value; (b) Testing value.

Figure 16.
Sensor layout of bilayer CFRP plate.
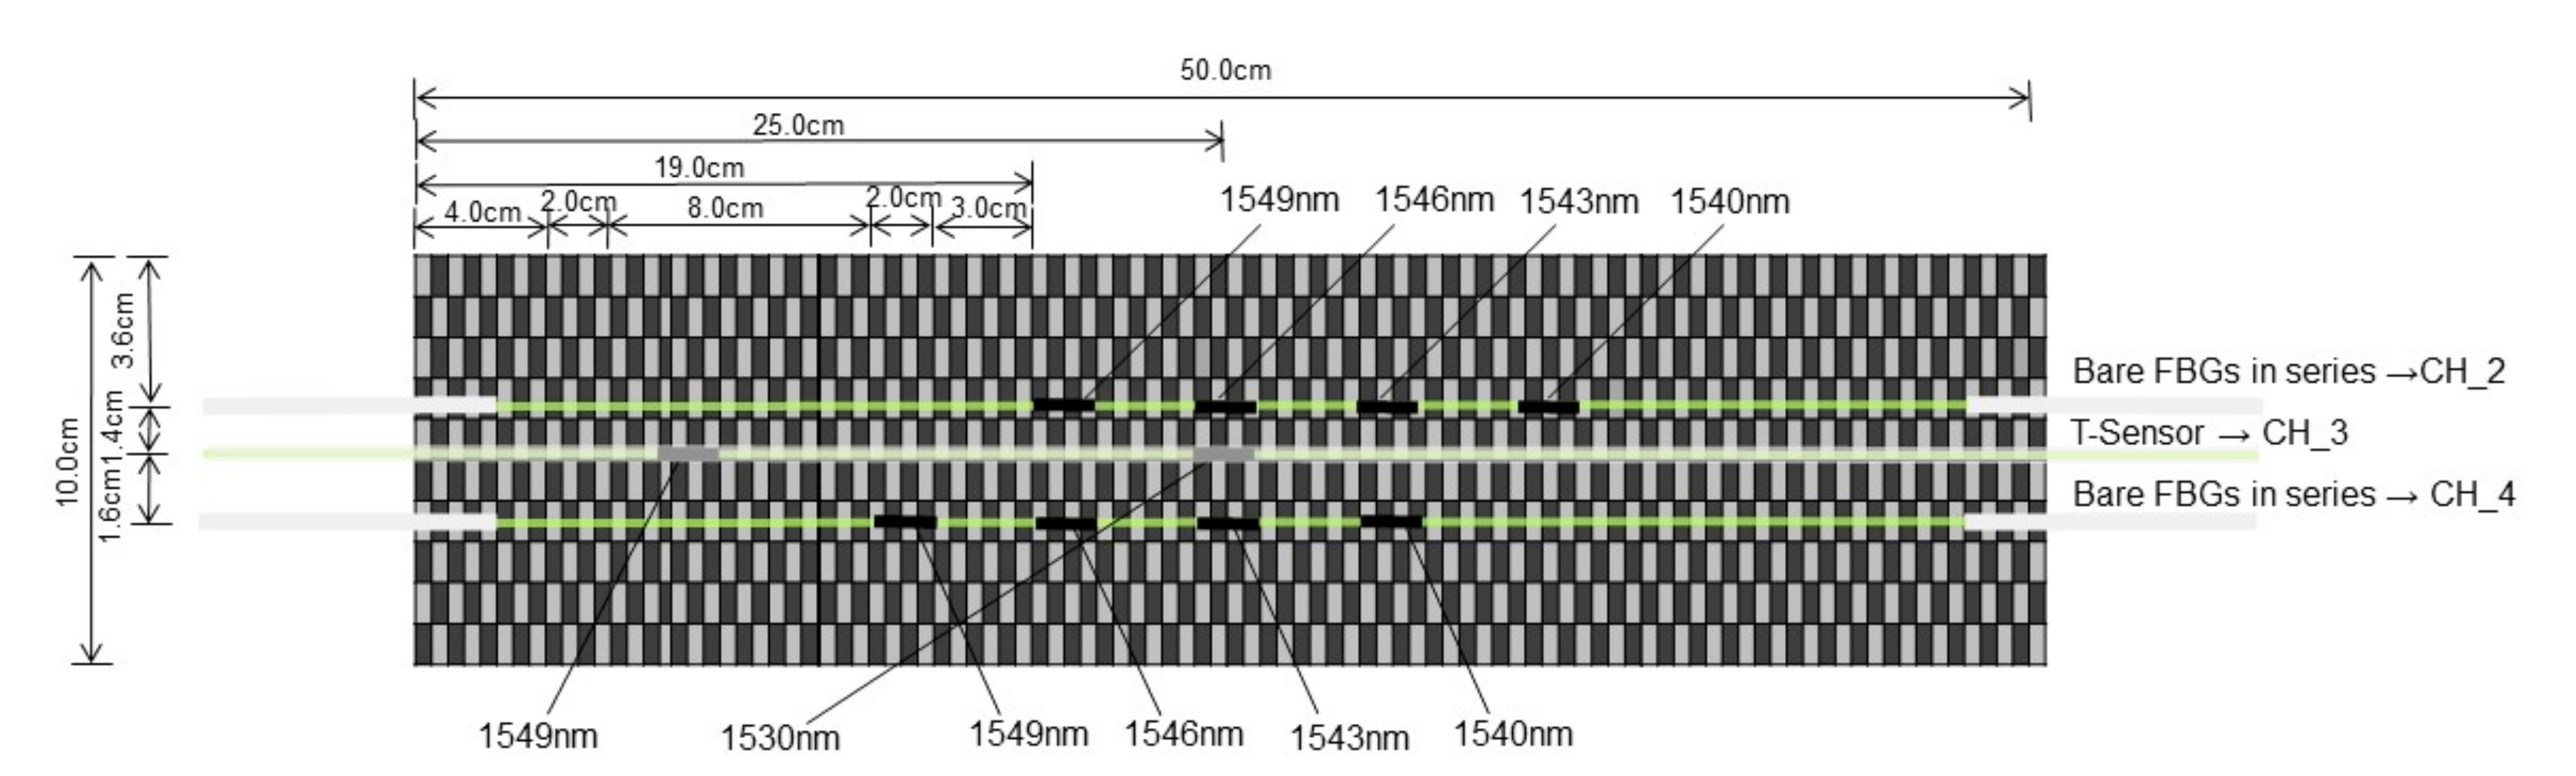
Figure 17.
Fabrication process of bilayer CFRP plate with FBGs embedded: (a) Sensor layout; (b) Curing process; (c) Temperature and strain measurement by the Optical system 200; (d) Bilayer CFRP plate with FBGs embedded.
Figure 17.
Fabrication process of bilayer CFRP plate with FBGs embedded: (a) Sensor layout; (b) Curing process; (c) Temperature and strain measurement by the Optical system 200; (d) Bilayer CFRP plate with FBGs embedded.

Figure 18.
Central wavelength increments during the curing process: FBGs in series CH_2 (a) 1549 nm, (b) 1546 nm, (c) 1543 nm, (d) 1540 nm.
Figure 18.
Central wavelength increments during the curing process: FBGs in series CH_2 (a) 1549 nm, (b) 1546 nm, (c) 1543 nm, (d) 1540 nm.

Figure 19.
Central wavelength increments during the curing process: FBGs in series CH_4 (a) 1549 nm, (b) 1546 nm, (c) 1543 nm, (d) 1540 nm.
Figure 19.
Central wavelength increments during the curing process: FBGs in series CH_4 (a) 1549 nm, (b) 1546 nm, (c) 1543 nm, (d) 1540 nm.
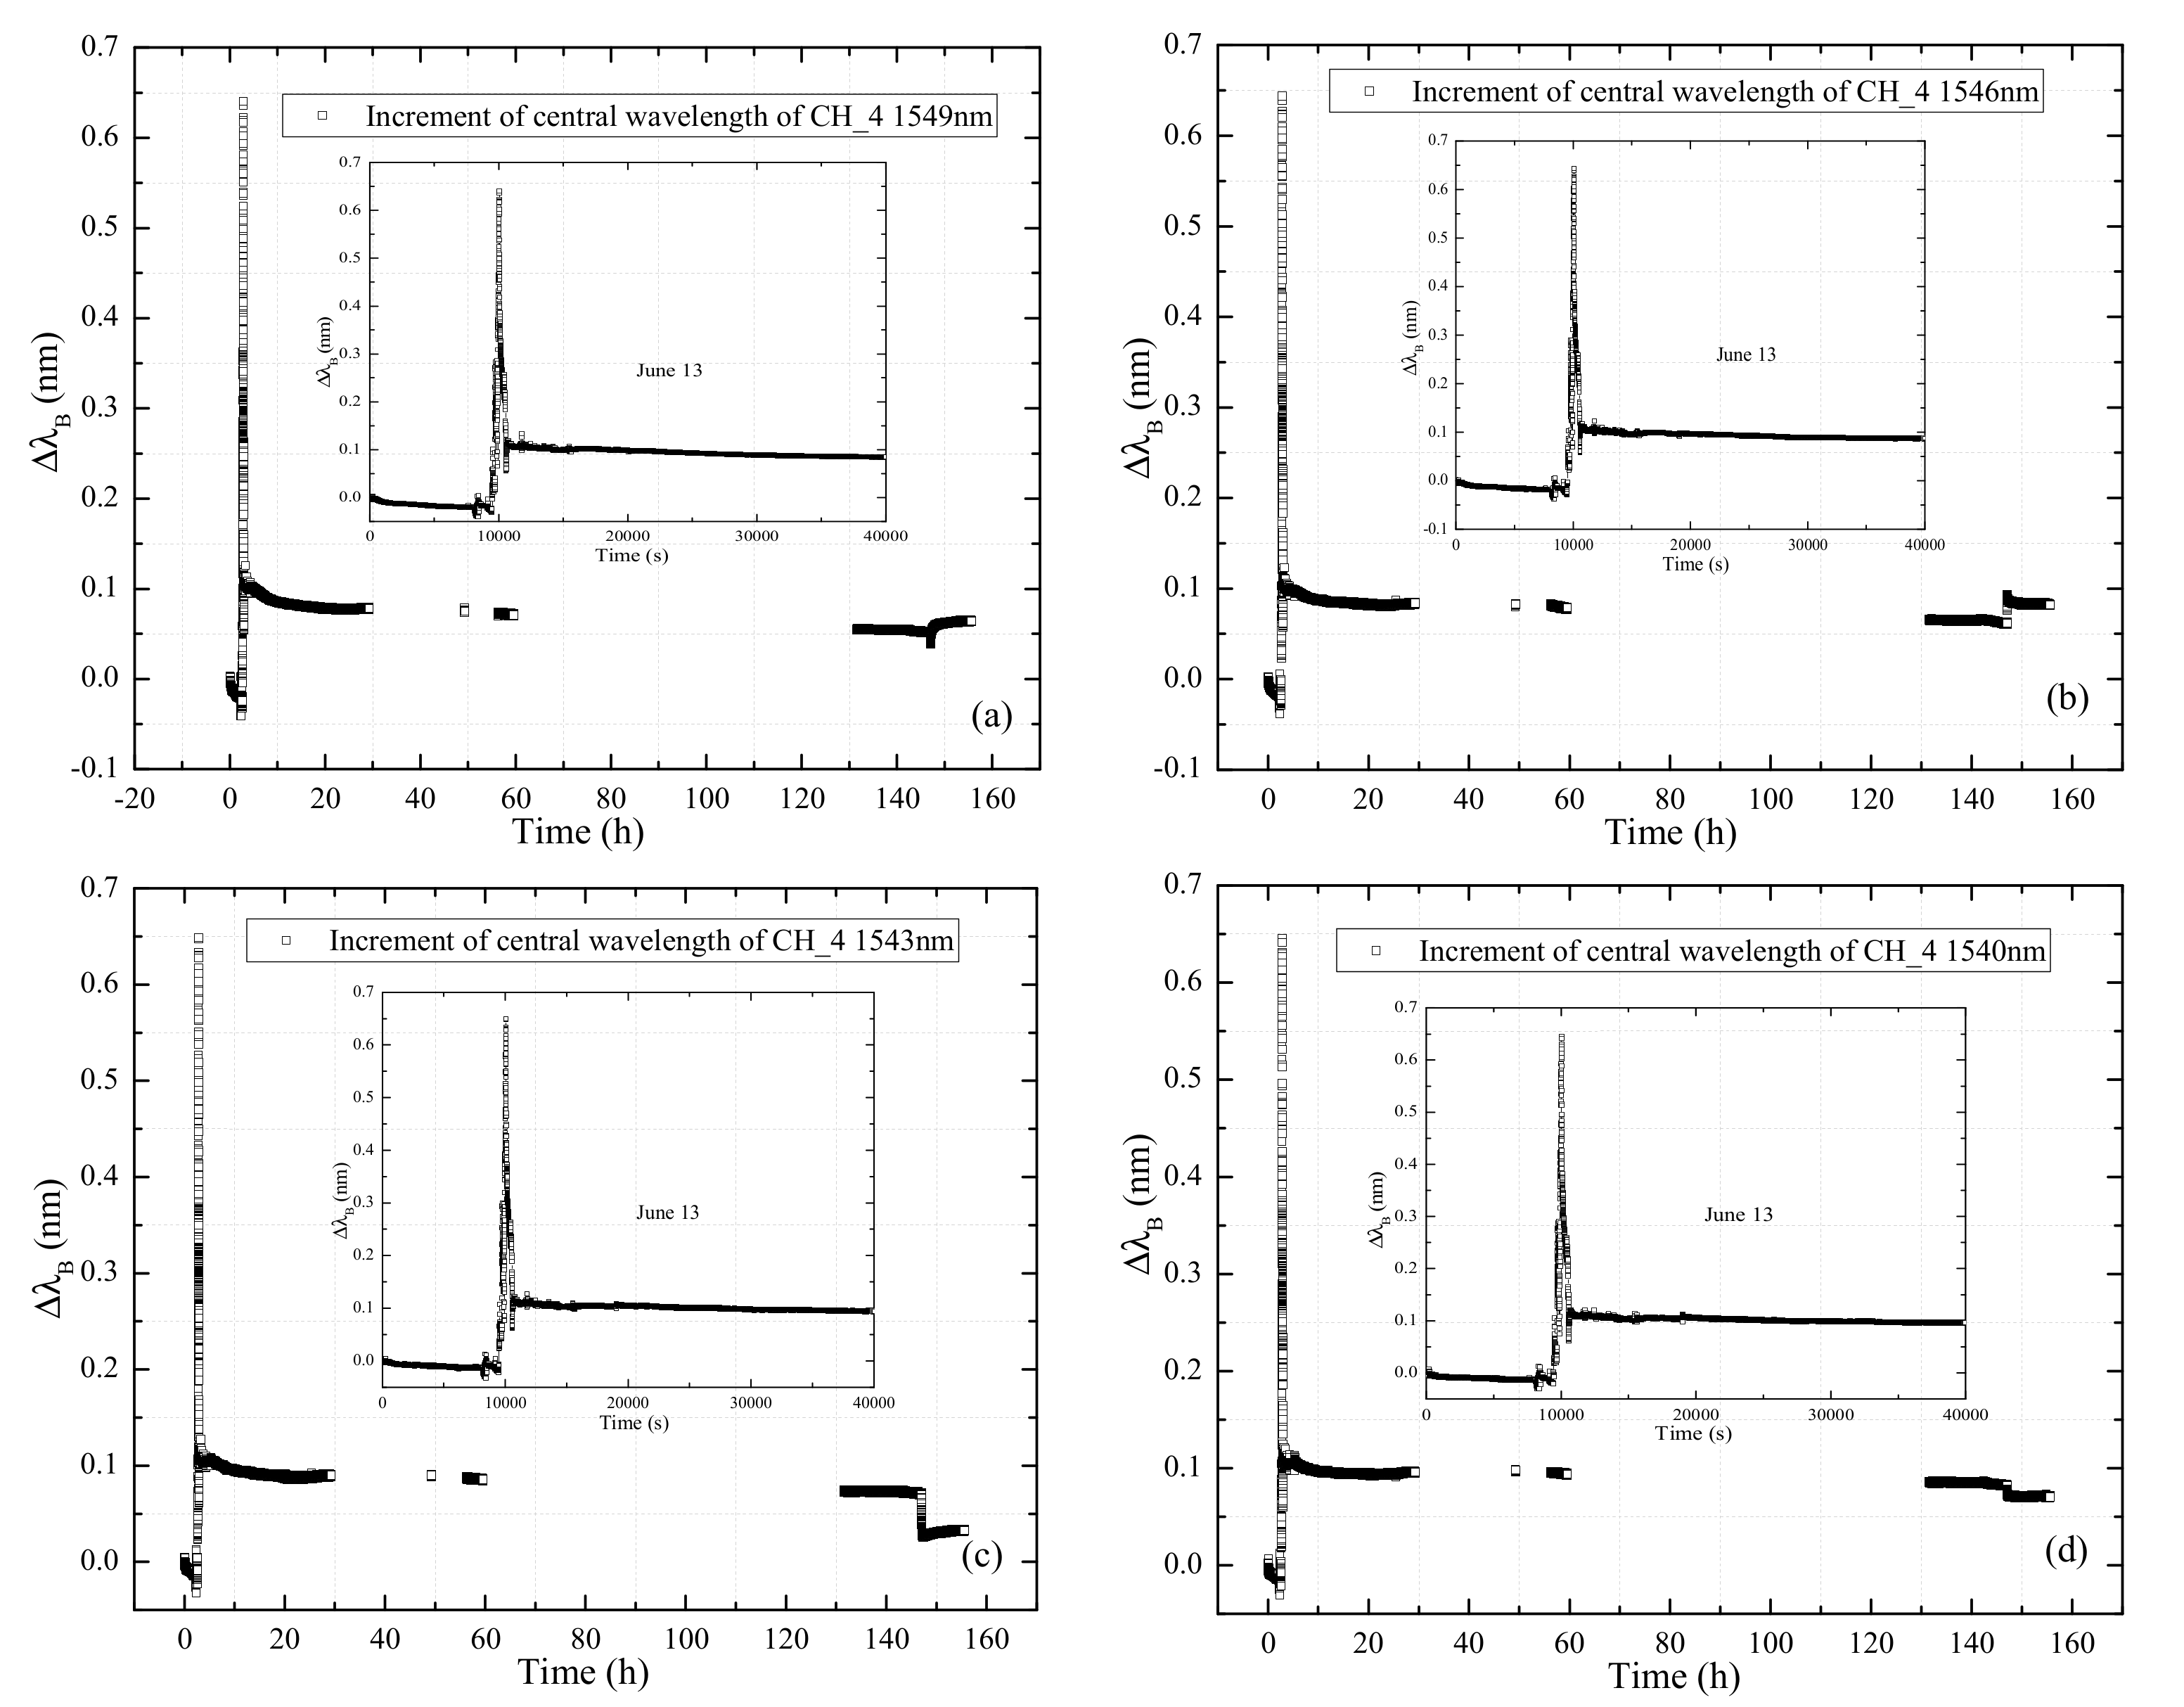
Figure 20.
Central wavelength increment during the curing process: T-sensor CH_3 (a) 1549 nm, (b) 1530 nm.
Figure 20.
Central wavelength increment during the curing process: T-sensor CH_3 (a) 1549 nm, (b) 1530 nm.
Publisher’s Note: MDPI stays neutral with regard to jurisdictional claims in published maps and institutional affiliations. |
© 2021 by the authors. Licensee MDPI, Basel, Switzerland. This article is an open access article distributed under the terms and conditions of the Creative Commons Attribution (CC BY) license (https://creativecommons.org/licenses/by/4.0/).
Share and Cite
MDPI and ACS Style
Wang, H.-P.; Chen, H.; Chen, C.; Zhang, H.-Y.; Jiang, H.; Song, T.; Feng, S.-Y. The Structural Performance of CFRP Composite Plates Assembled with Fiber Bragg Grating Sensors. Symmetry 2021, 13, 1631. https://doi.org/10.3390/sym13091631
AMA Style
Wang H-P, Chen H, Chen C, Zhang H-Y, Jiang H, Song T, Feng S-Y. The Structural Performance of CFRP Composite Plates Assembled with Fiber Bragg Grating Sensors. Symmetry. 2021; 13(9):1631. https://doi.org/10.3390/sym13091631
Chicago/Turabian StyleWang, Hua-Ping, Hao Chen, Cong Chen, Hu-Yuan Zhang, Hao Jiang, Tao Song, and Si-Yuan Feng. 2021. "The Structural Performance of CFRP Composite Plates Assembled with Fiber Bragg Grating Sensors" Symmetry 13, no. 9: 1631. https://doi.org/10.3390/sym13091631
Note that from the first issue of 2016, this journal uses article numbers instead of page numbers. See further details here.