
A Multi-Attention UNet for Semantic Segmentation in Remote Sensing Images

1
School of Electronics and Communications Engineering, North China University of Technology, Beijing 100144, China
2
School of Information and Electronics, Beijing Institute of Technology, Beijing 100081, China
3
Qian Xuesen Laboratory of Space Technology, China Academy of Space Technology, Beijing 100094, China
*
Author to whom correspondence should be addressed.
Symmetry 2022, 14(5), 906; https://doi.org/10.3390/sym14050906
Submission received: 26 March 2022
/
Revised: 20 April 2022
/
Accepted: 26 April 2022
/
Published: 29 April 2022
(This article belongs to the Special Issue Symmetry in Computer Vision and Its Applications)
Abstract
:In recent years, with the development of deep learning, semantic segmentation for remote sensing images has gradually become a hot issue in computer vision. However, segmentation for multicategory targets is still a difficult problem. To address the issues regarding poor precision and multiple scales in different categories, we propose a UNet, based on multi-attention (MA-UNet). Specifically, we propose a residual encoder, based on a simple attention module, to improve the extraction capability of the backbone for fine-grained features. By using multi-head self-attention for the lowest level feature, the semantic representation of the given feature map is reconstructed, further implementing fine-grained segmentation for different categories of pixels. Then, to address the problem of multiple scales in different categories, we increase the number of down-sampling to subdivide the feature sizes of the target at different scales, and use channel attention and spatial attention in different feature fusion stages, to better fuse the feature information of the target at different scales. We conducted experiments on the WHDLD datasets and DLRSD datasets. The results show that, with multiple visual attention feature enhancements, our method achieves 63.94% mean intersection over union (IOU) on the WHDLD datasets; this result is 4.27% higher than that of UNet, and on the DLRSD datasets, the mean IOU of our methods improves UNet’s 56.17% to 61.90%, while exceeding those of other advanced methods.
1. Introduction
In recent years, with the development of computer technology and artificial intelligence, image segmentation tasks have gradually become important elements of computer vision [1,2,3]. Semantic segmentation for remote sensing images is a popular branch of image segmentation tasks. Geospatial object segmentation [4] in remote sensing images, as a special semantic segmentation task, can be widely used in typical task scenarios, such as sea and land segmentation [5], old city transformation [6], building mapping [7], road extraction [8], and vegetation cover assessment [9]. Semantic image segmentation classifies each pixel in an image into a corresponding class to achieve pixel-level classification, which constitutes a fundamental problem in computer vision, together with typical tasks, such as motion estimation, image classification, target detection, and target tracking. However, making machines learn to segment targets in remote sensing images is still a daunting task, and a series of classic methods have been gradually created with the advancement of technology and the innovation of researchers.
Traditional image segmentation methods cut an image into smaller areas based on its grayscale, color, texture and shape features to form similarities within smaller areas, and to differentiate between these smaller areas; but the accuracy of these traditional image segmentation methods is relatively low, and they cannot perform pixel-level segmentation. Most of these segmentation methods are based on thresholding, edge or graph theory segmentation. For example, based on the position invariance, scale invariance and rotation invariance of an image, a combination of AIR and SIFT algorithms [10] was proposed to achieve segmentation and alignment for remote sensing images. Wang, Y. et al. proposed a watershed segmentation method [11], combining multiscale morphological gradient reconstruction and marker extraction, based on threshold theory; In addition to the threshold method, a graph-based optimization algorithm, combined with region features, aims to efficiently solve the image segmentation problem [12]. With the development of machine learning, researchers have achieved image classification via hand-crafted features, and, compared to traditional methods, machine learning methods are more adaptable to performing feature extraction for different images. In machine learning, the Histogram of Oriented Gradient (HOG) [13] is widely used in feature design. Dong, C. et al. proposed a method to detect ships by using a gradient histogram for remote sensing images [14] and achieved an accuracy of 97%. Qi, S. et al. proposed an unsupervised ship detection approach based on saliency and S-HOG descriptors from optical satellite images [15], and it demonstrates good performance compared to state-of-the-art methods.
The advent of deep learning has had a significant impact on image segmentation methods. Convolutional neural networks (CNNs) [16] use an end-to-end approach to train the model, i.e., after the structure of the model is designed, it is only necessary to input the images and their corresponding labels to get the final model, which is different from the way of designing features manually in machine learning, and greatly simplifies the process of manually designing features. CNNs have a strong ability to mine spatial contextual information. CNNs-based image segmentation methods do not require hand-crafted features, and the model has better ability to automatically mine and integrate features, which is why more and more algorithms adopt CNNs. Long et al. made some modifications to a CNN, based on the classification task, by removing the fully connected layer that condenses the semantic representation obtained from the classification network and proposing a fully convolutional network [17] to enable end-to-end pixel-level classification for the first time, and it achieved improved segmentation of PASCAL VOC (30% relative improvement to 67.2% mean IOU on PASCAL VOC 2012). After that, a large number of classical segmentation models have emerged, such as UNet [18], PSPNet [19] and Deeplab [20]. UNet is a symmetric U-shaped network for encoding and decoding, aiming to focus on recovering information lost during convolutional down-sampling, and it achieves, without any further preprocessing or postprocessing, a warping error of 0.0003529 and a rand error of 0.0382 on EM datasets. PSPNet is a pyramid scene parsing network for the multiscale problem, and it yielded a new record of mIoU accuracy of 85.4% on PASCAL VOC 2012. DeepLab is another typical architecture for semantic segmentation. Its representative approach is a multiscale design based on dilated convolution, which eliminates repetitive up-sampling structure. On the PASCAL VOC 2012 semantic image segmentation task, Deeplab reaches 79.7% mean IOU.
However, these algorithms are not ideal when applied directly to remote sensing images. Remote sensing images have some difficulties, such as complex backgrounds and large levels of noise, and many categories need to be segmented in remote sensing images, such as buildings, vehicles, pedestrians, vegetation, water sources, etc. Furthermore, the features and scales vary greatly between different categories. Researchers further improved typical algorithms to adapt to the segmentation of remote sensing images [21,22,23,24,25]. Among these improvements, the most representative improved models are based on UNet: UNet++ [26], Attention UNet [27] and Trans-UNet [28]. UNet++ is a deep supervised network based on encoder-decoder. The encoder and decoder subnetworks perform feature fusion through a series of nested, dense skip connections to reduce the semantic loss between the feature mappings. Unlike the UNet++ stack subnetwork, Attention UNet and Trans-UNet enable the model to pay attention [29,30,31,32] to detailed information of features and enhance the mapping and expression of features, by adding an attention mechanism to the encoder and decoder. They are state-of-the-art models in different segmentation tasks at present.
For remote sensing images, many difficulties are still faced in terms of segmenting multicategory targets. Current segmentation networks have fewer backbone layers and relatively poor feature extraction abilities, which leads to low accuracy when segmenting adjacent pixels between different categories in complex scenes. Moreover, the multiple scales in different categories of targets in remote sensing images lead to poor segmentation for targets of different scales in the same image. To solve these two problems, we propose a UNet based on multiple attention mechanisms, named multi-attention UNet (MA-UNet). We incorporate various attention mechanisms into UNet, including the newly popular multi-head self-attention mechanism of the transformer, to enhance the semantic representations of features through multiple dimensions. The implementation code is avalilable on the following Github Link (https://github.com/1343744768/Multiattention-UNet, accessed on 25 March 2022). The improvements are specified as follows:
- We add a residual structure in the backbone to alleviate the gradient disappearance problem and enhance the generalization performance of the backbone. To further improve the extraction capability of the backbone for fine-grained features, a simple attention module is used in the residual unit, without increasing the computational effort;
- We increase the number of down-sampling once (from the original 16-fold down-sampling process of UNet to 32-fold down-sampling) and use multi-head self-attention for the lowest level feature to rebuild the feature map and enhance the semantic representation of each feature point on the feature map. This improves the refinement of pixel segmentation between different categories;
- To solve the problem regarding multiple scales in different categories, we use a channel attention module and a spatial attention module in the feature fusion stage at different scales to better fuse the feature information of targets at different scales;
- To address the problem of unbalanced target categories among multiple categories, we use weighted cross-entropy loss (WCE loss) to ensure the model focuses more on categories with smaller sample sizes.
2. Methods
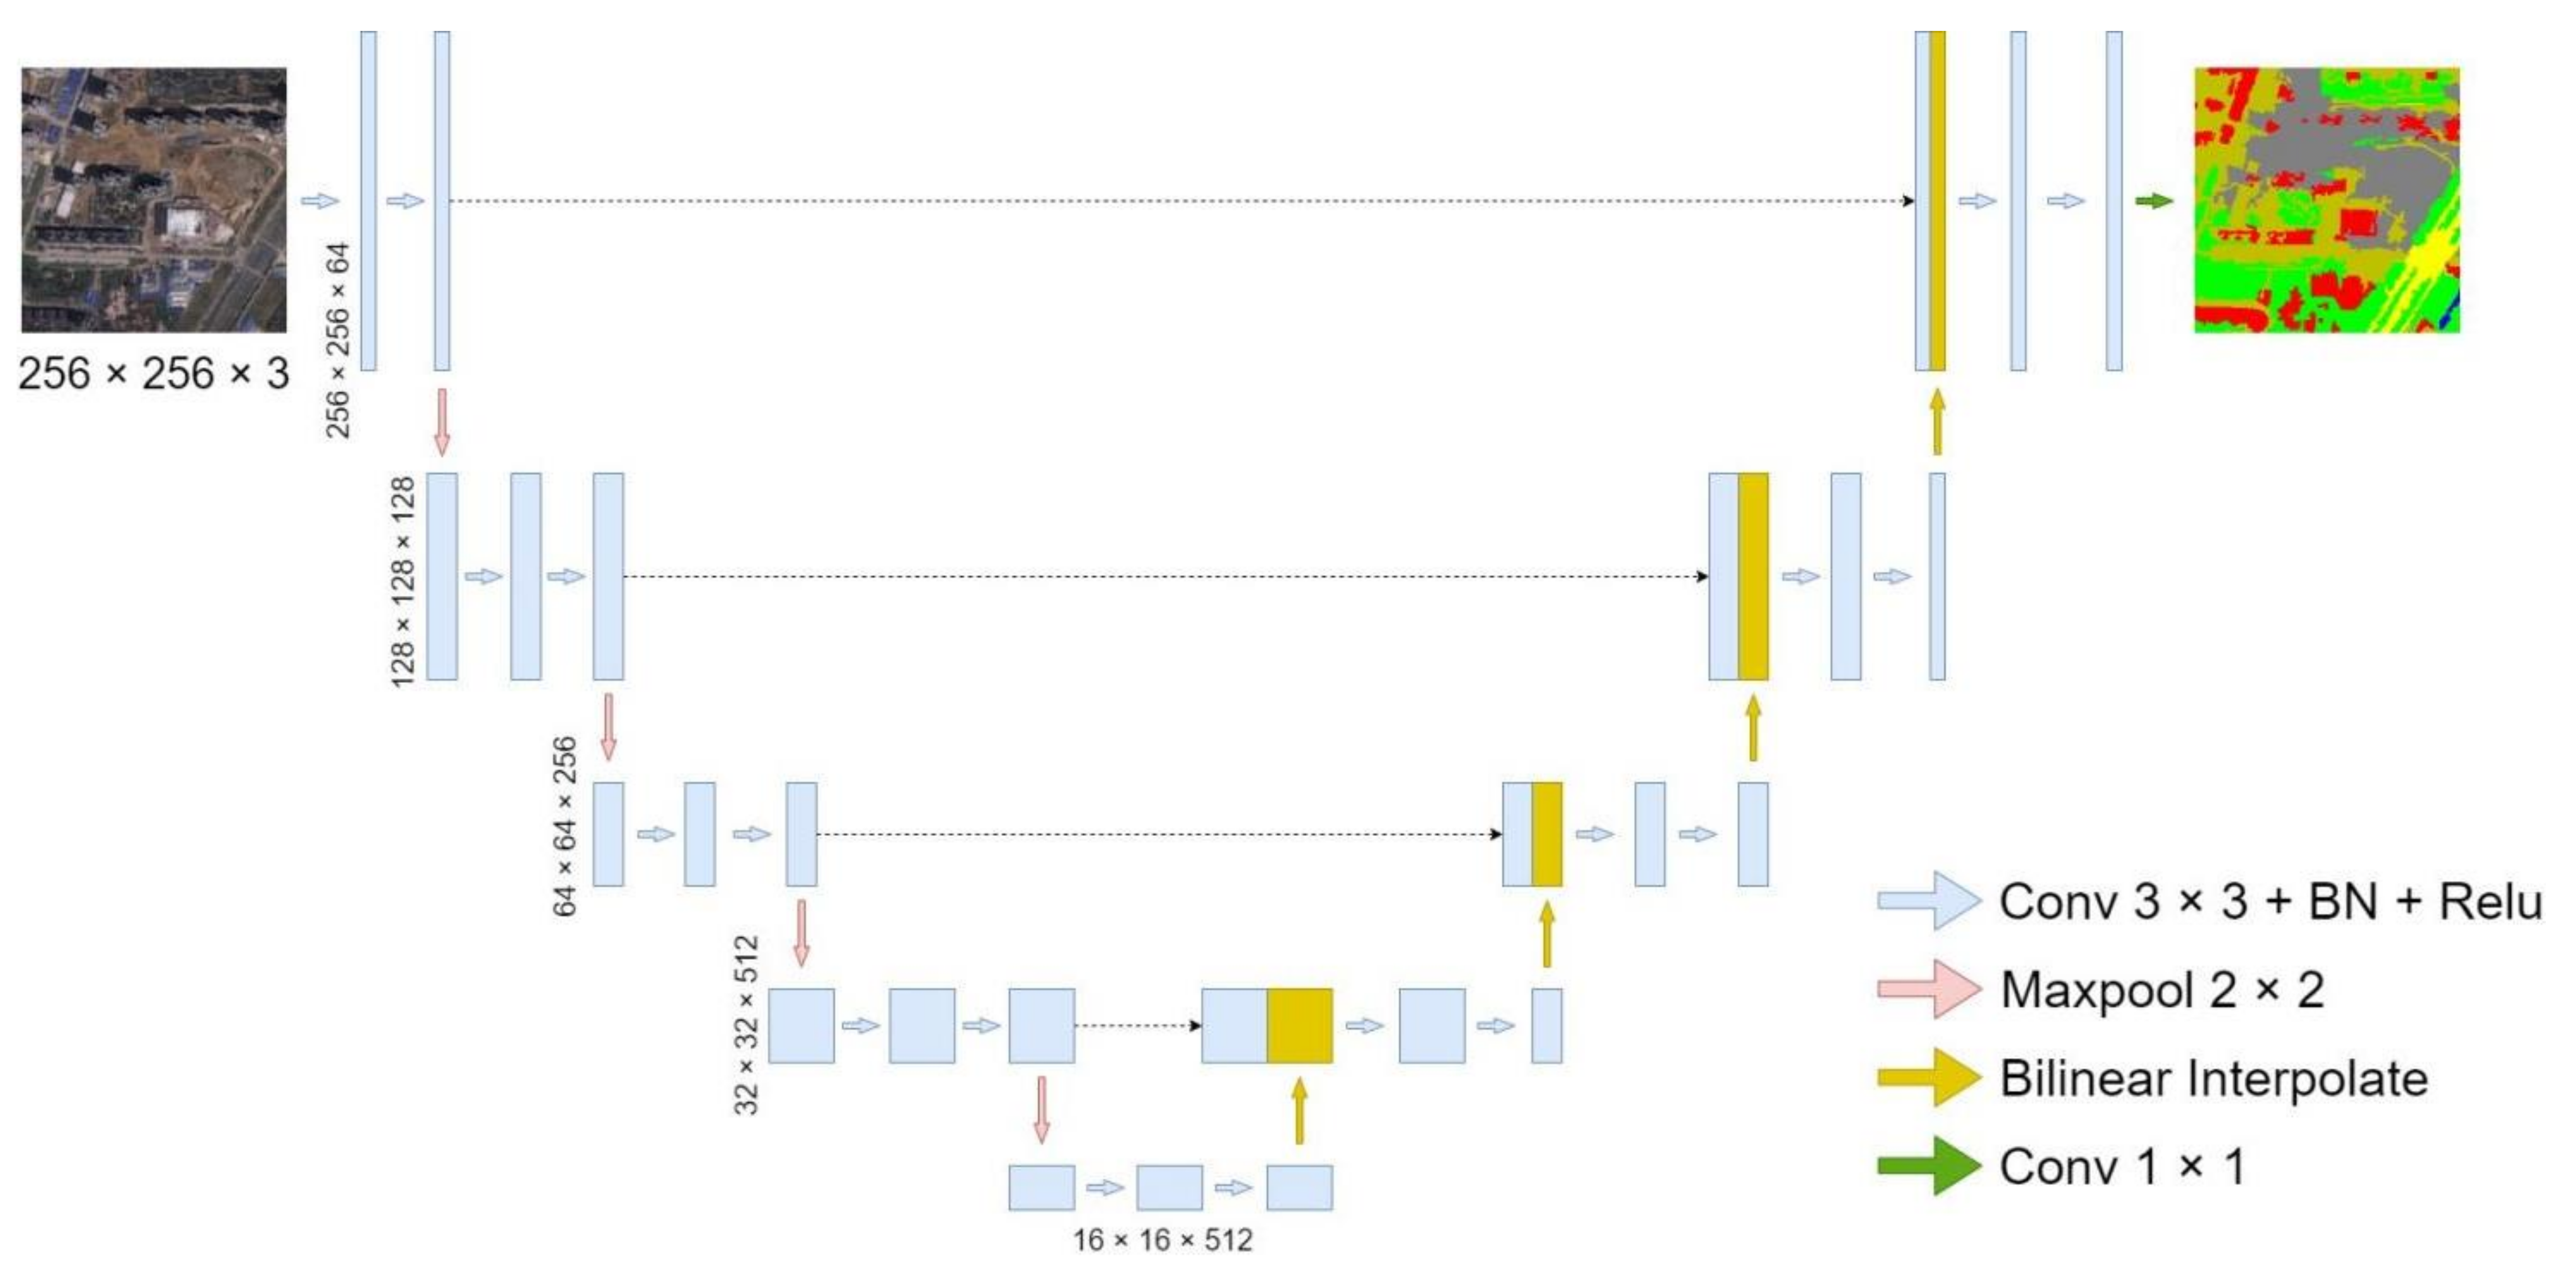
We used UNet as the baseline for the structural design of our model. UNet uses a typical encoder-decoder structure, i.e., after continuous convolution and down-sampling are performed by the encoder, feature maps with small resolutions, but condensed high dimensional semantic representations, are generated. Then, the decoder is continuously convolved and up-sampled to the original size to obtain a segmentation result. UNet has five scales of feature maps; the first four scales of the feature maps are fused with the lower-level features by skip connections after up-sampling at the decoding end. The lowermost feature map is down-sampled 16 times, compared with the original map, and contains high dimensional semantic features. The segmented image is finally generated after continuous up-sampling, and feature fusion. The UNet structure is shown in Figure 1.
We added a variety of improved attention modules, based on UNet, and proposed multi-attention UNet (MA-UNet). In this section, we first introduce the structure of MA-UNet, giving the figure of its overall structure, then we introduce the construction method of each attention module and its function step-by-step, and finally we introduce our improved loss function.
2.1. Structure of MA-UNet
Based on the UNet structure, we introduced four attention modules and proposed MA-UNet. We used a residual structure and a simple attention module (simAM) to construct the encoder and build an attention-based residual encoder, to improve the fine extraction ability of the backbone for target features. By using a 3 × 3 convolution, with a step size of 2 and a padding of 1, instead of max pooling for down-sampling, we reduced detail loss incurred due to max pooling, and increased the number of down-sampling once (from the original 16-time down-sampling process to 32-time down-sampling), to improve the feature extraction capability of the network for large scale targets. We used multi-head self-attention for the lowest level feature to rebuild the feature map and enhance the semantic representation of each feature point on the feature map. Unlike the general encoder and decoder, MA-UNet performs feature enhancement on features after the skip connections, by using an attention module. We argue that the shallow features, because of their relatively large feature map resolutions and spatial feature distribution, have a greater impact on feature fusion, so spatial attention is utilized to integrate the fused features at the first three scales. High dimensional features tend to be compressed in channels, so fused features are integrated by using channel attention at the last two scales. The overall network structure is shown in Figure 2, and the attention module in the network is described in detail in subsequent subsections.
2.2. Residual Encoder Based on Attention
The residual structure first appeared in ResNet [33,34], effectively solving problems such as gradient disappearance and gradient explosion, due to the deepening of the network. Two kinds of structures are generally available: the ordinary residual structure, shown in Figure 3a, and the improved bottleneck structure of the residual, shown in Figure 3b. Since MA-UNet increases the number of down-sampling once, which deceptively increases the network depth, it is necessary to delay the gradient disappearance process during backpropagation, via the residual structure.
Although the residual structure, based on bottlenecks, reduces the number of operations, we used the normal residual structure, because MA-UNet does not stack many residual layers and the original UNet encoder also uses two 3 × 3 convolutions for each scale of the feature layer. However, the residual structure alone cannot significantly improve the feature extraction performance of the encoder, and, to prevent further increase in the computational effort of the encoder, we added a simple parameter-free attention module (simAM) to the residual structure. After the feature map is convolved, the importance of each neuron needs to be evaluated, and simAM infers the attention weights from the energy function. In detail, the approach is as follows:
- We obtain the feature space mean d based on the input feature map X, as shown in Equation (1);
- We find the variance of the feature map width and height in its channel direction based on the feature space mean d, as shown in Equation (2);
- We obtain the energy distribution of the feature map, as shown in Equation (3), where q is the energy factor;
- Finally, the enhanced feature map is obtained, as shown in Equation (4).
The residual structure based on simAM is formed by adding simAM behind the 3 × 3 convolution kernel in the residual structure, as shown in Figure 4. Ultimately, the encoder of the MA-UNet consists of five residual blocks, based on simAM, and five convolution kernels, with step sizes of 2.
2.3. Feature Map Reconstruction Based on Multi-Head Self-Attention
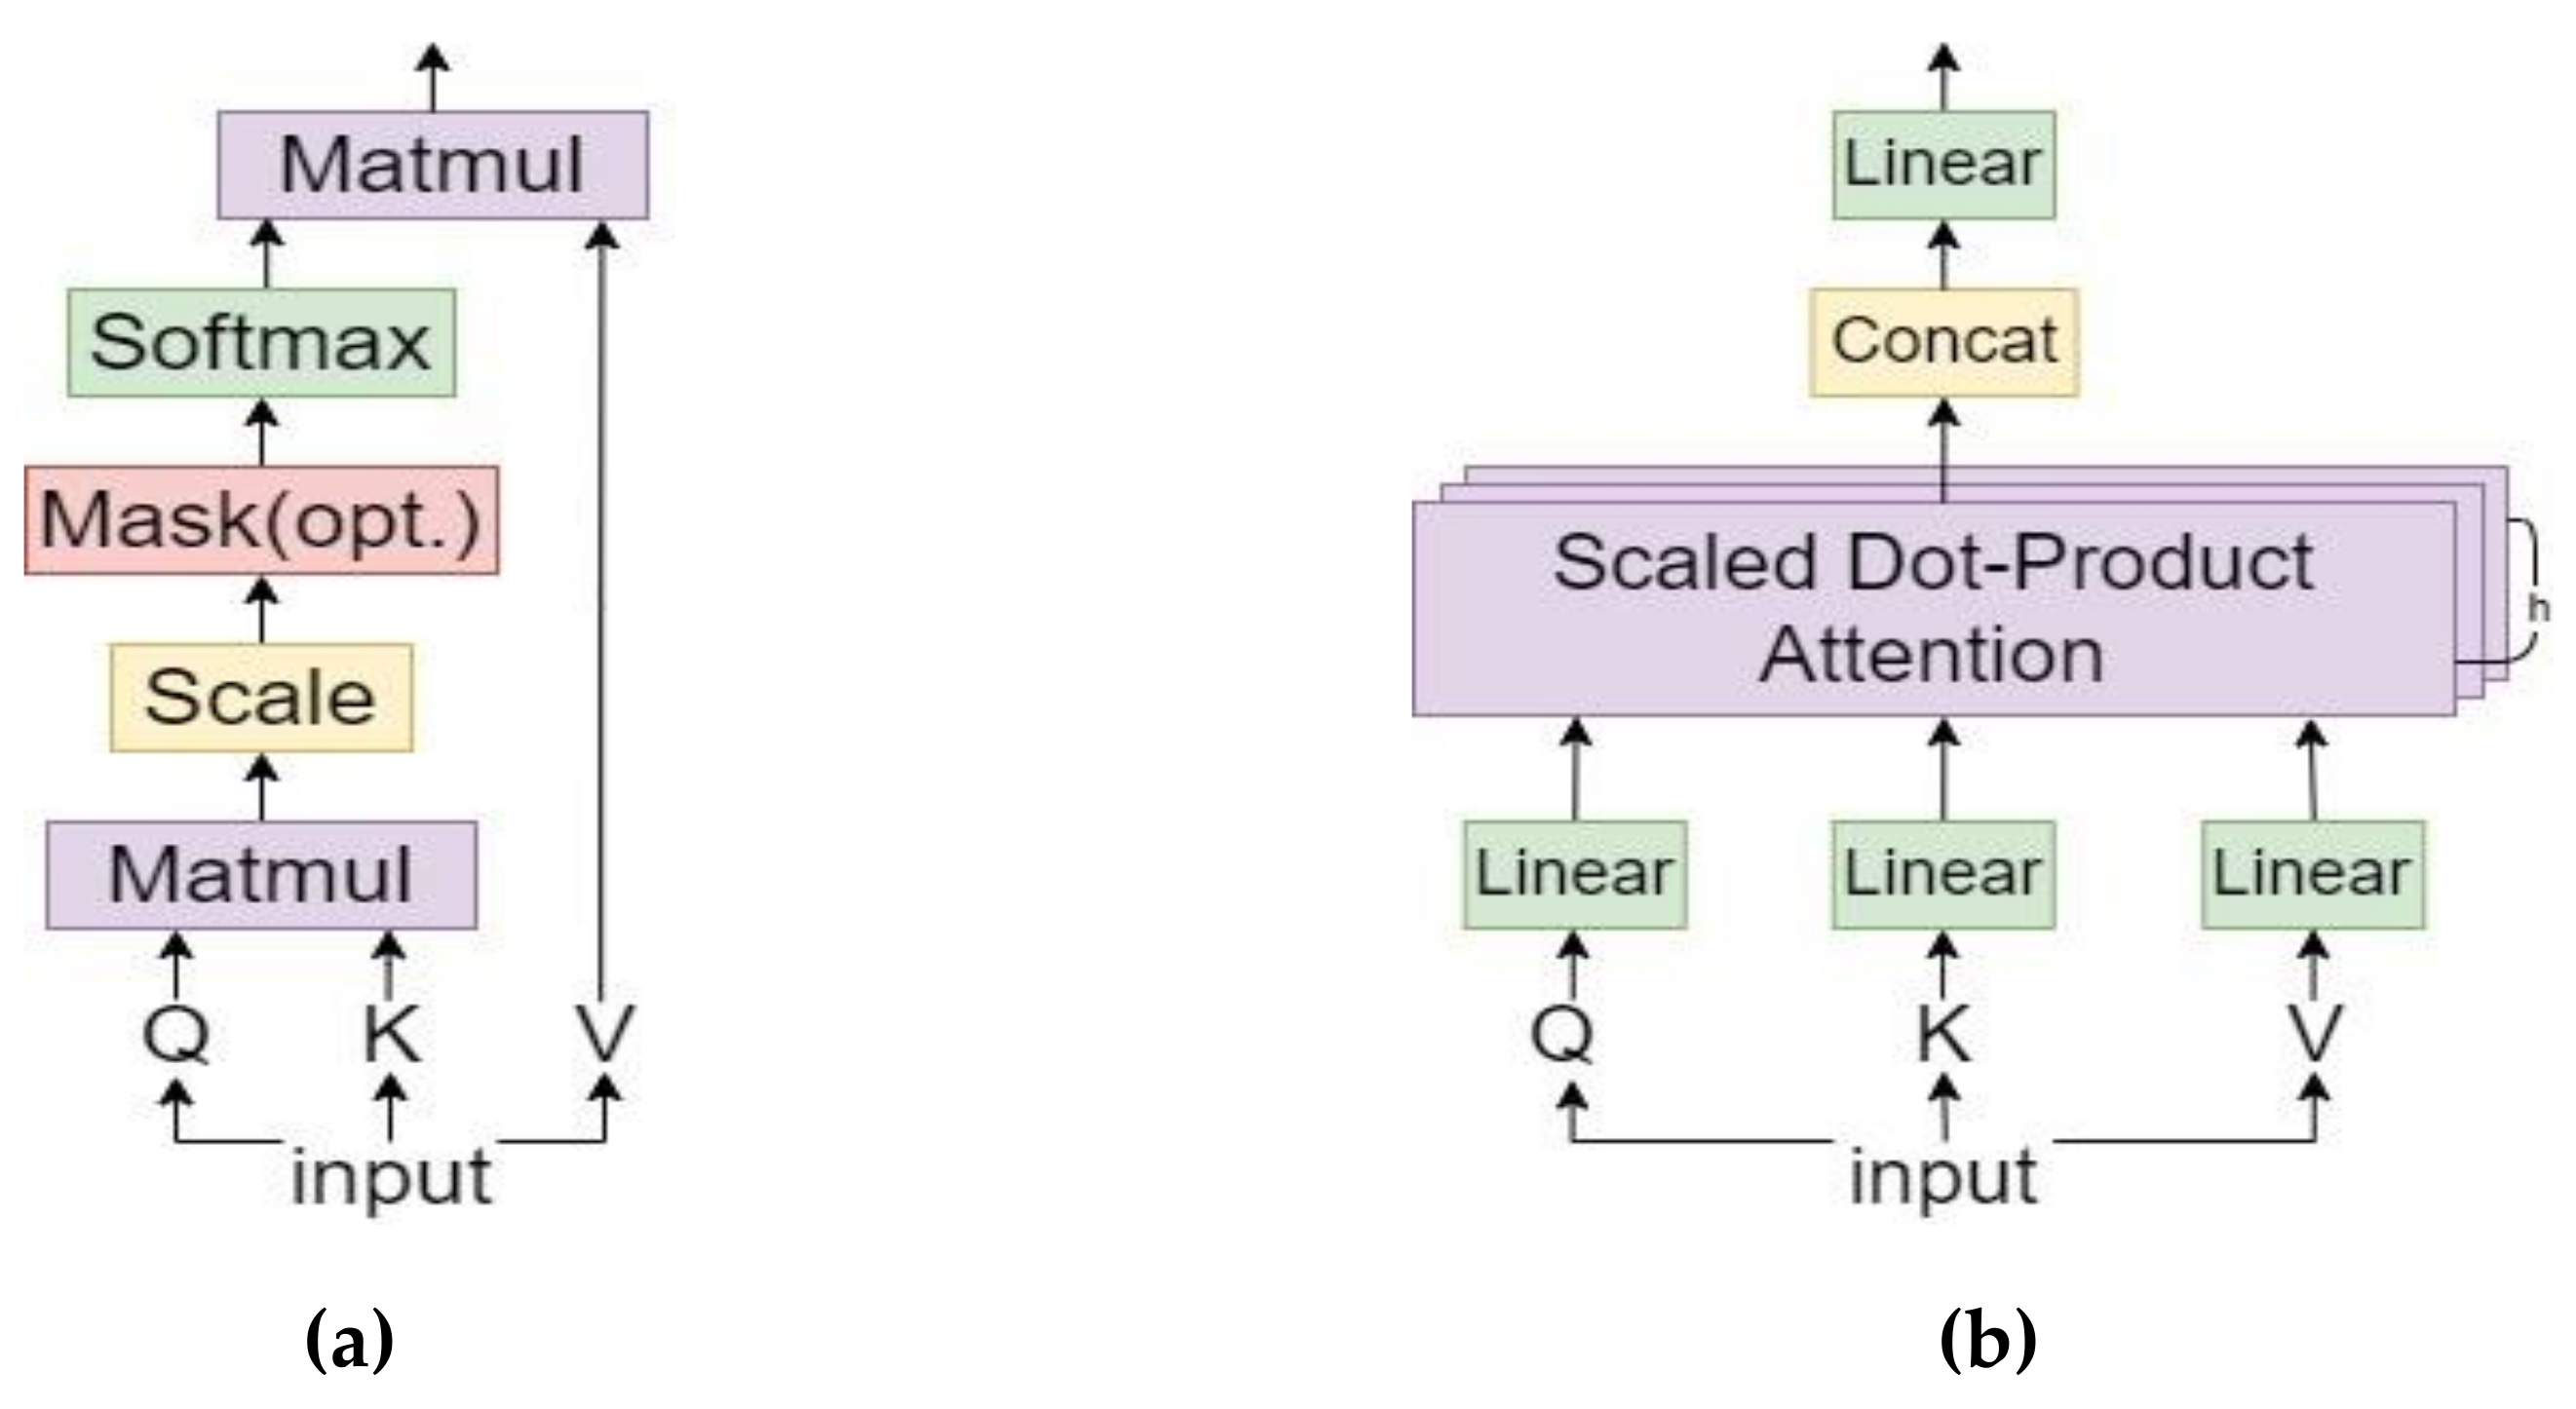
After 5 convolutions and 5 down-sampling operations, for an image with an input size of 256 × 256 × 3, the final feature map size was 8 × 8 × 512, i.e., only 64 pixels per dimension, and the perceptual field, corresponding to the high dimensional features, was relatively large. To further improve the correlation and globalization between the feature points, we reconstructed the feature map, via multi-head self-attention (MSA). The specific approach involved the generation of a query vector, a key vector and a value vector for the input vector through the fully connected layer. The query vector queries all the candidate locations to find the vector that is most closely related to itself, and each candidate location has a pair of key vectors and value vectors. The process of querying is the process of calculating the dot product between this vector and the key vectors of all candidate positions. The result of the dot product operation was weighted to the respective value vectors after softmax activation, and the final result was obtained by summation. MSA is based on self-attention with multiple heads to achieve parallelism and improve the efficiency of operations. The self-attention mechanism is shown in Figure 5a, and the MSA mechanism is shown in Figure 5b.
The final attention factor obtained can be expressed by the following Equation (5):
The attention of multi-head parallel computing can be expressed by the following Equations (6) and (7).
The input and output of MSA are two-dimensional matrix vectors. To apply this to the segmentation task, the feature map needs to be flattened into a two-dimensional feature matrix. The specific approach involved keeping the channel dimensions of the final 8 × 8 × 512 feature map, flattening it into a 512 × 64 2D matrix (after performing feature reconstruction by layer normalization and MSA, the output is still a 512 × 64 2D matrix), and then reshaping it back to the original feature map size. The overall structure is shown in Figure 6.
2.4. Feature Fusion Based on Attention Enhancement
In the decoding stage, the decoder restores the feature map to the original size and finally obtains the segmentation result. The original UNet decoder consists of bilinear interpolation, feature fusion and two 3 × 3 convolution layers, and after repeated up-sampling and convolution operations, the number of channels is finally reduced to a specific value by 1 × 1 convolution to obtain the resulting segmentation map. We used transposed convolution, instead of bilinear interpolation, for up-sampling, and an attention module was used to enhance the fused features during the feature fusion stage. We argue that the simple concatenation of high dimensional features after up-sampling can easily confuse the features of targets at different scales, especially when their boundaries are adjacent and their contours are blurred and irregular. Therefore, we designed an attention enhancement module to enhance recognition ability and strengthen the distinctions between targets of different scales, while refining the features between different classes of targets.
Due to the relatively large resolution of the shallow level feature map, the spatial feature distribution has a greater impact on feature fusion, so the three largest scale feature maps use a spatial attention module (SAM) to integrate the fused features. Specifically, the fused features are first further extracted by convolution operations, and the convolved feature maps are average pooled and max pooled in the channel dimension. Then, the spatial weight coefficients are obtained, after convolution and sigmoid activation, and, finally, the spatial weight coefficients are multiplied by the original feature map to obtain an enhanced feature map. High-dimensional features are often compressed in terms of their channels, so the fused features are integrated by using a channel attention module (CAM) for the latter two smaller scale feature maps. Specifically, the fused features were first further extracted by a convolution operation. After linear mapping and summation, the channel weight coefficients were obtained through the activation function, and finally, the channel weight coefficients were multiplied by the original feature map to obtain the enhanced feature map. The structures of the SAM and CAM are shown in Figure 7.
2.5. Improved Loss Function
For the segmentation task, the total number of pixel points in each category is the sample size, and when the number of categories is large, there are often unbalanced sample sizes in different categories, which makes the model more biased toward predicting the categories with more samples; thus, yielding a lower prediction loss. Such prediction results make the segmentation effect for a category with fewer samples less accurate, and when the pixels of the category with fewer samples are misclassified into other categories, this also deceptively reduces the accuracies of other categories. For the problem of unbalanced target categories, we used weighted cross-entropy loss (WCE loss) to make the misclassification losses of different categories different by adjusting the weight gains of different categories, assigning larger weights to categories with smaller sample sizes and smaller weights to categories with larger sample sizes, so that the model focused more on categories with smaller sample sizes. The improved cross-entropy loss Equation (8) is as follows:
where m is the number of sample points, n is the number of categories, is the weight corresponding to the current category, is the category number of the current sample point, and is the classification probability of the current sample point predicted by the network.
3. Experiments and Results
To verify the effectiveness of our method, we conducted comparison experiments on the publicly available WHDLD datasets and DLRSD datasets with MA-UNet and some classic segmentation algorithms. In this section, we present the utilized datasets, evaluation metrics, experimental procedures and experimental results.
3.1. Datasets
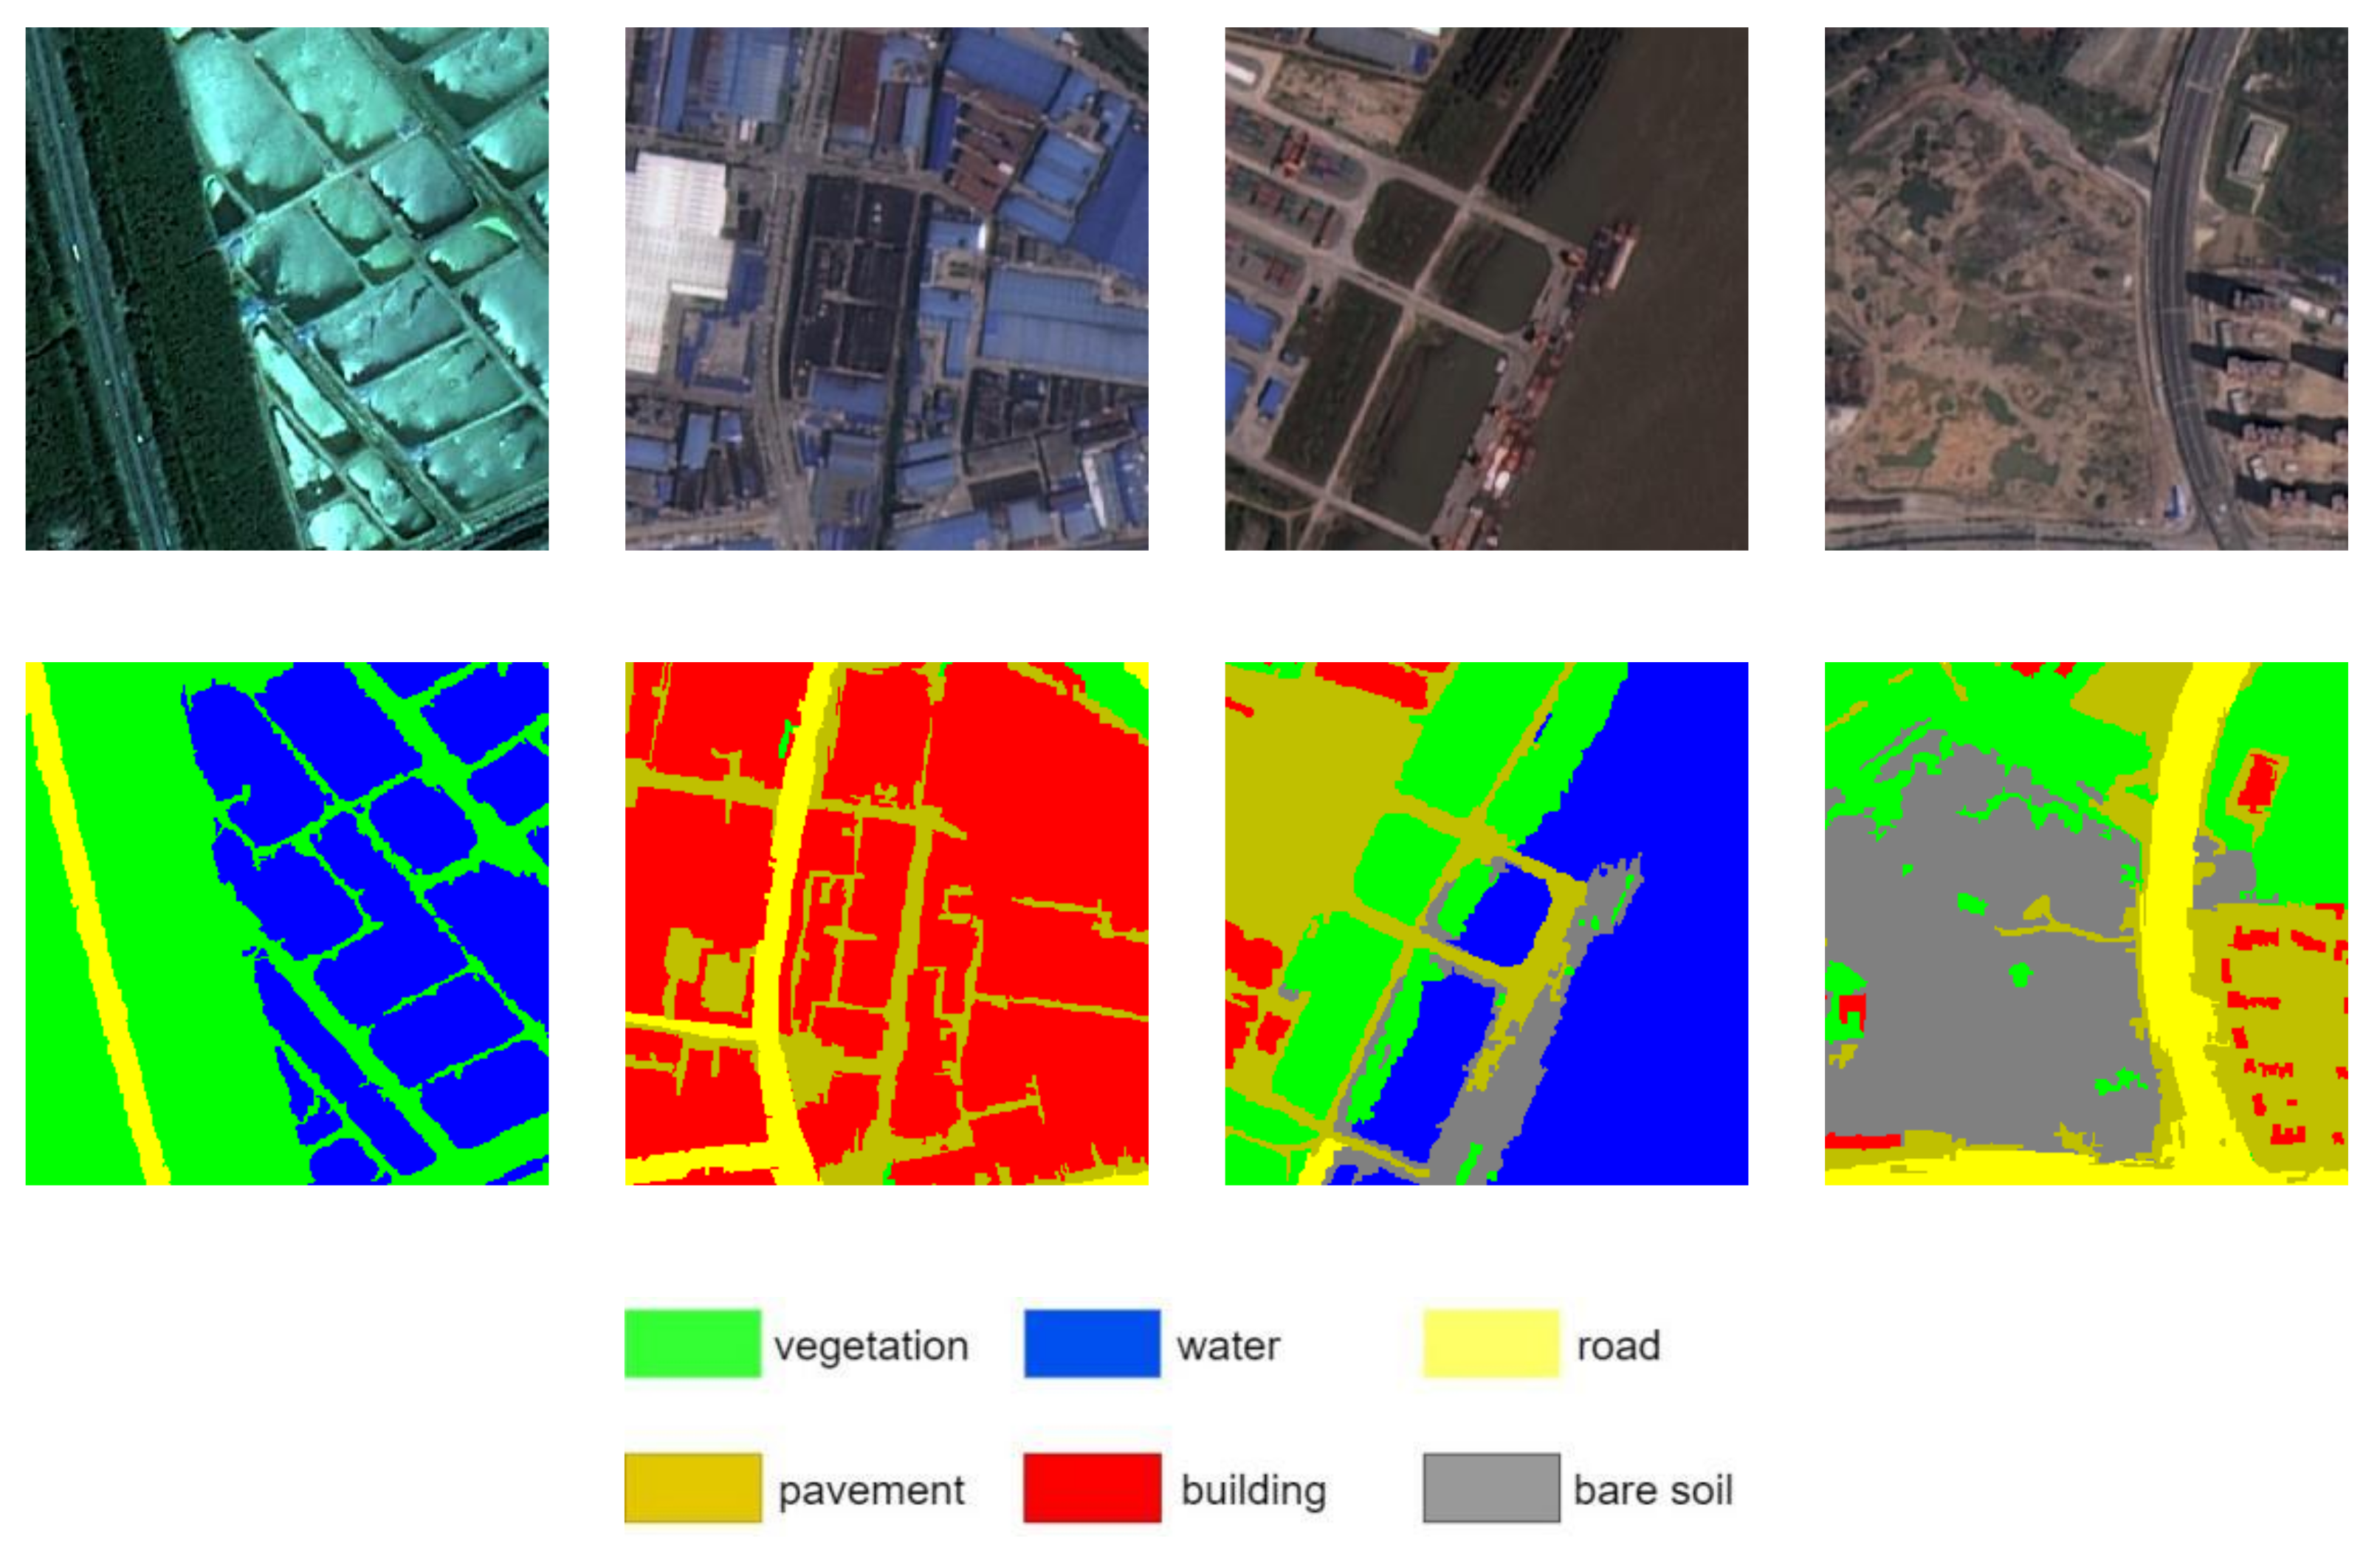
The WHDLD datasets [35] is an open-source dataset for remote sensing image segmentation, published by Wuhan University, with an image resolution of 256 × 256 × 3; the categories are divided into 6 classes containing bare soil, buildings, pavement, roads, vehicles, and water, with a total of 4940 images. We randomly divided the training sets and validation sets at a ratio of 0.8:0.2 for each category, among which 3952 images were used for training and 988 were used for testing. The images and labels of the WHDLD datasets are shown in Figure 8.
The DLRSD dataset [36] is a multicategory segmentation task dataset for remote sensing images, produced by Wuhan University. It contains 2100 images with 256 × 256 × 3 resolution, covering 17 commonly used target classes for remote sensing images, with 100 images in each class. We randomly divided the training sets and validation sets at a ratio of 0.8:0.2 for each category, with 1680 images for training and 420 images for testing. The images and labels of the DLRSD datasets are shown in Figure 9.
As seen from the above figures, the WHDLD datasets and DLRSD datasets have complex scenes [37] and many categories, such as cities, lakes, grasslands, farms, docks, airports, etc. The target scales of different categories vary greatly, with small targets, such as cars and trees, having resolutions less than 20 × 20, and buildings, lakes, roads, etc. having resolutions greater than 200 × 200. Moreover, the distribution of different target categories is chaotic, and the boundaries are blurred, making it difficult to classify pixels between neighboring targets.
3.2. Evaluation Metrics
To evaluate the accuracy of model segmentation, we used the mean intersection over union (mIOU), mean pixel accuracy (mPA), precision (P), and recall (R) for the segmentation performance. The mIOU is defined as the ratio of the intersection of the model’s predicted outcomes and the true values for each category in the merged set, which were summed and then averaged, as shown in Equation (9).
The mPA is defined by separately calculating the proportion of pixels that are correctly classified for each class and then summing and averaging the values, as shown in Equation (10).
Precision represents the proportion of the predicted results that are correctly predicted, and recall represents the probability that the true value is correctly predicted, as shown in Equations (11) and (12).
where TP stands for true positives, FP stands for false positives, TN stands for true negatives, and FN stands for false negatives.
3.3. Experimental Design
We trained Unet [18], UNet++ [26], Attention UNet (AttUNet) [27], SegNet [38], PSPNet [19], DeepLab [20], and MA-UNet on the WHDLD datasets and DLRSD datasets, and the experimental environment included Ubuntu 18.04, CUDA 10.1, PyTorch 1.8.0, and Python 3.7. To ensure the fairness of the experiments, the raw data were uniformly augmented [39], including via random cropping, rotation, scaling, and flipping. The final input size was 256 × 256 × 3, and all experiments were performed on four NVDIA GTX 2080Ti. We used the Adam optimizer [40] for optimization with a learning rate of 0.0001, and we used WCE loss to calculate the loss values, where the weights of each category were equal. Our experiments were divided into three steps. First, the detailed test results of MA-UNet on the WHDLD datasets and DLRSD datasets for each category were given; then, to visualize the performance improvement yielded by MA-UNet over UNet, we qualitatively compared the prediction effects of MA-UNet and UNet on some images and then gave the segmentation results of different models. Finally, the gain brought by each attention modification to MA-UNet was evaluated via ablation experiments. The final experimental results are shown in the next section.
3.4. Results and Analysis
3.4.1. Experimental Results of MA-UNet
3.4.2. Results of the Comparison Experiment
To further verify the performance of our method in comparison with that of the original UNet, we qualitatively compared the segmentation results obtained for different scenes and classes of images in the DLRSD datasets and the WHDLD datasets, and we found that both the MA-UNet and UNet had certain degrees of misclassification, but, overall, the segmentation results of MA-UNet were better. The segmentation results obtained on DLRSD are shown in Figure 12. In the black box area in the second row of Figure 12, UNet incorrectly divided the large area of grass into trees, while MA-UNet accurately segmented the larger scale grass class. Furthermore, as in the third row of Figure 12 for the car class with a relatively small red area, the accuracy of MA-UNet was higher than that of UNet, which showed that the overall segmentation effect of MA-UNet was also better than that of UNet for targets with different size scales.
The segmentation results obtained on the WHDLD datasets are shown in Figure 13. In the first row of Figure 13, for pool segmentation, the results of UNet had misclassifications for a small portion of pixels (e.g., classifying the water within the white box as vegetation), while MA-UNet accurately segmented each water region. In the third row of Figure 13, the large chunk of bare soil in the white box is classified as a road, and, compared with the original image, we found that the misclassified region is white overall and has similar features to roads, leading to the inability of UNet to effectively distinguish similar features between different categories. In contrast, MA-UNet enhanced the semantic representations of features between different categories by attention in different dimensions to achieve a finer segmentation result.
To further verify the effectiveness of our method, we trained UNet, UNet++, AttUNet, SegNet, PSPNet, DeepLabv3+, and MA-UNet on the WHDLD datasets and DLRSD datasets and tested them on the test sets. The mIOU, mPA, precision (P) and recall (R) of each model were calculated. The test results of each model on the WHDLD datasets are shown in Table 1.
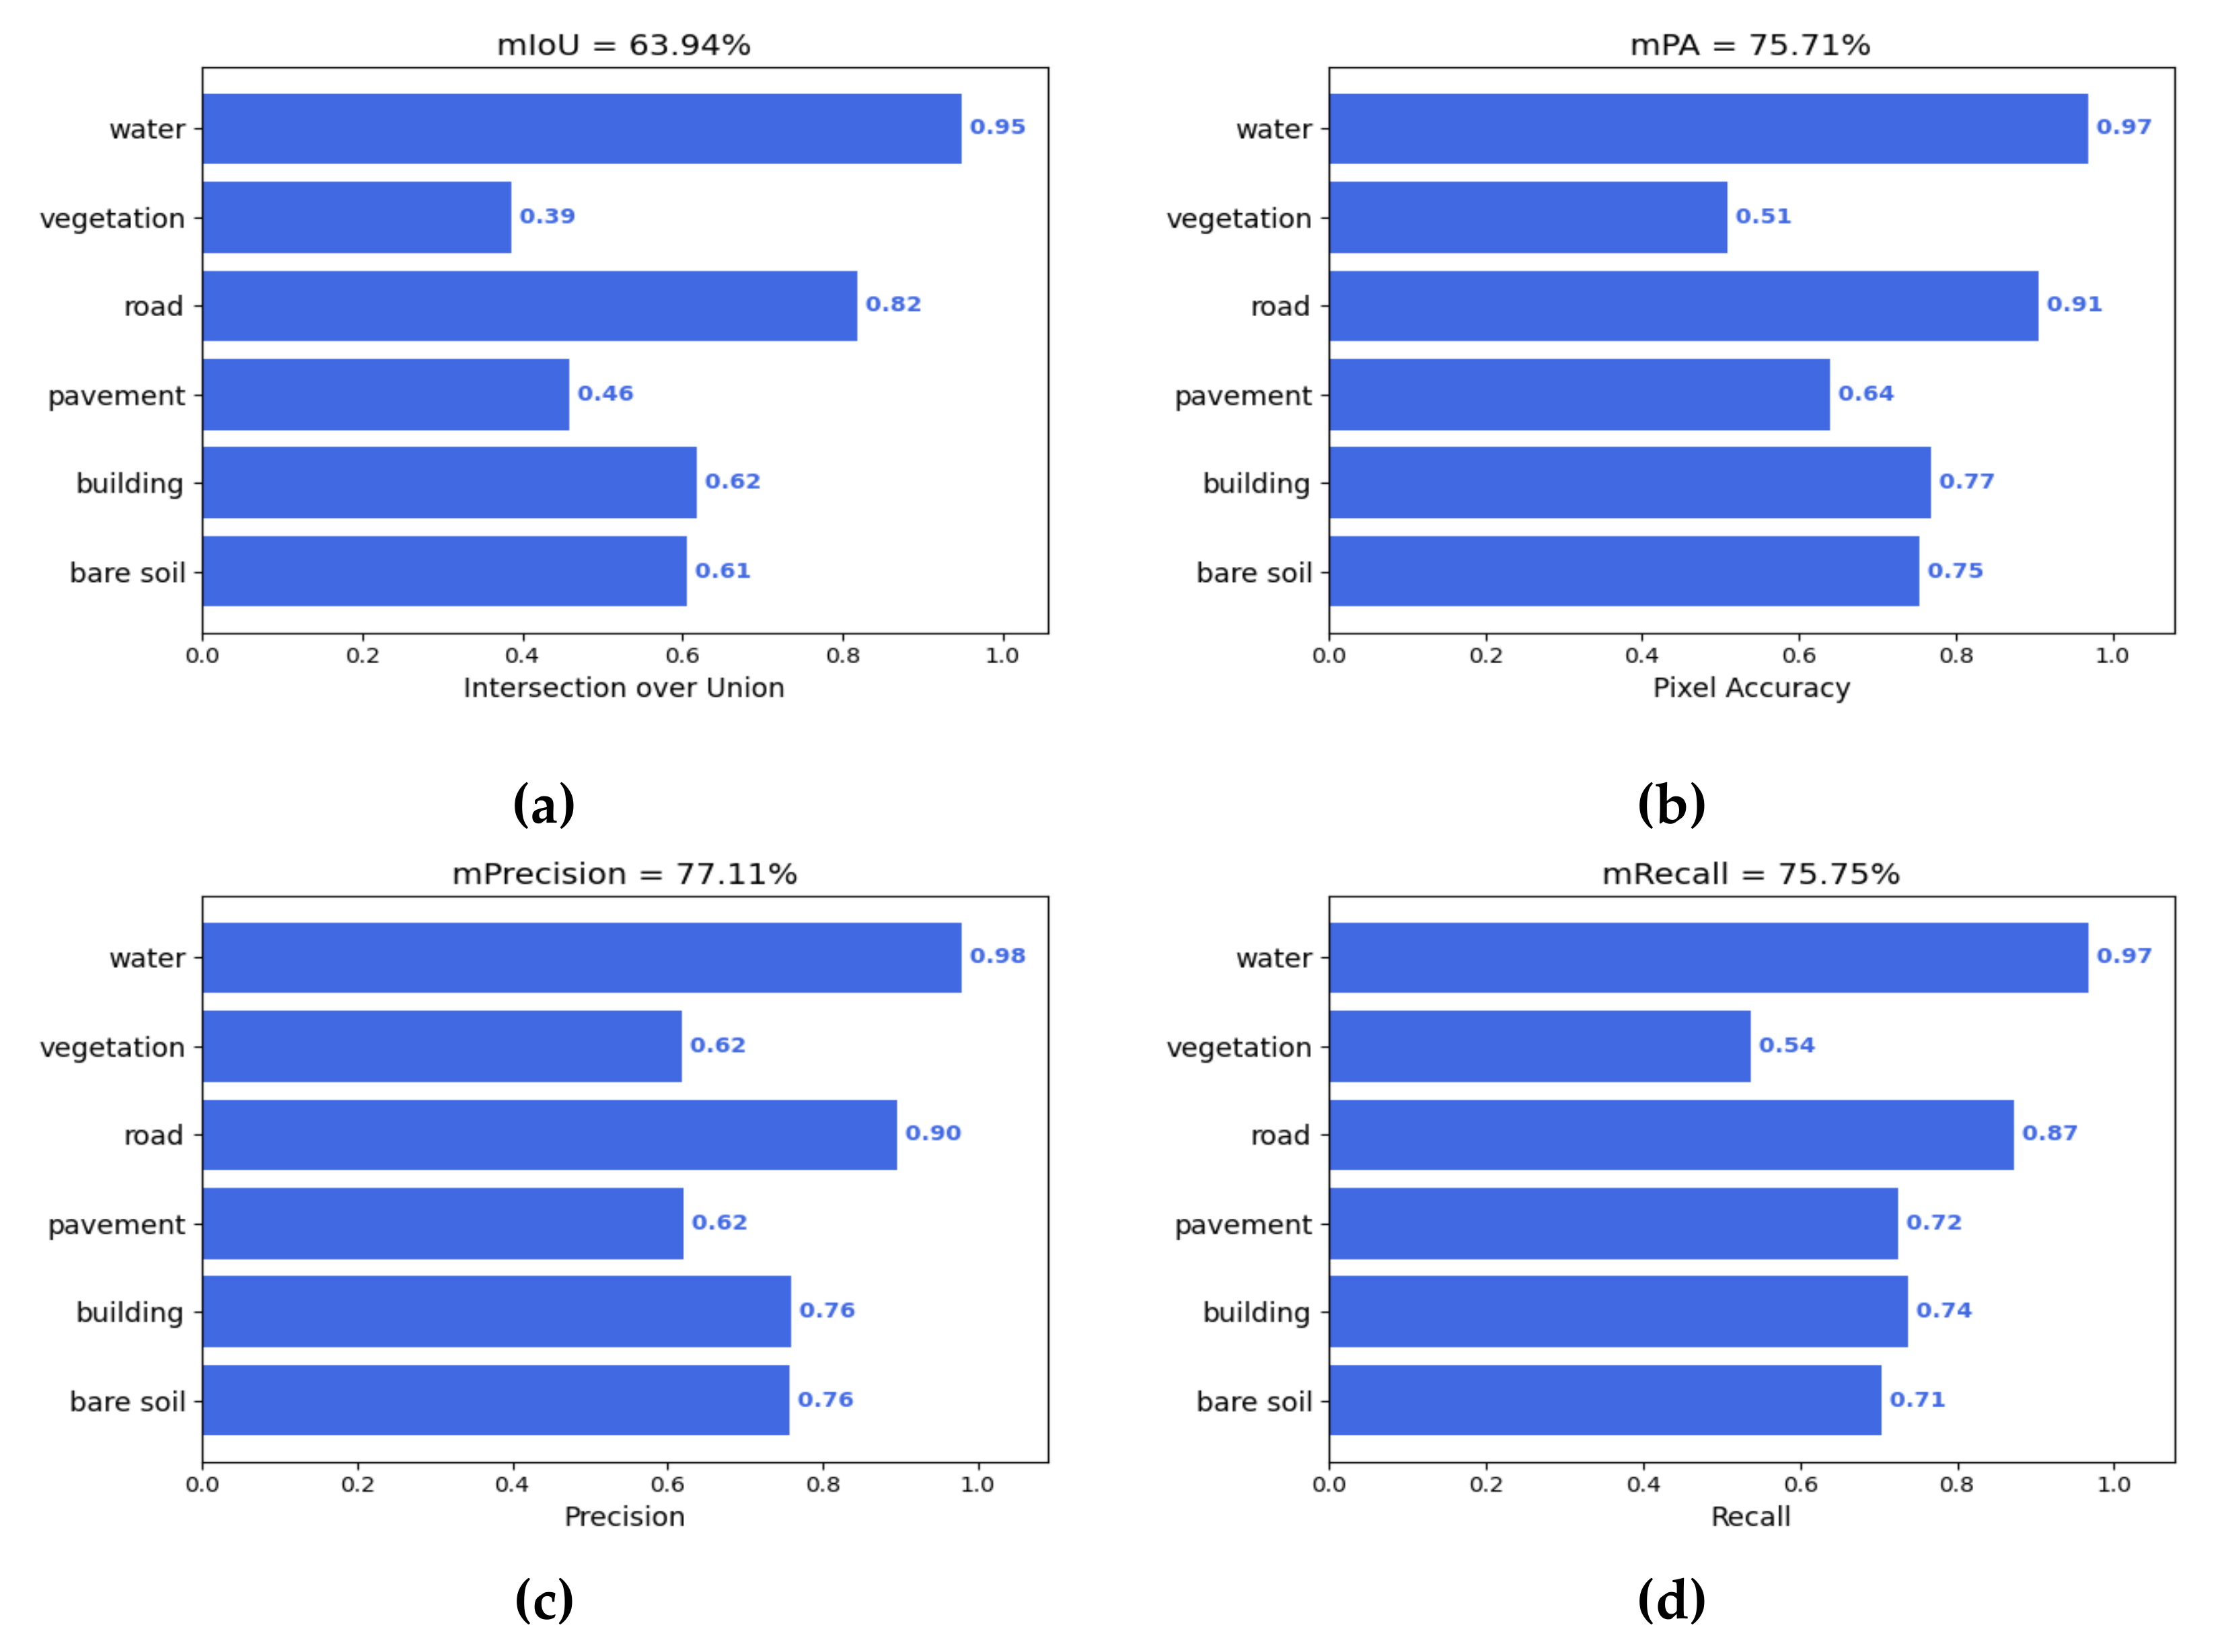
UNet, as a baseline, benefits from the feature fusion ability provided by skip connections and has slightly higher segmentation performance than SegNet and PSPNet. Its mIOU, mPA, P, and R are 59.67%, 72.52%, 74.00% and 71.92%, respectively, and its mIOU is higher than PSPNet and SegNet by 1.36% and 3.99% respectively. It can be seen that for the segmentation of multi-class targets of remote sensing images, the multiscale feature design of PSPNet and SegNet models needs to be improved, and it is even less effective than the baseline UNet. The mIOU and mPA of DeepLabv3+ 1.69% and 1.97% higher than those of UNet, due to its stronger ResNet50 encoder and dilation convolution-based [41] multiscale design, respectively. The improved AttUNet and UNet++, based on UNet, have higher precision and recall values, while their mIOUs are also higher than that of the original UNet, reaching 61.54% and 62.07%, respectively. Compared with the above models, MA-UNet had higher segmentation performance, and its precision and recall were 3.11% and 3.83% higher than those of the original UNet, while its mIOU and mPA were also significantly higher than those of the other models, reaching 63.94% and 75.71%, respectively.
On the DLRSD datasets, our model also achieved the best performance, with mIOU and mPA values reaching 61.90% and 76.72%, respectively; these values were higher than the 56.17% and 71.11% of the original UNet, as shown in Table 2. The test results of all models on the DLRSD datasets were slightly lower than those obtained on the WHDLD datasets, due to the presence of more categories and greater scale differences in the DLRSD datasets. By comparing the results of each model, we found that for datasets with more categories, such as DLRSD, enhanced feature fusion [42,43,44] could achieve higher mIOU and mPA values; for example, the mIOU and mPA of UNet++ with enhanced feature fusion, via multilayer nesting, reached 60.29% and 75.80%, respectively, and the mIOU and mPA of DeepLabv3+, with a multiscale design based on dilation convolution, were 59.36% and 74.96%, respectively. AttUNet, with the advantage of attention, was more accurate in terms of fine-grained segmentation for different target classes, producing precision and mPA results of 74.84% and 76.13%, respectively, which were only lower than those of our method.
The comparison experiments on the two datasets show that multiscale feature design is very important for the segmentation of multi-category targets, and the UNet-based models both showed high segmentation performance. In addition to the multiscale feature design, feature fusion between different scales also affects the performance of the model. It can be seen that UNet++, based on the fusion of multi-layer nested structural features, as well as attention-based AttUNet segmentation metrics, were better with UNet, and MA-UNet not only enhanced its feature extraction ability through residuals and attention in the encoder but also enhanced its feature enhancement ability through SAM and CAM in the feature fusion stage, which resulted in MA-UNet achieving the highest scores on the two datasets.
3.4.3. Ablation Experiments
In order to verify the performance improvement and parameters change of each attention module on MA-UNet, we performed ablation experiments on WHDLD datasets by adding each attention module, step by step, on the basis of the original UNet, as shown in Table 3. The training period, learning rate, optimizer and other hyperparameters are guaranteed to be constant. Experiment 1 denotes the results of the original UNet. Experiment 2 represents the results obtained after adding the residual structure, based on simAM, to the encoder of UNet, The mIOU improved by 1.47% over that of UNet. Experiment 3 shows the results obtained after increasing the feature map scale of one down-sampling operation and adding MSA to improve the feature map, based on Experiment 2. Due to the MSA, the mIOU improved by 0.68% to 61.82%. Experiment 4 contains the results yielded after adding spatial attention to the upper feature map on the basis of Experiment 3, and the mIOU improved significantly from 61.82% to 63.58%, because the features enhanced by SAM directly affected the output results. Experiment 5 denotes the results obtained after adding CAM to the lower feature map on the basis of Experiment 4. The final mIOU reached 63.94% after adding channel attention for feature enhancement. The ablation experiments showed that feature enhancement, through multiple types of visual attention, can significantly improve the segmentation performance of the proposed approach.I Its parameters are not significantly improved; only from the original 13.32 M to 14.57 M. According to our actual tests, the frame rate of MA-UNet was 38 fps on an NVDIA GTX 2080Ti, which is only 4 fps down from the 42 fps of UNet.
In addition, the WHDLD datasets have extremely unbalanced data, which makes it difficult to improve the accuracy of the segmentation results for vegetation and pavement categories. We experimented with them by adjusting the weights of the weighted cross-entropy loss, setting higher weights for vegetation and pavement, so that the loss gains of these two categories was higher than the loss gains of the other categories; thus, making the model pay more attention to the data of these two categories. Experiment 1 set equal weights for all categories, while experiment 2 set the weights for vegetation and pavement to twice the weights of the other categories, and experiment 3 set the weights for vegetation and pavement to three times the weights of the other categories. The final segmentation results are shown in Table 4.
The results show that, although increasing the weight for a category with a small sample size can improve the segmentation accuracy for this category, there are slight accuracy losses for the other categories, and setting the weight for a category with a small sample size as large as possible is not a good method. When the weights of the vehicle and pavement categories were set to three times the weights of the other categories, their segmentation accuracies were not as good as those achieved when they were set to twice the weights of the other categories. The accuracies of the other categories were significantly reduced, compared to those produced by the baseline; for example, the accuracy of the bare soil category was reduced by 3.33% (from 60.64% to 57.31%), and the accuracy of the road category was reduced from 81.61% to 80.22%. When the weights of the vegetation and pavement categories were set to twice the weights of other categories, the segmentation accuracies of these two categories improved significantly, from the original values of 38.55% and 46.35% to 43.02% and 50.08%, respectively, and the mIOU of the total category increased by 0.93%, from 63.94% to 64.87%, thus demonstrating the effectiveness of weighted cross-entropy loss.
4. Conclusions
Recently, with the development of satellite imaging technology and deep learning technology, remote sensing image segmentation has gradually become a hot issue, gaining many researchers’ attention. However, there are still many difficulties regarding the segmentation of multicategory targets in remote sensing images. In this paper, we propose UNet, based on multiple attentions, to address the problems of low segmentation accuracy and multiple scales in different categories. First, we built a residual encoder, based on simAM, to enhance the generalization performance of the backbone; then, we increased the multiplicity of the down-sampling layer from the original 16-time down-sampling operation of UNet to 32-time down-sampling for larger-scale targets, and we utilized MSA to rebuild the feature map to enhance the semantic representation and relevance of each feature point. Finally, we introduced a SAM and a CAM at different feature fusion stages to enhance the fused feature representation. Our proposed method achieved high segmentation performance on the WHDLD datasets and DLRSD datasets. On the WHDLD datasets, our method achieved the highest mIOU of 63.94%, which is much higher than the 59.67% of UNet, and it outperformed advanced methods, such as AttUNet, UNet++, and DeepLab. On the DLRSD datasets, the mIOU of our algorithm also exceeded those other classical algorithms, reaching 61.90%, which is 5.73% higher than the 56.17% of UNet.
In general, our method not only solves the problems presented in this paper to a large extent but also has a strong generalization ability and high segmentation accuracy. However, our method also has limitations. In the experimental design, the image resolution of our chosen datasets is relatively low. However, in remote sensing images, high-resolution images are also widely used, and the application of our model on high-resolution images is yet to be validated. Besides this, the segmentation results obtained for some remote sensing images with high noise are still poor, and blurred images, and images with high noise, are still major challenges with regards to remote sensing image segmentation. Further research will be carried out in subsequent work.
Author Contributions
Conceptualization, Y.S. and F.B.; methodology, Y.S. and F.B.; software, Y.S. and Y.G.; validation, F.B., L.C. and S.F.; formal analysis, Y.G.; investigation, L.C.; resources, F.B.; data curation, S.F.; writing—original draft preparation, Y.S.; writing—review and editing, F.B., L.C. and Y.G.; visualization, S.F.; supervision, L.C.; project administration, Y.S.; funding acquisition, F.B. All authors have read and agreed to the published version of the manuscript.
Funding
This research was funded by the National Natural Science Foundation of China (Grant No. 61971006).
Institutional Review Board Statement
Not applicable.
Informed Consent Statement
Not applicable.
Data Availability Statement
Not applicable.
Conflicts of Interest
The authors declare no conflict of interest.
References
- Zhan, J.; Hu, Y.; Cai, W.; Zhou, G.; Li, L. PDAM–STPNNet: A Small Target Detection Approach for Wildland Fire Smoke through Remote Sensing Images. Symmetry 2021, 13, 2260. [Google Scholar] [CrossRef]
- Wang, S.; Sun, X.; Liu, P.; Xu, K.; Wu, C.; Wu, C. Research on Remote Sensing Image Matching with Special Texture Background. Symmetry 2021, 13, 1380. [Google Scholar] [CrossRef]
- Kai, Y.K.; Rajendran, P. A Descriptor-Based Advanced Feature Detector for Improved Visual Tracking. Symmetry 2021, 13, 1337. [Google Scholar] [CrossRef]
- Ren, Y.; Yu, Y.; Guan, H. DA-CapsUNet: A Dual-Attention Capsule U-Net for Road Extraction from Remote Sensing Imagery. Remote Sens. 2020, 12, 2866. [Google Scholar] [CrossRef]
- Lei, S.; Zou, Z.; Liu, D. Sea-Land Segmentation for Infrared Remote Sensing Images based on Superpixels and Multi-scale Features. Infrared Phys. Technol. 2018, 91, 12–17. [Google Scholar] [CrossRef]
- Xi, C.; Yulong, G.; He, R. The Use of Remote Sensing to Quantitatively Assess the Visual Effect of Urban Landscape-A Case Study of Zhengzhou. China Remote Sens. 2022, 14, 203. [Google Scholar] [CrossRef]
- Shen, Y.; Ai, T.; Chen, H. Multilevel Mapping from Remote Sensing Images: A Case Study of Urban Buildings. IEEE Trans. Geosci. Remote Sens. 2021, 99, 1–16. [Google Scholar] [CrossRef]
- Abdollahi, A.; Pradhan, B.; Shukla, N. Deep Learning Approaches Applied to Remote Sensing Datasets for Road Extraction: A State-Of-The-Art Review. Remote Sens. 2020, 12, 1444. [Google Scholar] [CrossRef]
- Feng, Q.; Liu, J.; Gong, J. UAV Remote Sensing for Urban Vegetation Mapping Using Random Forest and Texture Analysis. Remote Sens. 2015, 7, 1074–1094. [Google Scholar] [CrossRef] [Green Version]
- Goncalves, H.; Corte-Real, L.; Goncalves, J.A. Automatic Image Registration Through Image Segmentation and SIFT. IEEE Trans. Geosci. Remote Sens. 2011, 49, 2589–2600. [Google Scholar] [CrossRef] [Green Version]
- Wang, Y.; Chen, D.R.; Shen, M.L. Watershed segmentation based on morphological gradient reconstruction. J. Optoelectron. Laser 2008. [Google Scholar]
- Blake, A.; Criminisi, A.; Cross, G. Image Segmentation of Foreground from Background Layers. US Patent US20100119147 A1, 2010. [Google Scholar]
- Radman, A.; Zainal, N.; Suandi, S.A. Automated segmentation of iris images acquired in an unconstrained environment using HOG-SVM and GrowCut. Digit. Signal Processing 2017, 64, 60–70. [Google Scholar] [CrossRef]
- Dong, C.; Liu, J.; Xu, F. Ship detection from optical remote sensing images using multi-scale analysis and Fourier HOG descriptor. Remote Sens. 2019, 11, 1529. [Google Scholar] [CrossRef] [Green Version]
- Qi, S.; Ma, J.; Lin, J. Unsupervised ship detection based on saliency and S-HOG descriptor from optical satellite images. IEEE Geosci. Remote Sens. Lett. 2015, 12, 1451–1455. [Google Scholar]
- Simonyan, K.; Vedaldi, A.; Zisserman, A. Deep Inside Convolutional Networks: Visualising Image Classification Models and Saliency Maps. Comput. Sci. 2013. preprint. [Google Scholar]
- Long, J.; Shelhamer, E.; Darrell, T. Fully convolutional networks for semantic segmentation. In Proceedings of the IEEE Conference on Computer Vision and Pattern Recognition, Boston, MA, USA, 7–12 June 2015; pp. 3431–3440. [Google Scholar]
- Ronneberger, O.; Fischer, P.; Brox, T. U-Net: Convolutional Networks for Biomedical Image Segmentation; Springer International Publishing: Berlin, Germany, 2015. [Google Scholar]
- Zhao, H.; Shi, J.; Qi, X. Pyramid Scene Parsing Network. In Proceedings of the IEEE Conference on Computer Vision and Pattern Recognition, Honolulu, HI, USA, 21–26 July 2017; pp. 2881–2890. [Google Scholar]
- Chen, L.C.; Papandreou, G.; Kokkinos, I. DeepLab: Semantic Image Segmentation with Deep Convolutional Nets, Atrous Convolution, and Fully Connected CRFs. IEEE Trans. Pattern Anal. Mach. Intell. 2018, 40, 834–848. [Google Scholar] [CrossRef] [Green Version]
- Liu, S.; Ye, H.; Jin, K. CT-UNet: Context-Transfer-UNet for Building Segmentation in Remote Sensing Images. Neural Processing Lett. 2021, 53, 4257–4277. [Google Scholar] [CrossRef]
- Abdollahi, A.; Pradhan, B.; Shukla, N. Multi-Object Segmentation in Complex Urban Scenes from High-Resolution Remote Sensing Data. Remote Sens. 2021, 13, 3710. [Google Scholar] [CrossRef]
- Wang, S.; Chen, W.; Xie, S.M. Weakly supervised deep learning for segmentation of remote sensing imagery. Remote Sens. 2020, 12, 207. [Google Scholar] [CrossRef] [Green Version]
- Zhang, Z.; Liu, Q.; Wang, Y. Road Extraction by Deep Residual U-Net. IEEE Geosci. Remote Sens. Lett. 2017, 99, 1–5. [Google Scholar] [CrossRef] [Green Version]
- Zhang, J.; Lin, S.; Ding, L. Multi-scale context aggregation for semantic segmentation of remote sensing images. Remote Sens. 2020, 12, 701. [Google Scholar] [CrossRef] [Green Version]
- Zhou, Z.; Rahman; Siddiquee, M.M.; Tajbakhsh, N. Unet++: A Nested U-Net Architecture for Medical Image Segmentation. Deep Learning in Medical Image Analysis and Multimodal Learning for Clinical Decision Support; Springer: Cham, Switzerland, 2018; pp. 3–11. [Google Scholar]
- Oktay, O.; Schlemper, J.; Folgoc, L.L. Attention u-net: Learning where to look for the pancreas. arXiv 2018, arXiv:1804.03999. [Google Scholar]
- Chen, L.Y.; Yu, Q. TransUNet: Transformers Make Strong Encoders for Medical Image Segmentation. arXiv 2021, arXiv:2102.04306. [Google Scholar]
- Vaswani, A.; Shazeer, N.; Parmar, N.; Uszkoreit, J.; Jones, L.; Gomez, A.N.; Kaiser, L.; Polosukhin, I. Attention is all you need. In Proceedings of the Advances in Neural Information Processing Systems, Long Beach, CA, USA, 4–9 December 2017; pp. 5998–6008. [Google Scholar]
- Woo, S.; Park, J.; Lee, J.Y. Cbam: Convolutional block attention module. In Proceedings of the European Conference on Computer Vision (ECCV), Glasgow, UK, 23–28 August 2018; pp. 3–19. [Google Scholar]
- Park, J.; Woo, S.; Lee, J.Y. A Simple and Light-Weight Attention Module for Convolutional Neural Networks. Int. J. Comput. Vis. 2020, 128, 783–798. [Google Scholar] [CrossRef]
- Roy, A.G.; Navab, N.; Wachinger, C. Concurrent spatial and channel “squeeze & excitation” in fully convolutional networks. In Proceedings of the International Conference on Medical Image Computing and Computer-Assisted Intervention, Strasbourg, France, 27 September–1 October 2018; Springer: Cham, Switzerland, 2018; pp. 421–429. [Google Scholar]
- He, K.; Zhang, X.; Ren, S. Deep residual learning for image recognition. In Proceedings of the IEEE Conference on Computer Vision and Pattern Recognition, Las Vegas, NV, USA, 27–30 June 2016; pp. 770–778. [Google Scholar]
- Xie, S.; Girshick, R.; Dollár, P. Aggregated residual transformations for deep neural networks. In Proceedings of the IEEE Conference on Computer Vision and Pattern Recognition, Honolulu, HI, USA, 21–26 July 2017; pp. 1492–1500. [Google Scholar]
- Shao, Z.; Zhou, W.; Deng, X.; Zhang, M.; Cheng, Q. Multilabel Remote Sensing Image Retrieval Based on Fully Convolutional Network. IEEE J. Sel. Top. Appl. Earth Obs. Remote Sens. 2020, 13, 318–328. [Google Scholar] [CrossRef]
- Shao, Z.; Yang, K.; Zhou, W. Performance Evaluation of Single-Label and Multi-Label Remote Sensing Image Retrieval Using a Dense Labeling Dataset. Remote Sens. 2018, 10, 964. [Google Scholar] [CrossRef] [Green Version]
- Hu, X.; Li, Y.; Shan, J.; Zhang, J.; Zhang, Y. Road Centerline Extraction in Complex Urban Scenes from LiDAR Data Based on Multiple Features. Geosci. Remote Sens. 2014, 52, 7448–7456. [Google Scholar]
- Badrinarayanan, V.; Kendall, A.; Cipolla, R. SegNet: A Deep Convolutional Encoder-Decoder Architecture for Image Segmentation. IEEE Trans. Pattern Anal. Mach. Intell. 2017, 39, 2481–2495. [Google Scholar] [CrossRef]
- Cubuk, E.D.; Zoph, B.; Mane, D. Autoaugment: Learning augmentation policies from data. arXiv 2018, arXiv:1805.09501. [Google Scholar]
- Kingma, D.P.; Ba, J. Adam: A method for stochastic optimization. arXiv 2014, arXiv:1412.6980. [Google Scholar]
- Zhou, L.; Zhang, C.; Ming, W. D-LinkNet: LinkNet with Pretrained Encoder and Dilated Convolution for High Resolution Satellite Imagery Road Extraction. In Proceedings of the 2018 IEEE/CVF Conference on Computer Vision and Pattern Recognition Workshops (CVPRW), Salt Lake City, UT, USA, 18–23 June 2018. [Google Scholar]
- Chi, M. SAFFNet: Self-Attention-Based Feature Fusion Network for Remote Sensing Few-Shot Scene Classification. Remote Sens. 2021, 13, 2532. [Google Scholar]
- Jiao, L. Attention-Guided Siamese Fusion Network for Change Detection of Remote Sensing Images. Remote Sens. 2021, 13, 4597. [Google Scholar]
- Bai, T.; Li, D.; Sun, K.; Chen, Y.; Li, W. Cloud Detection for High-Resolution Satellite Imagery Using Machine Learning and Multi-Feature Fusion. Remote Sensing 2016, 8, 715. [Google Scholar] [CrossRef] [Green Version]
Figure 1.
The structure of UNet; BN in the figure represents batch normalization.

Figure 2.
The structure of MA-UNet; LN in the figure represents layer normalization and BN represents batch normalization.
Figure 2.
The structure of MA-UNet; LN in the figure represents layer normalization and BN represents batch normalization.

Figure 3.
The structure of residual block. (a) The ordinary residual structure; (b) The improved bottleneck structure of the residual. C and BN in the figure represent number of channels and batch normalization, respectively.
Figure 3.
The structure of residual block. (a) The ordinary residual structure; (b) The improved bottleneck structure of the residual. C and BN in the figure represent number of channels and batch normalization, respectively.

Figure 4.
The structure of the residual, based on simAM.

Figure 5.
(a) Structure of the self-attention mechanism; (b) Structure of the MSA mechanism.

Figure 6.
The structure of MSA appling to image features rebuilding.

Figure 7.
Feature enhancement based on SAM and CAM.

Figure 8.
Some images and labels in WHDLD datasets.

Figure 9.
Some images and labels in DLRSD datasets.


Figure 10.
Results obtained on the WHDLD datasets. (a) mIOU; (b) mPA; (c) Precision; (d) Recall.

Figure 11.
Results obtained on the DLRSD datasets. (a) mIOU; (b) mPA; (c) Precision; (d) Recall.

Figure 12.
Images of the segmentation results obtained on the DLRSD datasets. (a) Image; (b) Label; (c) Result of UNet; (d) Result of MA-UNet.
Figure 12.
Images of the segmentation results obtained on the DLRSD datasets. (a) Image; (b) Label; (c) Result of UNet; (d) Result of MA-UNet.

Figure 13.
Images of the segmentation results obtained on the WHDLD datasets. (a) Image; (b) Label; (c) Result of UNet; (d) Result of MA-UNet.
Figure 13.
Images of the segmentation results obtained on the WHDLD datasets. (a) Image; (b) Label; (c) Result of UNet; (d) Result of MA-UNet.


Table 1.
Comparison among the results obtained by different methods on the WHDLD datasets.
| Method | mIOU (%) | mPA (%) | P (%) | R (%) |
|---|---|---|---|---|
| UNet | 59.67 | 72.52 | 74.00 | 71.92 |
| UNet++ | 62.07 | 75.16 | 76.32 | 74.83 |
| AttUNet | 61.54 | 74.35 | 75.18 | 73.39 |
| SegNet | 55.68 | 67.92 | 69.71 | 67.26 |
| PSPNet | 58.31 | 72.32 | 73.12 | 70.67 |
| DeepLabv3+ | 61.36 | 74.49 | 74.87 | 73.04 |
| MA-UNet(ours) | 63.94 | 75.71 | 77.11 | 75.75 |
Table 2.
Comparison among the results obtained by different methods on the DLSRD datasets.
| Method | mIOU (%) | mPA (%) | P (%) | R (%) |
|---|---|---|---|---|
| UNet | 56.17 | 71.11 | 68.46 | 72.52 |
| UNet++ | 60.29 | 75.80 | 73.27 | 72.93 |
| AttUNet | 59.62 | 76.13 | 74.84 | 72.29 |
| SegNet | 53.73 | 70.71 | 66.32 | 68.90 |
| PSPNet | 55.81 | 71.28 | 69.54 | 68.49 |
| DeepLabv3+ | 59.36 | 74.96 | 72.35 | 72.14 |
| MA-UNet(ours) | 61.90 | 76.72 | 75.47 | 74.96 |
Table 3.
Ablation experiments on the WHDLD datasets.
| Exp1 | Exp2 | Exp3 | Exp4 | Exp5 | |
|---|---|---|---|---|---|
| Residual + simAM | √ | √ | √ | √ | |
| MSA | √ | √ | √ | ||
| SAM | √ | √ | |||
| CAM | √ | ||||
| mIOU (%) | 59.67 | 61.14 | 61.82 | 63.58 | 63.94 |
| Param (M) | 13.32 | 13.49 | 14.536 | 14.537 | 14.57 |
Table 4.
Comparison among the results obtained with different weights for the categories of the WHDLD datasets.
Table 4.
Comparison among the results obtained with different weights for the categories of the WHDLD datasets.
| Classes | Exp1 | Exp2 | Exp3 |
|---|---|---|---|
| Bare soil | 60.64 | 59.84 | 57.31 |
| Building | 61.82 | 62.37 | 60.87 |
| Pavement | 46.35 | 50.08 | 48.62 |
| Road | 81.61 | 80.44 | 80.22 |
| Vegetation | 38.55 | 43.02 | 40.36 |
| Water | 94.67 | 93.49 | 94.04 |
| mIOU (%) | 63.94 | 64.87 | 63.57 |
Publisher’s Note: MDPI stays neutral with regard to jurisdictional claims in published maps and institutional affiliations. |
© 2022 by the authors. Licensee MDPI, Basel, Switzerland. This article is an open access article distributed under the terms and conditions of the Creative Commons Attribution (CC BY) license (https://creativecommons.org/licenses/by/4.0/).
Share and Cite
MDPI and ACS Style
Sun, Y.; Bi, F.; Gao, Y.; Chen, L.; Feng, S. A Multi-Attention UNet for Semantic Segmentation in Remote Sensing Images. Symmetry 2022, 14, 906. https://doi.org/10.3390/sym14050906
AMA Style
Sun Y, Bi F, Gao Y, Chen L, Feng S. A Multi-Attention UNet for Semantic Segmentation in Remote Sensing Images. Symmetry. 2022; 14(5):906. https://doi.org/10.3390/sym14050906
Chicago/Turabian StyleSun, Yu, Fukun Bi, Yangte Gao, Liang Chen, and Suting Feng. 2022. "A Multi-Attention UNet for Semantic Segmentation in Remote Sensing Images" Symmetry 14, no. 5: 906. https://doi.org/10.3390/sym14050906
Note that from the first issue of 2016, this journal uses article numbers instead of page numbers. See further details here.