
Peak Detection and HRV Feature Evaluation on ECG and PPG Signals
by
 , ,
, ,
Filipa Esgalhado
1,2,3,*, 
Arnaldo Batista
1,4,
Valentina Vassilenko
1,2,3,
Sara Russo
1 and
Manuel Ortigueira
1,4 1
NOVA School of Science and Technology, NOVA University of Lisbon, Campus de Caparica, 2829-516 Caparica, Portugal
2
Laboratory of Instrumentation, Biomedical Engineering and Radiation Physics (LIBPhys-UNL), Department of Physics, NOVA School of Science and Technology, NOVA University of Lisbon, Campus de Caparica, 2829-516 Caparica, Portugal
3
NMT, S.A., Parque Tecnológico de Cantanhede, Núcleo 04, Lote 3, 3060-197 Cantanhede, Portugal
4
UNINOVA-CTS, NOVA School of Science and Technology, NOVA University of Lisbon, Campus de Caparica, 2829-516 Caparica, Portugal
*
Author to whom correspondence should be addressed.
Symmetry 2022, 14(6), 1139; https://doi.org/10.3390/sym14061139
Submission received: 21 March 2022
/
Revised: 13 April 2022
/
Accepted: 26 May 2022
/
Published: 1 June 2022
(This article belongs to the Special Issue Symmetry Applied in Biometrics Technology)
Abstract
:Heart Rate Variability (HRV) evaluates the autonomic nervous system regulation and can be used as a monitoring tool in conditions such as cardiovascular diseases, neuropathies and sleep staging. It can be extracted from the electrocardiogram (ECG) and the photoplethysmogram (PPG) signals. Typically, the HRV is obtained from the ECG processing. Being the PPG sensor widely used in clinical setups for physiological parameters monitoring such as blood oxygenation and ventilatory rate, the question arises regarding the PPG adequacy for HRV extraction. There is not a consensus regarding the PPG being able to replace the ECG in the HRV estimation. This work aims to be a contribution to this research area by comparing the HRV estimation obtained from simultaneously acquired ECG and PPG signals from forty subjects. A peak detection method is herein introduced based on the Hilbert transform: Hilbert Double Envelope Method (HDEM). Two other peak detector methods were also evaluated: Pan-Tompkins and Wavelet-based. HRV parameters for time, frequency and the non-linear domain were calculated for each algorithm and the Pearson correlation, T-test and RMSE were evaluated. The HDEM algorithm showed the best overall results with a sensitivity of 99.07% and 99.45% for the ECG and the PPG signals, respectively. For this algorithm, a high correlation and no significant differences were found between HRV features and the gold standard, for the ECG and PPG signals. The results show that the PPG is a suitable alternative to the ECG for HRV feature extraction.
1. Introduction
In the last decades, morbidity and mortality due to Cardiovascular Diseases (CVD) have been decreasing [1,2]. Despite this progress, CVD continues to be one of the main causes of death worldwide [3]. Strategies for the early detection of vascular disease may be the key for preventing CVD.
Recently, an increased number of Heart Rate Variability (HRV) studies emphasized its value as a prognostic tool and as a quick and non-invasive assessment of the autonomic nervous function [4,5]. The HRV is used to evaluate the cardiovascular autonomic regulation and the balance between the sympathetic and the parasympathetic nervous system. Adverse changes in HRV could be used as a predictor of several diseases, such as CVD and diabetic neuropathy [6]. Several features can be extracted from the HRV, such as the Standard Deviation of Normal-Normal intervals (SDNN), which can show valuable information for different pathologies [7]. However, features derived from the HRV are dependent on the peak detection accuracy over the PPG or ECG signals [8,9,10].
The HRV represents a time-series with the time differences between consecutive heartbeat fiducial points. In the ECG and PPG, the R-peak and the systolic peak represent the fiducial points, respectively. In the clinical context, the ECG is recorded with nine Ag/AgCl electrodes [11]. However, for HRV analysis, typically, three leads are needed for accurate detection of the R-peaks [12]. The ECG is susceptible to different noise sources, which can be physiological, namely electromyography noise, or non-physiological, such as electrode displacement and powerline interference [13]. For PPG acquisition, an optical sensor responsive to specific light wavelengths monitors the cyclical blood volume variations in the tissue due to the pulsatile nature of arterial blood flow. The sensor is reusable and patient–friendly, since it can be placed on the finger [14], earlobe [15], forehead [16] or wrist [17].
The PPG and the motion artefacts frequency typically range from 0.5 to 4 Hz and 0.1 to 10 Hz, respectively [18]. This bandwidth overlap hinders the process of obtaining a clean signal using ordinary filtering. Different approaches, such as moving average [19], adaptive filters [20] and algorithms based on accelerometer data [21] have been proposed to reduce these artefacts. Artefact removal in the PPG and the ECG is a challenging task given the unpredictable nature of the noise sources regarding amplitude, bandwidth and stationarity. It is expected that the noise removal operation efficiency will affect the accurate detection of the fiducial points.
Different methodologies have been proposed for the detection of the QRS and the systolic peaks in the ECG and PPG signals, respectively, such as artificial neural networks [22], wavelet transforms [23] and machine learning methods [24,25]. Table 1 presents a literature survey of several sensitivity, positive predictive value and error detection rate results for the ECG and PPG peak detection. Despite the different approaches, the sensitivity of the algorithms for the ECG and PPG cases was above 90%, although direct comparison should cautiously be made given that different databases were used.
Peak detection is an essential step for an accurate HRV estimation. Additionally, the PPG versus ECG performance has been evaluated through the computation of the respective HRV features, such as the time and frequential metrics [49]. Table 2 shows a summary of different studies that have compared HRV features from ECG and PPG signals. Some studies [49,50,51,52,53] claim that the PPG shows high accuracy in HRV feature determination. Other authors [54,55,56] have found that the PPG is not a reliable replacement for the ECG, which seems to be in apparent disagreement with the overall good results regarding PPG sensitivity in Table 1. However, one must bear in mind that a universal database was not used.
The herein presented work aims to contribute to the clarification of PPG and ECG comparative capabilities for accurate fiducial points detection in view of the application to HRV analysis. To achieve this goal, the study was divided into the following steps:
- An evaluation of different algorithms for peak detection was performed for ECG and PPG. The ground truth was the expert peak marking in both signals.
- In the herein presented work, three different peak detector algorithms were evaluated, one of them being a novel methodology that performs peak detection without the need to use thresholding, a common methodology in bio-signal peak detection. Even with adaptive thresholding adjustment, missing peaks can occur due to tracking latency, after wider signal variations.
- An assessment of different HRV parameters was implemented to evaluate the similarity of the results obtained from different peak detection methodologies. The ground truth was the HRV parameters obtained via the expert peak marking in both signals.
2. Materials and Methods
A cohort of 40 healthy volunteers participated in the study, twenty females and twenty males with an age of 36.4 ± 19.2 and 47.3 ± 21.7 years and a BMI of 22.9 ± 3.2 and 27.2 ± 4.5, respectively. All participants signed an Informed Consent, and the working database was anonymized. This research was approved by the Hospital da Senhora de Oliveira Ethics Commission with Reference Number 86/2019.
Experimental ECG and PPG data were simultaneously recorded, for the same participant, by the MP35 BIOPAC® system, Goleta, CA, USA. The ECG signals were acquired using a 3 electrode lead set (SS2L) attached to the right wrist (‘Positive’), right ankle (‘Ground’) and left ankle (‘Negative’). The PPG data was recorded from the index finger with a BIOPAC® photoplethysmography sensor model SS4LA. The signals were recorded with a 2000 Hz sampling frequency for at least five minutes. The subjects stayed in a comfortable semi-recumbent position throughout the recording period and were requested to minimize their body movement.
Data pre-processing included bandpass filtering, trimming and detrending. The ECG and the PPG bandpass filters were set to 0.5 to 35 Hz [62,63] and 0.4 to 4 Hz, respectively [64,65]. Three peak detector algorithms were tested on the ECG and PPG signals: a modified Pan-Tompkins [26], Wavelet-based [66] and the Hilbert Double Envelope Method (HDEM).
The Pan-Tompkins [26] algorithm applies low and high pass filters in order to reduce background noise, such as powerline interference or muscle noise. The signal is then squared to amplify the higher amplitude segments of the signals, and an adaptative threshold detects the peaks [26].
Similarly for the PPG signal, a Filter Based Peak Detection (FBPD) algorithm was implemented. This algorithm was inspired in the Pan–Tompkins method but kept in mind the spectral characteristics of the PPG signal according to the criteria presented in [67]. The rational behind the application of the FBPD algorithm was to be able to evaluate the Pan–Tompkins ECG R peak detection results with a comparable filter-based algorithm applied to the PPG systolic fiducial point recognition. Figure 1 represents the FBPD algorithms steps for peak detection.
The Wavelet algorithm (Figure 2) is based on an adapted version of the R-wave peak detector introduced by Sahambi et al. [66] and Cardoso et al. [67]. The selected wavelet function was the Mexican Hat [68]. The P and T waves are detected based on the modulus maxima and zero crossings of the wavelet transform. The mother wavelet was then optimized to reduce the effect of low and high frequency noise on the timing characterization [66,67,68].
To further improve peak detection, a new algorithm is proposed in this work. The HDEM is based on the Hilbert envelope. The Hilbert transform description will herein be presented by firstly introducing the Analytic Signal concept [69]. Consider a real signal s(t) with spectrum . The complex signal z(t) only defined for positive frequencies is given by the inverse transform of :
Multiplication by 2 stems from the need to make the real part of the analytical signal equal to s(t). However, the spectrum of s(t) is given by:
Replacing this value in Equation (1) it is obtained:
Given the relation:
The following is obtained:
The Analytic Signal of s(t) is obtained by:
The Hilbert Transform of s(t) is the imaginary part of z(t):
Figure 3 shows a block diagram of the Hilbert transform (HT) application to PPG or ECG peak detection. The selected filter size is selected as where fs is the sampling frequency. Through the application of HT, the lower and upper signal envelopes are obtained, being the first one discarded. In the next step, the HT is applied to the upper envelope. From the output of this last step only the lower envelope is retrieved.
This procedure will guarantee that this lower envelope will intercept the signal in two points closely located to the peak to be detected, which can be easily retrieved by obtaining the local maximum between the intersection points. However, wider signal oscillations may render the interception points time offset relative to the peak value. To solve this issue, a validation is performed within a 30-millisecond window around the peak candidate. Unlike typical PPG and ECG peak detectors, no threshold value needs to be established, an advantage of the HDEM. Figure 4 shows a visual representation of the HDEM application to a PPG signal.
To evaluate the peak detection performance of the different algorithms, the sensitivity (), positive prediction value () and error detection rate () were determined. The sensitivity is the probability of detecting a signal peak when it exists. The positive predictive value is the probability of detecting a true signal peak among the detected peaks in the signal. The error detection rate is the probability of the identified peak not matching a real signal peak. These parameters are given by the following expressions [70]:
where true positive () is the number of correct peaks identified in the signal; false negative () is the number of peaks in the signal that were not detected, and false positive () is the number of misidentified peaks detected by the algorithm.
The inter-beat intervals (IBI) vector, another designation for the HRV, was extracted from ECG and PPG peaks. Two features from each HRV domain were chosen to be evaluated. In the time domain, the IBI Mean and SDNN were selected. In the frequency domain, the Low Frequency (LF) power peak and High Frequency (HF) power peak were chosen. The LF and HF frequency band ranged from 0.04 to 0.15 Hz and 0.15 to 0.4 Hz, respectively [7]. The non-linear domain parameters, S1 and S2, defined as the standard deviation of the Poincaré plot axis perpendicular to the line-of-identity and the standard deviation along the line-of-identity axis, respectively, were obtained [71].
The algorithms’ performance evaluation was assessed with the paired T-test, the Pearson correlation and the Root Mean Squared Error (RMSE). The paired T-test evaluates if there is a significant difference between the average values of the two datasets, and , and is given by [72]:
where is the mean of the dataset, is the total variance, is the number of samples, is the correlation and is defined by [72]:
where is the observation and is the mean of the dataset.
The Pearson correlation was used to evaluate the HRV parameters. The Pearson correlation coefficient () between A and B is defined as [73]:
where and are the mean and standard deviation of , and are the mean and standard deviation of and is the number of samples. The Pearson correlation ranges from −1 to 1 with 0 representing no linear correlation between the variables.
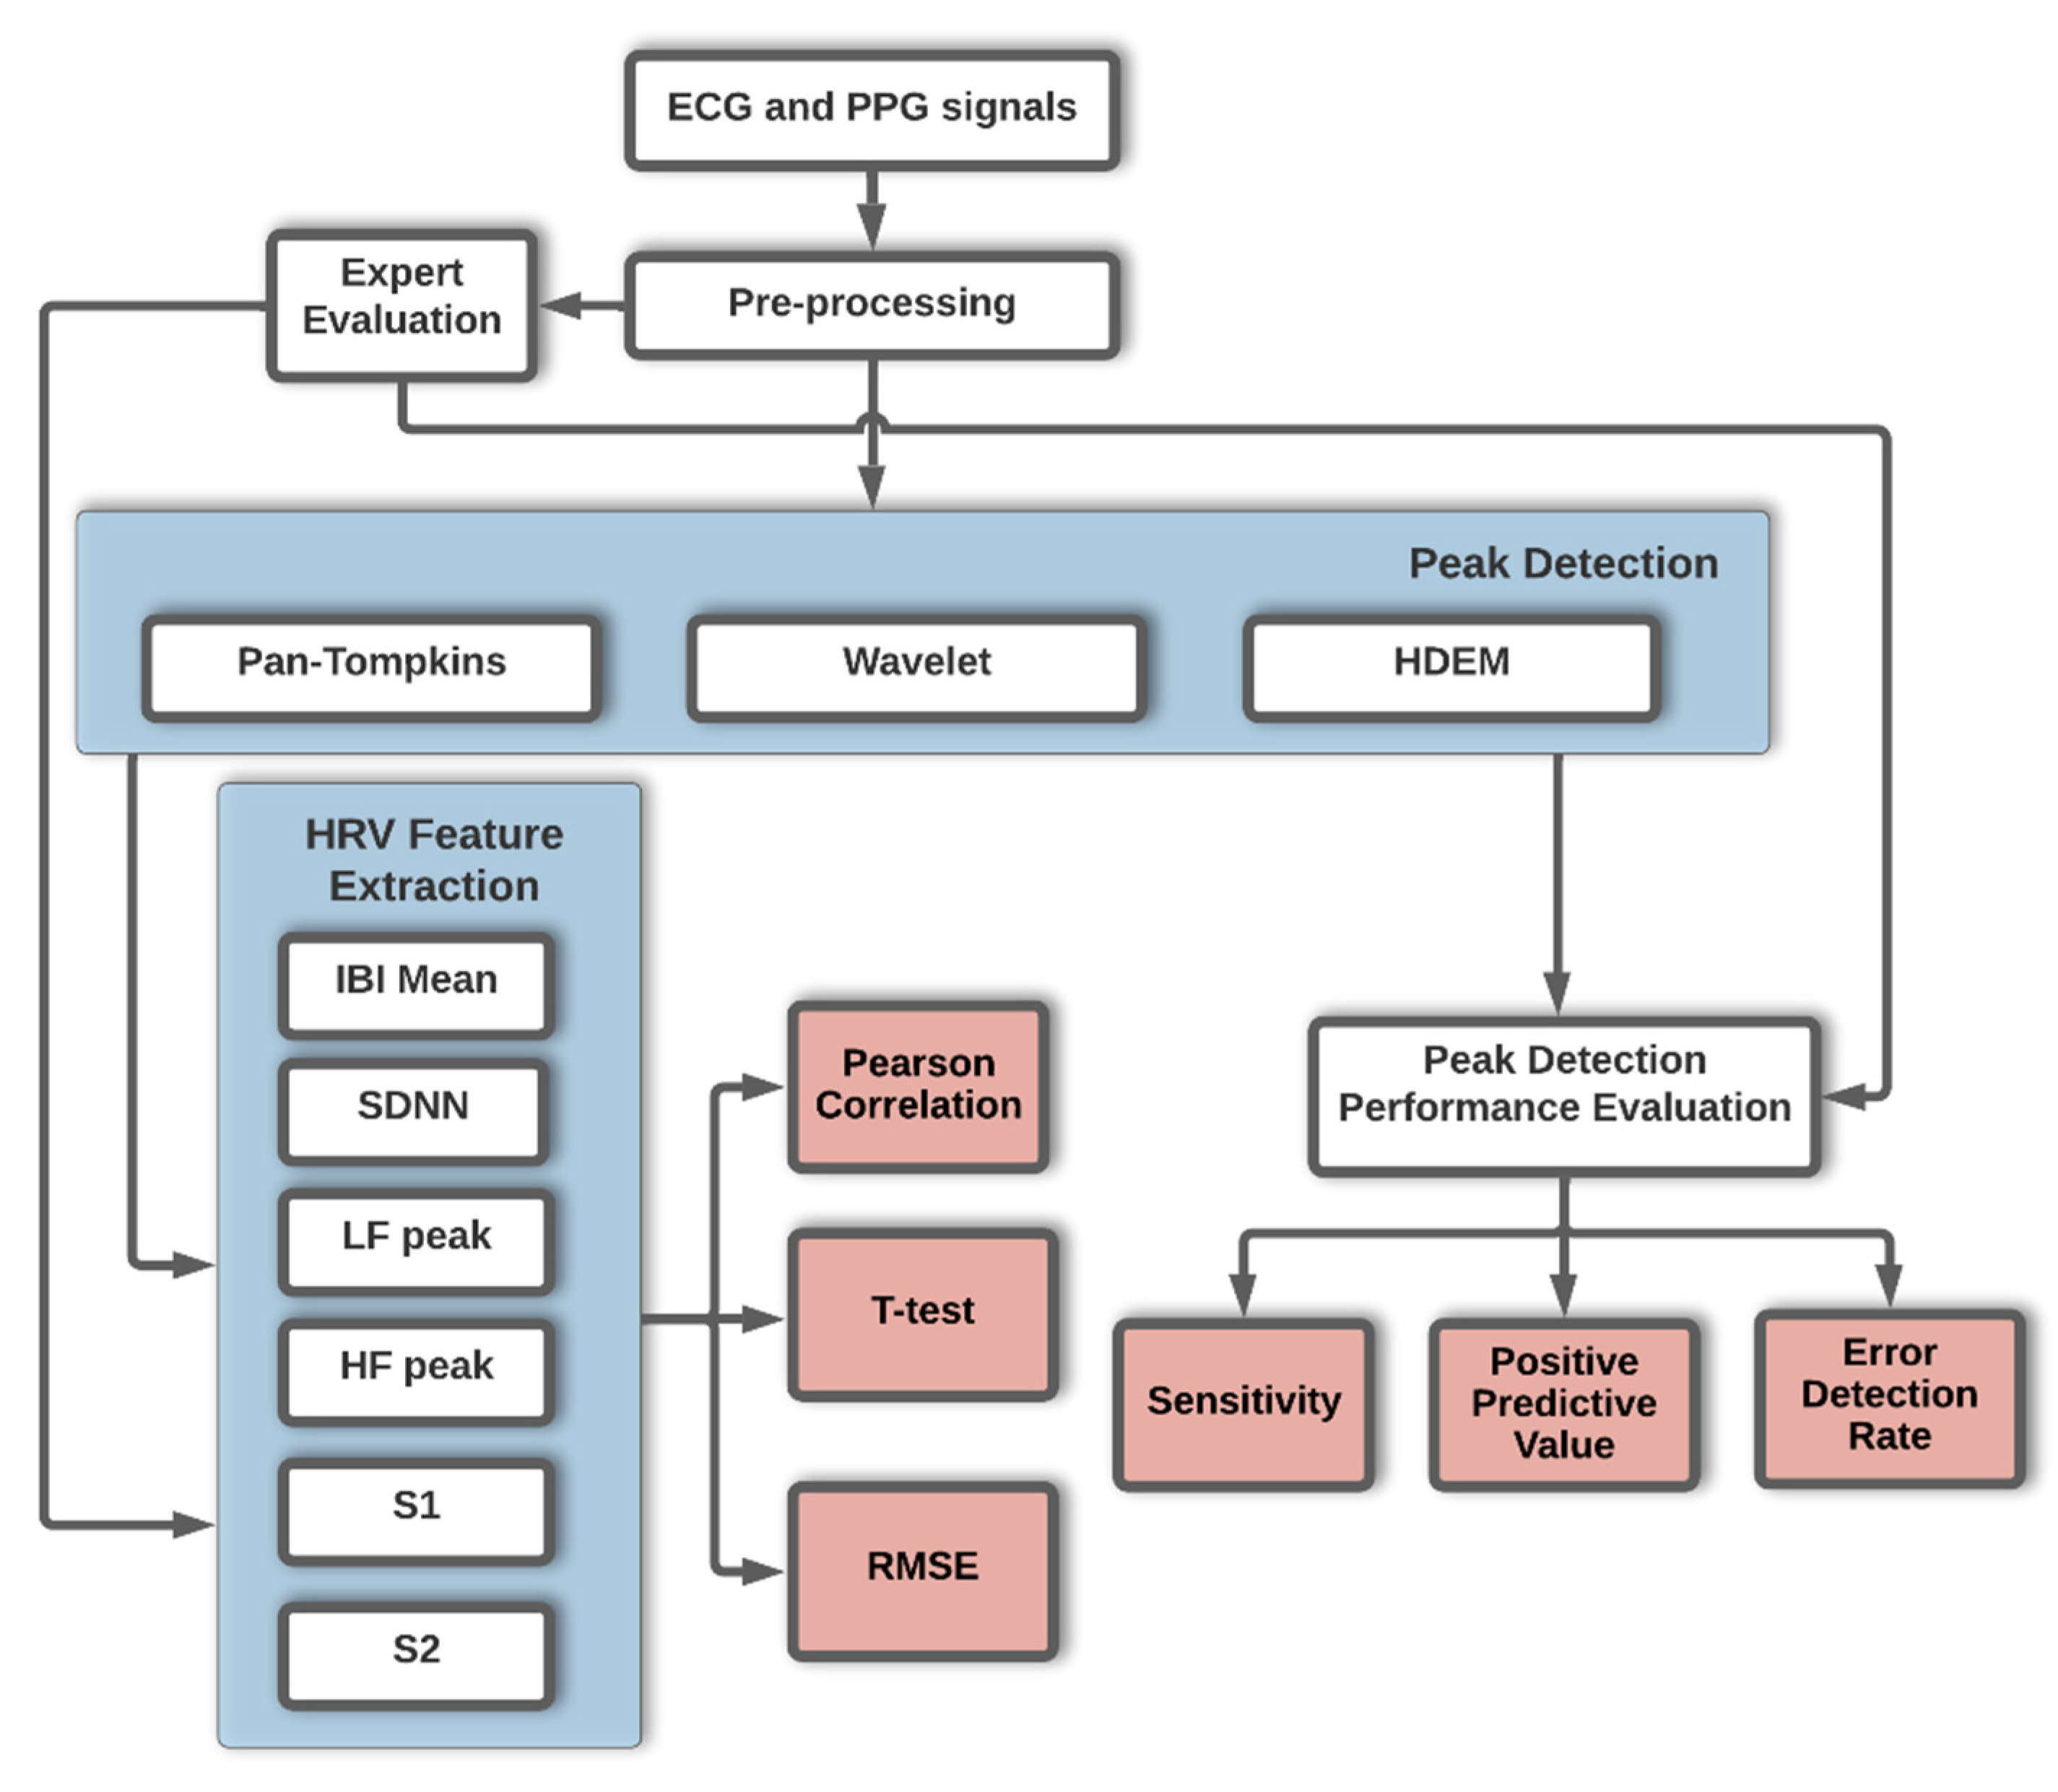
A summary flowchart of the work methodology is presented in Figure 5. All data was analysed with MATLAB® 2020a version, MathWorks, Inc., Natick, MA, USA.
3. Results
A total of 21,275 peaks were previously identified by blind approach expert classification in the ECG and the PPG signals. This dataset was used as the gold standard in the algorithm’s evaluation. For the ECG, the applied peak detection algorithms were: Pan–Tompkins, Wavelet and HDEM. For the PPG the applied peak detection algorithms were: FBPD, Wavelet and HDEM. For the Wavelet method the selected wavelet function was the Mexican Hat as referred in [66] and [67].The FBPD relies on a bandpass filter with cut-off frequencies between 0.4 Hz and 4 Hz.
The results of the evaluation of the algorithm’s peak detection performance regarding sensitivity, positive predictive value, error detection rate and the mean processing time per case are presented in Table 3. Regarding sensitivity, the HDEM presented the best results for the ECG and PPG. This method also showed the lowest error detection rate for both signals. The FBPD applied to the PPG signal had the worst overall results, with a sensitivity of 59.82% and a 42.15% error detection rate. Regarding the computational cost, the HDEM and the Wavelet were the fastest and slowest algorithms, respectively in the used platform base.
Based on the peak detection, the IBI for each method was determined and the HRV features were extracted and compared with the respective gold standard derived values. The Pearson correlation, RMSE and a T-test were applied, and a significance level of 0.05 for the latter was considered. The RMSE is measured in milliseconds. The results are presented in Table 4. For the HRV parameters extracted from the ECG, the following comments apply:
- Good overall Pearson correlation values were obtained for all the methods.
- No significant differences were found between the HRV parameters relative to the gold standard.
- Similar RMSE values for the three methods were obtained.
- Relative to the PPG HRV parameters, the following comments apply:
- Consistent low Pearson correlation values were obtained for the FBPD and the Wavelet methods, except in the Wavelet IBI mean.
- The significant threshold p-value (0.05) was not attained in four (three) of the six HRV parameters for the FBPD (Wavelet) methods.
- The HDEM excelled with the lowest RMSE values, p-values above the significant threshold (0.05) and good Pearson correlation values.
Overall, the HDEM method was the best performing for the task under study.
4. Discussion
Recent studies have assessed the importance of different HRV parameters in the early detection of cardiovascular diseases [74,75,76] with promising results, thus increasing the research and clinical interest in such features. The PPG is a convenient way to measure the HRV using a home-based device or in a clinical environment due to being a non-invasive, low intrusive single sensor system with competitive production cost [77]. Data compression algorithms may be used to reduce data sizes, an interesting feature for home-based monitoring systems [78].
The herein presented work explored three algorithms for peak detection and evaluated the obtained HRV parameters relative to the ground truth. Regarding the peak detection on the ECG signal, the HDEM achieved the best sensitivity with 99.07% and an error detection rate of 2.78%. On the PPG, this algorithm also achieved the best results with a sensitivity and error detection rate of 99.45% and 1.35%, respectively. Regarding sensitivity, the proposed HDEM algorithm for ECG and PPG pairs with the Table 1 results which rank above 99%, although comparisons should be made with caution given that different databases have been used in the reported studies.
HRV parameters extracted from each evaluated peak detection algorithms were also analysed. In the ECG, no significant differences were found between the gold standard HRV derived values and the algorithms-based parameters. For the PPG, the HDEM was the only method presenting p-values above the significant threshold (0.05) value. This deemed the HDEM as the best performing algorithm within the presented framework. Additionally, the HDEM computational cost stands as the lowest of the T-test validated algorithms. Under the HDEM framework, it is concluded that the PPG and the ECG produce similar sensitivity results, thus approving the PPG as an alternative to the ECG.
The following studies presented similar results to the herein achieved, but it must be considered that different evaluation metrics were used as well as different datasets:
- Lu et al. [51] found a high correlation (0.99) between the PPG and the ECG.
- Bánhalmi et al. [52] found an IBI mean deviation between the ECG and the PPG of 0.01 to 0.06 milliseconds.
- The results presented by Lam et al. [57] are in agreement with the herein obtained outcome for a wavelet transform-based algorithm. In both studies, the PPG extracted HRV parameters scored poorly relative to the ECG.
- Chakraborty et al. [48] used the Hilbert Transform to detect PPG peaks in which an amplitude threshold of 50% was defined. In the herein presented work, in the HDEM algorithm no threshold value is required.
5. Conclusions
To summarise, the following highlights apply:
- Three peak detector methods were tested for the PPG and the ECG. In this context, peak detection accuracy is crucial in applications such as HRV parameter extraction.
- The PPG has been found as a valid replacement to the ECG, regarding the extraction of the HRV features. This may be of interest in applications where one may take advantage of the reduced number of required sensors and their flexible location, for the PPG acquisition.
- A new peak detector method (HDEM) was implemented whose main advantage is precluding the need for a thresholding criteria definition. Thresholding usually leads to missed peaks due to defective tracking of the signal amplitude or interference sources.
- As far as the HDEM is concerned, the low computational cost makes the method suitable for real-time applications and home-based monitoring systems based on the PPG or the ECG.
Author Contributions
Conceptualization, F.E. and A.B.; methodology, F.E. and A.B.; software, F.E. and A.B.; validation, F.E., A.B., V.V., S.R. and M.O.; formal analysis, F.E., A.B., V.V., S.R. and M.O.; investigation, F.E., A.B., V.V., S.R. and M.O.; resources, F.E., A.B., V.V., S.R. and M.O.; data curation, F.E. and A.B.; writing—original draft preparation, F.E. and A.B.; writing—review and editing, F.E., A.B., V.V., S.R. and M.O.; visualization, F.E. and A.B.; supervision, A.B., V.V. and M.O.; project administration, A.B., V.V. and M.O.; funding acquisition, A.B., V.V. and M.O. All authors have read and agreed to the published version of the manuscript.
Funding
This research was funded by FCT and NMT, S.A. in the scope of the project PD/BDE/150312/2019 and under the project UIDB/00066/2020 (FCT).
Institutional Review Board Statement
The study was conducted in accordance with the Declaration of Helsinki and approved by the Ethics Committee of Hospital da Senhora de Oliveira Ethics Commission with Reference Number 86/2019.
Informed Consent Statement
Informed consent was obtained from all subjects involved in the study.
Data Availability Statement
Not applicable.
Conflicts of Interest
The authors declare no conflict of interest.
References
- Mensah, G.A.; Wei, G.S.; Sorlie, P.D.; Fine, L.J.; Rosenberg, Y.; Kaufmann, P.G.; Mussolino, M.E.; Hsu, L.L.; Addou, E.; Engelgau, M.M.; et al. Decline in Cardiovascular Mortality. Circ. Res. 2017, 120, 366–380. [Google Scholar] [CrossRef] [PubMed]
- Amini, M.; Zayeri, F.; Salehi, M. Trend analysis of cardiovascular disease mortality, incidence, and mortality-to-incidence ratio: Results from global burden of disease study 2017. BMC Public Health 2021, 21, 401. [Google Scholar] [CrossRef] [PubMed]
- WHO. The Top 10 Causes of Death. 2020. Available online: https://www.who.int/news-room/fact-sheets/detail/the-top-10-causes-of-death (accessed on 1 March 2022).
- Moser, M.; Lehofer, M.; Sedminek, A.; Lux, M.; Zapotoczky, H.G.; Kenner, T.; Noordergraaf, A. Heart rate variability as a prognostic tool in cardiology. A contribution to the problem from a theoretical point of view. Circulation 1994, 90, 1078–1082. [Google Scholar] [CrossRef] [PubMed] [Green Version]
- Mazzeo, A.T.; La Monaca, E.; Di Leo, R.; Vita, G.; Santamaria, L.B. Heart rate variability: A diagnostic and prognostic tool in anesthesia and intensive care. Acta Anaesthesiol. Scand. 2011, 55, 797–811. [Google Scholar] [CrossRef]
- Kristal-Boneh, E.; Raifel, M.; Froom, P.; Ribak, J. Heart rate variability in health and disease. Scand. J. Work. Environ. Health 1995, 21, 85–95. [Google Scholar] [CrossRef] [Green Version]
- Malik, M. Task Force of the European Society of Cardiology the North American Society of Pacing Electrophysiology Guidelines Heart rate variability. Eur. Heart J. 1996, 17, 354–381. [Google Scholar] [CrossRef] [Green Version]
- Alqaraawi, A.; Alwosheel, A.; Alasaad, A. Heart rate variability estimation in photoplethysmography signals using Bayesian learning approach. Healthc. Technol. Lett. 2016, 3, 136–142. [Google Scholar] [CrossRef] [Green Version]
- Kaufmann, T.; Sütterlin, S.; Schulz, S.M.; Vögele, C. ARTiiFACT: A tool for heart rate artifact processing and heart rate variability analysis. Behav. Res. Methods 2011, 43, 1161–1170. [Google Scholar] [CrossRef]
- Hinde, K.; White, G.; Armstrong, N. Wearable Devices Suitable for Monitoring Twenty Four Hour Heart Rate Variability in Military Populations. Sensors 2021, 21, 1061. [Google Scholar] [CrossRef]
- Steijlen, A.S.; Jansen, K.M.; Albayrak, A.; Verschure, D.O.; Van Wijk, D.F. A Novel 12-Lead Electrocardiographic System for Home Use: Development and Usability Testing. JMIR mHealth uHealth 2018, 6, e10126. [Google Scholar] [CrossRef]
- Einthoven, W. The galvanometric registration of the human electrocardiogram, likewise a review of the use of the capillary-electrometer in physiology. Ann. Noninvasive Electrocardiol. 1997, 2, 93. [Google Scholar] [CrossRef]
- Imtiaz, S.A.; Mardell, J.; Saremi-Yarahmadi, S.; Rodriguez-Villegas, E. ECG artefact identification and removal in mHealth systems for continuous patient monitoring. Healthc. Technol. Lett. 2016, 3, 171–176. [Google Scholar] [CrossRef] [PubMed] [Green Version]
- Elgendi, M. On the Analysis of Fingertip Photoplethysmogram Signals. Curr. Cardiol. Rev. 2012, 8, 14–25. [Google Scholar] [CrossRef] [PubMed]
- Bradke, B.; Everman, B. Investigation of Photoplethysmography Behind the Ear for Pulse Oximetry in Hypoxic Conditions with a Novel Device (SPYDR). Biosensors 2020, 10, 34. [Google Scholar] [CrossRef] [Green Version]
- Hernando, A.; Peláez-Coca, M.D.; Lozano, M.T.; Lázaro, J.; Gil, E. Finger and forehead PPG signal comparison for respiratory rate estimation. Physiol. Meas. 2019, 40, 095007. [Google Scholar] [CrossRef] [Green Version]
- Bashar, S.K.; Han, D.; Hajeb-Mohammadalipour, S.; Ding, E.; Whitcomb, C.; McManus, D.D.; Chon, K.H. Atrial Fibrillation Detection from Wrist Photoplethysmography Signals Using Smartwatches. Sci. Rep. 2019, 9, 15054. [Google Scholar] [CrossRef]
- Moraes, J.; Rocha, M.; Vasconcelos, G.; Vasconcelos Filho, J.; de Albuquerque, V.; Alexandria, A. Advances in Photopletysmography Signal Analysis for Biomedical Applications. Sensors 2018, 18, 1894. [Google Scholar] [CrossRef] [Green Version]
- Chen, Y.; Li, D.; Li, Y.; Ma, X.; Wei, J. Use Moving Average Filter to Reduce Noises in Wearable PPG During Continuous Monitoring. eHealth 2017, 181, 193–203. [Google Scholar]
- Ram, M.R.; Madhav, K.V.; Krishna, E.H.; Komalla, N.R.; Reddy, K.A. A Novel Approach for Motion Artifact Reduction in PPG Signals Based on AS-LMS Adaptive Filter. IEEE Trans. Instrum. Meas. 2012, 61, 1445–1457. [Google Scholar] [CrossRef]
- Santos, S.A.; Venema, B.; Leonhardt, S. Accelerometer-assisted PPG Measurement During Physical Exercise Using the LAVIMO Sensor System. Acta Polytech. 2012, 52. [Google Scholar] [CrossRef]
- Xiang, Y.; Lin, Z.; Meng, J. Automatic QRS complex detection using two-level convolutional neural network. Biomed. Eng. Online 2018, 17, 13. [Google Scholar] [CrossRef] [PubMed] [Green Version]
- Vadrevu, S.; Manikandan, M.S. A Robust Pulse Onset and Peak Detection Method for Automated PPG Signal Analysis System. IEEE Trans. Instrum. Meas. 2019, 68, 807–817. [Google Scholar] [CrossRef]
- Álvarez, R.A.; Penín, A.J.M.; Sobrino, X.A.V. A Comparison of Three QRS Detection Algorithms Over a Public Database. Procedia Technol. 2013, 9, 1159–1165. [Google Scholar] [CrossRef] [Green Version]
- Esgalhado, F.; Fernandes, B.; Vassilenko, V.; Batista, A.; Russo, S. The Application of Deep Learning Algorithms for PPG Signal Processing and Classification. Computers 2021, 10, 158. [Google Scholar] [CrossRef]
- Pan, J.; Tompkins, W.J. A Real-Time QRS Detection Algorithm. IEEE Trans. Biomed. Eng. 1985, 32, 230–236. [Google Scholar] [CrossRef]
- Okada, M. A Digital Filter for the QRS Complex Detection. IEEE Trans. Biomed. Eng. 1979, 26, 700–703. [Google Scholar] [CrossRef]
- Hadjileontiadis, L.J.; Panoulas, K.I.; Penzel, T.; Panas, S.M. Performance of three QRS detection algorithms during sleep: A comparative study. Annu. Int. Conf. IEEE Eng. Med. Biol. 2001, 2, 1954–1957. [Google Scholar] [CrossRef]
- Hamilton, P.S.; Tompkins, W.J. Quantitative Investigation of QRS Detection Rules Using the MIT/BIH Arrhythmia Database. IEEE Trans. Biomed. Eng. 1986, 33, 1157–1165. [Google Scholar] [CrossRef]
- Dohare, A.K.; Kumar, V.; Kumar, R. An efficient new method for the detection of QRS in electrocardiogram. Comput. Electr. Eng. 2014, 40, 1717–1730. [Google Scholar] [CrossRef]
- Paoletti, M.; Marchesi, C. Discovering dangerous patterns in long-term ambulatory ECG recordings using a fast QRS detection algorithm and explorative data analysis. Comput. Methods Programs Biomed. 2006, 82, 20–30. [Google Scholar] [CrossRef]
- Gutierrez-Rivas, R.; Garcia, J.J.; Marnane, W.P.; Hernandez, A. Novel Real-Time Low-Complexity QRS Complex Detector Based on Adaptive Thresholding. IEEE Sens. J. 2015, 15, 6036–6043. [Google Scholar] [CrossRef]
- De Cooman, T.; Goovaerts, G.; Varon, C.; Widjaja, D.; Willemen, T.; Van Huffel, S. Heart beat detection in multimodal data using automatic relevant signal detection. Physiol. Meas. 2015, 36, 1691–1704. [Google Scholar] [CrossRef]
- Elgendi, M. Fast QRS Detection with an Optimized Knowledge-Based Method: Evaluation on 11 Standard ECG Databases. PLoS ONE 2013, 8, e73557. [Google Scholar] [CrossRef] [PubMed] [Green Version]
- Martínez, A.; Alcaraz, R.; Rieta, J.J. Application of the phasor transform for automatic delineation of single-lead ECG fiducial points. Physiol. Meas. 2010, 31, 1467–1485. [Google Scholar] [CrossRef] [PubMed]
- Avanzato, R.; Beritelli, F. Automatic ECG Diagnosis Using Convolutional Neural Network. Electronics 2020, 9, 951. [Google Scholar] [CrossRef]
- Li, J.; Si, Y.; Xu, T.; Jiang, S. Deep Convolutional Neural Network Based ECG Classification System Using Information Fusion and One-Hot Encoding Techniques. Math. Probl. Eng. 2018, 2018, 7354081. [Google Scholar] [CrossRef]
- Pambudi Utomo, T.; Nuryani, N.; Satriyo Nugroho, A. Automatic QRS-complex peak detector based on moving average and thresholding. J. Phys. Conf. Ser. 2019, 1153, 012039. [Google Scholar] [CrossRef]
- Wu, L.; Xie, X.; Wang, Y. ECG Enhancement and R-Peak Detection Based on Window Variability. Heathcare 2021, 9, 227. [Google Scholar] [CrossRef] [PubMed]
- Shin, H.S.; Lee, C.; Lee, M. Adaptive threshold method for the peak detection of photoplethysmographic waveform. Comput. Biol. Med. 2009, 39, 1145–1152. [Google Scholar] [CrossRef]
- Farooq, U.; Jang, D.G.; Park, J.H.; Park, S.H. PPG delineator for real-time ubiquitous applications. In Proceedings of the 2010 Annual International Conference of the IEEE Engineering in Medicine and Biology, Buenos Aires, Argentina, 31 August–4 September 2010; pp. 4582–4585. [Google Scholar]
- Argüello-Prada, E.J. The mountaineer’s method for peak detection in photoplethysmographic signals. Rev. Fac. Ing. Univ. Antioquia 2019, 90, 42–50. [Google Scholar] [CrossRef] [Green Version]
- Jiang, W.J.; Wittek, P.; Zhao, L.; Gao, S.C. Adaptive thresholding with inverted triangular area for real-time detection of the heart rate from photoplethysmogram traces on a smartphone. In Proceedings of the 2014 36th Annual International Conference of the IEEE Engineering in Medicine and Biology Society, Chicago, IL, USA, 26–30 August 2014; pp. 3212–3215. [Google Scholar]
- Lin, S.-T.; Chen, W.-H.; Lin, Y.-H. A Pulse Rate Detection Method for Mouse Application Based on Multi-PPG Sensors. Sensors 2017, 17, 1628. [Google Scholar] [CrossRef] [PubMed] [Green Version]
- Jang, D.-G.; Park, S.; Hahn, M.; Park, S.-H. A Real-Time Pulse Peak Detection Algorithm for the Photoplethysmogram. Int. J. Electron. Electr. Eng. 2014, 2, 45–49. [Google Scholar] [CrossRef]
- Kuntamalla, S.; Ram Gopal Reddy, L. An Efficient and Automatic Systolic Peak Detection Algorithm for Photoplethysmographic Signals. Int. J. Comput. Appl. 2014, 97, 18–23. [Google Scholar] [CrossRef]
- Elgendi, M.; Norton, I.; Brearley, M.; Abbott, D.; Schuurmans, D. Systolic Peak Detection in Acceleration Photoplethysmograms Measured from Emergency Responders in Tropical Conditions. PLoS ONE 2013, 8, e76585. [Google Scholar] [CrossRef] [Green Version]
- Chakraborty, A.; Sadhukhan, D.; Mitra, M. A Robust PPG Onset and Systolic Peak Detection Algorithm Based on Hilbert Transform. In Proceedings of the 2020 IEEE Calcutta Conference, Kolkata, India, 28–29 February 2020; pp. 176–180. [Google Scholar] [CrossRef]
- Vescio, B.; Salsone, M.; Gambardella, A.; Quattrone, A. Comparison between Electrocardiographic and Earlobe Pulse Photoplethysmographic Detection for Evaluating Heart Rate Variability in Healthy Subjects in Short- and Long-Term Recordings. Sensors 2018, 18, 844. [Google Scholar] [CrossRef] [Green Version]
- Selvaraj, N.; Jaryal, A.; Santhosh, J.; Deepak, K.K.; Anand, S. Assessment of heart rate variability derived from finger-tip photoplethysmography as compared to electrocardiography. J. Med. Eng. Technol. 2008, 32, 479–484. [Google Scholar] [CrossRef] [PubMed]
- Lu, S.; Zhao, H.; Ju, K.; Shin, K.; Lee, M.; Shelley, K.; Chon, K.H. Can Photoplethysmography Variability Serve as an Alternative Approach to Obtain Heart Rate Variability Information? J. Clin. Monit. Comput. 2008, 22, 23–29. [Google Scholar] [CrossRef]
- Bánhalmi, A.; Borbás, J.; Fidrich, M.; Bilicki, V.; Gingl, Z.; Rudas, L. Analysis of a Pulse Rate Variability Measurement Using a Smartphone Camera. J. Healthc. Eng. 2018, 2018, 4038034. [Google Scholar] [CrossRef] [PubMed]
- Mejía-Mejía, E.; Budidha, K.; Abay, T.Y.; May, J.M.; Kyriacou, P.A. Heart Rate Variability (HRV) and Pulse Rate Variability (PRV) for the Assessment of Autonomic Responses. Front. Physiol. 2020, 11, 779. [Google Scholar] [CrossRef] [PubMed]
- Chang, F.C.; Chang, C.K.; Chiu, C.; Hsu, S.F.; Lin, Y.D. Variations of HRV analysis in different approaches. In Proceedings of the 2007 Computers in Cardiology, Durham, NC, USA, 30 September–3 October 2007; pp. 17–20. [Google Scholar]
- Constant, I.; Laude, D.; Murat, I.; Elghozi, J.L. Pulse rate variability is not a surrogate for heart rate variability. Clin. Sci. 1999, 97, 391–397. Available online: http://www.ncbi.nlm.nih.gov/pubmed/10491338 (accessed on 1 March 2022). [CrossRef]
- Lu, G.; Yang, F. Limitations of Oximetry to Measure Heart Rate Variability Measures. Cardiovasc. Eng. 2009, 9, 119–125. [Google Scholar] [CrossRef] [PubMed]
- Lam, E.; Aratia, S.; Wang, J.; Tung, J. Measuring Heart Rate Variability in Free-Living Conditions Using Consumer-Grade Photoplethysmography: Validation Study. JMIR Biomed. Eng. 2020, 5, e17355. [Google Scholar] [CrossRef]
- Jan, H.-Y.; Chen, M.-F.; Fu, T.-C.; Lin, W.-C.; Tsai, C.-L.; Lin, K.-P. Evaluation of Coherence Between ECG and PPG Derived Parameters on Heart Rate Variability and Respiration in Healthy Volunteers With/Without Controlled Breathing. J. Med. Biol. Eng. 2019, 39, 783–795. [Google Scholar] [CrossRef] [Green Version]
- Teng, X.F.; Zhang, Y.T. Study on the peak interval variability of photoplethysmogtaphic signals. In Proceedings of the IEEE EMBS Asian-Pacific Conference on Biomedical Engineering, Kyoto, Japan, 20–22 October 2003; pp. 140–141. [Google Scholar]
- Kiran kumar, C.; Manaswini, M.; Maruthy, K.N.; Siva Kumar, A.V.; Mahesh kumar, K. Association of Heart rate variability measured by RR interval from ECG and pulse to pulse interval from Photoplethysmography. Clin. Epidemiol. Glob. Health 2021, 10, 100698. [Google Scholar] [CrossRef]
- Lu, G.; Yang, F.; Taylor, J.A.; Stein, J.F. A comparison of photoplethysmography and ECG recording to analyse heart rate variability in healthy subjects. J. Med. Eng. Technol. 2009, 33, 634–641. [Google Scholar] [CrossRef]
- Yap, J.H.; Jeong, D.U. Design and Implementation of Ubiquitous ECG Monitoring System by Using Android Tablet. In Ubiquitous Information Technologies and Applications; Springer: Berlin/Heidelberg, Germany, 2013; pp. 269–277. [Google Scholar]
- Kim, B.-H.; Noh, Y.-H.; Jeong, D.-U. A Wearable ECG Monitoring System Using Adaptive EMD Filter Based on Activity Status. In Proceedings of the 2015 IEEE 29th International Conference on Advanced Information Networking and Applications Workshops, Gwangiu, Korea, 24–27 March 2015; pp. 11–16. [Google Scholar]
- Allen, J.; Murray, A. Effects of filtering on multi-site photoplethysmography pulse waveform characteristics. In Proceedings of the Computers in Cardiology, Kyoto, Japan, 27 June–1 July 2004; pp. 485–488. [Google Scholar]
- Béres, S.; Hejjel, L. The minimal sampling frequency of the photoplethysmogram for accurate pulse rate variability parameters in healthy volunteers. Biomed. Signal Process. Control 2021, 68, 102589. [Google Scholar] [CrossRef]
- Sahambi, J.S.; Tandon, S.N.; Bhatt, R.K.P. A new approach for on-line ECG characterization. In Proceedings of the Proceedings of the 1996 Fifteenth Southern Biomedical Engineering Conference, Dayton, OH, USA, 29–31 March 1996; pp. 409–411. [Google Scholar]
- Cardoso, F.E.; Vassilenko, V.; Batista, A.; Bonifácio, P.; Martin, S.R.; Muñoz-Torrero, J.; Ortigueira, M. Improvements on Signal Processing Algorithm for the VOPITB Equipment. In Doctoral Conference on Computing, Electrical and Industrial Systems; Springer: Cham, Sweitzerland, 2021; pp. 324–330. [Google Scholar]
- Ouahabi, A.; Castanié, F. Signal and Image Multiresolution Analysis. 2013. Available online: https://doi.org/10.1002/9781118568767 (accessed on 1 March 2022).
- Cohen, L. Time-Frequency Analysis; Prentice-Hall: Englewood Cliffs, NJ, USA, 1995; ISBN1 0135945321. Available online: https://catalogue.nla.gov.au/Record/510802 (accessed on 1 March 2022)ISBN2 0135945321.
- D’Aloia, M.; Longo, A.; Rizzi, M. Noisy ECG Signal Analysis for Automatic Peak Detection. Information 2019, 10, 35. [Google Scholar] [CrossRef]
- Mirescu, S.; Harden, S. Nonlinear dynamics methods for assessing heart rate variability in patients with recent myocyrdial infarction. Rom. J. Biophys. 2012, 22, 117–124. [Google Scholar]
- Kim, T.K. T test as a parametric statistic. Korean J. Anesthesiol. 2015, 68, 540. [Google Scholar] [CrossRef] [Green Version]
- Fisher, R.A. Statistical Methods for Research Workers; Hafner: New York, NY, USA, 1958; pp. 66–70. [Google Scholar]
- Fang, S.-C.; Wu, Y.-L.; Tsai, P.-S. Heart Rate Variability and Risk of All-Cause Death and Cardiovascular Events in Patients With Cardiovascular Disease: A Meta-Analysis of Cohort Studies. Biol. Res. Nurs. 2020, 22, 45–56. [Google Scholar] [CrossRef]
- Hillebrand, S.; Gast, K.B.; de Mutsert, R.; Swenne, C.A.; Jukema, J.W.; Middeldorp, S.; Rosendaal, F.R.; Dekkers, O.M. Heart rate variability and first cardiovascular event in populations without known cardiovascular disease: Meta-analysis and dose–response meta-regression. EP Eur. 2013, 15, 742–749. [Google Scholar] [CrossRef]
- Tsuji, H.; Larson, M.G.; Venditti, F.J.; Manders, E.S.; Evans, J.C.; Feldman, C.L.; Levy, D. Impact of Reduced Heart Rate Variability on Risk for Cardiac Events. Circulation 1996, 94, 2850–2855. [Google Scholar] [CrossRef] [PubMed]
- Ghamari, M. A review on wearable photoplethysmography sensors and their potential future applications in health care. Int. J. Biosens. Bioelectron. 2018, 4, 195–202. [Google Scholar] [CrossRef] [PubMed] [Green Version]
- Bent, B.; Lu, B.; Kim, J.; Dunn, J.P. Biosignal compression toolbox for digital biomarker discovery. Sensors 2021, 21, 516. [Google Scholar] [CrossRef] [PubMed]
Figure 1.
The FBPD methodology for PPG peak detection.

Figure 2.
Flowchart of Wavelet algorithm (adapted from [67]).
Figure 2.
Flowchart of Wavelet algorithm (adapted from [67]).

Figure 3.
Flowchart of Hilbert Envelope implemented in HDEM.

Figure 4.
Flowchart of the proposed peak detection algorithm based on the HDEM.

Figure 5.
Flowchart summary of the applied methodology.


Table 1.
Performance evaluation in peak detection for ECG and PPG signals.
| Study | Signal | Peak Detection Algorithm | Number of Subjects | Sensitivity (%) | Positive Predictive Value (%) | Error Detection Rate (%) |
|---|---|---|---|---|---|---|
| Pan et al. [26] | ECG | Digital Filter | 48 | 99.30 | NA | 0.67 |
| Okada et al. [27] | ECG | Digital Filter | 4 | 99.80 | NA | NA |
| Hadjileontiadis et al. [28] | ECG | Higher-Order Statistics | 4 | 99.95 | NA | NA |
| Hamilton et al. [29] | ECG | Digital Filter | 47 | 99.69 | 99.77 | 0.54 |
| Dohare et al. [30] | ECG | Sixth Power of Signal | 368 | 99.52 | 99.69 | NA |
| Paoletti et al. [31] | ECG | Karhunen–Loève Transform | 47 | 99.15 | NA | 0.85 |
| Gutiérrez-Rivas et al. [32] | ECG | Finite-State Machine | 89 | 99.54 | 99.74 | NA |
| Cooman et al. [33] | ECG | Difference Operation | 300 | 97.11 | 97.75 | NA |
| Elgendi et al. [34] | ECG | Digital Filter | 47 | 99.78 | NA | NA |
| Martínez et al. [35] | ECG | Phasor Transform | 343 | 99.81 | 99.89 | NA |
| Xiang et al. [22] | ECG | Convolutional Neural Network | 47 | 99.77 | 99.91 | 0.32 |
| Avanzato et al. [36] | ECG | Convolutional Neural Network | 47 | 98.33 | 98.35 | 1.66 |
| Li et al. [37] | ECG | Convolutional Neural Network | 47 | 99.30 | 98.70 | NA |
| Utomo et al. [38] | ECG | Moving Average | 10 | 99.26 | 99.01 | NA |
| Wu et al. [39] | ECG | Moving Average | 48 | 99.65 | 99.39 | NA |
| Vadrevu et al. [23] | PPG | Wavelet Transform | 16 | 99.66 | 99.90 | NA |
| Shin et al. [40] | PPG | Adaptative Threshold | 18 | 98.84 | 99.98 | 1.18 |
| Farooq et al. [41] | PPG | Adaptative Threshold | 35 | 96.89 | 94.55 | 8.47 |
| Argüello-Prada [42] | PPG | Adaptative Threshold | 8 | 98.85 | 98.57 | 2.61 |
| Jiang et al. [43] | PPG | Incremental-Merge Segmentation | 24 | 98.00 | 98.80 | NA |
| Lin et al. [44] | PPG | Adaptative Threshold | 21 | 98.50 | 99.85 | 0.15 |
| Jang et al. [45] | PPG | Digital Filter | 117 | 96.45 | 60.57 | NA |
| Kuntamalla et al. [46] | PPG | Moving Average | 47 | 99.82 | 98.88 | NA |
| Elgendi et al. [47] | PPG | Moving Average | 40 | 99.84 | 99.89 | NA |
| Chakraborty et al. [48] | PPG | Hilbert Transform | 212 | 99.98 | 100.00 | 0.00 |
Table 2.
Comparison of HRV parameters from ECG and PPG signals.
| Study | Number of Subjects | Sample Rate (Hz) | Recording Duration | Peak Detection Algorithm | Conclusion |
|---|---|---|---|---|---|
| Chang et al. [54] | 10 | 250 | 5 min | ECG: First Derivative PPG: Neighboring Peak Searching | Differences between the time and frequency domain features were found between the ECG and PPG |
| Constant et al. [55] | 20 | 500 | 5 min | Derivative Processes | HRV should be studied using the ECG signal |
| Lu et al. [56] | 36 | 1000 | 5 min | ECG: First Derivative PPG: Neighboring Peak Searching | The PPG was less reliable than the ECG due to its vulnerability to motion artefacts |
| Lam et al. [57] | 10 | NA | 90 min | Discrete Wavelet Transform | The PPG was a poor surrogate for ECG HRV |
| Jam et al. [58] | 30 | 1250 | 25 min | Double Difference and Interval Processing | PPG cannot be applied as a HRV screening tool for cardiopulmo-nary analysis with a controlled breathing maneuver |
| Selvaraj et al. [50] | 10 | 1000 | 5 min | NA | A reliable HRV estimation can be obtained from the PPG |
| Lu et al. [51] | 10 | 400 | 20 min | Empirical Mode Decomposition | HRV parameters for the PPG and ECG were highly correlated |
| Teng et al. [59] | 16 | 1000 | NA | NA | During rest, the PPG and ECG derived HRV were similar. After exercise session the HRV diffe-rence increased |
| Bánhalmi et al. [52] | 50 | 500 (ECG)240 (PPG) | 5 min | Local Maximum and Moving Window | HRV from the PPG demonstrated high accuracy |
| Mejía-Mejía et al. [53] | 20 | 1000 | 2 min | Derivative Calculation | HRV responds to cold exposure differently in the ECG and PPG signals, especially in peripheral locations |
| Vescio et al. [49] | 20 | 1000 | −20 min −24 h | NA | PPG was suitable for short and long-term HRV monitoring |
| Kumar et al. [60] | 50 | NA | 10 min | KUBIOS 1.1 platform | A good agreement between HRV variables from ECG and PPG was found |
| Lu et al. [61] | 42 | 200 (ECG)100 (PPG) | 7 min | ECG: First Derivative PPG: Neighboring Peak Searching | HRV analysis of signals derived from the ECG and earlobe PPG recordings are almost identical in healthy subjects |
Table 3.
Peak detection performance evaluation on ECG and PPG signals.
| Signal | Peak Detection Algorithm | Sensitivity (Se%) | Positive Predictive Value (PPV%) | Error Detection Rate (EDR%) | Mean Processing Time Per Case (s) |
|---|---|---|---|---|---|
| ECG | Pan-Tompkins | 97.61 | 98.06 | 4.32 | 0.94 |
| ECG | Wavelet | 97.66 | 98.04 | 4.30 | 4.71 |
| ECG | HDEM | 99.07 | 98.17 | 2.78 | 0.82 |
| PPG | FBPD | 59.82 | 96.80 | 42.15 | 0.12 |
| PPG | Wavelet | 84.11 | 97.53 | 18.03 | 6.34 |
| PPG | HDEM | 99.45 | 99.21 | 1.34 | 0.81 |
Table 4.
Pearson correlation, T-test and RMSE results for HRV features.
| Peak Detection Algorithm | Signal | IBI Mean | SDNN | LF Power Peak | HF Power Peak | S1 | S2 | |
|---|---|---|---|---|---|---|---|---|
| Pan-Tompkins | ECG | 0.99 | 0.82 | 0.98 | 0.76 | 0.93 | 0.98 | |
| p-value | 0.92 | 0.48 | 0.96 | 0.27 | 0.61 | 0.73 | ||
| RMSE | 0.02 | 55.00 | 1.17 × 10⁻² | 9.20 × 10⁻² | 40.15 | 39.49 | ||
| Wavelet | ECG | 0.99 | 0.82 | 0.95 | 0.75 | 0.94 | 0.98 | |
| p-value | 0.89 | 0.50 | 0.83 | 0.24 | 0.64 | 0.77 | ||
| RMSE | 0.02 | 54.17 | 1.91 × 10⁻² | 0.10 | 38.85 | 40.71 | ||
| HDEM | ECG | 0.99 | 0.72 | 0.92 | 0.82 | 0.88 | 0.97 | |
| p-value | 0.88 | 0.19 | 0.96 | 0.46 | 0.58 | 0.85 | ||
| RMSE | 5.8 × 10⁻³ | 52.92 | 1.69 × 10⁻² | 7.21 × 10⁻² | 35.93 | 41.41 | ||
| FBPD | PPG | 0.15 | 0.03 | 0.63 | 0.58 | 0.14 | 0.26 | |
| p-value | 0.26 | 1.20 × 10⁻² * | 0.01 * | 0.08 | 0.01 * | 0.01 * | ||
| RMSE | 63.33 | 1.25 × 10⁴ | 4.15 | 0.15 | 1.19 × 10⁴ | 1.27 × 10⁴ | ||
| Wavelet | PPG | 0.97 | 0.15 | 0.76 | 0.72 | 0.27 | 0.41 | |
| p-value | 0.11 | 4.81 × 10⁻⁵ * | 0.10 | 0.32 | 1.47 × 10⁻⁴ * | 5.79 × 10⁻⁴ * | ||
| RMSE | 0.16 | 8.48 × 10² | 3.83 × 10⁻² | 0.13 | 8.05 × 10² | 7.88 × 10² | ||
| HDEM | PPG | 0.99 | 0.97 | 0.91 | 0.95 | 0.98 | 0.99 | |
| p-value | 0.88 | 0.63 | 0.67 | 0.37 | 0.79 | 0.24 | ||
| RMSE | 5.8 × 10⁻² | 16.93 | 2.37 × 10⁻² | 5.78 × 10⁻² | 12.02 | 26.71 |
* The significant threshold p-value (0.05) was not attained.
Publisher’s Note: MDPI stays neutral with regard to jurisdictional claims in published maps and institutional affiliations. |
© 2022 by the authors. Licensee MDPI, Basel, Switzerland. This article is an open access article distributed under the terms and conditions of the Creative Commons Attribution (CC BY) license (https://creativecommons.org/licenses/by/4.0/).
Share and Cite
MDPI and ACS Style
Esgalhado, F.; Batista, A.; Vassilenko, V.; Russo, S.; Ortigueira, M. Peak Detection and HRV Feature Evaluation on ECG and PPG Signals. Symmetry 2022, 14, 1139. https://doi.org/10.3390/sym14061139
AMA Style
Esgalhado F, Batista A, Vassilenko V, Russo S, Ortigueira M. Peak Detection and HRV Feature Evaluation on ECG and PPG Signals. Symmetry. 2022; 14(6):1139. https://doi.org/10.3390/sym14061139
Chicago/Turabian StyleEsgalhado, Filipa, Arnaldo Batista, Valentina Vassilenko, Sara Russo, and Manuel Ortigueira. 2022. "Peak Detection and HRV Feature Evaluation on ECG and PPG Signals" Symmetry 14, no. 6: 1139. https://doi.org/10.3390/sym14061139
Note that from the first issue of 2016, this journal uses article numbers instead of page numbers. See further details here.