Abstract
The electrolysis of black liquor (BL) has emerged as a new form to valorize this byproduct from the pulp and paper industry. BL electrolysis produces a green fuel, hydrogen, and lignin, a high added-value compound. In opposition to water electrolysis, a symmetric process with two different gases produced at the electrodes, hydrogen and oxygen, BL electrolysis is seen as an asymmetric process, as hydrogen is the only gas generated (at the cathode), while solid lignin is electrodeposited at the anode. The present work intended to develop a model in Aspen Plus® to simulate BL electrolysis and consequently evaluate the performance of the BL electrolyzer. Aspen Plus® does not include a package for electrolyzers, so it was necessary to use the Aspen Custom Modeler (ACM) tool. The model developed in ACM is valid for the following conditions: nickel electrodes with 2 cm interelectrode distance, cell voltage between 1.5 V and 2.0 V, and temperatures between 25 and 35 °C for batch operation and 25 and 65 °C for continuous operation. Sensitivity analysis demonstrated that the optimum working temperature for batch operation is 35 °C, whereas it is 45 °C for continuous operation. An economic analysis was carried out, calculating the real gross profit (RGP) for the process and the electricity cost. A 2 kW electrolyzer with 80 cells and an active area of 0.3 m2 was simulated. For the electrolyzer in batch operation, RGP values of 1056 €/year and 1867 €/year for the worst and the best scenario were obtained, respectively, and the electricity cost was 1431 €/year. For continuous operation, the RGP values were 2064 €/year and 3648 €/year for the worst and best scenario, respectively, and 2967 €/year for the electricity costs.
1. Introduction
Human actions directly influence the behavior of Earth’s ecosystems. For that reason, since the industrial revolution, Earth’s average temperature has gradually increased. Burning fossil fuels releases carbon dioxide, methane, and other gases into the atmosphere. These gases are the main cause of climate change and the greenhouse effect [1]. It is undeniable that the increase in the Earth’s average temperature is changing the planet [2]. The widespread adoption of renewable energy sources is essential to fight global warming. This requires new policies to incentivize replacing nonrenewable sources with renewable ones. A positive aspect is that the consumption of renewable sources is gradually increasing, including solar, wind, hydroelectric, tidal, wave, biomass, geothermal, or nuclear energy. The use of renewable sources has a much lower impact on the environment. However, they suffer from high installation costs, setup, and the unpredictability of nature, making it challenging to maintain constant production [2].
Hydrogen is an energy carrier with enormous potential for the necessary energy transition. It is a clean fuel because its combustion only produces water vapor and heat. Another advantage is that its higher heating value (HHV) per mass is three times higher than gasoline [3,4]. Fossil fuels are currently the primary source of hydrogen production, which is a major disadvantage. One of the solutions is to promote clean ways to produce hydrogen [5].
Thermochemical and electrolysis processes are potential techniques for producing hydrogen. Natural gas reforming and solar thermochemical hydrogen are thermochemical processes [6]. Water electrolysis is a symmetric process that simultaneously generates hydrogen and oxygen simply using water and electricity. This technology is commercially available and can produce hydrogen with 99.9% purity [7]. Moreover, if powered by renewable energy sources, it leads to the so-called green hydrogen. This compatibility with renewable energy makes electrolysis a highly promising technique. Unfortunately, less than 4% of global hydrogen production comes from water electrolysis [7].
The electrolyzer, the piece of equipment where electrolysis is carried out, must always contain an anode, a cathode, and an electrolyte. There are different types of water electrolyzers, including the alkaline water electrolyzer, the proton-exchange membrane electrolyzer, and the solid oxide electrolysis cell. The former is the most mature technology, with the electrode processes described by Equations (1) and (2). KOH and NaOH are the most common electrolytes, with the former being preferred because of the higher ionic conductivity of their solutions [7].
2 H2O + 2 e− → H2 + OH−
4 OH− → O2 + 2 H2O + 4 e−
Electrolytic processes can also be applied to other systems, such as producing renewable synthetic fuels from liquefied biomass. Gonçalves et al. [8] introduced gas mixtures from typical water electrolysis into a reactor containing liquefied biomass to obtain syngas, which can be further used to synthesize second-generation biofuels (e.g., biomethane, biomethanol, bio-dimethyl ether, formic acid). The authors reported that the gas outlet contained a mixture of hydrogen, oxygen, carbon monoxide, carbon dioxide, and methane, the latter reaching a volumetric concentration of 35% [8]. Another application of electrolysis is the direct production of hydrogen from industrial byproducts. In this way, the electrolysis of black liquor (BL), a byproduct of the pulp and paper industry, appears as an exciting technology because it can produce green fuel (i.e., hydrogen) and recover lignin, a product with high market value [4,9]. Hydrogen is generated at the cathode, following the same reaction as in alkaline water electrolyzers (Equation (1)). Remarkably, during BL electrolysis, there is no production of gases (e.g., O2) at the anode, with lignin electrodeposition as the only occurring anodic process. This asymmetric feature allows the BL electrolyzer to obtain high-purity hydrogen without needing a separator [3]. The high energy requirement is a major disadvantage of conventional water electrolysis, making the process unappealing from an economic perspective. Conversely, due to the lower potential for lignin oxidation, the electrolysis of BL requires a significantly lower quantity of energy, making the process more attractive [9,10]. This owes to the fact that lignin electrolysis can start from ca. 0.45 V, a significantly lower potential than that required for water electrolysis, thermodynamically favored from ca. 1.2 V [5].
Lignin is one of nature’s most abundant organic molecules and a major component (15–25%) of biomass from wood [11]. It has a structural function and gives a hydrophobic character, decreasing water loss [12]. Nowadays, 50 million tons of lignin are produced annually as waste in the Kraft process. The lignin in BL is usually burned in a recovery boiler to generate energy [5,13]. The chemical composition of BL depends on the wood used for cooking. Generally, it is composed of a complex mixture of organic and inorganic compounds [10]. Treating the BL is essential from the environmental and economic perspectives. In fact, Kraft pulp mills release several malodorous gases (e.g., hydrogen sulfide, methyl mercaptan, dimethyl sulfide) with noticeable environmental impacts, which could be easily minimized by a moderate investment of pulp mills in proper abatement techniques [14]. Additionally, lignin recovery from BL can have a significant economic impact. Lignin finds many applications as a substitute for phenol in phenolic resins, biodegradable plastic additive, as an adjunct crosslinker in reactions to produce epoxy resins, and it can be used as a sustainable carbon bio source. It can also be applied in fertilizers, food, and cosmetic and health applications [4,13,15].
Santos et al. [7] reviewed water electrolysis technologies for hydrogen production, including the fundamentals of alkaline water electrolysis, its advantages, and constraints. Alkaline water electrolysis is generally seen as a simpler technology; however, improving efficiency by minimizing the system resistances is necessary.
Sanchez et al. [16] proposed a model to evaluate and optimize the performance of an alkaline water electrolysis plant. The model was based on semi-empirical equations describing the cell voltage, Faraday efficiency, and gas purity as a function of the current. Experimental data and calculated values showed excellent correlation, demonstrating the model’s accuracy. Increasing the temperature and reducing the pressure improved the system’s overall performance. The results indicated that pressure’s influence was small compared with temperature. Optimal operating conditions of 5 bar and 80 °C were determined. Other models were developed, for instance, by Ulleberg [17], combining similar approaches to high degrees of fidelity to experimental data and prediction of equipment behavior in transient states.
Caravaca et al. [5] proposed a new technology for hydrogen production through BL electrolysis. The production of hydrogen via electrolysis of lignin solutions was made, for the first time, in continuous operation in a Polymer Electrolyte Membrane (PEM) reactor. It was demonstrated that lignin electrolysis in PEM reactors could produce hydrogen at a much lower voltage than water electrolysis. Caravaca et al. used linear scan voltammetry to follow the current with the applied cell potential. They observed that the minimum thermodynamic cell voltage for water electrolysis was approximately 1.2 V, but when lignin solution was fed to the anode, the current changed linearly with the potential from cell potentials of ca. 0.45 V [5]. Working at high temperatures (<90 °C) yielded better electrolysis performance due to the improved kinetics and conductivity of the polymeric membrane. Cyclic voltammetry studies also demonstrated that lignin oxidation occurred at a potential much lower than oxygen evolution. The voltammograms presented an anodic peak at approximately 0.75 V for the electrooxidation of lignin, followed by a second anodic peak at ca. 0.95 V. The latter is assumed to be related to the formation of an oxide film on the surface of the metallic anode electrocatalyst, considering that oxygen evolution is thermodynamically unfavorable at this potential [5].
Several authors presented simulation and modeling techniques to improve the efficiency of electrolyzers [18,19,20]. Jang et al. [18] introduced a water electrolysis model that considers parameters such as the charge transfer coefficient, resistances, and electrical conductivity. The aim was to investigate the pressure effect on the performance of the alkaline water electrolysis stack and the balance of plant (BOP) power consumption. Another objective was to find the optimal operating pressure to reach the maximum system efficiency. They concluded that an increase in operating pressure increased the reversible cell voltage. However, activation and ohmic overvoltage decreased due to improved bubble kinetics. Moreover, the BOP power consumption rapidly decreased with increasing pressure in the low-pressure range (<10 bar). Increasing pressure would increase hydrogen purity; however, the increase of purity was not significant at approximately >20 bar. Lee et al. [19] proposed a multidimensional and transient model for water electrolysis where the electrochemical reactions and key transport processes were rigorously considered. The model was validated through data obtained experimentally under different conditions. The multidimensional distributions of species concentration, temperature, and current density were also analyzed. Herdem et al. [20] developed a novel thermodynamic model for producing hydrogen from coal gasification and alkaline water electrolysis in parallel and evaluated it through exergy efficiency. The power required was entirely generated in the system; thus, connecting to the electric grid was not needed. The CO2 produced was captured, making the system environmentally friendly. Dolle et al. [21] and Li et al. [22] focused on decreasing the cell voltage during electrolysis. Having that in mind, Dolle et al. [21] studied the replacement of water electrolysis with biomass electrolysis. This is an attractive solution to decrease the hydrogen production costs and valorize wastes from agriculture/forestry and biofuel industries. Li et al. [22] followed a more focused approach, where lignin solutions replaced water, and studied the key operating parameters of the lignin-assisted water electrolysis (LAWE), such as temperature and lignin concentration. An anion-exchange membrane H-type electrolysis cell was built to compare the LAWE with conventional alkaline water electrolysis. Adding lignin was shown to inhibit the oxygen evolution reaction. Moreover, by replacing the latter reaction with the oxidation of lignin, the H-type electrolytic cell could produce hydrogen at a lower cell voltage. Additionally, hydrogen production could be effectively increased by increasing the temperature and lignin concentration. However, the temperature increase also had negative effects, leading to the deactivation of the Ti/PbO2 electrode [22].
This work presented a model for BL electrolysis in the Aspen Custom Modeler suite, which was afterward integrated into the Aspen Plus® process simulator. This model considers several aspects of BL electrolysis, including polarization curves obtained experimentally from industrial BL samples provided by a Portuguese pulp mill and then modeled. To the best of the authors’ knowledge, there are no other works where the modeling of BL electrolysis for hydrogen production is reported.
2. Materials and Methods
2.1. Theoretical Materials
Electrolysis is a process in which a potential difference is applied to generate chemical reactions involving electron transfer (redox reactions). It can split substances into their original elements, such as water into oxygen and hydrogen [23]. An electrolytic cell is constituted by two electrodes immersed in an electrolyte. A membrane often separates the anode and cathode compartments, and an external power source sets the required cell voltage [13].
Electrolytic cells need energy for the reaction to occur. This energy is associated with the overvoltage, η, defined by the difference between the cell voltage, Vcell, and the equilibrium voltage, Vrev (Equation (3)) [7].
η = Vcell − Vrev
Oxidation and reduction reactions take place at the electrodes’ surface. Therefore, the electrodes require some properties, such as corrosion resistance, chemical stability at operating conditions, high electronic conductivity, and low cost. Noble metals, especially platinum, are efficient electrode materials but are not cheap. Because of that, transition metals, such as nickel can be used as electrodes when working in alkaline media. The electrolytes are solutions with high conductivity to lower the resistance and improve the mobility of ions transport between anode and cathode. The electrolyte must be liquid under working conditions, chemically stable, and easy to store and handle. Membranes are a physical separation between an anode and cathode with the primary objective of separating their products. This makes the separation processes easier and cheaper. However, in some specific cases, such as the electrolysis of BL, the membrane is not needed because the products are in different physical states. The use of membranes presents the disadvantages of increased cell resistance and higher electrolyzer cost [7,10].
For the reaction in an electrolytic cell to occur, it is necessary to overcome a series of barriers. These barriers relate to the boundary layers on the surface of the electrode and the total cell resistance (Rcell). Cell resistance is critical; thus, reducing it will increase efficiency. The total resistance of the cell can be calculated by Equation (4),
where Relectric is the resistance of the electric circuit, Ranode and Rcathode are the resistances related to the anodic and cathodic reactions, respectively, Rprod,a and Rprod,c are the resistances related to the anode and cathode products, respectively, and Rion and Rmemb concern the resistances associated to the electrolyte and membrane, respectively.
Rcell = Relectric + Ranode + Rprod,a + Rion + Rmemb + Rcathode + Rprod,c
The reaction resistances (Ranode and Rcathode) are due to the overpotential needed to overcome the activation energies of the electrode reactions. Transport resistances (Rprod,a, Rprod,c, Rmemb, and Rion) are the main reason why the conductivity of the membrane and electrolyte has to be high and the electrode should have a high surface area. Electrical resistance (Relectric) can be calculated by Ohm’s law. By analyzing the different parameters that affect the overpotential, it is possible to improve the performance of an electrolytic cell by changing the work conditions and minimizing the total cell resistance [7].
The minimum theoretical potential required for a reaction to occur is known as the equilibrium or reversible voltage (Vrev). The thermoneutral voltage is the voltage when the cell works adiabatically (Vtn). Above this voltage, the cell is exothermic, and below it is endothermic. The efficiency of the electrolyzer is related to the overpotential and the total resistance. It allows the comparison between different cells. The voltage efficiency (ηvoltage) provides the proportion of effective voltage causing the reaction to occur and can be calculated using Equation (5) [7], where Veanode and Vecathode are the equilibrium potentials for the anode and cathode, respectively. The energetic efficiency (ηenergetic) can be determined by Equation (6), where nH2 is the number of moles of produced hydrogen, HHVH2 is the higher heating value of hydrogen, and W is the electric power [24].
Electrochemical methods are used to study the redox reactions occurring in the electrolyzer. Voltammetry is a method that stands out for its simplicity and low cost. Cyclic voltammetry involves a cyclic scan of the working electrode potential between two potential values and back to the starting value. The resulting current vs. potential plots may be used to determine the reaction’s reversibility, quasi-reversibility, or irreversibility. Similarly, linear scan voltammetry (LSV) records the cell current during a linear scan of the electrode potential, from a potential where no current is passing, the open circuit potential, until a potential where reduction (negative potentials) or oxidation (positive potentials) processes can occur. LSV allows the determination of the electrode polarization curves from where Tafel analysis can be applied [25].
2.2. Experimental Runs
The BL samples were provided by a Portuguese pulp mill. The pulp is produced from wood chips of Eucalyptus Globulus using the Kraft process, and the BL is a byproduct of the pulping process.
To analyze the total solids (TS) present in the BL (Equation (7)), the samples were weighed before (mliquor) and after (msolids) heating in a muffle furnace. The temperature must be high enough to evaporate the water and not decompose the organic compounds.
The ash content corresponding to the inorganic fraction of the solid sample was calculated by Equation (8). It was determined by heating the sample to a temperature where organic compounds are decomposed. The mash is the mass of the remaining solid.
Klason lignin is the insoluble lignin in an acidic environment. Thus, a fraction of the total solids was dissolved in acidic media and filtration was carried out. The remaining solid was the Klason lignin. Furthermore, pH and electrical conductivity were other analyzed parameters with extreme relevance for the electrolyzer’s performance, directly influencing the total resistance. The density of the BL was directly measured using a pycnometer. Oliveira et al. [13] and Belo et al. [26] have detailed these procedures.
The BL samples were used as the electrolyte to obtain the polarization curves for the electrolysis cell. The cell polarization curve, which relates the current density passing in the cell with the applied cell voltage, is necessary to accurately model and simulate the electrolyzer. The polarization curves were obtained using LSV, and replicas were run to ensure reproducibility. The BL electrolysis cell contained two identical nickel plate electrodes with surface area of 22.4 cm2 and 2 cm of interelectrode spacing. The electrodes were connected to an Admiral Instruments (Tempe, AZ, USA) potentiostat, model SquidstatTM Plus. The BL solutions were placed in a PVC beaker of 500 mL, and the temperature was controlled using a CW3-10 Heating Bath Circulator (Lab Companion, Billerica, MA, USA). A Heidolph overhead stirrer with RZR 2051 control (Heidolph Instruments GmbH & Co. KG, Schwabach, Germany) kept the solution homogeneous. A Nahita thermometer ensured the temperature was as desired. LSVs were run at a scan rate of 1 mV/s to polarize the BL electrolysis cell from 0 V to 2.4 V using the Squidstat User Interface 2.0 Beta program.
2.3. Simulation of Black Liquor Electrolysis
Aspen Plus® and Aspen Custom Modeler suits were used to model the electrolytic process, allowing for a pre-optimization of the operating conditions and complementing the experimental data. BL electrolysis is a recent process and the quantity of available data is still limited. There is no detailed information on the global reaction for BL electrolysis and the mechanisms involved in anode and cathode reactions. Parameters such as the thermoneutral voltage, needed for the energy balance, are also unknown. As such, several simplifications are necessary to develop the model. The stoichiometric coefficients were obtained through the experimental mass balance data (Table S1), resorting to some assumptions as described below. Due to the lack of thermoneutral voltage, the heat generated by the stack cannot be separated from the total heat discharged by the system, which was calculated in the model. The Faraday efficiency during the simulation was also considered to be constant. The model does not account for mass losses on the anode due to corrosion, which is negligible during short runs. Additionally, an equation that describes the variation of current with the voltage increase for BL electrolysis is not available, so a simplified equation of the polarization curve for water electrolysis was used to model the experimental data (Equation (10)).
The model for the BL electrolysis should describe the electrochemical behavior through the data provided by the polarization curves, mass, and heat balances. The model was based on the work developed by Sanchez et al., where a model for water electrolysis was reported [16]. The present model should enable the study and a preliminary optimization of a BL electrolysis system for industrial purposes before building a prototype stack. Additionally, it intends to provide estimates for hydrogen production, lignin deposition, and total heat discharged by the system. These are crucial parameters to be considered when designing equipment and assessing electrolyzer performance. To the best of the authors’ knowledge, this is the first model referring to BL electrolysis. Aspen Plus® does not include readily available electrolyzer models and requires developing a semi-empiric custom model in Aspen Custom Modeler (ACM). The ACM model can then be exported to Aspen Plus® and integrated with other models provided by the platform to achieve the desired simulation, including sensitivity analysis [16]. Figure 1 represents the scheme of the electrochemical model of BL electrolysis.
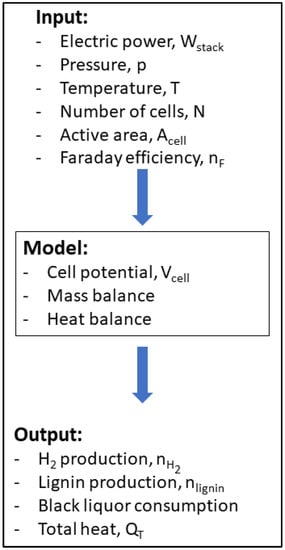
Figure 1.
Scheme of the approach followed to model the BL electrolysis.
The Faraday efficiency (ηF) is the ratio between the actual amount of the product and the theoretical amount of products. For the case of water electrolysis, it can be determined by an empirical equation (Equation (9)), where the efficiency depends on the temperature (T) and current density (j) [16]. This value remains constant during BL electrolysis simulation because no correlation was found.
The current (i) flowing in the BL electrolyzer depends on the cell voltage (Vcell), the electrodes’ surface area (Acell), the interelectrode distance, the electrode material/composition, the temperature (T), pressure (p), and the BL composition. In the model, the influence of p will be neglected due to a lack of available data. Varying feed composition will also be neglected, as the model is built upon experimental data obtained from an industrial BL sample of fairly constant composition. The influence of these two parameters should be analyzed in future work. The polarization curve is related to Vcell, i, T, and Acell. The interelectrode distance and the electrode material are part of the validation range, 2 cm between the nickel plate electrodes.
Due to the cell resistance, Vcell is always higher than Vrev. To assess Vcell, the polarization curve is employed. It relates Vcell with the current density (j) for different operational conditions. Equation (10) is adjusted to the experimental data to determine the polarization curve. Vrev is a parameter that depends on temperature and pressure. However, this value was assumed to be constant at different operation conditions.
The hydrogen production in the cathode depends on the electrochemical behavior of the cell and can be determined by Equation (11) [16], where N is the number of cells in the electrolyzer, z is the number of transferred electrons, and F is Faraday’s constant. Knowing the hydrogen production and the relation between compounds (i.e., the stoichiometric factor), it is possible to estimate the production and consumption of each species.
Through the heat balance, it is possible to obtain the total heat. It includes the heat exchanged with the utility and the heat generated by the electrolyzer. The electric power of the electrolyzer stack, Wstack, is determined according to Equation (12) [16], where Vstack is the total stack voltage of the electrolyzer.
Wstack = Vstack × i = (Vcell × N) (j × Acell)
No consensus has been reached regarding the mechanism that describes the global reaction. Thus, a mass balance provided valuable data for the simulation (Table S1). The mass balance was obtained in a laboratory cell with the following operating conditions: 3 h run time, 3.0 V of applied voltage, 25 °C, and a single cell with identical nickel electrodes (A = 22.4 cm2). The electrical power was 0.915 W.
Only the electrolyzer was simulated without considering any other downstream equipment. To define the components, assumptions are necessary. In the current model, glucose represents sugars, citric acid represents hydroxy-carboxylic acids, and acetic acid represents volatile acids with low molecular weight. Nickel oxidation to NiO (this compound is not compatible with ACM and is given by Ni2+ and O2) and Na2S are simulated as Na+ and S2− (that produces S). The lignin in BL is represented by p coumaryl alcohol (a lignin precursor) [27]. The precipitated lignin is represented by anthracene because the main objective is obtaining the precipitated lignin flow. In this work, only the electrolyzer was simulated. If other equipment were simulated, thermodynamic or dynamic properties would be needed, and the precipitated lignin had to be represented by another molecule or be defined in Aspen Plus®. Thus, the precipitated lignin was not defined in Aspen Plus® due to the lack of information. The assumptions were needed because lignin in Aspen Plus® is not a conventional compound.
The sulfur present in the precipitated lignin is possibly structural. Thus, the sulfur in the outlet is represented by the elementary molecule for the simulation. The formation of NiO accounts for possible anode corrosion, which will eventually require replacement after some time [26].
The coding in ACM was based on the work of Tremblay et al. [28]. After developing the model code in ACM, a simulation in Aspen Plus® was carried out. The modeled system was simulated in a steady-state, and the method used to estimate thermodynamic properties was NRTL (non-random two-liquid) [16]. The required thermodynamic data for p-coumaryl alcohol was obtained from Gorensek et al. [29].
2.4. Economic Analysis
A preliminary economic analysis was performed to study the system’s economic viability. The real gross profit (RGP) was calculated based on the mass balance obtained from the laboratory cell results.
The hydrogen price depends on the process. For green hydrogen (hydrogen produced through water electrolysis using renewable energy sources), in 2021, the price ranged between 2.5 and 5.5 €/kg, which is still too high to be competitive with fossil fuel-based hydrogen production processes [30]. In 2018, the lignin price varied between 0.65 and 1.0 €/kg [31]. Herein, the BL was assumed not to have any cost because the objective was to use electrolysis to handle the excess of this byproduct of the pulp industry. The RGP was calculated for the best and worst scenarios for 2021.
3. Results and Discussion
3.1. Electrochemical Studies
BL samples were physicochemically characterized, and the determined parameters are shown in Table 1.

Table 1.
Physicochemical characterization of the BL samples.
Then, LSV was used to obtain the cell polarization curves related to BL electrolysis. Two approaches were considered to simulate batch (Figure 2a) and continuous (Figure 2b) BL electrolyzer operation. In the first case, the polarization curves were run with nickel electrodes that had been previously cleaned, simulating batch operation. To simulate continuous operation (where an automatic scraper would be required), the nickel electrodes started the experiment with a thin lignin layer, thus presenting a lower available surface area.
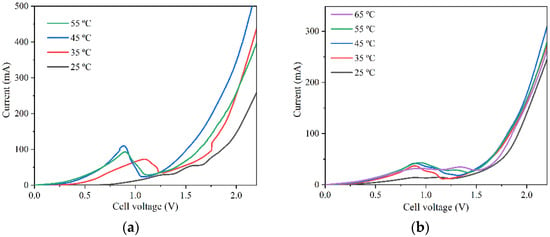
Figure 2.
Comparison of BL electrolysis cell polarization curves for the case of (a) batch and (b) continuous operation at different temperatures.
The polarization curves showed that up to 45 °C, the current increases because the reaction rate increases for higher temperatures. However, after 45 °C, the activity was too high, suggesting significant lignin is deposited in the anode, decreasing the available surface area and reducing the recorded currents.
Overall, Figure 2a shows significantly higher currents compared with the data shown in Figure 2b. This happens because the initial presence of lignin in the electrodes used in the continuous simulation (Figure 2b) led to a lower available surface area, in opposition to the cleaner electrodes used to obtain the data shown in Figure 2a. In continuous BL electrolyzer operation, there is constant removal of lignin, although total removal is impossible, and a thin layer of lignin remains on the anode surface. Therefore, the results from Figure 2b were used to simulate the continuous BL electrolyzer containing a lignin surface layer at the beginning of each experiment/temperature. The results shown in Figure 2a, at 25 °C and 35 °C, were used to simulate the batch electrolyzer. At 25 °C, the experiment started with clean electrodes, and at 35 °C the deposited lignin was negligible. During batch operation, the current will change over time. However, for simulating the batch process, the electrolyzer is considered to work with a current value, which is the weighted current average throughout the entire study.
3.2. BL Electrolysis Simulation
The mathematical description of the model follows Equations (10)–(12), as described in Section 2.3. These equations were used in the Aspen Custom Modeler software to create the mass, charge, and energy balances to be subsequently included in the Aspen Plus® suite.
To obtain the simulated polarization curve, Equation (10) was adjusted to the experimental data between 1.5 V and 2.0 V from Figure 2a,b. A value of 1.5 V for Vrev of BL electrolysis was considered [26]. Below 1.5 V, there is no significant formation of products, and above 2.0 V, Ni anode corrosion may occur. After mathematical treatment, the coefficients (c.f. Equation (10)) obtained for batch and continuous operation are shown in Table 2.

Table 2.
Coefficients determined for the BL electrolysis simulation.
Figure 3a,b compare the model and the experimental data recorded at 25 °C for batch and continuous operation, respectively.
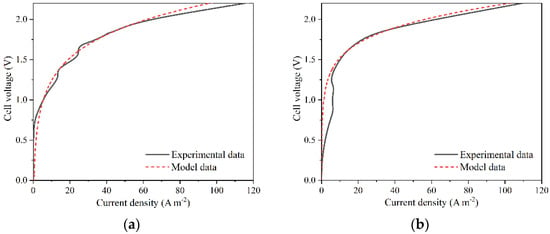
Figure 3.
Comparison between the experimental data for (a) batch and (b) continuous simulation at 25 °C and the corresponding models.
Figure 3 shows a good fitting between 1.5 V and 2.0 V. Above 2.0 V, an adequate fitting is also observed. However, there is a discrepancy for values below 1.5 V, meaning the model cannot be extrapolated for lower voltages. Similar model data for higher temperatures yielded similar results, which can be found in the Supplementary Information (Figures S1 and S2). The value of R2 for the batch model is 0.932, showing a good correlation between the model and the experimental data. For the continuous simulation, R2 had a value of 0.662. This low value of R2 is related to the discrepancy below 1.5 V. However, only values above 1.5 V were considered for the electrolyzer operation, where the R2 was 0.995 and 0.989 for the batch and continuous models, respectively, which in turn validates the model for the selected potential range.
Before simulating in Aspen Plus® it is necessary to extract information from the calculated mass balance. The mass balance was obtained in batch operation, and the average current density was estimated to be 13.6 mA cm−2 (0.305 A). It was also possible to obtain a value of 87% for the Faraday efficiency and the stoichiometric factors between reagents and products (Table S3). The simulated system is represented in Figure 4. The system allows for the simulation of batch and continuous operations simultaneously.
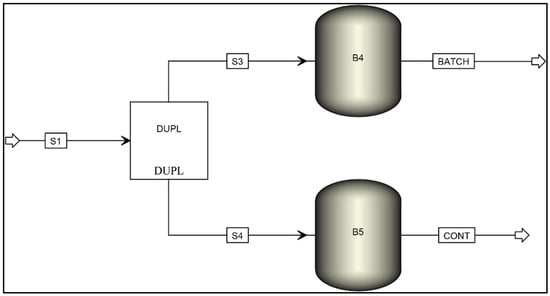
Figure 4.
System for the simulation of batch and continuous operation.
The model described in Figure 4 is composed of several material streams (S1, S3, S4, BATCH, and CONT) and three different operation blocks (DUPL, B4, and B5). The properties of the BL sample were defined according to the data present in Table S1 (in Supplementary Information), with the simplifications described in Section 2.3. The BL sample was fed to the system via material stream S1 and then admitted into the block DUPL, which duplicates the inlet stream into two identical outlet streams. Each stream was then fed into block B4 or B5, representing the exported Aspen Custom Modeler model containing the equations needed to calculate the electrolysis products. The resulting products were then transported by material streams BATCH for the batch process model and CONT, for the continuous process model. Additional operation blocks can be included in further modeling using readily available tools from Aspen Plus®.
The simulation led to a negligible deviation in the mass balance and a 60% deviation in the charge balance. Significant deviations in the charge balance were already expected due to the necessary assumptions made regarding the components. Table S2 compares the molar flow of anions and cations, showing a deviation of 60.2%, equal to the value obtained by Aspen Plus® (60%).
The results from Aspen Plus® were compared to those of the experimentally obtained mass balance to validate the model. The specifications of the electrolysis cell were N = 1, Acell = 22.4 cm2, and T = 25 °C. The absolute values are presented in Table 3 and the respective deviations in Table 4.

Table 3.
Results from experimental data (after 3 h of electrolysis), continuous model, and batch model.

Table 4.
Absolute deviation of I, Vcel, Wstack, and nH2 for continuous and batch operation.
Table 3 and Table 4 reveal that the most significant differences between the experimental data and model predictions were in the electric power (Wstack) and cell voltage (Vcell), with differences of 21% for the batch model and 23% for the continuous model. This deviation occurred due to the validation range of the model. The experimental run used to compare the results considered a Vcell of 3.0 V, which resulted in significant corrosion. This corrosion can result in a change in the cell area Acell, significantly altering the results. The model does not consider cell corrosion, and Wstack and Vcell parameters were tuned to obtain a similar production of H2, which results in the deviations presented in Table 4.
Additionally, the ideal interelectrode distance was assumed to be 2 cm. For higher distances, the current drops due to the increase of resistance to ionic transportation, and for lower distances, it can induce electric sparks, posing an explosion hazard [7]. While a reasonable assumption, any possible deviation from this value can also help explain the observed differences.
Further developments to the model may be performed to mitigate this difference, such as accounting for anode corrosion at high voltages. The advantage of tuning the cell voltage and electric power to obtain similar H2 production through the models offers the advantage of retaining model accuracy from a production point of view while simultaneously providing a framework to identify the parameters that affect the relevant outputs, which can be studied and refined in future works.
It is also possible to conclude that observed batch operation deviations are lower than those observed in continuous operation. This was expected because the experimental data used to develop the model were obtained from batch experimental runs.
3.3. Batch Operation vs. Continuous Operation
One of the objectives of this work involved understanding the differences between batch and continuous operations. Current BL electrolysis studies are typically performed in batch operation, meaning that electrolysis occurs during a set amount of time, and afterward the equipment is opened for cleaning and maintenance. Conversely, the advantages of continuous operation are evident, as the electrolyzer operates continuously with no need for intervention, thus minimizing stoppages and maximizing hydrogen production, cost savings, and potential earnings. However, the main challenge for continuous operation is the lignin deposition at the anode, which deteriorates electrolyzer performance and forces the operators to stop the equipment for cleaning. As such, it is imperative to optimize the cell design by incorporating continuous removal of the deposited lignin and, to do that, it is important to develop mathematical models to study this behavior.
Table 3, Table 4 and Table 5 show that the batch and continuous operation results are similar. This happens because the polarization curves at 25 °C are practically identical. However, operating temperature is expected to significantly affect results due to its influence on several key parameters. With the temperature increase, the deviation of mass balance between batch and continuous operations will be insignificant because the simulation will be made to adjust the nH2. Still, the deviations in Wstack and Vcell will be higher. Due to the significant increase in resistance caused by the deposited lignin, these parameters will increase in continuous operation.

Table 5.
Absolute deviation of I, Vcel, Wstack, and nH2 between continuous and batch operation.
3.4. Sensitivity Analysis
To understand the system’s behavior, a sensitivity analysis was performed to study the influence of N, Acell, Faraday efficiency, T, and Wstack on the output parameters of the model. The sensitivity analysis results for continuous operation are shown in the Supplementary Information. The conclusions for batch operation are otherwise generally the same as those observed for continuous operation, with the relevant differences pointed out in this section.
Firstly, a sensitivity analysis of the number of cells in the stack and its effect on current and hydrogen production was performed. The increase of N led to a decrease in i and Vcell. This happens because Wstack was constant, and with increasing N, the same power is be distributed by more cells, lowering Vcell. As Acell was also constant, the current decreased, as observed in the polarization curve. Although Vcell decreased, Vstack increased because Wstack was constant and the current decreased. N also influenced the hydrogen production and total system heat (nH2 and QT). With the increase of N, nH2 increased because there were more cells to produce hydrogen. Consequently, the total heat flow (QT) needed to supply to the cell to maintain it at the desired temperature increased (Figure 5 and Figure S3).
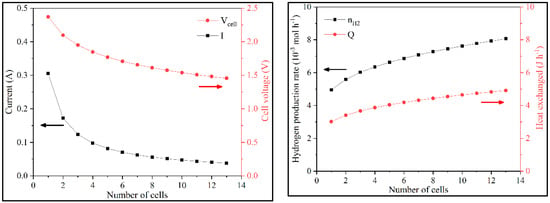
Figure 5.
Variation of i, Vcell, nH2, and QT with N in batch operation.
A second sensitivity analysis focused on the effect of varying the active cell area. With the increase of Acell, i increases and Vcell decreased. A higher active cell area provides additional available reaction sites and, consequently, more collisions between the reagent molecules and the electrodes, increasing the electron flux (i). As Wstack and N were constant and i increased, the cell presented a lower voltage. With the increase in current, hydrogen production increased, and therefore, the system heat also increased (Figure 6 and Figure S4).
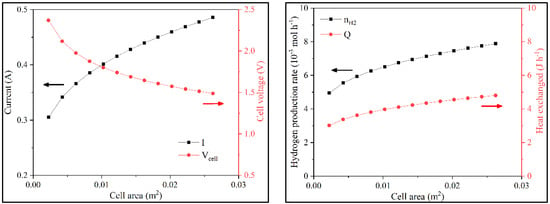
Figure 6.
Variation of i, Vcell, nH2, and QT with Acell in batch operation.
A sensitivity analysis on Faraday efficiency revealed the sole impact to be observed on the values of nH2 and QT. Increasing Faraday efficiency would increase hydrogen production and total system heat (Figure 7 and Figure S5).
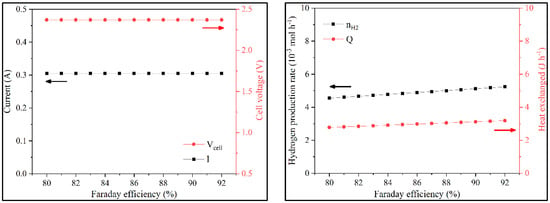
Figure 7.
Variation of i, Vcell, nH2, and QT with the Faraday efficiency in batch operation.
For the batch operation, the temperature was studied between 25 °C and 35 °C, and for continuous operation between 25 °C and 65 °C. In batch operation, with higher temperature, there was more activity and the current increased because Wstack and N were constant and Vcell decreased. With the rise of current, nH2 would increase. QT increased as well, not just because of the flow increase but also because of the temperature increase (Figure 8).
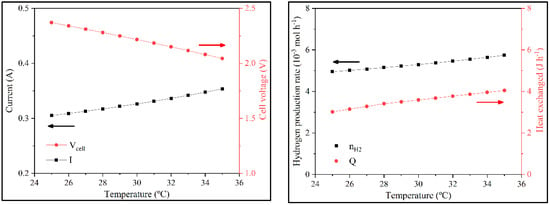
Figure 8.
Variation of i, Vcell, nH2, and QT with the temperature in batch operation.
The following sensitivity analysis focused on the effect of temperature on system variables. In continuous operation until 45 °C, the behavior was identical to batch operation. Above 45 °C, the current and Vcell hit a plateau. This happens because of two opposing effects. On the one hand, the activity increased, leading to a higher reaction rate. However, this higher rate led to a significant amount of lignin depositing on the anode, thus decreasing the available area and the electron flux, which eventually balanced out. nH2 also did not change; QT increased because the working temperature increased (Figure 9).
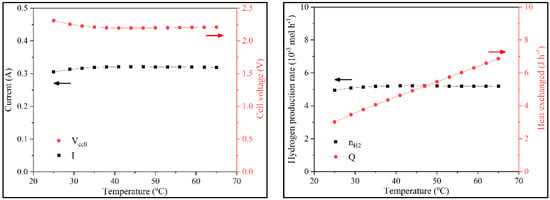
Figure 9.
Variation of i, Vcell, nH2, and QT with the temperature in continuous operation.
A final sensitivity analysis was performed on the stack’s electric power. With the increase of Wstack, the available energy also increased, allowing for higher Vcell. As Acell and T were constants, the current increased, as noted in the polarization curve. This, in turn, increased hydrogen production and QT (Figure 10 and Figure S6).
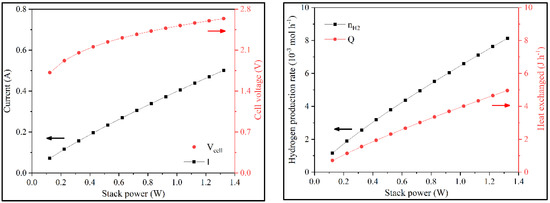
Figure 10.
Variation of i, Vcell, nH2, and QT with the electric power in batch operation.
This analysis provides a better understanding of the system behavior, allowing for a preliminary optimization of process conditions and equipment design. The optimal conditions for maximizing nH2 were found at 35 °C for batch operations and 45 °C for continuous operations. Wstack, Acell, and N are very dependent parameters, so it is necessary to know the typical value ranges when determining the optimal design.
To better understand the parameters that most strongly impact hydrogen production, it is relevant to look at the data regarding the sensitivity analysis in percentage form. This allows a more intuitive comparison between the imposed increment in the analyzed parameters and the resulting output response.
The data presented in Table 6, Table 7 and Table 8 detail the changes in output variables, such as the hydrogen production estimated by the model, in response to an imposed variation of several input variables. The input variables in question are the number of cells (N) in Table 6, the active area of the cell (Acell) in Table 7, and the electric power (Wstack) in Table 8.

Table 6.
Sensitivity analysis for the number of cells (N).

Table 7.
Sensitivity analysis for the active area (Acell).

Table 8.
Sensitivity analysis for the electric power (Wstack).
The sensitivity analysis results showed that hydrogen production was influenced mainly by electric power, as expected by observing Equations (11) and (12). Conversely, when studying the effect of electrolyzer design, parameters such as the cell area and the number of cells are also important to consider, as they influence the electric power. In this case, a change in cell number or cell area yielded a similar response regarding hydrogen production and discharged heat. However, it is relevant to point out that hydrogen production does not scale linearly with these design parameters, which makes them essential parameters to be optimized during the equipment design stages.
When comparing batch operation and continuous operation, it is interesting to observe that lower increments in cell number or cell area have a more significant impact on hydrogen production for continuous operation, which further highlights the merits of continuous operation versus batch operation, particularly in an industrial setting. However, the effect is reversed for higher values and likewise larger scales, favoring batch operation. Designing an electrolyzer places a significant onus on optimizing equipment scale and number to achieve peak hydrogen production with minimal costs.
Sensitivity analyses of the cell efficiency and process temperature were also carried out and are available in Tables S4 and S5 in Supplementary Information. In both cases, hydrogen production scales linearly with both parameters.
3.5. Economic Analysis
Economic analysis calculated RGP for 2021 based on the mass balance. Therefore, it was necessary to update the lignin price, which was found to vary in the range of 0.70–1.08 €/kg. The mass balance was obtained through an experimental run of batch operation. We considered 3 h of production per batch and 1 h for cleaning and preparing each new batch. The annual production is based on 219 days of work. Considering the small-scale lab BL electrolysis cell, the yearly hydrogen production would be 39.2 g, and the annual output of lignin would be 263 g. An RGP of 0.28 € for the worst scenario and 0.50 € for the best were obtained from those values. An industrial electricity cost of 0.15 €/kWh was assumed. For an electric power of 0.915 W, the electricity cost would be 0.54 €. Examining the values of RGP and the electricity cost, the immediate conclusion is that the production of hydrogen and lignin does not compensate for the electricity cost. However, this cell does not work in optimal conditions, and further improvements can make the system economically viable.
Following the preliminary analysis, a more refined analysis was performed considering a typical pilot or industrial electrolyzer with the following specifications: 2 kW, 80 cells, Acell of 0.3 m2, and T = 35 °C. For the batch operations, the model has a deviation of 21% in electric power, which was used to determine the electricity cost. The continuous operation electrolyzer works with 2 kW, 80 cells, Acell of 0.3 m2, and T = 45 °C. The deviation in electric power is 23%, and the yearly operation time was assumed to be 335 days (Table 9).

Table 9.
Electricity cost and RGP for continuous and batch operation.
Analyzing the worst scenarios in Table 9, the product does not compensate for the power cost, but there is profit to be found in the best scenarios. This demonstrates that product and utility market costs are essential to guarantee commercial feasibility. The value of RGP by electric power for the continuous operation is about double than that for the batch operation. Thus, for the same quantity of electric power, the RGP for continuous operation will be much higher than for batch operation.
4. Conclusions
The work aimed to develop a novel custom mathematical model to describe the black liquor (BL) electrolysis process, which can be readily imported and used within the widely used Aspen Plus® chemical process simulation suite.
The simulation of BL electrolysis was based on previously developed water electrolysis models, with relevant parameters obtained from experimental data. Aspen Plus® was used for the simulation, but the modeling of the electrolyzer was made using Aspen Custom Modeler. The experimentally obtained data were modeled to determine the equation of the polarization curves. The simulation of BL electrolysis was also based on a mass balance obtained from experimental runs, involving several assumptions due to the lack of literature data.
Validation of the model was successful by comparing the model and experimental data. The main difference was found to be the cell voltage and power stack, which can be improved in subsequent models.
The difference between batch and continuous operation was also evaluated. At 25 °C, the models behaved similarly. However, deviations were observed for higher temperatures. For the continuous operation to have the same nH2 as a batch operation, the required electric power is higher.
A sensitivity analysis helped to understand the electrolyzer’s behavior. Variations in inputs were made to see the influence on outputs. The analysis demonstrated that to maximize nH2, the optimal temperature is 35 °C for batch operation and 45 °C for continuous operation. Wstack, Acell, and N are very dependent on each other, and it is necessary to know the typical value when designing. The parameters that most impact hydrogen production were the stack’s electric power, the number of electrolytic cells, and the cell’s active area. As such, optimized equipment design cannot be understated when considering BL electrolysis as a process. Additionally, a comparison between batch and continuous operation revealed a need for careful equipment design according to the desired scale, which may influence the choice of the system.
The economic viability for hydrogen production by BL electrolysis was estimated. RGP for the electrolyzer’s worst and best scenario was calculated with typical dimensions and optimized temperature (2 kW, 80 cells, and an active electrode area of 0.3 m2). It was observed that with estimated values, economic feasibility is dependent on the balance between product market prices and operational costs.
In summary, the model presented adequately describes hydrogen production via BL electrolysis and provides a solid framework for further developments, not only in the context of evaluating the fundamental process and its industrial application but also in developing a tool for optimizing BL electrolyzer design and operation.
Supplementary Materials
The following supporting information can be downloaded at: https://www.mdpi.com/article/10.3390/sym14081676/s1, Figure S1: Comparison between experimental data and the model for batch simulation at 25 °C and 35 °C; Figure S2: Comparison between experimental data and the model at different temperatures for continuous operation; Figure S3: Variation of i, Vcell, nH2, and QT with N in continuous operation; Figure S4: Variation of i, Vcell, nH2, and QT with Acell in continuous operation; Figure S5: Variation of i, Vcell, nH2, and QT with the Faraday efficiency in continuous operation; Figure S6: Variation of i, Vcell, nH2, and QT with the electric power in continuous operation; Table S1: Mass balance based on BL electrolysis in a laboratory cell; Table S2: The mass balance used in Aspen Plus®; Table S3: Stoichiometric factors for the different compounds; Table S4: Sensitivity analysis for Faraday efficiency; Table S5: Sensitivity analysis for temperature.
Author Contributions
Conceptualization, D.M.F.S. and M.M.M.; data curation, J.R.M.G. and D.M.C.; formal analysis, J.R.M.G. and D.M.C.; funding acquisition, D.M.F.S. and M.M.M.; investigation, J.R.M.G.; methodology, J.R.M.G., R.C.P.O. and D.M.C.; project administration, D.M.F.S. and M.M.M.; resources, D.M.F.S.; software, D.M.C.; supervision, D.M.F.S. and M.M.M.; validation, R.C.P.O. and D.M.C.; visualization, M.M.M. and D.M.C.; writing—original draft preparation, J.R.M.G.; writing—review and editing, D.M.F.S. and D.M.C. All authors have read and agreed to the published version of the manuscript.
Funding
The support of the Foundation for Science and Technology (FCT, Portugal) is gratefully acknowledged for funding a contract in the scope of programmatic funding UIDP/04540/2020 (D.M.F. Santos).
Data Availability Statement
The data presented in this study are available on request from the corresponding author.
Conflicts of Interest
The authors declare no conflict of interest.
References
- Mikhaylov, A.; Moiseev, N.; Aleshin, K.; Burkhardt, T. Global Climate Change and Greenhouse Effect. Entrep. Sustain. Issues 2020, 7, 2897–2913. [Google Scholar] [CrossRef]
- Shahzad, U. Global Warming: Causes, Effects and Solutions. Durreesamin J. 2015, 1, 1–7. [Google Scholar]
- Oliveira, R.C.P.; Mateus, M.; Santos, D.M.F. Black Liquor Electrolysis for Hydrogen and Lignin Extraction. ECS Trans. 2016, 72, 43–53. [Google Scholar] [CrossRef]
- Oliveira, R.C.P.; Mateus, M.M.; Santos, D.M.F. On the Oxidation of Kraft Black Liquor for Lignin Recovery: A Voltammetric Study. J. Electrochem. Soc. 2019, 166, E547–E553. [Google Scholar] [CrossRef]
- Caravaca, A.; Garcia-Lorefice, W.E.; Gil, S.; de Lucas-Consuegra, A.; Vernoux, P. Towards a Sustainable Technology for H2 Production: Direct Lignin Electrolysis in a Continuous-Flow Polymer Electrolyte Membrane Reactor. Electrochem. Commun. 2019, 100, 43–47. [Google Scholar] [CrossRef]
- Falter, C.; Sizmann, A. Solar Thermochemical Hydrogen Production in the USA. Sustainability 2021, 13, 7804. [Google Scholar] [CrossRef]
- Santos, D.M.F.; Sequeira, C.A.C.; Figueiredo, J.L. Hydrogen Production by Alkaline Water Electrolysis. Quim. Nova 2013, 36, 1176–1193. [Google Scholar] [CrossRef]
- Gonçalves, A.; Puna, J.F.; Guerra, L.; Rodrigues, J.C.; Gomes, J.F.; Santos, M.T.; Alves, D. Towards the Development of Syngas/Biomethane Electrolytic Production, Using Liquefied Biomass and Heterogeneous Catalyst. Energies 2019, 12, 3787. [Google Scholar] [CrossRef]
- Oliveira, R.C.P.; Jeremias, M.J.; Mateus, M.M.; Santos, D.M.F. Developing a Novel Direct Liquid Fuel Cell Based on Pulping Liquors. Fuel Cells 2022, 22, 39–47. [Google Scholar] [CrossRef]
- Oliveira, R.C.P.; Buijnsters, J.G.; Mateus, M.M.; Bordado, J.C.M.; Santos, D.M.F. On the Electrooxidation of Kraft Black Liquor on Boron-Doped Diamond. J. Electroanal. Chem. 2022, 909, 116151. [Google Scholar] [CrossRef]
- Oliveira, R.C.P.; Mateus, M.; Santos, D.M.F. Chronoamperometric and Chronopotentiometric Investigation of Kraft Black Liquor. Int. J. Hydrogen Energy 2018, 43, 16817–16823. [Google Scholar] [CrossRef]
- Henriksson, G. Wood Chemistry and Wood Biotechnology; Ek, M., Gellerstedt, G., Henriksson, G., Eds.; De Gruyter: Berlin, Germany, 2009; ISBN 9783110213409. [Google Scholar]
- Oliveira, R.C.P. Valorização Energética de Efluentes Da Indústria Papeleira—Estudos Fundamentais de Electrólise de Licor Negro. Master’s Thesis, Instituto Superior Técnico, Lisboa, Portugal, 2015. [Google Scholar]
- Bordado, J.C.M.; Gomes, J.F.P. Emission and Odour Control in Kraft Pulp Mills. J. Clean. Prod. 2003, 11, 797–801. [Google Scholar] [CrossRef]
- Belo, I.C.; Oliveira, R.C.P.; Mateus, M.; Bordado, J.C.M.; Pinto, P.; Santos, D.M.F. Development of a Black Liquor Electrolyzer for Lignin Extraction. ECS Trans. 2018, 86, 3–9. [Google Scholar] [CrossRef]
- Sánchez, M.; Amores, E.; Abad, D.; Rodríguez, L.; Clemente-Jul, C. Aspen Plus Model of an Alkaline Electrolysis System for Hydrogen Production. Int. J. Hydrogen Energy 2020, 45, 3916–3929. [Google Scholar] [CrossRef]
- Ulleberg, Ø. Modeling of Advanced Alkaline Electrolyzers: A System Simulation Approach. Int. J. Hydrogen Energy 2003, 28, 21–33. [Google Scholar] [CrossRef]
- Jang, D.; Cho, H.S.; Kang, S. Numerical Modeling and Analysis of the Effect of Pressure on the Performance of an Alkaline Water Electrolysis System. Appl. Energy 2021, 287, 116554. [Google Scholar] [CrossRef]
- Lee, J.; Alam, A.; Ju, H. Multidimensional and Transient Modeling of an Alkaline Water Electrolysis Cell. Int. J. Hydrogen Energy 2021, 46, 13678–13690. [Google Scholar] [CrossRef]
- Herdem, M.S.; Farhad, S.; Dincer, I.; Hamdullahpur, F. Thermodynamic Modeling and Assessment of a Combined Coal Gasification and Alkaline Water Electrolysis System for Hydrogen Production. Int. J. Hydrogen Energy 2014, 39, 3061–3071. [Google Scholar] [CrossRef]
- Dolle, C.; Neha, N.; Coutanceau, C. Electrochemical Hydrogen Production from Biomass. Curr. Opin. Electrochem. 2022, 31, 100841. [Google Scholar] [CrossRef]
- Li, J.; Zhou, W.; Huang, Y.; Gao, J. Lignin-Assisted Water Electrolysis for Energy-Saving Hydrogen Production with Ti/PbO2 as the Anode. Front. Energy Res. 2021, 9, 757. [Google Scholar] [CrossRef]
- Santos, A.L.; Cebola, M.-J.; Santos, D.M.F. Towards the Hydrogen Economy—A Review of the Parameters That Influence the Efficiency of Alkaline Water Electrolyzers. Energies 2021, 14, 3193. [Google Scholar] [CrossRef]
- Lamy, C.; Millet, P. A Critical Review on the Definitions Used to Calculate the Energy Efficiency Coefficients of Water Electrolysis Cells Working under near Ambient Temperature Conditions. J. Power Sources 2020, 447, 227350. [Google Scholar] [CrossRef]
- Bontempelli, G.; Dossi, N.; Toniolo, R. Linear Sweep and Cyclic. In Reference Module in Chemistry, Molecular Sciences and Chemical Engineering; Elsevier: Amsterdam, The Netherlands, 2016; pp. 1–10. [Google Scholar] [CrossRef]
- Belo, I. Isolamento de Lenhina Por Eletrólise de Licor Negro. Master’s Thesis, Instituto Superior Técnico, Lisboa, Portugal, 2018. [Google Scholar]
- Stark, N.M.; Yelle, D.J.; Agarwal, U.P. Techniques for Characterizing Lignin. In Lignin in Polymer Composites; Faruk, O., Sain, M., Eds.; William Andrew: Norwich, NY, USA, 2016; pp. 49–66. [Google Scholar] [CrossRef]
- Tremblay, D.; Peers, Z. Jump Start: Aspen Custom Modeler V8; AspenTech: Bedford, MA, USA, 2015; Available online: https://www.academia.edu/36652580/Jump_Start_Aspen_Custom_Modeler_V8_A_Brief_Tutorial_and_supplement_to_training_and_online_documentation (accessed on 15 October 2021).
- Gorensek, M.B.; Shukre, R.; Chen, C.-C. Development of a Thermophysical Properties Model for Flowsheet Simulation of Biomass Pyrolysis Processes. ACS Sustain. Chem. Eng. 2019, 7, 9017–9027. [Google Scholar] [CrossRef]
- Anderson, Z.R. Mainstreaming Green. Translating the Green Economy in an Indonesian Frontier. In Frontier Assemblages: The Emergent Politics of Resource Frontiers in Asia; Cons, J., Eilenberg, M., Eds.; John Wiley & Sons Ltd.: Hoboken, NJ, USA, 2018; pp. 83–98. [Google Scholar] [CrossRef]
- Barrett, A. The European Commission Papers: The Lignin Briefing. Available online: https://bioplasticsnews.com/2018/08/10/european-commission-lignin/ (accessed on 15 October 2021).
Publisher’s Note: MDPI stays neutral with regard to jurisdictional claims in published maps and institutional affiliations. |
© 2022 by the authors. Licensee MDPI, Basel, Switzerland. This article is an open access article distributed under the terms and conditions of the Creative Commons Attribution (CC BY) license (https://creativecommons.org/licenses/by/4.0/).