Article

Blend of Deep Features and Binary Tree Growth Algorithm for Skin Lesion Classification

Department of Electronics and Communication Engineering, Tezpur University, Napaam, Tezpur 784028, Assam, India
*
Author to whom correspondence should be addressed.
Symmetry 2023, 15(12), 2213; https://doi.org/10.3390/sym15122213
Submission received: 17 November 2023 / Revised: 8 December 2023 / Accepted: 15 December 2023 / Published: 18 December 2023
(This article belongs to the Special Issue Symmetry/Asymmetry in Computer Vision and Image Processing)

Abstract

:
One of the most frequently identified cancers globally is skin cancer (SC). The computeraided categorization of numerous skin lesions via dermoscopic images is still a complicated problem. Early recognition is crucial since it considerably increases the survival chances. In this study, we introduce an approach for skin lesion categorization where, at first, a powerful hybrid deep-feature set is constructed, and then a binary tree growth (BTG)-based optimization procedure is implemented using a support vector machine (SVM) classifier with an intention to compute the categorizing error and build symmetry between categories, for selecting the most significant features which are finally fed to a multi-class SVM for classification. The hybrid deep-feature set is constructed by utilizing two pre-trained models, i.e., Densenet-201, and Inception-v3, that are fine-tuned on skin lesion data. These two deep-feature models have distinct architectures that characterize dissimilar feature abstraction strengths. This effective deep feature framework has been tested on two publicly available challenging datasets, i.e., ISIC2018 and ISIC2019. The proposed framework outperforms many existing approaches and achieves notable {accuracy, sensitivity, precision, specificity} values of {98.50%, 96.60%, 97.84%, 99.59%} and {96.60%, 94.21%, 96.38%, 99.39%} for the ISIC2018 and ISIC2019 datasets, respectively. The proposed implementation of the BTG-based optimization algorithm performs significantly better on the proposed feature blend for skin lesion classification.

1. Introduction

Skin cancer (SC) is one of the most prevalent types of cancer in the current decade [1]. According to several reports, in many countries, the number of new SC patients and the loss of lives from SC has increased in recent years. Among various types of SC, e.g., basal cell carcinoma, squamous cell carcinoma, melanoma, etc., melanoma is one of the most deadly and lethal compared to other types [2]. The majority of malignant cases such as melanoma are distinguished by the growth of lesion accompanied by its asymmetric shape and various colors, entirely with a record of variation in texture, color, structure and/or size. UV radiation disclosure is one of the primary origins of SC. Melanoma exhibits the highest number of cases among various other types of SC. Prior to age 50, incidence rates are higher in women than men, but after that, it become progressively higher among men. Melanoma skin cancer can be treated early to reduce patient mortality. So, early detection is crucial to reduce the incidence of melanoma SC. The “ABCDE” rule and the “7-point checklist” are two of the most used techniques for diagnosis. Decisions based on asymmetry, uneven borders, colour variation, diameter, evolution, inflammation, and sensory alterations are strongly relied upon.
In order to identify melanoma SC, an experienced dermatologist typically follows a series of steps. They begin by visually inspecting suspicious lesions, then proceed to dermoscopy and, if necessary, a biopsy. In the biopsy procedure, a suspected cutaneous lesion is obtained and examined in the pathological laboratory to ascertain if it is cancerous. This procedure is time consuming and painful [1]. Because of the increasing number of cases, the inter-human variations in views and the infrastructural constraints, the manual way of examination is not found to be reliable. Moreover, melanoma is hard to notice in the early stages as they are visually quite similar to benign lesions. Because of all these reasons, the manual diagnosis procedure is usually challenging. To overcome such problems, a computer-aided diagnosis using dermoscopic images could be highly beneficial to discriminate between melanoma SC and benign cases in its early phases and may be utilized as a second opinion. Dermoscopy is an effective imaging mechanism for skin lesions where an enlarged high-resolution image is captured while suppressing the skin surface back scattering. Though improved high resolution pictures of skin lesions are available through dermoscopy, dermatologists still encounter difficulties achieving higher SC diagnosis improvement rates. The inter-expert variation in opinions, the time factor and the availability of experienced dermatologists pose limitations in the manual examination of dermoscopic images. An automatic computer-aided system for SC diagnosis from dermoscopic images is important for the improved diagnosis of SC and may be utilized as a second opinion for experts.
In this study, we construct a hybrid deep feature set in order to capture the comprehensive features and improve the generalization capacity. The best appropriate features are selected through an effective BTG algorithm. Our contributions in this paper are encapsulated below:
  • We fine-tuned the Densenet-201 and Inception-v3 models on skin lesion data. The deep features from each model are extracted and blended together to form a powerful hybrid deep-feature set in order to obtain improved discriminating features. It is observed that the features extracted from each model are complementary to each other.
  • In order to further improve the classification outcomes, the redundant or irrelevant features from the hybrid feature set are removed using the BTG-based optimization procedure. The BTG-based optimization is implemented employing a SVM classifier which is used for computation of categorizing errors and to build a symmetry between the classification categories. Extensive tests have been performed to verify the benefits of the suggested method.
The remaining work is assembled as follows—Section 2 presents the literature survey on various skin lesion classification studies and feature selection techniques. Section 3 provides an overview of the dataset used, and the proposed methodology is described in Section 4. Section 5 presents the experimental results and related discussion, and finally, Section 6 concludes the paper.

2. Related Work

In [3], the authors presented a deep learning (DL)-based CAD technique in which they carried out image augmentation on a dermoscopic training dataset, and the fine tuning of pre-trained CNN (Resnet-50 and Resnet-101) models was performed to classify the skin lesion images. They extracted deep features from the global average pooling (GAP) layer and performed feature fusion along with feature selection followed by machine learning classification. They had encouraging outcomes on the HAM10000 dataset. Using transfer learning with pre-trained GoogleNet, Kassem et al. [2] developed a technique for the ISIC 2019 challenge dataset. Even with varying numbers of images in each category, the suggested technique can reliably classify eight types of lesions. A few filters in some layers were added to improve the features. Popescu et al. [4] presented a CAD system to classify SC using the collective intelligence of nine CNNs. The judgement made by each neural network is fused into a single one using a weight matrix to create a decision fusion module. Compared to the best performing individual network, the authors demonstrate a considerable increase in accuracy. Zhao et al. [5] introduced a novel SC classification framework where high-quality synthetic images were generated using StyleGAN. The structure of noise input and style control in the actual generator of the module was reorganized and a new loss function was implemented in order to boost balanced multi-class accuracy. In [6], Al-Masni et al. developed a novel framework in which full-resolution CNN (FrCN) [7] was used to segment the lesions and different pre-trained CNN models such as Inception-v3, Resnet-50, Inception-Resnet-v2 and Densenet-201 were applied on segmented lesions in order to classify them. The analysis revealed that ResNet-50 is the best performing model for identifying SC, followed by the Inception-ResNet-v2 model. The authors also show that their method performs better with augmented and balanced datasets than unaugmented and imbalanced datasets. A framework [8] is developed to collect a skin sample through a mobile device and label it according to its lesion. The lesion is initially segmented using a 16-layered CNN architecture with an enhanced high dimension contrast transform technique. This method reduced computational time while increasing segmentation accuracy compared to contemporary methods. On a well-known dataset of dermoscopic images, i.e., HAM10000, Kousis et al. [9] examined 11 pre-trained networks to diagnose skin cancer. Their findings showed that the Densenet-169 performs better than other networks. A two-class Densenet-169 mapping model was developed which has shown excellent results. A mobile application was also developed to assist users in obtaining a preliminary understanding of their skin lesions based on the basic 2-class model. Ali et al. [10] suggested an architecture that used sigmoid as the output activation layer. The HAM10000 dataset was used to evaluate the suggested framework. Compared to other transfer learning models already in use, the authors achieved better training and testing accuracy results. The dataset was balanced to enhance classification accuracy for all the datasets. Lan et al. [11] introduced a capsule network called FixCaps. Applying a high-performance large-kernel with a kernel size of up to 31 × 31 at the bottom convolution layer allows FixCaps to achieve a significant receptive field. In order to reduce spatial information losses and prevent model underfitting in the capsule layer, the convolutional block attention module and group convolution, respectively, were adopted. FixCap can increase detection accuracy while requiring fewer calculations than other available techniques. Almaraz-Damian et al. [12] presented a new CAD system combining handcrafted features with deep features to discriminate between melanoma and nevus lesions. The suggested approach combines the features using a mutual information metric to pick up the most important features. In order to improve the efficacy of skin lesion classification, the authors [13] proposed a new deep CNN model, i.e., CSLNet with fewer filters and parameters that employ numerous layers, and different filter sizes. CSLNet unlike many other algorithms does not require rigorous pre-processing or handcrafted features to classify the skin lesions effectively. In [14], the authors combined image deep features, hand-designed features and some patient related meta-data in order to accurately detect skin cancer. In [15], Kadirappa et al. proposed an efficient skin lesion segmentation technique called SASegNet which is based on a new U-Net and spatial attention blocks. The segmented output data are then fed to EfficientNet B1 in order to produce the local features. The global features are produced by feeding the actual preprocessed images to the EfficientNet B1 network and eventually both local and global features are combined to produce the best features for accurate classification. A novel 56-layered residual deep CNN, i.e., RDCNN for the detection of skin cancers is introduced in [16]. Golnoori et al. [17] optimized the hyper parameters of a few pre-trained networks using metaheuristic algorithms and blended the features extracted from them. A KNN classifier is employed to classify the skin lesions. Alsahafi et al. [18] introduced a 54-layered deep residual network for skin lesion categorization. This method captures multi-level features by employing variable filter dimensions. The authors carried out cross-channel correlation and neglected the spatial dimensions. Jasil and Ulagamuthalvi [19] offered a multi-class classification system for skin lesion categorization that uses a Densenet and residual-based architecture. In order to enhance the discriminativeness of the features, they blended the layers from Densenet 121 and the residual-based network. The features from both networks are blended together and are fed to the convolutional layers and eventually to the classifier. It is shown that the powerful pre-processing procedures before classification can notably enhance the overall performance of the system. In order to increase the system’s ability to recognize skin lesions, Juan et al. [20] employed an optimized form of transfer learning version concerning to Densenet-201, Inception-Resnet-v2 and Inception-v3 models. Experiments with/without augmentation with/without optimization is employed to handle the class imbalance issue. The experiments achieved an accuracy of up to 98% on the HAM10000 dataset and up to 93% on the ISIC2019 dataset. Hassan et al. [21] demonstrated the benefits of a decision fusion scheme that utilizes the accuracy associated with a deep network model for SC classification. The authors combined a few of such schemes to achieve a global decision framework with much-enhanced accuracy than any other single classifier. The models were fine-tuned to discriminate the various categories of skin lesions. In [22], Samia et al., examined the efficiency of seventeen deep CNN architectures for capturing of features and twenty-four different classifiers for categorizing of skin lesions. The Densenet-201 coupled with cubic SVM was observed to have achieved superior results on ISIC2019. In [23], Rashid et al. introduced a deep feature framework based on the Mobilenet-v2 model for skin cancer detection. Their model classifies the skin lesions into malignant or benign categories. Data augmentation was carried out to tackle the class imbalance problem. A deep feature framework called MSLANet for skin lesion categorization, which is made of multiple long attention networks, is proposed in [24]. Each network utilizes context details and enhances the crucial information description via long attention technique. The global context and local scale details are captured through the MSLANet model. A deep data augmentation scheme is introduced to improve the overall performance of the framework.
Each pre-trained deep network model based on its architectural design captures some unique features from the input images and accordingly shows some misclassification outcomes. The strength of different deep feature models can be used to reduce the wrong predictions by blending their features for SC classification.
In [25,26,27,28,29,30,31,32,33,34,35], it was observed that the presence of irrelevant or redundant features may lead to the incorrect prediction of images and may bring down the classification results. Many techniques [25,26,27,28,29,30,31,32,33,34,35] employ feature selection (FS) algorithms for selecting the most appropriate features in order to maximize the classification performance. In [25], the authors suggested a technique where the best features from a fine-tuned NASNET-large network are selected through a hybrid whale optimization algorithm (WOA) and entropy mutual information technique, and, fused using modified canonical correlation scheme and eventually classified through ELM. In [26], the authors introduced an SC categorization technique that uses a grasshopper optimization algorithm for optimized FS. In [27], Khan et al., used entropy coupled with Bhattacharyya distance and variance as an FS scheme to capture the significant features. Khan et al., in [28] used an FS technique based on distance-guided entropy for SC categorization. An iterative Newton-Raphson-based FS scheme is utilized in [29] for skin lesion categorization. In [31], Wen et al., introduced a technique for the categorization of meta-spectral remote sensing images where the ant colony optimization scheme is applied for feature selection. The ant colony optimization (ACO) imitates the foraging conduct of ants. In [32], Venkata proposed an effective framework for the detection of kidney carcinoma. Their method comprised of region of interest segmentation, image pre-processing, extraction and then optimal selection of features, and finally categorization. The optimal feature selection here is carried out using dragonfly algorithm. The dragonfly technique concentrates on dragonfly characteristics and their psychological potential. The dragonfly swarming nature during migration and hunting is known as a stationary swarm and it is characterized by small groups of dragonflies changing their movement quickly and in close proximity. An amalgamation of deep GoogleNet features and a natural environment inspired optimization scheme, i.e., particle swarm optimization (PSO) is used for autonomous vehicle categorization [33]. The canonical PSO is greatly influenced by the transformative conduct of the creatures and is based on the social co-ordination and flocking conducts of birds and fish schools. An effective scheme, which combines the butterfly optimization and ant lion procedures in order to effectively lessen the feature dimensions through eliminating redundant features, is proposed in [36]. The selected features are then used to foresee the benign/malignant condition of breast tissues employing different classifiers. In [37], an efficient metaheuristic procedure called the tree growth algorithm (TGA) which is motivated from a tree’s struggle to obtain light and nourishment, is proposed. Zhong et al., in [34] introduced a binary TGA and a linearly escalating variable adjustment scheme to adjust the variable value in TGA. In [38], Khasanov et al., proposed an integrated optimization scheme utilizing TGA and power loss sensitivity factor, i.e., PLSF to recognize the best dimension and position of different distributed generation unit in distributed systems in order to lessen the complete power losses. In [35], Too et al., proposed a framework for myoelectric signal categorization utilizing the binary TGA-based feature selection. In any image classification framework, the choice of optimized feature selection (FS) algorithms plays a crucial role. While many effective feature selection-based image classification frameworks exists in the literature, yet more powerful frameworks that facilitate improved and robust feature selection are still demanding.
Several meta-heuristic procedures have been employed in the feature selection applications. The monarch butterfly optimization algorithm (MBOA) [39] is a category of swarm intelligence and motivated by relocation conduct of monarch butterflies. Lone cases in MBOA are modified through the relocation process and butterfly adaptation action. The performance of MBOA was compared to five different metaheuristic optimization schemes via 38 criteria. MBOA performs at the fifth best level on six out of the 38 criteria when taken as the mean. The very recent RIME optimization algorithm [40] imitates the formation of rime-ice’s soft-rime and hard-rime layers, and then builds a soft-rime probe tactic and a hard-rime piercing scheme in order to apply the exploration and exploitation conducts in optimization approaches. In [41], Wang introduced a new all-purpose metaheuristic approach called Moth search where the photo axis and levy flights of moths in the natural environment are abstracted and mapped in this study. The Moth search implementation was demonstrated to be simple and flexible. Iman et al. [42] introduced a new optimizer called weighted mean of vectors to optimize various issues. This approach is an improved weight-mean approach that employs the weight mean tactic for a solid layout and three key schemes to change the location of the vectors: (i) an updating way, (ii) vector merging and (iii) a local exploration. This technique has been demonstrated to have converged to 0.99% of the overall best solution. In [43], a nature-motivated algorithm called Harris hawks optimization algorithm (HHOA) which is based on population-kind, is proposed. The primary source of HHO’s motivation is the friendly attitude and tracking manner of Harris hawks in their natural environment known as surprise pounce. In this clever plan, many hawks work together to attack prey from various angles in an effort to surprise it. In order to create an optimization procedure, this study computationally imitates such active patterns and conducts. This technique exhibits good results at random occasions when compared to popular relevant schemes. The Runge Kutta optimization scheme proposed by Iman et al. [44] can be applied in many real word applications. The Runge Kutta optimization scheme is based on a logical probing technique for global optimization that makes use of the rationale of slope differences computed by the Runge Kutta scheme. In order to explore the crucial areas in the feature space and to make progress towards the overall optimal result, this search technique takes advantage of two dynamic stages, i.e., exploration and exploitation. This method has shown good results and faster convergence. Motivated by the action of animals in a starving situation, in [45], a hunger game search algorithm (HGSA) is introduced. The HGSA integrates the hunger idea into the feature operation. To put it differently, an adaptive weight depending on the hunger idea is created and used to mimic the impact of hunger on each search stage. The key benefits of this algorithm over other approaches are its dynamic behavior, straight-forward framework, good converging results and adequate nature of solutions. In [46], Li et al., introduced a slime mould (SM) optimization algorithm which is based on the fluctuation fashion of slime mould in the natural environment. This algorithm has many novel features and a special computational model that imitates the creation of (+ve) and (−ve) feedbacks of the SM propagation wave built on bio-oscillator to construct the ideal path for linking food with very good exploratory capability and exploitation tendency. This model utilizes adaptive weights. To validate the effectiveness of this SM-based technique, it was tested on four traditional engineering issues, where it demonstrated the best results quite often on various search prospects. An optimization method called the colony predation algorithm which utilizes the joint kind of predation of animals is proposed in [47]. This algorithm uses a computational depiction that mimics the tactics employed by animal-hunting parties like scattering prey, surrounding the prey, assisting the hunter with the best chance of success and looking for alternative prey. This algorithm has shown good performance over a few other meta-heuristics on some criteria.
From the literature, it can be seen that the TGA [37] is a straightforward meta-heuristic that has proven to be more effective than many others. Its performance was tested and found to be satisfactory in solving different engineering optimization problems. Its convergence conduct on two standard functions demonstrates that TGA is very fast and has powerful convergence nature and can detect the global optima in very few iterations. Moreover, with the adjustment of very few parameters, the compromise between intensification and diversification can be achieved. Therefore, motivated by the encouraging performance of TGA, we have attempted the implementation of a binary tree growth (BTG) algorithm which simulates the behavior of a flourishing tree in feature selection with an application to the skin lesion classification problem.
A feature selection issue is a search-space issue and needs complete balance between diversification or exploration and intensification or exploitation phases. Although a good number of work exists in the literature that shows good balance between these two phases, discerning schemes that exhibit more appropriate balance between these two phases for a feature selection problem is demanding.

3. Datasets

We have considered ISIC2018 [48,49] and ISIC2019 [49,50] datasets for experiments in this study.
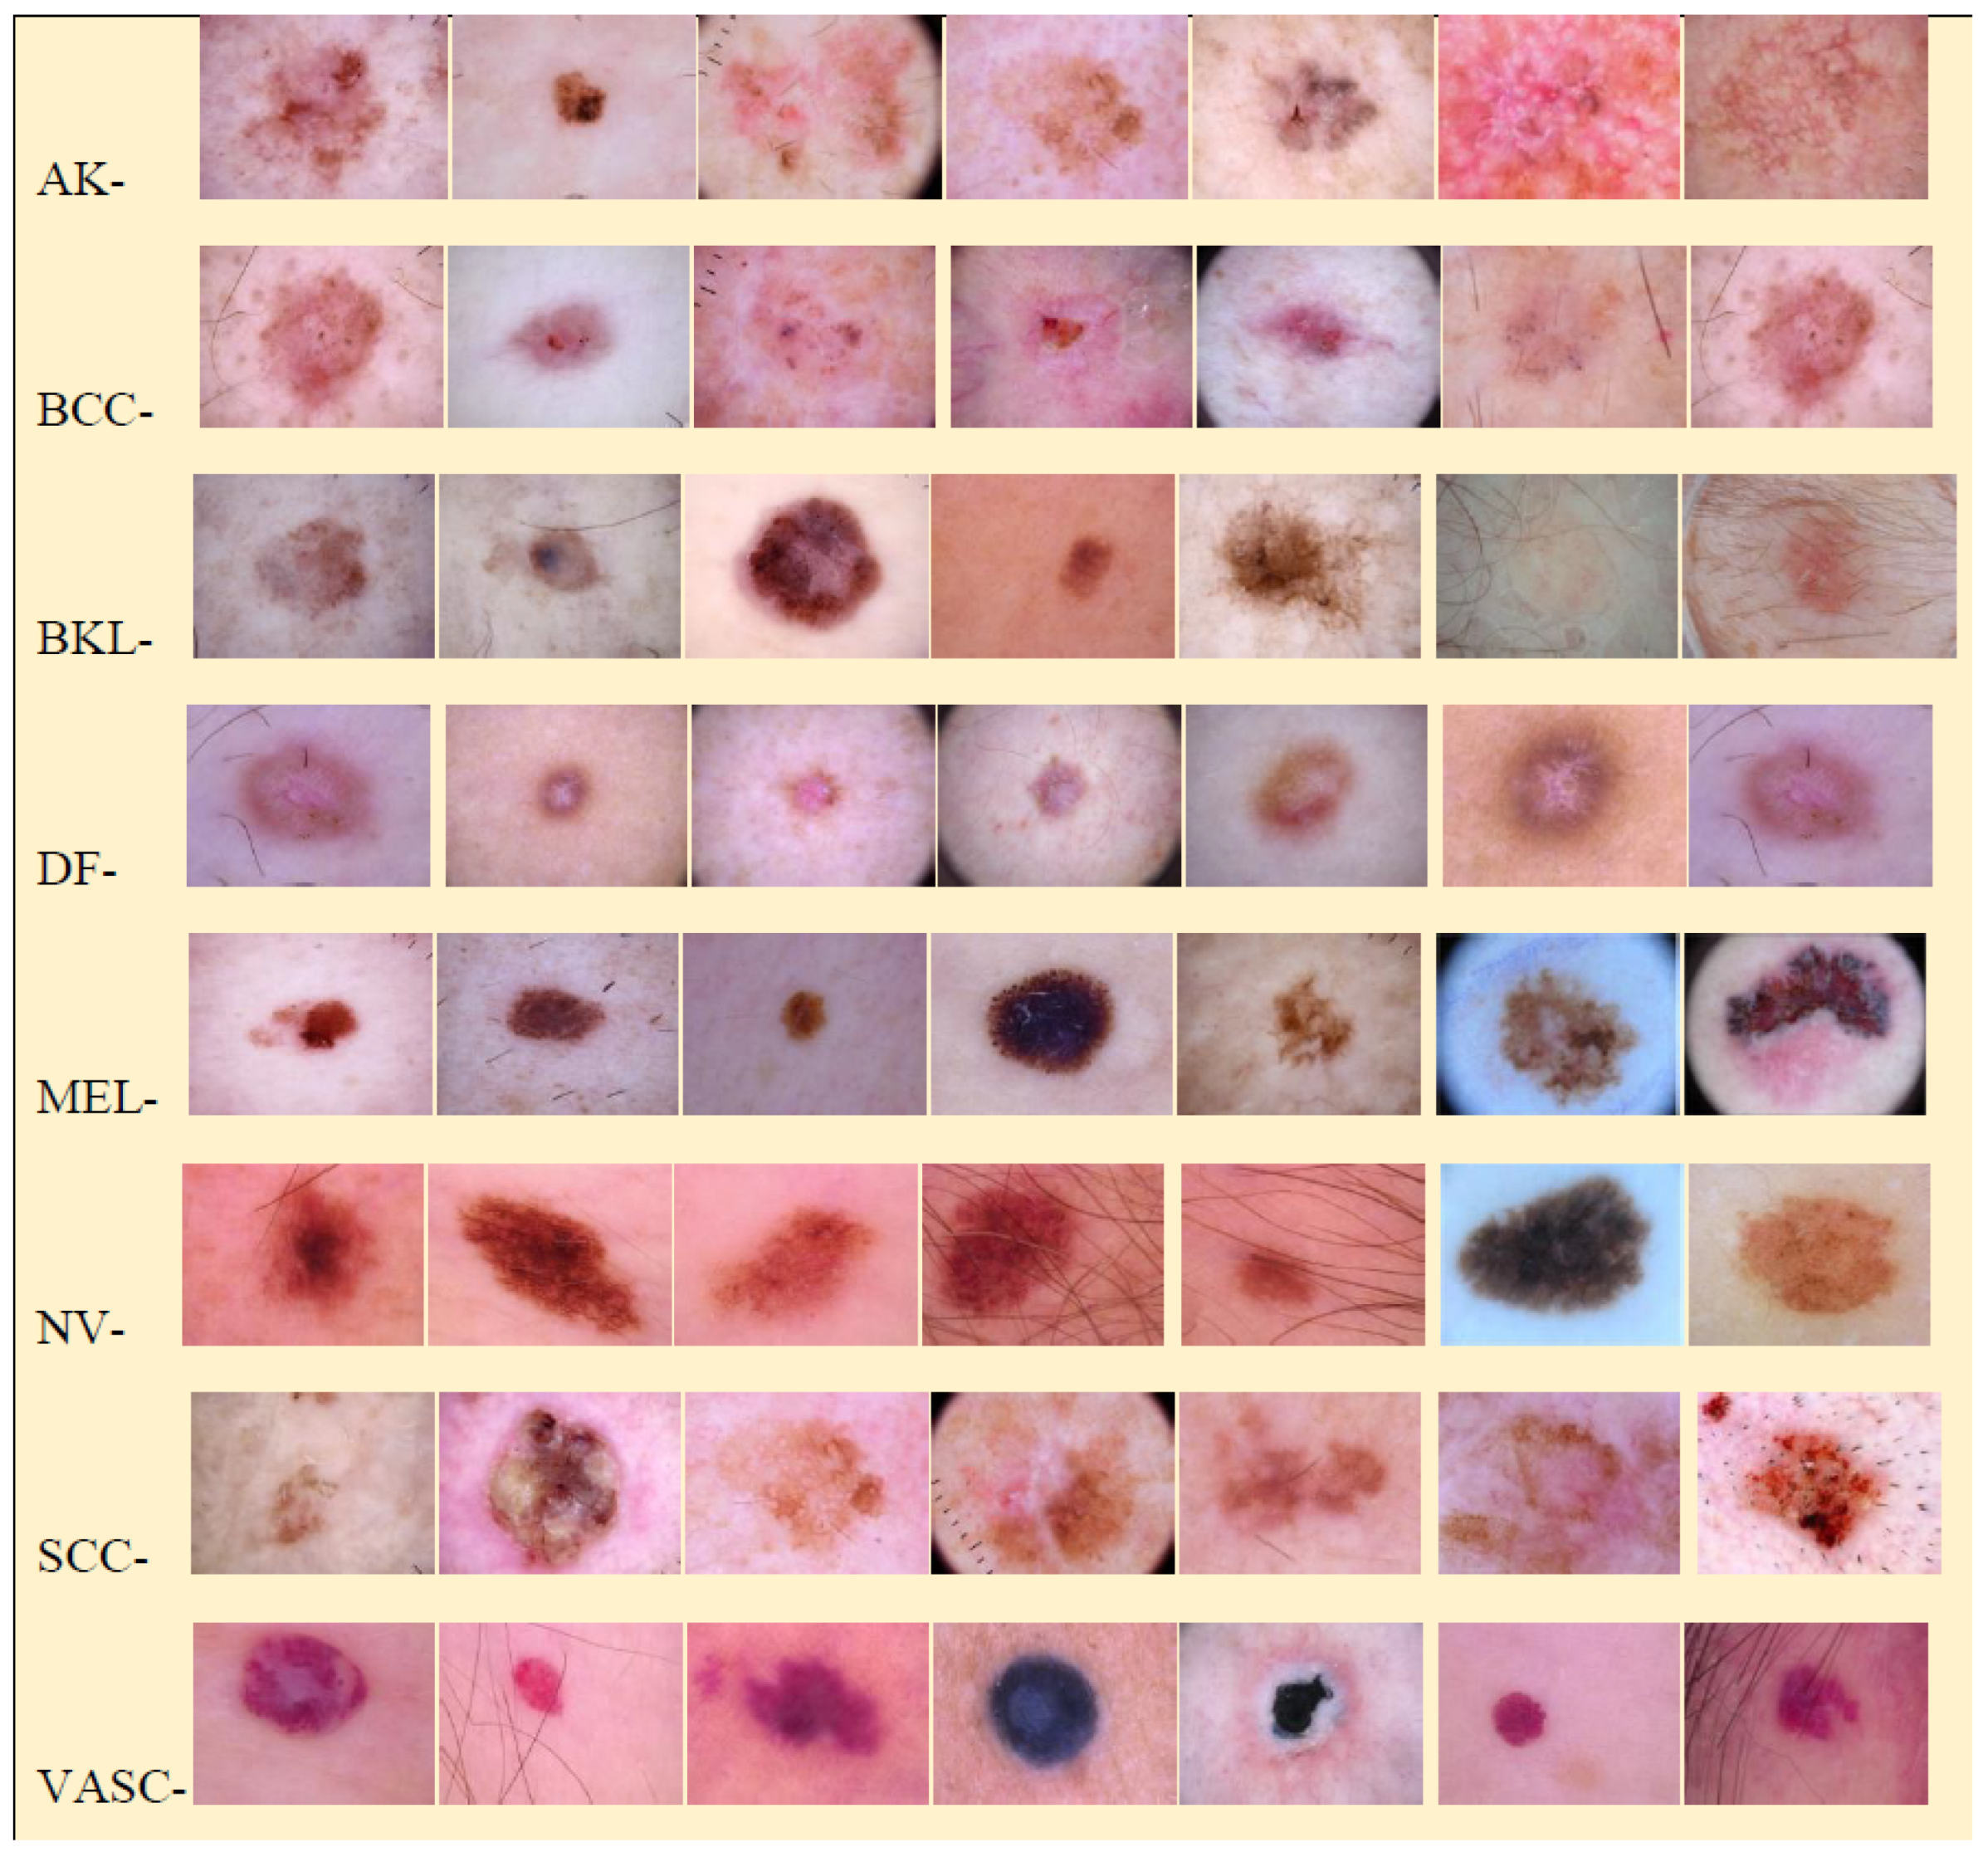
The ISIC2018 dataset contains 10,015 dermoscopic images. The dataset images were collected from the Medical University of Vienna (MUV), Austria, and C. R. skin cancer practice in Queensland, Australia. It has taken twenty years to put this collection together. Prior to the easy access of digital cameras, lesion photographs were taken, saved, and placed at the Department of Dermatology, MUV, Austria. The Nikon-Coolscan-5000-ED scanner was used to digitally scan these image prints which were next transformed into 8-bit color JPEG pictures with a quality of 300 DPI. After necessary editing, the photos were saved at 72 DPI and 800 × 600 pixels of resolution. This dataset comprised of seven classes, i.e., (i) vascular lesions (VASC), (ii) actinic keratosis (AKIEC), (iii) melanoma (MEL), (iv) benign keratosis (BKL), (v) melanocytic nevus (NV), (vi) basal cell carcinoma (BCC) and, (vii) dermatofibroma (DF) with 142, 327, 1113, 1099, 6705, 514 and 115 images in each class, respectively.
The ISIC2019 dataset contains 25,331 dermoscopic images and is comprised of eight classes, i.e., (i) melanoma (MEL), (ii) squamous cell carcinoma (SCC), (iii) basal cell carcinoma (BCC), (iv) dermatofibroma (DF), (v) melanocytic nevus (NV), (vi) vascular lesion (VASC), (vii) benign keratosis (BKL) and actinic keratosis (AKIEC) with 4522, 628, 3323, 239, 12,875, 253, 2624 and 867 images in each class, respectively. Because photographs from previous ISIC challenges were re-employed in subsequent challenges, ISIC images were grouped by their actual datasets, as depicted in the ISIC records, to avoid the same images being considered more than one time in analysis.
The sample images from each class of the ISIC2019 dataset are shown in Figure 1.

4. Methodology

The block diagram of proposed framework for SC classification is presented in Figure 2. The proposed method consists of the following crucial steps: (i) data augmentation; (ii) construction of a hybrid feature set by concatenating features obtained from fine-tuned Inception-v3 and Densenet-201 models; (iii) feature selection via binary tree growth (BTG) algorithm.

4.1. Data Augmentation

The performance of DL models strongly depends on the image quality, size of the dataset, and contextual sense of images because these models need huge amounts of images to achieve good results. Data scarcity is a big problem where gathering and developing more data is challenging. Data augmentation schemes provide a strong and low cost answer in such situations [51]. Data augmentation schemes can artificially generate more images and boost the total number of images. The simplest form of generating augmented images is by creating different geometrical transformations of the original image using operations such as adding noise, cropping, translation, shearing, etc. This study generated the augmented images using translation (pixelshift = [−30 30]), reflection (flips/turn over the images with an 50 percent prob. in every dimension), and shearing (with the shearing angle varying randomly between −30 and 30). These schemes supply the proposed model with various forms of the actual version which enhances its generalization potential.
Figure 2. Framework of the proposed methodology.
Symmetry 15 02213 g002

4.2. Construction of Hybrid Deep Feature Set via Fine-Tuned Densenet-201 and Inception-v3 Models

In the interest of capturing effective image features, we employed well-known deep-learning architectures that are pre-trained Densenet-201 and Inception-v3 models, which have demonstrated excellent classification results and are trained on a huge amount of data from the Imagenet dataset.

4.2.1. Densenet-201

The Densenet architecture [52] is built on intricate connections between convolutional layering. Densenet strengthens the feature extraction process by addressing the vanishing gradient problem and minimizes the number of inputs and the associated variables. Its architecture which is composed of a number of dense blocks connected by transition layers utilizes the benefits of shortcut connections. Each block has a bunch of convolutional layers, and rather than accumulating them, each layer is linked to all the preceding layers from the same block. The network becomes thinner and tighter when the earlier level feature-maps are transferred to succeeding layers. As a succession of dense blocks, transition layers, classification layers, and conv. along with pooling layers, construct Densenet. Several variants of Densenet have been introduced, such as Densenet-121, Densenet-169, Densenet-201, etc. We used Densenet-201 in our study, which is a 201 layered-CNN and considers an input image dimension of 224 × 224.
Figure 3 shows the structure of a Densenet framework where every layer comprises (i) batch normalization (BN), (ii) ReLU and (iii) Conv. (3 × 3-filter). Every block accepts input in a matrix form that represents an image pixel, which is then fed to the BN step, thereby minimizing the over-fitting kind of issues.

4.2.2. Inception-v3

The upgrade of the inception block with modifications to the symmetric and asymmetric construction modules was the concept behind Inception-v3 [53]. Inception-v3 is an improved form of Inception-v2 that performs image classification with improved efficiency through factorizing conv. (5 × 5) into two reduced forms of conv. (3 × 3) to accelerate calculations and stretch the filter bank in thickness to eliminate the symbolic bottleneck. In asymmetric convolution, a conv. (N × N) may be substituted by a (1 × N) conv. followed by a (N × 1) convolution. The Inception-v3 achieves label smoothing and eliminates over-fitting by including a regularisation module into a loss function. In addition, Inception-v3 factorizes conv. (7 × 7) and concatenates several layers using the BN scheme, resulting in better capability and reduced computing complexity. Figure 4 illustrates the structure of Inception blocks, and Figure 5 depicts the Inception-v3 framework.
Both Inception-v3 and Densenet-201 pre-trained models are originally capable of categorizing images into 1000 different classes like different animals, pencils, monitors, etc. and the characteristic learned from images from the Imagenet dataset might be utilized to resolve certain jobs requiring fresh data with the limited amount of samples. This problem has been addressed with the introduction of the transfer learning (TL) scheme [54]. In Figure 6, the concept of TL is depicted. Our pre-trained Inception-v3 and Densenet-201 models are trained on millions of images, so that it can be treated as a generalized model. Hence, the TL scheme avoids the requirement to train a network using a huge amount of data right from the beginning. The TL can be implemented using fine-tuning, where we modify the network architecture by eliminating and substituting the earlier fully connected (FC) layers with new FC layers, and these fresh layers are trained with the new desired dataset to foretell the current input categories. The TL with fine-tuning is the process of image categorization using pre-trained CNN operating on a new given dataset.
The hyper-parameters of fine-tuned Inception-v3 and Densenet-201 models are tuned according to our datasets. In order to capture the comprehensive features, we concatenate the features obtained from fine-tuned Inception-v3 and Densenet-201 models to form a hybrid feature set. The most discriminating features are next selected from the hybrid feature set using the BTG algorithm, which are eventually fed to a multi-class SVM classifier for skin lesion categorization.

4.3. Optimized Feature Selection (FS) Using Binary Tree Growth (BTG) Algorithm

While maintaining the integrity of the information, FS picks up the most significant information from the input feature vector. FS boosts the classification results by decreasing the count of insignificant features. There are two broad types of FS: (i) filter-type and (ii) wrapper-type. The wrapper type use a meta-heuristic algorithm to pick up the most effective mixture of pertinent features to improve the classification results. The filter type bases its selection of the pertinent aspects on (i) statistical, (ii) separation and, (iii) mutual information. The filter-type strategy takes less time and is not dependent on the learning task in contrast to wrapper-type schemes. The wrapper-types are quite popular in engineering-related fields and usually exhibit satisfactory results.
Figure 5. The structure of an Incpetion-v3 framework.
Symmetry 15 02213 g005
Figure 6. The idea of transfer learning.
Symmetry 15 02213 g006
Image categorization relies heavily on selecting a relevant collection of features, which increases classification efficiency and speeds up computation. In this study, the subset of best image characteristics from the feature vector is chosen using the BTG algorithm. The BTG is a powerful FS algorithm with very few related studies in the literature. In this study, we have investigated the application of the BTG algorithm-based FS in skin lesion classification problems. In [34,37], the authors proposed a tree growth (TG) algorithm which is motivated by a natural environment inhabitant build meta-heuristic that tries to imitate the developing or spreading conduct of forest trees.
In the TG algorithm, to build the primary trees in the forest, a collection of possible solutions is produced randomly. The entire community of trees is separated into four categories based on their fitness parameters. The trees that are more fit go into the first group, where the trees will continue to expand further. The group that competes for light trees is the second group. In this group, the tree is transferred to a location such that it is near to the two nearby trees. The objective of the third category, known as ’removal or replacement’, tries to remove the bad trees and grow new ones. The fourth group involves reproduction, where the best trees from this category are used to produce new trees. The following is an explanation of the TG algorithm in brief [34,37]:
A starting population or community of trees is produced arbitrarily in the first step, and the fitness value is calculated. In this study, an SVM classifier is employed for the computation of categorizing errors and to form a symmetry between the categories. We employ the following fitness function in our study:
F i t n e s s = B E r + ( 1 B ) | F s | | F t |
where F s is the number of chosen features, and F t denotes the complete set of features. E r is the categorizing error rate of the learning procedure, whereas factors B and ( 1 B ) are used for symmetric-balancing of both the measures. The value of B ranges between 0 and 1.
The fitness value is used to rank the community/population of trees in ascending order. The first tree group is then given the best N 1 trees, which expands further as:
P i t + 1 = P i t θ + r P i t
where r represents a random number between 0 and 1, t represents the present number of iterations, theta represents the tree depletion figure of power, and P i represents the tree (solution) at order i in the community. The present tree will be substituted if the freshly created tree obtains a higher fitness score. If not, the present tree is saved for the next generation. In the subsequent phase, N 2 trees are transferred to a second group. The Euclidean distance for each tree is computed using Equation (3), based on which the two closest trees (from the first and second group) are identified.
d i = i = 1 N 1 + N 2 P N 2 t P i t 2 1 2
P i represents the ith tree in the community and P N 2 denotes the present tree. It can be noted that when P N 2 = P i , where N 2 = i the distance becomes infinite. The present tree then approaches the neighboring trees to battle for light. The following equation computes the linear sum of the two nearby trees:
Q = λ a 1 + ( 1 λ ) a 2
where λ is employed to tune the effect of a nearby tree, whereas the parameters a 1 and a 2 are the first and second nearest trees, respectively. In the second group, the tree location is changed as:
P N 2 t + 1 = P N 2 t + α Q
where α stands for the angular distribution between 0 and 1, the N 3 bad trees are eliminated from the third group and substituted with fresh trees (fresh solutions). The N 3 trees are determined by the expression:
N 3 = N N 1 N 2
N 1 and N 2 are the number of trees in the first and second groups, respectively, and N is the population size. Utilizing the mask operator, fresh N 4 trees are created in the final group around the finest trees. It is to be noted that the total no. of N 1 and N 2 is not supposed to be less than the no. of N 4 . After that, the freshly created N 4 trees are then included into the community/population. The fitness value is used to order the combined population. The finest N trees are then chosen to represent the fresh population in the subsequent iteration. Until the final condition is fulfilled, the procedure is repeated. Eventually, the universally supreme arbitrary tree is chosen as the supreme solution.
For engineering problems, TGA is an excellent optimizer, but for feature selection, a binary version is required. For feature selection, Jingwei et al. [35] presented binary TG, i.e., the BTG technique. The trees location is translated into a probability value by using the transfer function. A greater prob. number often means a greater possibility that the feature will be chosen. The sigmoid function is used in this work as the transfer function in the BTG algorithm for FS, which is expressed by:
S ( p i d t ) = 1 1 + e p i d t
where p represents the dth facet of the search space. The location is transformed by the transfer function into a prob value, ranging from 0 to 1. The tree’s location is then modified depending on the prob. value in the manner described below:
p i d t + 1 = 1 , if R n < S i d t 0 , otherwise
where R n is an arbitrary number from 0 to 1. The forth tree group employs a mask procedure as indicated in the TG algorithm. The mask procedure for the BTG algorithm is explained as illustrated in the Figure 7.
Though the TG algorithm-based concept has shown some good results [34,37], few studies have been found regarding FS concerning image classification mainly linked to skin lesion classification.

5. Experimental Results and Discussion

This section describes of the experimental setup, performance assessment metrics utilized in the study, experimental findings, and the associated discussion.

5.1. Experimental Set-Up

Two challenging datasets, i.e., ISIC2018 and ISIC2019, are utilized to test the performance of the proposed framework. The dataset details can be found in Section 3. The entire code was implemented in MATLAB, and the experiments were performed on an HP Workstation that has 64 GB RAM along with a NVIDIA’s Quadro P2200 5GB graphics card. We chose the test:train ratio to be 20:80 (randomly selected) for the classification study. We adjust the hyper-parameters of the fine-tuned Inception-v3 and Densenet-201 models for various datasets, based on several tests to find the optimal outcomes (Table 1).
The implementation of the BTG algorithm in our study employs various choices of parameters as depicted in Table 2. In the BTG procedure, we set the value of B to 0.99.
We have compared our classification outcomes with several well-known existing schemes [2,4,5,6,12,13,20,21,22,25,30] to demonstrate the better performance of the proposed framework.

5.2. Performance Evaluation Measures

We evaluate the SC classification performance of the proposed framework in terms of accuracy, precision, sensitivity, specificity, and F1-score measures for all the datasets. These measures can be calculated using the following expressions:
A c c u r a c y = T P + T N T P + F P + T N + F N
P r e c i s i o n = T P T P + F P
S e n s i t i v i t y ( R e c a l l ) = T P T P + F N
S p e c i f i c i t y = T N T N + F P
F 1 s c o r e = 2 P r e c i s i o n R e c a l l P r e c i s i o n + R e c a l l
where TP, TN, FP, and FN denote “true positive”, “true negative”, “false positive”, and “false negative” values, respectively.

5.3. Results and Analysis

The classification outcomes of our framework are presented and discussed in this subsection. The outcomes are analyzed via accuracy, precision, sensitivity, specificity, and F1-score measures using seven separate feature vectors:
  • The features extracted from the fine tuned Densenet-201 model are denoted as [ F 1 ] feature vectors.
  • The features extracted from the fine tuned Inception-v3 model are denoted as [ F 2 ] feature vectors.
  • The optimized feature selection (FS) using BTG algorithm from F 1 is denoted as [ F 1 ] ( o ) feature vector.
  • The optimized FS using BTG algorithm from F 2 is denoted as [ F 2 ] ( o ) feature vector.
  • The concatenation of [ F 1 ] and [ F 2 ] is denoted as [ F 1 F 2 ] feature vector.
  • The concatenation of [ F 1 ] ( o ) and [ F 2 ] ( o ) is denoted as [ [ F 1 ( o ) ] [ F 2 ( o ) ] ] feature vector.
  • The optimized FS using BTG algorithm from [ F 1 F 2 ] vector is denoted as [ F 1 F 2 ] ( o ) feature vector.
Table 3 illustrates the classification performance of the proposed method (i.e., [ F 1 F 2 ] ( o ) ) along with other feature vectors in terms of various measures for ISIC2018. The performance of [ F 1 ] and [ F 2 ] individually shows very low sensitivity, F1-score, and precision compared to its respective accuracy and specificity values. However, the optimized feature vectors [ F 1 ] ( o ) and [ F 2 ] ( o ) individually show outstanding improvement in terms of sensitivity, F1-score, and precision when compared to the performance of feature vectors [ F 1 ] and [ F 2 ] , respectively. Though the outcomes of feature vector [ F 1 F 2 ] improve upon the individual outcomes of [ F 1 ] and [ F 2 ] vectors, the improvements in sensitivity, F1-score and precision measures are not satisfactory. The [ F 1 F 2 ] ( o ) vector exhibits a tremendous improvement in performance over all other feature vectors (Table 3) in terms of all the metrics, including sensitivity, F1-score, and precision.
The confusion matrix of the proposed framework, i.e., the feature vector [ F 1 F 2 ] ( o ) for various classes of ISIC2018, is shown in Figure 8. The ‘bkl’ and ‘vasc’ classes were noted to have been perfectly learned by the model (i.e., 100%), however, the error rates were noted to be 12.7% for class ‘ak’, 4.7% for ‘mel’, 4.0% for ‘df’, 2.1% for ‘bcc’ and 0.4% for class ‘nv’.
The ROC plots also provide important information that depicts a compromise between true and false positive rates. Figure 9 shows the highest AUC, i.e., 1 for both the ‘df’ and ‘vasc’ classes and worst for the ‘mel’ class.
Table 4 shows the performance of Densenet-201 and Inception-v3 models with and without augmentation implementations which further motivated us to include this crucial step in this study.
Table 5 and Table 6 depicts the performance of proposed framework on ISIC2018 dataset with k-NN and random forest classifiers, respectively. The results from Table 3, Table 5 and Table 6 clearly demonstrates the superiority of proposed framework with SVM classifier over k-NN and random forest for skin lesion categorization.
In Table 7 we have shown the comparison of combination of different DL models such as fine-tuned Inception-v3, Densenet-201, Renet-101 and Googlenet models for ISIC2018. It can be clearly observed from Table 3 and Table 7 that the blend of fine-tuned Densenet-201 and Inception-v3 features achieves best results and is complementary to the individual models.
Table 8 shows the classification performance of the proposed method in terms of various measures for ISIC2019. Like the results shown in Table 3, here, too, the feature vectors [ F 1 ] and [ F 2 ] individually show very low values of sensitivity, F1-score, and precision when compared to accuracy and specificity values. The feature vectors [ F 1 ] ( o ) and [ F 2 ] ( o ) , respectively, when compared to [ F 1 ] and [ F 2 ] vectors, provides a great benefit in terms of improvement in all the measures, including sensitivity, F1-score, and precision metrics. As can be seen clearly from Table 8, the proposed feature set, i.e., [ F 1 F 2 ] ( o ) , shows notable improvement in terms of all metrics, demonstrating the effectiveness of powerful FS from a hybrid comprehensive feature set [ F 1 F 2 ] . Unlike [ [ F 1 ( o ) ] [ F 2 ( o ) ] ] where the global best solutions are computed in individual [ F 1 ] and [ F 2 ] , the feature vector [ F 1 F 2 ] ( o ) allows the BTG algorithm to compute globally superior feature subset from the hybrid comprehensive feature set [ F 1 F 2 ] which can identify the best optimal fitness solution.
The confusion matrix of the proposed framework, i.e., the feature vector [ F 1 F 2 ] ( o ) for various classes of ISIC2019, is shown in Figure 10. The ‘bcc’ and ‘df’ classes, respectively, were noted to have been the best and worst learned by the model. The class error rates were observed to be 10.2% for class ‘df’, 8.7% for ‘vasc’, 8.1% for ‘scc’, 5.6% for ‘ak’, 5.0% for class ‘bkl’, 4.9% for ‘mel’, 2.4% for ‘nv’ and 1.5% for ‘bcc’ class.
The ROC curve for ISIC2019 is demonstrated in Figure 11. Here, too, the ‘df’ and ‘vasc’ classes achieve the highest AUC and exhibits ‘bkl’ as the worst performing class.
From Table 3 and Table 8, it can be seen that the feature vector [ F 1 F 2 ] ( o ) has reduced feature dimensions compared to [ F 1 F 2 ] with a notable increase in classification performance.
In Table 9, we have demonstrated a comparative analysis of proposed deep features when combined with a few popular metaheuristic algorithm-based feature selection schemes such as binary ACO, binary HHOA, binary dragonfly algorithm (BDA), binary WOA, binary PSO and binary BTG algorithms. The results show that the proposed framework (proposed deep features with BTG) consistently outperforms the cases when proposed features are combined with binary ACO, binary PSO and binary HHOA (except for sensitivity parameter) algorithms with much less feature dimensions. Though proposed features with BDA provides less dimensions but their performance is much inferior to the proposed framework. The proposed framework outperforms binary WOA-based FS by a very close margin except for sensitivity where the proposed framework with BTG underperforms WOA by a very small margin, however the WOA provides quite large dimensions compared to BTG algorithm-based FS. The proposed framework (proposed deep features with BTG) overall shows encouraging results over many well-known metaheuristic algorithm-based FS schemes but with many fewer feature dimensions.
Table 10 clearly demonstrates that at 20 number of iterations we achieve the best performance with relatively much lesser feature dimensions and run-time.
Table 11 shows the results comparison of proposed framework with a few well-known recent techniques. Our framework clearly and consistently outperforms all the existing recent techniques, including a few FS-based techniques in terms of all the performance measures for all the datasets. The margin of improvement for proposed technique over other techniques is comparatively higher in case of ISIC2018 than ISIC2019 dataset. The significantly improved accuracy, sensitivity, precision, specificity, F1-score, and AUC of our framework can offer remarkable benefits for both medical professionals and researchers and pave the way for further advancements in skin lesion diagnostics.

6. Conclusions

This article has introduced a novel, automated and improved multiclass skin lesion categorization framework composed of a few vital steps including image augmentation, amalgamation of deep features obtained from fine-tuned Inception-v3 and Densenet-201 models, optimized feature selection via BTG algorithm and the categorization of hybrid deep features using a SVM classifier. The experimental outcomes reveal that such blend of features supplies improved discriminating capability and complements the independent models. A BTG algorithm is implemented on the hybrid deep-feature set in order to obtain improved classification results with decreased feature dimensions. The optimized feature vector obtained after FS is eventually fed to a multi-class SVM for classification. The performance of our scheme is validated on ISIC2018 and ISIC2019 datasets which is demonstrated to be highly competitive when compared to existing well-known algorithms. Although the proposed framework provides encouraging results for the challenging ISIC2018 and ISIC2019 datasets, it has the following limitations and drawbacks: (i) though it is demonstrated that the deep-feature blending from different fine-tuned pre-trained networks could further enhance the classification performance, a limited number of pre-trained networks are explored. The present work can be further extended by investigating a higher number of such networks which may further improve the performance. Furthermore coupling the present framework with hand-designed features could enhance the results. (ii) The training images used in the present study are somewhat limited and a higher number of training images is crucial for better fine-tuning of pre-trained networks, So, the availability of more quality dermoscopic skin lesion images could enhance the performance. (iii) More appropriate pre-processing actions could further improve the classification outcomes. (iv) Some skin lesion images are occasionally occluded by human hairs which may affect the classification results. Many existing techniques remove these hairs through special image processing schemes. In the future work, the above limitations and drawbacks shall be explored.

Author Contributions

Conceptualization, S.K. and D.H.; methodology, S.K. and V.K.N.; software, S.K.; validation, S.K., V.K.N. and D.H.; formal analysis, S.K., V.K.N. and D.H.; investigation, S.K. and V.K.N.; resources, V.K.N. and D.H.; data curation, S.K.; writing—original draft preparation, S.K., V.K.N. and D.H.; writing—review and editing, S.K., V.K.N. and D.H.; visualization, S.K., V.K.N. and D.H.; supervision, V.K.N.; project administration, D.H.; funding acquisition, S.K. All authors have read and agreed to the published version of the manuscript.

Funding

This research received no external funding.

Data Availability Statement

The datasets generated during and/or analysed during the current study are available from the corresponding author on reasonable request.

Acknowledgments

The authors are grateful to the anonymous referees for their comments, which helped to improve the quality of the manuscript. This work was supported by the All India Council for Technical Education (AICTE), Govt. of India through AICTE Doctoral Fellowship (ADF) scheme.

Conflicts of Interest

The authors declare no conflict of interest.

References

  1. Dildar, M.; Akram, S.; Irfan, M.; Khan, H.U.; Ramzan, M.; Mahmood, A.R.; Alsaiari, S.A.; Saeed, A.H.M.; Alraddadi, M.O.; Mahnashi, M.H. Skin cancer detection: A review using deep learning techniques. Int. J. Environ. Res. Public Health 2021, 18, 5479. [Google Scholar] [CrossRef]
  2. Kassem, M.A.; Hosny, K.M.; Fouad, M.M. Skin lesions classification into eight classes for ISIC 2019 using deep convolutional neural network and transfer learning. IEEE Access 2020, 8, 114822–114832. [Google Scholar] [CrossRef]
  3. Arshad, M.; Khan, M.A.; Tariq, U.; Armghan, A.; Alenezi, F.; Javed, M.Y.; Aslam, S.M.; Kadry, S. A computer-aided diagnosis system using deep learning for multiclass skin lesion classification. Comput. Intell. Neurosci. 2021, 2021, 9619079. [Google Scholar] [CrossRef] [PubMed]
  4. Popescu, D.; El-Khatib, M.; Ichim, L. Skin Lesion Classification Using Collective Intelligence of Multiple Neural Networks. Sensors 2022, 22, 4399. [Google Scholar] [CrossRef]
  5. Zhao, C.; Shuai, R.; Ma, L.; Liu, W.; Hu, D.; Wu, M. Dermoscopy image classification based on StyleGAN and DenseNet201. IEEE Access 2021, 9, 8659–8679. [Google Scholar] [CrossRef]
  6. Al-Masni, M.A.; Kim, D.H.; Kim, T.S. Multiple skin lesions diagnostics via integrated deep convolutional networks for segmentation and classification. Comput. Methods Programs Biomed. 2020, 190, 105351. [Google Scholar] [CrossRef] [PubMed]
  7. Al-Masni, M.A.; Al-Antari, M.A.; Choi, M.T.; Han, S.M.; Kim, T.S. Skin lesion segmentation in dermoscopy images via deep full resolution convolutional networks. Comput. Methods Programs Biomed. 2018, 162, 221–231. [Google Scholar] [CrossRef]
  8. Khan, M.A.; Muhammad, K.; Sharif, M.; Akram, T.; De Albuquerque, V.H.C. Multi-class skin lesion detection and classification via teledermatology. IEEE J. Biomed. Health Inform. 2021, 25, 4267–4275. [Google Scholar] [CrossRef]
  9. Kousis, I.; Perikos, I.; Hatzilygeroudis, I.; Virvou, M. Deep learning methods for accurate skin cancer recognition and mobile application. Electronics 2022, 11, 1294. [Google Scholar] [CrossRef]
  10. Ali, M.S.; Miah, M.S.; Haque, J.; Rahman, M.M.; Islam, M.K. An enhanced technique of skin cancer classification using deep convolutional neural network with transfer learning models. Mach. Learn. Appl. 2021, 5, 100036. [Google Scholar] [CrossRef]
  11. Lan, Z.; Cai, S.; He, X.; Wen, X. FixCaps: An improved capsules network for diagnosis of skin cancer. IEEE Access 2022, 10, 76261–76267. [Google Scholar] [CrossRef]
  12. Almaraz-Damian, J.A.; Ponomaryov, V.; Sadovnychiy, S.; Castillejos-Fernandez, H. Melanoma and nevus skin lesion classification using handcraft and deep learning feature fusion via mutual information measures. Entropy 2020, 22, 484. [Google Scholar] [CrossRef]
  13. Iqbal, I.; Younus, M.; Walayat, K.; Kakar, M.U.; Ma, J. Automated multi-class classification of skin lesions through deep convolutional neural network with dermoscopic images. Comput. Med. Imaging Graph. 2021, 88, 101843. [Google Scholar] [CrossRef] [PubMed]
  14. Sharafudeen, M.; Chandra, S.S.V. Detecting skin lesions fusing handcrafted features in image network ensembles. Multimed. Tools Appl. 2023, 82, 3155–3175. [Google Scholar] [CrossRef]
  15. Kadirappa, R.; Deivalakshmi, S.; Pandeeswari, R.; Ko, S.-B. An automated multi-class skin lesion diagnosis by embedding local and global features of Dermoscopy images. Multimed. Tools Appl. 2023, 82, 34885–34912. [Google Scholar] [CrossRef]
  16. Hosny, K.M.; Kassem, M.A. Refined residual deep convolutional network for skin lesion classification. J. Digit. Imaging 2022, 35, 258–280. [Google Scholar] [CrossRef]
  17. Golnoori, F.; Boroujeni, F.Z.; Monadjemi, A. Metaheuristic algorithm based hyper-parameters optimization for skin lesion classification. Multimed. Tools Appl. 2023, 82, 25677–25709. [Google Scholar] [CrossRef]
  18. Alsahafi, Y.S.; Kassem, M.A.; Hosny, K.M. Skin-Net: A novel deep residual network for skin lesions classification using multilevel feature extraction and cross-channel correlation with detection of outlier. J. Big Data 2023, 10, 105. [Google Scholar] [CrossRef]
  19. Jasil, S.G.; Ulagamuthalvi, V. A hybrid CNN architecture for skin lesion classification using deep learning. Soft Comput. 2023, 1–10. [Google Scholar] [CrossRef]
  20. Villa-Pulgarin, J.P.; Ruales-Torres, A.A.; Arias-Garzón, D.; Bravo-Ortiz, M.A.; Arteaga-Arteaga, H.B.; Mora-Rubio, A.; Alzate-Grisales, J.A.; Mercado-Ruiz, E.; Hassaballah, M.; Orozco-Arias, S.; et al. Optimized convolutional neural network models for skin lesion classification. Comput. Mater. Contin. 2022, 70, 2131–2148. [Google Scholar] [CrossRef]
  21. El-Khatib, H.; Popescu, D.; Ichim, L. Deep learning-based methods for automatic diagnosis of skin lesions. Sensors 2020, 20, 1753. [Google Scholar] [CrossRef]
  22. Benyahia, S.; Meftah, B.; Lezoray, O. Multi-features extraction based on deep learning for skin lesion classification. Tissue Cell 2022, 74, 101701. [Google Scholar] [CrossRef] [PubMed]
  23. Rashid, J.; Ishfaq, M.; Ali, G.; Saeed, M.R.; Hussain, M.; Alkhalifah, T.; Alturise, F.; Samand, N. Skin cancer disease detection using transfer learning technique. Appl. Sci. 2022, 12, 5714. [Google Scholar] [CrossRef]
  24. Wan, Y.; Cheng, Y.; Shao, M. MSLANet: Multi-scale long attention network for skin lesion classification. Appl. Intell. 2023, 53, 12580–12598. [Google Scholar] [CrossRef]
  25. Afza, F.; Sharif, M.; Khan, M.A.; Tariq, U.; Yong, H.S.; Cha, J. Multiclass skin lesion classification using hybrid deep features selection and extreme learning machine. Sensors 2022, 22, 799. [Google Scholar] [CrossRef]
  26. Farhat, A.; Khan, M.A.; Sharif, M.; Rehman, A. Microscopic skin laceration segmentation and classification: A framework of statistical normal distribution and optimal feature selection. Microsc. Res. Tech. 2019, 82, 1471–1488. [Google Scholar]
  27. Khan, M.A.; Akram, T.; Sharif, M.; Shahzad, A.; Aurangzeb, K.; Alhussein, M.; Haider, S.I.; Altamrah, A. An implementation of normal distribution based segmentation and entropy controlled features selection for skin lesion detection and classification. BMC Cancer 2018, 18, 638. [Google Scholar] [CrossRef]
  28. Khan, M.A.; Akram, T.; Sharif, M.; Javed, K.; Rashid, M.; Bukhari, S.A.C. An integrated framework of skin lesion detection and recognition through saliency method and optimal deep neural network features selection. Neural Comput. Appl. 2020, 32, 15929–15948. [Google Scholar] [CrossRef]
  29. Khan, M.A.; Sharif, M.; Akram, T.; Bukhari, S.A.C.; Nayak, R.S. Developed Newton-Raphson based deep features selection framework for skin lesion recognition. Pattern Recognit. Lett. 2020, 129, 293–303. [Google Scholar] [CrossRef]
  30. Zafar, M.; Amin, J.; Sharif, M.; Anjum, M.A.; Mallah, G.A.; Kadry, S. DeepLabv3+-Based Segmentation and Best Features Selection Using Slime Mould Algorithm for Multi-Class Skin Lesion Classification. Mathematics 2023, 11, 364. [Google Scholar] [CrossRef]
  31. Wen, L.; Yin, Q.; Guo, P. Ant Colony Optimization Algorithm for Feature Selection and Classification of Multispectral Remote Sensing Image. In Proceedings of the IEEE International Geoscience and Remote Sensing Symposium (IGARSS), Boston, MA, USA, 7–11 July 2008. [Google Scholar]
  32. Narasimhulu, C.V. An automatic feature selection and classification framework for analyzing ultrasound kidney images using dragonfly algorithm and random forest classifier. IET Image Process. 2021, 15, 2080–2096. [Google Scholar] [CrossRef]
  33. Alhudhaif, A.; Saeed, A.; Imran, T.; Kamran, M.; Alghamdi, A.S.; Aseeri, A.O.; Alsubai, S. A Particle Swarm Optimization Based Deep Learning Model for Vehicle Classification. Comput. Syst. Sci. Eng. 2022, 40, 223–235. [Google Scholar] [CrossRef]
  34. Zhong, C.; Chen, Y.; Peng, J. Feature Selection Based on a Novel Improved Tree Growth Algorithm. Int. J. Comput. Intell. Syst. 2020, 13, 247–258. [Google Scholar] [CrossRef]
  35. Too, J.; Abdullah, A.R.; Saad, N.M.; Ali, N.M. Feature selection based on binary tree growth algorithm for the classification of myoelectric signals. Machines 2018, 6, 65. [Google Scholar] [CrossRef]
  36. Thawkar, S.; Sharma, S.; Khanna, M.; Singh, L.K. Breast cancer prediction using a hybrid method based on Butterfly Optimization Algorithm and Ant Lion Optimizer. Comput. Biol. Med. 2021, 139, 104968. [Google Scholar] [CrossRef] [PubMed]
  37. Cheraghalipour, A.; Hajiaghaei-Keshteli, M.; Paydar, M.M. Tree Growth Algorithm (TGA): A novel approach for solving optimization problems. Eng. Appl. Artif. Intell. 2018, 72, 393–414. [Google Scholar] [CrossRef]
  38. Khasanov, M.; Xie, K.; Kamel, S.; Wen, L.; Fan, X. Combined Tree Growth Algorithm for Optimal Location and Size of Multiple DGs with Different Types in Distribution Systems. In Proceedings of the IEEE Innovative Smart Grid Technologies—Asia (ISGT Asia), Chengdu, China, 21–24 May 2019; pp. 1265–1270. [Google Scholar]
  39. Wang, G.G.; Deb, S.; Cui, Z. Monarch butterfly optimization. Neural Comput. Appl. 2019, 31, 1995–2014. [Google Scholar] [CrossRef]
  40. Su, H.; Zhao, D.; Heidari, A.A.; Liu, L.; Zhang, X.; Mafarja, M.; Chen, H. RIME: A physics-based optimization. Neurocomputing 2023, 532, 183–214. [Google Scholar] [CrossRef]
  41. Wang, G.G. Moth search algorithm: A bio-inspired metaheuristic algorithm for global optimization problems. Memetic Comput. 2018, 10, 151–164. [Google Scholar] [CrossRef]
  42. Ahmadianfar, I.; Heidari, A.A.; Noshadian, S.; Chen, H.; Gandomi, A.H. INFO: An efficient optimization algorithm based on weighted mean of vectors. Expert Syst. Appl. 2022, 195, 116516. [Google Scholar] [CrossRef]
  43. Heidari, A.A.; Mirjalili, S.; Faris, H.; Aljarah, I.; Mafarja, M.; Chen, H. Harris hawks optimization: Algorithm and applications. Future Gener. Comput. Syst. 2019, 97, 849–872. [Google Scholar] [CrossRef]
  44. Ahmadianfar, I.; Heidari, A.A.; Gandomi, A.H.; Chu, X.; Chen, H. RUN beyond the metaphor: An efficient optimization algorithm based on Runge Kutta method. Expert Syst. Appl. 2021, 181, 115079. [Google Scholar] [CrossRef]
  45. Yang, Y.; Chen, H.; Heidari, A.A.; Gandomi, A.H. Hunger games search: Visions, conception, implementation, deep analysis, perspectives, and towards performance shifts. Expert Syst. Appl. 2021, 177, 114864. [Google Scholar] [CrossRef]
  46. Li, S.; Chen, H.; Wang, M.; Heidari, A.A.; Mirjalili, S. Slime mould algorithm: A new method for stochastic optimization. Future Gener. Comput. Syst. 2020, 111, 300–323. [Google Scholar] [CrossRef]
  47. Tu, J.; Chen, H.; Wang, M.; Gandomi, A.H. The Colony Predation Algorithm. J. Bionic Eng. 2021, 18, 674–710. [Google Scholar] [CrossRef]
  48. Codella, N.; Rotemberg, V.; Tschandl, P.; Celebi, M.E.; Dusza, S.; Gutman, D.; Helba, B.; Kalloo, A.; Liopyris, K.; Marchetti, M.; et al. Skin lesion analysis toward melanoma detection 2018: A challenge hosted by the international skin imaging collaboration (isic). arXiv 2018, arXiv:1902.03368. [Google Scholar]
  49. Tschandl, P.; Rosendahl, C.; Kittler, H. The HAM10000 dataset, a large collection of multi-source dermatoscopic images of common pigmented skin lesions. Sci. Data 2018, 5, 180161. [Google Scholar] [CrossRef]
  50. Combalia, M.; Codella, N.C.F.; Rotemberg, V.; Helba, B.; Vilaplana, V.; Reiter, O.; Carrera, C.; Barreiro, A.; Halpern, A.C.; Puig, S.; et al. Bcn20000: Dermoscopic lesions in the wild. arXiv 2019, arXiv:1908.02288. [Google Scholar]
  51. Shorten, C.; Khoshgoftaar, T.M. A survey on image data augmentation for deep learning. J. Big Data 2019, 6, 1–48. [Google Scholar] [CrossRef]
  52. Huang, G.; Liu, Z.; Maaten, L.V.D.; Weinberger, K.Q. Densely connected convolutional networks. In Proceedings of the IEEE Conference on Computer Vision and Pattern Recognition, Honolulu, HI, USA, 21–26 July 2017; pp. 2261–2269. [Google Scholar]
  53. Szegedy, C.; Vanhoucke, V.; Ioffe, S.; Shlens, J.; Wojna, Z. Rethinking the inception architecture for computer vision. In Proceedings of the IEEE Conference on Computer Vision and Pattern Recognition, Las Vegas, NV, USA, 27–30 June 2016; pp. 2818–2826. [Google Scholar]
  54. Plested, J.; Gedeon, T. Deep transfer learning for image classification: A survey. arXiv 2022, arXiv:2205.09904. [Google Scholar]
Figure 1. Sample images from each class of ISIC2019.
Symmetry 15 02213 g001
Figure 3. The structure of a Densenet framework.
Symmetry 15 02213 g003
Figure 4. Inception blocks (a) block-1; (b) block-2; (c) block-3.
Symmetry 15 02213 g004
Figure 7. An example of masking procedure.
Symmetry 15 02213 g007
Figure 8. Confusion matrix obtained for proposed framework on ISIC2018. (The correct and incorrect observations are displayed in diagonal and off-diagonal cells respectively. The values in last column displays the corresponding precision and false discovery rates. The values in last row correspond to recall and false negative rates. The last diagonal cell in the bottom right displays the overall accuracy).
Symmetry 15 02213 g008
Figure 9. ROC curve corresponding to proposed framework for ISIC 2018 dataset (a) original and (b) partially zoomed form of (a).
Symmetry 15 02213 g009
Figure 10. Confusion matrix obtained for proposed framework on ISIC2019. (The correct and incorrect observations are displayed in diagonal and off-diagonal cells respectively. The values in last column displays the corresponding precision and false discovery rates. The values in last row correspond to recall and false negative rates. The last diagonal cell in the bottom right displays the overall accuracy).
Symmetry 15 02213 g010
Figure 11. ROC curve corresponding to proposed framework for ISIC 2019 dataset (a) original and (b) partially zoomed form of (a).
Symmetry 15 02213 g011
Table 1. Hyper-parameters set used for training.
Models/Hyper-Par.DatasetBatch-SizeEpochsLearning-RateOptimizer
Inception-v3ISIC-2018321000.001sgdm
ISIC-201932500.001sgdm
Densenet-201ISIC-201824200.001sgdm
ISIC-20198200.0001sgdm
Table 2. Parameters of BTG algorithm employed in this study.
ParametersValue
No. of trees (N)10
Max. no. of iter.20
First group trees (N1)3
Second group trees (N2)5
Fourth group trees (N4)3
Rate of tree reduction (theta)0.8
Parameter controlling the impact of closest tree (lambda)0.5
Table 3. Classification performance of proposed framework with SVM classifier on ISIC-2018 dataset. (Bold face indicates best performance).
Feature VectorAccuracy PrecisionSensitivitySpecificityF1-ScoreFeat. Dim.
[ F 1 ] 89.6281.7174.9697.3478.191920
[ F 2 ] 88.9782.7575.2197.2278.802048
[ F 1 ] ( o ) 97.4096.4095.0099.3895.691429
[ F 2 ] ( o ) 97.5596.3095.0699.4195.691371
[ F 1 F 2 ] 90.8185.8575.9797.6180.613968
[ [ F 1 ( o ) ] [ F 2 ( o ) ] ] 97.8597.4995.1799.4196.312801
[ F 1 F 2 ] ( o ) 98.5097.8496.6099.5997.221983
Table 4. Classification performance on ISIC-2018 dataset for two deep learning models with and without augmentation cases (using SVM classifier).
Feature VectorAccuracyPrecisionSensitivitySpecificityF1-Score
Densenet-201 (with Augment.)89.6281.7174.9697.3478.19
Densenet-201 (without Augment.)86.2282.0669.1595.9675.05
Inception-v3 (with Augment.)88.9782.7575.2197.2278.80
Inception-v3 (without Augment.)84.6275.5766.1995.7070.57
Table 5. Classification performance of proposed framework with k-NN classifier on ISIC-2018 dataset.
No. of Iter.AccuracyPrecisionSensitivitySpecificityF1-Score
1098.0096.0493.7799.5694.89
2097.8596.2496.0899.5096.16
2598.2097.4795.0799.5796.26
5098.0096.8494.8399.5595.83
10098.0096.2195.9999.5496.10
15097.8597.1996.3999.5396.79
20098.2097.2395.2599.5496.23
30098.4598.5895.3299.5696.92
Table 6. Classification performance of proposed framework with random forest classifier on ISIC-2018 dataset.
No. of Iter.AccuracyPrecisionSensitivitySpecificityF1-Score
1097.1096.9891.8199.0994.32
2097.1096.5892.6699.0694.58
2597.1597.9492.6399.0295.21
5096.9097.1691.2598.9894.11
10096.9596.9291.7199.1294.24
15097.2097.0992.3199.2294.64
20097.2597.1991.9299.2194.48
30096.7597.0191.8498.9694.36
Table 7. Comparison of different deep features combination with respect to proposed framework with SVM classifier on ISIC-2018 dataset.
CombinationAccuracyPrecisionSensitivitySpecificityF1-Score
Densenet-201-Inceptionv398.5097.8496.6099.5997.22
Densenet-201-Googlenet98.1597.3595.4599.5096.41
Densenet-201-Resnet10197.6096.2792.6499.3994.42
Inceptionv3-Googlenet98.1097.7495.8199.5096.77
Inceptionv3-Resnet10198.1096.7096.1799.5496.44
Googlenet-Resnet10197.9593.3295.2699.5496.28
Table 8. Classification performance on ISIC-2019 dataset using proposed framework with SVM. (Bold face indicates best performance).
Feature VectorAccuracyPrecisionSensitivitySpecificityF1-ScoreFeat. Dim.
[ F 1 ] 82.0677.0967.9096.7272.201920
[ F 2 ] 86.0782.8671.3897.4976.692048
[ F 1 ] ( o ) 91.4989.4485.5198.5387.43979
[ F 2 ] ( o ) 96.1794.9293.7899.3594.351037
[ F 1 F 2 ] 86.8485.4472.4397.5678.393968
[ [ F 1 ( o ) ] [ F 2 ( o ) ] ] 96.2396.2594.1699.3295.192016
[ F 1 F 2 ] ( o ) 96.6096.3894.2199.3995.283106
Table 9. Performance comparison of proposed deep features when combined with different optimized FS approaches for ISIC 2018 dataset. The ‘Time’ is the run-time (in seconds) required for only optimal selection of features through a given FS approach. (Boldface indicates superior results).
Prop. Feat.AccuracyPrecisionSensitivitySpecificityF1-ScoreFeat. Dim.Time
with ACO97.6597.4794.4099.3595.9122601216
with BHHO98.2096.6997.0299.5896.8624762810
with BDA98.0097.5395.3099.4696.401950967
with WOA98.4597.4596.7999.5897.1229701898
with BPSO98.3597.6096.1199.5896.8520231400
with BASO97.9097.2394.7799.4495.9910951423
with BTG98.5097.8496.6099.5997.2219831760
Table 10. Classification performance on the ISIC-2018 dataset for proposed framework with BTGA-based FS using different numbers of iterations. The ‘Time’ is the run-time (in seconds) required for only optimal selection of features through a given FS approach. (Boldface indicates superior results).
No. of Iter.AccuracyPrecisionSensitivitySpecificityF1-ScoreFeat. Dim.Time
1098.1597.5195.0699.4696.2730741062
2098.5097.8496.6099.5997.2219831760
2597.9097.0094.4099.4395.6827302692
5098.2596.3893.2499.5494.7826375247
10098.2097.6596.0899.4996.8627388541
15098.0596.6495.4499.5196.04226511,948
20098.0597.2795.7399.4896.49241415,477
30098.3097.5395.3799.5696.43257624,555
Table 11. Comparison of proposed framework results with existing methods. (Boldface indicates superior results).
Ref.YearDatasetAcc.Prec.Sens.Spec.F1-ScoreAUCTrain:Test:Val.
[6]2020ISIC201889.28 81.0087.1681.28 72:20:8
[12]2020ISIC201892.40 75:25:0
[13]2021ISIC201888.7590.4588.7595.7289.11 70:20:10
[25]2022ISIC201894.3694.08 50:50:0
[4]2022ISIC201886.71 70:30:0
[16]2022ISIC201895.0582.2982.8697 70:15:15
[17]2023ISIC201890.189.890.0 89.7 70:20:10
[14]2023ISIC201894.13 90.4997.76 80:10:10
[15]2023ISIC201892.7392.1092.595.492.80.97270:10:20
Prop. ISIC201898.5097.8496.6099.5997.220.998980:20:0
[21]2020ISIC201993 92.593.33 70:30:0
[2]2020ISIC201994.9280.3679.897 80:10:10
[5]2021ISIC201993.64 68.20 0.925
[13]2021ISIC201989.5890.6688.5897.5789.75 70:20:10
[22]2022ISIC201992.34 80:20:0
[20]2022ISIC201993 75:8:17
[30]2023ISIC201991.7
[14]2023ISIC201991.93 85.5898.29 80:10:10
[15]2023ISIC201991.7392.7092.497.792.50.96270:10:20
[18]2023ISIC201994.6572.5670.7896.7871.33 70:15:15
Prop. ISIC201996.6096.3894.2199.3995.280.996680:20:0
Disclaimer/Publisher’s Note: The statements, opinions and data contained in all publications are solely those of the individual author(s) and contributor(s) and not of MDPI and/or the editor(s). MDPI and/or the editor(s) disclaim responsibility for any injury to people or property resulting from any ideas, methods, instructions or products referred to in the content.

