
A Chaotic-Based Interactive Autodidactic School Algorithm for Data Clustering Problems and Its Application on COVID-19 Disease Detection

Department of Computer Engineering, Urmia Branch, Islamic Azad University, Urmia 5716963896, Iran
*
Author to whom correspondence should be addressed.
Symmetry 2023, 15(4), 894; https://doi.org/10.3390/sym15040894
Submission received: 18 February 2023
/
Revised: 13 March 2023
/
Accepted: 7 April 2023
/
Published: 10 April 2023
(This article belongs to the Section Computer)
Abstract
:In many disciplines, including pattern recognition, data mining, machine learning, image analysis, and bioinformatics, data clustering is a common analytical tool for data statistics. The majority of conventional clustering techniques are slow to converge and frequently get stuck in local optima. In this regard, population-based meta-heuristic algorithms are used to overcome the problem of getting trapped in local optima and increase the convergence speed. An asymmetric approach to clustering the asymmetric self-organizing map is proposed in this paper. The Interactive Autodidactic School (IAS) is one of these population-based metaheuristic and asymmetry algorithms used to solve the clustering problem. The chaotic IAS algorithm also increases exploitation and generates a better population. In the proposed model, ten different chaotic maps and the intra-cluster summation fitness function have been used to improve the results of the IAS. According to the simulation findings, the IAS based on the Chebyshev chaotic function outperformed other chaotic IAS iterations and other metaheuristic algorithms. The efficacy of the proposed model is finally highlighted by comparing its performance with optimization algorithms in terms of fitness function and convergence rate. This algorithm can be used in different engineering problems as well. Moreover, the Binary IAS (BIAS) detects coronavirus disease 2019 (COVID-19). The results demonstrate that the accuracy of BIAS for the COVID-19 dataset is 96.25%.
1. Introduction
One of the main scientific fields of machine learning and data mining is data clustering. It involves separating several objects into groups of things [1]. In other words, data clustering is a branch of unsupervised learning and an automatic process that divides samples into categories whose members are similar. Data clustering aims to illustrate an extensive dataset with fewer initial samples or clusters; this simplifies the data in modeling and plays a significant role in exploration and data mining. Clustering means identifying similar classes of objects. It is possible to identify further the dense and scattered areas in the object space, discover the general distribution pattern, and find the correlation properties between the data. Clustering techniques combine visible samples within clusters that meet two main criteria: (1) each group or cluster is homogeneous; and (2) each group or cluster must be different from other clusters. The most crucial clustering techniques are hierarchical, distribution, partition, density, fuzzy, and graph-based clustering [2,3].
Using asymmetric similarities and dissimilarities is one solution to data clustering. In order for them to accurately reflect the hierarchical asymmetric relationships between items in the studied dataset, they need to be applied in algorithms in the appropriate manner. Hence, it should be ensured that their use is in line with the data’s hierarchical linkages. Asymmetric coefficients and cluster coefficients that are put into the formulas for symmetric measures can be used to accomplish this. By building the asymmetric measurements off of the symmetric ones, we can do so. The hierarchy’s consistency should be guaranteed by the asymmetry coefficients and cluster coefficients. As they should guarantee greater values in the direction—from a more specific notion to a more generic one—in the event of similarities, they should.
Clustering means assigning samples to different cluster centers based on proximity and intra-cluster similarity. K-means clustering is widely used as one of the classical methods due to its easy implementation and low computational efficiency for clustering problems [4]. However, for K-means clustering, the number of clusters should be specified beforehand. While in many practical applications, users usually have no information about the number of clusters. If the clustering algorithm tries to test a different number of clusters to find the optimal state, finding the correct number will be time-consuming and challenging. Therefore, to overcome the above phenomenon, intelligent clustering methods should automatically determine the optimal number of clusters and obtain better partitioning [5].
Optimization algorithms are critical computational tools in engineering, and their application has grown significantly over the past decades. Analytical and metaheuristic methods differentiate the optimization algorithms. Analytical approaches, also called gradient-based algorithms, are deterministic and always offer the same optimal solution using the same starting point [6]. Although these numerical methods work well in solving optimization problems, they have three significant drawbacks compared to metaheuristic methods [7]. First, numerical methods cannot be used when the fitness function and constraints are discrete since their gradients are not defined. Second, numerical methods may get trapped in local minimums due to their dependence on the value of the starting point. Finally, the numerical methods are unstable and unreliable when the fitness function and constraints have multiple or sharp peaks. Researchers have turned to new stochastic approaches with specific features instead of traditional analytical techniques to solve complex engineering optimization problems.
Metaheuristic algorithms are essential in solving optimization problems; they are among the most successful methods in solving various complex optimization problems. These algorithms provide the optimal solution for optimization problems. The systems and behavior of animals often inspire metaheuristic algorithms in nature, such as flocks of birds, ant colonies, and fish schools. The behavior of the members of these algorithms is based on the behavior of the inspiring being in nature in terms of searching for the best food sources. Most metaheuristic optimization algorithms have similar characteristics: stochastic or random walk algorithms, independent of gradient information, iterative methods, and applied to continuous and discrete problems. The performance of any metaheuristic algorithm depends on the complexity of the cost function and the constraints that define the functional search space. Metaheuristic algorithms have been used to solve various optimization problems; they have been successful in many optimization problems, including clustering. Classical clustering algorithms such as k-means often converge to local optima and have slow convergence rates for larger datasets. Clustering-based algorithms use swarm-based metaheuristic methods to overcome such issues. Swarm or population-based metaheuristic approaches strive to achieve the optimal solution in clustering at a reasonable time [8].
The IAS is a novel metaheuristic algorithm proposed by Jahangiri in 2020 [9]. It simulates the interactions of a group of students trying to learn without the help of a teacher; thus, an autodidactic school sequence is created. To explore the search space looking for the optimal solution, the IAS, as with other population-based algorithms, iteratively uses a population in which the students’ leader is called the leader and the rest of the community is called the followers. This paper implements an improved IAS based on chaotic maps on various clustering datasets.
The proposed model is appraised on different benchmark test functions for analyzing its efficiency and accuracy. The experimental results demonstrated that the performance of the proposed model is improved in terms of global search and convergence rate. The proposed model is analyzed considering statistical criteria such as best, worst, lowest, and standard deviation. Moreover, its convergence is compared with other metaheuristic algorithms such as the Artificial Bee Colony (ABC) [10], Bat Algorithm (BA) [11], Crow Search Algorithm (CSA) [12], and Artificial Electric Field Algorithm (AEFA) [13]. Then, the IAS is developed to transfer the continuous search space to a binary one using the S-shaped transfer function. Furthermore, the BIAS was applied in a case study to detect coronavirus disease 2019 (COVID-19). The experimental results prove that BIAS is more efficient than other comparative algorithms in searching the problem space and selecting the most compelling features. The contributions of this paper are as follows:
- ➢
- Increasing the discovery of the optimal solution in the proposed model with a balance between exploration and exploitation by chaotic maps
- ➢
- They provide an improved version of the IAS for the data clustering problem based on chaotic maps.
- ➢
- Evaluation of the proposed model on 20 UCI datasets
- ➢
- Assessment of the proposed model based on fitness function and convergence rate
- ➢
- Developing the BIAS as the binary version of IAS using the V-shaped transfer function to find valuable features from COVID-19.
- ➢
- Comparison of the proposed model with ABC, BA, CSA, and AEFA
- ➢
- We are applying the BIAS in a case study to detect COVID-19.
The rest of the paper is organized as follows. In Section 2, related works in clustering by metaheuristic algorithms are surveyed. Section 3 describes material and methods such as the IAS algorithm and chaotic maps. Section 4 proposes a new version of the improved IAS algorithm based on chaotic maps for data clustering. In Section 5, the performance of the proposed model is compared with other algorithms on the clustering dataset. Section 6 establishes the actual application of the proposed BIAS for extracting essential features from the COVID-19 dataset. Finally, Section 7 provides concluding remarks and suggestions for future research.
2. Related Works
This section presents the subject’s background and related literature in data clustering using metaheuristic algorithms. Here, the aim is to review recent data clustering improvements using metaheuristic algorithms. Therefore, the related works are presented below in the order of publishing time.
Ahmadi et al. [14] presented an improved version of the Grey Wolf Optimizer (GWO) algorithm for clustering problems. A modified GWO has been proposed to address some metaheuristic algorithms’ challenges. This modification includes a balancing approach between exploring and exploiting the GWO and a local search for the best solution. The results show that the proposed model has a lower intra-cluster distance than other algorithms and a mean error of about 11%, which is the lowest among all comparison algorithms.
Ashish et al. [15] proposed a fast and efficient parallel BA for data clustering using a mapping reduction architecture. The parallel BA is very efficient and helpful since it uses an evolutionary approach to clustering instead of other algorithms, such as k-means; it also enjoys high speed due to Hadoop architecture. The results of various experiments show that the parallel BA performs better than Particle Swarm Optimization (PSO); it performs faster than other comparative algorithms when the number of nodes increases.
The applicability of the Cuttlefish Algorithm (CFA) to clustering issues has been examined in this study [16]. Additionally, it has demonstrated that the CFA can find the optimal cluster centers. The technique has prevented the cluster centers from readily becoming trapped in a local minimum, a significant drawback of the K-means. The CFA was used as a search method to reduce the clustering metrics. Based on the Shapes and UCI real-world datasets, the performance of the CFA-Clustering model has been assessed. The three well-known algorithms, Genetic Algorithm (GA), PSO, and K-means, were compared. The empirical findings show that, for the most part, the CFA-Clustering approach outperforms the other methods.
An asymmetric version of the k-means clustering algorithm [17] arises caused by usage of dissimilarities, which are asymmetric by definition (for example, the Kullback–Leibler divergence).
Cuckoo and krill herd algorithms are utilized on k-means++ to improve cluster quality and create optimized clusters [18]. Performance parameters such as accuracy, error rate, f-measure, CPU time, standard deviation, cluster quality check, and so forth are used to measure the clustering potentialities of these algorithms. The results presented the high performance of the newly designed algorithm.
Zhang et al. [19] proposed an improved K-means algorithm based on canopy density in 2018 to improve the K-means algorithm’s accuracy and stability and determine the most appropriate number of K clusters and the best initial data. An enhanced K-means method based on density Canopy is suggested to enhance the accuracy and stability of the K-means algorithm and to address the issue of selecting the best-starting seeds and the optimal number of K of clusters. The first step is to compute the density of the sample data sets, the average sample distance inside clusters, and the distance between clusters. The density maximum sampling point is then selected as the first cluster center, and the density cluster is then removed from the sample datasets. The K-means technique uses the density Canopy as a pre-processing step, and the output is utilized to determine the cluster number and starting clustering center. Comparative results show that the improved K-means algorithm based on canopy density has obtained better clustering results. The improved K-means algorithm based on canopy density is less sensitive to noisy data than the K-means algorithm, the canopy-based K-means algorithm, the semi-supervised K-means++ algorithm, and the K-means-u algorithm. The clustering accuracy of the proposed canopy density-based K-means algorithm is improved by an average of 30.7%, 6.1%, 5.3%, and 3.7% in the UCI dataset, respectively, and by 44.3%, 3.6%, 9.6%, and 8.9%, respectively, in the simulated dataset with the improved noise signal. It enjoys a more accurate performance than comparative algorithms.
To use the advantages of the two ABC and the K-means algorithms, Kummer et al. [20] proposed a hybrid algorithm combining these two algorithms, called the MABCKM Algorithm. The Hybrid MABCKM Algorithm modifies the solutions generated by ABC and considers them as the initial solutions for the K-means algorithm. According to the results obtained from comparing the performance of MABCKM, K-means, and ABC algorithms on different datasets taken from the UCI repository, it is clear that MABCKM outperforms other comparative algorithms.
The Whale Clustering Optimization Algorithm(WOA) was proposed for clustering data [21]. The results of WOA are compared with the well-known k-means clustering method and other standard stochastic algorithms such as PSO, ABC, Differential Evolution (DE), and GA clustering. The proposed model was checked using one artificial and seven real benchmark datasets from the UCI. Simulations have proven that the proposed model could successfully be used for data clustering.
Qaddoura et al. [22] presented an improved version of the GA’s evolutionary behavior as well as the advanced performance of the nearest neighbor search technique for clustering problems based on allocation and selection mechanisms. The success of evolutionary algorithms in solving various machine learning problems, including clustering, has been proven. The proposed model’s objective was to improve the quality of clustering results by identifying a solution that maximizes differentiation between different clusters and coherence between data points within the same cluster. Various experiments show that the proposed model works well with the Silhouette coefficient’s fitness function and outperforms other algorithms.
Zhou et al. [23] presented an enhanced version of the symbiotic organism search (SOS) algorithm to solve data clustering. It evokes the symbiotic interaction strategies used by organisms in the ecosystem to survive and spread. This paper implemented the proposed model on ten standard UCI machine-learning repository datasets. Various experiments showed that the SOS algorithm performed better than other algorithms in accuracy and precision.
Rahnema and Gharehchopogh proposed an improved ABC based on the whale optimization algorithm for data clustering in 2020 [2]. In this paper, two random and elite memories are used in the ABC to overcome the problem of exploration and late convergence. Finally, the proposed model was evaluated by being implemented on ten standard datasets taken from the UCI machine learning repository. Ewees et al. presented an improved version of the Multi-Verse Harris-Hawk optimization (CMVHHO) [24]. The primary purpose of this algorithm was to use chaotic maps to determine optimized values of the main parameters of the Harris algorithm. In addition, it was used as a local search approach to improving the ability to exploit the search space. It was tested using several different chaotic maps. Experimental results show that the Circle chaotic point is the best function among all available functions since it has improved the performance of the proposed model and has a positive effect on the behavior of the proposed model.
Chen et al. presented a chaotic-based dynamic weighted PSO algorithm [25]. The proposed model introduces a chaotic map and an emotional weight for modifying the search process. Dynamic weight is a fitness function that increases the search accuracy and performance of the proposed model. Various experiments show that the proposed model outperformed nature-inspired and PSO algorithms in almost all functions.
To overcome the shortcomings of the Fruit Fly Optimization (FFO) algorithm [26], Zhang et al. proposed a new version of the FFO using the Gaussian mutation operator and the local chaotic search strategy. The Gaussian mutation operator is integrated into the FFO algorithm to prevent premature convergence and improve the exploration process. Then, a chaotic local search approach is adopted to increase the group’s local search ability; the results prove that the proposed model works better than the basic FFO algorithm.
In this section, important clustering literature using metaheuristic algorithms was reviewed. Most of these works have considered the clustering problem an optimization problem and applied a metaheuristic algorithm to solve it; in addition, the fitness function of the intra-cluster dataset was used as the fitness function. Some authors have used a combination of genetic operators and other methods, while others have employed chaotic and quantum mapping to improve exploitation and convergence. Considering the literature reviewed in this paper, an enhanced version of the IAS based on chaotic maps is proposed for the clustering problem.
3. Material and Method
3.1. IAS Algorithm
As with other population-based algorithms, IAS randomly generates an initial population called students [9]. A specific problem’s upper and lower limit values determine students’ eligibility for inclusion in the IAS. The student with the highest performance (minimum score) in each step gets the position of “leader student” or simply “leader”. In IAS optimization, the best performance is achieved when the minimum value of the cost function is performed. However, this position can be reassigned to another more skilled student at any point in the process. The method of student generation and assessment of student eligibility in school can be described as Algorithm 1.
where Si is the ith generated student, and are the lower and upper limits of the variables, respectively, ri (0, 1) is a random number between 0 and 1, N_student is the number of students, Mi is the score of the ith student, and LS is the leader student. Autodidactic/self-learning sessions in this interactive school are held in three stages: individual training, group training, and new student challenges.
| Algorithm 1 The method of student generation and assessment of student eligibility |
Individual Training Session: First, a random group of two follower students is selected. Then, they discuss it one by one with the leader student. The student’s knowledge will increase in peer-to-peer discussions with the leader. Accordingly, an individual training session can be formulated as described in Algorithm 2:
where TSi and TSj are the first and second follower students, respectively; ICi and ICj are the inherent competencies of the first and second students, respectively; ri (1, 2) and rj (1, 2) are two different random vectors between 1 and 2. Individual competencies (ICi and ICj) are randomly determined as 1 or 2.
| Algorithm 2 Individual Training Session |
| 1: 3: 4: 5: |
Collective Training Session: After the individual training session, each follower student has the opportunity to review the contents of the last session and interact with other follower students in the same group to resolve the unclear points of the lesson. In addition to the knowledge level of individually trained students, their social abilities, such as communication skills, teamwork, and collaboration, referred to as collective competencies, can significantly impact the effectiveness of group learning. Accordingly, the group training session can be formulated as described in Algorithm 3.
where CCij is defined as the collective ability of the group as a team, based on the weighted average of students’ competencies. Moreover, ri (1, 2) and rj (1, 2) are two different random vectors between 1 and 2. Students’ collective competencies (CCi and CCj) are randomly set as 1 or 2.
| Algorithm 3 Collective Training Session |
| 1: 2: 3: 5: |
Challenge of the New Student: In some optimization problems, due to the complex nature of the cost function, the gradual improvement of follower students may be limited to a specific area of design space solely around the leader student (i.e., the current temporary/local optima). However, it is still far from a permanent/global optimization. Accordingly, a bad operating loop hinders the optimization process and will probably fail to find the global optimum. The new student challenge is introduced to complement the algorithm to provide a more dynamic and exploratory IAS, creating an ongoing rebellion against the current leader. If the new student has more skills than the current leader student, they will take on the role of leader. The new student challenge can be formulated as described in Algorithm 4.
where NS is a new student; MF1 and MF2 are the first and second corrective factors, respectively; r(0, 1) is a random vector between 0 and 1. In addition, LS Student is the new leader of the school.
| Algorithm 4 New student challenge |
| 1: 3: 4: 5: |
The process (including all three sessions) is repeated until the termination criteria are met. At the end of the process, each student has to have communicated with the leader at least once. In both individual and group training sessions, groups of two students are randomly selected in the search space to interact with the leader and themselves. Proper selection of regulatory parameters, such as the number of students and several iterations, can lead to faster detection of a global optimum. The more students exist in the autodidactic school, the more likely there will be elite students among them. In addition, the number of sessions held is equal to the number of students in the school. Hence, the population in this IAS has a significant effect on increasing the knowledge level of students.
3.2. Chaotic Maps
Most chaotic maps have been used to solve various stochastic and optimization algorithms problems [27]. This section introduces ten chaotic maps to improve the IAS. Each chaotic map has unique features, described and formulated in Table 1. The whole set of chaotic maps employed in this paper is selected with an initial point of 0.7 with different behaviors. The initial point in chaotic maps can be any number between 0 and 1.
Table 1 lists the proposed chaotic maps to improve the IAS. The proposed model uses chaotic maps to create the initial population and generate random parameters.
4. Proposed Model
The IAS is one of the most successful optimization algorithms. However, it fails to work effectively in global optimization and finding the best solution. The main reason may be the generation of an inadequate initial population and random parameters. Due to the ergodic nature and lack of correct iteration of chaotic maps, better global and local searches can be performed than random searches that rely primarily on probability. As a result, this paper presents different versions of the IAS based on other chaotic maps to solve the clustering problem. The flowchart of the proposed model is shown in Figure 1.
4.1. Pre-Processing
The pre-processing step includes data conversion and data normalization. For datasets where the data is of string type, the label-encoder method is used to convert string data to numeric data. Once the string data is converted to numeric data, the data normalization is carried out. The MinMax method is the most popular standard normalization method that transfers data to the space between 0 and 1, as given in Equation (1).
In Equation (1), Xvalue is the initial value of a feature in the dataset, and Xnormal refers to the normalized feature. The MaxXvalue and MinXvalue parameters represent the feature’s largest and smallest values.
A dataset with m samples is defined according to Equation (2).
In Equation (2) is the ith samples of D, is the information of the ith sample, and shows the label of the ith sample.
4.2. Chaotic-Based Population Generation
First, the IAS based on chaotic maps must generate a suitable initial population to improve the algorithm’s convergence rate. Therefore, student generation and assessment of students’ competence in school can be described as Equation (3) according to the chaotic maps.
where Si is the ith generated student; lb and ub are the lower and upper bounds, respectively; ri (0, 1) is a number generated by chaotic maps (listed in Table 1) between 0 and 1. Thus, the IAS generates a population based on chaotic maps from the very beginning.
4.3. Chaotic-Based Individual Training Session
In the second step, the IAS uses chaotic sequences instead of random numbers to improve the convergence speed of the algorithm in different iterations. Therefore, according to the chaotic maps, the individual training session can be described as Algorithm 5.
where TSi and TSj are the first and second students, hj and hi are two different chaotic vectors between 1 and 2 that are generated by the chaotic maps (listed in Table 1). Individual competencies (ICi and ICj) are randomly set to 1 or 2, and there is no need to use chaotic maps.
| Algorithm 5 Chaotic-Based Individual Training |
| 1: 3: 6: |
4.4. Chaotic-Based Group Training Session
In the third step, the IAS uses chaotic sequences instead of random numbers to improve the convergence speed of the algorithm in different iterations. Therefore, according to the chaotic maps, the group training session can be described as Algorithm 6.
where CCij is defined as the collective ability of the group as a team based on the weighted average of students’ competencies, hj and hi are two different chaotic vectors between 1 and 2 generated by the chaotic maps (listed in Table 1). Students’ collective competencies (CCi and CCj) are randomly set to 1 or 2, and there is no need to use chaotic maps.
| Algorithm 6 Chaotic-Based Group Training |
| 1: 4: 5: 6: |
4.5. Chaotic-Based New Student Challenge
In the fourth step of the IAS, chaotic sequences are used instead of random numbers to improve the convergence speed of the algorithm in different iterations. Therefore, according to the chaotic maps, the group training session can be described as Algorithm 7.
| Algorithm 7 Chaotic-Based New Student |
2: m= 3: 5: |
In Algorithm 7, a new solution (i.e., NS, is generated entirely by chaotic maps), and MF1 and MF2 are the first and second corrective factors generated based on the chaotic variable m. The worst side of this step is that, instead of random numbers, the chaotic sequence generated by the chaotic maps is applied to increase the exploitation of the proposed model.
4.6. Formation of Clusters
For the proposed model, each student vector expresses a solution with a certain number of cluster centers, ranging from to . The decision variables are inscribed as real-valued strings and regarded as cluster centers. Assuming that the dimension of the dataset is , the maximum length of the student vector is Kmax × d. For each student vector whose cluster number is c, the entries are evaluated as effective cluster center solutions, and the remaining variables are invalid. Figure 2 shows the format of students’ initial population for clustering. In IAS, the candidate solution is determined as {, ,…, }, where . Here, P describes the number of iterations.
Figure 2 shows that if a dataset has two clusters, different solutions are generated to find the two clusters. In each solution, other features are formed for the centrality of a cluster. Each solution is evaluated, and at the end, the solution with the best fitness (closest distance) is selected as the optimal solution.
4.7. Fitness Function of Clustering
In our proposed model, the fitness function of clustering called intra-cluster summation using the Euclidean distance function is employed, the most popular and valid distance criterion in clustering. It can be calculated as Equation (4).
In Equation (4), the variable m indicates the number of features, Oip represents the value of the feature p of the object Oi, and represents the value of the feature p of the object Oj. This function minimizes the distance between each object and the cluster’s center, which is allocated to generate compact groups. Intra-cluster is defined by Equation (5).
Here, if is 1, the object is in cluster i; otherwise, is not in cluster . The variable k shows the number of clusters; the variable n indicates the number of objects. The variable m shows the number of features. Note that shows the value of feature p of the center of cluster ith.
5. Results and Discussion
An IAS based on ten chaotic maps (i.e., CIAS, was presented in the previous section). In this section, statistical criteria such as the fitness function’s minimum value and the fitness function’s convergence rate are considered to compare the proposed model and other algorithms. Here, ten versions of the proposed CIAS algorithm are first compared with each other in terms of statistical criteria. The best version is considered an improved or superior version. Then it is compared with other metaheuristic methods such as the BA, CSA, ABC, and AEFA. Therefore, more details about the implementation, parameters, criteria, comparison, and evaluation of the proposed CIAS algorithm for the clustering problems are given here.
5.1. Dataset
All clustering datasets used here to evaluate the improved version of the IAS based on chaotic maps are listed in Table 2; the number of features and samples taken from these 20 valid UCI clustering datasets is mentioned.
5.2. Simulation Environment and Parameters Determination
The proposed CIAS approaches and comparative algorithms are implemented using MATLAB 2019 on a system with 8 GB of RAM, a Cori5 CPU (2.4 GHz), and a 64-bit operating system. For a better comparison, the quantitative parameters of the proposed CIAS approaches, the BS, CSA, ABC, and AEFA, are set the same (see Table 3). In addition, the qualitative parameters of each algorithm are set as standard.
Table 3 shows that the initial values of the population and the number of iterations are considered the same for all algorithms, and the importance of the other parameters is set as standard. Different versions of the IAS based on chaotic maps (i.e., CIAS-1, CIAS-2, …, CIAS-10) are compared with other statistical criteria. The evaluations and comparisons of different versions of the IAS based on chaotic maps are provided below. The convergence rate for implementing various versions of the IAS based on chaotic maps on 10 clustering datasets is presented in Figure 3.
The results related to the convergence rate of different versions of the proposed model on 20 datasets indicate that: (1) IAS-2 had a better performance on BLOOD and DERMATOLOGY datasets, and IAS-1 had a better performance on BLOOD and CANCER datasets; (2) IAS-1 had a better performance on IRIS and WINE datasets and IAS-4 had a better performance on STEEL and IRIS datasets; (3) IAS-4 had a better performance on GLASS, HABERMAN, BREASTEW datasets, and IAS-1 had a better performance on BREASTEW AND HABERMAN datasets; (4) IAS-1 had a better performance on HEART and LUNG CANCER datasets, and IAS-2 had a better performance on HABERMAN dataset; (5) IAS-1 had a better performance on VOWEL datasets, and IAS-2 had a better performance on SEEDS dataset. The results related to the convergence rate of different versions of the IAS based on chaotic maps implemented on the whole dataset show that IAS-1, IAS-2, IAS-4, and IAS-6 have improved results compared to other versions. To further evaluate the different versions of the IAS based on chaotic maps, the developments related to the worst solution for the population of the algorithms are compared, as shown in Table 4.
IAS-1, in 60% of clustering datasets, achieved better results than other versions; IAS-2, IAS-4, and IAS-6 succeeded in 10% of clustering datasets. Regarding the average fitness function results for the different versions of the IAS, IAS-1 exceeded other versions in 67% of the clustering datasets. Chaotic functions tend to reach the closest point to the objective function by finding optimal solutions.
5.3. Comparison of the Proposed Model with Other Metaheuristics
In this section, the first chaotic map-based IAS (IAS-1), called CIAS, is compared with other basic metaheuristic algorithms in terms of different statistical criteria. The results of other evaluations and comparisons are given below. The results related to the convergence rate of the proposed model and comparative metaheuristic algorithms implemented on 10 datasets are shown in Figure 4.
The results related to the convergence rate of the proposed model and the fifth group of comparative algorithms show that the proposed CIAS algorithm performed better than the other metaheuristic algorithms in two of the fifth group of datasets. The results related to the convergence rate of the proposed model and comparative algorithms implemented on the whole dataset indicate that the proposed CIAS approach has achieved better results. The proposed CIAS model performed better in 75% of clustering datasets. The results related to the worst, best, and average solutions for the population of the proposed model and other comparative algorithms are presented in Table 5.
The outcomes of the worst, best, and average population solutions for the proposed model, as well as other comparative algorithms, demonstrate that the worst population solution outperformed other algorithms in clustering datasets, while the best population solution outperformed other algorithms in clustering datasets, and the average population solution outperformed other comparative algorithms. In this section, the simulation and parameter determination was first carried out. Then the different versions of the IAS based on the chaotic map (CIAS-1, CIAS-2, …, CIAS-10) were compared in various statistical criteria. Further evaluations and comparisons showed that the Chebyshev chaotic map achieved better results than other chaotic maps. The Chebyshev-based IAS was compared with the basic metaheuristic algorithms such as BA, CSA, ABC, and AEFA. The results of various experiments indicate that the Chebyshev-based IAS has better convergence and performance than other basic metaheuristic algorithms.
6. Real Application: Binary CIAS on COVID-19 Dataset
The severe acute respiratory syndrome coronavirus2 is the causative agent of the sickness known as coronavirus disease 2019 (COVID-19) (https://github.com/Atharva-Peshkar/Covid-19-Patient-Health-Analytics, accessed on 22 January 2023), which is an exceptionally infectious and dangerous illness (SARS-CoV-2). In December 2019, Wuhan, China, was the location of the first confirmed case, which was quickly followed by a rapid global spread. Due to the escalating number of likely COVID-19 acute respiratory issues and the disease’s high fatality rates, the World Health Organization (WHO) has proclaimed the COVID-19 illness a worldwide catastrophe. It is vital to develop effective processes that consistently identify potential cases of COVID-19 to halt its spread and partially alleviate the global crisis. This will enable likely patients to be isolated from the general population. Several alternative optimization approaches are being developed as part of the response to the COVID-19 pandemic. These approaches may be separated into distinct categories: screening, monitoring, prediction, and diagnosis. In recent times, a significant number of diagnostic procedures that detect the COVID-19 disease by exploiting efficient features taken from the clinical dataset have been developed. So far, various models such as BE-WOA [28], Binary Simulated Normal Distribution Optimizer (BSNDO) [29], and Artificial Gorilla Troop Optimization (AGTO) [30] have been proposed for the diagnosis of COVID-19 disease.
The applicability and performance of the BIAS are tested on the novel coronavirus 2019 dataset, which is a pre-processed and released version of the original COVID-19 dataset. The results of these evaluations are discussed in the section that follows. Table 6 describes the dataset after it has been pre-processed. In that Table, the column labeled “diff_sym_hos” contains the number of days that have elapsed since the date on which symptoms were first observed (which corresponds to the column “sym_on” in the raw dataset) and the date on which the patient checked into the hospital (column hosp-vis in the original dataset). All of the categorical columns in the pre-processed dataset were label-encoded by assigning a number to each distinct, unconditional value included inside the column. There are 864 cases and 14 attributes included in this dataset.
The experiment’s results were repeated 20 times to evaluate the BIAS’s performance compared to other algorithms. The K Nearest Neighbor (KNN) classifier was used with k equal to 3 and the 10-fold cross-validation approach to construct the classification model for every algorithm.
6.1. Fitness Function
The main challenge is determining which features from a dataset will help a classifier correctly identify the category to which a sample belongs [31,32]. While we are selecting essential features, we must automatically rule out those that are redundant. When the selected feature subset is used for classification, we will be able to maximize the classification accuracy of a classification problem [33]. In this paper, BIAS is used to identify the most helpful feature subset, and then a classifier is used to determine how accurately this feature subset can be classified. Let stand for the classification accuracy of the model that was determined with the help of a classifier; for the dimension of the feature subset; and for the total number of attributes that were included in the initial dataset. Therefore, the error in classification is denoted by the notation , and the proportion of features chosen from the complete dataset is represented by . The fitness function is defined according to Equation (6).
In Equation (6), denotes the weightage given to the classification error.
6.2. Transfer Function
Since FS is a binary optimization problem, its result is the numbers 0 and 1, where 0 indicates that the feature is not selected since it is unnecessary. One suggests that it is chosen since it is beneficial. However, we cannot determine the potential that the result produced will fall outside the desired range. A binarization function needs to be applied to each agent for us to guarantee that the output will always fall within the parameters of the selected range. The sigmoid (S-shaped) transfer function is responsible for carrying out this activity in BIAS. The S-shaped transfer function is defined according to Equation (7).
This function has a range of [0,1] in its domain. If the output of the transfer function is more significant than rand, where it is a random number chosen from a uniform distribution between 0 and 1, the value is equal to 1. This property is helpful, its value will always be equal to 0 if it is equal to or lower than the rand. Since the attribute is unnecessary, we will not consider it.
6.3. Evaluation Criteria
The BIAS’s effectiveness was evaluated based on accuracy, Recall, precision, F-measure, and the total amount of features (selection size).
Precision: The significance of the results is defined by the accuracy of the results, which is represented as the ratio of successfully predicted positive observations to the total number of positive observations.
Recall: The term “recall” refers to the proportion of accurately predicted affirmative observations relative to the total number of observations in an actual class that answer “yes”.
F-measure: The F1 Score is another method for determining the correctness of an experiment. It is calculated using the weighted mean of the Precision and Recall scores. As a result, this score considers the possibility of both false positives and negatives.
Accuracy: Accuracy is the measurable statistic that correctly classifies the occurrence instance, and it is simply a ratio of predicted correct observations to the total sample size. It is the performance measure that is the most intuitive to assess.
According to accuracy values in Table 7, BIAS could take the highest average accuracy value of 96.25%, while BABC, BBA, BCSA, and BAEFA could take 91.95%, 92.48%, 95.32%, and 94.79%, respectively.
Compared to previous algorithms, the proposed model performed significantly better in Recall, precision, accuracy, and f-measure, as evidenced by the experiment’s findings. Within the search space, the implementation of BIAS investigates regions that are relatively close to optimum global values. During the exploration and exploitation phases, the BIAS versions search the most promising area of the search space. According to the results of BIAS’s search history analyses, the distribution of candidate solution points around the global optimal is greater than that of BCSA. Figure 5 compares the performance of BIAS with other algorithms based on recall, precision, f-measure, and accuracy.
The BIAS optimization algorithm was used to produce the best possible feature set, displayed in Table 8). BIAS identifies the best potential value for six of the thirteen provided features. It is utilized in these characteristics to predict the presence of COVID-19 positive in individuals exhibiting various symptoms. When compared to the input feature set, which consisted of 14 features (Table 6), 8 of those features were removed. The vast majority of the elements that have been removed are those that pertain to personal information such as age, sex, etc. The results of the suggested model, based on the selection of features, are presented in Table 8. The accuracy percentage ranges from 98.41 to 98.68 for five features. The accuracy percentage that is the highest for six different features is 98.23, while the accuracy percentage that is the lowest is 98.06. In addition, the recall and precision scores are both 98.35 and 98.30, correspondingly. The accuracy ranges from 97.76 to 98.31 percent over seven distinct features. The least accurate accuracy range is 97.76 percent. The accuracy ranges from 97.52 to 97.65 when eight features are chosen. Accuracy is 97.29 percent for precision, 97.48 percent for Recall, 97.38 percent for F-Measure, and 97.52 percent overall when ten features from the feature space are selected. The highest possible accuracy is 96.92%, and the lowest possible accuracy percentage is 96.84 when 11 features are selected. According to the findings, the proposed model with fewer features has a better accuracy percentage than its competitors.
7. Conclusions and Future Works
The IAS is a population-based metaheuristic optimization algorithm with three robust operators: individual training sessions, group training sessions, and new student challenges. This paper presented an improved version of the chaotic IAS to solve data clustering problems. First, ten different chaotic maps were used to generate different versions of the IAS (i.e., CIAS-1, CIAS-2, …, and CIAS-10). Next, 20 valid UCI clustering datasets were used to evaluate the proposed approaches. In addition, the intra-cluster summation fitness function was previously defined as the fitness function for the proposed model and other comparative algorithms. An improved version of the chaotic IAS was implemented on MATLAB 2019; the initial population was 20, and the number of repetitions was 100. At first, CIAS-1, CIAS-2, …, and CIAS-10 were compared with different criteria. The various evaluations and comparisons showed that the Chebyshev-Chaotic-Map-based version performed better. Finally, the Chebyshev-Chaotic-Map-based performance of the IAS was compared with other basic metaheuristic methods such as the BA, the CSA, the ABC, and the AEFA. The various experiments showed that this version of the IAS has better convergence and performance than other basic metaheuristic algorithms. Furthermore, BIAS is experimented on a COVID-19 dataset for detecting the coronavirus disease. Future research will consider a multi-objective IAS with chaotic maps for solving high-dimensional data clustering.
Author Contributions
Conceptualization, F.S.G. and A.A.K.; methodology, F.S.G.; software, A.A.K.; validation, F.S.G. and A.A.K.; formal analysis, A.A.K.; investigation, A.A.K.; resources, F.S.G.; data curation, F.S.G.; writing—original draft preparation, A.A.K.; writing—review and editing, F.S.G.; visualization, A.A.K.; supervision, F.S.G.; project administration, F.S.G.; funding acquisition, F.S.G. All authors have read and agreed to the published version of the manuscript.
Funding
This paper received no external funding.
Institutional Review Board Statement
Not applicable.
Informed Consent Statement
Not applicable.
Data Availability Statement
All data used in this manuscript was downloaded from the UCI depository.
Conflicts of Interest
The authors declare no conflict of interest.
References
- Sorkhabi, L.B.; Gharehchopogh, F.S.; Shahamfar, J. A systematic approach for pre-processing electronic health records for mining: Case study of heart disease. Int. J. Data Min. Bioinform. 2020, 24, 97–120. [Google Scholar] [CrossRef]
- Arasteh, B.; Abdi, M.; Bouyer, A. Program source code comprehension by module clustering using combination of discretized gray wolf and genetic algorithms. Adv. Eng. Softw. 2022, 173, 103252. [Google Scholar] [CrossRef]
- Nadimi-Shahraki, M.H.; Taghian, S.; Mirjalili, S.; Ewees, A.A.; Abualigah, L.; Elaziz, M.A. MTV-MFO: Multi-Trial Vector-Based Moth-Flame Optimization Algorithm. Symmetry 2021, 13, 2388. [Google Scholar] [CrossRef]
- Izci, D. A novel improved atom search optimization algorithm for designing power system stabilizer. Evol. Intell. 2022, 15, 2089–2103. [Google Scholar] [CrossRef]
- Ekinci, S.; Izci, D.; Al Nasar, M.R.; Abu Zitar, R.; Abualigah, L. Logarithmic spiral search based arithmetic optimization algorithm with selective mechanism and its application to functional electrical stimulation system control. Soft Comput. 2022, 26, 12257–12269. [Google Scholar] [CrossRef]
- Arasteh, B.; Sadegi, R.; Arasteh, K. Bölen: Software module clustering method using the combination of shuffled frog leaping and genetic algorithm. Data Technol. Appl. 2021, 55, 251–279. [Google Scholar] [CrossRef]
- Arasteh, B.; Sadegi, R.; Arasteh, K. ARAZ: A software modules clustering method using the combination of particle swarm optimization and genetic algorithms. Intell. Decis. Technol. 2020, 14, 449–462. [Google Scholar] [CrossRef]
- Gharehchopogh, F.S.; Gholizadeh, H. A comprehensive survey: Whale Optimization Algorithm and its applications. Swarm Evol. Comput. 2019, 48, 1–24. [Google Scholar] [CrossRef]
- Jahangiri, M.; Hadianfard, M.A.; Najafgholipour, M.A.; Jahangiri, M.; Gerami, M.R. Interactive autodidactic school: A new metaheuristic optimization algorithm for solving mathematical and structural design optimization problems. Comput. Struct. 2020, 235, 106268. [Google Scholar] [CrossRef]
- Karaboga, D. An Idea Based on Honey Bee Swarm for Numerical Optimization; Technical Report-tr06; Erciyes University: Ercis, Turkey, 2005. [Google Scholar]
- Yang, X.-S. A new metaheuristic bat-inspired algorithm. In Nature Inspired Cooperative Strategies for Optimization (NICSO 2010); Springer: Berlin/Heidelberg, Germany, 2010; pp. 65–74. [Google Scholar]
- Askarzadeh, A. A novel metaheuristic method for solving constrained engineering optimization problems: Crow search algorithm. Comput. Struct. 2016, 169, 1–12. [Google Scholar] [CrossRef]
- Yadav, A.; Kumar, N. Artificial electric field algorithm for engineering optimization problems. Expert Syst. Appl. 2020, 149, 113308. [Google Scholar] [CrossRef]
- Ahmadi, R.; Ekbatanifard, G.; Bayat, P. A Modified Grey Wolf Optimizer Based Data Clustering Algorithm. Appl. Artif. Intell. 2021, 35, 63–79. [Google Scholar] [CrossRef]
- Ashish, T.; Kapil, S.; Manju, B. Parallel bat algorithm-based clustering using mapreduce. In Networking Communication and Data Knowledge Engineering; Springer: Berlin/Heidelberg, Germany, 2018; pp. 73–82. [Google Scholar]
- Eesa, A.S.; Orman, Z. A new clustering method based on the bio-inspired cuttlefish optimization algorithm. Expert Syst. 2020, 37, e12478. [Google Scholar] [CrossRef]
- Olszewski, D. Asymmetric k-means algorithm. In Adaptive and Natural Computing Algorithms; Lecture Notes in Computer Science; Dobnikar, A., Lotric, U., Ster, B., Eds.; Springer: Berlin/Heidelberg, Germany, 2011; Volume 6594, pp. 1–10. [Google Scholar]
- Aggarwal, S.; Singh, P. Cuckoo and krill herd-based k-means++ hybrid algorithms for clustering. Expert Syst. 2019, 36, e12353. [Google Scholar] [CrossRef]
- Zhang, G.; Zhang, C.; Zhang, H. Improved K-means algorithm based on density Canopy. Knowl. Based Syst. 2018, 145, 289–297. [Google Scholar] [CrossRef]
- Kumar, A.; Kumar, D.; Jarial, S. A novel hybrid K-means and artificial bee colony algorithm approach for data clustering. Decis. Sci. Lett. 2018, 7, 65–76. [Google Scholar] [CrossRef]
- Nasiri, J.; Khiyabani, F.M. A whale optimization algorithm (WOA) approach for clustering. Cogent Math. Stat. 2018, 5, 1483565. [Google Scholar] [CrossRef]
- Qaddoura, R.; Faris, H.; Aljarah, I. An efficient evolutionary algorithm with a nearest neighbor search technique for clustering analysis. J. Ambient. Intell. Humaniz. Comput. 2021, 12, 8387–8412. [Google Scholar] [CrossRef]
- Zhou, Y.; Wu, H.; Luo, Q.; Abdel-Baset, M. Automatic data clustering using nature-inspired symbiotic organism search algorithm. Knowl. Based Syst. 2019, 163, 546–557. [Google Scholar] [CrossRef]
- Ewees, A.A.; Elaziz, M.A. Performance analysis of Chaotic Multi-Verse Harris Hawks Optimization: A case study on solving engineering problems. Eng. Appl. Artif. Intell. 2020, 88, 103370. [Google Scholar] [CrossRef]
- Chen, K.; Zhou, F.; Liu, A. Chaotic dynamic weight particle swarm optimization for numerical function optimization. Knowl. Based Syst. 2018, 139, 23–40. [Google Scholar] [CrossRef]
- Zhang, X.; Xu, Y.; Yu, C.; Heidari, A.A.; Li, S.; Chen, H.; Li, C. Gaussian mutational chaotic fruit fly-built optimization and feature selection. Expert Syst. Appl. 2019, 141, 112976. [Google Scholar] [CrossRef]
- Gharehchopogh, F.S.; Nadimi-Shahraki, M.H.; Barshandeh, S.; Abdollahzadeh, B.; Zamani, H. CQFFA: A Chaotic Quasi-oppositional Farmland Fertility Algorithm for Solving Engineering Optimization Problems. J. Bionic Eng. 2022, 20, 158–183. [Google Scholar] [CrossRef]
- Nadimi-Shahraki, M.H.; Zamani, H.; Mirjalili, S. Enhanced whale optimization algorithm for medical feature selection: A COVID-19 case study. Comput. Biol. Med. 2022, 148, 105858. [Google Scholar] [CrossRef]
- Ahmed, S.; Sheikh, K.H.; Mirjalili, S.; Sarkar, R. Binary Simulated Normal Distribution Optimizer for feature selection: Theory and application in COVID-19 datasets. Expert Syst. Appl. 2022, 200, 116834. [Google Scholar] [CrossRef]
- Piri, J.; Mohapatra, P.; Acharya, B.; Gharehchopogh, F.S.; Gerogiannis, V.C.; Kanavos, A.; Manika, S. Feature Selection Using Artificial Gorilla Troop Optimization for Biomedical Data: A Case Analysis with COVID-19 Data. Mathematics 2022, 10, 2742. [Google Scholar] [CrossRef]
- Nadimi-Shahraki, M.H.; Fatahi, A.; Zamani, H.; Mirjalili, S. Binary Approaches of Quantum-Based Avian Navigation Optimizer to Select Effective Features from High-Dimensional Medical Data. Mathematics 2022, 10, 2770. [Google Scholar] [CrossRef]
- Nadimi-Shahraki, M.H.; Fatahi, A.; Zamani, H.; Mirjalili, S.; Oliva, D. Hybridizing of Whale and Moth-Flame Optimization Algorithms to Solve Diverse Scales of Optimal Power Flow Problem. Electronics 2022, 11, 831. [Google Scholar] [CrossRef]
- Nadimi-Shahraki, M.H.; Moeini, E.; Taghian, S.; Mirjalili, S. DMFO-CD: A Discrete Moth-Flame Optimization Algorithm for Community Detection. Algorithms 2021, 14, 314. [Google Scholar] [CrossRef]
Figure 1.
Flowchart of the proposed model.
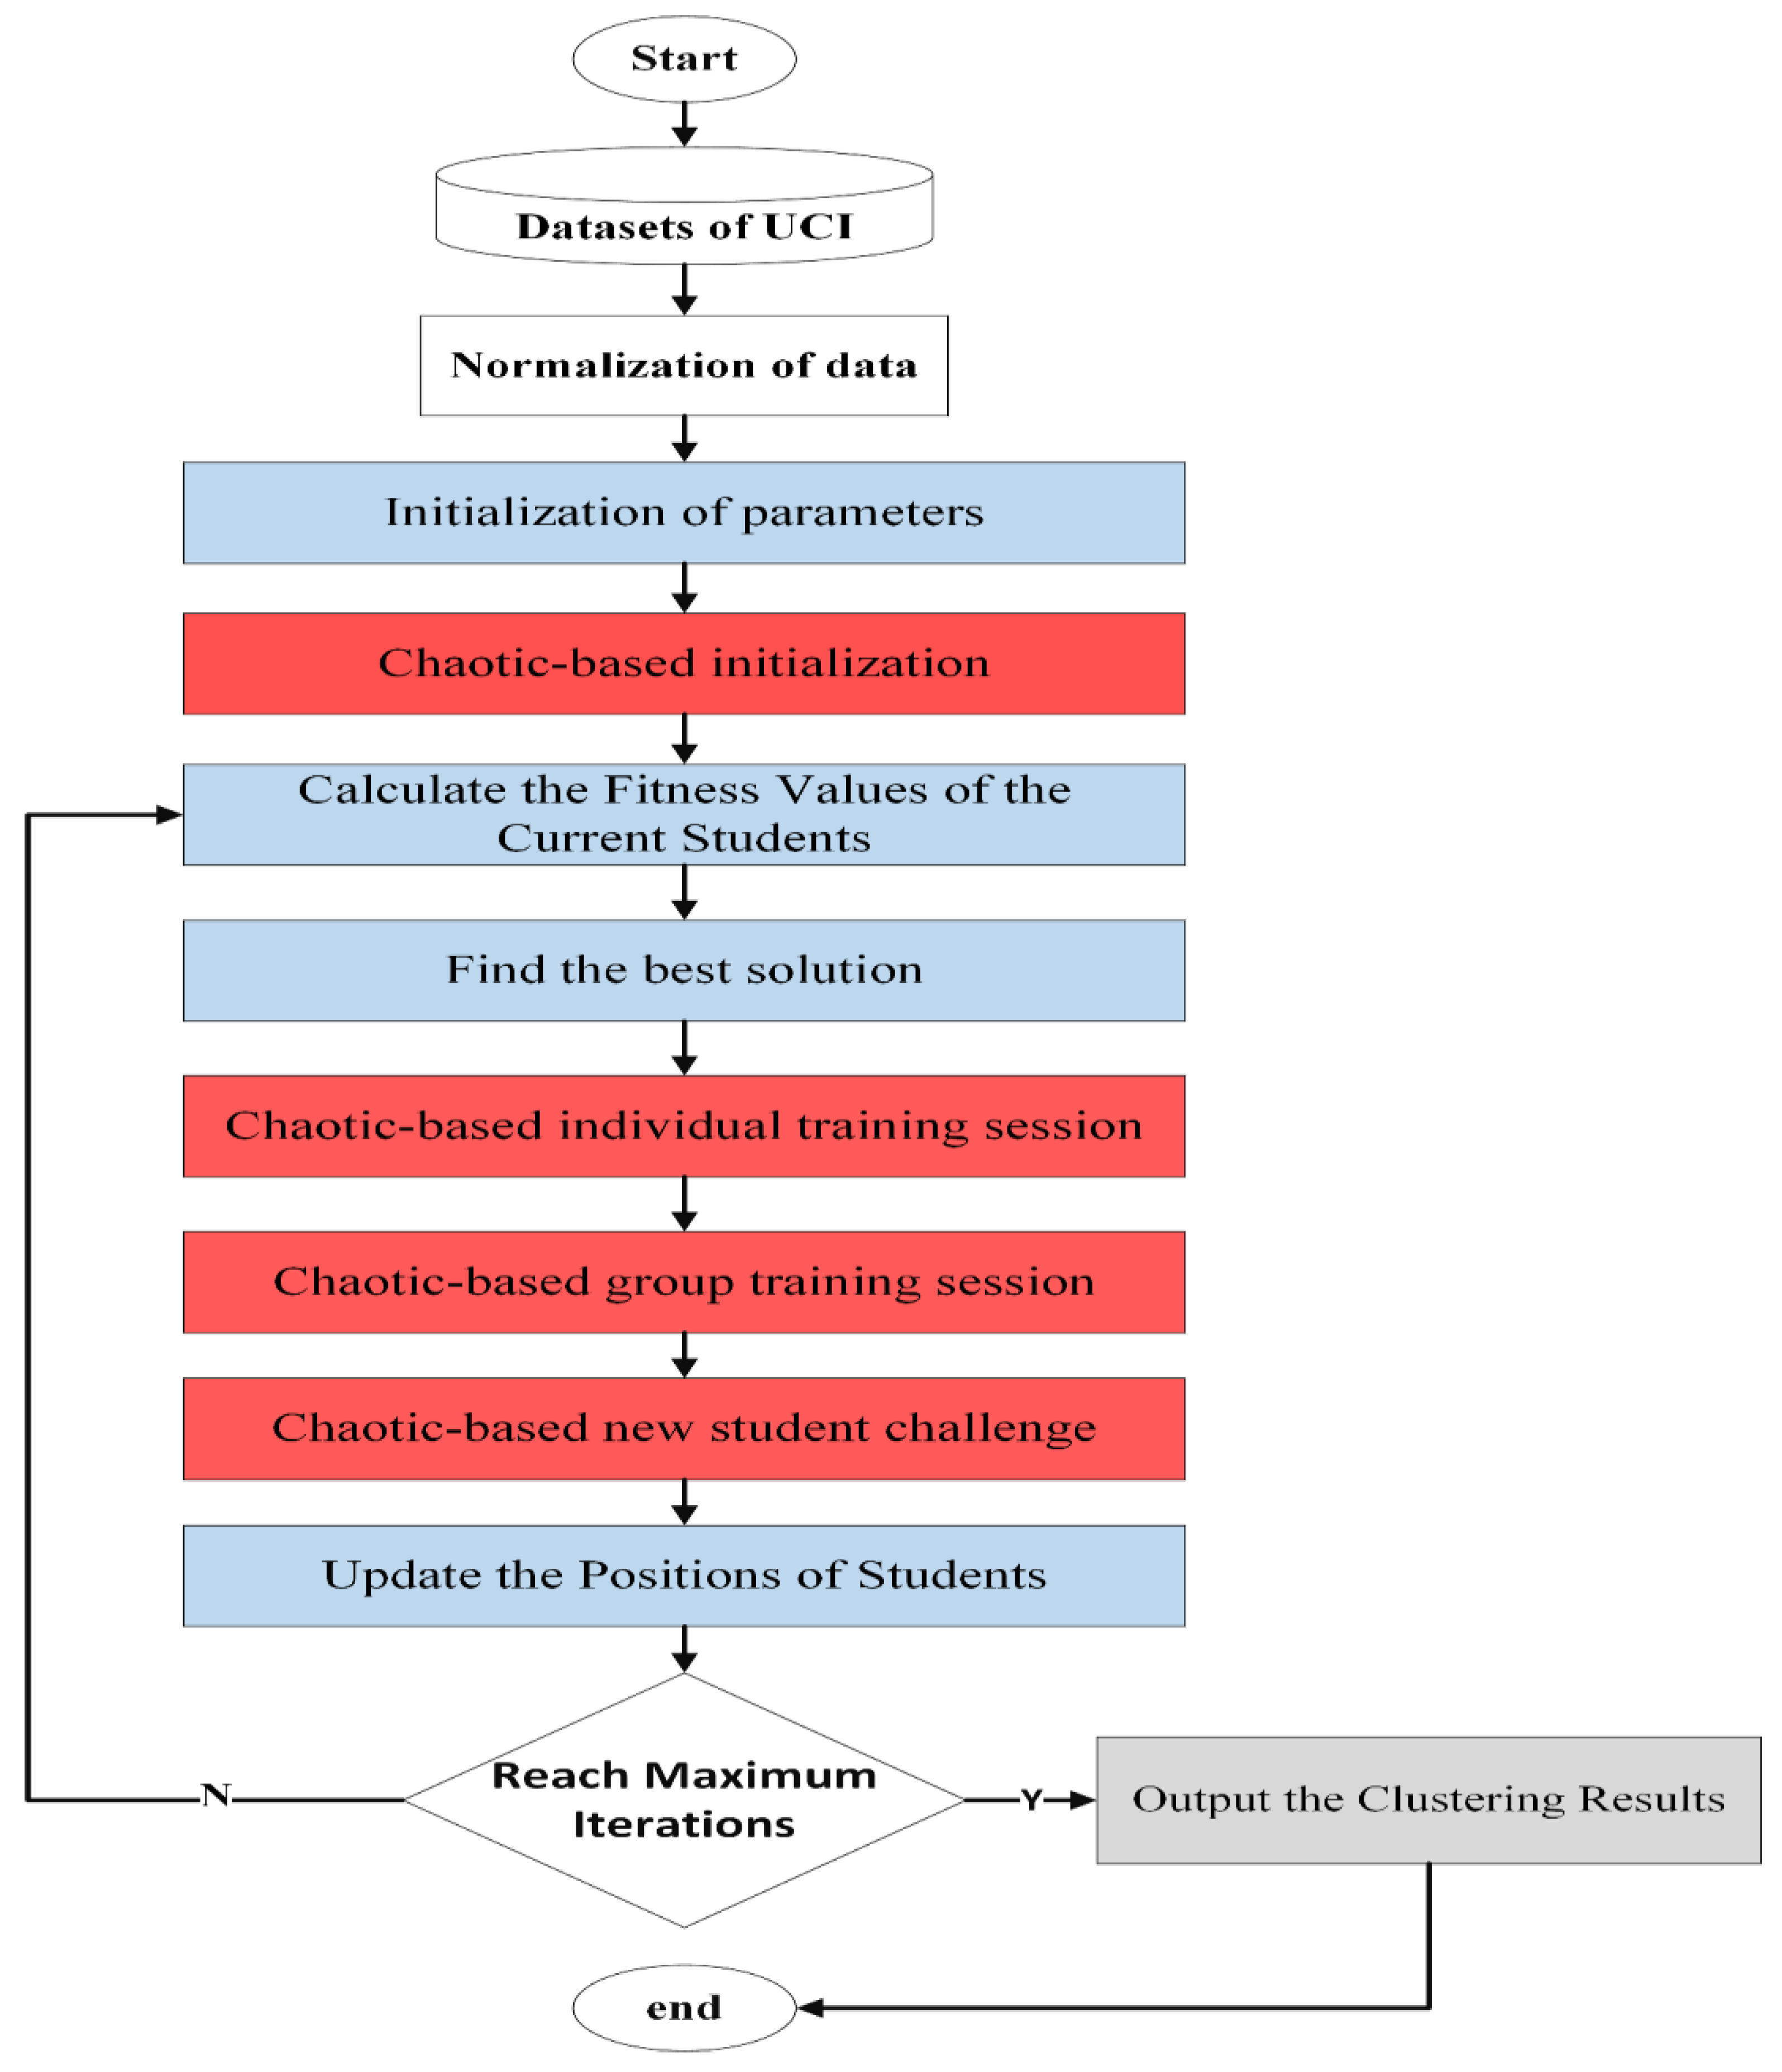
Figure 2.
Format of the initial population of students for clustering.

Figure 3.
Convergence rate of different versions of IAS based on chaotic maps.


Figure 4.
Convergence rate of the proposed model and other comparative algorithms.


Figure 5.
Performance comparison of BIAS with other algorithms.


Table 1.
Functions of Chaotic Maps.
| Methods | Chaotics | Mathematical Model | Range |
|---|---|---|---|
| CIAS-1 | Chebyshev | pq + 1 = cos(q cos − 1(pq)) | (−1, 1) |
| CIAS-2 | Circle | (0, 1) | |
| CIAS-3 | Guess/mouse | (0, 1) | |
| CIAS-4 | Iterative | (−1, 1) | |
| CIAS-5 | Logistic | , c = 4 | (0, 1) |
| CIAS-6 | Piecewise | (0, 1) | |
| CIAS-7 | Sine | (0, 1) | |
| CIAS-8 | Singer | (0, 1) | |
| CIAS-9 | Sinusoidal | , c = 2.3 | (0, 1) |
| CIAS-10 | Tent | (0, 1) |
Table 2.
Clustering Dataset.
| No. | Datasets | Number of Features | Number of Samples |
|---|---|---|---|
| 1 | Balance Scale | 4 | 625 |
| 2 | Blood | 4 | 748 |
| 3 | breast | 30 | 569 |
| 4 | CMC | 9 | 1473 |
| 5 | Dermatology | 34 | 366 |
| 6 | Glass | 9 | 214 |
| 7 | Haberman’s Survival | 3 | 306 |
| 8 | hepatitis | 19 | 155 |
| 9 | Iris | 4 | 150 |
| 10 | Libras | 90 | 360 |
| 11 | lung cancer | 32 | 56 |
| 12 | Madelon | 500 | 2600 |
| 13 | ORL | 1024 | 400 |
| 14 | seeds | 7 | 210 |
| 15 | speech | 310 | 125 |
| 16 | Starlog (Heart) | 13 | 270 |
| 17 | Steel | 33 | 1941 |
| 18 | Vowel | 3 | 871 |
| 19 | wine | 13 | 178 |
| 20 | Wisconsin | 9 | 699 |
Table 3.
Values of initial parameters.
| Values | Parameters | Algorithms |
|---|---|---|
| ABC [10] | Limit 5D | 5D |
| Population Size | 20 | |
| Number of lookers | 20 | |
| Iterations | 100 | |
| BA [11] | R | 0.5 |
| A | 0.8 | |
| population size | 20 | |
| Iterations | 100 | |
| CSA [12] | Ap | 0.8 |
| population size is | 20 | |
| Iterations | 100 | |
| AEFA [13] | FCheck | 1 |
| population size | 20 | |
| Iterations | 100 | |
| Proposed Model | population size | 20 |
| Iterations | 100 |
Table 4.
Results related to the worst, best, and average solutions for the population of different versions of the ISA.
Table 4.
Results related to the worst, best, and average solutions for the population of different versions of the ISA.
| Dataset | Results | IAS-1 | IAS-2 | IAS-3 | IAS-4 | IAS-5 | IAS-6 | IAS-7 | IAS-8 | IAS-9 | IAS-10 |
|---|---|---|---|---|---|---|---|---|---|---|---|
| Blood | Worst | 4.21E+05 | 8.46E+05 | 8.46E+05 | 4.20E+05 | 8.47E+05 | 8.46E+05 | 8.47E+05 | 8.46E+05 | 8.46E+05 | 8.46E+05 |
| Best | 4.10E+05 | 4.10E+05 | 4.12E+05 | 4.10E+05 | 4.18E+05 | 4.13E+05 | 4.12E+05 | 4.15E+05 | 4.20E+05 | 4.13E+05 | |
| Avg | 4.14E+05 | 4.93E+05 | 4.93E+05 | 4.15E+05 | 5.46E+05 | 5.20E+05 | 5.22E+05 | 6.30E+05 | 6.55E+05 | 5.20E+05 | |
| Cancer | Worst | 4.25E+03 | 4.45E+03 | 3.59E+03 | 3.63E+03 | 4.36E+03 | 3.94E+03 | 4.71E+03 | 4.24E+03 | 4.25E+03 | 5.36E+03 |
| Best | 3.28E+03 | 3.93E+03 | 3.30E+03 | 3.26E+03 | 3.68E+03 | 3.42E+03 | 3.94E+03 | 3.77E+03 | 3.50E+03 | 3.72E+03 | |
| Avg | 3.82E+03 | 4.20E+03 | 3.44E+03 | 3.48E+03 | 4.08E+03 | 3.62E+03 | 4.40E+03 | 4.03E+03 | 3.83E+03 | 5.05E+03 | |
| CMC | Worst | 9.70E+03 | 9.91E+03 | 1.38E+04 | 1.01E+04 | 1.32E+04 | 1.26E+04 | 1.31E+04 | 1.38E+04 | 1.38E+04 | 1.31E+04 |
| Best | 8.08E+03 | 7.79E+03 | 7.40E+03 | 7.33E+03 | 7.80E+03 | 7.60E+03 | 7.31E+03 | 6.93E+03 | 7.66E+03 | 7.15E+03 | |
| Avg | 9.11E+03 | 8.67E+03 | 1.16E+04 | 8.85E+03 | 1.10E+04 | 1.09E+04 | 1.01E+04 | 1.18E+04 | 1.21E+04 | 1.05E+04 | |
| Dermatology | Worst | 4.95E+03 | 3.54E+03 | 1.21E+04 | 4.76E+03 | 4.65E+03 | 4.00E+03 | 7.71E+03 | 4.94E+03 | 5.05E+03 | 4.37E+03 |
| Best | 3.05E+03 | 2.75E+03 | 2.83E+03 | 2.87E+03 | 3.31E+03 | 3.03E+03 | 2.96E+03 | 3.08E+03 | 2.93E+03 | 2.90E+03 | |
| Avg | 3.75E+03 | 3.27E+03 | 1.15E+04 | 3.69E+03 | 3.80E+03 | 3.41E+03 | 3.99E+03 | 3.79E+03 | 3.71E+03 | 3.51E+03 | |
| Iris | Worst | 2.29E+02 | 3.03E+02 | 2.97E+02 | 2.38E+02 | 2.75E+02 | 2.88E+02 | 2.86E+02 | 3.03E+02 | 3.03E+02 | 2.84E+02 |
| Best | 1.67E+02 | 1.71E+02 | 1.75E+02 | 1.55E+02 | 2.00E+02 | 1.47E+02 | 2.05E+02 | 1.85E+02 | 1.97E+02 | 1.71E+02 | |
| Avg | 1.97E+02 | 2.55E+02 | 2.51E+02 | 1.96E+02 | 2.43E+02 | 2.39E+02 | 2.57E+02 | 2.66E+02 | 2.57E+02 | 2.29E+02 | |
| Orl | Worst | 9.55E+05 | 7.65E+05 | 5.28E+05 | 5.59E+05 | 5.69E+05 | 7.77E+05 | 5.72E+05 | 7.32E+05 | 6.38E+05 | 7.67E+05 |
| Best | 8.44E+05 | 7.35E+05 | 5.23E+05 | 5.36E+05 | 5.55E+05 | 7.44E+05 | 5.54E+05 | 6.70E+05 | 5.73E+05 | 7.51E+05 | |
| Avg | 9.37E+05 | 7.62E+05 | 5.27E+05 | 5.45E+05 | 5.64E+05 | 7.71E+05 | 5.65E+05 | 7.01E+05 | 6.28E+05 | 7.60E+05 | |
| Steel | Worst | 3.8E+09 | 4.64E+09 | 4.18E+09 | 3.8E+09 | 4.64E+09 | 4.26E+09 | 4.64E+09 | 4.64E+09 | 4.64E+09 | 4.64E+09 |
| Best | 2.40E+06 | 2.42E+06 | 2.48E+06 | 2.36E+06 | 2.55E+06 | 2.48E+06 | 2.51E+06 | 2.55E+06 | 2.37E+06 | 2.44E+06 | |
| Avg | 3.29E+09 | 3.97E+09 | 3.85E+09 | 3.05E+09 | 3.92E+09 | 3.72E+09 | 3.85E+09 | 3.96E+09 | 3.98E+09 | 3.71E+09 | |
| Wine | Worst | 2.26E+04 | 2.90E+04 | 3.51E+04 | 2.27E+04 | 8.38E+04 | 3.83E+04 | 4.28E+04 | 8.38E+04 | 8.38E+04 | 8.38E+04 |
| Best | 1.74E+04 | 1.82E+04 | 1.77E+04 | 1.75E+04 | 1.75E+04 | 1.78E+04 | 1.79E+04 | 1.79E+04 | 1.91E+04 | 1.82E+04 | |
| Avg | 2.01E+04 | 2.18E+04 | 3.40E+04 | 2.00E+04 | 3.31E+04 | 2.58E+04 | 2.52E+04 | 3.64E+04 | 3.83E+04 | 3.35E+04 | |
| Balance Scale | Worst | 1.49E+03 | 1.51E+03 | 2.33E+03 | 1.63E+03 | 1.54E+03 | 1.52E+03 | 1.51E+03 | 1.53E+03 | 1.79E+03 | 1.51E+03 |
| Best | 1.45E+03 | 1.45E+03 | 1.52E+03 | 1.47E+03 | 1.46E+03 | 1.44E+03 | 1.45E+03 | 1.45E+03 | 1.48E+03 | 1.45E+03 | |
| Avg | 1.47E+03 | 1.49E+03 | 2.15E+03 | 1.55E+03 | 1.49E+03 | 1.48E+03 | 1.48E+03 | 1.50E+03 | 1.61E+03 | 1.48E+03 | |
| Worst | 2.37E+03 | 2.99E+03 | 2.69E+03 | 2.44E+03 | 3.22E+03 | 2.79E+03 | 3.13E+03 | 2.55E+03 | 2.50E+03 | 2.79E+03 | |
| Breasts | Best | 2.22E+03 | 2.69E+03 | 2.58E+03 | 2.29E+03 | 2.84E+03 | 2.53E+03 | 2.68E+03 | 2.43E+03 | 2.43E+03 | 2.47E+03 |
| Avg | 2.30E+03 | 2.89E+03 | 2.63E+03 | 2.37E+03 | 3.10E+03 | 2.73E+03 | 2.98E+03 | 2.51E+03 | 2.47E+03 | 2.63E+03 | |
| Glass | Worst | 8.46E+02 | 8.86E+02 | 9.65E+02 | 8.76E+02 | 1.19E+03 | 1.15E+03 | 1.19E+03 | 1.19E+03 | 1.20E+03 | 1.20E+03 |
| Best | 5.52E+02 | 5.87E+02 | 5.89E+02 | 5.15E+02 | 5.31E+02 | 5.73E+02 | 6.19E+02 | 5.65E+02 | 5.93E+02 | 6.10E+02 | |
| Avg | 8.13E+02 | 7.72E+02 | 9.35E+02 | 7.44E+02 | 9.74E+02 | 8.87E+02 | 9.86E+02 | 1.02E+03 | 1.09E+03 | 8.79E+02 | |
| Haberman | Worst | 3.61E+03 | 4.47E+03 | 4.46E+03 | 3.64E+03 | 4.14E+03 | 4.46E+03 | 5.64E+03 | 4.16E+03 | 4.28E+03 | 4.52E+03 |
| Best | 2.70E+03 | 2.84E+03 | 3.07E+03 | 2.73E+03 | 3.00E+03 | 3.14E+03 | 3.21E+03 | 2.78E+03 | 3.01E+03 | 2.79E+03 | |
| Avg | 3.14E+03 | 3.85E+03 | 3.43E+03 | 3.29E+03 | 3.65E+03 | 3.78E+03 | 3.77E+03 | 3.70E+03 | 3.78E+03 | 3.91E+03 | |
| Heart | Worst | 1.97E+04 | 2.72E+04 | 3.33E+04 | 1.97E+04 | 4.22E+04 | 3.46E+04 | 4.17E+04 | 4.22E+04 | 4.15E+04 | 3.62E+04 |
| Best | 2.40E+06 | 2.42E+06 | 2.48E+06 | 2.36E+06 | 1.46E+04 | 1.43E+04 | 1.42E+04 | 1.37E+04 | 1.42E+04 | 1.31E+04 | |
| Avg | 3.29E+09 | 3.97E+09 | 3.85E+09 | 3.05E+09 | 2.43E+04 | 2.18E+04 | 2.75E+04 | 2.71E+04 | 3.03E+04 | 1.99E+04 | |
| Hepatitis | Worst | 2.26E+04 | 2.90E+04 | 3.51E+04 | 2.27E+04 | 2.22E+04 | 2.25E+04 | 1.96E+04 | 2.25E+04 | 2.24E+04 | 2.27E+04 |
| Best | 1.74E+04 | 1.82E+04 | 1.77E+04 | 1.75E+04 | 1.35E+04 | 1.31E+04 | 1.34E+04 | 1.36E+04 | 1.32E+04 | 1.34E+04 | |
| Avg | 2.01E+04 | 2.18E+04 | 3.40E+04 | 2.00E+04 | 1.83E+04 | 1.78E+04 | 1.72E+04 | 1.90E+04 | 1.79E+04 | 1.75E+04 | |
| Libras | Worst | 1.49E+03 | 1.51E+03 | 2.33E+03 | 1.63E+03 | 1.05E+03 | 9.16E+02 | 9.21E+02 | 6.11E+02 | 7.15E+02 | 7.38E+02 |
| Best | 1.45E+03 | 1.45E+03 | 1.52E+03 | 1.47E+03 | 6.89E+02 | 8.72E+02 | 6.69E+02 | 5.78E+02 | 6.88E+02 | 5.97E+02 | |
| Avg | 1.47E+03 | 1.49E+03 | 2.15E+03 | 1.55E+03 | 8.82E+02 | 8.94E+02 | 8.62E+02 | 5.87E+02 | 7.07E+02 | 6.60E+02 | |
| Lung Cancer | Worst | 2.37E+03 | 2.99E+03 | 2.69E+03 | 2.44E+03 | 1.98E+02 | 1.87E+02 | 2.03E+02 | 2.19E+02 | 1.97E+02 | 2.07E+02 |
| Best | 2.22E+03 | 2.69E+03 | 2.58E+03 | 2.29E+03 | 1.69E+02 | 1.70E+02 | 1.80E+02 | 1.79E+02 | 1.66E+02 | 1.76E+02 | |
| Avg | 2.30E+03 | 2.89E+03 | 2.63E+03 | 2.37E+03 | 1.88E+02 | 1.80E+02 | 1.95E+02 | 1.97E+02 | 1.83E+02 | 1.93E+02 | |
| Madelon | Worst | 8.46E+02 | 8.86E+02 | 9.65E+02 | 8.76E+02 | 1.95E+06 | 1.83E+06 | 1.86E+06 | 1.82E+06 | 1.84E+06 | 1.82E+06 |
| Best | 5.52E+02 | 5.87E+02 | 5.89E+02 | 5.15E+02 | 1.94E+06 | 1.83E+06 | 1.84E+06 | 1.82E+06 | 1.82E+06 | 1.82E+06 | |
| Avg | 8.13E+02 | 7.72E+02 | 9.35E+02 | 7.44E+02 | 1.95E+06 | 1.83E+06 | 1.85E+06 | 1.82E+06 | 1.83E+06 | 1.82E+06 | |
| Seeds | Worst | 3.61E+03 | 4.47E+03 | 4.46E+03 | 3.64E+03 | 7.75E+02 | 8.30E+02 | 8.41E+02 | 7.97E+02 | 8.58E+02 | 7.19E+02 |
| Best | 2.70E+03 | 2.84E+03 | 3.07E+03 | 2.73E+03 | 5.29E+02 | 5.15E+02 | 4.93E+02 | 5.29E+02 | 5.28E+02 | 5.33E+02 | |
| Avg | 3.14E+03 | 3.85E+03 | 3.43E+03 | 3.29E+03 | 6.63E+02 | 6.42E+02 | 6.66E+02 | 6.96E+02 | 7.47E+02 | 6.29E+02 | |
| Speech | Worst | 1.97E+04 | 2.72E+04 | 3.33E+04 | 1.97E+04 | 6.58E+12 | 6.58E+12 | 6.52E+12 | 6.58E+12 | 6.58E+12 | 6.55E+12 |
| Best | 2.40E+06 | 2.42E+06 | 2.48E+06 | 2.36E+06 | 3.68E+12 | 2.54E+12 | 3.02E+12 | 3.31E+12 | 3.45E+12 | 3.46E+12 | |
| Avg | 3.29E+09 | 3.97E+09 | 3.85E+09 | 3.05E+09 | 5.40E+12 | 5.06E+12 | 5.09E+12 | 5.03E+12 | 4.42E+12 | 5.07E+12 | |
| Vowel | Worst | 2.26E+04 | 2.90E+04 | 3.51E+04 | 2.27E+04 | 5.83E+05 | 4.49E+05 | 5.72E+05 | 5.76E+05 | 6.92E+05 | 4.43E+05 |
| Best | 1.74E+04 | 1.82E+04 | 1.77E+04 | 1.75E+04 | 2.45E+05 | 2.50E+05 | 2.60E+05 | 2.32E+05 | 2.37E+05 | 2.23E+05 | |
| Avg | 2.01E+04 | 2.18E+04 | 3.40E+04 | 2.00E+04 | 4.04E+05 | 3.46E+05 | 3.87E+05 | 4.38E+05 | 4.46E+05 | 3.31E+05 |
Table 5.
Results related to the worst, best, and average solutions for the population of the proposed model and other comparative algorithms.
Table 5.
Results related to the worst, best, and average solutions for the population of the proposed model and other comparative algorithms.
| Dataset | CSA | ABC | BA | AEFA | CIAS | |
|---|---|---|---|---|---|---|
| Blood | worst | 4.10E+05 | 3.90E+06 | 6.01E+05 | 4.88E+06 | 4.41E+05 |
| best | 4.08E+05 | 4.11E+05 | 6.01E+05 | 4.85E+05 | 4.41E+05 | |
| avg | 4.09E+05 | 1.13E+06 | 6.01E+05 | 1.99E+06 | 4.41E+05 | |
| Cancer | worst | 4.43E+03 | 9.45E+03 | 5.85E+03 | 3.57E+03 | 2.96E+03 |
| best | 4.09E+03 | 3.57E+03 | 5.81E+03 | 3.56E+03 | 2.96E+03 | |
| avg | 4.30E+03 | 5.78E+03 | 5.82E+03 | 3.56E+03 | 2.96E+03 | |
| CMC | worst | 6.47E+03 | 1.05E+04 | 7.72E+03 | 6.74E+03 | 5.53E+03 |
| best | 6.30E+03 | 5.95E+03 | 7.69E+03 | 6.74E+03 | 5.53E+03 | |
| avg | 6.35E+03 | 7.75E+03 | 7.70E+03 | 6.74E+03 | 5.53E+03 | |
| Dermatology | worst | 2.97E+03 | 3.51E+03 | 3.08E+03 | 3.14E+03 | 2.25E+03 |
| best | 2.97E+03 | 3.16E+03 | 3.07E+03 | 3.13E+03 | 2.24E+03 | |
| avg | 2.97E+03 | 3.35E+03 | 3.07E+03 | 3.14E+03 | 2.25E+03 | |
| Iris | worst | 1.06E+02 | 3.60E+02 | 1.50E+02 | 1.07E+02 | 9.67E+01 |
| best | 1.03E+02 | 1.22E+02 | 1.46E+02 | 1.05E+02 | 9.67E+01 | |
| avg | 1.04E+02 | 2.21E+02 | 1.48E+02 | 1.07E+02 | 9.67E+01 | |
| Orl | worst | 5.01E+05 | 7.77E+05 | 6.36E+05 | 7.33E+05 | 5.03E+05 |
| best | 5.00E+05 | 7.68E+05 | 6.36E+05 | 7.26E+05 | 5.03E+05 | |
| avg | 5.00E+05 | 7.74E+05 | 6.36E+05 | 7.30E+05 | 5.03E+05 | |
| Steel | worst | 2.99E+09 | 9.93E+09 | 6.82E+09 | 2.98E+10 | 5.81E+09 |
| best | 2.95E+09 | 2.15E+09 | 6.82E+09 | 6.30E+09 | 5.81E+09 | |
| avg | 2.97E+09 | 3.40E+09 | 6.82E+09 | 1.85E+10 | 5.81E+09 | |
| Wine | worst | 1.72E+04 | 1.83E+04 | 1.71E+04 | 5.35E+04 | 1.63E+04 |
| best | 1.71E+04 | 1.65E+04 | 1.71E+04 | 1.90E+04 | 1.63E+04 | |
| avg | 1.72E+04 | 1.72E+04 | 1.71E+04 | 5.02E+04 | 1.63E+04 | |
| balance scale | worst | 1.43E+03 | 1.72E+03 | 1.45E+03 | 1.43E+03 | 1.43E+03 |
| best | 1.43E+03 | 1.44E+03 | 1.44E+03 | 1.43E+03 | 1.43E+03 | |
| avg | 1.43E+03 | 1.52E+03 | 1.44E+03 | 1.43E+03 | 1.43E+03 | |
| breasts | worst | 3.43E+03 | 6.08E+03 | 3.05E+03 | 2.36E+03 | 2.02E+03 |
| best | 3.39E+03 | 2.32E+03 | 3.03E+03 | 2.36E+03 | 2.02E+03 | |
| avg | 3.41E+03 | 4.34E+03 | 3.04E+03 | 2.36E+03 | 2.02E+03 | |
| glass | worst | 4.37E+02 | 6.30E+02 | 3.69E+02 | 4.11E+02 | 2.53E+02 |
| best | 3.91E+02 | 3.07E+02 | 3.65E+02 | 4.10E+02 | 2.53E+02 | |
| avg | 4.10E+02 | 5.03E+02 | 3.67E+02 | 4.11E+02 | 2.53E+02 | |
| Haberman | worst | 2.62E+03 | 1.11E+04 | 2.94E+03 | 2.59E+03 | 2.57E+03 |
| best | 2.59E+03 | 2.62E+03 | 2.93E+03 | 2.59E+03 | 2.57E+03 | |
| avg | 2.61E+03 | 3.90E+03 | 2.93E+03 | 2.59E+03 | 2.57E+03 | |
| heart | worst | 1.10E+04 | 3.01E+04 | 1.45E+04 | 1.19E+04 | 1.06E+04 |
| best | 1.08E+04 | 1.07E+04 | 1.45E+04 | 1.13E+04 | 1.06E+04 | |
| avg | 1.09E+04 | 1.37E+04 | 1.45E+04 | 1.18E+04 | 1.06E+04 | |
| Hepatitis | worst | 1.24E+04 | 1.25E+04 | 1.48E+04 | 1.93E+04 | 1.18E+04 |
| best | 1.20E+04 | 1.18E+04 | 1.48E+04 | 1.48E+04 | 1.18E+04 | |
| avg | 1.22E+04 | 1.21E+04 | 1.48E+04 | 1.93E+04 | 1.18E+04 | |
| Libras | worst | 5.87E+02 | 9.16E+02 | 7.34E+02 | 7.78E+02 | 5.41E+02 |
| best | 5.85E+02 | 8.71E+02 | 7.23E+02 | 7.78E+02 | 5.40E+02 | |
| avg | 5.86E+02 | 8.92E+02 | 7.26E+02 | 7.78E+02 | 5.41E+02 | |
| lung Cancer | worst | 1.59E+02 | 1.71E+02 | 1.64E+02 | 1.65E+02 | 1.38E+02 |
| best | 1.58E+02 | 1.60E+02 | 1.63E+02 | 1.65E+02 | 1.38E+02 | |
| avg | 1.59E+02 | 1.66E+02 | 1.63E+02 | 1.65E+02 | 1.38E+02 | |
| Madelon | worst | 1.86E+06 | 3.91E+06 | 2.85E+06 | 2.67E+06 | 1.91E+06 |
| best | 1.86E+06 | 3.64E+06 | 2.85E+06 | 2.52E+06 | 1.90E+06 | |
| avg | 1.86E+06 | 3.77E+06 | 2.85E+06 | 2.59E+06 | 1.90E+06 | |
| seeds | worst | 3.77E+02 | 1.04E+03 | 3.69E+02 | 3.68E+02 | 3.12E+02 |
| best | 3.67E+02 | 3.72E+02 | 3.63E+02 | 3.65E+02 | 3.12E+02 | |
| avg | 3.71E+02 | 5.29E+02 | 3.64E+02 | 3.66E+02 | 3.12E+02 | |
| speech | worst | 4.65E+12 | 2.41E+12 | 6.92E+12 | 3.63E+13 | 3.00E+12 |
| best | 3.71E+12 | 2.16E+12 | 6.92E+12 | 7.07E+12 | 3.00E+12 | |
| avg | 4.18E+12 | 2.26E+12 | 6.92E+12 | 1.68E+13 | 3.00E+12 | |
| vowel | worst | 1.71E+05 | 3.73E+05 | 2.55E+05 | 4.16E+05 | 1.62E+05 |
| best | 1.69E+05 | 1.92E+05 | 2.55E+05 | 2.09E+05 | 1.62E+05 | |
| avg | 1.70E+05 | 2.58E+05 | 2.55E+05 | 3.27E+05 | 1.62E+05 | |
Table 6.
Description of the novel coronavirus 2019 dataset.
| No. | Features Name | Description |
|---|---|---|
| 1 | Location | The location where patients belong to |
| 2 | Country | The country where patients belong to |
| 3 | Gender | The gender of patients |
| 4 | Age | The ages of the patients |
| 5 | vis_wuhan (Yes: 1, 0: No) | Whether the patients visited Wuhan, China |
| 6 | from_wuhan (Yes: 1, 0: No) | Whether the patients from Wuhan, China |
| 7 | symptom 1 | Fever |
| 8 | symptom 2 | Cough |
| 9 | symptom 3 | Cold |
| 10 | symptom 4 | Fatigue |
| 11 | symptom 5 | Body pain |
| 12 | symptom 6 | Malaise |
| 13 | diff_sym_hos | The day’s difference between the symptoms being noticed and admission to the hospital |
| 14 | Class | The class of patient can be either death or recovery |
Table 7.
Comparison of the BIAS and other algorithms based on the accuracy.
| Models | Iterations | Precision | Recall | F-Measure | Accuracy |
|---|---|---|---|---|---|
| BABC | 100 | 91.15 | 91.24 | 91.19 | 91.21 |
| 200 | 91.48 | 91.62 | 91.55 | 91.95 | |
| BBA | 100 | 92.29 | 92.38 | 92.33 | 92.15 |
| 200 | 92.37 | 92.51 | 92.44 | 92.48 | |
| BCSA | 100 | 94.14 | 94.26 | 94.20 | 94.71 |
| 200 | 95.25 | 95.38 | 95.31 | 95.32 | |
| BAEFA | 100 | 94.06 | 94.19 | 94.09 | 94.36 |
| 200 | 94.52 | 94.63 | 94.57 | 94.79 | |
| Proposed Model | 100 | 95.53 | 95.76 | 95.64 | 95.84 |
| 200 | 96.04 | 96.35 | 96.19 | 96.25 |
Table 8.
Results of the BIAS Feature Selection.
| Features | Precision | Recall | F-Measure | Accuracy |
|---|---|---|---|---|
| 5 | 98.32 | 98.43 | 98.37 | 98.68 |
| 5 | 98.41 | 98.47 | 98.44 | 98.41 |
| 6 | 98.26 | 98.35 | 98.30 | 98.23 |
| 6 | 98.14 | 98.46 | 98.30 | 98.06 |
| 7 | 98.45 | 98.55 | 98.50 | 98.31 |
| 7 | 97.35 | 97.49 | 97.42 | 97.76 |
| 8 | 97.50 | 97.58 | 97.54 | 97.65 |
| 8 | 97.14 | 97.30 | 97.22 | 97.52 |
| 9 | 97.32 | 97.58 | 97.45 | 97.41 |
| 10 | 97.29 | 97.48 | 97.38 | 97.52 |
| 10 | 97.06 | 97.19 | 97.12 | 97.13 |
| 11 | 96.58 | 96.67 | 96.62 | 96.84 |
| 11 | 96.61 | 96.75 | 96.68 | 96.92 |
| 12 | 96.35 | 96.42 | 96.38 | 96.56 |
| 12 | 96.42 | 96.56 | 96.49 | 96.42 |
| 13 | 96.11 | 96.20 | 96.15 | 96.25 |
Disclaimer/Publisher’s Note: The statements, opinions and data contained in all publications are solely those of the individual author(s) and contributor(s) and not of MDPI and/or the editor(s). MDPI and/or the editor(s) disclaim responsibility for any injury to people or property resulting from any ideas, methods, instructions or products referred to in the content. |
© 2023 by the authors. Licensee MDPI, Basel, Switzerland. This article is an open access article distributed under the terms and conditions of the Creative Commons Attribution (CC BY) license (https://creativecommons.org/licenses/by/4.0/).
Share and Cite
MDPI and ACS Style
Gharehchopogh, F.S.; Khargoush, A.A. A Chaotic-Based Interactive Autodidactic School Algorithm for Data Clustering Problems and Its Application on COVID-19 Disease Detection. Symmetry 2023, 15, 894. https://doi.org/10.3390/sym15040894
AMA Style
Gharehchopogh FS, Khargoush AA. A Chaotic-Based Interactive Autodidactic School Algorithm for Data Clustering Problems and Its Application on COVID-19 Disease Detection. Symmetry. 2023; 15(4):894. https://doi.org/10.3390/sym15040894
Chicago/Turabian StyleGharehchopogh, Farhad Soleimanian, and Aysan Alavi Khargoush. 2023. "A Chaotic-Based Interactive Autodidactic School Algorithm for Data Clustering Problems and Its Application on COVID-19 Disease Detection" Symmetry 15, no. 4: 894. https://doi.org/10.3390/sym15040894
Note that from the first issue of 2016, this journal uses article numbers instead of page numbers. See further details here.