
Characteristics of Midface Asymmetry in Skeletal Class III Malocclusion Using Three-Dimensional Analysis
by

Chia-Yi (Jessica) Wang
1, 
Chen-Jung Chang
1,*,
Meng-Yen Chen
2,
Tung-Yiu Wong
2 and
Jing-Jing Fang
3 1
Division of Orthodontics, Department of Stomatology, National Cheng Kung University Hospital, College of Medicine, National Cheng Kung University, Tainan 704, Taiwan
2
Division of Oral Maxillofacial Surgery, Department of Stomatology, National Cheng Kung University Hospital, College of Medicine, National Cheng Kung University, Tainan 704, Taiwan
3
Department of Mechanical Engineering, College of Engineering, National Cheng Kung University, Tainan 704, Taiwan
*
Author to whom correspondence should be addressed.
Symmetry 2024, 16(4), 490; https://doi.org/10.3390/sym16040490
Submission received: 5 March 2024
/
Revised: 29 March 2024
/
Accepted: 10 April 2024
/
Published: 18 April 2024
(This article belongs to the Special Issue Advances in Imaging Evaluation of Head and Neck Spaces with Symmetry)
Abstract
:Background: The midface plays an important role in the judgment of symmetry. However, studies on three-dimensional analyses of midface asymmetry are limited. This study investigated the characteristics of midface asymmetry in skeletal Class III malocclusion patients through three-dimensional analysis. Methods: Sixty-eight adult subjects with skeletal Class III malocclusion were included and divided into mandible symmetry and asymmetry groups. The prevalence of recognizable malar asymmetry and the deviation of anterior nasal spine (ANS) were examined. The relation between midface and mandible asymmetry were investigated with Spearman correlation. The difference in distance of landmarks to reference planes were compared between the two groups using Mann–Whitney U test (p < 0.05). Results: The overall prevalence of malar asymmetry was 7.35% and of ANS deviation was 38.24%. In subjects with chin deviated to the right, there was a moderate negative correlation between chin deviation and difference of zygion and zygomatic process to mid-sagittal plane. The absolute value of difference in the glenoid fossa was significantly greater in female asymmetry subjects. Conclusions: The prevalence of midface asymmetry is not low. The more severely the chin is shifted, the greater asymmetrical position of the zygoma and glenoid fossa was found. Therefore, pre-surgical case-by-case evaluation of the midface region is essential for understanding the midface skeletal characteristics of Class III patients with chin deviation, thereby providing patients with realistic expectations and optimizing surgical outcomes and patient satisfaction.
1. Introduction
The midface is defined as the region from the eyebrows to the subnasale and is mostly formed by the zygoma and part of the maxilla [1]. It includes the nose and cheek and is located in the center of a person’s gaze [2]. The prevalence of clinically apparent asymmetry was reported to be up to 34%, with the asymmetry affecting the chin in 74% of cases and the midface in 36% [3]. Despite its importance in the judgment of the facial esthetic [4], studies on 3D analyses of midface asymmetry are still limited. Most previous studies evaluated facial asymmetry by primarily focusing on the lower face, including occlusal plane canting, the morphology of the mandible, or the deviation of the menton [5,6,7].
Vig et al. analyzed facial asymmetry using 2D posteroanterior (PA) cephalometric films and indicated that the upper maxillary region exhibited asymmetry [8]. Ferrario et al. assessed the soft tissue asymmetry in healthy subjects using 3D photography and demonstrated that the tragion and zygion (z) were the most asymmetrical landmarks [9]. In contrast, Švábová et al. found no significant difference in bilateral facial soft tissue thickness in the Slovak population using an ultrasound device [10]. Moubayed et al. proposed a technique for evaluating the malar eminence using 3D computed tomography (CT) images and concluded that the prevalence of malar asymmetry was 40.5% [11]. Although the above studies evaluated the lateral projection and the prominence of the zygoma, the nose deviation was neglected.
Except for facial asymmetry, Class III malocclusion is also the most common diagnosis for patients seeking surgical orthodontic treatment to improve their facial esthetic. Class III malocclusion is associated with a discrepancy in the sagittal relationship of the maxilla and the mandible, characterized by a deficiency and/or a backward position of the maxilla or by prognathism and/or forward position of the mandible [12]. Treating a patient with skeletal Class III and facial asymmetry could be challenging for orthodontists and oral surgeons. Lee et al. conducted analyses of skeletal Class III deformities with facial asymmetry and revealed significant differences in the 3D condylar position in patients with mandible prognathism and asymmetry [13]. Research into condylar movement in patients with mandible asymmetry demonstrated the close relationship between the condyle, glenoid fossa, and condylar path [14,15,16,17,18]. Asymmetrical condylar movement might affect surgical planning [16], and asymmetrical condylar movement has been reported to persist after surgery and affect stability of surgical outcomes [16,18]. However, studies examining the differences in glenoid fossa position in skeletal Class III subjects with facial asymmetry showed varied results [15,16,17,18,19]. Furthermore, for Class III patients with mandible asymmetry, midface asymmetry might be overlooked due to compensation in head posture or the masking effect by their protruded and deviated chin. Understanding the characteristics of these midfacial features before orthognathic surgery is crucial to provide a patient with realistic expectations and to set a practical treatment plan. Therefore, the objective of this study is to analyze the characteristics of midface asymmetry, including the zygoma, nose, and glenoid fossa position, and their correlation to mandible asymmetry in skeletal Class III patients.
2. Materials and Methods
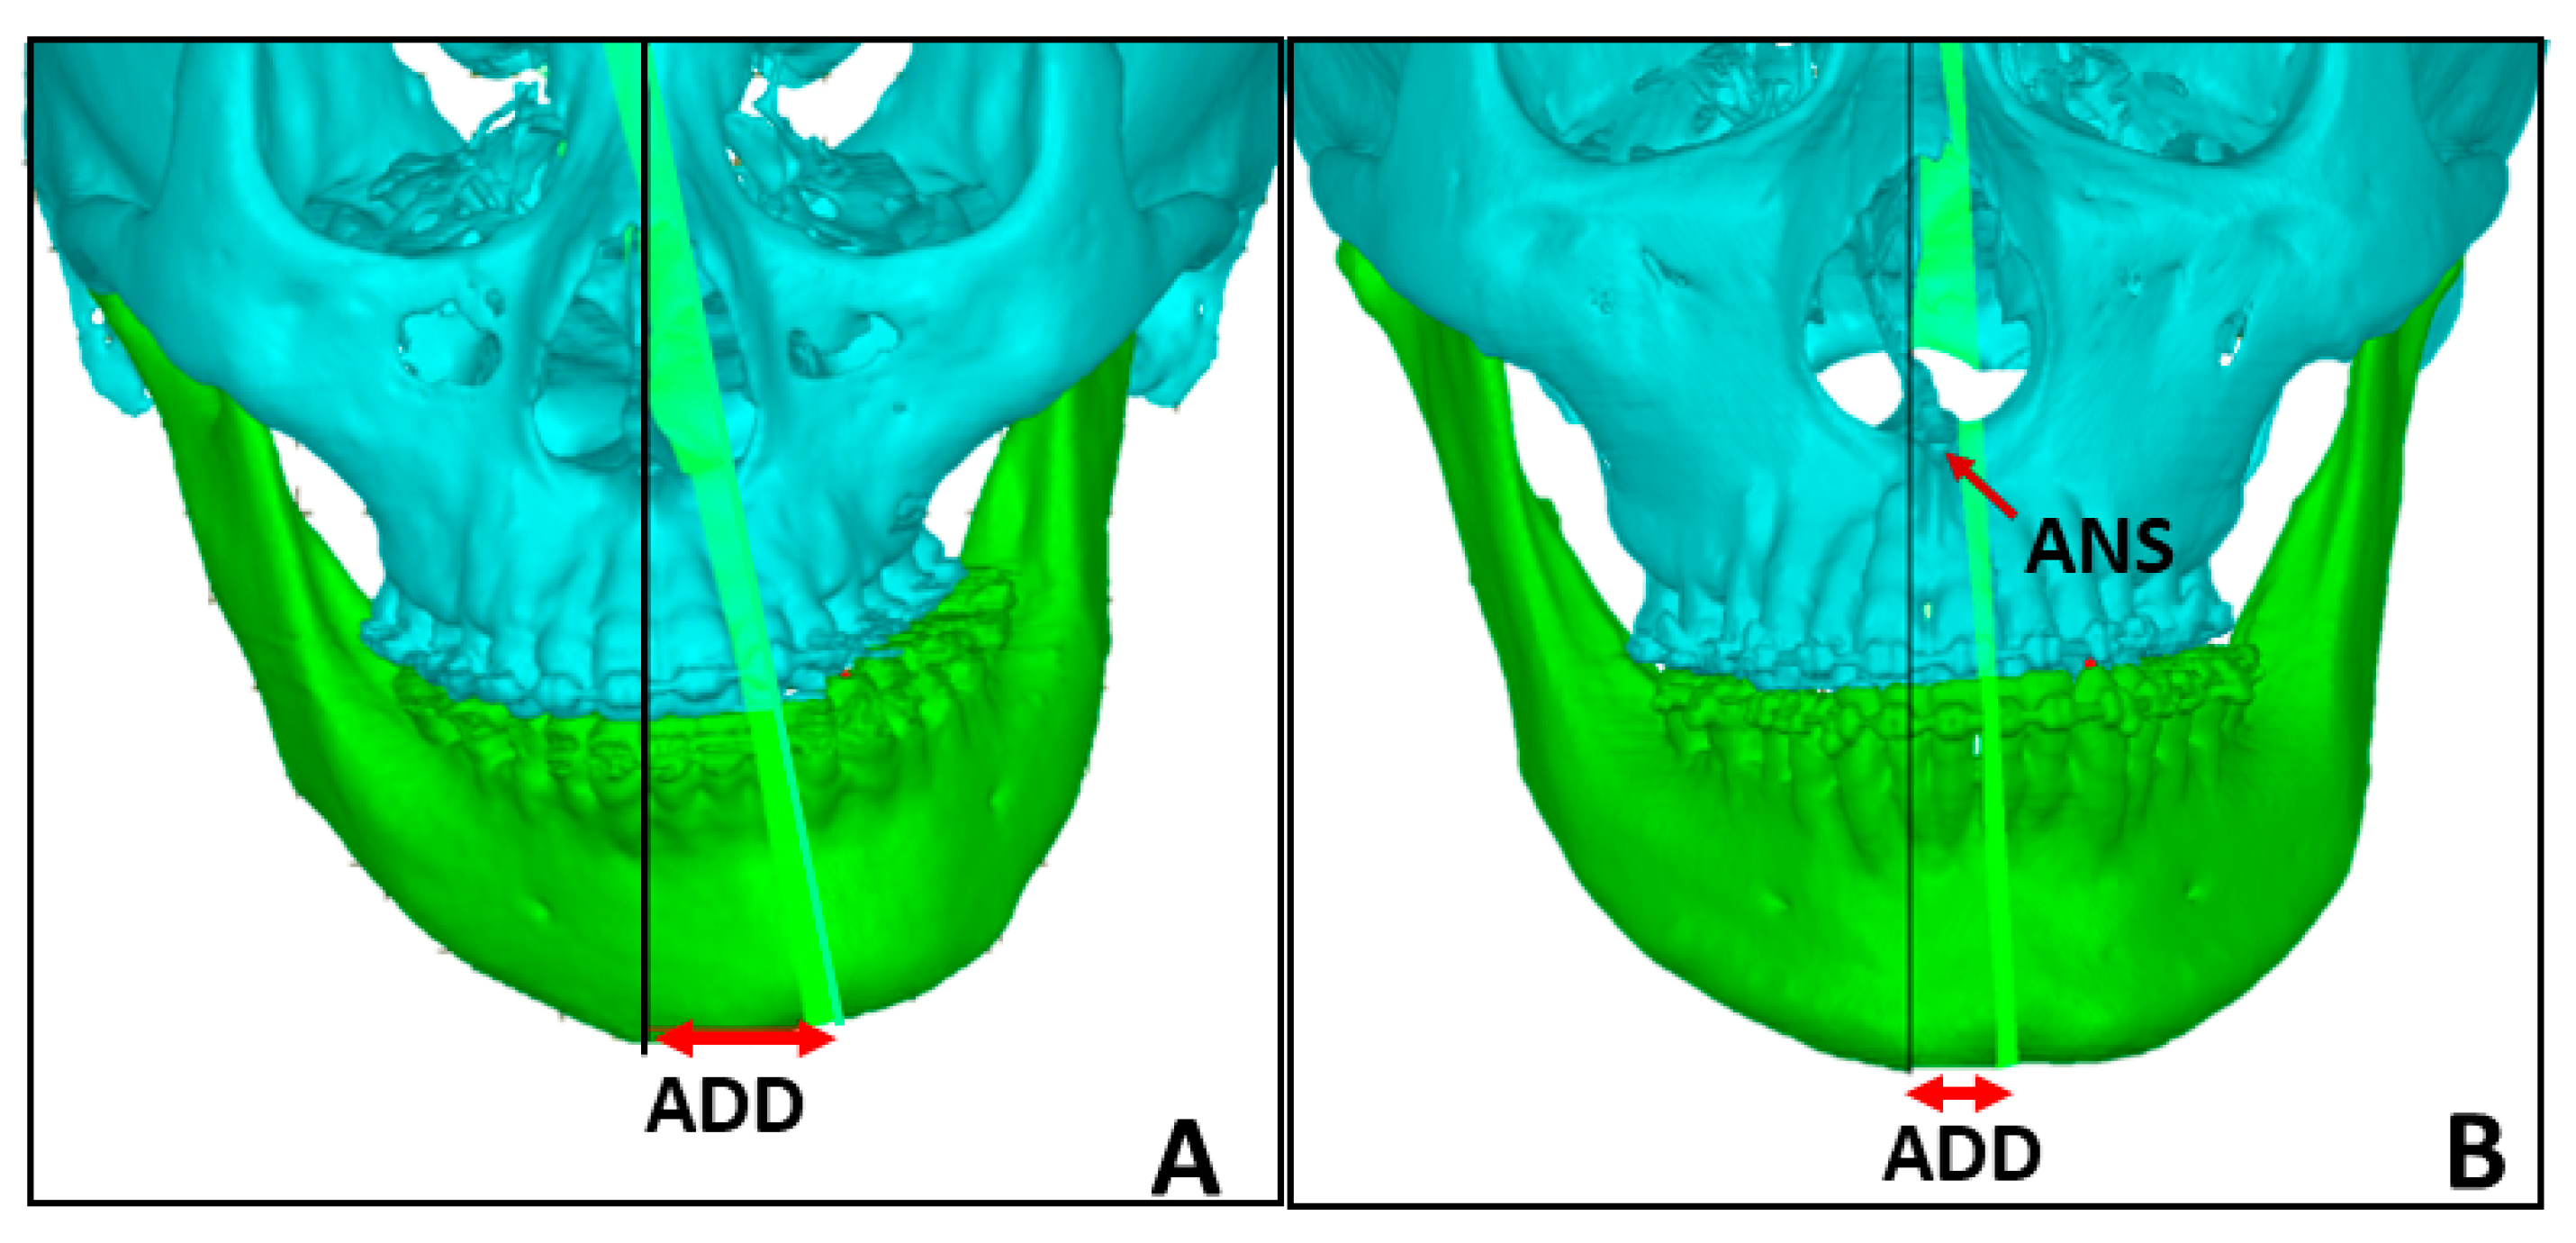
This retrospective study included 68 skeletal Class III subjects who underwent orthodontic treatment combined with orthognathic surgery (OGS) at National Cheng Kung University Hospital (NCKUH) from 2011 to 2022. Subjects with diagnosis of a craniofacial syndrome, such as cleft lip and palate, or a history of orthopedic treatment, such as maxillary skeletal expansion, were excluded. The sample included 35 males and 33 females with cervical vertebral maturation stage six [20] and a skeletal Class III relationship with an ANB angle of less than zero degrees. The subjects’ pre-surgical CT images (settings 120 kV and 70 to 80 mA; increment 0.7 mm; model Siemens S5VA70A, Siemens, Berlin, Germany) were used to computerize the midface and mandible optimal symmetry plane (OSP). The OSP is a computer-generated voxel-based median plane described by Wong et al. [21,22]. The subjects were divided into “symmetry” and “asymmetry” groups based on the anterior deviation distance (ADD), which is defined as the distance between the midface OSP and the lowest point of the mandible OSP, measured in millimeters [21,22] (Figure 1). Chin deviation to the left is presented as a positive value, whereas chin deviation to the right is presented as a negative value. Subjects with an absolute value of ADD less than or equal to 4 were placed in the symmetry group, and subjects with an absolute value of ADD greater than 4 were placed in the asymmetry group [21]. This study was approved by the Ethics Committee of National Cheng Kung University Hospital (IRB No. B-ER108-364).
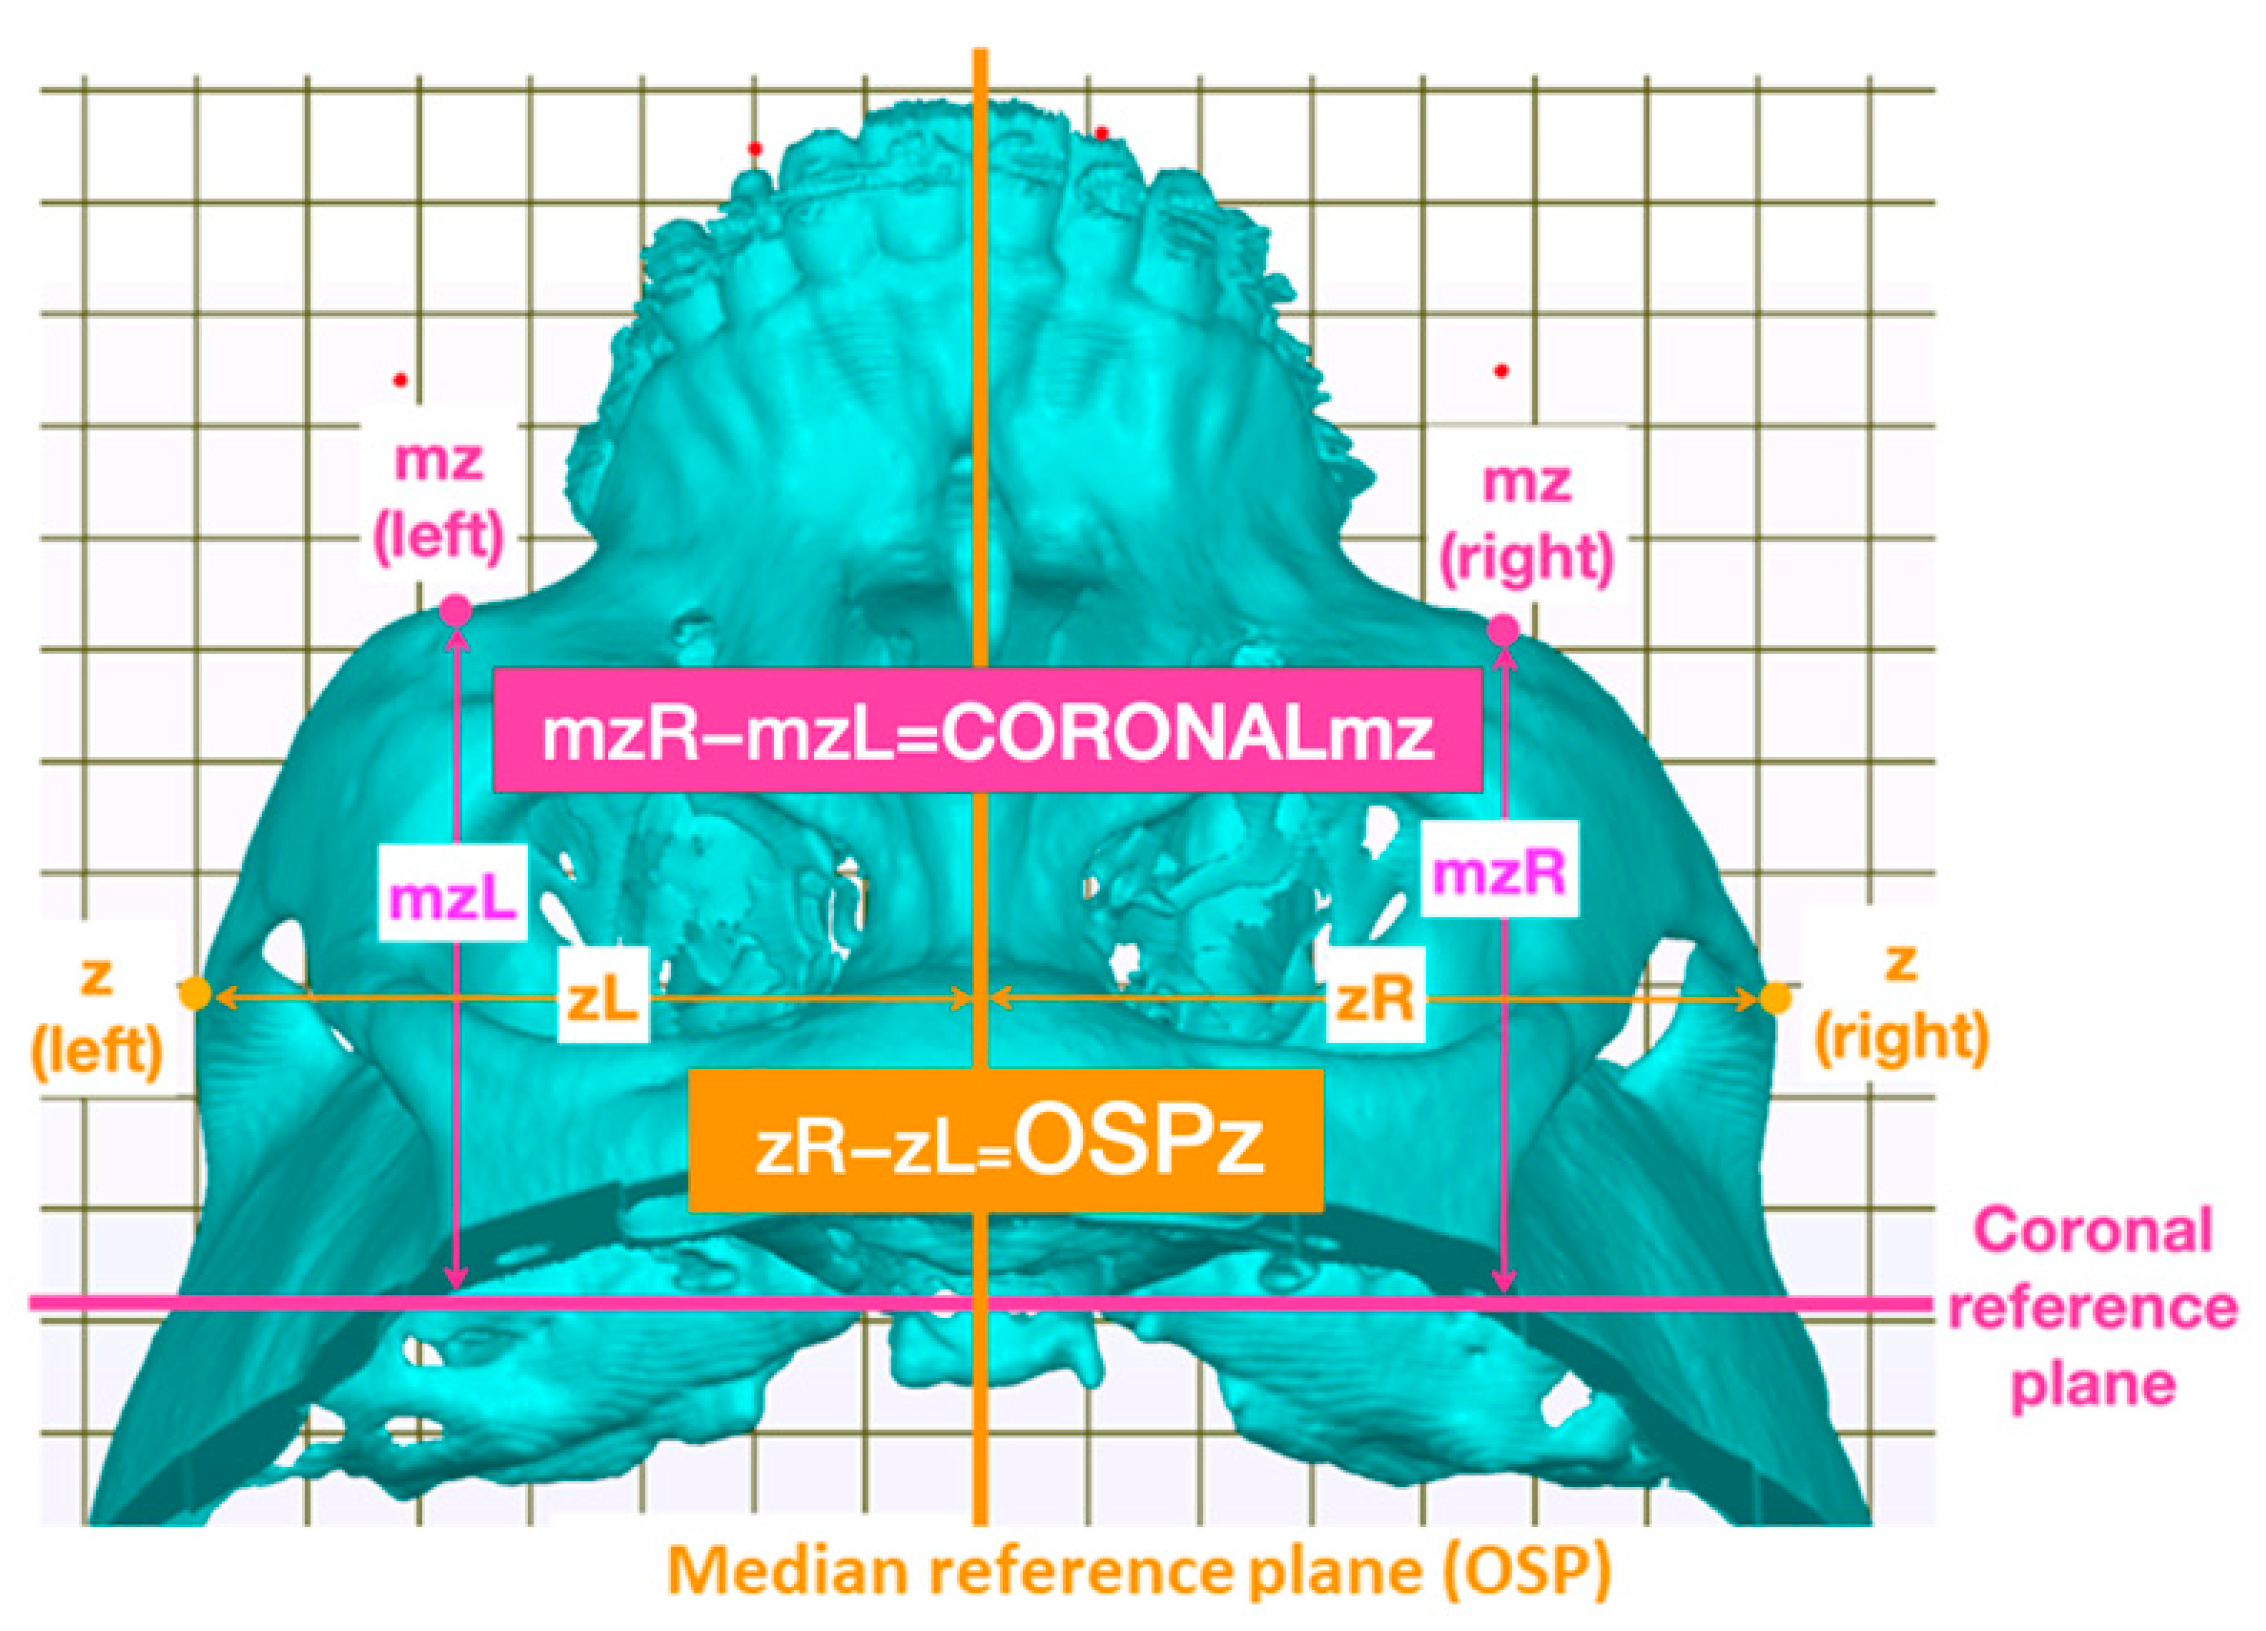
Two zygoma landmarks were chosen for their contribution to the facial outline, and two glenoid fossa landmarks were chosen to represent the glenoid fossa position. The first zygoma landmark is the z, the most lateral point of the zygomatic arch identified from a superior view [9]. The second landmark is the maxillozygion (mz), identified by Nechala et al. [23] as the prominence beneath the lateral third of the orbit when observed using a superior three-quarters view (Figure 2). For the two glenoid fossa landmarks, the zp point is the highest point on the curve of the zygomatic process at the temporomandibular joint, observed from a lateral view (Figure 3). The second glenoid fossa landmark is the most medial point of the fossa identified from an inferior view, represented as the gf point (Figure 4). The mid-sagittal reference plane used in this study is the OSP of the midface. The coronal reference plane is a plane passing through the center of the sella turcica, perpendicular to both the midface OSP and the Frankfurt horizontal plane. To quantify the midface asymmetry, the distances from the selected landmarks to the mid-sagittal and coronal reference planes were measured, and the differences between the right and left sides of the face were calculated. The greater the difference, the more significant the asymmetry. The distances from the right and left mz points to the coronal reference plane were measured. The distance from the left mz point to the coronal reference plane subtracted from the distance from the right mz point to the coronal reference plane is represented as CORONALmz, denoting both the respective reference plane and landmark. The distances from the right and left z points to the OSP were measured. Based on the same rationale, the distance from the left z point to the OSP subtracted from the distance from the right is represented as OSPz (Figure 2). For the two glenoid fossa landmarks, the distances to both the coronal reference plane and the mid-sagittal reference plane were measured (Figure 3 and Figure 4), and the difference in distance between the right and left sides of the face was calculated. All distances were measured in millimeters. A single investigator performed the measurements on CT scans using self-developed software, which was designed in collaboration with the NCKU Department of Mechanical Engineering. Analysis of all 68 subjects using this software generated six measurements for each subject: the OSPz, CORONALmz, OSPzp, CORONALzp, OSPgf, and CORONALgf (Table 1).
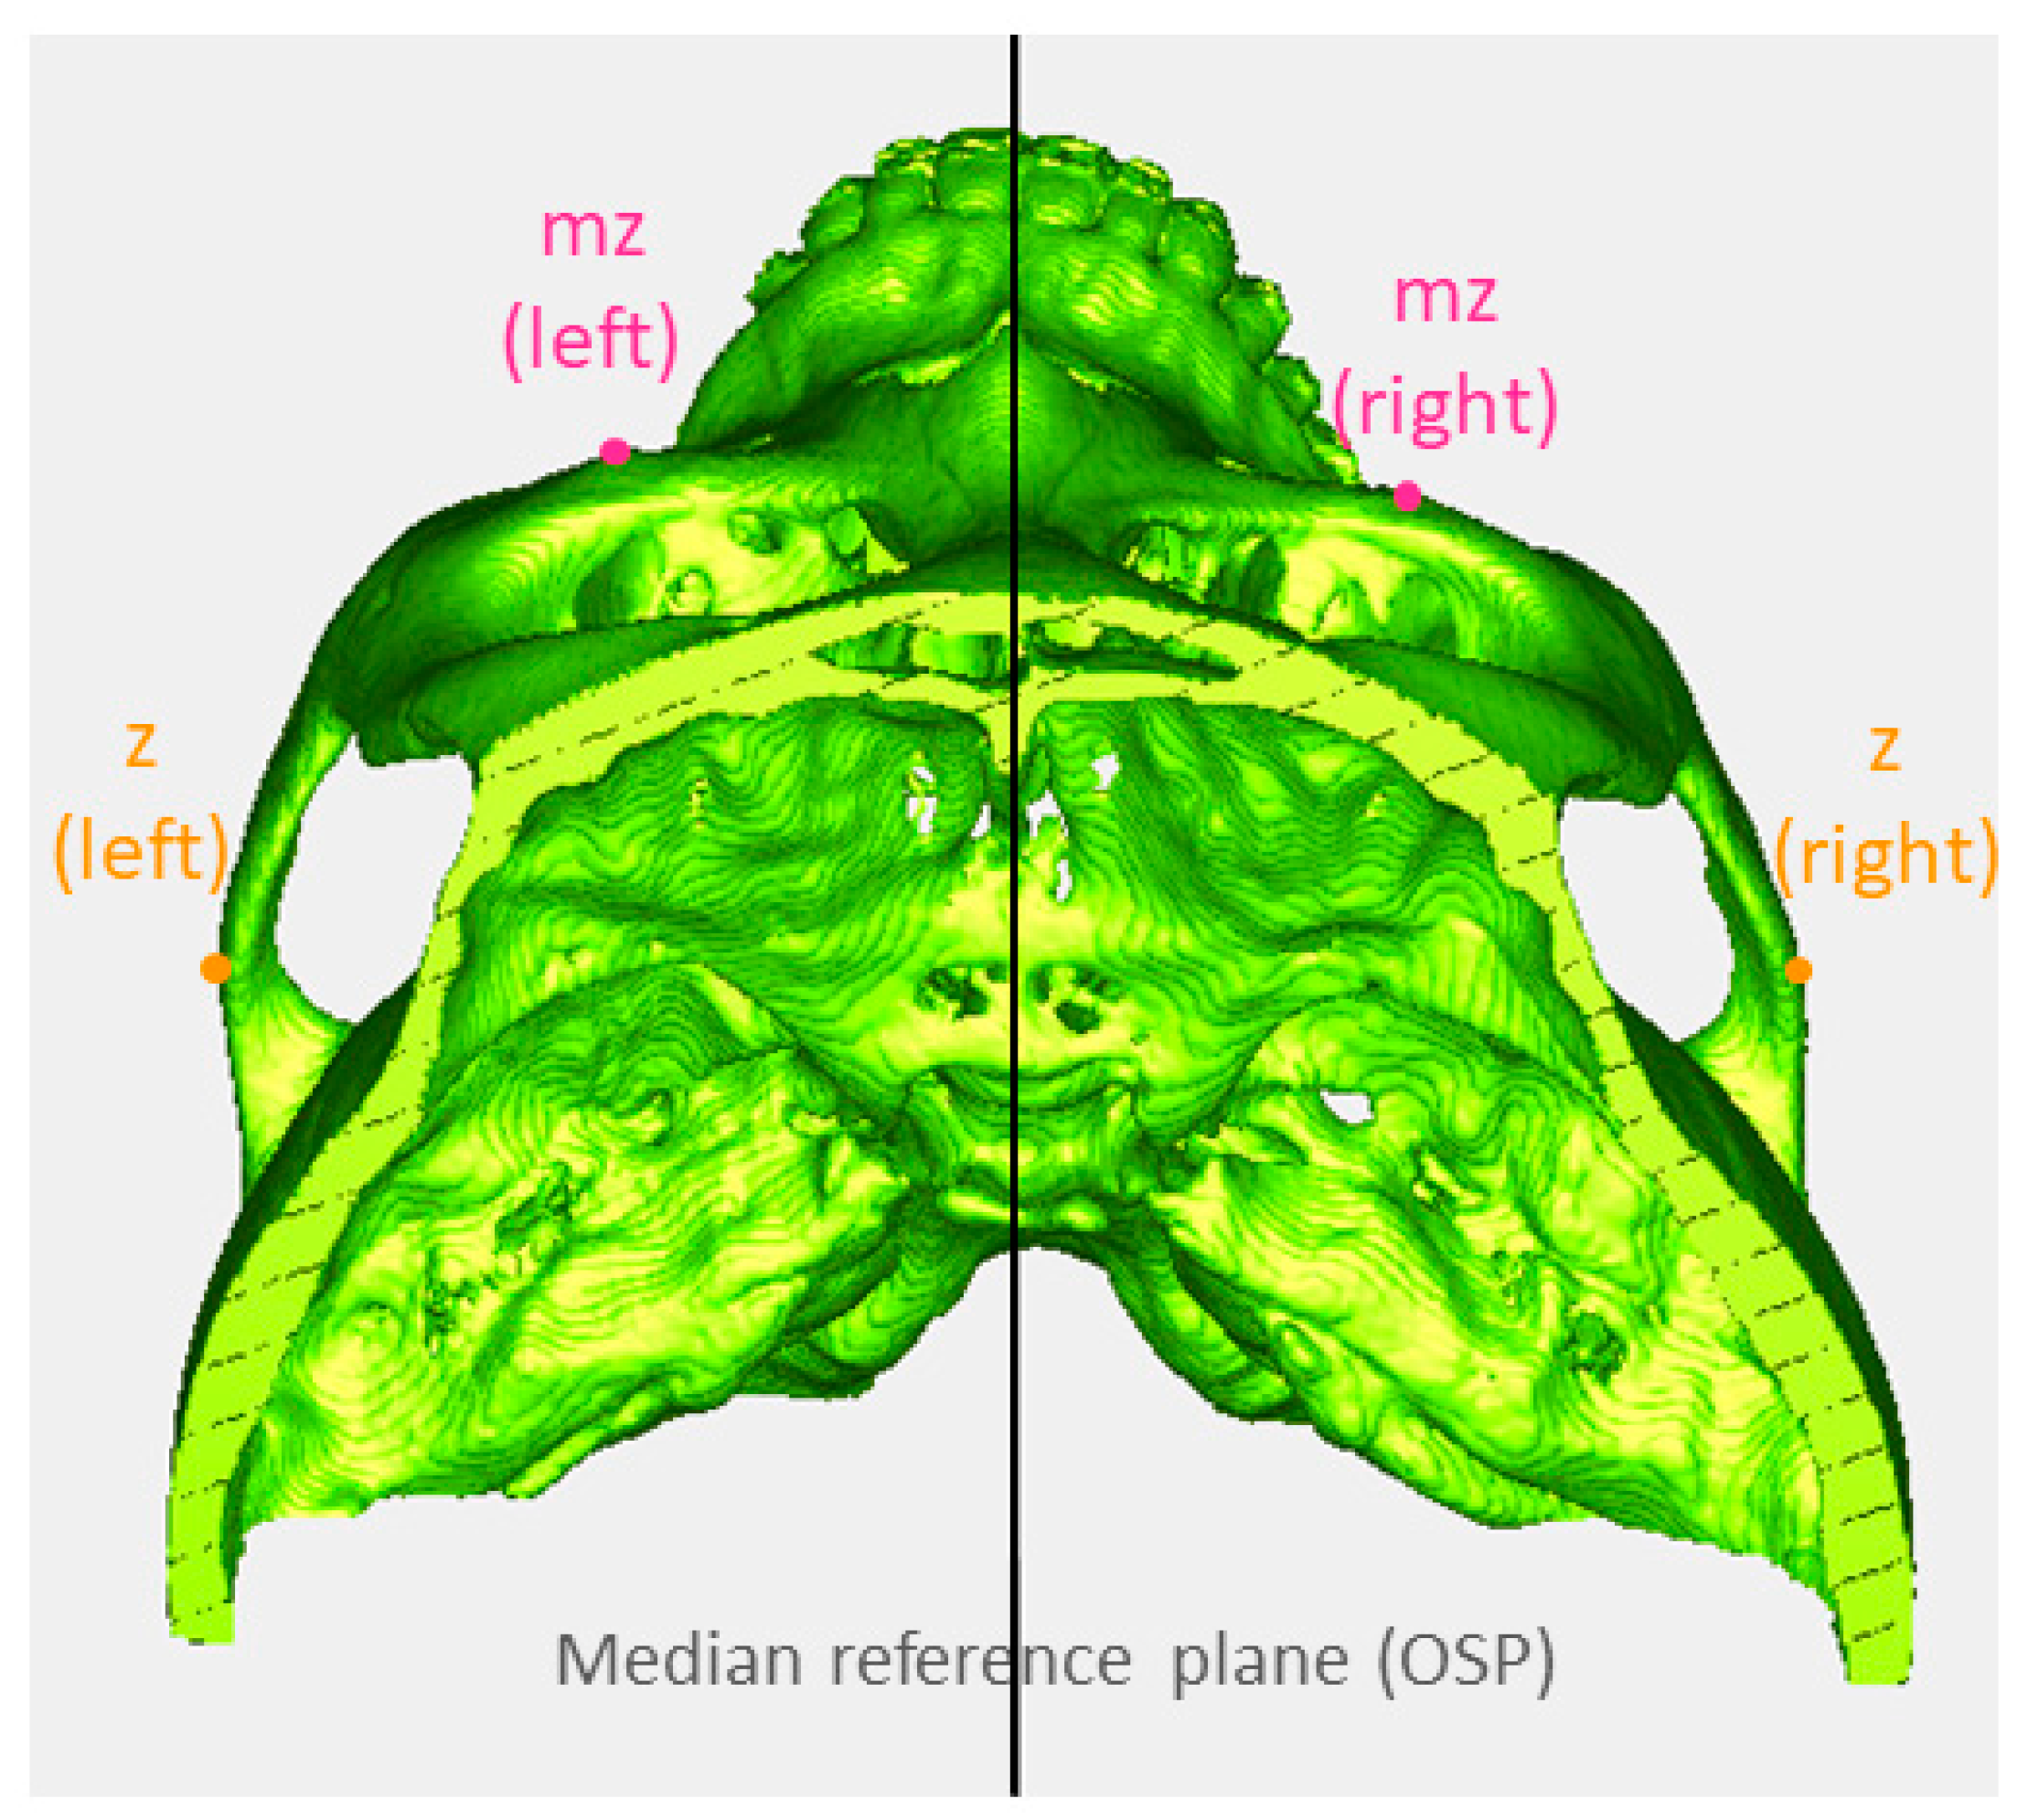
To investigate the prevalence of recognizable malar asymmetry, the prevalence of z and mz differences greater than 3 mm was established (Figure 5) [24]. The anterior nasal spine (ANS) deviation was defined as the ANS not coinciding with the mid-sagittal reference plane. The prevalence of ANS deviation was also calculated (Figure 1B). Statistical analysis was performed with SPSS statistical software (version 19.0; IBM, Armonk, NY, USA). Spearman correlation was used to analyze the relationship between midface asymmetry and the severity of mandible asymmetry. A Mann–Whitney U test was performed to compare differences in midface asymmetry between the asymmetry and symmetry groups of the mandible. p values of <0.05 were considered statistically significant. To confirm intra-examiner reliability, the intraclass correlation coefficient was analyzed for all data measured by the same examiner two months apart.
3. Results
The intraclass correlation coefficient ranged from 0.72 to 0.97, indicating good to excellent intra-examiner reliability. Within the study group of 68 skeletal Class III subjects, 31 subjects were assigned to the mandible symmetry group, comprising 16 males and 15 females. The mandible asymmetry group comprised 37 subjects, including 19 males and 18 females. In the asymmetry group, 16 subjects showed chin deviation to the left, and 21 subjects showed chin deviation to the right. The absolute ADD values for the symmetry group averaged 1.57 and ranged from 0.07 to 3.09. For the asymmetry group, the absolute ADD values averaged 8.87 and ranged from 4.68 to 17.82 (Table 2).
3.1. The Prevalence of Midface Asymmetry
In assessing the prevalence of recognizable malar asymmetry, no z differences greater than 3 mm were found. For the mz landmark, 2 of 35 male subjects (one in each group) and 3 of 33 female subjects (one in the symmetry group and two in the asymmetry group) showed mz differences greater than 3 mm (Figure 5), resulting in an overall prevalence of 7.35%. In assessing the prevalence of ANS deviation, 10 out of 31 subjects (32.26%, in the symmetry group) and 16 out of 37 subjects (43.24%, in the asymmetry group) showed ANS deviation of 1–3 mm, resulting in an overall prevalence of 38.24%.
3.2. The Correlation between Chin Deviation and Midface Asymmetry
Spearman correlation analysis was used to elucidate the relationship between chin deviation and midface asymmetry (Table 3). In subjects with chin deviation to the right, there was a moderate negative correlation between ADD and OSPz, OSPzp, and CORONALzp.
Examining the differences between the symmetry and asymmetry groups with respect to the mandible (Table 4) revealed larger values in the mandible asymmetry group. However, no statistically significant difference between the two groups was found. Further analysis based on sex showed that there were no statistical differences between the symmetry and asymmetry groups for the male subjects (Table 5). Among the female subjects, the OSPgf was found to be significantly greater in the asymmetry group (Table 6). Regarding the difference among sexes in asymmetry subjects, no significant difference in midface asymmetry was found (Table 7).
4. Discussion
This study evaluated the characteristics of midface asymmetry, including the zygoma, nose, and glenoid fossa position, and assessed the correlation between midface asymmetry and mandible asymmetry in skeletal Class III deformities. The prevalence of malar asymmetry in this study was found to be 7.35% and was present in both the symmetry and asymmetry groups. In a retrospective survey, 34% of the patients who visited a dentofacial clinic were found to have clinically apparent facial asymmetry, with the asymmetry affecting the midface in 36% of the cases [3]. In Moubayed et al.’s study, the prevalence of malar asymmetry was found to be 40.5% [11]. The prevalence of malar asymmetry in these two studies exceeded our findings. The reasons for this might be related to differences in the definition of asymmetry and the chosen reference plane. A deviation greater than 2–4 mm has previously been used as the threshold for asymmetry that is perceptible to an observer, with 4 mm for the chin and 3 mm for the eyebrow and oral commissure [24]. The present study defined z and mz differences greater than 3 mm as recognizable midface asymmetry. Midface landmark differences greater than 3 mm were all related to the mz, which represents a protuberance of the midface. In contrast, Moubayed et al. used a 2 mm difference as the threshold for malar asymmetry [11]. Another possible influencing factor is the various mid-sagittal reference planes used [8,9,10,11,13,14,15,16,17,18]. Mid-sagittal reference planes are based on specific anatomical landmarks, such as the mid-point of the bilateral foramen spinosa, the nasion, the ANS, or the subspinale. Using the ANS as a sagittal reference point may introduce bias and influence the measurement outcomes, given that our study and Haraguchi et al. have both shown a high prevalence of ANS deviation [25]. A previous study has demonstrated that the nose plays an important role in the perception of symmetry [26]. Subjects with nose deviations usually exhibited compensatory head posture. Therefore, the clinician should orient the patient’s head posture to eliminate the masking effect of nose asymmetry [27]. For those who have a nose deviation but are unwilling to undergo nose surgery, the median plane selected should be discussed with patients before OGS surgical planning to avoid a misleading treatment plan.
Regarding the relationship between chin deviation and midface asymmetry, a moderate negative correlation was found between ADD and OSPz, as well as between ADD and OSPzp, in subjects with chin deviations to the right. The z point is the widest point on the zygomatic arch, and the zp point is the highest point on the curve of the temporomandibular joint, also related to the zygomatic arch. This indicates that the more the chin deviates towards the right, the greater the distance from the left z and zygomatic process to the reference compared to the right side. This means that a greater chin deviation is associated with a higher probability of the zygomatic process being wider on the non-shifted side, which may be related to increased muscle tonicity on the non-shifted side of the craniofacial complex and lead to osseous growth. Correspondingly, a previous study by López-Buitrago found a greater distance from the midsagittal plane to the malar on the non-shifted side in patients with facial asymmetry [28]. Another possible reason could be explained by a past study conducted by Woo [29], which demonstrated that the malar bone is the only cranial bone where the left side is dominant. However, their measurements were made on skulls without significant asymmetry and were not correlated with mandible asymmetry. A moderate negative correlation was also found between ADD and CORONALzp in patients with chin deviated to the right. These findings indicate a more anterior position of the right zp point compared to the left zp point in patients with chin deviated to the right. This contrasts the finding from Oo et al. [15]. The differences may be related to dissimilar reference systems, sample grouping, or skeletal classification of subjects. Increasing the sample size in future studies will be advantageous for further investigation of the tendency.
When comparing the symmetry and asymmetry groups regarding the mandible, no significant differences in the midface landmarks were found. However, when stratified by sex, the absolute value of OSPgf was found to be significantly greater in female subjects in the asymmetry group than in the symmetry group. This implies that the glenoid fossa may be further away from the mid-sagittal plane on the non-shifted side in female Class III subjects. An asymmetrical glenoid fossa position in patients with chin deviations has been reported in previous studies [15,16,19]. However, the present study found that in the lateral direction, the glenoid fossa was positioned further from the mid-sagittal plane on the non-shifted side, whereas other studies did not find significant differences [15,16]. In the anteroposterior direction, the findings of Kim et al. were congruent to that of the present study, with no significant differences found in the glenoid fossa position. In contrast, Oo et al. and Marianetti et al. found a more anterior position of the glenoid fossa on the non-shifted side [15,19]. We investigated the underlying reasons for the observed sex-specific difference that was limited to female asymmetry subjects in the present study. Further analysis of the sex composition of the previous studies revealed that they all had more female subjects in the asymmetry group. In contrast, the present study had more male subjects in the asymmetry group. Sex may indeed play a role in the growth and adaptive remodeling of the glenoid fossa; however, further investigation with a larger sample size is needed to confirm this postulation. Another possible influencing factor is the heterogeneity in the sagittal reference planes used in previous studies [8,9,10,11,13,14,15,16,17,18], which may introduce bias and influence the study outcomes. In the present study, a voxel-based median reference plane was automatically generated by computing the best pairing of the bony voxels; this method has been proven to be more stable and reliable than other landmark methods [22,30].
One limitation of the present study is that it focused on the hard tissue of the craniofacial complex, and the masking effect of overlying soft tissue was not taken into consideration. Further research incorporating a correlation between skeletal and soft tissue asymmetries is required to draw definite conclusions in this regard.
5. Conclusions
The overall prevalence of recognizable malar asymmetry and ANS deviation is 7.35% and 38.24%, respectively, and neither is limited to patients with mandibular asymmetry. In addition, the more severely the chin is shifted, the higher the probability that the most lateral point of the zygomatic arch is wider on the non-shifted side of the face. Furthermore, a significantly greater asymmetrical position of the glenoid fossa was found in female skeletal Class III subjects with a mandibular shift. Therefore, in clinical settings, pre-surgical case-by-case evaluation is essential for understanding the midface skeletal characteristics of Class III patients with mandible asymmetry, thereby providing patients with realistic expectations and optimizing surgical outcomes and patient satisfaction.
Author Contributions
Conceptualization, C.-J.C. and M.-Y.C.; methodology, C.-J.C. and M.-Y.C.; software, J.-J.F.; validation, C.-Y.W.; resources, T.-Y.W. and M.-Y.C.; data curation, C.-Y.W.; writing—original draft preparation, C.-Y.W. and C.-J.C.; writing—review and editing, C.-J.C.; supervision, T.-Y.W. and J.-J.F. All authors have read and agreed to the published version of the manuscript.
Funding
This research received no external funding.
Institutional Review Board Statement
This study has been reviewed and approved by the Institutional Review Board of National Cheng Kung University Hospital (IRB No. B-ER-108-364) on 2 November 2021, ensuring adherence to ethical standards.
Informed Consent Statement
The study does not reveal personal data.
Data Availability Statement
Data available on request due to restrictions.
Acknowledgments
The authors would like to thank Yu-Ching Hsiao from the NCKU Department of Mechanical Engineering for the development of the measurement software used in this study. The authors would also like to thank Sheng-Hsiang Lin and Wan-Ni Chen for providing statistical consulting services from the Biostatistics Consulting Center, Clinical Medicine Research Center, and National Cheng Kung University Hospital.
Conflicts of Interest
The authors declare no conflicts of interest.
References
- Zide, B.; Grayson, B.; McCarthy, J.G. Cephalometric analysis for upper and lower midface surgery: Part II. Plast. Reconstr. Surg. 1981, 68, 961–968. [Google Scholar] [CrossRef] [PubMed]
- Mertens, I.; Siegmund, H.; Grüsser, O.J. Gaze motor asymmetries in the perception of faces during a memory task. Neuropsychology 1993, 31, 989–998. [Google Scholar] [CrossRef] [PubMed]
- Severt, T.R.; Proffit, W.R. The prevalence of facial asymmetry in the dentofacial deformities population at the University of North Carolina. Int. J. Adult Orthodon. Orthognath. Surg. 1997, 12, 171–176. [Google Scholar] [PubMed]
- Lu, S.M.; Bartlett, S.P. On facial asymmetry and self-perception. Plast. Reconstr. Surg. 2014, 133, 873e. [Google Scholar] [CrossRef] [PubMed]
- Padwa, B.L.; Kaiser, M.O.; Kaban, L.B. Occlusal Cant in the frontal plane as a reflection of facial asymmetry. J. Oral. Maxillofac. Surg. 1997, 55, 811–816. [Google Scholar] [CrossRef] [PubMed]
- Masuoka, N.; Muramatsu, A.; Ariji, Y. Discriminative thresholds of cephalometric indexes in the subjective evaluation of facial asymmetry. Am. J. Orthod. Dentofac. Orthop. 2007, 131, 609–613. [Google Scholar] [CrossRef] [PubMed]
- Lee, H.Y.; Bayome, M.; Kim, S.H.; Kim, K.B.; Brhrents, R.G.; Kook, Y.A. Mandibular dimensions of subjects with asymmetric skeletal Class III malocclusion and normal occlusion compared with cone-beam computed tomography. Am. J. Orthod. Dentofac. Orthop. 2012, 142, 179–185. [Google Scholar] [CrossRef] [PubMed]
- Vig, P.S.; Hewitt, A.B. Asymmetry of the human facial skeleton. Angle Orthod. 1975, 45, 125–129. [Google Scholar] [PubMed]
- Ferrario, V.F.; Sforza, C.; Ciusa, V.; Dellavia, C.; Tartaglia, G.M. The effect of gender and age on facial asymmetry in healthy subjects: A cross-sectional study from adolescence to mid-adulthood. J. Oral. Maxillofac. Surg. 2001, 59, 382–388. [Google Scholar] [CrossRef]
- Švábová, P.; Matláková, M.; Beňuš, R.; Chovancová, M.; Masnicová, S. The relationship between biological parameters and facial soft tissue thickness measured by ultrasound and its forensic implications. Med. Sci. Law 2023, 64, 23–31. [Google Scholar] [CrossRef]
- Moubayed, S.P.; Duong, F.; Ahmarani, C.; Rahal, A. A novel technique for malar eminence evaluation using 3-dimensional computed tomography. Arch. Facial. Plast. Surg. 2012, 14, 403–407. [Google Scholar] [CrossRef] [PubMed]
- Proffit, W.R.; Fields, H.; Larson, B.; Sarver, D.M. Contemporary Orthodontics, 6th ed.; Elsevier Health Sciences: Amsterdam, The Netherlands, 2019. [Google Scholar]
- Lee, J.S.; Xi, T.; Kwon, T.G. Three-dimensional analysis of mandibular condyle position in patients with deviated mandibular prognathism. Int. J. Oral. Maxillofac. Surg. 2017, 46, 1052–1058. [Google Scholar] [CrossRef] [PubMed]
- Ikeda, M.; Miyamoto, J.J.; Takada, J.; Moriyama, K. Association between 3-dimensional mandibular morphology and condylar movement in subjects with mandibular asymmetry. Am. J. Orthod. Dentofac. Orthop. 2017, 151, 324–334. [Google Scholar] [CrossRef] [PubMed]
- Oo, L.T.; Miyamoto, J.J.; Takada, J.J.; Moriyama, K. Correlation between the position of the glenoid fossa and condylar translational movement in skeletal Class III mandibular asymmetry patients. Eur. J. Orthod. 2022, 44, 294–302. [Google Scholar]
- Kim, J.Y.; Kim, B.J.; Park, K.H.; Huh, J.K. Comparison of volume and position of the temporomandibular joint structures in patients with mandibular asymmetry. Oral. Surg. Oral Med. Oral Pathol. Oral Radiol. 2016, 122, 772–780. [Google Scholar] [CrossRef] [PubMed]
- Kwon, T.G.; Park, H.; Ryoo, H.M.; Lee, S.H. A comparison of craniofacial morphology in patients with and without facial asymmetry-a three-dimensional analysis with computed tomography. Int. J. Oral. Maxillofac. Surg. 2006, 35, 43–48. [Google Scholar] [CrossRef] [PubMed]
- Hashimoto, T.; Kuroda, S.; Lihua, E.; Tanimoto, Y.; Miyawaki, S.; Takano-Yamamoto, T. Correlation between craniofacial and condylar path asymmetry. J. Oral. Maxillofac. Surg. 2008, 66, 2020–2027. [Google Scholar] [CrossRef]
- Marianetti, T.M.; Marianetti, S.; Gasparini, G.; Pelo, S. Correlation between cranial base morphology and the position of the glenoid fossa in patients with facial asymmetry. J. Craniofac. Surg. 2014, 25, 1190–1194. [Google Scholar] [CrossRef] [PubMed]
- Baccetti, T.; Franchi, L.; McNamara, J.A., Jr. The cervical vertebral maturation (CVM) method for the assessment of optimal treatment timing in dentofacial orthopedics. Semin. Orthod. 2005, 11, 119–129. [Google Scholar] [CrossRef]
- Wong, T.Y.; Liu, J.K.; Fang, J.J.; Wu, T.C.; Tu, Y.H. Use of the matching optimal symmetry plane method in planning surgical correction of facial asymmetry—A preliminary report of 20 patients. J. Oral. Maxillofac. Surg. 2014, 72, 1180.e1–1180.e13. [Google Scholar] [CrossRef]
- Wong, T.Y.; Liu, J.K.; Wu, T.C.; Tu, Y.H.; Chen, K.C.; Fang, J.J.; Cheng, K.H.; Lee, J.W. Plane-to-plane analysis of mandibular misalignment in patients with facial asymmetry. Am. J. Orthod. Dentofac. Orthop. 2018, 153, 70–80. [Google Scholar] [CrossRef] [PubMed]
- Nechala, P.; Mahoney, J.; Farkas, L.G. Maxillozygional anthropometric landmark: A new morphometric orientation point in the upper face. Ann. Plast. Surg. 1998, 41, 41402–41409. [Google Scholar] [CrossRef] [PubMed]
- Choi, K.Y. Analysis of facial asymmetry. Arch. Craniofac. Surg. 2015, 16, 1. [Google Scholar] [CrossRef] [PubMed]
- Haraguchi, S.; Takada, K.; Yasuda, Y. Facial asymmetry in subjects with skeletal Class III deformity. Angle Orthod. 2002, 72, 28–35. [Google Scholar] [PubMed]
- Meyer-Marcotty, P.; Stellzig-Eisenhauser, A.; Bareis, U.; Hartmann, J.; Kochel, J. Three-dimensional perception of facial asymmetry. Eur. J. Orthod. 2011, 33, 647–653. [Google Scholar] [CrossRef] [PubMed]
- Srivastava, D.; Singh, H.; Mishra, S.; Sharma, P.; Kapoor, P.; Chandra, L. Facial asymmetry revisited: Part I-diagnosis and treatment planning. J. Oral Biol. Craniofac. Res. 2018, 8, 7–14. [Google Scholar] [CrossRef] [PubMed]
- López-Buitrago, D.F. Diferencias en la morfología ósea entre el lado desplazado y contralateral en pacientes con asimetría facial: Estudio 3D-TC. CES Odonto. 2020, 33, 23–38. [Google Scholar] [CrossRef]
- Woo, T.L. On the asymmetry of the human skull. Biometrika 1931, 22, 324–352. [Google Scholar] [CrossRef]
- Fang, J.J.; Wong, T.Y.; Liu, J.K.; Zhang, Y.X.; Leong, I.F.; Chen, K.C. Evaluation of mandibular contour in patients with significant facial asymmetry. Int. J. Oral. Maxillofac. Surg. 2016, 45, 922–931. [Google Scholar] [CrossRef]
Figure 1.
Pre-surgical CT images from two subjects were used to computerize the midface (black) and mandible (green) optimal symmetry plane (OSP). The OSP is a computer-generated voxel-based median plane. Anterior deviation distance (ADD) is the distance between the midface OSP and the lowest point of the mandible OSP, measured in millimeters [21,22]. (A) a patient with mandible deviation to the left, with ANS coinciding with the mid-sagittal reference plane (midface OSP); (B) a patient with mandible deviation and ANS deviation to the left side.

Figure 2.
The measurements and outcomes of midface landmarks. z: zygion, marked by orange points; mz: maxillozygion, marked by pink points. The distance from the left mz point to the coronal reference plane subtracted from the distance from the right mz point to the coronal reference plane is represented as CORONALmz. The distances from the right and left z points to the OSP were measured. Based on the same rationale, the distance from the left z point to the OSP subtracted from the distance from the right is represented as OSPz. OSP: optimal symmetry plane.

Figure 3.
Measurements of bilateral zp landmarks in lateral and anteroposterior directions. (A) The distance from the left zp points to the median reference plane (midface OSP); and (B) the distance from the left zp points to the coronal reference plane. zp: the highest point on the curve of the zygomatic process at the temporomandibular joint from the lateral view, marked by the purple point. OSP: optimal symmetry plane.

Figure 4.
Measurements of bilateral gf landmarks. OSPgf is the distance from the left gf point to OSP subtracted from the distance of the right gf point to OSP. CORONALgf is the distance from the left gf point to the coronal reference plane subtracted from the distance from the right gf point to the coronal reference plane. OSP: optimal symmetry plane; gf: the most medial point of the glenoid fossa identified from the inferior view, marked by red points.

Figure 5.
A subject with recognizable asymmetry of the midface. The value of CORONALmz in this patient is −3.45. z: zygion, marked by orange points; mz: maxillozygion, marked by pink points. OSP: optimal symmetry plane.
Figure 5.
A subject with recognizable asymmetry of the midface. The value of CORONALmz in this patient is −3.45. z: zygion, marked by orange points; mz: maxillozygion, marked by pink points. OSP: optimal symmetry plane.


Table 1.
Definition of four landmarks and six measurement outcomes.
| Definition | |
|---|---|
| z | Zygion, the most lateral point of the zygomatic arch identified from a superior view [9]. |
| mz | Maxillozygion, the prominence beneath the lateral third of the orbit observed using a superior three-quarters view [23]. |
| zp | The highest point on the curve of the zygomatic process at the temporomandibular joint from a lateral view. |
| gf | The most medial point of the glenoid fossa identified from an inferior view. |
| OSPz | Distance from left z point to OSP subtracted from distance of right z point to OSP. |
| CORONALmz | Distance from left mz point to coronal reference plane subtracted from distance from right mz point to coronal reference plane. |
| OSPzp | Distance from left zp point to OSP subtracted from distance from right zp point to OSP. |
| CORONALzp | Distance from left zp point to coronal reference plane subtracted from distance from right zp point to coronal reference plane. |
| OSPgf | Distance from left gf point to OSP subtracted from distance from right zp point to OSP. |
| CORONALgf | Distance from left gf point to coronal reference plane subtracted from distance from right gf point to coronal reference plane. |
OSP, optimal symmetry plane.
Table 2.
General information of study samples. (ADD: Anterior deviation distance).
| Mandible Symmetry | Mandible Asymmetry | |||
|---|---|---|---|---|
| N | 31 | 37 | ||
| Sex composition | Male | Female | Male | Female |
| 16 | 15 | 19 | 18 | |
| Chin deviation ADD (mm) | Mean | Range | Mean | Range |
| 1.72 | 0.25–3.67 | 8.87 | 4.68–17.82 | |
Table 3.
The relationship between midface asymmetry and mandible asymmetry with Spearman correlation analysis.
Table 3.
The relationship between midface asymmetry and mandible asymmetry with Spearman correlation analysis.
| Chin Deviation to the Left (n = 21) | Chin Deviation to the Right (n = 16) | |||
|---|---|---|---|---|
| ADD | r | p | r | p |
| OSPz | −0.055 | 0.812 | −0.482 | 0.059 |
| CORONALmz | 0.245 | 0.285 | −0.041 | 0.880 |
| OSPzp | −0.067 | 0.773 | −0.441 | 0.087 |
| CORONALzp | −0.224 | 0.329 | −0.568 | 0.022 * |
| OSPgf | −0.049 | 0.834 | −0.268 | 0.316 |
| CORONALgf | −0.108 | 0.642 | −0.279 | 0.295 |
ADD, anterior deviation distance. * p < 0.05.
Table 4.
Comparison of midface asymmetry between the asymmetry and symmetry groups with respect to the mandible, regardless of sex.
Table 4.
Comparison of midface asymmetry between the asymmetry and symmetry groups with respect to the mandible, regardless of sex.
| Mandible Asymmetry (n = 37) | Mandible Symmetry (n = 31) | ||||
|---|---|---|---|---|---|
| Median | IQR | Median | IQR | p | |
| OSPz | 0.66 | (0.35, 1.08) | 0.49 | (0.16, 1.16) | 0.409 |
| CORONALmz | 1.38 | (0.59, 2.35) | 1.43 | (0.63, 2.37) | 0.941 |
| OSPzp | 1.48 | (0.98, 2.26) | 1.30 | (0.56, 2.33) | 0.768 |
| CORONALzp | 1.14 | (0.48, 1.85) | 0.85 | (0.50, 1.30) | 0.223 |
| OSPgf | 1.64 | (0.98, 2.49) | 1.03 | (0.33, 2.01) | 0.076 |
| CORONALgf | 1.50 | (0.87, 2.01) | 1.43 | (0.63, 2.36) | 0.768 |
Results of Mann–Whitney U test with absolute values used. IQR, inter-quartile range.
Table 5.
Comparison of midface asymmetry among male subjects in the asymmetry and symmetry groups with respect to the mandible.
Table 5.
Comparison of midface asymmetry among male subjects in the asymmetry and symmetry groups with respect to the mandible.
| Male | |||||
|---|---|---|---|---|---|
| Mandible Asymmetry (n = 19) | Mandible Symmetry (n = 16) | ||||
| Median | IQR | Median | IQR | p | |
| OSPz | 0.63 | (0.29, 1.08) | 0.36 | (0.10, 1.20) | 0.282 |
| CORONALmz | 1.46 | (0.72, 2.46) | 1.18 | (0.51, 1.98) | 0.253 |
| OSPzp | 1.48 | (0.55, 2.05) | 1.02 | (0.59, 2.04) | 0.679 |
| CORONALzp | 0.88 | (0.46, 2.23) | 0.92 | (0.38, 1.35) | 0.345 |
| OSPgf | 1.22 | (0.55, 2.67) | 0.89 | (0.50, 2.18) | 0.456 |
| CORONALgf | 1.54 | (0.70, 2.39) | 1.71 | (1.16, 2.48) | 0.477 |
Results of Mann–Whitney U test with absolute values used. IQR, inter-quartile range.
Table 6.
Comparison of midface asymmetry among female subjects in the asymmetry and symmetry groups with respect to the mandible.
Table 6.
Comparison of midface asymmetry among female subjects in the asymmetry and symmetry groups with respect to the mandible.
| Female | |||||
|---|---|---|---|---|---|
| Mandible Asymmetry (n = 18) | Mandible Symmetry (n = 15) | ||||
| Median | IQR | Median | IQR | p | |
| OSPz | 0.72 | (0.35, 1.18) | 0.65 | (0.37, 1.16) | 1.000 |
| CORONALmz | 1.26 | (0.52, 2.20) | 2.11 | (0.95, 2.37) | 0.338 |
| OSPzp | 1.58 | (1.00, 2.60) | 1.65 | (0.32, 2.79) | 0.957 |
| CORONALzp | 1.21 | (0.48, 1.74) | 0.66 | (0.50, 1.13) | 0.459 |
| OSPgf | 1.75 | (1.54, 2.49) | 1.17 | (0.11, 1.71) | 0.041 * |
| CORONALgf | 1.30 | (0.90, 1.94) | 1.24 | (0.46, 1.95) | 0.731 |
Results of Mann–Whitney U test with absolute values used. IQR, inter-quartile range. * p < 0.05.
Table 7.
Comparison of midface asymmetry between sexes among subjects in the asymmetry group with respect to the mandible.
Table 7.
Comparison of midface asymmetry between sexes among subjects in the asymmetry group with respect to the mandible.
| Asymmetry Group | |||||
|---|---|---|---|---|---|
| Female (n = 18) | Male (n = 19) | ||||
| Median | IQR | Median | IQR | p | |
| OSPz | 0.72 | (0.35, 1.18) | 0.63 | (0.29, 1.08) | 0.682 |
| CORONALz | 1.90 | (1.26, 3.20) | 2.24 | (0.63, 4.76) | 0.660 |
| OSPmz | 1.48 | (0.57, 1.83) | 2.57 | (1.03, 3.70) | 0.158 |
| CORONALmz | 1.26 | (0.52, 2.20) | 1.46 | (0.72, 2.46) | 0.421 |
| OSPzp | 1.58 | (1.00, 2.60) | 1.48 | (0.55, 2.05) | 0.494 |
| CORONALzp | 1.21 | (0.48, 1.74) | 0.88 | (0.46, 2.23) | 0.820 |
| OSPgf | 1.75 | (1.54, 2.49) | 1.22 | (0.55, 2.67) | 0.186 |
| CORONALgf | 1.30 | (0.90, 1.94) | 1.54 | (0.70, 2.39) | 0.820 |
Results of Mann–Whitney U test with absolute values used. IQR, inter-quartile range.
Disclaimer/Publisher’s Note: The statements, opinions and data contained in all publications are solely those of the individual author(s) and contributor(s) and not of MDPI and/or the editor(s). MDPI and/or the editor(s) disclaim responsibility for any injury to people or property resulting from any ideas, methods, instructions or products referred to in the content. |
© 2024 by the authors. Licensee MDPI, Basel, Switzerland. This article is an open access article distributed under the terms and conditions of the Creative Commons Attribution (CC BY) license (https://creativecommons.org/licenses/by/4.0/).
Share and Cite
MDPI and ACS Style
Wang, C.-Y.; Chang, C.-J.; Chen, M.-Y.; Wong, T.-Y.; Fang, J.-J. Characteristics of Midface Asymmetry in Skeletal Class III Malocclusion Using Three-Dimensional Analysis. Symmetry 2024, 16, 490. https://doi.org/10.3390/sym16040490
AMA Style
Wang C-Y, Chang C-J, Chen M-Y, Wong T-Y, Fang J-J. Characteristics of Midface Asymmetry in Skeletal Class III Malocclusion Using Three-Dimensional Analysis. Symmetry. 2024; 16(4):490. https://doi.org/10.3390/sym16040490
Chicago/Turabian StyleWang, Chia-Yi (Jessica), Chen-Jung Chang, Meng-Yen Chen, Tung-Yiu Wong, and Jing-Jing Fang. 2024. "Characteristics of Midface Asymmetry in Skeletal Class III Malocclusion Using Three-Dimensional Analysis" Symmetry 16, no. 4: 490. https://doi.org/10.3390/sym16040490
Note that from the first issue of 2016, this journal uses article numbers instead of page numbers. See further details here.