Article

Associations between Floral Asymmetry and Individual Genetic Variability Differ among Three Prickly Pear (Opuntia echios) Populations

by
Philippe Helsen
1,2 and
Stefan Van Dongen
2,*
1
Centre for Research and Conservation-Conservation Genetics Lab, Royal Zoological Society of Antwerp, Antwerp 2000, Belgium
2
Evolutionary Ecology Group, Department of Biology, University of Antwerp, Antwerp 2610, Belgium
*
Author to whom correspondence should be addressed.
Symmetry 2016, 8(11), 116; https://doi.org/10.3390/sym8110116
Submission received: 16 August 2016 / Revised: 24 October 2016 / Accepted: 25 October 2016 / Published: 29 October 2016
(This article belongs to the Special Issue Fluctuating Asymmetry 2016)

Abstract

:
While stress is expected to increase developmental instability (DI), not all studies confirm this. This heterogeneity could in part be due to the use of subtle differences between the left and right side of bilateral symmetrical organisms to quantify DI, leading to large sampling error obscuring associations with DI. Traits that develop simultaneously more than twice (such as flower petals or bird feathers) reflect individual DI more reliably, such that stronger associations are expected to emerge. Furthermore, some studies have shown differences in strengths of associations among populations. We studied the association between individual genetic diversity and DI in flower petals within three Opuntia echios populations inhabiting Galápagos. Quantifying individual DI through variation in length and width of a high number of petals within individual cacti, lead to a strong association between DI and genetic diversity in one population. We conclude that associations between individual DI and genetic diversity can be more easily revealed by measuring traits that develop repeatedly.

1. Introduction

Environmental and genetic challenges influence developing systems in that they may disturb development. It is generally accepted that organisms try to overcome such disturbances or noise in a process called developmental stability, the reproducible development of a genotype under given environmental conditions [1,2]. Nevertheless, duplicate copies of morphological symmetrical structures like fish fins [3], tarsus length in birds [4], and turtle shells [5] among many others are reported to deviate from perfect symmetry (subtle left–right differences in seemingly symmetrical traits). Developmental instability (DI) represents the inability to buffer development against random noise and is mostly quantified by fluctuating asymmetry (FA), non-directional deviations from the average perfect symmetrical traits. The key idea behind FA as an indirect measure of DI is that both sides of an organism can be viewed as independent replicas of the same developmental event sharing a common genotype and environment [6,7,8,9].
Many studies have investigated the effect of (genetic or environmental) stress on developing systems, and whether there is a relationship between FA and stress. In some studies, asymmetry is often used or proposed as a measure of stress [10,11,12,13,14,15], where FA could serve as an easy, low cost, and non-invasive measure to quantify vulnerable populations [8,16]. The reported heterogeneity of conclusions, however, led to a general belief that FA is not an omnipresent simple measure of stress and fitness, nor a straight forward measure of DI, hampering its general application [8,17,18]. Besides statistical issues, reasons behind these conflicting outcomes is that associations between stress and FA depends on the amount, type, and combination stresses organisms experience [2,4]. Measurement errors (ME) are another source of problems obscuring real stress-FA associations. Since FA is usually small (typically 1%–2% of the mean trait size), it can easily be confounded with measurement error (ME) [1,19]. However, the magnitude of ME relative to FA can easily be partitioned through repeated measurements, allowing the identification of suitable traits and required number of repeated measurements [19]. The tradition of using bilaterally symmetrical traits to obtain an estimate of the degree of asymmetry presents a more difficult statistical problem. It comes down to estimating DI (which can be expressed as a variance) by two data points (left minus right), which causes high sampling error. Consequently, and depending of the amount of between-individual variation in DI, much of the between-individual variation in FA may reflect sampling noise, potentially causing heterogeneity in the association between the underlying DI and the observable FA between populations [6,7,8,9,20]. Traits that develop more often under identical conditions (i.e., flower petals) are expected to provide a more robust estimate of individual levels of DI leading to more powerful analysis. It is thus crucial to measure multiple traits or radial asymmetry and to combine different forms of stress in DI-stress studies.
The association between DI and both inbreeding and heterozygosity has been studied intensively since the mid-nineties. Additionally, a high heterogeneity among studies can be found [17,18]. The current literature seems to be biased towards animal studies (for example, in a meta-analysis, only 2 out of 40 studies were on plants [17]). In addition, few studies have investigated interactions between the effects of environmental and genetic stress on DI (but see [4]), and most studies investigated bilateral asymmetry, while radial asymmetry is expected to more reliably reflect individual DI. We predicted that the use of radial symmetry measured in many petals of different flowers to estimate individual DI would show strong associations with genetic variability. To achieve this, we studied this association in three populations of the highly morphologically diverse and endemic Opuntia echios of Galápagos. Earlier studies showed low genetic differentiation between the different varieties and high genetic diversity [21,22]. Furthermore, petal asymmetry significantly differed between individual plants and is presumably closely reflecting individual DI [23]. Here, we studied the relationship of neutral genetic diversity as measured by eight highly variable microsatellite markers [21] with variation in petal asymmetry. We predicted a reliable estimation of DI—genetic diversity associations among individuals—and tested for differences in strength of association among populations.

2. Materials and Methods

2.1. Study Species and Study Site

Cacti of the genus Opuntia or “prickly pears” inhabiting Galápagos are mainly known for their morphological diversity [22,24] and the keystone role they fulfil in the semi-arid ecosystem [25]. In the last few decades, Galápagos’ prickly pears have been under such serious threat that conservation and re-introduction programs were started for some taxa [26]. We collected morphological and genetic data within three endemic Opuntia echios populations at the beginning of the warm/wet season of 2007 [27]. Thirty-nine cacti (N) representing 197 flowers (nf) were collected at the relatively large island Santa Cruz (986 km²) near Charles Darwin Research Center (CDRS) (Opuntia echios var. gigantea [22]). Two smaller populations were sampled on two satellite islands of Santa Cruz, namely Baltra (27 km2, N = 38, nf = 130) and Plaza Sur (0.13 km2, N = 16, nf = 50) (Opuntia echios var. echios [22]).
Within these three locations, we collected, for each blooming plant, both flowers and a fresh mature terminal cladode for genetic analysis. Since no records are available on which environmental factors might affect flower morphology, we randomly sampled multiple flowers (max. 10) to estimate intra- and inter-individual variation in radial asymmetry. This sampling procedure resulted in a nested dataset, with flowers nested within plants and plants nested within populations. Cladodes were chopped off at the joint with a machete and transported in individual paper bags to CDRS where they were stored at room temperature. Here, 25 cm2 of green tissue was isolated from all individual pads after removing the cuticle and the slimy secretion containing the parenchyma [28]. Resulting tissues were sent in a cooled container (containing dry ice) to the University of Antwerp where they were genotyped. Due to export regulations and loss of material, DNA from only a smaller sample could be transported to the genetic lab in Belgium.

2.2. Individual Genetic Diversity

We isolated DNA using DNA easy plant mini kits (Qiagen, Hilden, Germany) and defined genetic diversity of each individual cactus using eight polymorphic microsatellite markers [22]. Earlier tests have revealed the absence of contamination between samples, as genetic profiles were highly repeatable [22]. Genotypes were visualized on an ABI 3730 instrument (Applied Biosystems, Carlsbad, CA, USA) and scored using size calling in GeneMapper Software v3.7 (Applied Biosystems). While partial heterozygosity [29] hampered exact scoring of these hexaploid species [22], we applied two methods to define individual diversity. The mean number of alleles (mNA) per locus was used as a conservative estimate, as it underestimates diversity due to null alleles. In addition, since we study a polyploid species, counting the number of alleles does not take into account that some alleles may be present in the genome more than once. Therefore, microsatellite DNA Allele Counting using Peak Ratios (MAC-PR) [30,31,32] was used as an alternative way to score haplotypes at the individual level. Genetic variability was subsequently quantified as Nei’s uncorrected diversity index, D = 1 − Σpi2, with the pi frequency of allele i defined by MAC-PR methods.

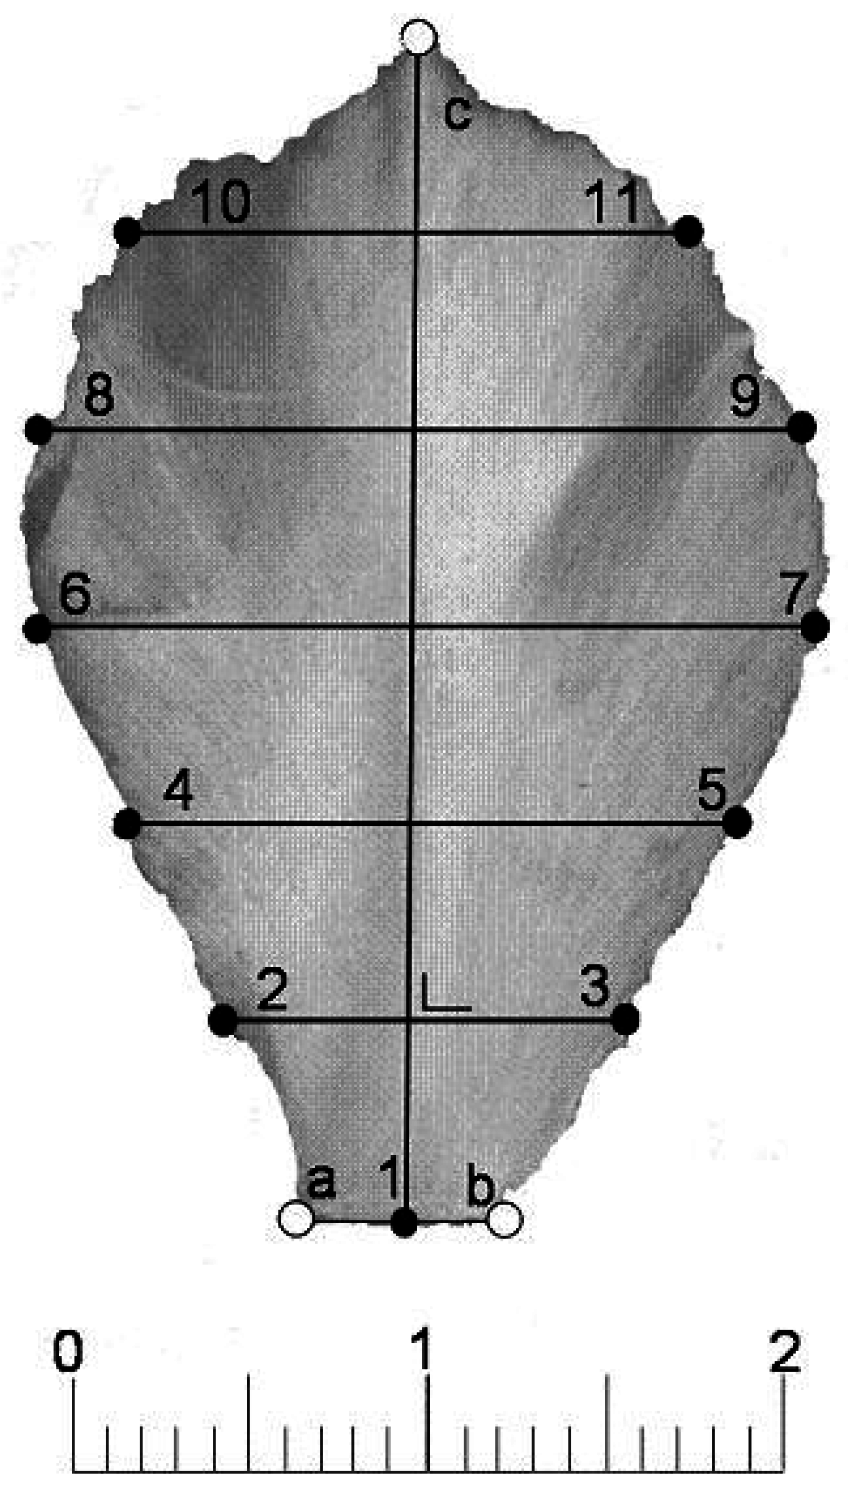
2.3. FA Measurements

For each flower, the five most interiorly situated petals were isolated, mounted on blue paper, compressed between two transparent slides, and digitalized using a reflex camera. Images were imported in ImageJ software (National Institutes of Health, Bethesda, MD, USA) [33] for further measurements. All asymmetry values were determined by the same person (HP) on the basis of petal lengths and widths measured from replicate images (details in [23]). As in most flowers, prickly pear petals display no more than three undisputable landmarks: their top (c) and both sides of their bases (a and b) (Figure 1). To obtain more comparable points, semilandmarks were identified. The first semilandmark (1) was defined as the midpoint of landmarks a and b. A ”raster” was constructed to identify 10 additional points on the petal’s edge (Figure 1). To achieve this, the chord connecting landmark c and semilandmark 1 was divided in six equally sized parts. From the five resulting points, perpendicular lines to the chord were constructed, and intersections with the outer contour of the petals were indicated as semilandmarks (2–11). This procedure was performed semi-automatically using ImageJ [33]. Individual radial asymmetry (rFA) was recovered from mean flower specific standard deviations in petal lengths. Flower specific bilateral asymmetry of petal width (wFA) was defined as the mean unsigned left-right differences in petal widths averaged over all petals within and across the sampled flowers [23] (Figure 1).
Every single handling operation within a sampling procedure can bring about measurement errors (MEs). Together with non-random deviations from perfect symmetry (directional asymmetry or DA), MEs can seriously confound interpretations of FA. In order to disentangle all potential levels (mounting the petals, taking pictures, and assigning landmarks) of ME from real FA, we reprocessed 31 flowers representing 156 individual petals. A mixed regression analysis was used to test for directional asymmetry in wFA (side was used as a fixed effect) and to define the origins of ME [23]. Although most operations within our sampling procedure (i.e., mounting the petals, taking a picture, and identifying the margins) did not add much more variation in FA, real petal width asymmetry (wFA) was overshadowed by the ME of setting up a raster to define petal margins (MEraster = 65% of total variance in wFA vs. 10% in rFA). Nevertheless, these asymmetry measurements proved to be sufficiently accurate to statistically differentiate between cacti with high or low levels of DI [23]. However, associations for wFA can be expected to be smaller because of the higher degree of ME.
In the above approach, to estimate individual DI, we implicitly assume that developmental errors are additive and that an underlying normality can be assumed. This assumption has been questioned [34,35], but was tested explicitly in our dataset [23]. By comparing alternative models, we were able to show that, at least for the flower petals of our prickly pear cacti, a normal distribution of developmental errors fitted best [23], (see also [36] for other examples in petals).
For completeness, we also report on associations between genetic diversity and individual between-flower variation in petal lengths. These were estimated by first averaging petal lengths within flowers and by subsequently estimating the between-flower variation in these averages for each individual. In this way, we have 3 measures of individual DI based on the petals. We next standardized each of them and calculated the average to obtain a composite measure of individual DI.

2.4. Relationships between Genetic Diversity and FA (Fluctuating Asymmetry)

We performed analyses of covariance to test whether genetic diversity is related to FA. The initial model included FA (measured as radial (rFA), width asymmetry (wFA), between-flower variation, and average instability) as a dependent variable, and population (fixed effect) and both genetic diversity indices as independent variables. In order to test for potential local differences in responses of genetic diversity on DI, we added the two-way interaction term population х genetic diversity to the model. All analyses were performed in SAS release 9.1 (SAS Institute Inc., Cary, NC, USA).

3. Results

3.1. Genetic Diversity and Fluctuating Asymmetry

The individual mean number of alleles and individual genetic diversity as calculated by Nei’s uncorrected diversity index (Table 1a) did not differ significantly between the three populations (F2,50 = 0.35, p > 0.5; F2,50 = 2.67, p = 0.079 respectively), and both genetic diversity measures were highly correlated (r = 0.84, DF = 53, p < 0.001).
Notwithstanding high ME in width asymmetry (wFA), both asymmetry measures varied between individuals (wFA: σ2 = 0.00037, χ 1 2 = 45.4 ; p < 0.001, rFA: σ2 = 0.00097; χ 1 2 =   3.4 , p < 0.032). Mean petal width asymmetry (wFA) displayed no directional component (F1,35 = 0.3, p = 0.64), and directional asymmetry did not differ among populations (F2,280 = 0.22, p = 0.81). On the locality level, albeit not significantly so after Bonferonni correction for multiple testing, mean width (wFA), radial (rFA) asymmetry and average instability were lowest within Plaza Sur. Between flower variation in petal length was lowest in Baltra (Table 1b).

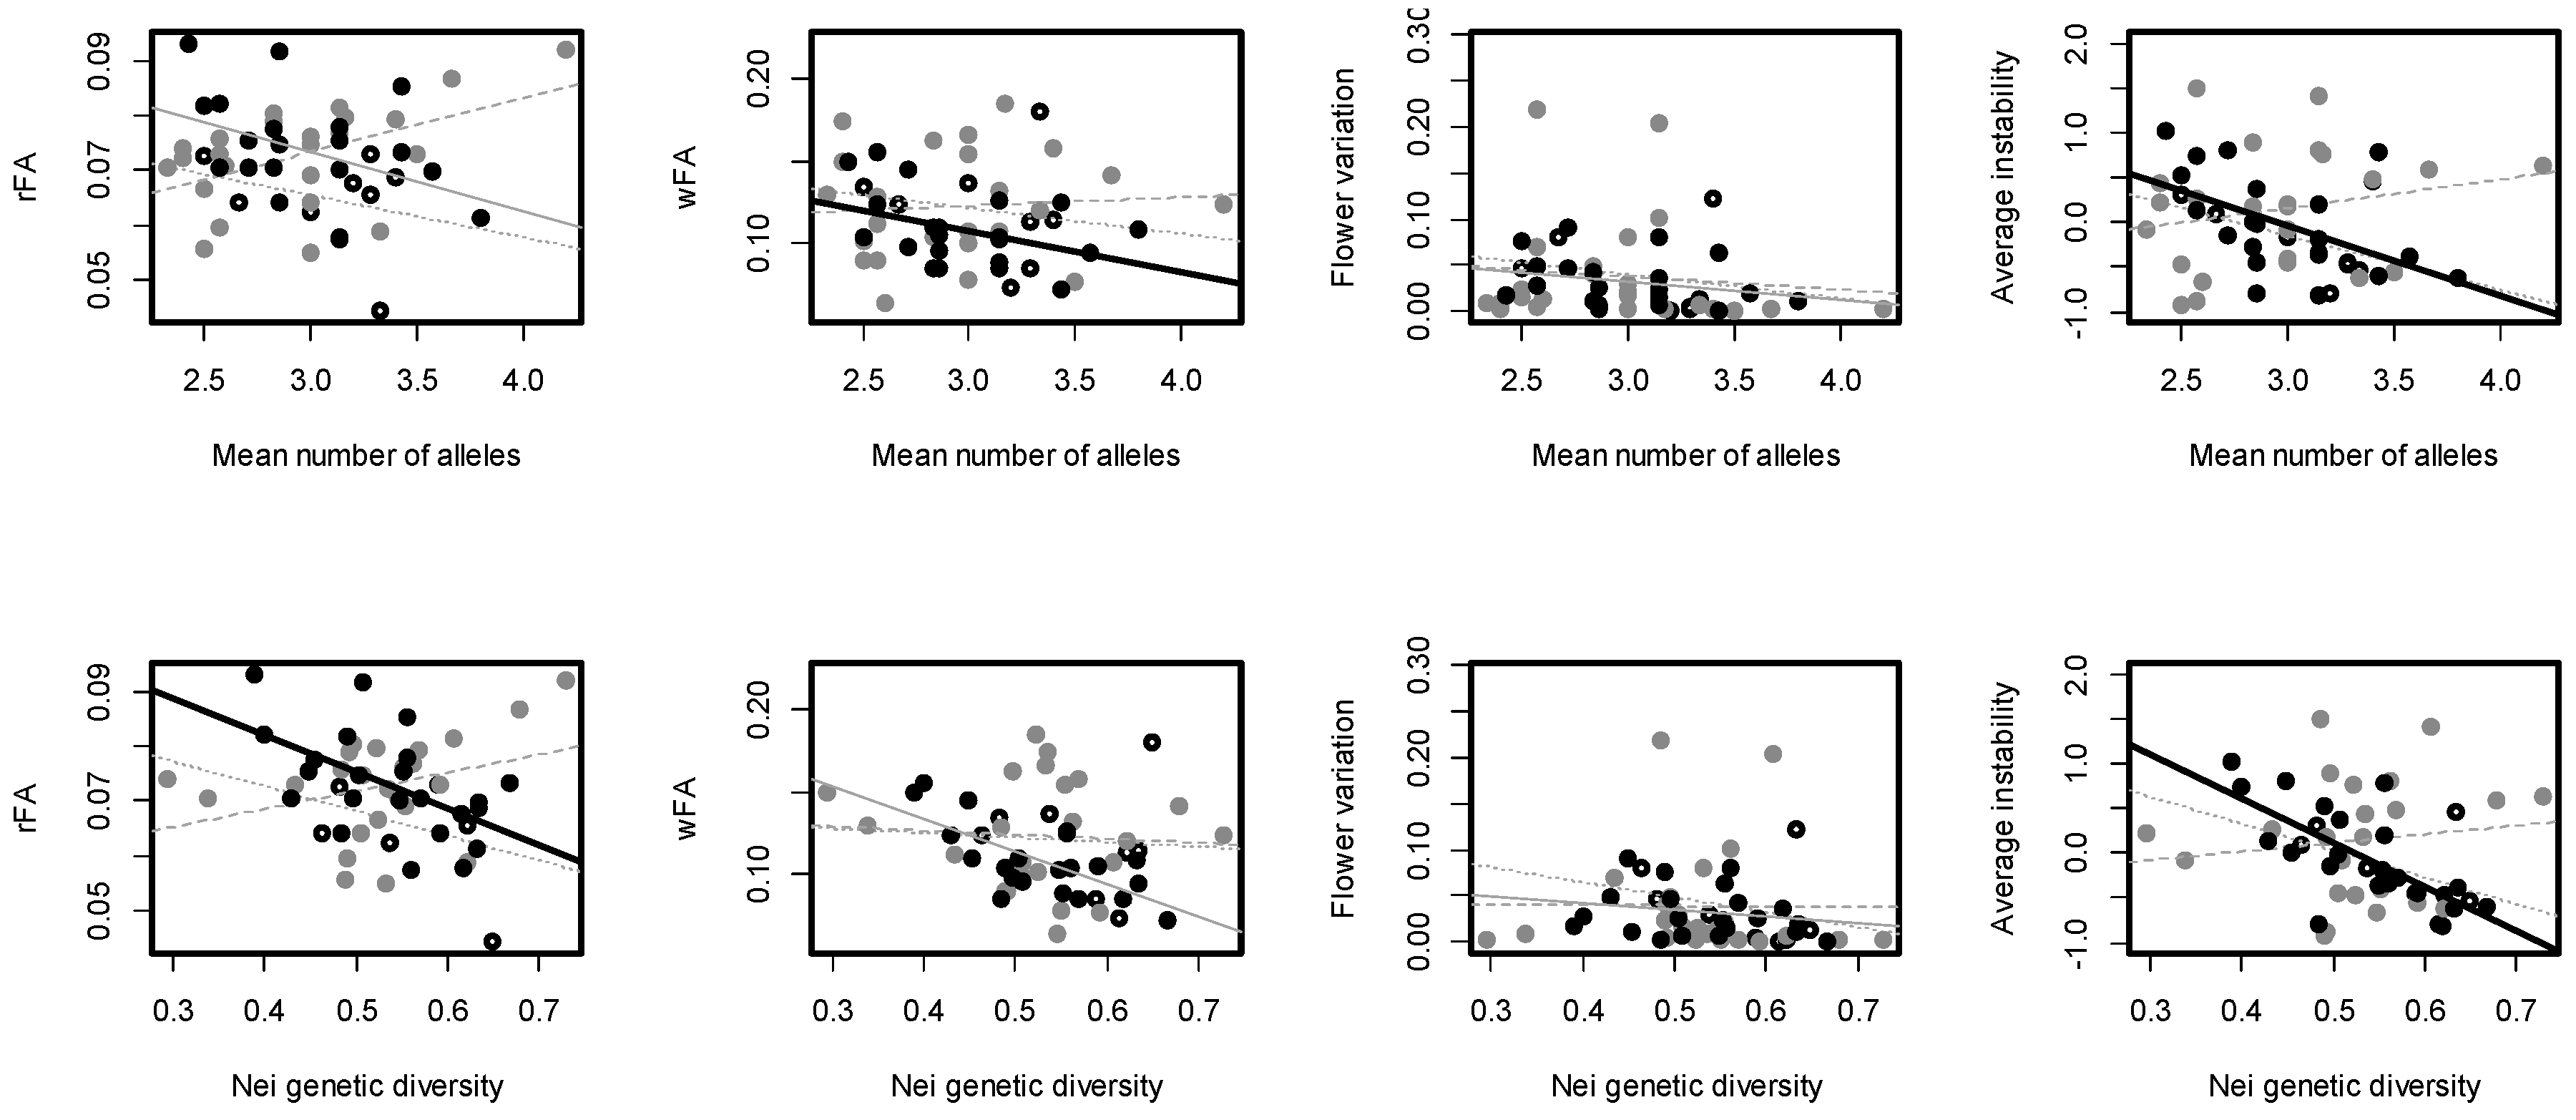
3.2. Correlation between Genetic Diversity and FA

Overall, our measures of DI were not significantly correlated with genetic diversity (i.e., no significant main effect of genetic diversity, Table 2). The association between genetic diversity and genetic diversity, however, differed between locations for rFA and the average instability measure (significant interactions between population and both genetic diversity measures, Table 2). Within single localities, we found relatively strong negative correlations for the Santa Cruz population only (Figure 2).

4. Discussion

Fluctuating asymmetry (representing a measure of DI) is generally expected to correlate negatively with the degree of genetic diversity [37]. Although reviews and meta-analysis indeed reveal such negative associations, the hypothesis is only weakly supported by the available data [17,18]. Hence, the debate on the association between DI and genetic diversity is still open, especially for patterns at the individual level. In addition, very little is known of these associations in plants. To our knowledge, no study has examined associations between DI and individual genetic diversity in natural populations.
Two reasons confound the negative association between genetic diversity and DI: (i) FA quantified by means of bilateral symmetrical characters are a weak measure for DI [6,7,8,9,20]; and (ii) the effect of diversity may differ among populations [2,4]. This first confounding factor can easily be minimized by measuring traits that develop repeatedly under identical conditions (i.e., petal lengths and widths of Galápagos’ prickly pears) to obtain a more robust estimate of individual levels of DI. Therefore, we measured the radial asymmetry of the lengths and widths in petals of several flowers within each individual to optimally estimate individual DI [23]. In addition, between-flower variation in petal lengths was explored as a measure of individual DI. The use of several measures of DI within an individual has also been advocated in the context of bilateral symmetry, where composite FA estimates (averages of FA across traits) are expected to more reliably estimate individual DI. In contrast to the use of radial asymmetry of a single trait as we did, the underlying assumption when combining bilateral FA from different traits is the existence of a so-called individual asymmetry parameter (IAP) and that each trait contributes to this individual variation in DI. While there seems to be some evidence for such an IAP [35,38], different traits may be affected differently depending on their evolutionary history (e.g., [39]).
Notwithstanding high measurement errors for width measurements, both petal width and length indeed appeared to be good inter-individual measures of DI [23]. We moreover state that extensively collecting within-individual FA measurements of such characters, even for merely a small number of specimens per location, is an interesting pathway to follow in detecting effects of genetic diversity on DI. The association between these two measures we find here indeed is far above average (r = −0.04 [17] versus r = −0.70 for one population in this study) and among the highest ever reported (r = −0.47 in rainbow trout Oncorhynchus mykiss [3]; r = −0.6 in Taita trushes Turdus helleri [4]). Not surprisingly, no associations were found between genetic diversity and between-flower variation in petal length, as the power for the analyses using this trait is based on the number of flowers and not the number of petals measured.
Within Galápagos’ prickly pears, the interplay between genetic diversity and FA differs between the three sampling locations. While the predicted strong negative association was found within cacti at CDRS (Santa Cruz), such a pattern was absent in both Baltra and Plaza Sur. About the reasons for this, we can only speculate. Possibly, cacti at CDRS experience less favorable environmental conditions [40,41,42], possibly enhancing the DI-genetic diversity associations. Indeed, studies revealing similar patterns [4,43] underpin the importance of the levels of stress a population is under, yet experimental evidence is lacking. Alternatively, there may be differences between the varieties of prickly pear, or differences in the population structure of the three populations could also generate these patterns. Obviously, to be conclusive—and in the absence of opportunities to experimentally interfere in this protected and highly vulnerable study system—we would need different independent populations experiencing high competition to be studied. Unfortunately, this tree-like prickly pear (i.e., Opuntia echios var. gigantea) is restricted to the southern area of Santa Cruz only. We thus can conclude that DI measured in repeated structures, even in merely a relative small number of individuals, might be a promising and statistically powerful attribute in future DI studies.

Acknowledgments

This work is financially supported by a BOF-NOI project (FAO70400/4) at the Evolutionary Ecology Group of the University of Antwerp and the Belgian Society Policy. This is a Contribution of the Charles Darwin Research Station (CDRS), the institute that provided cooperation and field logistics support. We thank Boris Pellegroms for his help in designing ImageJ macros, Natalie van Houtte for the help in the lab, and Xavier Arturo, Daniel Segura, Jorge-Luis Renteria, Fredy Nugra, and Luis Molina (all CDRS) for their assistance in the field. Alan Tye, Frank Bungartz, Frauke Ziemmeck, Anne Guezou, Rachell Atkinson, Ivan Aldaz, and Patty Jaramillo (all CDRS) for their support at and far away from Galápagos.

Author Contributions

Philippe Helsen and Stefan Van Dongen conceived and designed the experiments; Philippe Helsen performed the experiments and measurements and analyzed the data; Philippe Helsen and Stefan Van Dongen wrote the paper.

Conflicts of Interest

The authors declare no conflict of interest.

References

  1. Palmer, A.R.; Strobeck, C. Fluctuating asymmetry—measurement, analysis, patterns. Annu. Rev. Ecol. Syst. 1986, 17, 391–421. [Google Scholar] [CrossRef]
  2. Palmer, A.R. Waltzing with asymmetry. Is fluctuating asymmetry a powerful new tool for biologist or just an alluring new dance step? Bioscience 1996, 46, 518–532. [Google Scholar] [CrossRef]
  3. Leary, R.F.; Allendorf, F.W.; Knudsen, K.L. Genetics, environmental and developmental causes of meristic variation in rainbow trout. Acta Zool. Fenn. 1992, 191, 79–95. [Google Scholar]
  4. Lens, L.; Van Dongen, S.; Galbusera, P.; Schenk, T.; Matthysen, E. Developmental instability and inbreeding in natural bird populations exposed to different levels of habitat disturbance. J. Evol. Biol. 2000, 13, 889–896. [Google Scholar] [CrossRef]
  5. Rivera, G.; Claude, J. Environmental media and shape asymmetry: A case study on turtle shells. Biol. J. Linn. Soc. Lond. 2008, 94, 483–489. [Google Scholar] [CrossRef]
  6. Whitlock, M. The heritability of fluctuating asymmetry and the genetic control of developmental stability. Proc. Biol. Sci. 1996, 263, 849–853. [Google Scholar] [CrossRef] [PubMed]
  7. Whitlock, M. The repeatability of fluctuating asymmetry: A revision and extension. Proc. Biol. Sci. 1998, 265, 1429–1431. [Google Scholar] [CrossRef]
  8. Van Dongen, S. Fluctuating asymmetry and developmental instability in evolutionary biology: Past, present and future. J. Evol. Biol. 2006, 19, 1727–1743. [Google Scholar] [CrossRef] [PubMed]
  9. Van Dongen, S. How repeatable is the estimation of developmental stability by fluctuating asymmetry? Proc. Biol. Sci. 1998, 265, 1423–1427. [Google Scholar] [CrossRef]
  10. Parsons, P.A. Fluctuating asymmetry: An epigenetic measure of stress. Biol. Rev. Camb. Philos. Soc. 1990, 65, 131–145. [Google Scholar] [CrossRef] [PubMed]
  11. Parsons, P.A. Fluctuating asymmetry: A biological monitor of environmental and genomic stress. Heredity 1992, 68, 361–364. [Google Scholar] [CrossRef] [PubMed]
  12. Clarke, G.M. Fluctuating asymmetry: A technique for measuring developmental stability in natural populations. Acta Zool. Fenn. 1992, 191, 31–36. [Google Scholar]
  13. Manning, J.T.; Chamberlain, A.T. Fluctuating asymmetry in gorilla canines: A sensitive indicator of environmental stress. Proc. Biol. Sci. 1994, 255, 189–193. [Google Scholar] [CrossRef] [PubMed]
  14. Söderman, F.; Van Dongen, S.; Pakkasmaa, S.; Merilä, J. Environmental stress increases skeletal fluctuating asymmetry in the moor frog Rana arvalis. Oecologia 2007, 151, 593–604. [Google Scholar] [CrossRef] [PubMed]
  15. Carter, A.J.R.; Weier, T.M.; Houle, D. The effect of inbreeding on fluctuating asymmetry of wing veins in two laboratory strains of Drosophila melanogaster. Heredity 2009, 102, 263–272. [Google Scholar] [CrossRef] [PubMed]
  16. Lens, L.; Eggermont, H. Fluctuating asymmetry as a putative marker of human-induced stress in avian conservation. Bird Conserv. Int. 2008, 18, 125–143. [Google Scholar] [CrossRef]
  17. Vøllestad, L.A.; Hindar, K.; Møller, A.P. A meta-analysis of fluctuating asymmetry in relation to heterozygosity. Heredity 1999, 83, 206–218. [Google Scholar] [CrossRef] [PubMed]
  18. Pertoldi, C.; Kristensen, T.N.; Andersen, D.H.; Loeschke, V. Developmental instability as an estimator of genetic stress. Heredity 2006, 96, 122–127. [Google Scholar] [CrossRef] [PubMed]
  19. Van Dongen, S. Accuracy and power in fluctuation asymmetry studies: Effects of sample size and number of within-individual repeats. J. Evol. Biol. 1999, 12, 547–550. [Google Scholar] [CrossRef]
  20. Houle, D. A simple model of the relationship between asymmetry and developmental stability. J. Evol. Biol. 2000, 13, 720–730. [Google Scholar] [CrossRef]
  21. Helsen, P.; Browne, R.A.; Anderson, D.J.; Verdyck, P.; Dongen, S. Galapagos’ Opuntia (prickly pear) cacti: Extensive morphological diversity, low genetic variability. Biol. J. Linn. Soc. 2009, 96, 451–461. [Google Scholar] [CrossRef]
  22. Helsen, P.; Verdyck, P.; Tye, A.; Van Dongen, S. Low levels of genetic differentiation between Opuntia echios varieties on Santa Cruz (Galápagos). Plant Syst. Evol. 2009, 279, 1–10. [Google Scholar] [CrossRef]
  23. Helsen, P.; Van Dongen, S. The normal dirstibution as appropriate model of developmental instability in Opuntia cacti flowers. J. Evol. Biol. 2009, 22, 1346–1353. [Google Scholar] [CrossRef] [PubMed]
  24. Anderson, E.F.; Walkington, D.L. Cactaceae. In Flora of the Galápagos Islands; Wiggins, I.L., Porter, D.M., Eds.; Stanford University Press: Stanford, CA, USA, 1971; pp. 533–546. [Google Scholar]
  25. Hicks, D.J.; Mauchamp, A. Evolution and conservation biology of the Galápagos Opuntias (Cactaceae). Haseltonia 1996, 4, 89–102. [Google Scholar]
  26. Tye, A. Restoration of the vegetation of the dry zone in Galápagos. Lyonia 2006, 9, 1–24. [Google Scholar]
  27. Jackson, M.H. Galápagos: A Natural History Guide; University of Calgary Press: Calgary, AB, Canada, 1993. [Google Scholar]
  28. Mauseth, R.A. Collapsible water-storage cells in cacti. Bull. Torrey Bot. Club 1995, 122, 145–151. [Google Scholar] [CrossRef]
  29. Bruvo, R.; Michiels, N.K.; D’Souza, T.G.; Schulenburg, H. A simple method for the calculation of microsatellite genotype distances irrespective of ploidy level. Mol. Ecol. 2004, 13, 2101–2106. [Google Scholar] [CrossRef] [PubMed]
  30. Esselink, G.D.; Nybom, H.; Vosman, B. Assignment of allelic configuration in polyploids using the MAC-PR (microsatellite DNA allele counting-peak ratios) method. Theor. Appl. Genet. 2004, 109, 402–408. [Google Scholar] [CrossRef] [PubMed]
  31. Nybom, H. Comparison of different nuclear DNA markers for estimating intraspecific genetic diversity in plants. Mol. Ecol. 2004, 13, 1143–1155. [Google Scholar] [CrossRef] [PubMed]
  32. Nybom, H.; Esselink, G.D.; Werlemark, G.; Leus, L.; Vosman, B. Unique genomic configuration revealed by microsatellite DNA in polyploid dogroses, Rosa sect. Can. J. Evol. Biol. 2006, 19, 635–648. [Google Scholar] [CrossRef] [PubMed]
  33. Abramoff, M.D.; Magelhaes, P.J.; Ram, S.J. Image processing with IMAGEJ. Biophoton. Int. 2004, 11, 36–42. [Google Scholar]
  34. Graham, J.H.; Shimizu, K.; Emlen, J.M.; Freeman, D.C.; Merkel, J. Growth models and the expected distribution of fluctuating asymmetry. Biol. J. Linn. Soc. 2003, 80, 57–65. [Google Scholar] [CrossRef]
  35. Graham, J.H.; Raz, S.; Hel-Or, H.; Nevo, E. Fluctuating asymmetry: Methods, theory, and applications. Symmetry 2010, 2, 466–540. [Google Scholar] [CrossRef]
  36. Van Dongen, S.; Møller, A.P. On the distribution of developmental errors: Comparing the normal, gamma, and log-normal distribution. Biol. J. Linn. Soc. 2007, 92, 197–210. [Google Scholar] [CrossRef]
  37. Lerner, I.M. Genetic Homeostasis; Wiley: New York, NY, USA, 2004. [Google Scholar]
  38. Freeman, D.C.; Graham, J.H.; Emlen, J.M.; Tracy, M.; Hough, R.A.; Alados, C.L.; Escós, J. Plant developmental instability: New measures, applications, and regulation. In Developmental Instability: Causes and Consequences; Polak, M., Ed.; Oxford University Press: New York, NY, USA, 2003; pp. 367–386. [Google Scholar]
  39. De Coster, G.; Van Dongen, S.; Malaki, P.; Muchane, M.; Alcantara-Exposito, A.; Matheve, H.; Lens, L. Fluctuating asymmetry and environmental stress: Understanding the role of trait history. PLoS ONE 2013, 8, e57966. [Google Scholar] [CrossRef] [PubMed] [Green Version]
  40. Arp, G.K. The Galápagos opuntias: Another interpretation. Noticias de Galápagos 1972, 21, 33–37. [Google Scholar]
  41. Racine, C.H.; Downhower, J.F. Vegetative and reproductive strategies of Opuntia (Cactaceae) in the Galapagos Islands. Biotropica 1974, 6, 175–186. [Google Scholar] [CrossRef]
  42. Burger, J.C.; Louda, S.M. Interaction of diffuse competition and insect herbivory in limiting brittle prickly pear cactus, Opuntia fragilis (Cactaceae). Am. J. Bot. 1999, 160, S135–S146. [Google Scholar] [CrossRef]
  43. Marchand, H.L.; Paillat, G.; Montuire, S.; Butet, A. Fluctuating asymmetry in bank vole populations (Rodentia, Arvicolinae) reflects stress caused by landscape fragmentation in the Mont-Saint-Michel Bay. Biol. J. Linn. Soc. Lond. 2003, 80, 37–44. [Google Scholar] [CrossRef]
Figure 1. Asymmetry measurement protocol for one prickly pear petal with a, b, and c, three undisputable landmarks. Petal length was defined as the distance between semilandmark 1 (the midpoint of (a–b) and c and used to calculate radial asymmetry (rFA). A “raster” constructed semi-automatically within ImageJ to identify 10 additional semilandmarks on the petal’s outer edge in order to evaluate levels of asymmetry in petal width (wFA [23]). Reproduced with permission from P. Helsen and S. Van Dongen, Journal of Evolutionary Biology; published by Wiley, 2009.
Symmetry 08 00116 g001
Figure 2. Correlations between genetic diversity (mean number of alleles on top row and Nei’s uncorrected genetic diversity index bottom row) and our three measures of developmental instability and the average instability for all sampled localities (Santa Cruz: solid black circle—full grey line or full black line if the association was statistically significant (see Table 2); Baltra: solid grey circle—dashed line; Plaza sur: open circle—dotted line).
Symmetry 08 00116 g002
Table 1. Results of the (a) genetic and (b) asymmetry analysis. n: Number of individuals/population; na: number of alleles; Nei’s GD: Mean individual genetic diversity according to Nei’s uncorrected diversity index; mNA: genetic diversity as the average number of alleles per individual; rFA = radial asymmetry; wFA = asymmetry in width; flower variation = between-flower variation; average instability: scaled average of the three measures of developmental instability. All averages are accompanied by their SE.
(a)
LocationGenetics
nnaNei’s GDmNA
Santa Cruz21680.528 ± 0.0782.98 ± 0.37
Baltra24750.528 ± 0.0922.94 ± 0.46
Plaza Sur8570.574 ± 0.0713.08 ± 0.33
(b)
LocationAsymmetry
rFAwFAFlower VariationAverage Instability
Santa Cruz0.074 ± 0.0100.085 ± 0.0180.045 ± 0.0140.10 ± 0.13
Baltra0.073 ± 0.0100.091 ± 0.0220.027 ± 0.007−0.03 ± 0.10
Plaza Sur0.065 ± 0.0100.075 ± 0.0240.038 ± 0.014−0.20 ± 0.14
Table 2. Results of ANCOVA analysis (F-tests) testing for associations between genetic diversity (mean number of alleles and Nei genetic diversity) and our measures of DI. Furthermore, population-specific correlations coefficients and their statistical significance are provided. (*: 0.05 ≤ p ≤ 0.01, **: 0.01 ≤ p ≤ 0.001, and ***: p < 0.001).
Significance Tests for the ANCOVA Models
Genetic Diversity IndexModel FactorrFAwFAFlower variationAverage instability
Mean number of allelesPop:F2,47 = 3.10F2,47 = 1.50F2,47 = 0.11F2,47 = 1.13
GD:F1,47 = 0.31F1,47 = 0.42F1,47 = 1.14F1,47 = 0.36
Pop×GD:F2,47 = 5.33 **F2,47 = 0.99F2,47 = 0.02F2,47 = 3.46 *
Nei GDPop:F2,47 = 3.08F2,47 = 1.16F2,47 = 0.11F2,47 = 1.21
GD:F1,47 = 0.53F1,47 = 3.20F1,47 = 0.28F1,47 = 2.45
Pop×GD:F2,47 = 5.13 **F2,47 = 1.50F2,47 = 0.20F2,47 = 4.31 *
Correlation coefficients for association between measures of DI and genetic diversity in each population, for the mean number of alleles and Nei GD respectively
Population:rFAwFAFlower variationAverage instability
Plaza sur−0.28/−0.36−0.06/−0.16−0.19/−0.26−0.47/−0.49
Baltra0.46/0.33−0.07/0.07−0.12/−0.000.22/0.13
Santa Cruz—CDRS−0.40/−0.53 *−0.70 ***/−0.42−0.26/−0.21−0.52 */−0.70 ***
CDRS: Charles Darwin Research Center.

