
Image Intelligent Detection Based on the Gabor Wavelet and the Neural Network

Abstract
:1. Introduction
2. Methodology
2.1. Gabor Wavelet Theory and Feature Transformation
2.2. Neural Network Model Structure and Its Algorithm
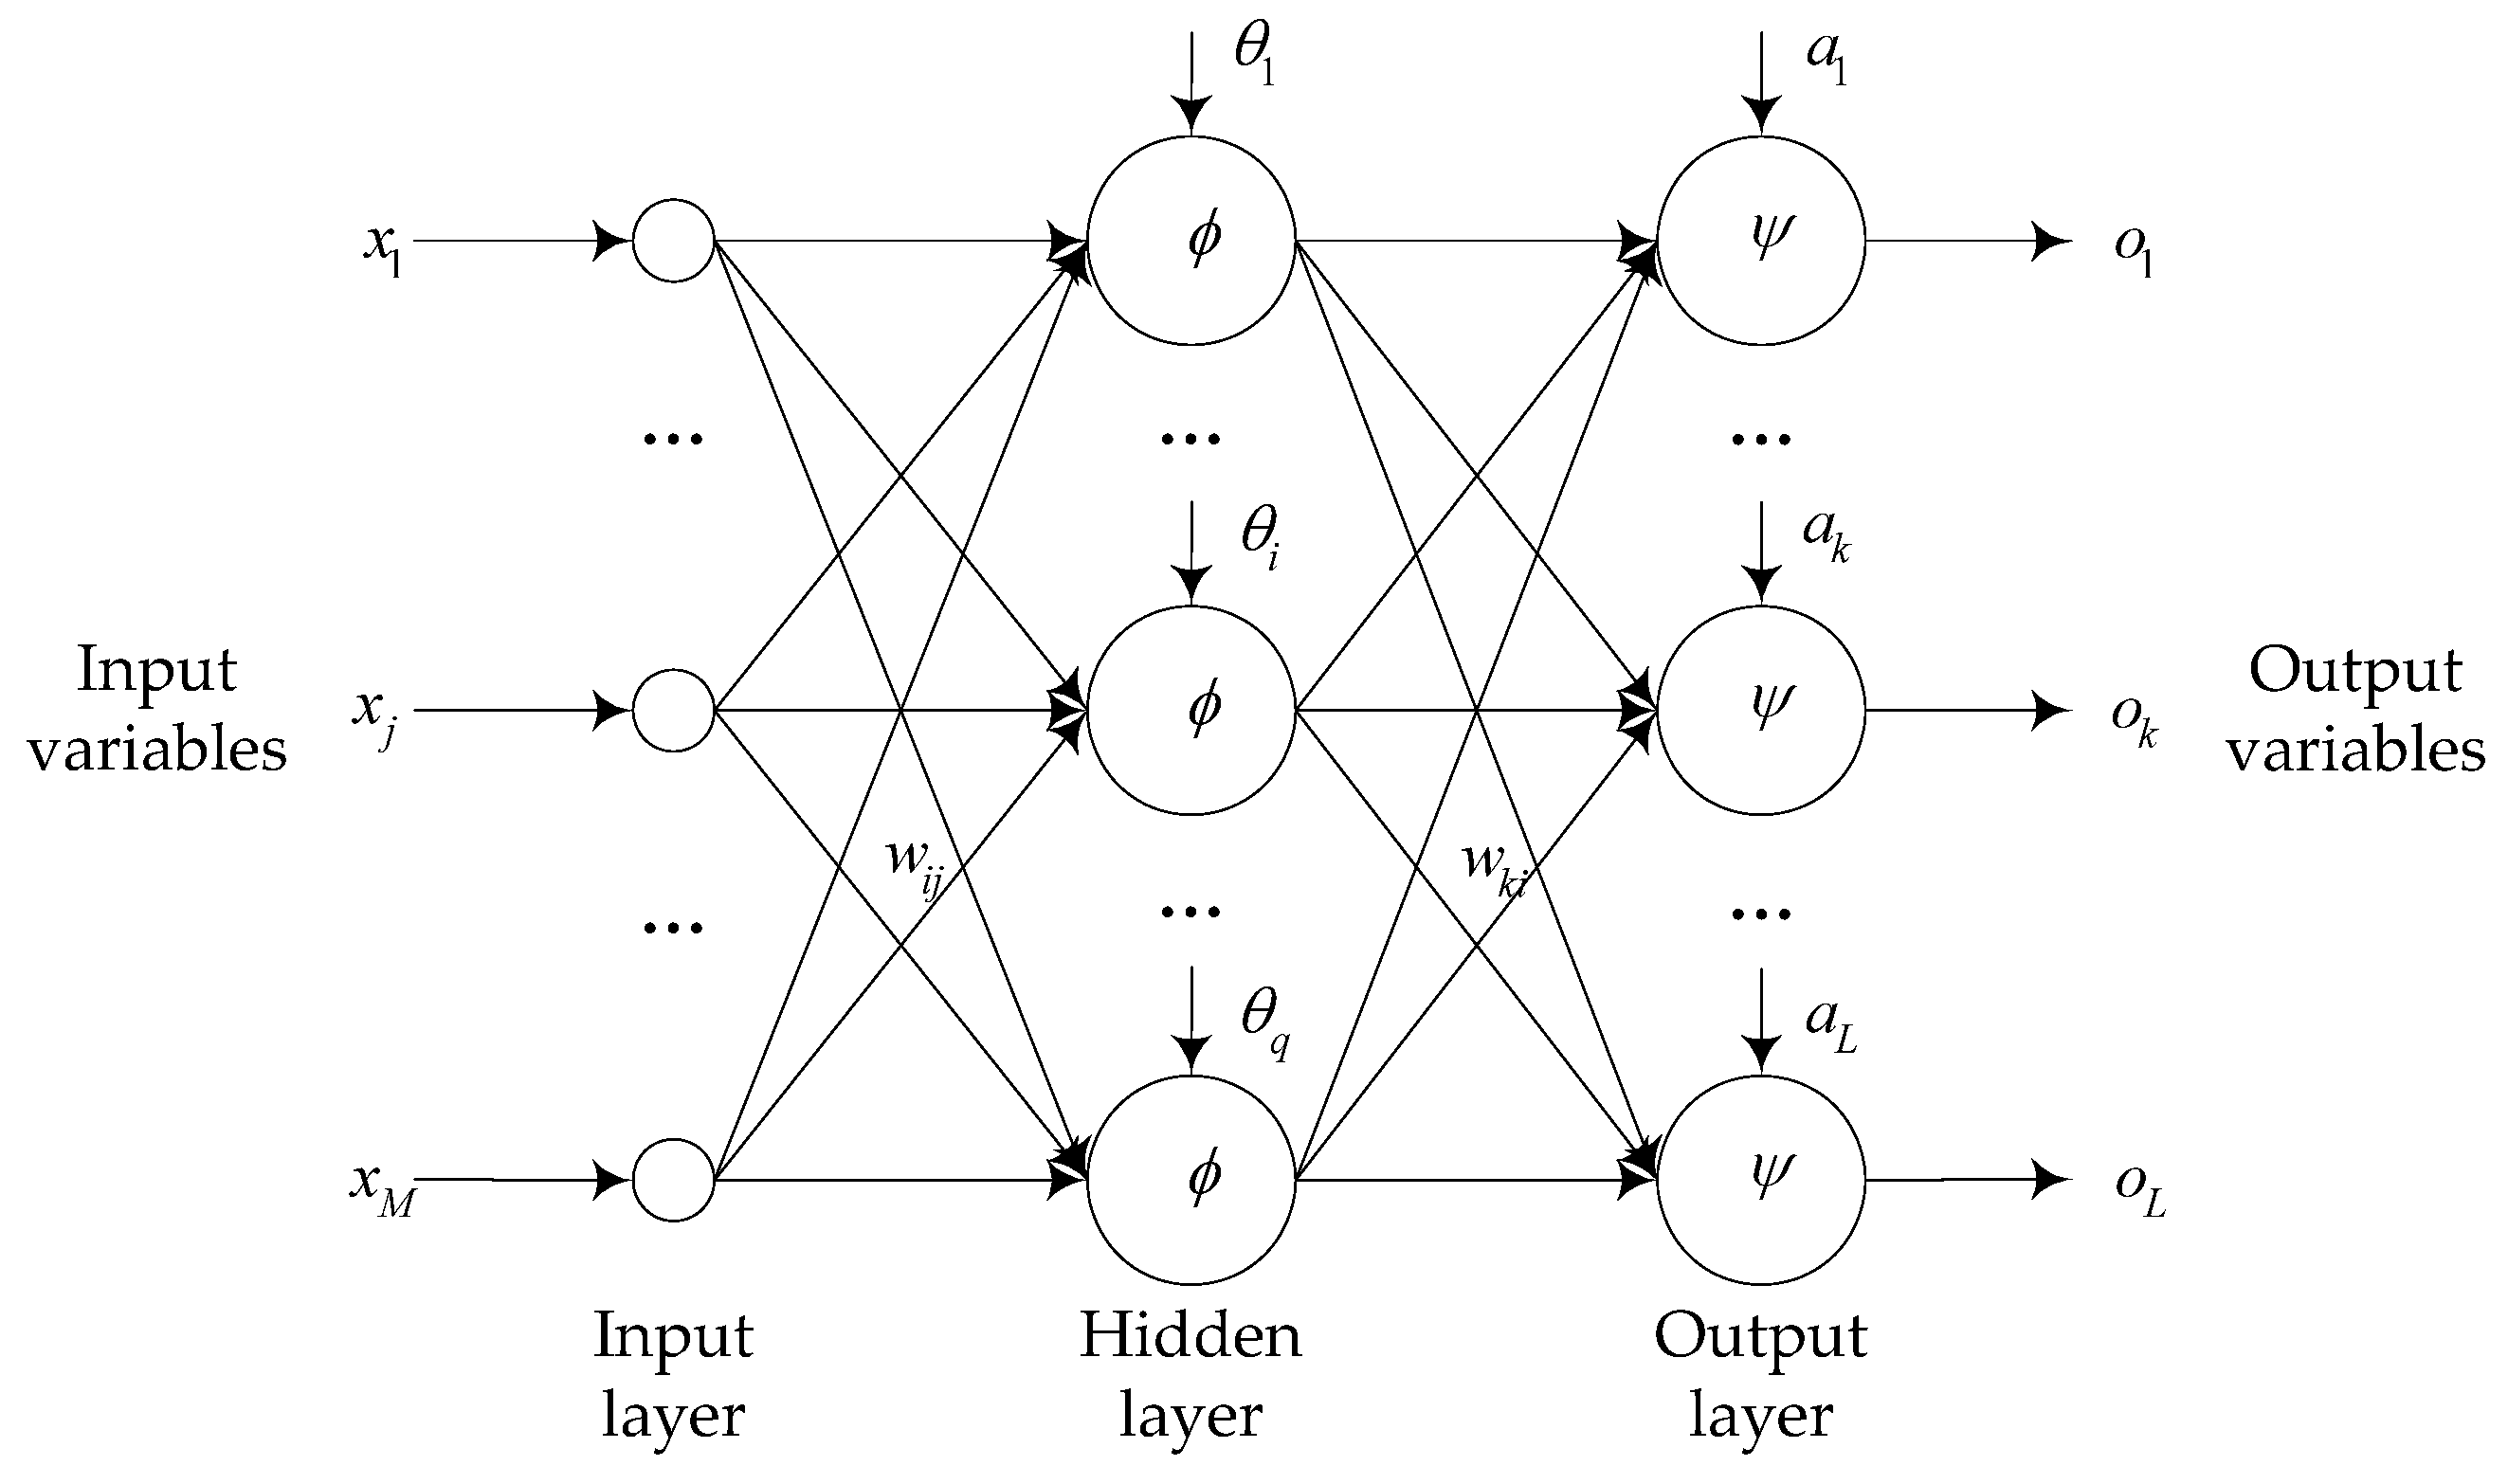
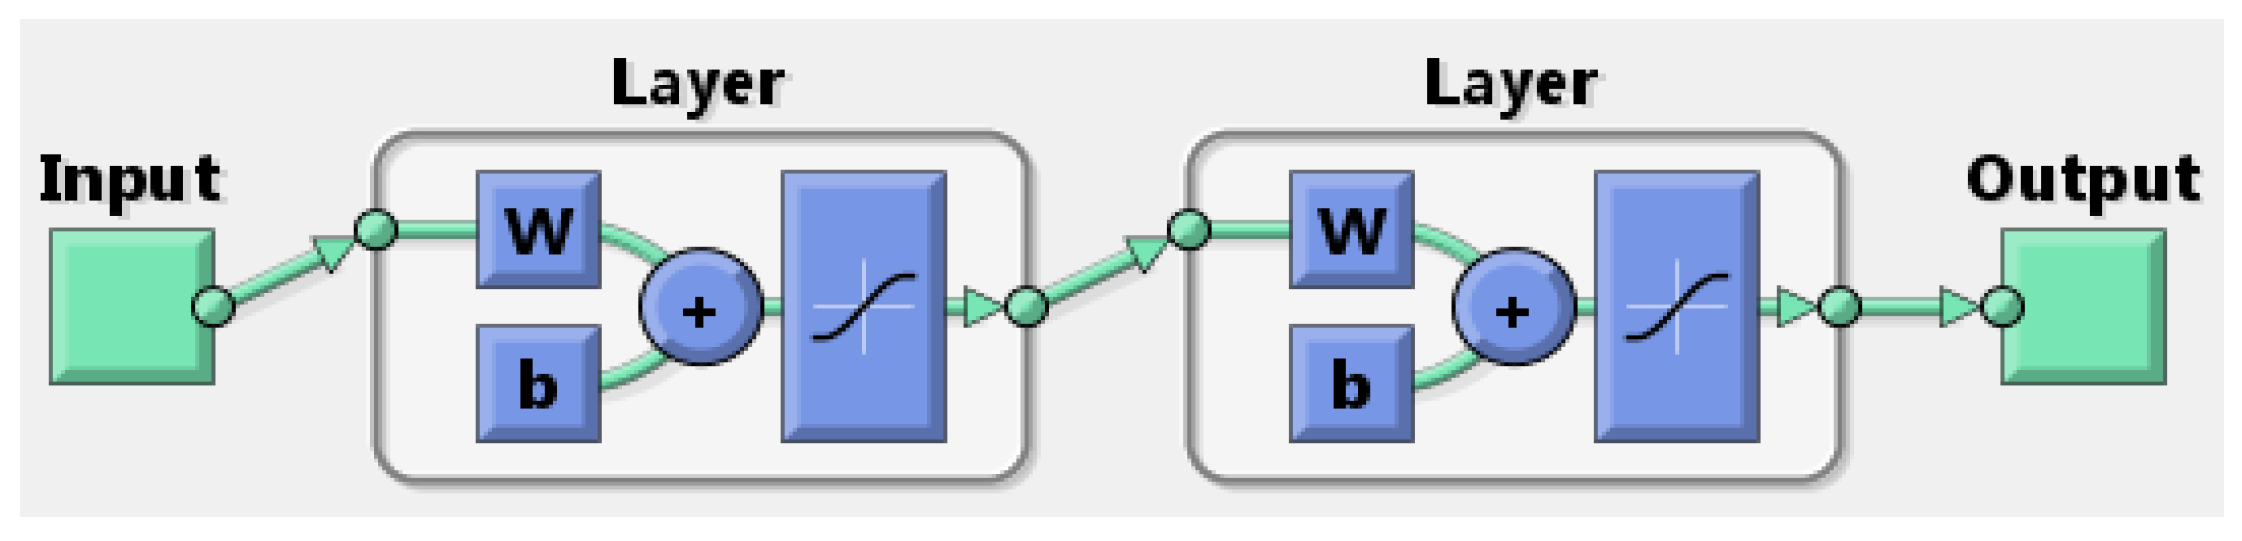
2.2.1. Back Propagation Neural Network Structure
2.2.2. Back Propagation Neural Network Model Algorithm Steps
- (1)
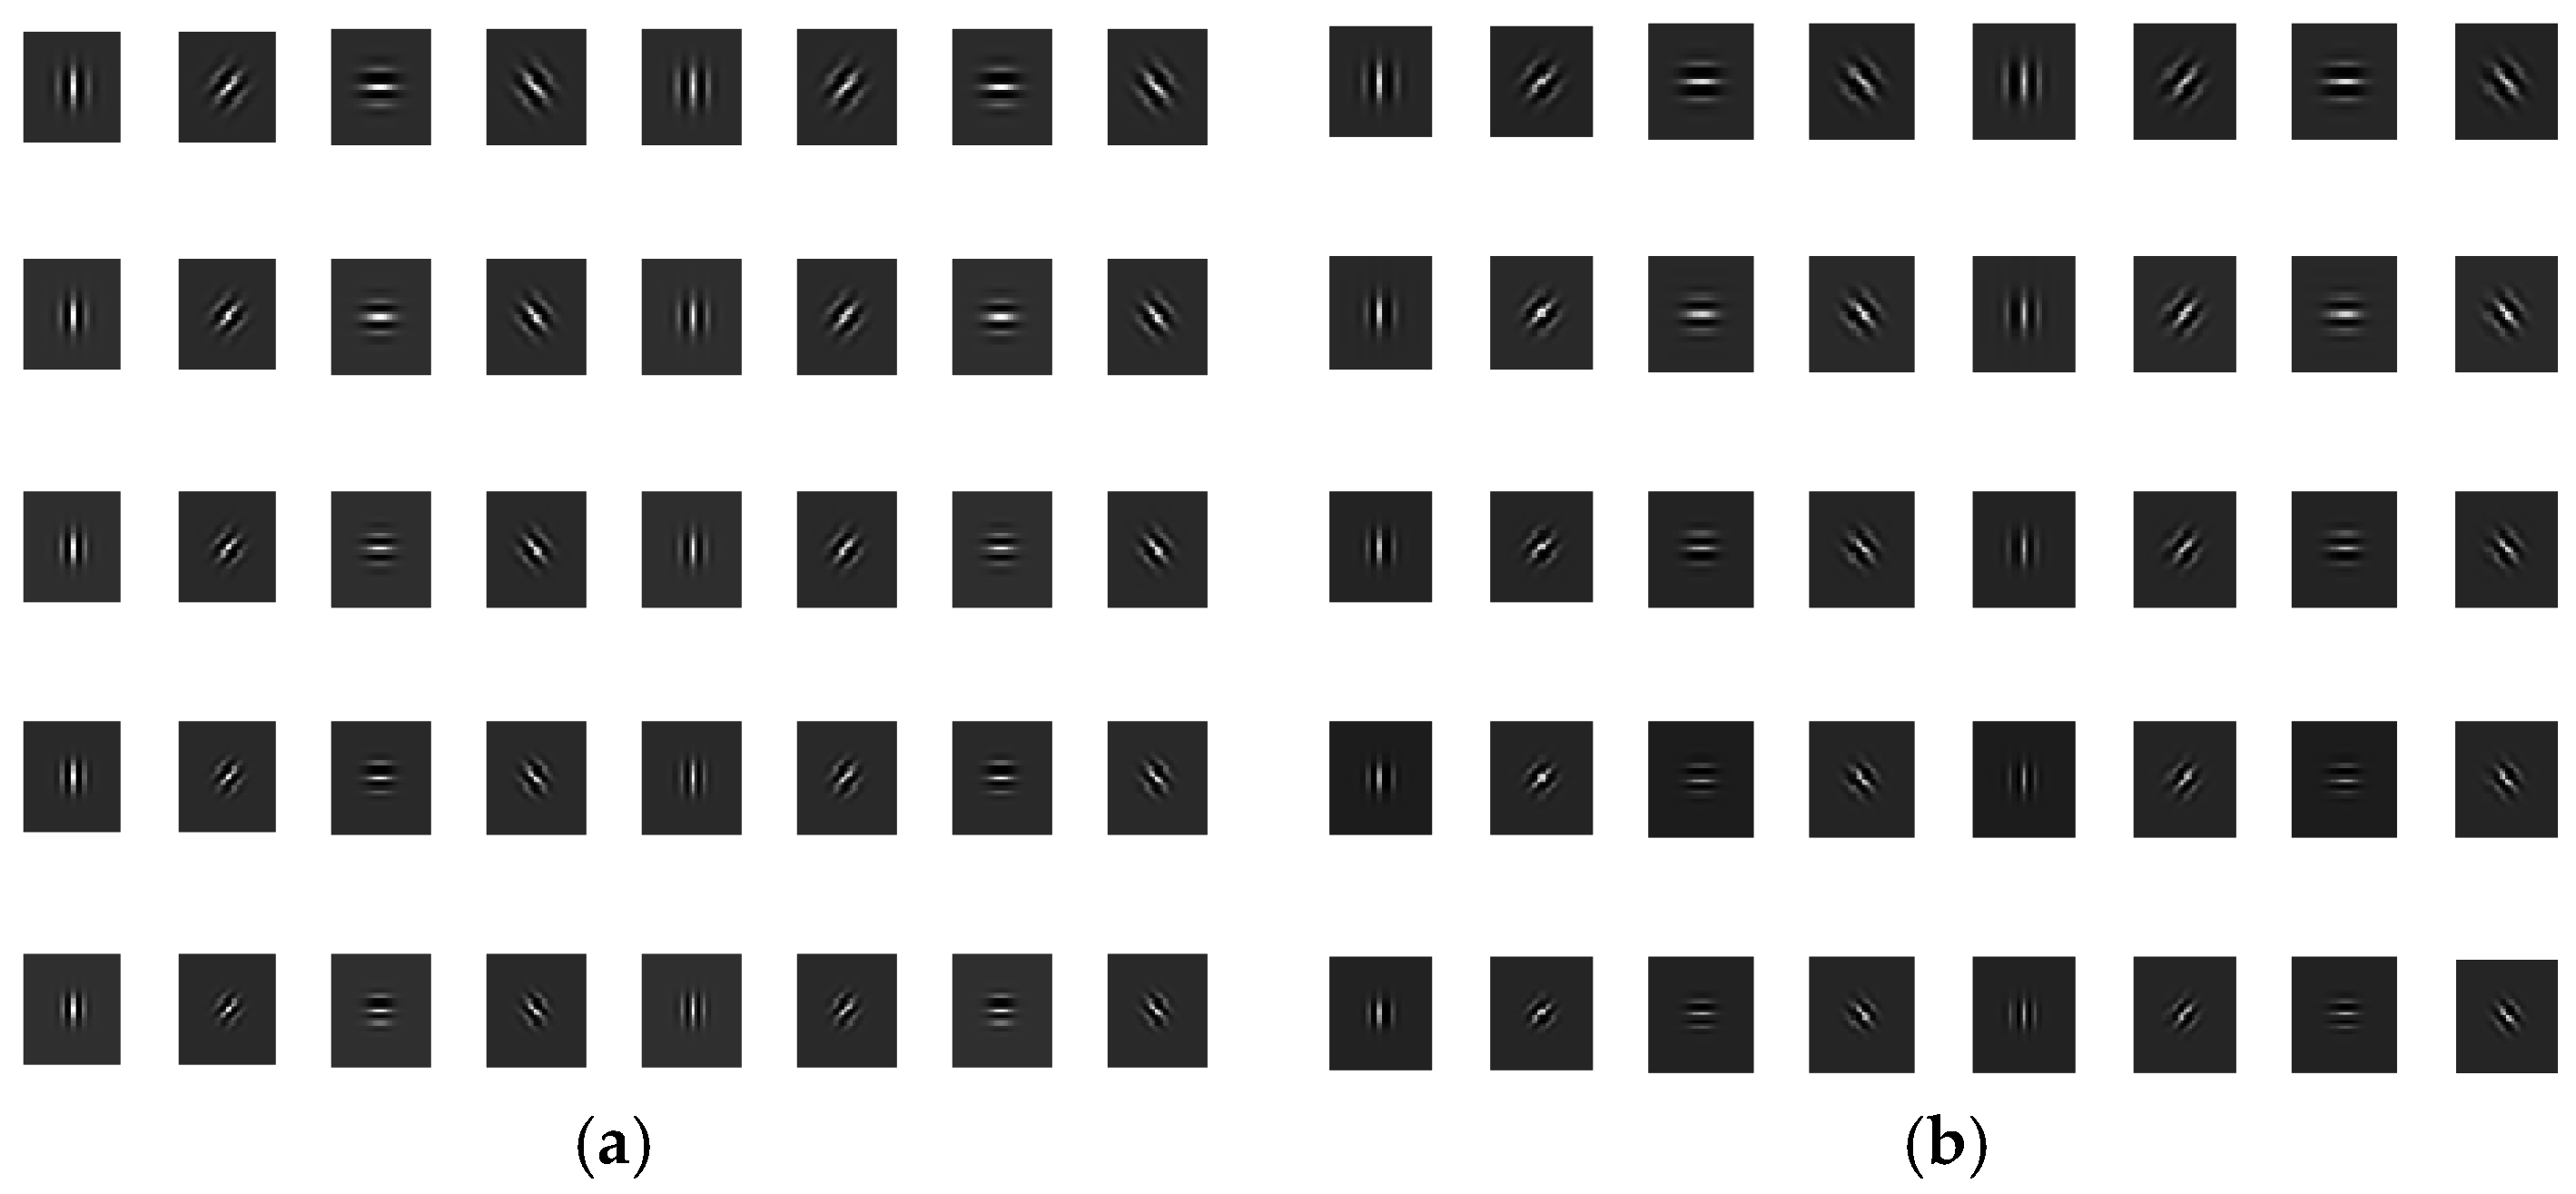
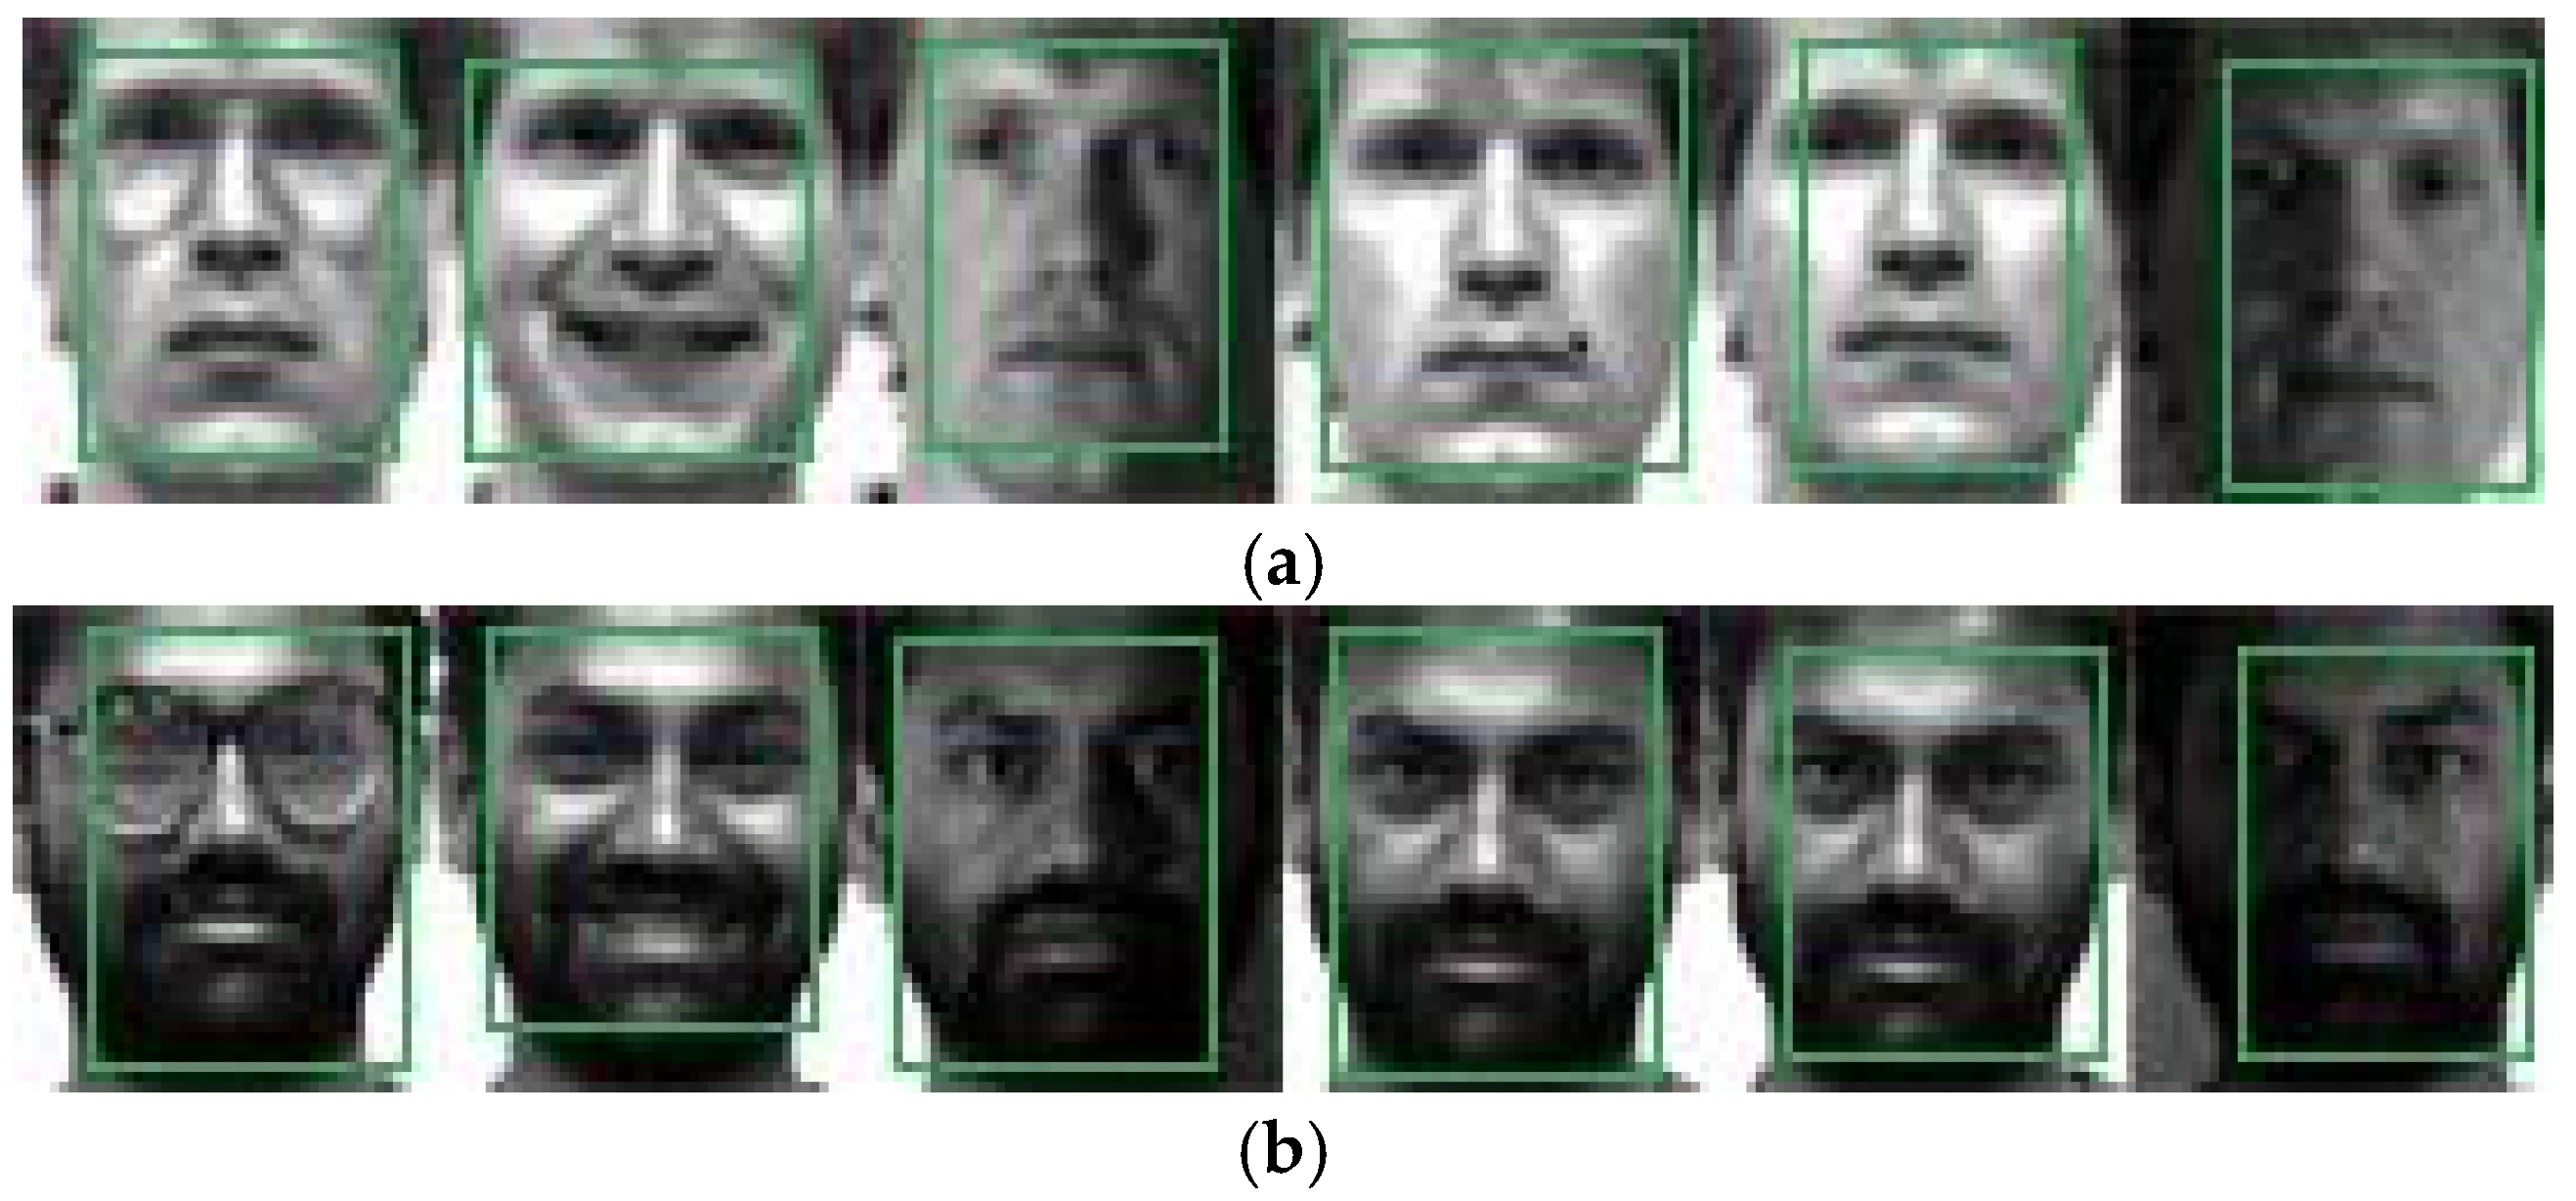
- Conduct convolution between the image to be recognized and the standard template image and improve the resistance against the image luminosity variation. The standard template image is shown in Figure 5 below:
- (2)
- Generate Gabor filters in terms of n frequencies and m orientations. Here, n = 5 and m = 8.
- (3)
- Upload the human-face and the non-human-face images as the training samples, extract features of filters generated in Step 1, and adopt the extracted feature data as the input information of the BP neural network model.
- (4)
- Build the BP neural network model and refer to the core network parameters in the following part.
- (5)
- Input the extracted feature data into the BP neural network already built according to Step 3, and train the network. Conduct human face detection of the trained network and draw the human face area on the image.
3. Results and Discussion
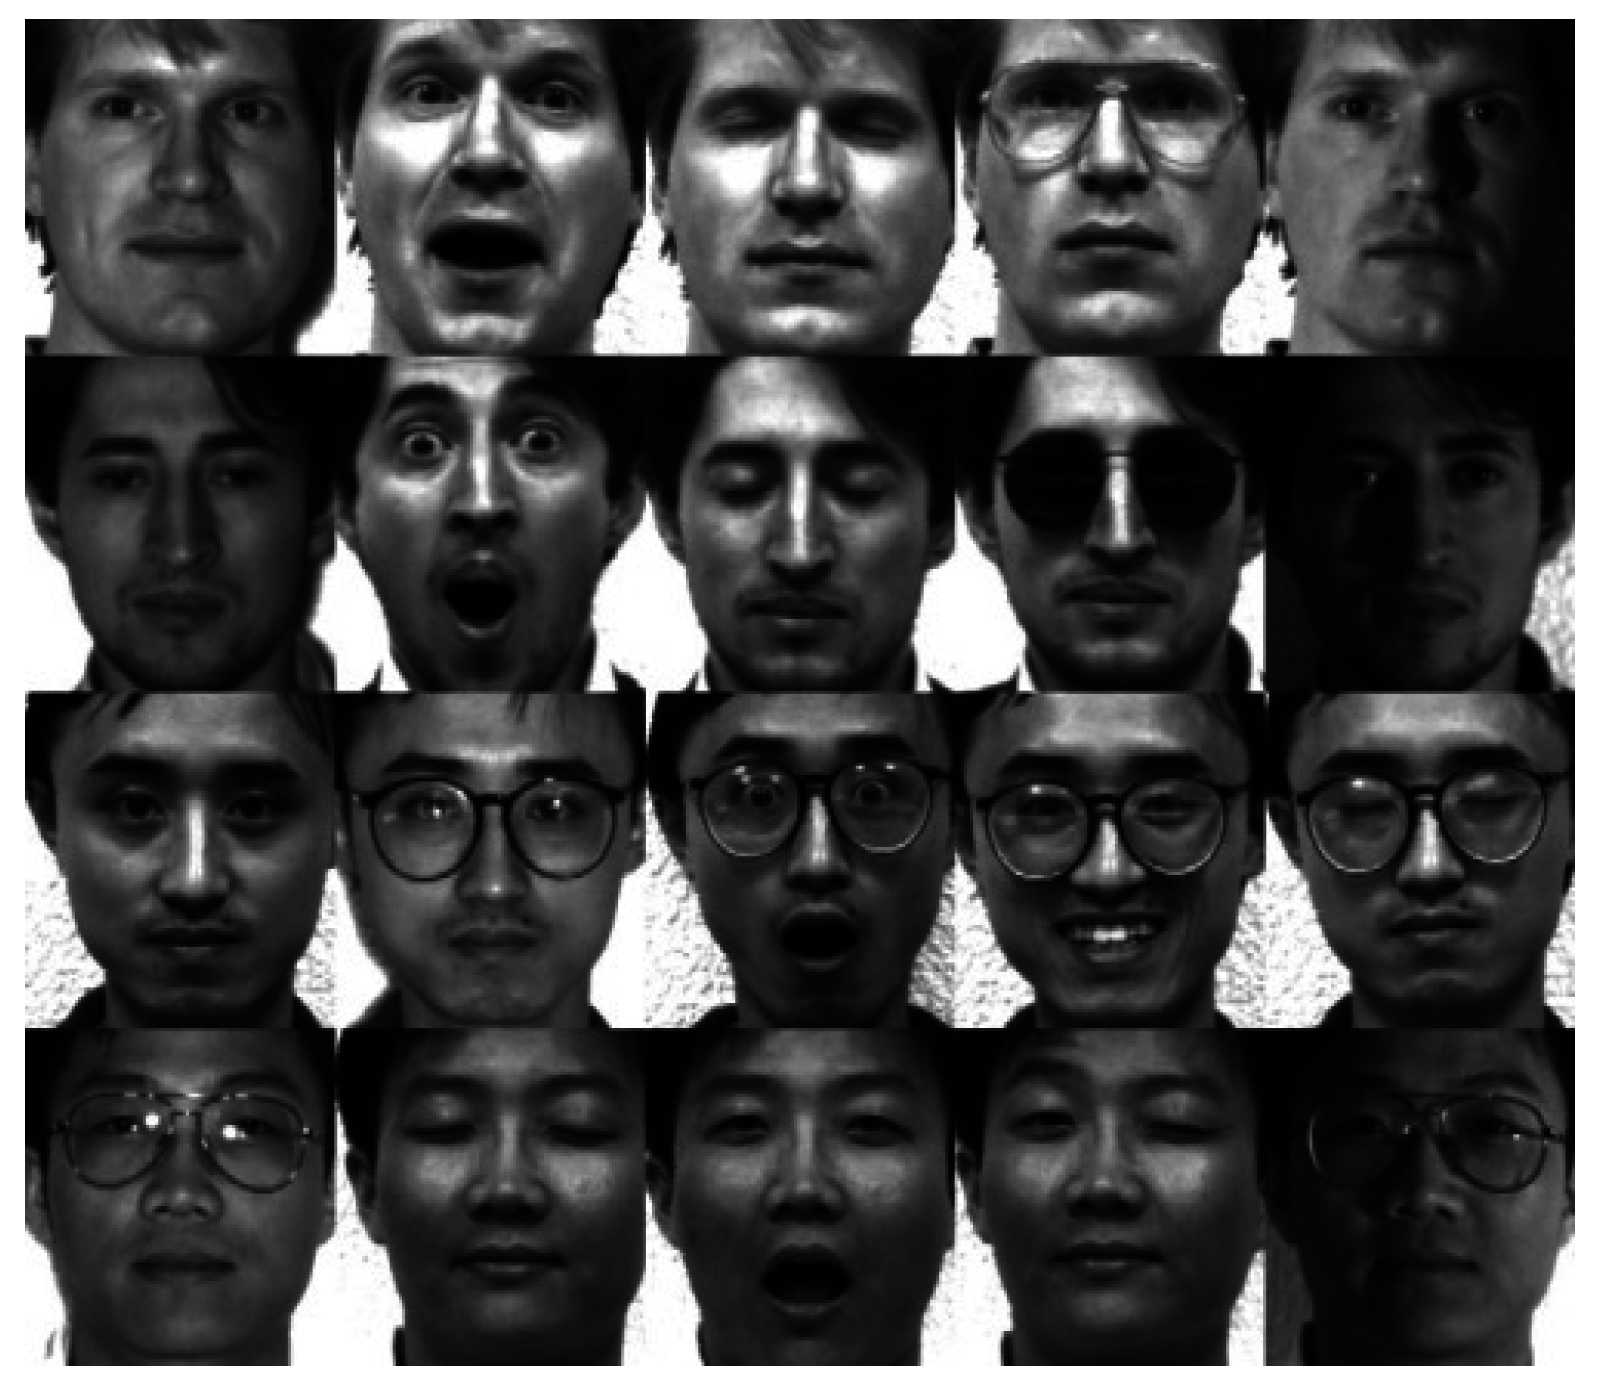
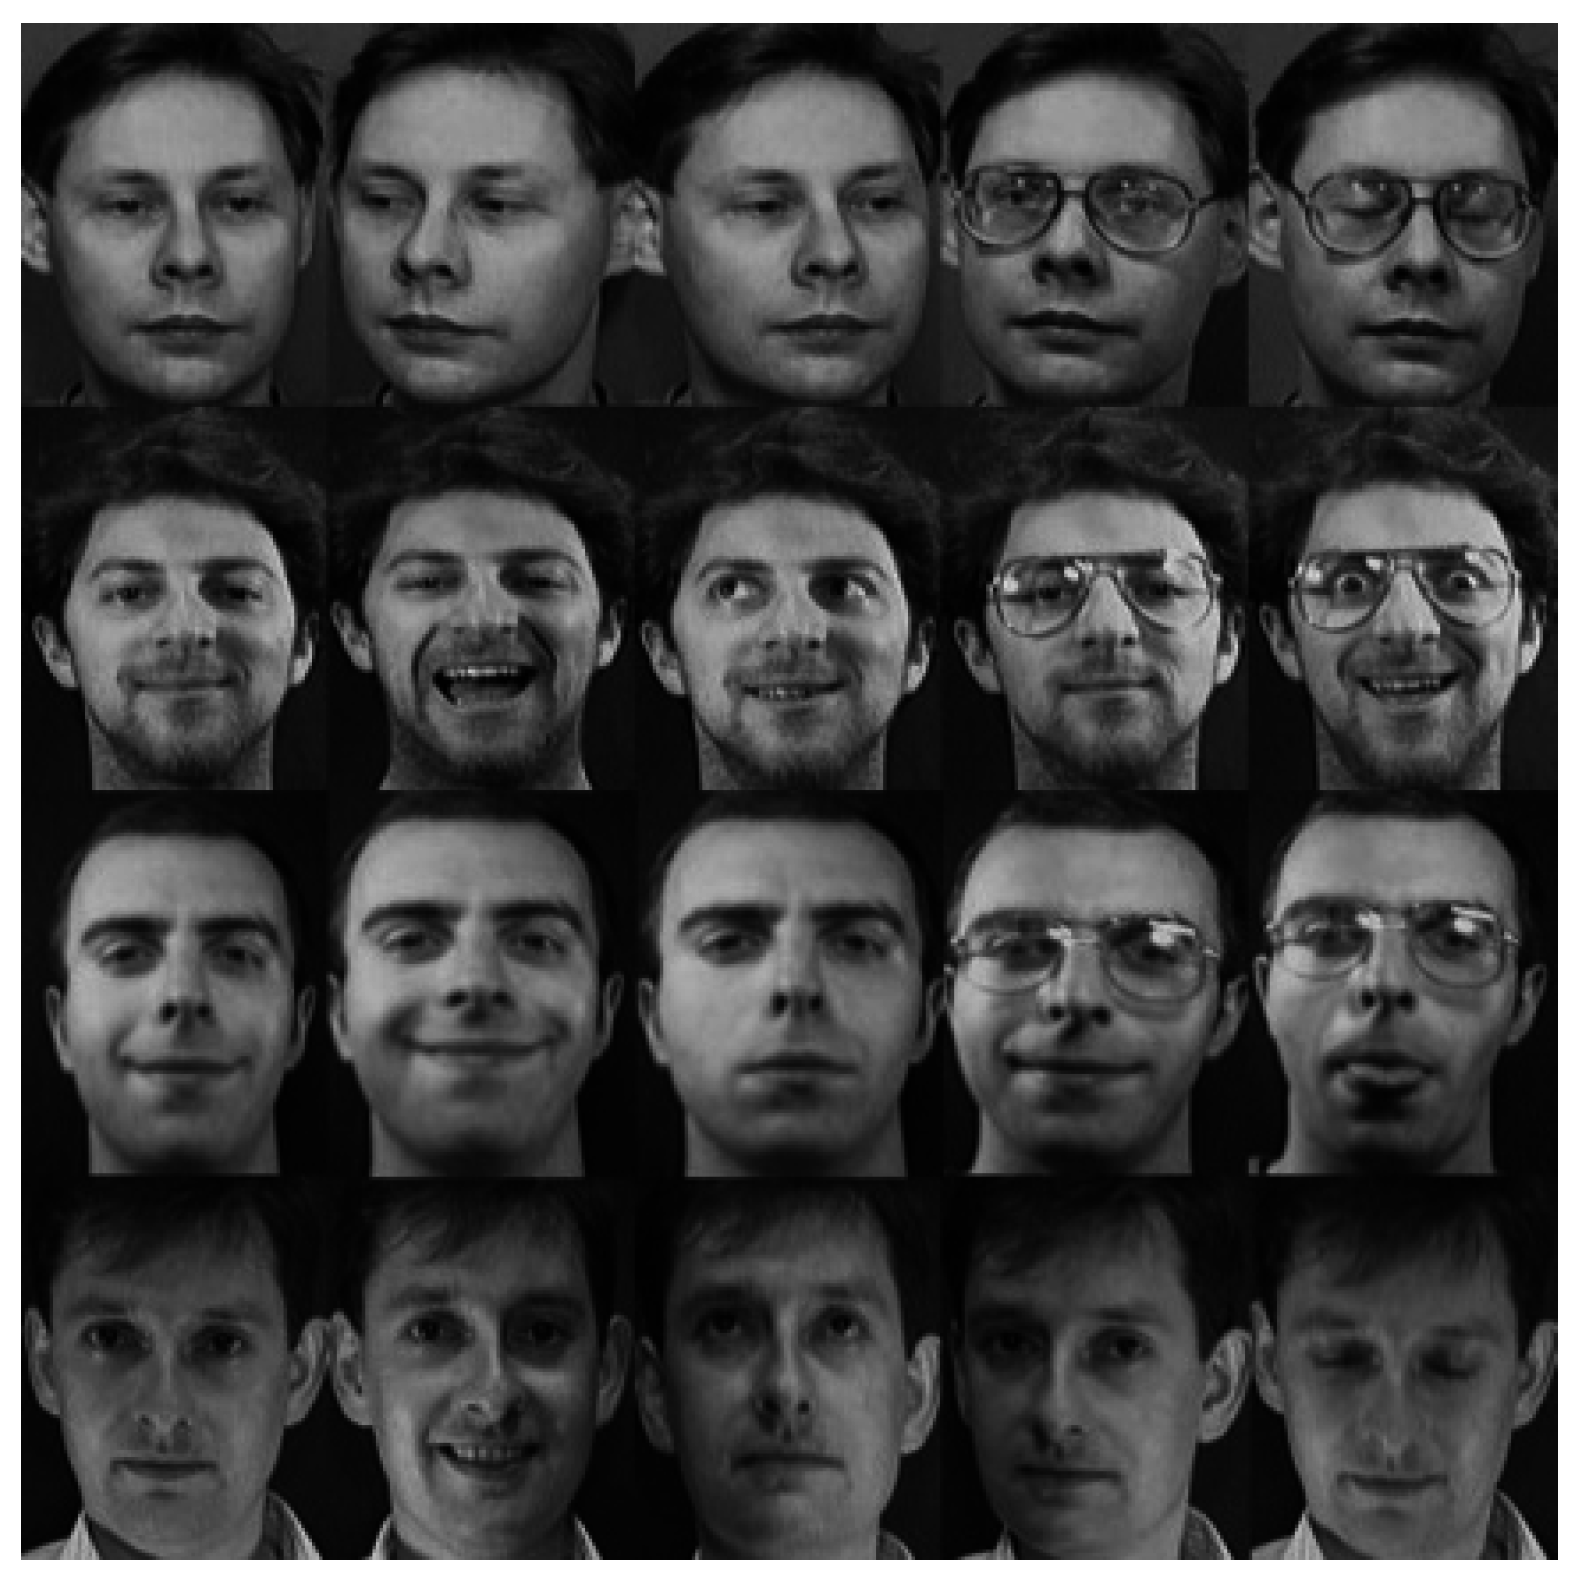
3.1. Experiments and Analysis on the Yale Face Database
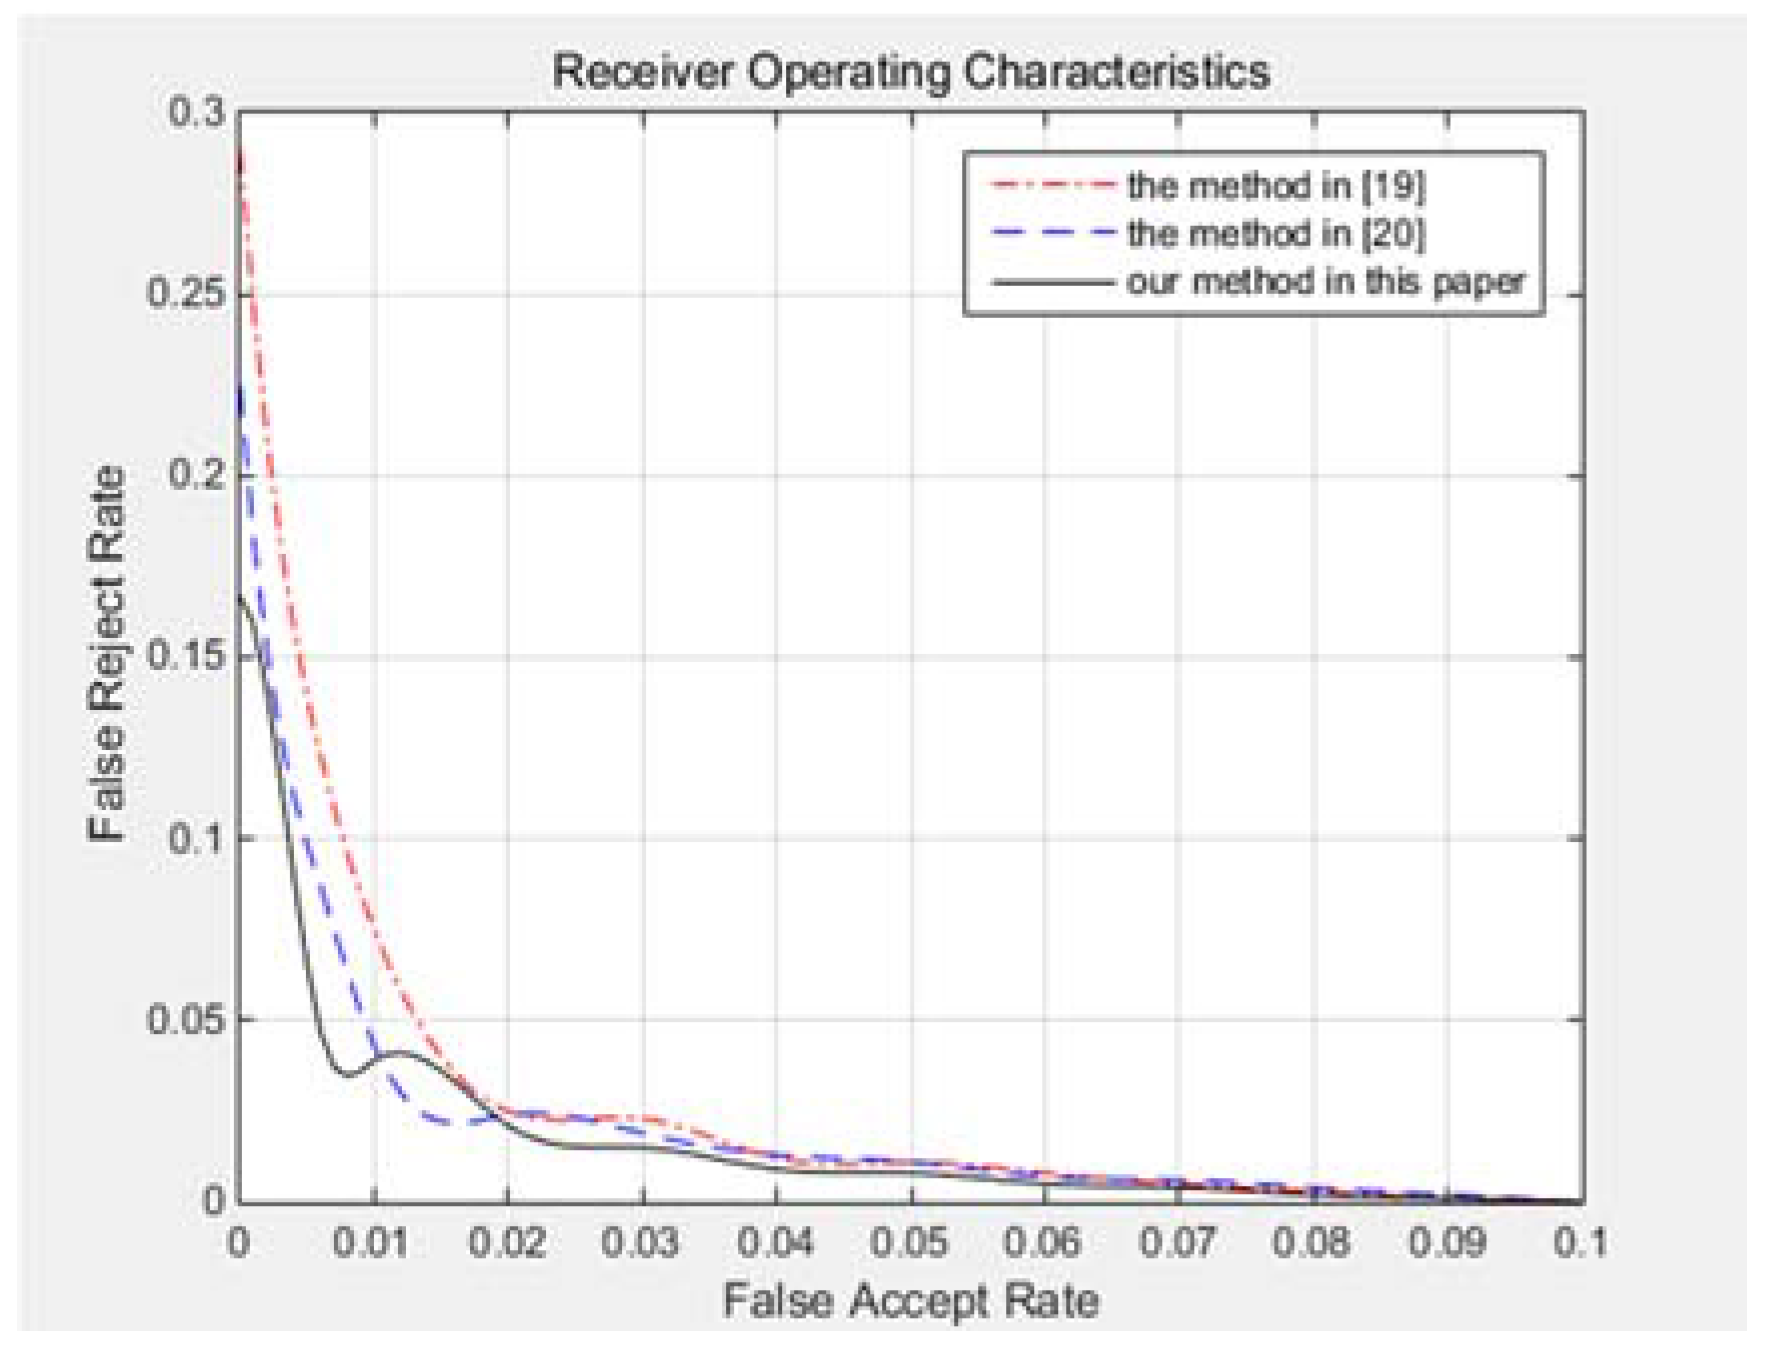
3.2. Experiments and Analysis on the AT&T Database
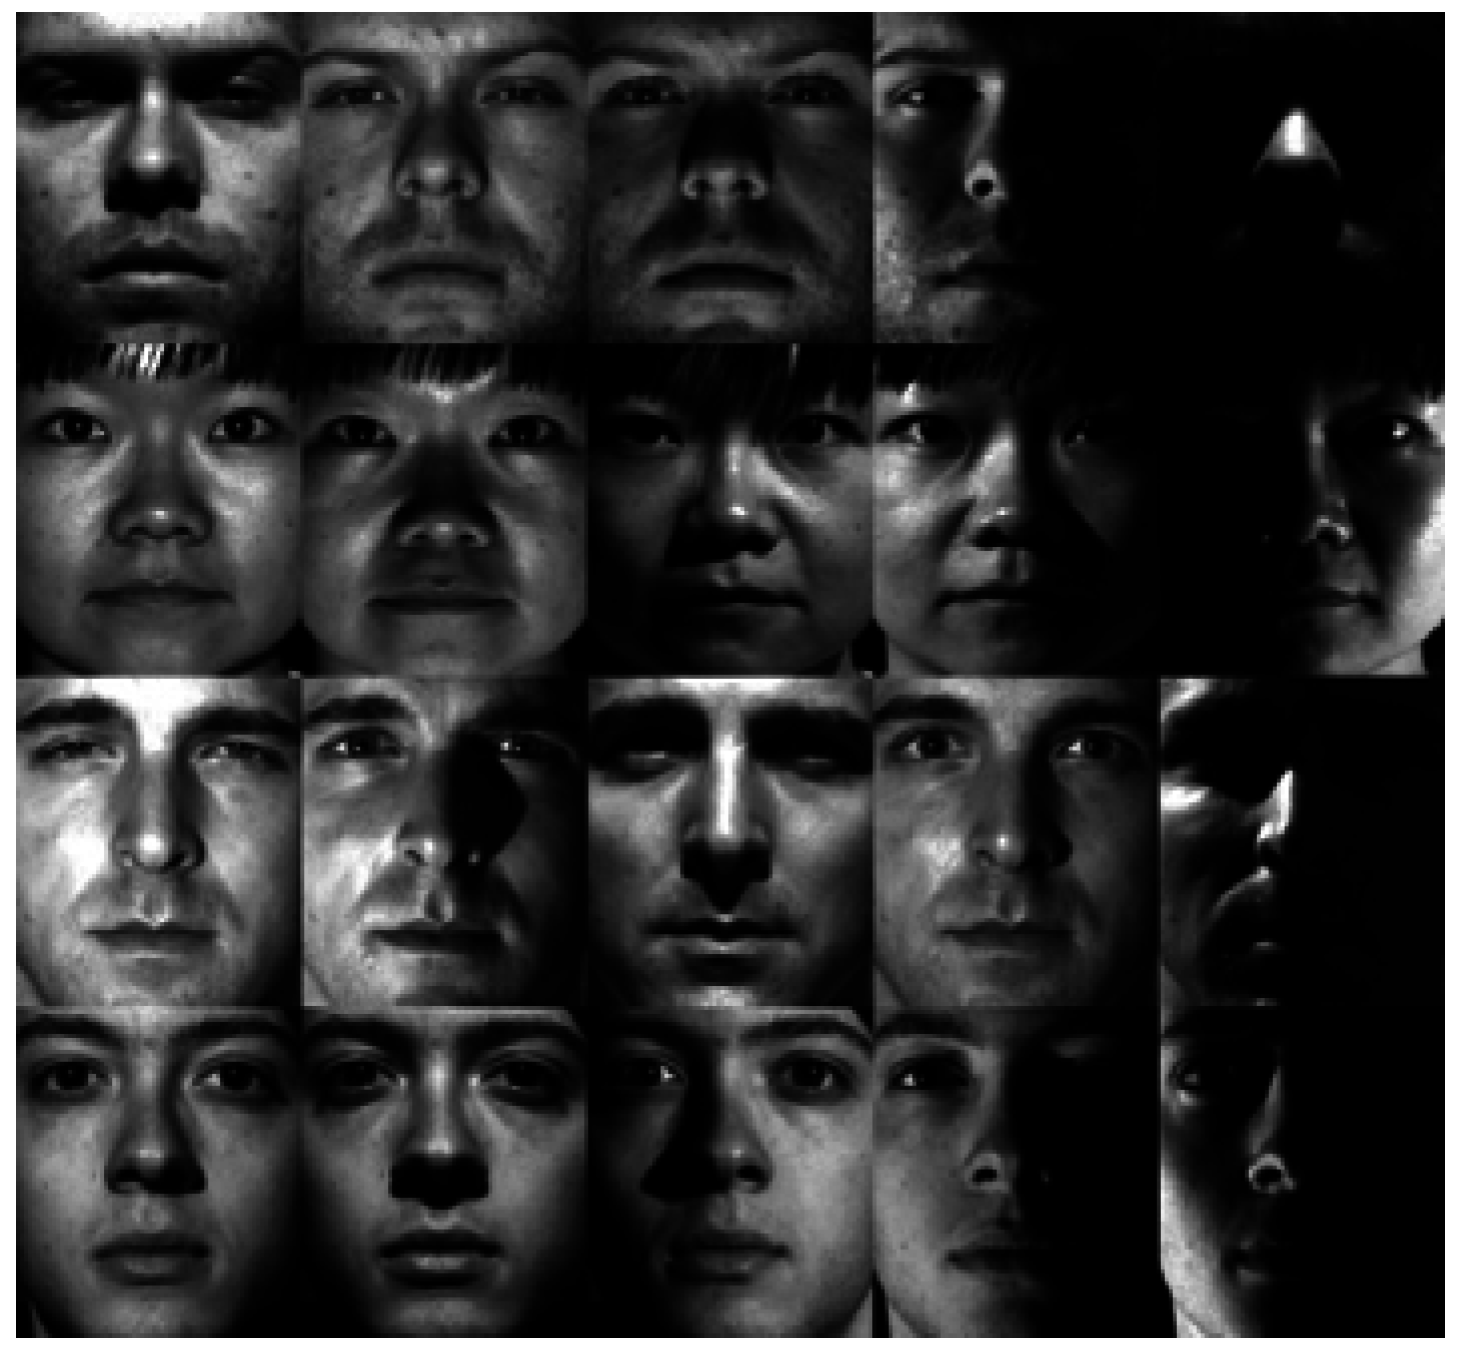
3.3. Experiments and Analysis on the Extended Yale B Face Database
4. Conclusions
Acknowledgments
Author Contributions
Conflicts of Interest
References
- Dong, Y.; Jiang, W. Facial expression recognition based on lifting wavelet and FLD. Opt. Tech. 2012, 38, 579–582. [Google Scholar]
- Zhou, L.J.; Ma, Y.-Y.; Sun, J. Face recognition approach based on local medium frequency Gabor filters. Comput. Eng. Des. 2013, 34, 3635–3638. [Google Scholar]
- Zhan, S.; Zhang, Q.X.; Jiang, J.G.; Ando, S. 3D face recognition by kernel collaborative representation based on Gabor feature. Acta Photonica Sin. 2013, 42, 1448–1453. [Google Scholar] [CrossRef]
- Li, H.; Ding, X. Application research on improved fusion algorithm based on BP neural network and POS. Appl. Mech. Mater. 2015, 733, 898–901. [Google Scholar] [CrossRef]
- Govindaraju, R.S. Artificial neural networks in hydrology. I: Preliminary concepts. J. Hydrol. Eng. 2000, 5, 115–123. [Google Scholar]
- Shao, J. Applications of wavelet fuzzy neural network in approximating non-linear functions. Comput. Dig. Eng. 2013, 41, 4–6. [Google Scholar]
- Wu, W.J.; Huang, D.G. Research on fault diagnosis for rotating machinery vibration of aero-engine based on wavelet transformation and probabilistic neural network. Adv. Mater. Res. 2011, 295–297, 2272–2278. [Google Scholar] [CrossRef]
- Kwolek, B. Face Detection Using Convolutional Neural Networks And Gabor Filters. In Proceedings of the International Conference Artificial Neural Networks: Biological Inspirations (ICANN 2005), Warsaw, Poland, 11–15 September 2005; Volume 3696, pp. 551–556.
- Kaushal, A.; Raina, J.P.S. Face detection using neural network & Gabor wavelet transform. Int. J. Comput. Sci. Technol. 2010, 1, 58–63. [Google Scholar]
- Andrzej, B.; Teresa, N.; Stefan, P. Face detection and recognition using back propagation neural network and fourier gabor filters. Signal Image Process. 2011, 2, 705–708. [Google Scholar]
- Yale Face Database. Available online: http://vision.ucsd.edu/content/yale-face-database (accessed on 14 November 2016).
- Database of Faces. 2016. Available online: http://www.cl.cam.ac.uk/research/dtg/attarchive/facedatabase.html (accessed on 14 November 2016).
- Extended Yale Face Database B (B+). Available online: http://vision.ucsd.edu/content/extended-yale-face-database-b-b (accessed on 14 November 2016).
- Khalil, M.S. Erratum to: Reference point detection for camera-based fingerprint image based on wavelet transformation. Biomed. Eng. Online 2016, 15, 30. [Google Scholar] [CrossRef] [PubMed]
- Yifrach, A.; Novoselsky, E.; Solewicz, Y.A.; Yitzhaky, Y. Improved nuisance attribute projection for face recognition. Form. Pattern Anal. Appl. 2016, 19, 69–78. [Google Scholar] [CrossRef]
- Lades, M.; Vorbruggen, J.C.; Buhmann, J.; Lange, J.; Malsburg, C.V.D.; Wurtz, R.P. Distortion invariant object recognition in the dynamic link architecture. IEEE Trans. Comput. 1993, 42, 300–311. [Google Scholar] [CrossRef]
- Gao, Y.; Zhang, R. Analysis of house price prediction based on genetic algorithm and BP neural network. Comput. Eng. 2014, 40, 187–191. [Google Scholar]
- Lee, K.C.; Ho, J.; Kriegman, D. Acquiring Linear Subspaces for Face Recognition under Variable Lighting. IEEE Trans. Pattern Anal. Mach. Intell. 2005, 27, 684–698. [Google Scholar] [PubMed]
- Ramakrishnan, S. Introductory Chapter: Face Recognition-Overview, Dimensionality Reduction, and Evaluation Methods. Face Recognition-Semisupervised Classification, Subspace Projection and Evaluation Methods; InTech: Vienna, Austria, 2016. [Google Scholar]
- Nanni, L.; Brahnam, S.; Ghidoni, S.; Menegatti, E. Region based approaches and descriptors extracted from the cooccurrence matrix. Int. J. Latest Res. Sci. Technol. 2014, 3, 192–200. [Google Scholar]
- Xie, S.; Shan, S.; Chen, X.; Chen, J. Fusing local patterns of Gabor magnitude and phase for face recognition. IEEE Trans. Image Process. 2010, 19, 1349–1361. [Google Scholar] [PubMed]


| Network Training Parameters | Network Convergence Parameters | ||
|---|---|---|---|
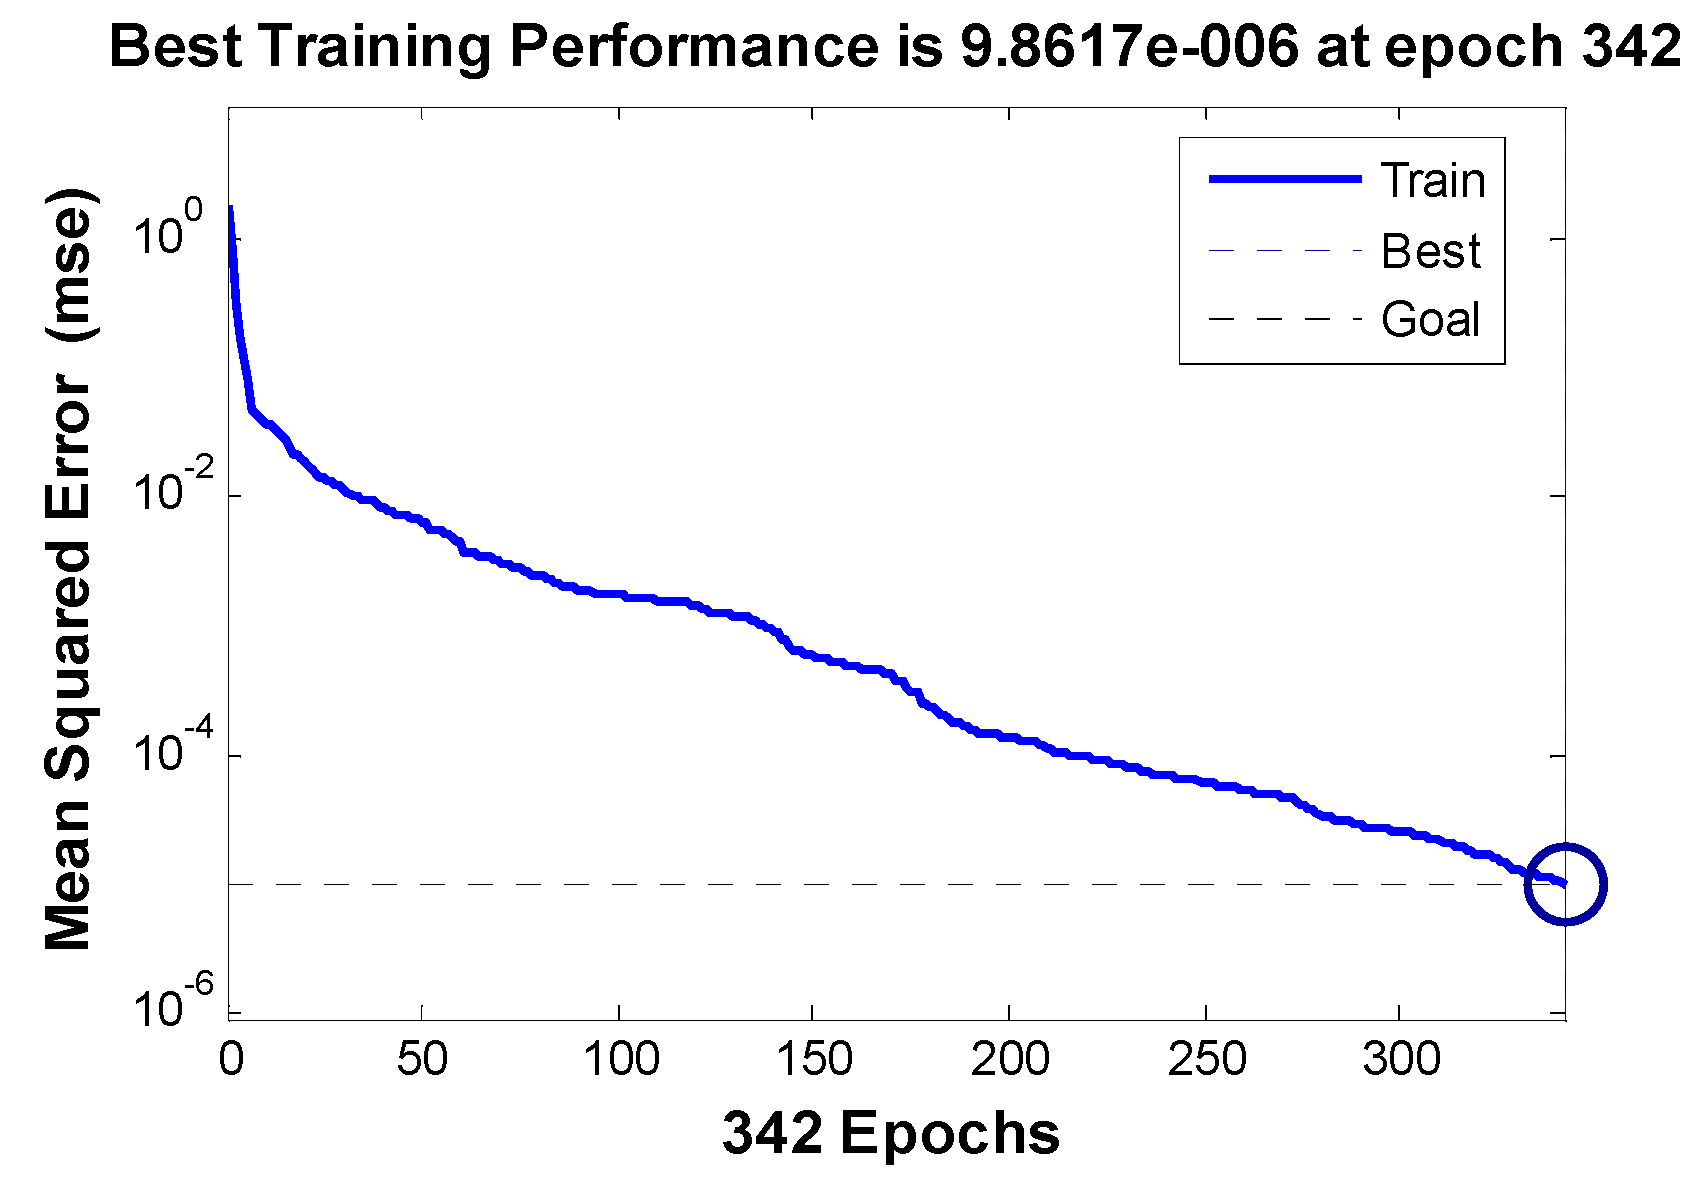
| Number of nodes in the first layer | 100 | Network training times | 342 |
| Number of nodes in the second layer | 1 | Network training duration(s) | 10 |
| Network target error | 1 × 10⁻⁵ | Network convergence error | 9.86 × 10⁻⁶ |
| Network training function | trainscg | Network goodness-of-fit | 0.99999 |
| Test Times | Number of Training Samples | Number of Test Samples | Recognition Accuracy Rate of Training Samples | Recognition Accuracy Rate of Test Samples | Comprehensive Recognition Accuracy Rate |
|---|---|---|---|---|---|
| 1 | 160 | 240 | 0.965 | 0.922 | 0.9392 |
| 2 | 160 | 240 | 0.975 | 0.935 | 0.9510 |
| 3 | 160 | 240 | 0.952 | 0.922 | 0.9340 |
| 4 | 160 | 240 | 0.961 | 0.920 | 0.9364 |
| 5 | 160 | 240 | 0.962 | 0.925 | 0.9398 |
| Methods | Training Sample Numbers | |||||
|---|---|---|---|---|---|---|
| 2 | 4 | 6 | 8 | 16 | 32 | |
| LG, Loris et al.’s method in [20] | 50.49% | 53.29% | 54.32% | 65.77% | 75.32% | 79.36% |
| LGBP, Xie et al.’s method in [21] | 53.65% | 59.35% | 65.89% | 74.49% | 78.96% | 82.32% |
| Our method | 54.76% | 60.78% | 76.44% | 79.53% | 83.56% | 86.23% |
© 2016 by the authors; licensee MDPI, Basel, Switzerland. This article is an open access article distributed under the terms and conditions of the Creative Commons Attribution (CC-BY) license (http://creativecommons.org/licenses/by/4.0/).
Share and Cite
Xu, Y.; Liang, F.; Zhang, G.; Xu, H. Image Intelligent Detection Based on the Gabor Wavelet and the Neural Network. Symmetry 2016, 8, 130. https://doi.org/10.3390/sym8110130
Xu Y, Liang F, Zhang G, Xu H. Image Intelligent Detection Based on the Gabor Wavelet and the Neural Network. Symmetry. 2016; 8(11):130. https://doi.org/10.3390/sym8110130
Chicago/Turabian StyleXu, Yajun, Fengmei Liang, Gang Zhang, and Huifang Xu. 2016. "Image Intelligent Detection Based on the Gabor Wavelet and the Neural Network" Symmetry 8, no. 11: 130. https://doi.org/10.3390/sym8110130