Article

The Novel Concept of “Behavioural Instability” and Its Potential Applications

by
Cino Pertoldi
1,2,*,
Simon Bahrndorff
1,
Zorana Kurbalija Novicic
3,4 and
Palle Duun Rohde
5,6,7
1
Department of Chemistry and Bioscience, Aalborg University, Fredrik Bajers Vej 7H, Aalborg DK-9000, Denmark
2
Department of Zoology, Aalborg Zoo, Mølleparkvej 63, Aalborg DK-9000, Denmark
3
Animal Ecology, Department of Ecology and Genetics, Evolutionary Biology Center, Uppsala University, Norbyvägen 18D, SE-752 36 Uppsala, Sweden
4
Institute for Biological Research, University of Belgrade, Despot Stefan Blvd. 142, 11000 Belgrade, Serbia
5
Center for Quantitative Genetics and Genomics, Department of Molecular Biology and Genetics, Aarhus University, Tjele 8830, Denmark
6
iPSYCH, The Lundbeck Foundation Initiative for Integrative Psychiatric Research, Aarhus 8000, Denmark
7
iSEQ, Center for Integrative Sequencing, Aarhus University, Aarhus 8000, Denmark
*
Author to whom correspondence should be addressed.
Symmetry 2016, 8(11), 135; https://doi.org/10.3390/sym8110135
Submission received: 29 August 2016 / Revised: 11 November 2016 / Accepted: 14 November 2016 / Published: 18 November 2016
(This article belongs to the Special Issue Fluctuating Asymmetry 2016)

Abstract

:
The concept of developmental instability (DI) is a well-known indicator of environmental and genetic stress and is often investigated using various indices such as fluctuating asymmetry, directional asymmetry, antisymmetry and phenotypic variance. Investigations dealing with DI are using morphometric traits. The aim of this investigation is to present the novel concept of behavioural instability in which the trait measured is a behavioural trait. We apply the conventional indices used for the estimation of developmental instability on directional movement—clockwise (CW) and counter-clockwise (CCW) movement of 19 highly inbred lines of Drosophila melanogaster tested in a circular arena. We show that it is possible to quantify behavioural instability using the indices traditionally used to investigate DI. Results revealed several significant differences among lines, depending on the index utilized. The perspectives of utilizing the concept in biological research such as toxicology, evolutionary and stress biology are discussed.

1. Introduction

1.1. Developmental Instability

Random processes can cause the deviation of a trait from its expected phenotype [1]. The capacity to buffer these processes can be determined by the individual’s genotype and the environment in which the individual is embedded [1,2], producing the “so-called” developmental instability (DI). Waddington [3] proposed the concept of developmental homeostasis (or homeorhesis), the stabilized flow of a developmental trajectory. Developmental instability has been suggested to respond to various genetic and environmental stressors [4,5] and to be correlated with several life-history traits [6]. The concept of DI is also linked to the concept of incidence of phenodeviants, which can be defined as sporadic, abnormal morphological deviations [7].

1.2. Phenotypic Variance

At the population level, DI can be estimated by the phenotypic variance of morphological traits (σp2) [8,9] or by using fluctuating asymmetry (FA) [1]. In a sexually reproducing population, σp2 is given by: σp2 = σg2 + V σe2 + σs2, where σs2 is the stochastic variance, which is equivalent to DI according to [10]. Therefore, it is only when environmental variability (σe2) and σg2 are negligible that σp2 can be utilized for the estimation of DI [11]. Hence, the use of σp2 as an estimator of DI is restricted to investigation with monoclonal strains or highly inbred strains where the within line genetic variance can be considered equal to 0 (gp2 = 0). However, even using monoclonal strains the σp2 estimates can be affected by σe2 [12]. The genetic factors that increase the developmental instability might be high levels of inbreeding [13] and hybridisation [2]. The environmental factors might be unusual temperatures [14] and chemical pollution [15,16,17].

1.3. Fluctuating Asymmetry

The dissimilarity in the expression of a given character on the right and left sides of an individual are not affected by differences in genotype or environment as the environment experienced by an individual is identical on the right and left side [1].
Fluctuating asymmetry can be estimated as FA; |FA|= ∑ |rl|/N. FA1 index and the scaled FA index; and |rl|/(0.5r + 0.5l) (FA3 index), which is equivalent to the mean of the absolute value of the difference between the left and right side divided by the population trait size [1].
The two mentioned indices of FA are probably the most used, and a list of the most frequently used indices are given in [1]. However, there are several other indices that can be used, and their performance depends on whether the FA of a trait is most correlated to its mean or its σp2 [18,19].
When using the two FA indices mentioned, it is advised to use both parametric and non-parametric tests since both the absolute FA and the variance tend to violate the assumptions of parametrical statistical tests. Fluctuating asymmetry is traditionally thought as being the only asymmetry that relates to accidents during morphogenesis and hence developmental instability [1].

1.4. Directional Asymmetry and Antisymmetry

Three kinds of asymmetry have been found in organisms: directional asymmetry, antisymmetry and fluctuating asymmetry [2,14]. The two asymmetries first mentioned are adaptive and can be represented by an intended phenotype. Directional asymmetry occurs whenever there is normally a greater development for one side of a trait than for the other [2,14]. The definition of antisymmetry is when one side of a character is larger than the other, but, compared to directional asymmetry, it is variable as to which side is becoming larger [2,14]. It has been discussed whether directional asymmetry and antisymmetry can be used to estimate developmental instability [14]. Some methods have been developed for removing or decomposing mixture distribution into directional asymmetry (DA), antisymmetry (AS) and fluctuating asymmetry (FA) [20,21].

1.5. Behavioural Instability

Studies on developmental instability have commonly been conducted on morphometric traits. However, in this investigation, we will apply the approaches utilized for such investigations on behavioural data and demonstrate that, in all cases in which behavioural data can be transformed into a bilateral trait, we will be able to estimate the DI of the behavioural trait using the FA indices mentioned above. The concept of behavioral phenodeviance was introduced by [22], which provided examples on how abnormal or phenodeviant behavior can compromise fitness in Drosophila and man.
As behaviour can change very fast, it can have applications in toxicological fields and one example was provided by [23]. In order to measure stochastic variation of behavioural response, they assessed the stability of the isolation reaction of blue mussel Mytilus edulis at regular changes of salinity.
Recently, several efforts have been devoted to the attempt of associating abnormal behavior with the genomic pool of an individual, and, as an example, for schizophrenia, it was assessed that the odds of the disease increased by 17% for each 1% increase in the genome-wide autozygosity [24]. There is, therefore, an urgent need for quantitative methods, which can help in finding associations between the behaviour and the genomic compositions. The aim of this investigation is to present the novel concept of behavioural instability in which the trait measured is a behavioural trait.

2. Material and Methods

2.1. Behavioural Data

Nineteen inbred lines of the Drosophila melanogaster Genetic Reference Panel (DGRP) were used in this investigation, and the flies have been inbred for at least 20 generations of full-sibling inbreeding of their progeny [25]. The fact that the lines are inbred let us assume that the within line is σg2 = 0, and, consequently, we expect that σp2 = σe2 + DI. Considering that all experiments have been conducted under the same environmental conditions, we further assume that σe2 = 0; thus, σp2 = DI.
Thirty flies of each line were placed singularly in circular arenas with a diameter of 1.6 cm. The platform (created in transparent polycarbonate to allow illumination of each arena from below and video recordings from above) consisted of a 120 mm × 120 mm plate containing 36 individual circular arenas.
The flies were immediately recorded once placed in the arenas, and the videos were analysed using the tracking software EthoVision XT (version 10) from Noldus (Wageningen, The Netherlands).
In order to minimize the environmental variance, all of the lines were treated under the same conditions, reared on oatmeal-sugar-yeast-agar medium and maintained at light-dark (LD) 12:12 h light/dark cycles and a constant temperature of 22.5 °C. The data were collected in the first 10 min. In order to avoid a bias produced by circadian rhythm, all of the experiments were performed between 00:00 and 03:00 Zeitgeber diurnal time. Only 2–3 day old male flies were utilized in the investigation. Further experimental and data processing descriptions can be found in [26].
The phenotype considered in this investigation is the number of directional movements—clockwise (CW) and counter-clockwise (CCW) movement, which has been made by individual flies in the circular arena.
The clockwise and counter clockwise movements were recorded when flies were in forward motion. Flies that were not in a forward trajectory but nevertheless rotating in one spot to the right or left were also included. The number of clockwise and counter-clockwise movements (defined as the number of times a fly moves more than 90 degrees in either direction) made by the fly in the arena in the 10 min interval will be considered as the right and left trait, respectively, in the same way in which a bilateral morphometric trait is typically measured.

2.2. Phenotypic Variance

For every line, we have obtained 30 values of clockwise (r) and counter-clockwise (l) movements and the individual mean (r + l)/2, the overall mean, the median, the variance, the 95% confidence interval, the skewness and kurtosis of the number of clockwise (r) and counter-clockwise (l) movements were estimated. The variance of the distribution (r + l)/2, is in this work defined as σp2. For clarity in the rest of the article, the number of clockwise and counter-clockwise movements will be mentioned as r and l, respectively.
Shapiro Wilk’s tests were utilized for testing for significant deviations within line of the (r + l)/2 distributions from normal distributions.
The log-transformed σp2 values estimated within a line were compared among lines with an F-test [27].
A Pearson Product moment correlation analysis was conducted within every line between the r and l in order to detect the presence of σe2.
Pertoldi et al. [12] suggested a methodology for detecting the presence of σe2; given the fact that σp2 = σ2(r+l) = σr2 + σl2 + 2cov(r,l) and σ2(r−l) = σr2 + σl2 − 2cov(r,l), (σr2 and σl2 are variances of right and left side) and 2cov(r,l) is the covariance between the right and the left side) in absence of σe2 these two terms should be identical; σ2(r+l) = σ2(rl), if σe2 is present, we get: σr2 + σl2 + 2cov(r,l) = σr2 + σl2 2cov(r,l) + σe2 rearranging σe2 = 4cov(r,l).
Environmental variance can simply be calculated as four times the covariance between the right and left side, as cov(r,l) = r(r,l) × σr × σl (where r is the Pearson product moment coefficient of the correlation between r and l values. Hence, if the regression coefficient of r versus l is not significantly different from zero, then σe2 ≈ 0. Consequently, if σe2 ≈ 0, we can consider σp2 as a reliable estimator of DI. If σe2 ≠ 0 and the correlation between r and l is positive, the σp2 will be overestimated and the FA will be underestimated [9].

2.3. Fluctuating Asymmetry

For every line, the same statistic parameter mentioned above was estimated for the (rl) values and the mean absolute FA; |FA|= ∑ |rl|/N. (FA1 index) and the scaled FA index; |rl|/(0.5r + 0.5l) (FA3 index) were estimated for each line.
Tests for significance differences among lines of the median of the distributions of the individual mean and of the FA1 and FA3 indices were performed with Kruskal–Wallis tests, followed by pairwise Mann–Whitney tests.

2.4. Directional Asymmetry and Antisymmetry

One-sample t-tests were used for testing for significant deviations within line of the (rl) distributions from zero, and this was made for detecting the presence of directional asymmetry (DA).
Shapiro Wilk’s tests were utilized for testing for significant deviations within line of the (rl) distributions from normal distributions. Deviations from normal distributions can be due to strong skewness, leptokurtic and platykurtic distributions. Platykurtic distributions could indicate the presence of antisymmetry (bimodality) (AS) [1,14].

2.5. Scaling of Fluctuating Asymmetry with the Mean

For testing whether there is a dependence of FA1 on trait size, we used a linear least squared analysis, and we determined the R and the significance of the regression line. The Bonferroni correction test for multiple comparisons was used to adjust significance levels in all of the correlation tests [28].

3. Results

3.1. Phenotypic Variance

A significant difference between sample medians of the total activity of the 19 lines was found (Kruskal–Wallis test; H = 185.2, p < 0.0001), and the pairwise differences between the medians, which were tested with Mann—Whitney U-tests, are shown in Table 1. The overall mean of a number of clockwise and counter-clockwise movements and the 95% confidence interval of the total activity of the 19 lines were plotted in Figure 1.
For every line, the means, the variance, the median, the skewness and kurtosis of the total activity have been estimated. In addition, a Shapiro–Wilk’s test for deviation from normal distribution has been tested on every line (Table 2). Some significant deviations from normality were found, but, after Bonferroni correction, the deviations were not significant any longer. However, in Table 2 several leptokurtic and platykurtic distributions are shown by the positive and negative kurtosis values, respectively. In addition, the negative and positive skewness values indicate the presence of skewed distributions.
The F-tests conducted on the log-transformed values of the variance of the total activity among the 19 lines revealed several significant differences, which are listed in the matrix of Table 3.
The Pearson Product moment correlation analyses, which was conducted within every line between the r and l, was conducted in order to detect the presence of σe2, which showed a significant negative relationship in five lines out of 19 lines tested (lines 385; r = −0.81 ***, 392; r = −0.63 **, 491; r = −0.76 ***, 508; r = −0.56 **, 584; r = −0.87 ***, 703; and r = −0.6 ***).

3.2. Fluctuating Asymmetry

The variance, the median, the skewness and kurtosis of the signed fluctuating asymmetry mean(rl) of the total activity of the 19 lines are listed in Table 4.
The Kruskal–Wallis test used for testing differences among medians of the absolute FA; |FA| = ∑ |rl|/N (FA1 index) and the scaled FA index; |rl|/(0.5r + 0.5l) (FA3 index) of the total activity was highly significant—(H = 112.2) *** and (H = 116.8) ***, respectively.
The pairwise differences of the FA1 and FA3 indices were tested with Mann–Whitney tests and several significant differences were found for both indices (Table 5 and Table 6).
A significant positive dependence of FA1 on trait size was found in 11 lines: (line 383; r = 0.65 **, 385; r = 0.57 ***, 386; r = 0.48 **, 461; r = 0.55 **, 357; r = 0.53 **, 508; r = 0.78 ***, 509; r = 0.69 ***, 563; r = 0.5 **, 589; r = 0.47 **, 703; r = 0.65 ***, 716; and r = 0.5 **).

3.3. Directional Asymmetry and Antisymmetry

The Shapiro–Wilk’s tests utilized for testing for deviation from normal distribution have been tested on every line; however, none of the deviations were significant after Bonferroni correction (K = 19) [28]. The lack of significant deviation from normal distributions excludes the presence of AS.
The one-sample t-tests, which were used for testing for significant deviations within line of the (rl) distributions from zero, did not show significant deviations from 0, excluding therefore the presence of DA.

4. Discussion

4.1. Behavioural Data

We have applied the classical analytical pipeline normally applied in morphometric studies where σp2 and FA are utilized for estimating DI for behavioural data. We have chosen completely inbred lines because σp2 can be used as an estimator of DI if the influence of σe2 is minimal or equal to zero. However, the FA indices can be considered reliable estimators of DI even if σg2 ≠ 0, which is the most common situation when dealing with sexually reproducing organisms. We have converted locomotor behaviour into a deviation from an expected value of 0; however, there are many other possible conversions of behavioural data, as, for example, the number of times in a given interval of time or the time spent holding the head on the right or on the left compared to the body of the axis of a bilateral animal. Another possibility is to estimate the number of times in a given interval of time or the time spent by a grazer in holding the head down and graze compared to when the grazer holds the head up. The concept of behavioural instability can also be applied to the behaviour of animals, which can be tracked with GPS or with a radar system counting the number of times that the individual is turning to the right or to the left in different environmental conditions.

4.2. Phenotypic Variance

Several significant differences between the medians of the total activity were found (Table 1), and these differences can be attributed to genetic differences among the different lines as the σe2 is expected to be negligible. However, we have shown that the σe2 is not negligible, as in five (lines 385, 392, 491, 508, 584 and 703) of the investigated lines, significant negative correlations between clockwise (CW) and counter-clockwise (CCW) movements were found producing a bias of both the medians of the total activity but also on the σp2 and FA estimates.
Therefore, these lines should be excluded from the statistical analyses, or, if possible, the experiments should be repeated on these lines until the correlation between CW and CCW disappear.
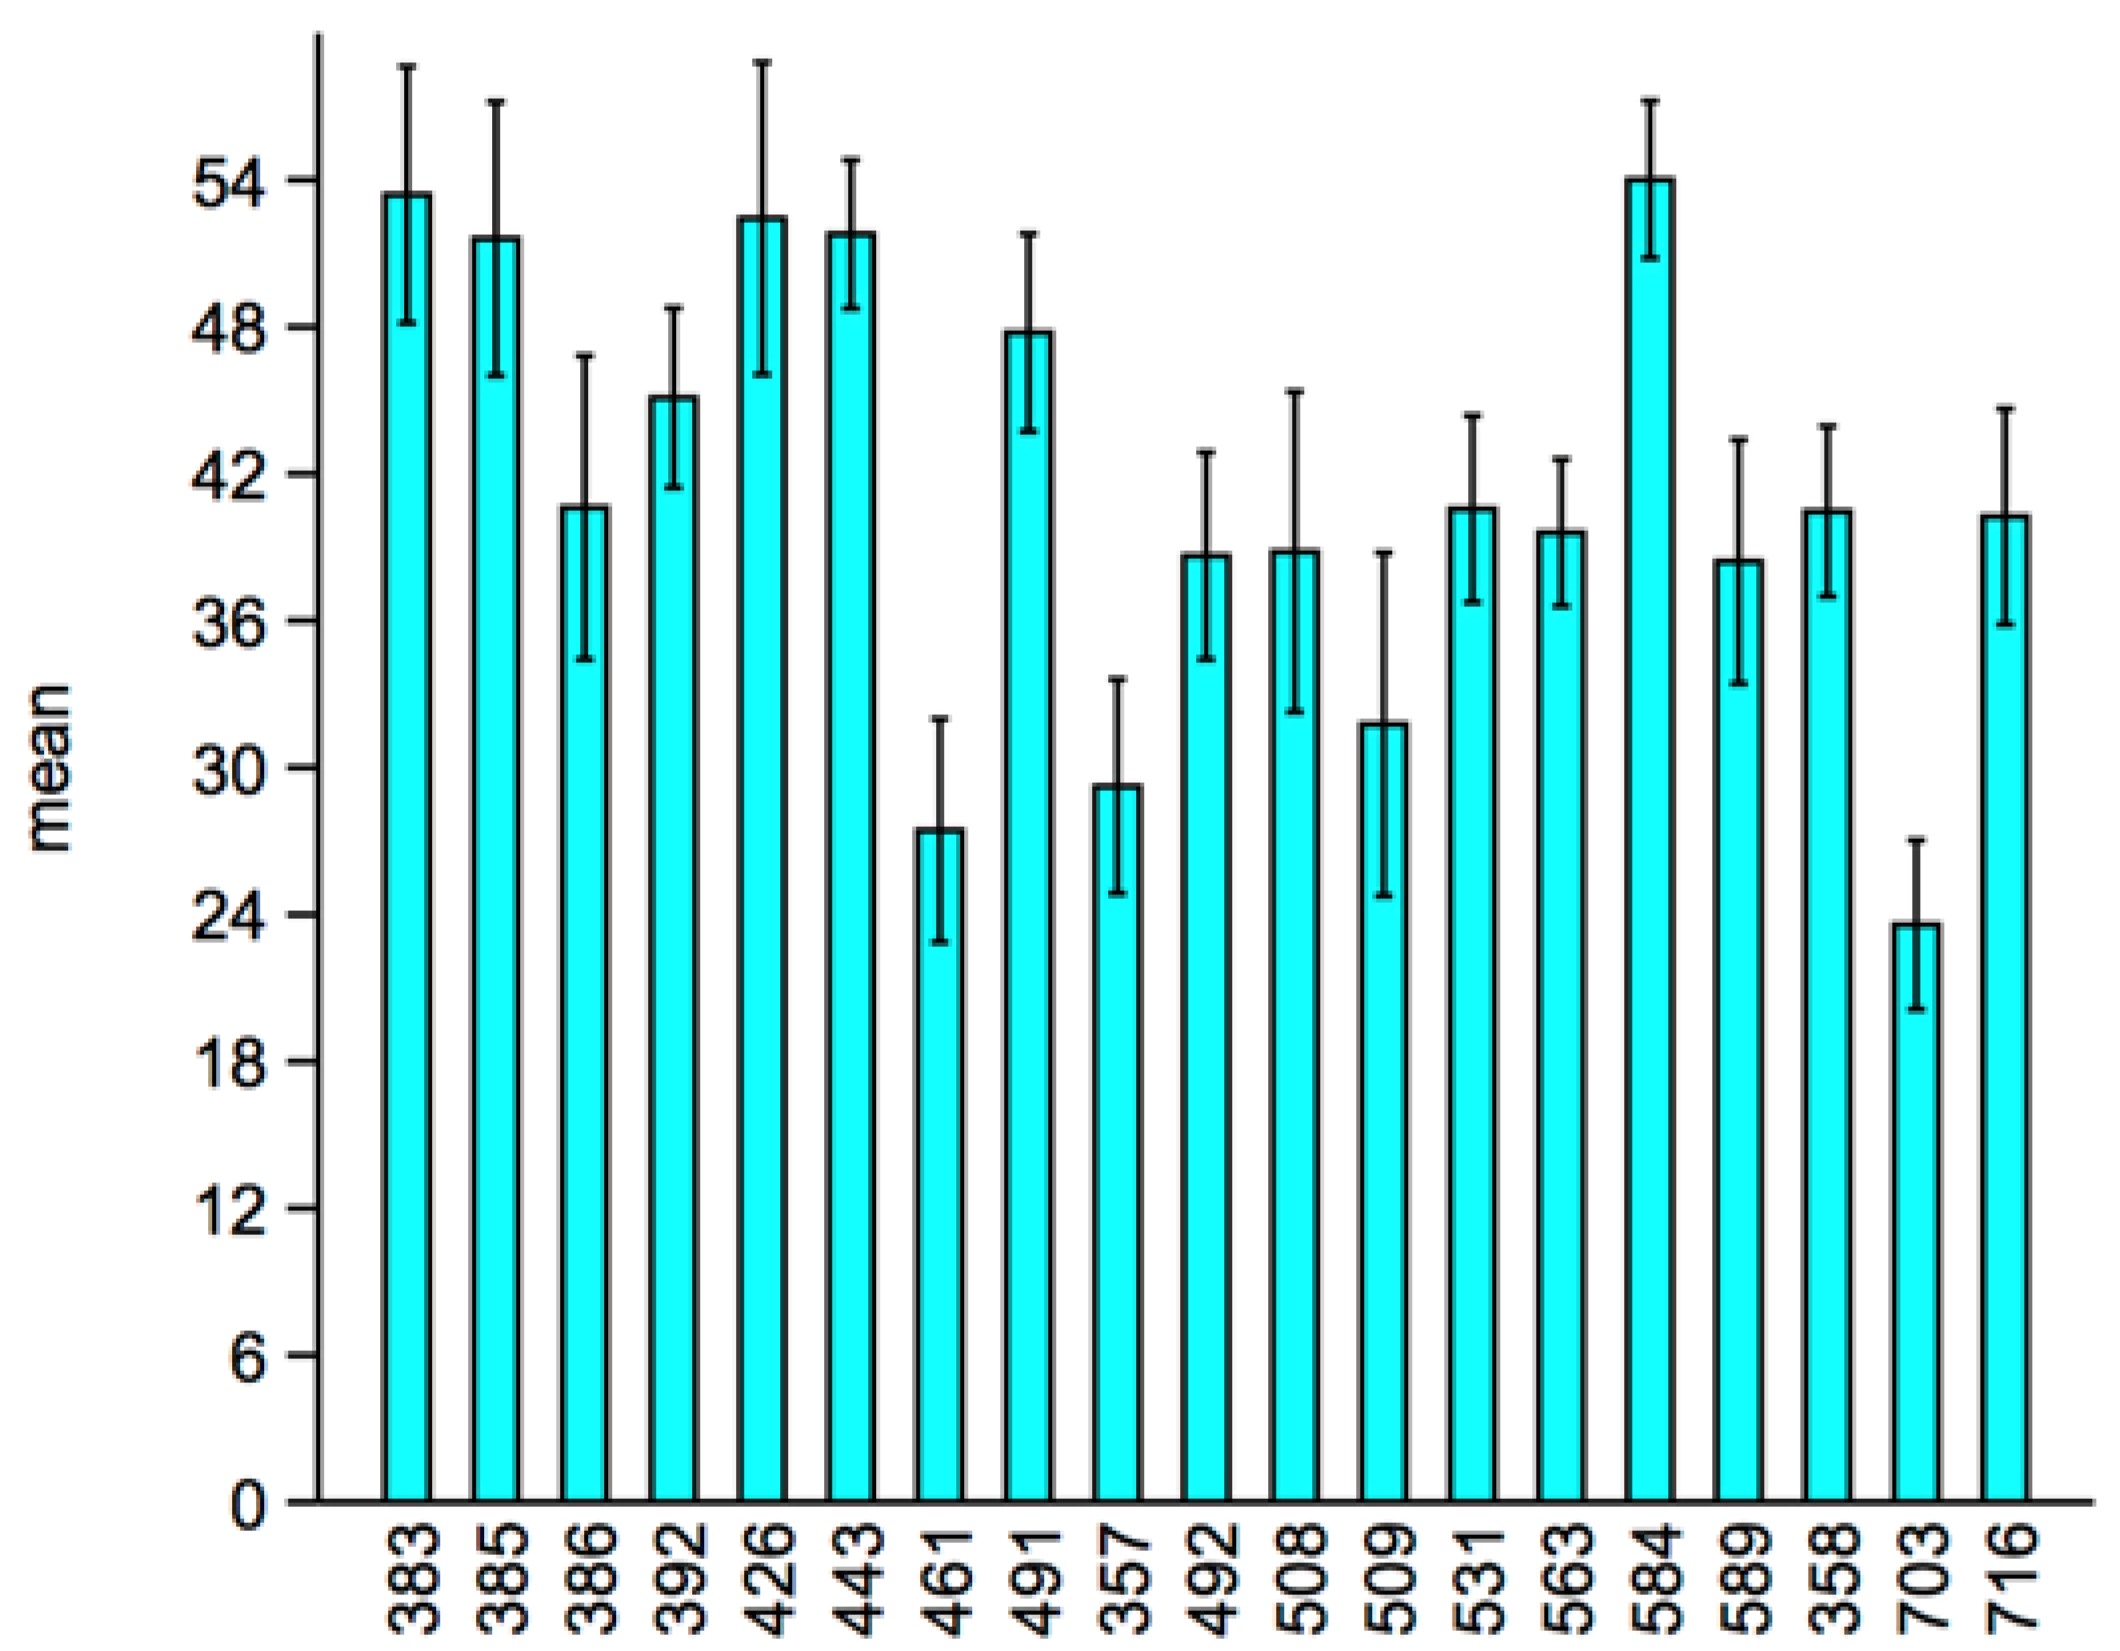
The F-tests conducted on the log-transformed values of the variance of the total activity of the 19 lines revealed several significant differences of σp2 as shown in Table 3 and Figure 1. The heterogeneity of the 95% confidence intervals indicate large differences of σp2, and several of these differences were also found between lines in which σe2 was negligible. Hence, we can consider these differences as differences in the degree of DI, and the lines in which the presence of σe2 will produce biased estimates of σp2 will be overestimated in the case of positive covariance between the CW and CCW or underestimated in the case of negative correlation between the CW and CCW (which is our case).
Some deviations from normal distributions of the distributions of the total activity were found. However, after the correction for multiple comparisons, none of the 19 lines showed significant deviations. These results should be interpreted with caution as the Bonferroni correction can be quite conservative when several tests are conducted, and, therefore, we should consider experiments where hypotheses requiring pairwise comparisons are utilized in order to reduce the chance of committing error type II [28]. The presence of σe2 should, in fact, reduce the kurtosis making the distributions platykurtic, and the fact that we have not been able to detect significant deviations from normality does not mean that a deviation will be found if we have increased the number of replicates per line. However, the fact that we were able to detect the presence of σe2 by testing the correlations between the CW and CCW is clearly showing that the correlational analysis is more sensible even with small sample size (see [12], for details of the method).

4.3. Fluctuating Asymmetry

Significant differences among lines were found both for the FA1 and FA3 indices, and Table 5 and Table 6 are showing which of the pairwise comparisons are significant. Notably, the matrices shown in Table 5 and Table 6 of the pairwise comparisons between lines of the FA1 and FA3 indices are not always concordant and sometimes different significant comparisons were found. This is not surprising, as the FA3 index is a scaled index, which is correcting for the mean. However, this index should only be used when a significant correlation between FA and the mean is found (see below). What is also notable is that the pairwise comparisons between the medians (Table 1) and the σp2 (Table 3) of the total activity are also not always concordant with the results found in Table 5 and Table 6. The medians of the total activity are not an estimator of DI, but σp2 should hypothetically find the same differences found by the FA estimators especially in the absence of a scaling effect. The reasons for the discrepancy could be due to the sampling error of the variance [29].

4.4. Directional Asymmetry and Antisymmetry

No sign of directional asymmetry (DA) has been found in this investigation, and a debate continues concerning the reliability of DA as a measure of DI [14]. We should consider the possibility that directional asymmetry could appear also when looking at behavioural data. Directional asymmetry could potentially be present in experiments in very stressful environments, such as [16] regarding transitions from FA to DA as responses to heavy stress. In any case, as DA may have some heritable component [2], it cannot be excluded that a genetic pool could produce such a phenomenon even when looking at behavioural traits [2].
The fact that no significant antisymmetry has been detected could once again be due to some of the reasons mentioned above.
A negative correlation between r and l (which is our case) can, in fact, generate a platykurtic distribution, and, at the same time, it overestimates the FA1 index [1]. For this reason, the five lines (lines 385, 392, 491, 508, 584 and 703) of the investigated lines indicate a significant negative correlation between clockwise (CW) and counter-clockwise (CCW) movement, which, as we previously argued (or the experiment should be repeated), should also be eliminated when estimating the FA1 and FA3 indices.

4.5. Scaling of Fluctuating Asymmetry with the Mean

The fact that significant positive correlations between FA and the mean trait size have been found for 11 lines out of 19 indicate that a cautionary approach should be undertaken when deciding which kind of indices should be utilised when estimating FA. In this case, the FA3 scaled index should outperform the FA1 index, even if this index can over or underestimate the true FA, as the standardization of the FA values by a division of the trait mean is only statistically correct if the variance of the trait is scaling with the square of the mean [19].

4.6. Perspectives

Potentially, there is a very promising application of FA and σp2 as an indicator of behavioural instability if we follow the correct procedures described in this paper. The concept of behavioural instability could have several possible applications as a biomonitoring tool if we expect that changes in environmental conditions can produce changes in the behavioural traits. For example, behavioural traits have been used in toxicological studies as a sensitive indicator of stress using traits such as swimming activity, locomotor activity or flight [30,31,32,33]. Behavioural instability provides another way of analysing data compared to traditional measures such as total distance traveled, activity per hour or swimming distance. Likewise, behavioural traits have been used in evolutionary studies to evaluate plasticity and genotypic difference or in psychological studies [34]. Similarly, several genome-wide association studies (GWAS) studies are trying to associate genetic variation with variation in behavioral traits [35]. These studies will clearly be beneficial if it is possible to associate the concept of behavioural instability with genetic variation. In addition, the procedure described in this paper could also be useful for excluding samples where σe2 is present, as it will bias the GWA analysis due to the fact that σe2 will, most of the time, increase the sizes of the traits and therefore invalidate the analysis.

Acknowledgments

This study has been partly supported by the Danish Natural Science Research Council (Grant Numbers #21-01-0526, #21-03-0125, 95095995, and #4002-00036) and the Aalborg Zoo Conservation Foundation (AZCF). We would also like to thank the Lead Guest Editor and three anonymous reviewers for invaluable suggestions and comments on the manuscript.

Author Contributions

All authors contributed equally. Cino Pertoldi and Palle Duun Rohde conceived and designed the experiments; Palle Duun Rohde performed the experiments; Cino Pertoldi and Palle Duun Rohde analyzed the data; Cino Pertoldi , Simon Bahrndorff, Zorana Kurbalija Novicic and Palle Duun Rohde wrote the paper.

Conflicts of Interest

The authors declare no conflict of interest.

References

  1. Palmer, A.R.; Strobeck, C. Fluctuating asymmetry: Measurement, analysis, patterns. Annu. Rev. Ecol. Syst. 1986, 17, 391–421. [Google Scholar] [CrossRef]
  2. Graham, J.H.; Raz, S.; Hel-Or, H.; Nevo, E. Fluctuating Asymmetry: Methods, Theory, and Applications. Symmetry 2010, 2, 466–540. [Google Scholar] [CrossRef]
  3. Waddington, C.H. The Strategy of the Genes; George Allen Unwin: London, UK, 1957. [Google Scholar]
  4. Leary, R.F.; Allendorf, F.W. Fluctuating asymmetry as an indicator of stress: Implications for conservation biology. Trends Ecol. Evol. 1989, 4, 214–217. [Google Scholar] [CrossRef]
  5. Leamy, L.J.; Klingenberg, C.P. The genetics and evolution of fluctuating asymmetry. Annu. Rev. Ecol. Evol. Syst. 2005, 36, 1–21. [Google Scholar] [CrossRef]
  6. Møller, A.P.; Swaddle, J.P. Asymmetry, Developmental Stability, and Evolution; Oxford University Press: New York, NY, USA, 1997. [Google Scholar]
  7. Rasmuson, B.; Green, M.M.; Ewertson, G. Qualitative and quantitative analyses of eye pigments and pteridines in back-mutations of the mutant wa in Drosophila melanogaster. Hereditas 1960, 46, 635–650. [Google Scholar] [CrossRef]
  8. Kristensen, T.N.; Pertoldi, C.; Andersen, D.H.; Loeschcke, V. The use of fluctuating asymmetry and phenotypic variability as indicators of developmental instability: A test of a new method employing clonal organisms and high temperature stress. Evol. Ecol. Res. 2003, 5, 53–68. [Google Scholar]
  9. Kristensen, T.N.; Pertoldi, C.; Pedersen, L.D.; Andersen, D.H.; Bach, L.A.; Loeschcke, V. The increase of fluctuating asymmetry in a monoclonal strain of collembolans after chemical exposure—Discussing a new method for estimating the environmental variance. Ecol. Indic. 2004, 4, 73–81. [Google Scholar] [CrossRef]
  10. Lajus, D.L.; Graham, J.H.; Kozhara, A.V. Developmental instability and the stochastic component of total phenotypic variance. In Developmental Instability: Causes and Consequences; Polak, M., Ed.; Oxford University Press: Oxford, UK, 2003; pp. 343–363. [Google Scholar]
  11. Pertoldi, C.; Kristensen, T.N.; Andersen, D.H.; Loeschcke, V. Developmental instability as an estimator of genetic stress. Heredity 2006, 96, 122–127. [Google Scholar] [CrossRef] [PubMed]
  12. Pertoldi, C.; Kristensen, T.N.; Loeschcke, V. A new method for estimating environmental variability for clonal organisms, and the use of fluctuating asymmetry as an indicator of developmental instability. J. Theor. Biol. 2001, 210, 407–410. [Google Scholar] [CrossRef] [PubMed]
  13. Lens, L.; van Dongen, S.; Galbusera, P. Developmental instability and inbreeding natural bird populations exposed to different levels of habitat disturbance. J. Evol. Biol. 2000, 13, 889–896. [Google Scholar] [CrossRef]
  14. Graham, J.H.; Freeman, D.C.; Emlen, J.M. Antisymmetry, directional asymmetry, and chaotic morphogenesis. Genetica 1993, 89, 121–137. [Google Scholar] [CrossRef]
  15. Hosken, D.J.; Blanckenhorn, W.U.; Ward, P.I. Developmental stability in yellow dung flies (Scathophaga stercoraria): Fluctuating asymmetry, heterozygosity and environmental stress. J. Evol. Biol. 2000, 13, 919–926. [Google Scholar] [CrossRef]
  16. Graham, J.H.; Freeman, D.C.; Emlen, J.M. Developmental stability: A sensitive indicator of populations under stress. In Environmental Toxicology and Risk Assessment; ASTM STP 1179; Landis, W.G., Hughes, J., Lewis, M.A., Eds.; American Society for Testing and Materials: Philadelphia, PA, USA, 1993; pp. 136–158. [Google Scholar]
  17. Østbye, K.; Øxenevad, S.A.; Vøllestad, L.A. Developmental stability in perch (Perca fluviatilis) in acidic aluminium-rich lakes. Can. J. Zool. 1997, 75, 919–928. [Google Scholar] [CrossRef]
  18. Windig, J.J.; Nylin, S. How to compare fluctuating asymmetry of different traits. J. Evol. Biol. 2000, 13, 29–37. [Google Scholar] [CrossRef]
  19. Pertoldi, C.; Kristensen, T.N. A New Fluctuating Asymmetry Index, or the Solution for the Scaling Effect? Symmetry 2015, 7, 327–335. [Google Scholar] [CrossRef]
  20. Graham, J.H.; Emlen, J.M.; Freeman, D.C.; Leamy, L.J.; Kieser, J. Directional asymmetry and the measurement of developmental instability. Biol. J. Linn. Soc. 1998, 64, 1–16. [Google Scholar] [CrossRef]
  21. Van Dongen, S.; Lens, L.; Molenberghs, G. Mixture analysis of asymmetry: Modelling directional asymmetry, antisymmetry and heterogeneity in fluctuating asymmetry. Ecol. Lett. 1999, 2, 387–396. [Google Scholar]
  22. Markow, T.A.; Gottesman, I.I. Behavioral phenodeviance: A Lerneresque conjecture. In Developmental Instability: Its Origins and Evolutionary Implications; Springer: Heidelberg, Germany, 1994; pp. 299–307. [Google Scholar]
  23. Lajus, D.; Sukhotin, A. A new approach for the assessment of stochastic variation: Analysis of behavioural response in blue mussel (Mytilus edulis L.). Helgol. Meeresunters. 1998, 52, 141–145. [Google Scholar] [CrossRef]
  24. Keller, M.C.; Simonson, M.A.; Ripke, S.; Neale, B.M.; Gejman, P.V.; Howrigan, D.P.; Lee, S.H.; Lencz, T.; Levinson, D.F.; Sullivan, P.F.; et al. Runs of homozygosity implicite asutozygosity as a schizophrenia risk factor. PLoS Genet. 2012, 8. [Google Scholar] [CrossRef] [PubMed] [Green Version]
  25. MacKay, T.F.C.; Richards, S.; Stone, E.A.; Barbadilla, A.; Ayroles, J.F.; Zhu, D.; Casillas, S.; Han, Y.; Magwire, M.M.; Cridland, J.M.; et al. The Drosophila melanogaster genetic reference panel. Nature 2012, 482, 173–178. [Google Scholar] [CrossRef] [PubMed]
  26. Rohde, P.D.; Krag, K.; Loeschcke, V.; Overgaard, J.; Sørensen, P.; Nygaard, T.N. A Quantitative Genomic Approach for Analysis of Fitness and Stress Related Traits in a Drosophila melanogaster Model Population. Int. J. Genom. 2016, 2157494, 1–11. [Google Scholar] [CrossRef] [PubMed]
  27. Zar, J.H. Biostatistical Analysis, 2nd ed.; Prentice Hall: Englewood Cliffs, NJ, USA, 1984. [Google Scholar]
  28. Rice, W.R. Analysing tables of statistical tests. Evolution 1989, 43, 223–225. [Google Scholar] [CrossRef]
  29. Evans, M.; Hastings, N.; Peacock, B. Statistical Distributions; Wiley: New York, NY, USA, 1993. [Google Scholar]
  30. Noss, C.; Dabrunz, A.; Rosenfeldt, R.R.; Lorke, A.; Schulz, R. Three-dimensional analysis of the swimming behavior of daphnia magna exposed to nanosized titanium dioxide. PLoS ONE 2013, 8. [Google Scholar] [CrossRef] [PubMed]
  31. Gerhardt, A.; de Bisthoven, L.J.; Schmidt, S. Automated recording of vertical negative phototactic behaviour in Daphnia magna Straus (Crustacea). Hydrobiologia 2006, 559, 433–441. [Google Scholar] [CrossRef]
  32. Zein, M.A.; Mcelmurry, S.P.; Kashian, D.R.; Savolainen, P.T.; Pitts, D.K. Optical bioassay for measuring sublethal toxicity of insecticides in Daphnia pulex. Environ. Toxicol. Chem. 2014, 33, 144–151. [Google Scholar] [CrossRef] [PubMed]
  33. Bahrndorff, S.; Michaelsen, T.; Jensen, A.; Faarup, M.L.; Nielsen, M.E.; Roslev, P. Automated swimming activity monitor for examining temporal patterns of toxicant effects on individual Daphnia magna. J. Appl. Toxicol. 2016, 36, 896–902. [Google Scholar] [CrossRef] [PubMed]
  34. McCarthy, K.; Kjærsgaard, A.; Bahrndorff, S.; Schou, T.M.; Manenti, T.; Loeschcke, V.; Pertoldi, C. The Effect of Social Isolation on Locomotor Activity in the Houseflies (Musca Domestica). J. Insect. Behav. 2015, 28, 288–296. [Google Scholar] [CrossRef]
  35. Ayroles, J.F.; Buchanan, S.M.; O’Leary, C.; Skutt-Kakaria, K.; Grenier, J.K.; Clark, A.G.; Hartl, D.L.; de Bivort, B.L. Behavioral idiosyncrasy reveals genetic control of phenotypic variability. Proc. Natl. Acad. Sci. USA 2015, 112, 6706–6711. [Google Scholar] [CrossRef] [PubMed]
Figure 1. Overall mean of the number of clockwise and counter-clockwise movements and 95% confidence interval of the total activity of the 19 lines.
Symmetry 08 00135 g001
Table 1. Pairwise tests for differences between the medians of the total activity between the 19 lines. All of the p-values have been corrected for multiple comparisons, following Bonferroni [19], and only significant p-values are reported.
Line383385386392426443461491357492508509531563584589358703
385------------------
386------------------
392------------------
426------------------
443------------------
4610.0000.000-0.0000.0000.000------------
491------0.000-----------
3570.0000.000-0.0010.0010.000-0.000----------
4920.008----0.006------------
508------------------
5090.008---0.0130.010------------
5310.013----0.0080.007-----------
5630.006----0.0000.027-----------
584------0.000-0.0000.000-0.0010.0000.000----
5890.012----0.021--------0.001---
3580.014----0.0100.013-0.047-----0.001---
7030.0000.0000.0110.0000.0000.000-0.000-0.001--0.0000.0000.0000.0030.000-
7160.016-----0.038-------0.002--0.001
Table 2. Means of the total activity of the 19 lines. The variance, the median, the skewness and kurtosis are listed and a Shapiro–Wilk’s test for deviation from normal distribution has been tested within every line. Significant deviations from normality are highlighted in bold. However, none of the deviations were significant after Bonferroni correction (K = 19) [19].
Line383385386392426443461491357492508509531563584589358703716
Mean53.4051.6040.6245.1052.4351.7827.4347.7729.2338.6538.8231.7740.5739.6054.0238.4240.4723.5840.25
Variance214.30244.42299.96101.24317.3271.84162.46127.17149.56139.80334.39383.65113.5370.3980.56194.0591.3293.19151.75
Median54.5048.7542.7546.5057.2552.2529.0051.5029.0040.5042.7532.0041.0039.5056.2542.5041.5022.2543.50
Skewness−0.95−0.21−0.67−0.79−0.870.36−0.49−1.05−0.04−0.47−0.05−0.20−1.570.22−0.81−1.11−0.620.19−0.92
Kurtosis0.76−0.61−0.33−0.160.02−0.08−0.470.26−0.720.11−1.28−1.254.830.070.100.90−0.08−0.250.03
Shapiro–W0.920.970.940.930.920.970.950.890.980.980.940.920.880.970.930.900.950.980.90
P (normal)0.02n.s.n.s.0.050.02n.s.n.s.0.00n.s.n.s.n.s.0.040.00n.s.n.s.0.01n.s.n.s.0.01
Table 3. F-tests of the log-transformed variances of the total activity; the log-variances have been sorted in descending order. The tests have been corrected for multiple comparisons (Bonferroni correction; K = 171) [19], and only significant p-values are reported.
Lines 509461386589531508357703426716492383385491358392563584443
Log-Variances 0.2400.1100.0970.0860.0650.0640.0560.0500.0420.0310.0290.0240.0230.01600140.0120.0090.0060.005
509-------------------
461*------------------
386*n.s.-----------------
589*n.s.n.s.-- -------------
531*n.s.n.s.n.s.---------------
508*n.s.n.s.n.s.n.s.--------------
357*n.s.n.s.n.s.n.s.n.s.-------------
703*n.s.n.s.n.s.n.s.n.s.n.s.------------
426*n.s.n.s.n.s.n.s.n.s.n.s.n.s.-----------
716*n.s.n.s.n.s.n.s.n.s.n.s.n.s.n.s.----------
492*n.s.n.s.n.s.n.s.n.s.n.s.n.s.n.s.n.s.---------
383*****n.s.n.s.n.s.n.s.n.s.n.s.--------
385*****n.s.n.s.n.s.n.s.n.s.n.s.n.s.-------
491*****n.s.n.s.n.s.n.s.n.s.n.s.n.s.n.s.------
358*********n.s.n.s.n.s.n.s.n.s.-----
392*********n.s.n.s.n.s.n.s.n.s.n.s.----
563*********n.s.n.s.n.s.n.s.n.s.n.s.n.s.---
584*********n.s.n.s.n.s.n.s.n.s.n.s.n.s.n.s.--
443*********n.s.n.s.n.s.n.s.n.s.n.s.n.s.n.s.n.s.-
* = p < 005.
Table 4. Signed fluctuating asymmetry mean(rl) of the total activity of the 19 lines. The variance, the median, the skewness and kurtosis are listed and a Shapiro–Wilk’s test for deviation from normal distribution has been tested within every line. Significant deviations from normality are highlighted in bold. However, none of the deviations were significant after Bonferroni correction (K = 19) [19].
Line383385386392426443461491357492508509531563584589358703716
Mean9.60−15.601.032.217.4715.375.279.473.2010.972.37−5.07−4.871.202.373.037.97−1.170.97
Variance8139.12183.42877.11838.01721.21863.71441.23583.8602.21051.04758.11819.4606.1571.34992.02060.4870.01424.51234.9
Median29.00−25.501.004.005.5010.009.0017.503.007.00−0.50−2.50−5.00−5.009.508.007.001.007.00
Skewness−0.290.01−0.360.07−0.200.28−0.310.040.70−0.02−0.12−0.25−0.200.74−0.14−0.120.12−0.29−0.51
Kurtosis−1.251.080.35−0.52−0.760.01−0.68−0.811.511.06−0.611.440.720.61−0.75−0.48−0.36−0.470.35
Shapiro–W0.920.940.980.970.970.970.960.940.950.980.970.890.970.930.970.980.980.980.97
P (normal)0.03n.s.n.s.n.s.n.s.n.s.n.s.n.s.n.s.n.s.n.s.0.01n.s.0.05n.s.n.s.n.s.n.s.n.s.
Table 5. Pairwise tests for differences between the medians of the total activity mean absolute FA; |FA|= ∑ |rl|/N. (FA1 index) between the 19 lines. All the p-values have been corrected for multiple comparisons, following Bonferroni [19], and only significant p-values are reported.
Lines383385386392426443461491357492508509531563584589358703
3850.00-----------------
386-0.02----------------
392------------------
426-0.01----------------
443-0.00----------------
461-0.01----------------
491-0.00----------------
3570.03-----------------
492-0.000.04-----0.00---------
508-0.00----------------
509------------------
531-0.00----------------
563-0.00------0.01---------
584-0.000.05-----0.00--0.02------
589-------------0.040.02---
358-0.01----------------
703-0.00----------------
716-0.00----------------
Table 6. Pairwise tests for differences between the medians of the total activity’s scaled FA index; |rl|/(0.5r + 0.5l) (FA3 index) between the 19 lines. All the p-values have been corrected for multiple comparisons, following Bonferroni [19], and only significant p-values are reported.
Lines383385386392426443461491357492508509531563584589358703
3850.00-----------------
386------------------
3920.00-----------------
4260.00-----------------
4430.00-----------------
461----0.040.05------------
491------------------
3570.00-----0.02-----------
4920.00-----0.03-----------
508-----0.04---0.05--------
509------------------
5310.00-----0.000.02--0.00-------
5630.00-----0.000.01--0.00-------
584------------------
589------------------
3580.00-----0.02---0.03-------
703----0.03---0.010.03--0.000.00--0.03-
7160.00-----0.03----------0.03

