Article

EMG Pattern Classification by Split and Merge Deep Belief Network

1
Department of Digital Electronics, Dong Seoul University, Seongnam 13117, Korea
2
Korea Electrotechnology Research Institute, Ansan 15588, Korea
3
Department of Electrical and Electronic Engineering, Xi’an Jiaotong-Liverpool University, Suzhou 215123, China
4
Biomedical Engineering Centre, Chiang Mai University, Chiang Mai 50200, Thailand
5
Department of Electronic Engineering, Korea Polytechinic University, Siheung 15073, Korea
6
Department of Information and Telecommunication Engineering, Incheon National University, Incheon 22012, Korea
7
Department of Electronic Engineering, Inha University, Incheon 22201, Korea
*
Author to whom correspondence should be addressed.
Symmetry 2016, 8(12), 148; https://doi.org/10.3390/sym8120148
Submission received: 18 April 2016 / Revised: 21 November 2016 / Accepted: 1 December 2016 / Published: 6 December 2016
(This article belongs to the Special Issue Symmetry in Systems Design and Analysis)

Abstract

:
In this paper; we introduce an enhanced electromyography (EMG) pattern recognition algorithm based on a split-and-merge deep belief network (SM-DBN). Generally, it is difficult to classify the EMG features because the EMG signal has nonlinear and time-varying characteristics. Therefore, various machine-learning methods have been applied in several previously published studies. A DBN is a fast greedy learning algorithm that can identify a fairly good set of weights rapidly—even in deep networks with a large number of parameters and many hidden layers. To reduce overfitting and to enhance performance, the adopted optimization method was based on genetic algorithms (GA). As a result, the performance of the SM-DBN was 12.06% higher than conventional DBN. Additionally, SM-DBN results in a short convergence time, thereby reducing the training epoch. It is thus efficient in reducing the risk of overfitting. It is verified that the optimization was improved using GA.

1. Introduction

Electromyography (EMG) pattern classification is used in various fields, such as biomedical engineering, rehabilitation engineering, user interface, and others [1,2,3,4]. EMG pattern classification consists of feature extraction and classification algorithms. EMG features can be categorized as time-domain features and frequency-domain features. However, it is difficult to find the dominant features that distinguish gestures of the musculoskeletal system, primarily because the characteristics of the EMG signal are nonlinear and time varying. Therefore, selection of the classification algorithm is important. In numerous previously published works, machine learning methods have been applied.
In many of the previously published works, various methods have been applied to the analysis and classification of EMG. Many of these studies were related to the extraction of better features and their application to more efficient classifiers. Many features, including independence component analysis, root-mean-square, distance-based features, and nonlinear multiscale features have been suggested [5,6,7,8,9,10,11,12,13,14,15,16,17,18,19]. Various machine learning algorithms, such as fuzzy, support vector machines (SVM), and neural networks were applied to solve the classification matter [7,9,20,21].
In our previous study, a Gaussian mixture model (GMM) and a deep belief network (DBN) were applied [22,23]. DBN has been shown to yield a better accuracy than GMM, linear discriminant analysis (LDA), or SVM. DBN was proposed by Hinton to dramatically improve the classification performance [24]. This algorithm reduced over-fitting and eliminated the local minima problem, which is difficult to solve in conventional multi-layer perceptron models. The performance of the DBN was better than other shallow-learning classifiers. However, the DBN needs lengthy iterations to attain good performance in recognizing EMG patterns. Since lengthy iterations induce over-fitting, it is necessary to reduce iterations. To reduce the over-fitting problem and enhance the accuracy of the DBN, split-and-merge algorithms were proposed in our previous study [25]. The split-and-merge deep belief network (SM-DBN) used a genetic algorithm (GA) after pre-training the DBN and selection of the best offspring. SM-DBN was shown to elicit a better performance than conventional DBN in the case of the mixed National Institute of Standards and Technology database dataset [26]. The DBN is a general-purpose classifier, which can be useful for images, time series signals, text data, and others.
In this paper, we propose an enhanced EMG pattern recognition algorithm based on SM-DBN. Because the EMG signal is a time series signal, our work proves that SM-DBN is efficient for both image and time series data. Herein, the procedures of the EMG pattern recognition and the concepts of the algorithms are described. Subsequently, the results generated based on the evaluation of the algorithms are presented.

2. Materials and Methods

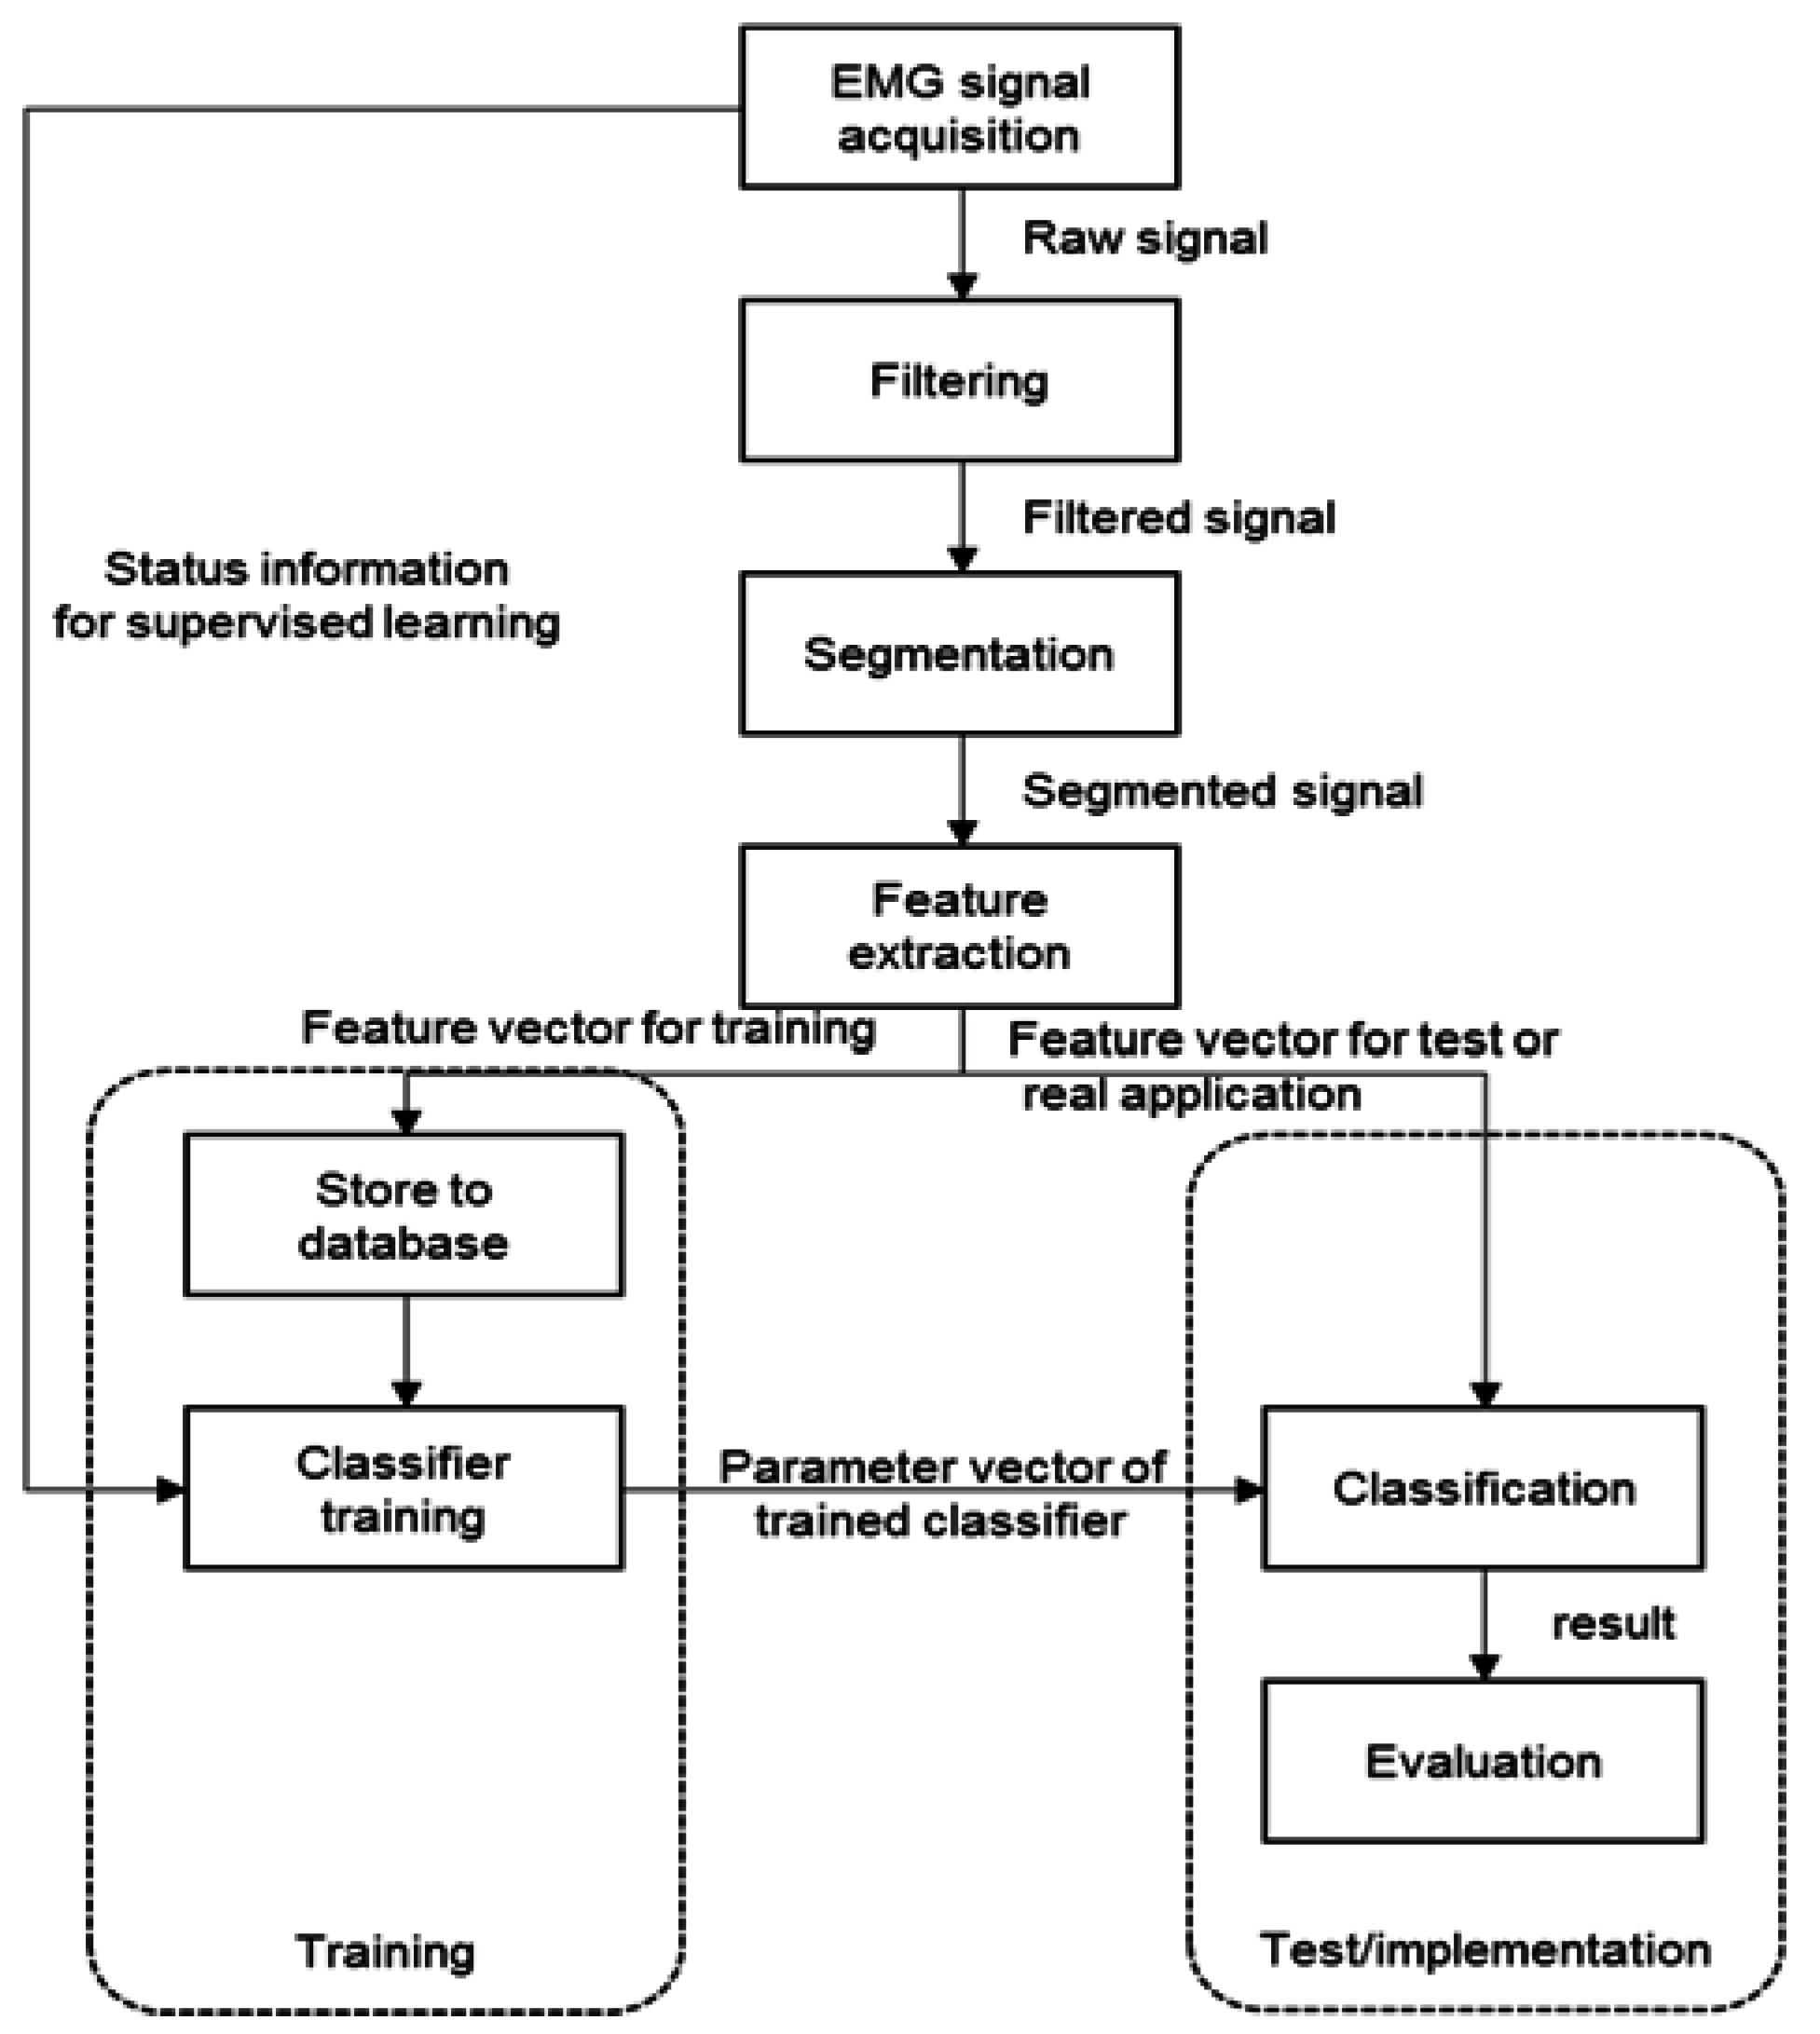
2.1. Pattern Recognition Process

The pattern recognition algorithm categorizes numerous input patterns to specified outputs. Generally, pattern recognition is dealt as a subtask of the machine learning algorithm. Figure 1 depicts a flow diagram of the entire EMG pattern recognition process.
At first, the EMG signal was acquired by the biosignal amplifier. Figure 2 shows the placement configuration of the electrodes. The amplitude range of the EMG signal was approximately −10 to 10 mV peak-to-peak. Furthermore, the frequency range was approximately 0 to 500 Hz, with the dominant energy in the 50 to 150 Hz range [27]. To recognize the wrist posture, the EMG of the flexor carpi ulnaris (FCU) and extensor carpi ulnaris (ECU) were recorded.
Next, filters were used to reduce noise sources—such as motion artifacts, hum, high frequency noise, and aliasing interferers—during analog-to-digital conversion. In this work, a second-order Butterworth bandpass filter with a 50 to 500 Hz bandwidth was used. Subsequently, the EMG signals were segmented using constant-time segmentation. The temporal span of the Hamming window used was 166 ms, and it was overlapped by 50%. After the segmentation of the time series signal, feature vectors were extracted from each segment for use as input to the classifier. The feature extraction algorithms are described in Section 2.2.

2.2. Feature Extraction

Jeong et al. compared EMG features that are commonly used, and suggested some efficiently separated features [22]. According to Jeong [22], we chose the following features. The different absolute mean value is the absolute average between two successive signal samples [22,28]. It can be calculated by integrating the absolute value of the signal sample during the time under consideration, expressed according to Equation (1):
D = 1 N i = 1 N | x i x i + 1 |
where N is the number of samples of the segmented EMG signal.
The different absolute standard deviation value (DASDV) is the standard deviation of the difference between two successive signal samples, and its value is expressed in accordance with Equation (2).
S = 1 N 1 i = 1 N 1 ( x i   x ¯ )
The mean absolute value (MAV) refers to the average of the absolute value of the EMG signal samples in the segmented signal, formulated in accordance with Equation (3):
M = 1 N i = 1 N | x i |
The zero crossing (ZC) is according to Equation (4):
Z = i = 1 N 1 S g n ( x i x i + 1 ) T h ( | x i x i + 1 | > θ s c )
where,
S g n ( x ) = { 0 ,   if   x > 0 1 ,   otherwise
T h ( x ) = { 0 ,   if   x < θ 1 ,   otherwise
In this paper, ZC is normalized as follows to fit to the input range of the classifiers.
Z n = Z N
where N is the number of samples in the window.

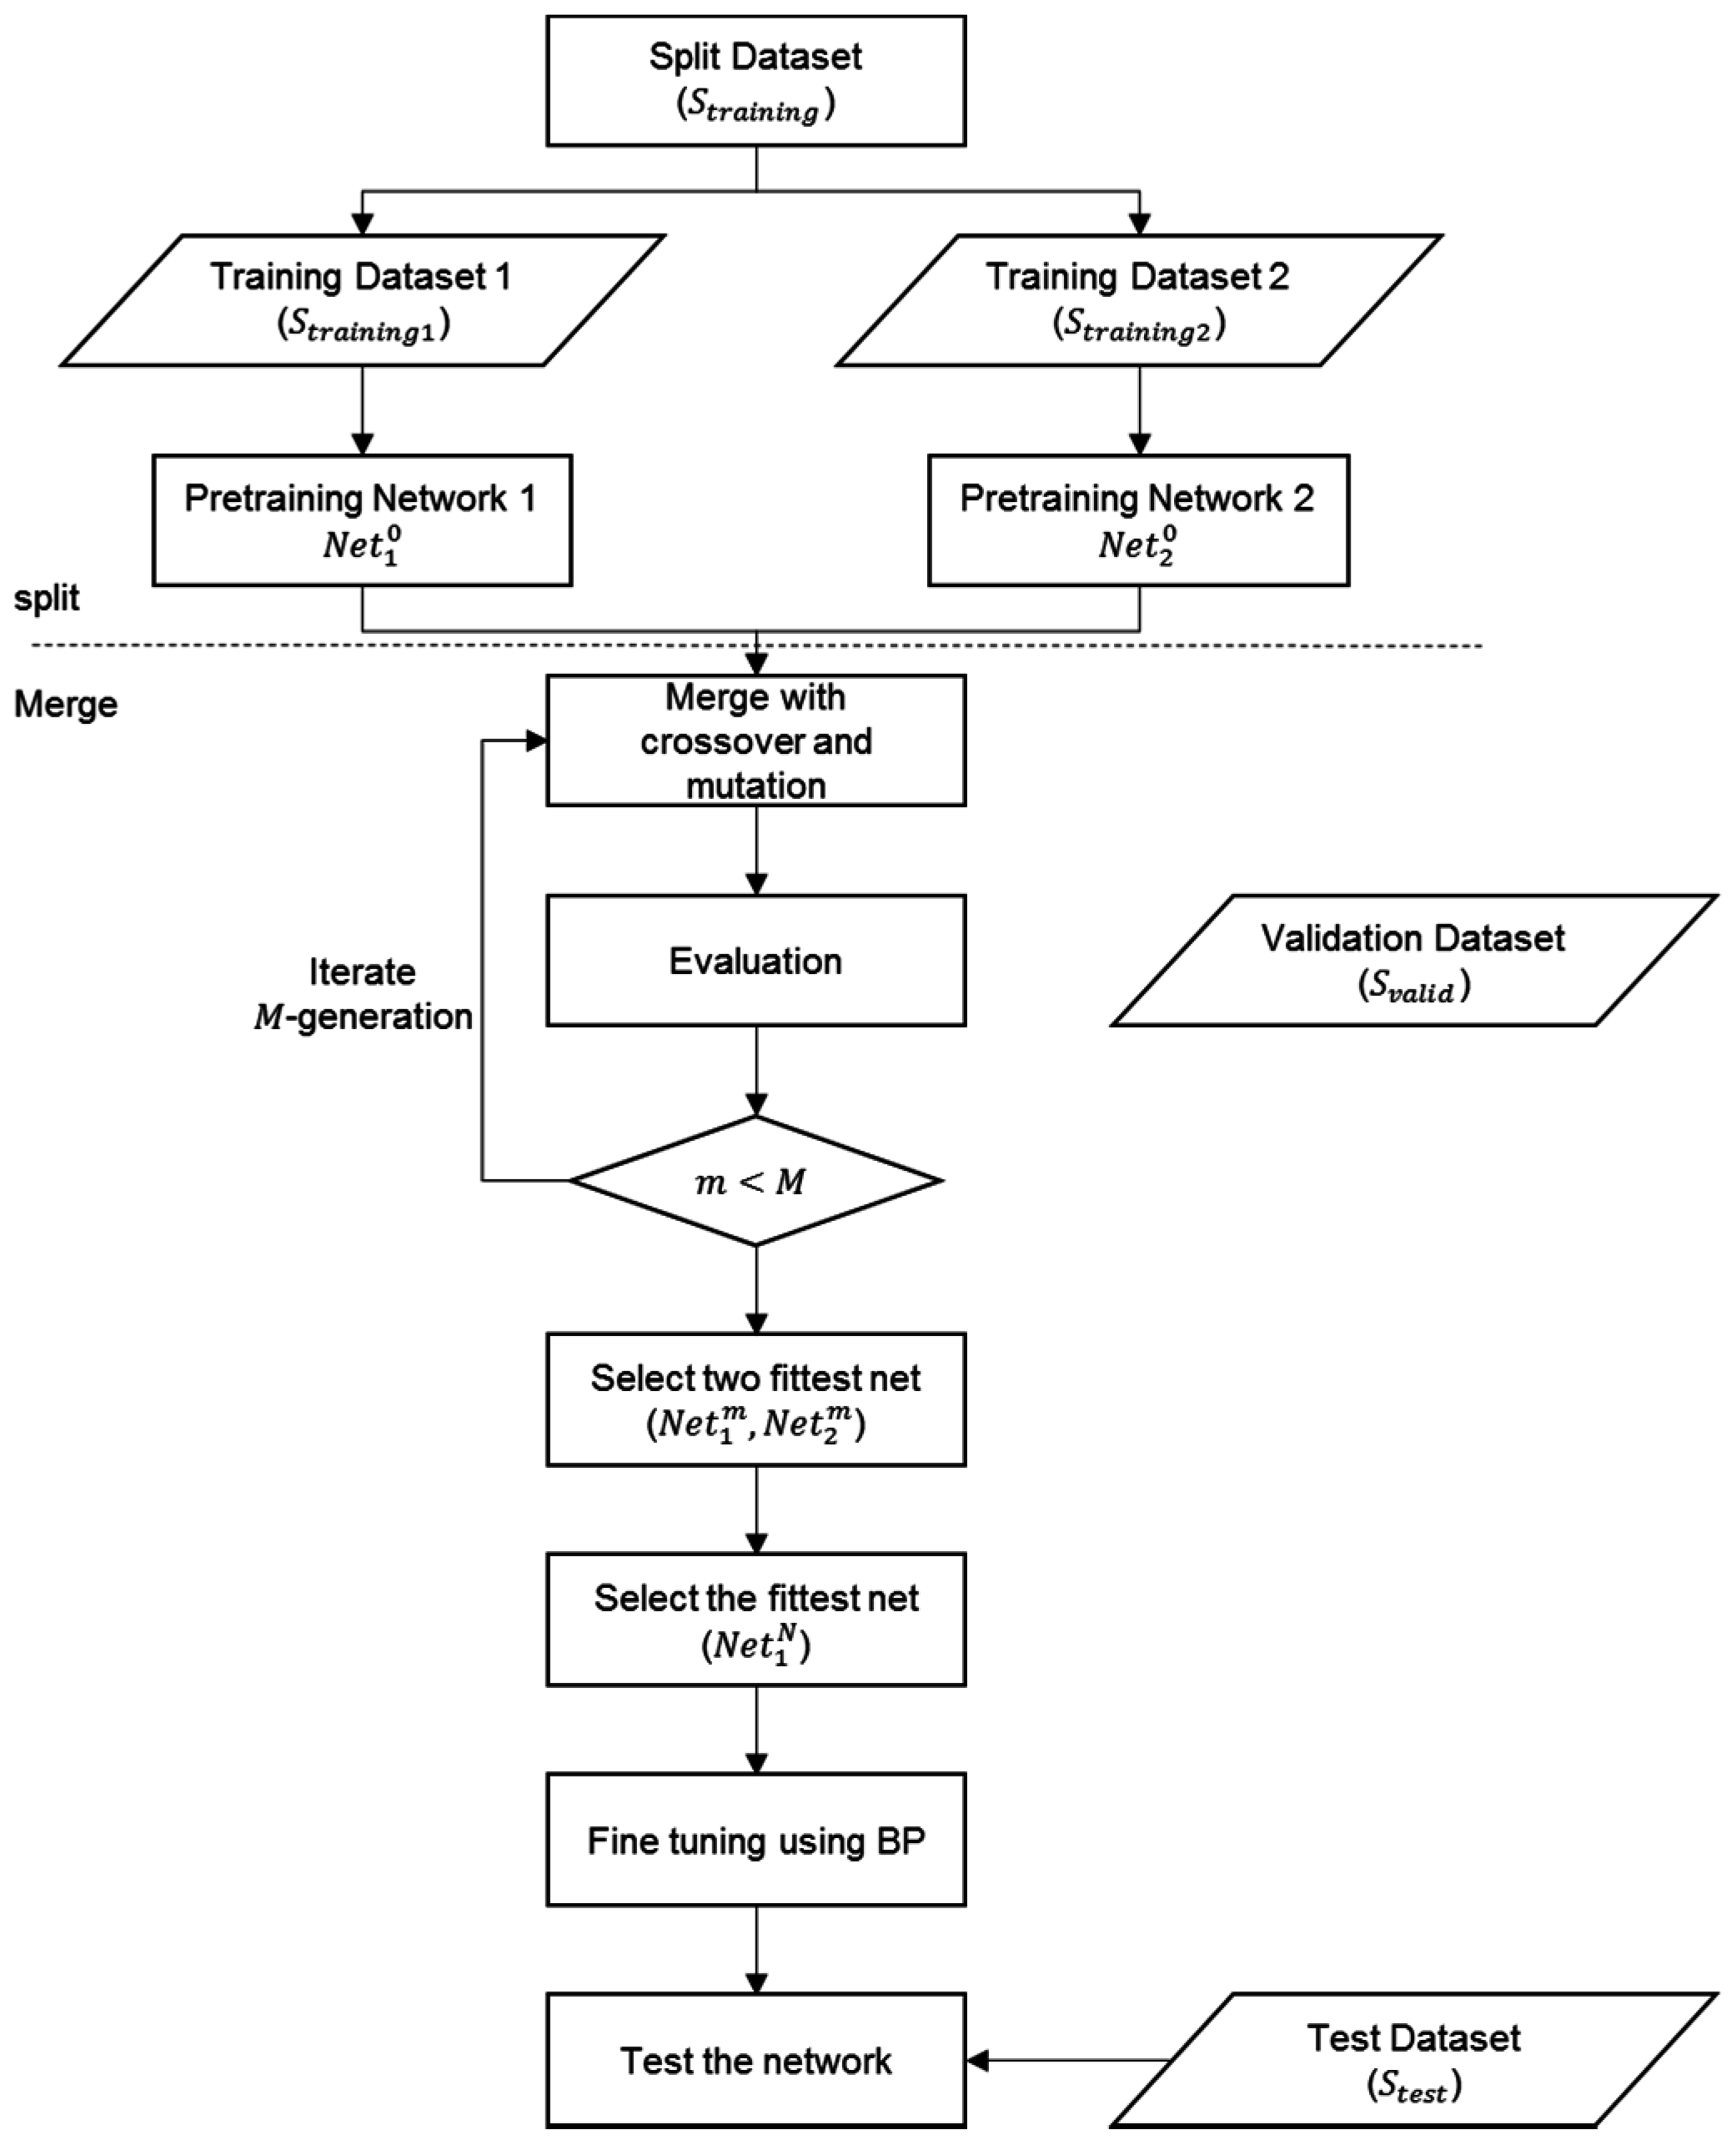
2.3. Split and Merge Deep Belief Network

Back propagation (BP) is a popular learning method for deep neural networks (DNNs). BP is used in conjunction with an optimization method, such as gradient descent [29]. However, this method is associated with some problems, such as local minima, a slow learning speed at an increasing of number of hidden layers, and over-fitting [30].
To overcome these problems, Hinton proposed DBNs [24]. The DBN consisted of a pre-training phase and a fine tuning phase. In the pre-training phase, a DBN generates a multilayer connected model with a restricted Boltzmann machine (RBM). The RBMs are trained using an unsupervised learning method. A joint probability between the visible layer and the hidden layer is then defined using an energy function in RBMs [31]. In this phase, each layer is trained in a greedy manner. After pre-training, fine-tuning is completed using BP.
DBN minimized the problems of the conventional DNNs. However, in the case of the EMG signal classification, the iteration time is too long, because the EMG signal has poor features for classification. This causes overfitting. Therefore, it is necessary to reduce the iteration time to prevent overfitting.
The split-and-merge deep belief networks (SM-DBNs) algorithm is proposed to reduce the iteration time and enhance the classification accuracy. The SM-DBN comprises three procedures [25]. In the first step (called split), two respective multilayer neural networks are initiated with the RBM method. The second step is called merge, and represents the stage where these two networks are merged by the GA. In the third step, this network is tuned finely by the BP.
Before training the model, the EMG signal data are divided into three datasets that are for training network, for validation of the network during training, and for testing performance. The training dataset S training is divided into two subsets, S training 1 and S training 2 . The validation dataset S valid is used to evaluate offspring performance in the GA training phase. The test set S t e s t is used to evaluate the performance of the trained networks. The relationships between theses sets are as follows:
S training 1 S training 2 = ϕ
S training 1 S test = ϕ ,   S training 2 S test = ϕ
S valid S test = ϕ
Figure 3 shows the flow diagram of the SM-DBN. At the start of the process, data set S training is divided into two subsets S training 1 and S training 2 . At this point, these should have an intersection set. Each subset is trained by its corresponding DBN. Each DBN has the same bias vectors. This network information is treated as chromosomes in the merge phase of GA. Moreover, the crossover and mutation occur in this phase. In this paper, the uniform crossover method is used. The performance of each offspring created after the merge phase is evaluated by counting the number of errors (zero-one loss) using a validation set, S valid . If R D { 1 , , L } is the prediction function, then this loss can be expressed as:
l 0 , 1 = i = 1 | S v a l i d | I f ( x i ) y i
where D is the number of input dimensions, L is the number of labels, and the dataset S valid . is an indexed validation dataset of pairs ( x i , y i ) .   x i R D is the ith data of dimensionality D , and and y i { 1 , , L } is the i th label assigned to input x i . The indicator function I x , and the function are defined as
I x = { 1 ,   if   x   is   true 0 ,   otherwise ,   f ( x ) = argmax k P ( Y = k | x ,   N e t ) ,
where N e t is a set of all parameters for a neural network. The aim of the GA is to find N e t u m which minimizes the zero-one loss function. Therefore, the objective function of the GA can be written as:
g ( x ) = N e t u m ,   u =   argmin v l 0 , 1 v
After the evaluation for the offspring, the two fitted offspring, N e t 1 m and N e t 2 m , are selected. The subscript refers to the ranking based on the validation test. Both networks are going to be parents in the next generation.
After iterating for M generations, the fittest offspring N e t 1 N ( N M ) is finally selected. This network is not yet optimized. Therefore, fine-tuning by BP must be executed.

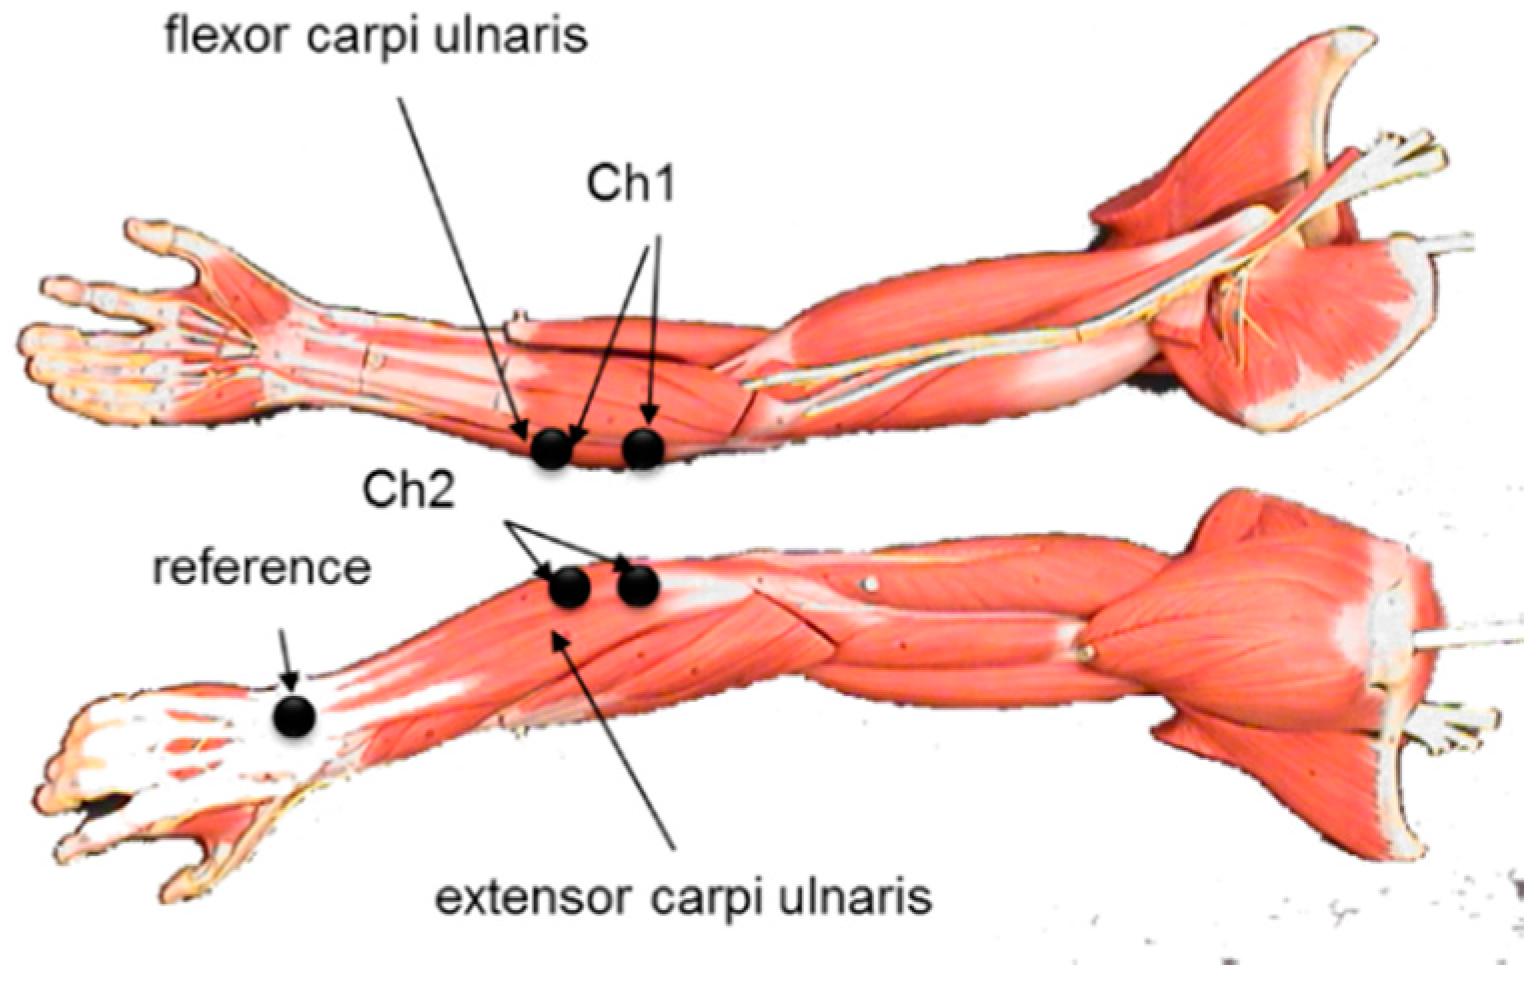
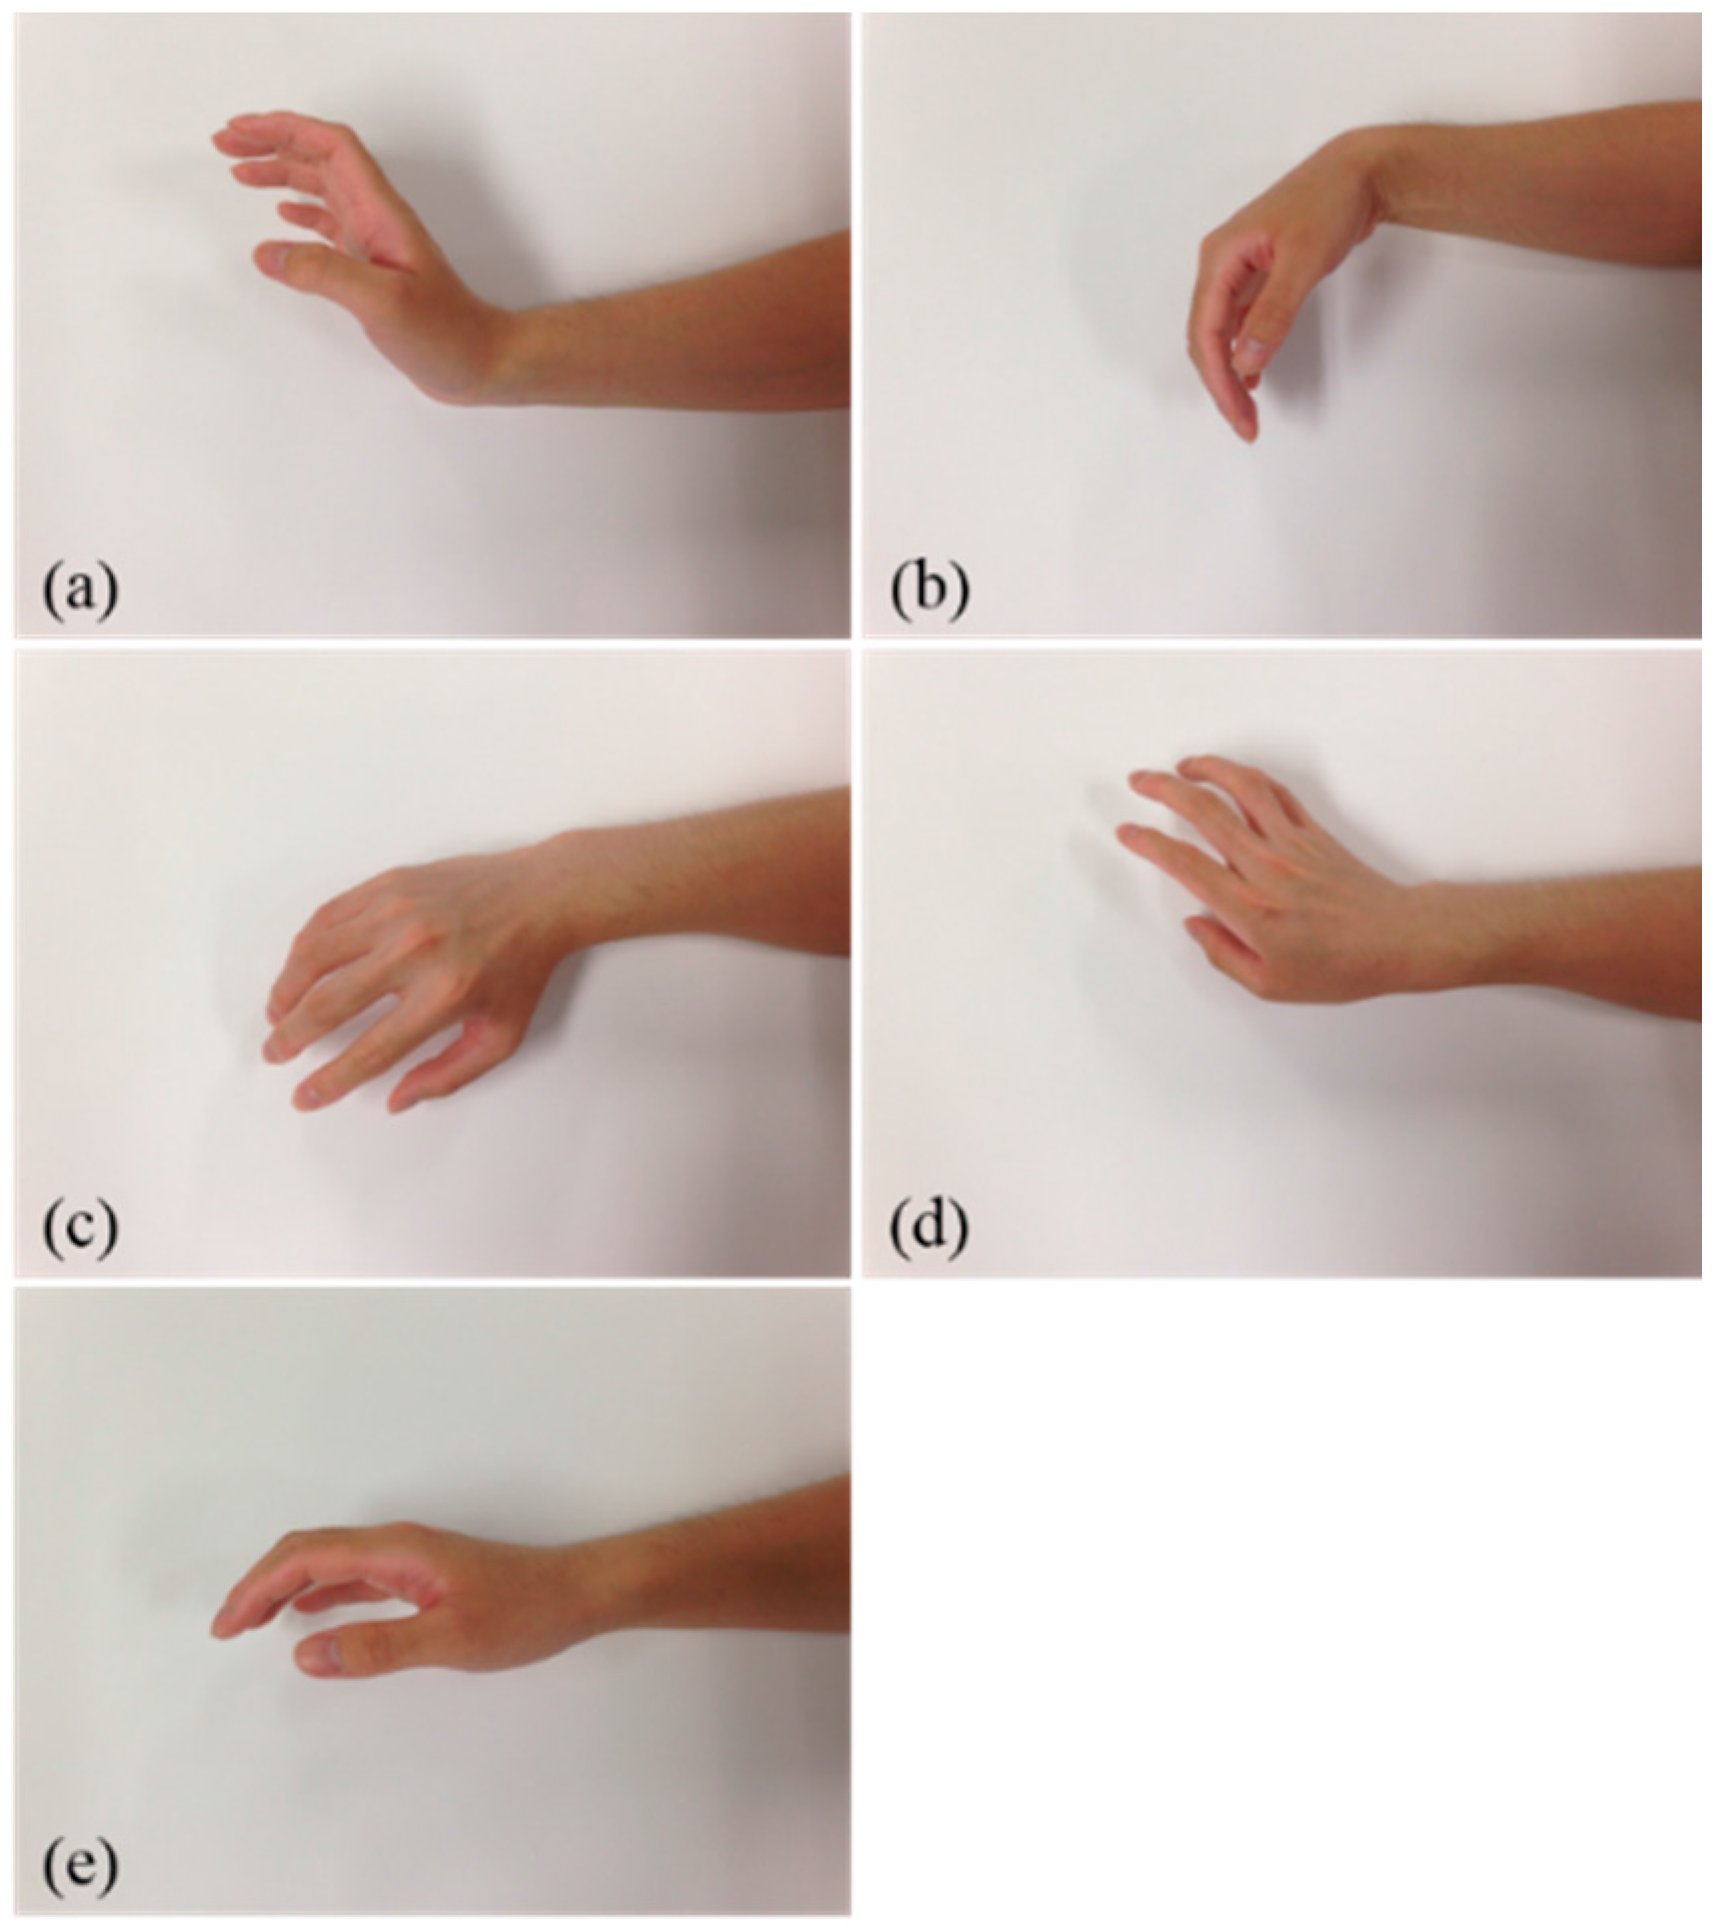
2.4. Participants and EMG Signal Acquisition

In this work, EMG signal data from our previous work are used [22,23]. The EMG signals from five wrist motions—named up, down, left, right, and rest—were acquired. Figure 4 shows the shape of the five motions of the wrist. The EMG signals were acquired from 23 males and 5 females. Each of the participants was informed about the experimental procedures before the onset of recording.
Ag/AgCl electrodes were used to record EMG signals, and these were attached on the FCU and ECU, respectively. These electrodes were connected to the biosignal amplifier. In this work, the MP150WSW and BN-EMG2 acquisition systems (BIOPAC Systems, Inc., Goleta, CA, USA) were used to record the signals. EMG signals were obtained using the BN-EMG2.
In this work, we collected 47 sets of EMG raw signals from 28 persons. We then extracted 11750 sets of features from raw EMG signals.

2.5. Training and Test
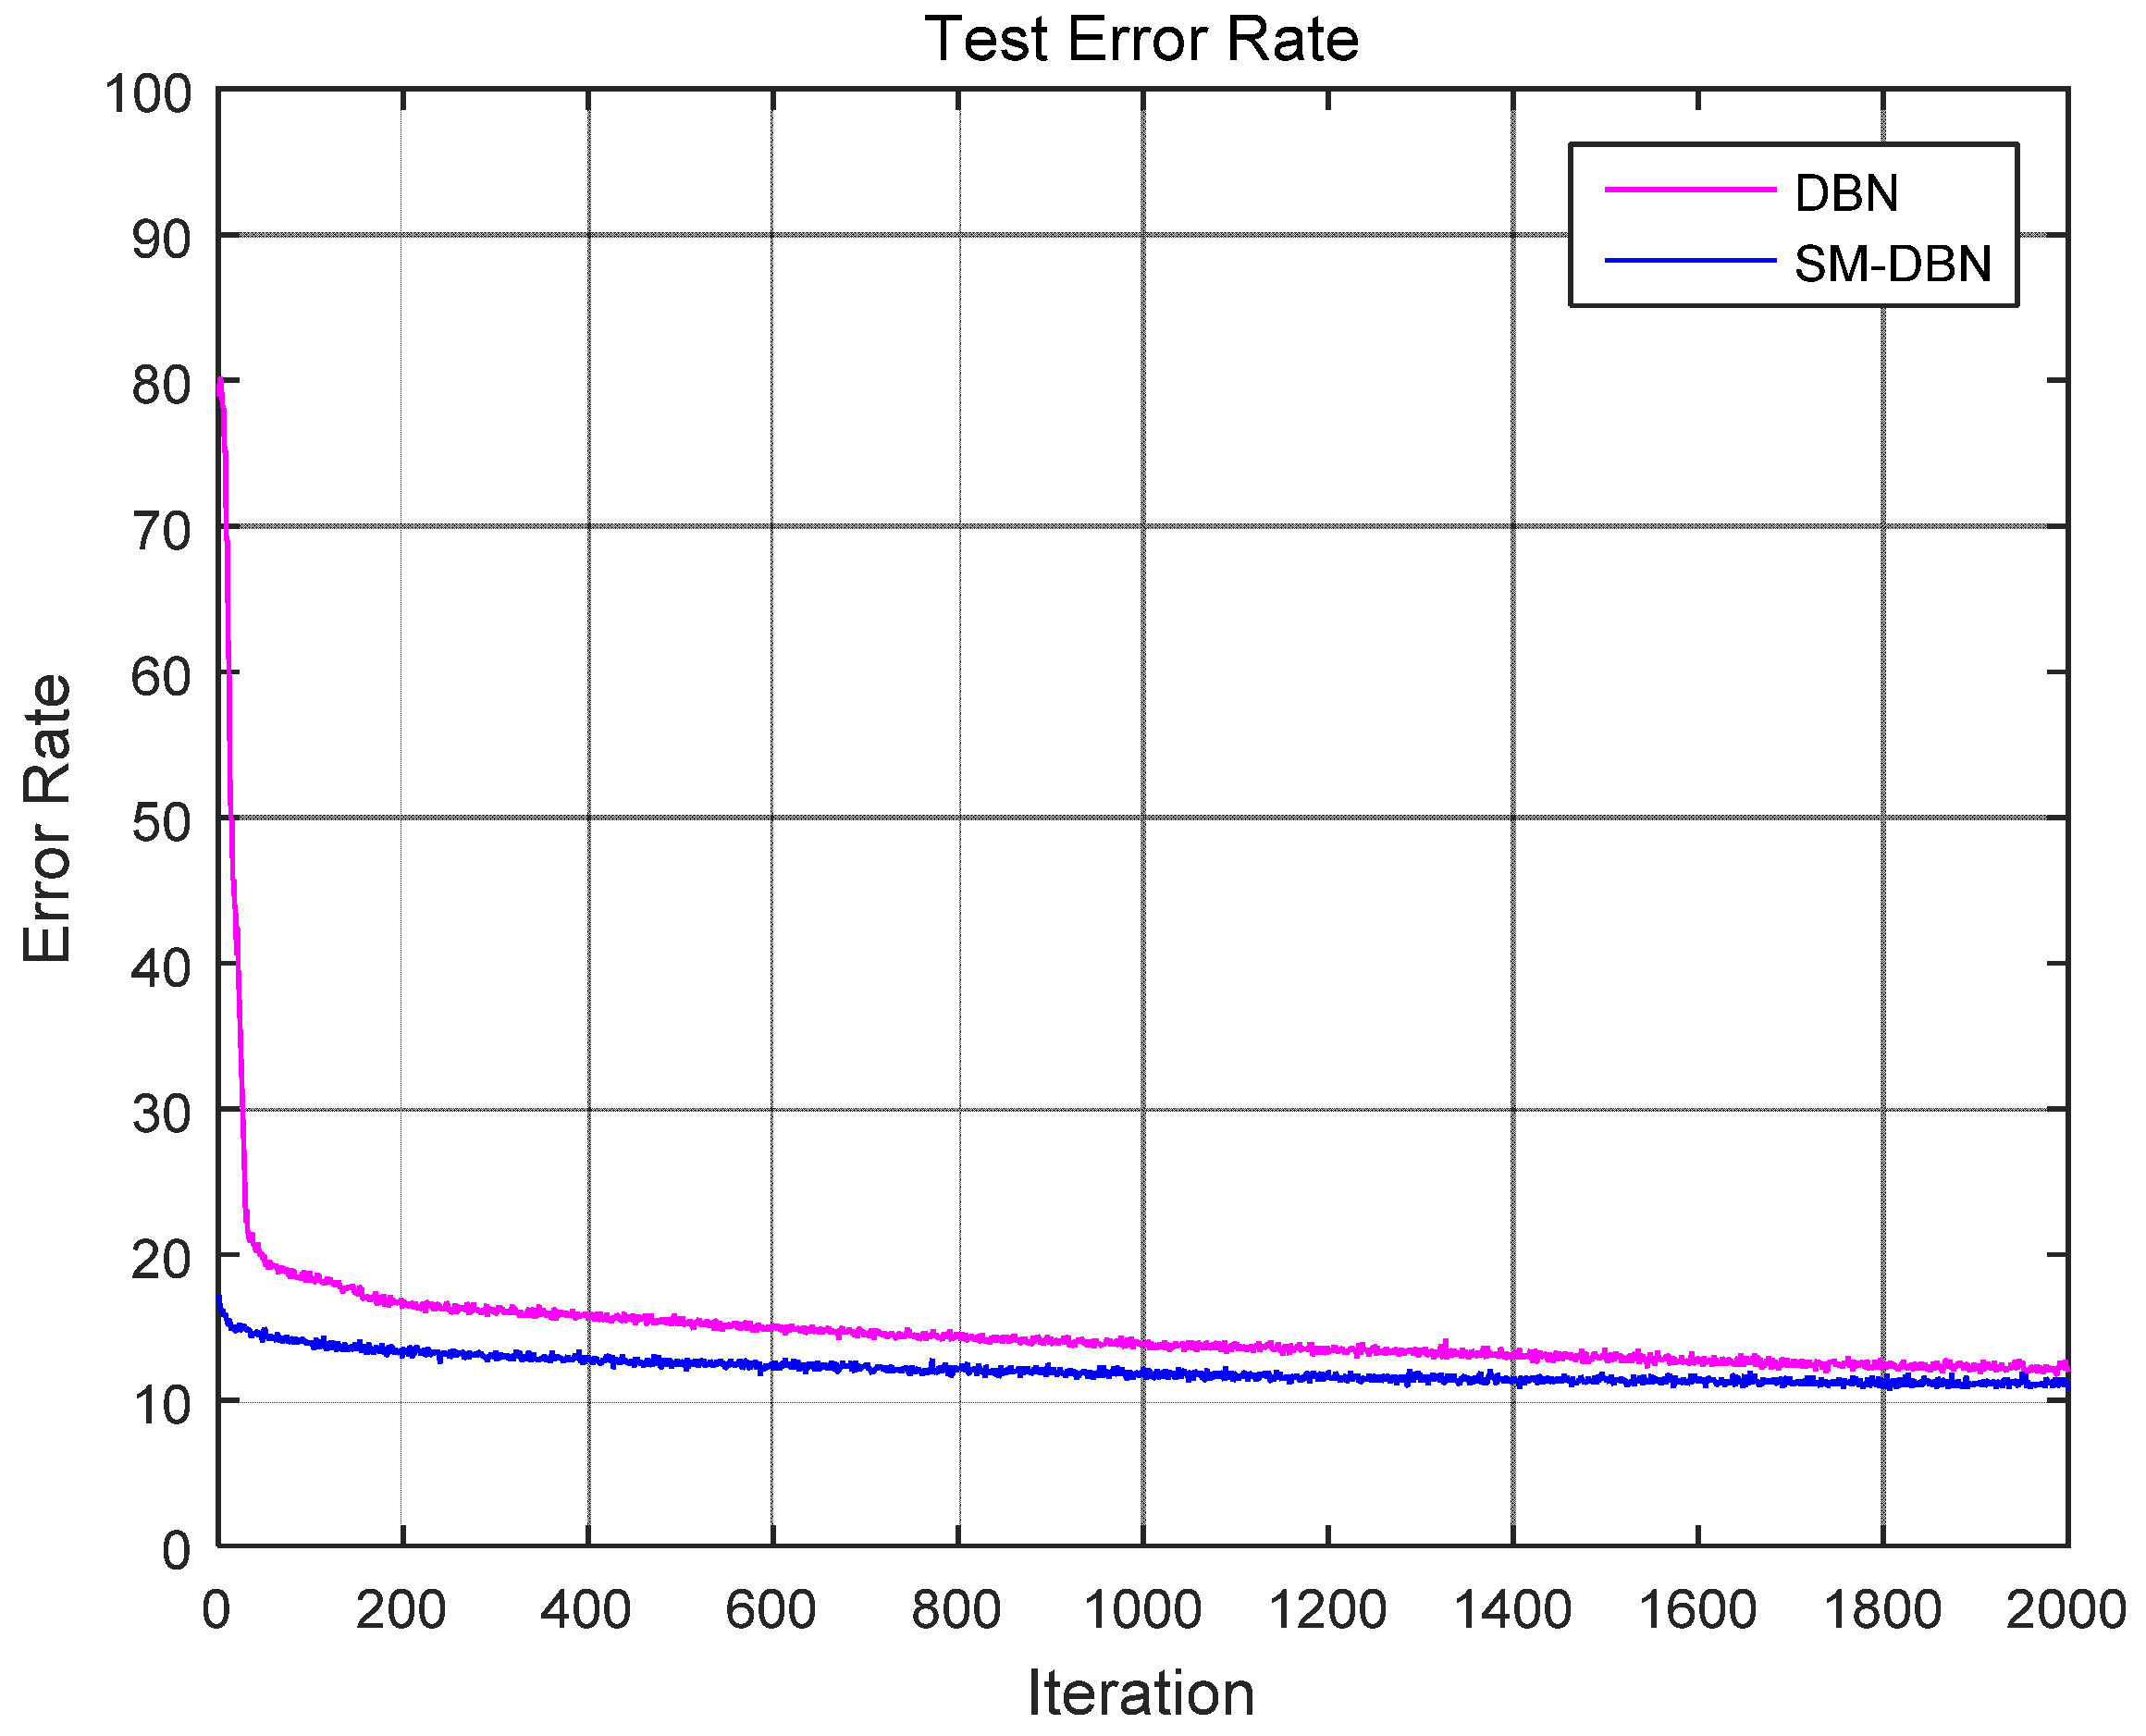
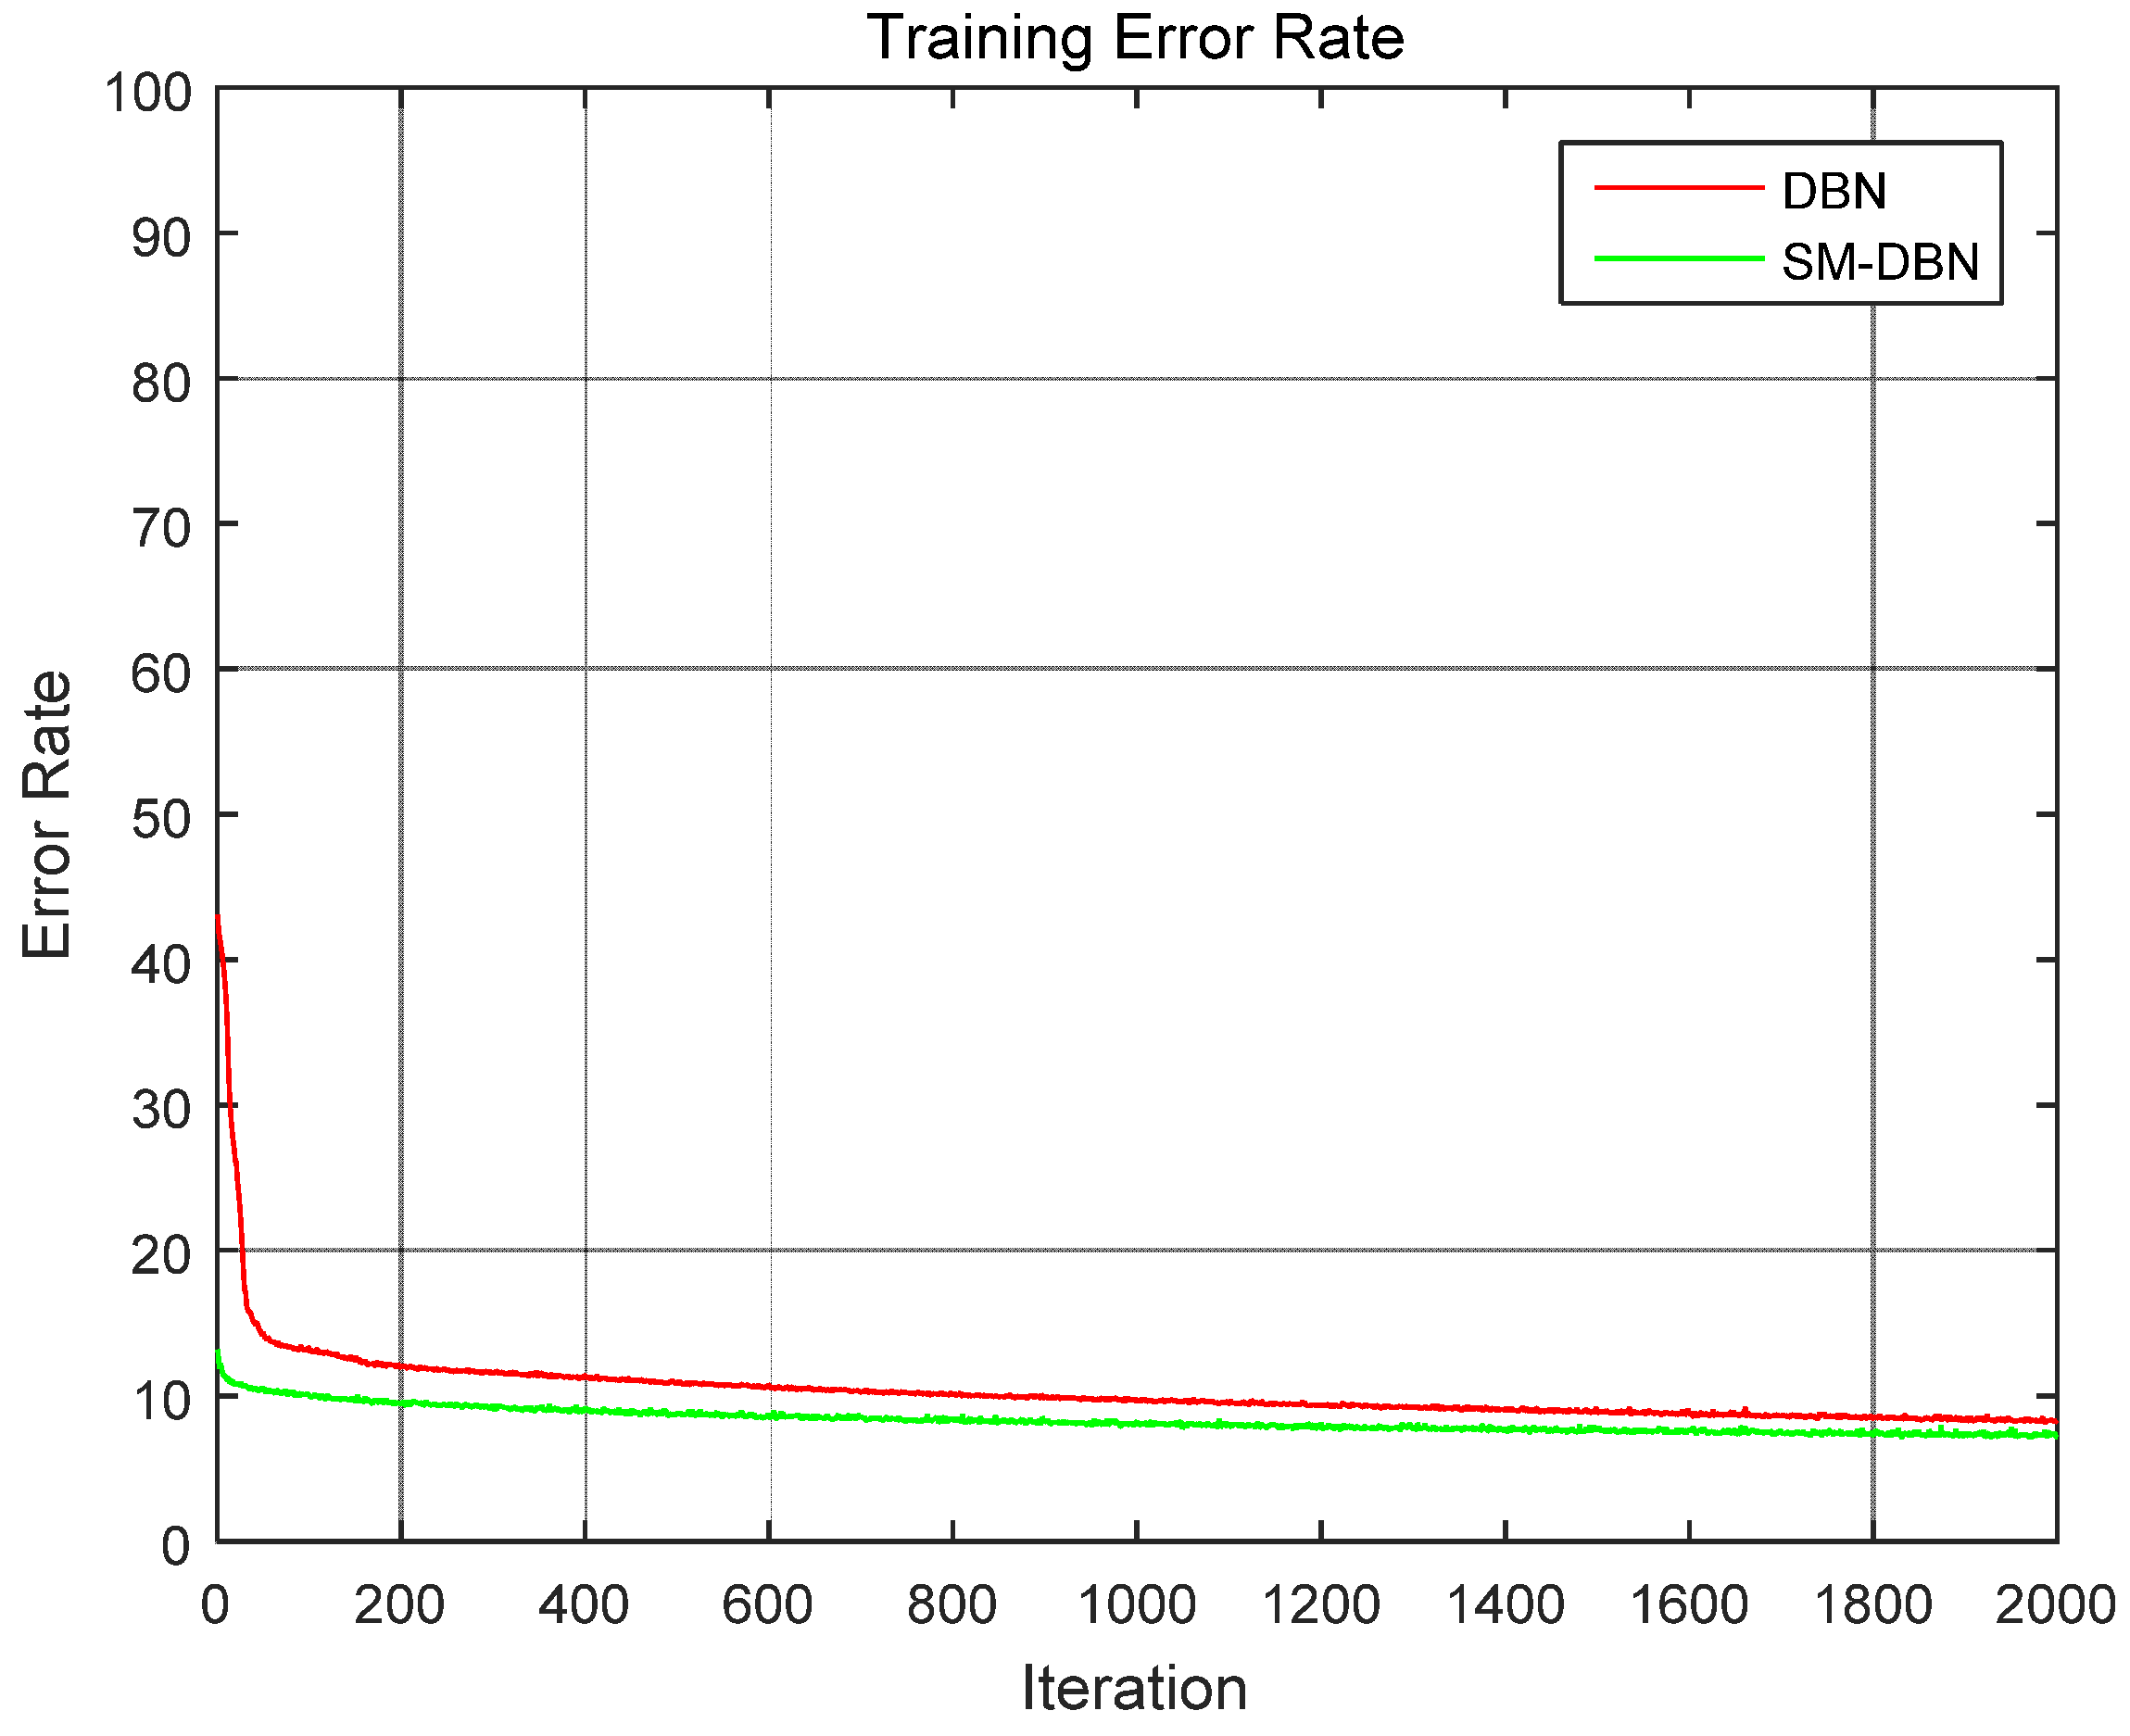
To extract features and classify motions, Python 2.7.7 [32], Numpy 1.9.0b, Scipy 0.14.0 [33], Scikit learn [34], MATLAB (Mathworks, Natick, MA, USA), and the DeepLearning Toolbox were used [35]. Table 1 describes the parameter settings used to acquire the EMG raw signals and features.

3. Results

To validate our method, we compared it with the conventional DBN. In our previous work, the DBN showed enhanced performance compared to other machine learning-based classifiers, such as the LDA or the SVM. Figure 5 shows the average learning curve of the DBN and SM-DBN, respectively. The learning error rate of the SM-DBN is less than the learning error rate of the DBN. Likewise, the figure shows the average test error rate curve of the DBN and SM-DBN. The test result is similar to the average learning curve.
A ten-fold cross-validation was used for statistical evaluation. In the cross-validation method, the entire dataset was divided into k sub-datasets. The classifier was trained with a training dataset, and it was then validated with a test dataset. Every dataset must be used for the test set more than once. In our work, the dataset was divided by 10 randomly. Eight subsets were then used for training, another subset was used for validation, and the rest were used for the test set. There were ten possible cases. Table 2 shows the validation test results. After 2000 iterations, the average error rate of the DBN was 12.00%. On the other hand, the error rate of the SM-DBN was 10.079. Moreover, the standard deviations of the DBN and SM-DBN were 1.086 and 1.050, respectively. Once the average result of 10 trials was compared with the DBN, the error rate of the SM-DBN was found to be 12.06% higher.
A dependent t-test was used to evaluate the statistical significance of the difference between the results of each algorithm. The statistical program R was used for statistical computing [36]. The elicited p-value was 0.0146, indicating a statistically significant difference between the two algorithms at a 5% level of significance.
TP (True Positive), FN (False Negative), FP (False Positive) and TN (True Negative) were obtained using the confusion matrix to evaluate the performance of the model. In addition to the accuracy, true positive rate (TPR) and false positive rate (FPR) were designed and evaluated for performance. TPR can be defined as:
TPR = TP TP + FN
and FPR can be written as:
FPR = FP FP + TN
Table 3 shows the results of sensitivity and specificity analysis. The sensitivity of SM-DBN was 1.29% higher, and the specificity was 0.66% lower. This suggests that SM-DBN has better sensitivity, specificity, and accuracy than DBN.

4. Discussion

There are some limitations associated with this work. The recording time of the EMG signal is not long. This means that the scale of the samples is small to be considered as big data. Although the DBN is suitable for big data classification, it elicited good performance in this work.
The parameters used for the classifier used the same values to allow comparison with the conventional DBN and SM-DBN. Thus, the error rate convergence of the SM-DBN is faster than that of conventional DBN. Statistically, the performance of the SM-DBN is improved, because the convergence time of the SM-DBN is shorter than that of the DBN. This is because the GA optimized weights of the network heuristically. The crossover and mutation of the merge procedure yielded strongly connected nodes for neurons that enhance the recognition performance, and weakly connected nodes for irrelevant and redundant neurons. Therefore, the feature extractor for the proposed method chooses more separable features than the RBMs. In the result, we can identify the proper classifier at approximately 1000 iterations. It is important to avoid the overfitting problem. In many cases, overfitting occurs in a long trained classifier. Any overfitting instance is not shown in Figure 6.
The standard deviations of the DBN and SM-DBN are small. This means that the stability of the classifiers is guaranteed.

5. Conclusions

In this paper, an EMG pattern recognition method is proposed based on SM-DBN. Conventional DBN generated a network with RBM, and was fine-tuned using BP. In SM-DBN, optimization with GA was added between RBM and BP. The implemented algorithm was then compared with the conventional DBN. As a result, the statistical performance of the SM-DBN was 12.06% higher than the conventional DBN. SM-DBN has a short convergence time in reducing the training epoch. It is also efficient in reducing the risk of overfitting. It shows the effectiveness of the optimization with GA.
To enhance the performance of the classifier, more research on extracting dominant features and designing optimized SM-DBN structures is required. This classifier architecture is not optimized. Therefore, with the optimization of the parameters, the accuracy of the classifiers will be improved.
Furthermore, more data recording is needed in general for deep learning that inherently requires tremendously large datasets. It is thus important to reduce the error rate and biased decision function

Acknowledgments

This work was supported by Basic Research Program through the National Research Foundation of Korea (NRF) funded by the Ministry of Education (2010-0020163) and the MSIP (Ministry of Science, ICT and Future Planning), Korea, under the C-ITRC (Convergence Information Technology Research Center) (IITP-2016-H8601-16-1003).

Author Contributions

Hyeon-min Shim and Sangmin Lee conceived and designed the experiments; Hongsub An performed the experiments; Sanghyuk Lee and Eung Hyuk Lee analyzed the data; Hong-ki Min contributed reagents/materials/analysis tools; Hyeon-min wrote the paper.

Conflicts of Interest

The authors declare no conflict of interest.

Abbreviations

BPBack Propagation
DAMVDifferent Absolute Mean Value
DBNDeep Belief Network
ECUExtensor Carpi Ulnaris
EMGElectromyography
FCUFlexor Carpi Ulnaris
GAGenetic Algorithm
GMMGaussian Mixture Model
LDALinear Discriminant Analysis
MAVMean Absolute Value
MLPMulti-Layer Perceptron
RBMRestricted Boltzmann Machine
SM-DBNSplit and Merge Deep Belief Network
SVMSupport Vector Machine
ZCZero Crossing

References

  1. Hudgins, B.; Parker, P.; Scott, R. A new strategy for multifunction myoelectric control. IEEE Trans. Biomed. Eng. 1993, 40, 82–94. [Google Scholar] [CrossRef] [PubMed]
  2. Saridis, G.N.; Gootee, T.P. Emg pattern analysis and classification for a prosthetic arm. IEEE Trans. Biomed. Eng. 1982, 29, 403–412. [Google Scholar] [CrossRef] [PubMed]
  3. Lee, J.W.; Lee, G.K. Gait angle prediction for lower limb orthotics and prostheses using an EMG signal and neural networks. Int. J. Control Autom. Syst. 2005, 3, 152–158. [Google Scholar]
  4. Ajiboye, A.; Weir, R. A heuristic fuzzy logic approach to EMG pattern recognition for multifunctional prosthesis control. IEEE Trans. Neural Syst. Rehabil. Eng. 2005, 13, 280–291. [Google Scholar] [CrossRef] [PubMed]
  5. Guo, Y.; Naik, G.R.; Huang, S.; Abraham, A.; Nguyen, H.T. Nonlinear multiscale Maximal Lyapunov Exponent for accurate myoelectric signal classification. Appl. Soft Comput. 2015, 36, 633–640. [Google Scholar] [CrossRef]
  6. Naik, G.R.; Nguyen, H.T. Nonnegative Matrix Factorization for the Identification of EMG Finger Movements: Evaluation Using Matrix Analysis. IEEE J. Biomed. Health Inform. 2015, 19, 478–485. [Google Scholar] [CrossRef] [PubMed]
  7. Naik, G.; Al-Timemy, A.; Nguyen, H. Transradial Amputee Gesture Classification Using an Optimal Number of sEMG Sensors: An Approach Using ICA Clustering. IEEE Trans. Neural Syst. Rehabil. Eng. 2015, 24, 837–846. [Google Scholar] [CrossRef] [PubMed]
  8. Chen, M.; Zhou, P. A Novel Framework Based on FastICA for High Density Surface EMG Decomposition. IEEE Trans. Neural Syst. Rehabil. Eng. 2016, 24, 117–127. [Google Scholar] [CrossRef] [PubMed]
  9. Naik, G.R.; Dinesh, K.K.; Marimuthu, P. Signal processing evaluation of myoelectric sensor placement in low-level gestures: Sensitivity analysis using independent component analysis. Expert Syst. 2014, 31, 91–99. [Google Scholar] [CrossRef]
  10. Naik, G.R.; Dinesh, K.K. Subtle electromyographic pattern recognition for finger movements: A pilot study using BSS techniques. J. Mech. Med. Biol. 2012, 12, 1–19. [Google Scholar] [CrossRef]
  11. Naik, G.R.; Dinesh, K. Kumar, Identification of hand and finger movements using multi run ICA of surface electromyogram. J. Med. Syst. 2012, 36, 841–851. [Google Scholar] [CrossRef] [PubMed]
  12. Naik, G.R.; Acharyya, A.; Nguyen, H.T. Classification of finger extension and flexion of EMG and Cyberglove data with modified ICA weight matrix. In Proceedings of the 2014 36th Annual International Conference of the IEEE Engineering in Medicine and Biology Society (EMBC), Chicago, IL, USA, 26–30 August 2014; pp. 3829–3832.
  13. Xie, H.-B.; Huang, H.; Wu, J.; Liu, L. A comparative study of surface EMG classification by fuzzy relevance vector machine and fuzzy support vector machine. Physiol. Meas. 2015, 36, 191–206. [Google Scholar] [CrossRef] [PubMed]
  14. Palkowski, A.; Grzegorz, R. Basic Hand Gestures Classification Based on Surface Electromyography. Computat. Math. Methods Med. 2016, 2016, 6481282. [Google Scholar] [CrossRef] [PubMed]
  15. Young, A.J.; Smih, L.H.; Rouse, E.J.; Hargrove, L.J. Classification of simultaneous movements using surface EMG pattern recognition. IEEE Trans. Biomed. Eng. 2013, 60, 1250–1258. [Google Scholar] [CrossRef] [PubMed]
  16. Park, S.; Lee, S. EMG pattern recognition based on artificial intelligence techniques. IEEE Trans. Rehabil. Eng. 1998, 6, 400–405. [Google Scholar] [CrossRef] [PubMed]
  17. Mandryk, R.L.; Inkpen, K.M.; Calvert, T.W. Using psychophysiological techniques to measure user experience with entertainment technologies. Behav. Inf. Technol. 2006, 25, 141–158. [Google Scholar] [CrossRef]
  18. Cortes, C.; Vapnik, V. Support-Vector Networks. Mach. Learn. 1995, 20, 273–297. [Google Scholar] [CrossRef]
  19. Ahsan, M.R.; Ibrahimy, M.I.; Khalifa, O.O. EMG signal classification for human computer interaction: A review. Eur. J. Sci. Res. 2009, 33, 480–501. [Google Scholar]
  20. Al-Angari, H.M.; Kanitz, G.; Tarantino, S.; Cipriani, C. Distance and mutual information methods for EMG feature and channel subset selection for classification of hand movements. Biomed. Signal Process. Control 2016, 27, 24–31. [Google Scholar] [CrossRef]
  21. Boudjellal, A.; Abed-Meraim, K.; Aissa-El-Bey, A. Sparsity-based algorithms for blind separation of convolutive mixtures with application to EMG signals. In Proceedings of the 2014 IEEE Workshop on Statistical Signal Processing (SSP), Jupiters, Gold Coast, Australia, 29 June–2 July 2014.
  22. Jeong, E.; Kim, S.; Song, Y.; Lee, S. Comparison of wrist motion classification methods using surface electromyogram. J. Central South Univ. 2013, 20, 960–968. [Google Scholar] [CrossRef]
  23. Shim, H.M.; Lee, S. Multi-channel electromyography pattern classification using deep belief networks for enhanced user experience. J. Central South Univ. 2015, 22, 1801–1808. [Google Scholar] [CrossRef]
  24. Hinton, G.; Osindero, S.; Teh, Y. A fast learning algorithm for deep belief nets. Neural Comput. 2006, 18, 1527–1554. [Google Scholar] [CrossRef] [PubMed]
  25. An, H.; Shim, H.M.; Na, S.I.; Lee, S. Split and merge algorithm for deep learning and its application for additional classes. Pattern Recognit. Lett. 2015, 65, 137–144. [Google Scholar] [CrossRef]
  26. THE MNIST Database. Available online: http://yann.lecun.com/exdb/mnist/ (accessed on 18 April 2016).
  27. Karlssona, S.; Gerdle, B. Mean frequency and signal amplitude of the surface EMG of the quadriceps muscles increase with increasing torque—A study using the continuous wavelet transform. J. Electromyogr. Kinesiol. 2001, 11, 131–140. [Google Scholar] [CrossRef]
  28. Lee, S.; Kim, J.; Park, S. An enhanced feature extraction algorithm for EMG pattern classification. IEEE Trans. Rehabil. Eng. 1996, 4, 439–443. [Google Scholar] [PubMed]
  29. Rumelhart, D.E.; Hinton, G.E.; Williams, R.J. Learning Representations by Back-Propagating Errors. In Cognitive Modeling; The MIT Press: Cambridge, MA, USA, 1988; pp. 213–220. [Google Scholar]
  30. Hinton, G.E.; Salakhutdinov, R.R. Reducing the dimensionality of data with neural networks. Science 2006, 313, 504–507. [Google Scholar] [CrossRef] [PubMed]
  31. Hopfield, J.J. Neural networks and physical systems with emergent collective computational abilities. Proc. Natl. Acad. Sci. USA 1982, 79, 2554–2558. [Google Scholar] [CrossRef] [PubMed]
  32. Python Software Foundation. Python2.7.7. Available online: https://www.python.org/ (accessed on 18 April 2016).
  33. Scipy developers. Sciypy. Available online: https://www.scipy.org/ (accessed on 18 April 2016).
  34. Scikit-learn machine learning in Python. Available online: http://scikit-learn.org/ (accessed on 18 April 2016).
  35. Palm, R.B. DeepLearnToolbox. Available online: https://github.com/rasmusbergpalm/ (accessed on 18 April 2016).
  36. The R Foundation. The R Project for Statistical Computing. Available online: https://www.r-project.org/ (accessed on 18 April 2016).
Figure 1. Flow diagram of the process for electromyography (EMG) pattern recognition.
Symmetry 08 00148 g001
Figure 2. We acquired two channel EMG signals. Channel 1 signals were measured from the flexor carpi ulnaris muscle, and channel 2 signals were measured from the extensor carpi ulnaris.
Symmetry 08 00148 g002
Figure 3. Flow diagram of the split-and-merge deep belief network (SM-DBN). BP: back propagation.
Symmetry 08 00148 g003
Figure 4. Five types of wrist motions. (a) Up; (b) Down; (c) Left; (d) Right; (e) Rest.
Symmetry 08 00148 g004
Figure 5. Average learning curve of DBN and SM-DBN.
Symmetry 08 00148 g005
Figure 6. Average test error rate curve of DBN and SM-DBN.
Symmetry 08 00148 g006
Table 1. Parameter settings to acquire raw signals and features.
ParameterValue
ChannelsFlexor carpi ulnaris
Extensor carpi ulnaris
Sampling rate1 kHz
Filter10–500 Hz 2nd order Butterworth
Data window166 ms Hamming window, 50% overlapped
FeaturesDAMV, DASDV, MAV, ZC
DAMV: different absolute mean value; DASDV: different absolute standard deviation value; MAV: mean absolute value; ZC: zero crossing.
Table 2. Result of performance test between DBN and SM-DBN.
Number of TrialsDBNSM-DBN
113.0910.82
212.6411.36
39.458.82
412.6412.36
511.189.55
612.4511.09
711.6410.73
811.739.73
912.1811.27
1013.0011.36
Average12.0010.709
Standard-deviation1.0861.050
t-testConfidence interval95%
[0.2873556, 2.2946444]
t2.7027
df17.979
p-value0.0146
alternative hypothesisTrue difference in means is not equal to 0.
Table 3. Sensitivity and specificity analysis of SM-DBN and DBN.
Number of TrialsSM-DBNDBN
Accuracy (%)Sensitivity (TPR, %)Specificity (FPR, %)Accuracy (%)Sensitivity (TPR, %)Specificity (FPR, %)
189.1889.27%2.90%86.91%86.98%3.56%
288.6488.73%3.08%87.36%87.44%3.46%
391.1891.29%2.34%90.55%90.83%2.53%
487.6487.74%3.37%87.36%87.43%3.46%
590.4590.58%2.55%88.82%89.02%3.02%
688.9189.11%3.00%87.55%87.80%3.42%
789.2789.34%2.90%88.36%88.36%3.16%
890.2790.31%2.59%88.27%88.37%3.19%
988.7388.87%3.04%87.82%87.74%3.28%
1088.6488.70%3.07%87.00%87.12%3.48%
Average89.2989.39%2.88%88.00%88.11%3.26%
Standard Deviation0.0105220.0104681190.0030519070.010850.0114460.003072

