Internet of THings Area Coverage Analyzer (ITHACA) for Complex Topographical Scenarios


1
Department of Information Engineering, University of Padua (UNIPD), Via Gradenigo 6/b, 35131 Padova, Italy
2
Faculty of Computer Science, Multimedia and Telecommunications, Universitat Oberta de Catalunya (UOC), Rambla del Poblenou 156, 08018 Barcelona, Spain
3
eLearn Center, Universitat Oberta de Catalunya (UOC), Rambla del Poble Nou 156, 08018 Barcelona, Spain
4
Internet Interdisciplinary Institute, Universitat Oberta de Catalunya (UOC), Av. Carl Friedrich Gauss 5, 08860 Castelldefels, Spain
*
Author to whom correspondence should be addressed.
Symmetry 2017, 9(10), 237; https://doi.org/10.3390/sym9100237
Submission received: 31 August 2017
/
Revised: 22 September 2017
/
Accepted: 9 October 2017
/
Published: 19 October 2017
(This article belongs to the Special Issue Applications of Internet of Things)
Abstract
:The number of connected devices is increasing worldwide. Not only in contexts like the Smart City, but also in rural areas, to provide advanced features like smart farming or smart logistics. Thus, wireless network technologies to efficiently allocate Internet of Things (IoT) and Machine to Machine (M2M) communications are necessary. Traditional cellular networks like Global System for Mobile communications (GSM) are widely used worldwide for IoT environments. Nevertheless, Low Power Wide Area Networks (LP-WAN) are becoming widespread as infrastructure for present and future IoT and M2M applications. Based also on a subscription service, the LP-WAN technology SIGFOXTM may compete with cellular networks in the M2M and IoT communications market, for instance in those projects where deploying the whole communications infrastructure is too complex or expensive. For decision makers to decide the most suitable technology for each specific application, signal coverage is within the key features. Unfortunately, besides simulated coverage maps, decision-makers do not have real coverage maps for SIGFOXTM, as they can be found for cellular networks. Thereby, we propose Internet of THings Area Coverage Analyzer (ITHACA), a signal analyzer prototype to provide automated signal coverage maps and analytics for LP-WAN. Experiments performed in the Gran Canaria Island, Spain (with both urban and complex topographic rural environments), returned a real SIGFOXTM service availability above 97% and above 11% more coverage with respect to the company-provided simulated maps. We expect that ITHACA may help decision makers to deploy the most suitable technologies for future IoT and M2M projects.
1. Introduction
Our society aims to enhance or create new services to ease their quotidian tasks. The Smart City context is directly linked to the Internet of Things (IoT) paradigm to provide better and new services to our society. Not only cities but also rural areas benefit from services improvement thanks to IoT. The IoT interconnects sensor devices to the Internet increasing a number of interactions among people and computers. With the increment of devices worldwide [1], more machine-to-machine (M2M) communications will be established providing disruptive applications. Within the available M2M technologies, we can find traditional cellular networks like the Global System for Mobile communications (GSM), and Low-Power Wide-Area Network (LP-WAN) technologies which transmit at low bit rate to long-range distances with low power consumption. A popular example of the latter technology is provided by the French company SIGFOXTM [2] which uses an Ultra Narrow Band (UNB) modulation.
A UNB communication system allows the low power wireless communication occupying a narrow range of frequencies. Since most of the devices have a limited battery life, it is suitable in a M2M paradigm. Thus, a LP-WAN network may cover larger areas, reducing costs with respect to common cellular networks, while keeping similar coverage service. Practical cases where LP-WAN networks may contribute to M2M communications within Smart City and rural contexts include the optimization of garbage truck routes to reduce time [3], air pollution control to combat climate change [4], battery level management from renewable energy sources to increase efficiency [5] and soil moisture analysis in crops to optimize water flow [6]. The two first cases are found in urban environments and the last two cases in rural environments. LP-WAN service must then work in those common environments.
Within the different features used to select any specific communications technology for a project, signal coverage is of key importance. In general, a company which wants to deploy any wireless communication technology should proceed to simulate the coverage using a software tool. The simulation allows analyzing a foresight coverage anticipating possible needs before deploying the network. Coverage maps are also used by potential customers to decide whether or not to use that specific service.
In case the simulated area does not present blocking elements (complex topography like mountains, valleys, etc.), service availability may be easily simulated. However, topographical complexity may make a difficult signal reception, and as a consequence, service unavailability. In these cases, simulated coverage maps may be inaccurate, or difficult to obtain. This is especially relevant for systems deployed in rural areas (i.e., monitoring mountain landslides). Therefore, there is the need of on-site coverage analysis to confirm simulated coverage maps, before offering the service to end users. Nevertheless, while real coverage maps can be found for GSM, there is no equivalent information for LP-WAN.
In this paper, we present Internet of THings Area Coverage Analyzer (ITHACA), a signal analyzer prototype to provide automated signal coverage maps and analytics for LP-WAN, which aims to provide further information to Smart City projects decision makers. We evaluated our prototype in the Gran Canaria Island, Spain, as a worst case scenario due to its rural complex topography, and well limited urban/rural boundaries [7]. The overall goal of this work is to provide a tool to evaluate, in given scenarios, whether LP-WAN technologies may be a candidate for IoT and M2M communications.
In this paper we present the following contributions:
- Comparison of subscription-based communication networks in terms of infrastructure deployment and end-user application costs;
- Design and development of a low-cost device to check the availability of LP-WAN service in a given area;
- Implementation of a system to collect and present the real measurements performed on the field;
- Evaluation of the proposed system in a complex topographical scenario.
The remainder of this paper is organized as follows: Section 2 details the problem motivation and the related state of the art. Section 3 describes the need for reliable service maps for LP-WAN technologies. The architecture of the system is described in Section 4 and Section 5 presents the methodology and experimentation procedure to collect the measurements. We evaluate and compare our results in Section 6. Finally, the paper is concluded in Section 7, also pointing out future work directions.
2. Related Work
When an application for IoT is planned to be implemented in a Smart City context, the application designer must select the most appropriate communication technology. On one hand, cellular technologies have been providing subscription-based data connectivity since the GSM technology firstly opened commercially in 1991 [8]. In 2001 the 98% of the West European surface was covered by GSM and its use was mainly focused on voice calls, SMS, and low-speed data services with a bit rate of 9.6 kbps. Within the different cellular technologies, IoT and M2M services can be provided from the second generation (2G) on, with specific features for IoT and M2M communications expected in the future NB-IoT standard [9], still to be released.
On the other hand, LP-WAN technologies became an alternative for low-rate and long-range communication technologies. Andreev et al. [10] review long-range communications technologies to interconnect devices in an IoT network. Myers [11] presents the low-power wide-area channel access method Random phase multiple access (RPMA), employing direct-sequence spread spectrum with multiple access (DSSS) using the 2.4 GHz band. The proprietary LP-WAN technology Long Range Wide area network is designed by Hornbuckle [12] based on the modulation type Chirp Spread Spectrum (CSS) which introduces expensive components to keep the synchronization among nodes. Fourtet and Bailleul [13] introduce a LP-WAN technology based on the modulation UNB working in the unlicensed Industrial, Scientific and Medical (ISM) band 868 MHz with a message transmissions’ duty-cycle of 140 messages of 12 byte each message per day (1% of frequency spectrum’s occupation per day) [14]. Sanchez-Iborra and Cano [15] compare these LP-WAN technologies among others as solutions for Industrial IoT Services. Margelis et al. [16] study the wireless technologies of LoRaWan, Sigfox, and Ingenu as Low Throughput Networks. These LP-WAN technologies are compared by Lab Links in [17]. Goursaud and Gorce [18] analyze the described wireless technologies from a Physical Layer (PHY) and Medium Access Control (MAC) layer point of view. Table 1 compares the described LP-WAN technologies.
Within the different LP-WAN technologies, we focus on SIGFOXTM, a world-wide subscription-based LP-WAN service [19] which uses the UNB modulation. Table 2 compares different aspects to consider in an M2M network implementation between SIGFOXTM and GSM, where most of the characteristics have been extracted from the IoT global network community [20]. From Table 2 we can observe how SIGFOXTM requires 20 times fewer antennas to cover the same urban environment than GSM, also having higher signal penetration into buildings. Regarding signal penetration into buildings, simulations considering a populated area in Denmark returned an indoor building penetration about 40% for General Packet Radio Service (GPRS) and higher than 95% for SIGFOXTM [21].
One of the main aspects for decision makers selecting the most appropriate technology for IoT or M2M communications is service availability. Besides simulated maps, checking signal availability by means of field trials have been a common practice to ensure proper connectivity. Turau et al. [22] describe the aspects to consider before performing field trials. Petäjäjärvi et al. [23] executed extensive field trials during 14 days in the Finish city of Oulu, using the LoRa technology. Oulu is characterized for a planar topography. Two experimental trials using the same LP-WAN technology is presented for Centenaro et al. [24]. The first experiment consisted on verifying the connectivity with temperature and humidity sensors located along a building composed of 19 floors, achieving good connectivity. The second experiment consisted in checking the coverage in the Italian city, Padua, with field trials. Using the LP-WAN technology with the UNB modulation, Llaria et al. [25] studied the behavior of a flock on the mountain site sending geolocalized messages. The mountain locations were Prat d’Albis in France and Urola-Erdia in Spain both at an altitude of 900–1600 m and 400–600 m, respectively. Xiong et al. [26] developed an IEEE 802.15.4k prototype, for low energy critical infrastructure monitoring (LECIM) networks, based on software-defined radio (SDR) where they have conducted experiments in an urban environment in China. The experiments consisted of 20 field trial spots distributed in both outdoor and indoor scenarios.
In the next section, we describe how service availability for SIGFOXTM and GSM can be evaluated by decision makers before implementing and IoT or M2M project.
3. Service Availability in SIGFOXTM and GSM
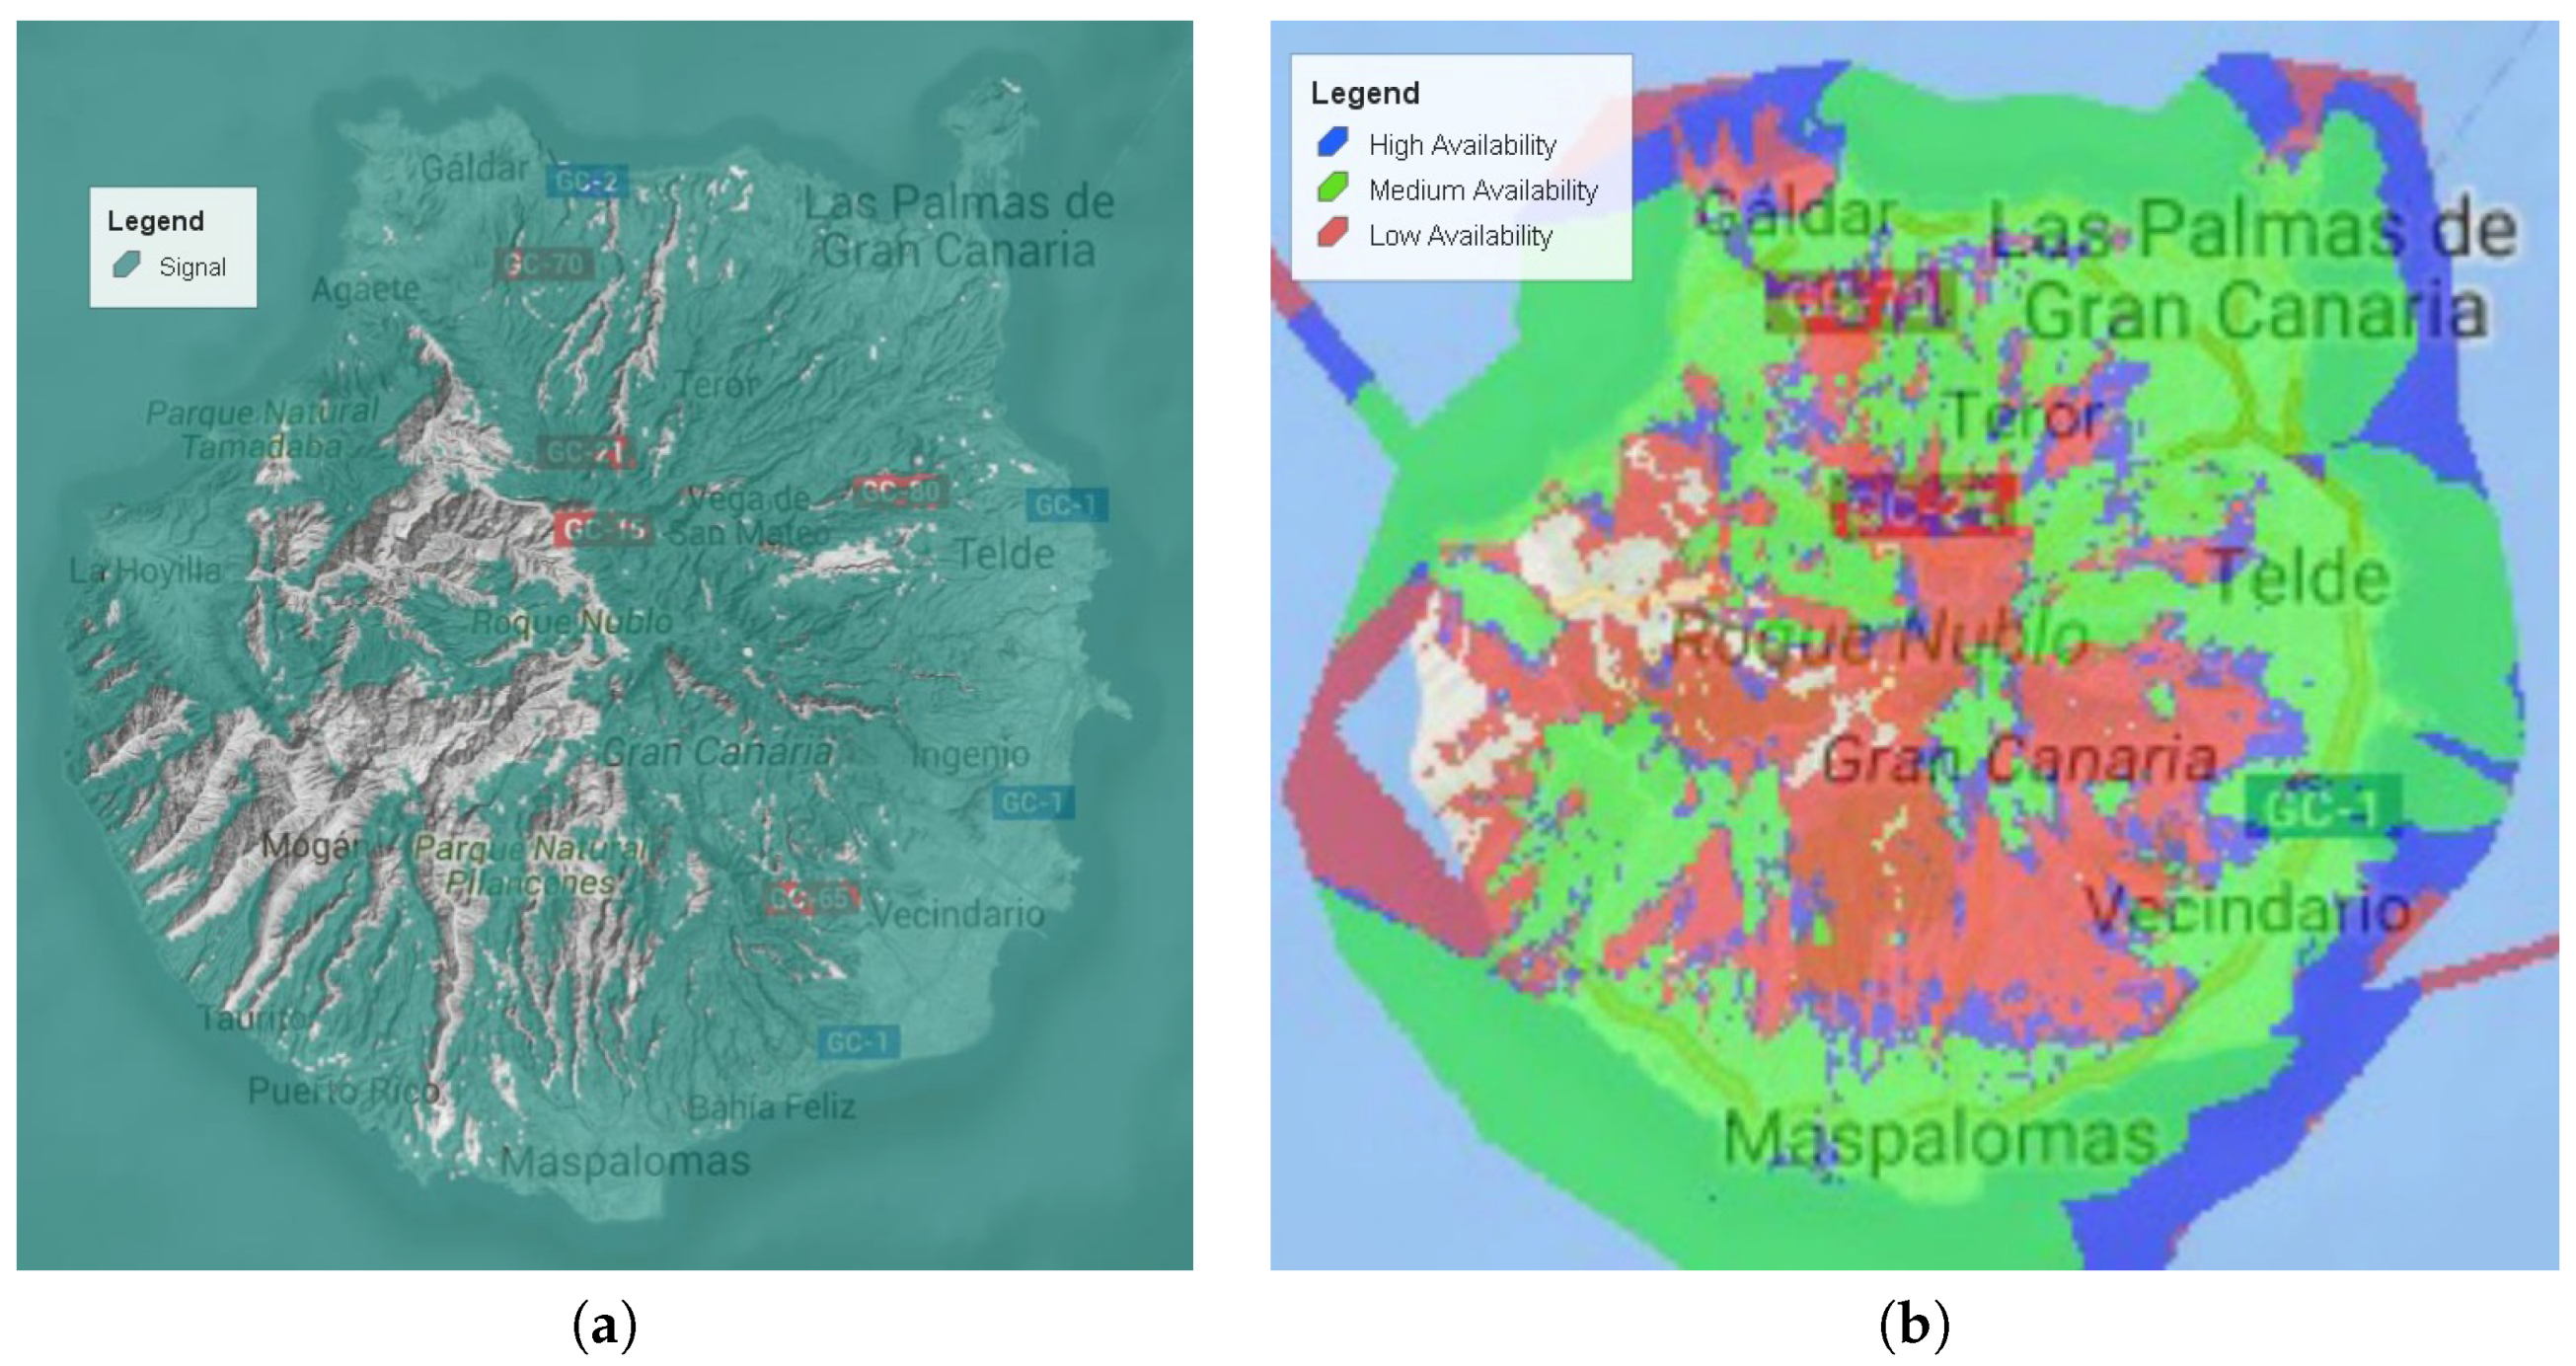
Service coverage is one of the main points to consider when deploying a wireless network infrastructure. Carriers usually provide simulated maps geographically describing service availability. We selected the mobile service providers which own base stations in Spain, accessing to their online 2G coverage map. These mobile service providers are Movistar [27], Vodafone [28], Orange [29] and Yoigo [30]. Figure 1 shows the coverage maps from SIGFOXTM (Figure 1a) and the mobile service provider with the largest extension covered (Figure 1b) in the Gran Canaria Island. We can observe how both SIGFOXTM and the mobile service provider cover a similar extension.
Besides simulated service maps, carriers provide online tools to check whether a given position from a map has service. Nevertheless, these service maps may not be completely accurate since they are simulated from signal transmission models and using the available topographic information. This is especially relevant in areas with complex topographical characteristics. For this reason, different applications allow to easily measure and share [31] actual service signal strength, generating a crowd-sourced map of actual service availability. Table 3 summarizes a list of crowd-sourced maps to check actual service availability.
The crowd-sourced maps from Table 3 are also relevant from a social perspective. Not only they provide actual service maps but fosters competition between operators to provide the best service, especially in those poorly covered areas [34]. SIGFOXTM provides a field test device [39] to check service availability, although with limited functionalities. Hence, no equivalent service to the ones described in Table 3 is available for SIGFOXTM, allowing to collect real measurements which could help project leaders to make informed decisions on selecting an IoT infrastructure in a given area.
In the remainder of this paper, we present ITHACA, a signal analyzer prototype to provide automated signal coverage maps and analytics for SIGFOXTM, although it could be adapted to any LP-WAN technology.
4. Proposed LP-WAN Signal Receiver Prototype
This section introduces the design, development, and configuration of our LP-WAN signal analyzer prototype, ITHACA.
4.1. ITHACA Prototype’s Architecture
Figure 2 represents our prototype composed of a hardware part (ITHACA-device), a server to receive the data from all the base stations (ITHACA-server) and a software tool (ITHACA-tool) which will be described in Section 4.2, Section 4.3, Section 4.4, respectively. Although compatible with other LP-WAN technologies, our prototype has been built to work with the SIGFOXTM technology, a highly used proprietary development of LP-WAN. From now on, we will refer to SIGFOXTM and LP-WAN indistinctly.
The procedure of obtaining the quality of signal’s measurement is the following:
- To geolocalize the ITHACA-device position for measuring thanks to the Global Positioning System (GPS) information. This information is included in the message to be received by the LP-WAN network, SIGFOXTM base stations.
- To transmit a message from the ITHACA-device to the LP-WAN network including the transmission ID, transmission power and the GPS position (measured in Step 1). The message has a length of 11 bytes (cf. Section 4.4). Besides transmitting the message to the LP-WAN network, it is stored in the internal memory from the ITHACA-device for further analysis with the ITHACA-tool. This is useful to identify unsuccessful transmissions, where no base stations received the message.
- To receive the message at one or more base stations from the LP-WAN network if their coverage area covers the position where the ITHACA-device is located when transmitting the message. In case the message is received by at least one base station, it will insert the information about the received message such as Received Signal Strength Indicator (RSSI), Signal to Noise Ratio (SNR) and timestamp. Each base station which received successfully the message will forward it at the SIGFOXTM backend (provider servers).
- To transmit the reports from the SIGFOXTM backend, previously received by all the base stations, to the ITHACA-server for further analysis. Message dump is performed from the SIGFOXTM backend to the ITHACA-server using the SIGFOXTM function called the callback. This function is configured at the SIGFOXTM backend directly. Once, the messages are stored at the ITHACA-server, these messages are saved in a file for a further analysis at the ITHACA-tool.
- To download the transmission log with the geolocation information from the ITHACA-device to the ITHACA-tool through a data cable. This transmission log contains all the transmitted messages to the LP-WAN network from the ITHACA-device during the whole field trial campaign and was stored at the ITHACA-device.
- To download the statistics information of the messages received from all the base stations to the ITHACA-tool using the import functionality while connected to the Internet.
- To process data by comparing the received data from the LP-WAN network and the transmitted data from the ITHACA-device, showing the results in a map at the ITHACA-tool. The different functions performed in this step are:
- (a)
- To check if transmitted messages from the ITHACA-device, and stored in the internal memory, were not received at the ITHACA-server. In that case, those unsuccessfully received messages are marked on the map as no signal point. This procedure is performed by matching the transmission identifiers between those messages imported from the ITHACA-device and those messages received to the LP-WAN network and later downloaded at the ITHACA-server.
- (b)
- To check for each received message by the LP-WAN network, how many base stations received this message. Basically, the system counts how many times a given transmission identifier appears within the imported file of the ITHACA-server. Thus, depending on the number of base stations which received the message, the measured mark at the map will be displayed with a different color: Green (three or more base stations), yellow (two base stations) and red (one base station). This information about the base station redundancy from a given position is important to measure the IoT service quality at that point.
- (c)
- To offer statistics such as maximum/minimum SNR and RSSI indicator, from each given message received at a group of base stations. These statistics are computed thanks to SIGFOXTM since they allow the configuration, at their backend, to receive a given message to more than one base station instead of only the first base station which received the message.
4.2. ITHACA-Device
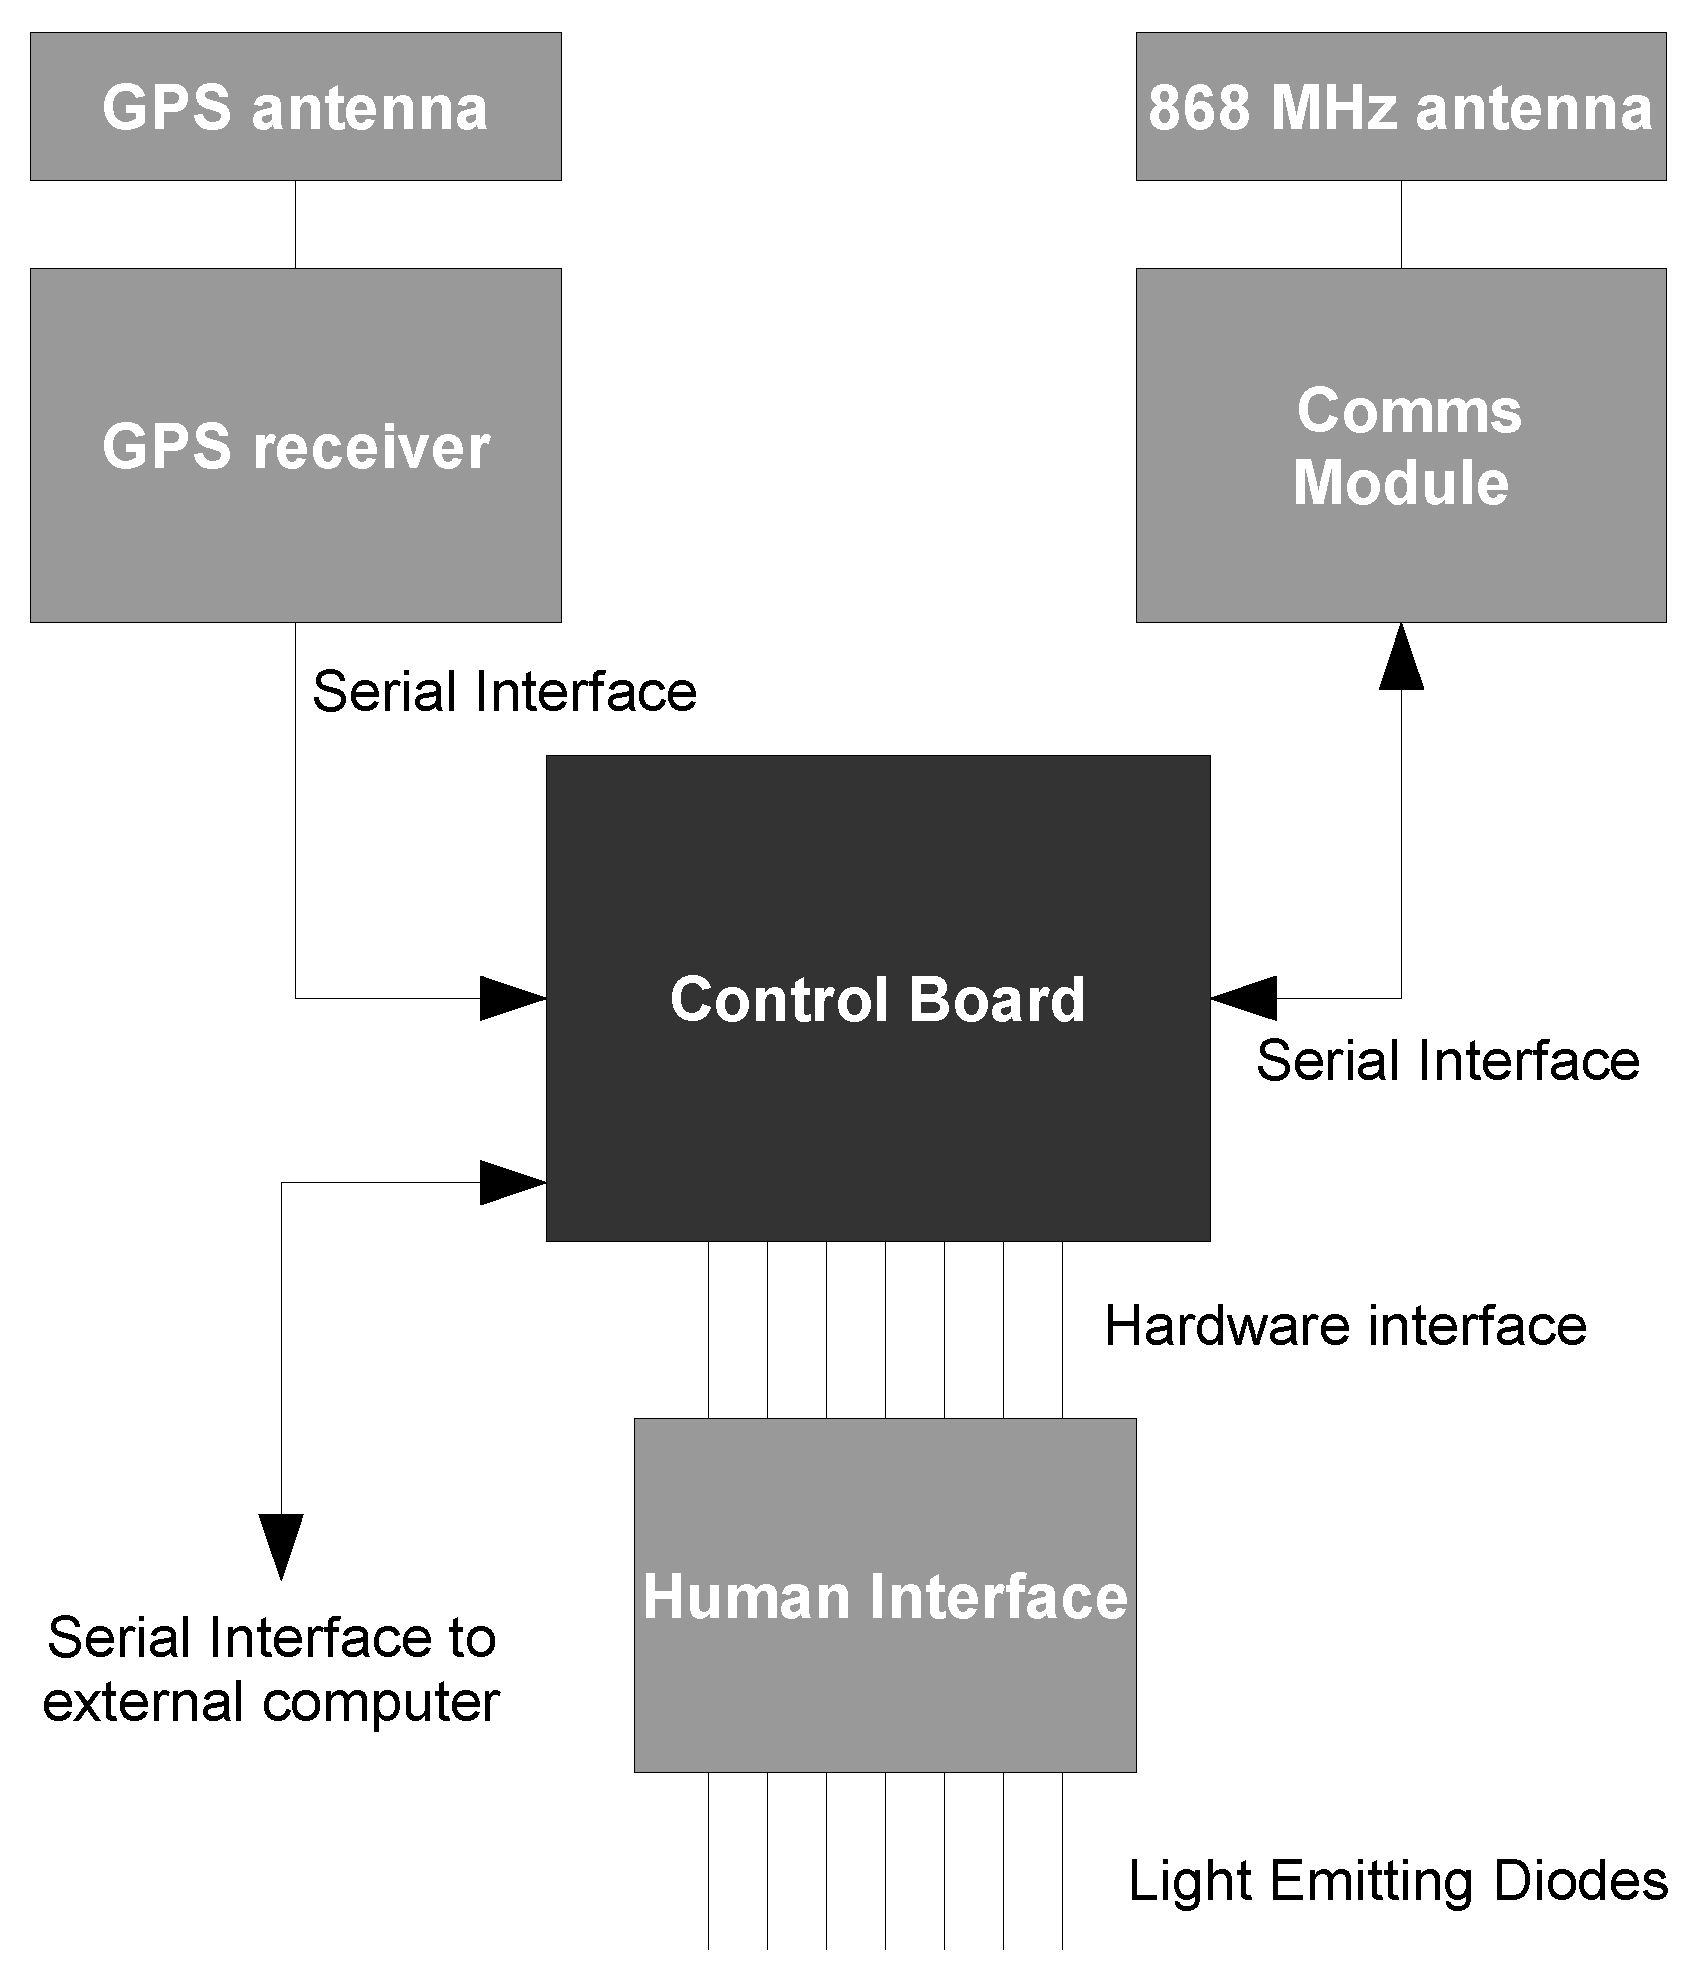
Figure 3 shows the ITHACA-device scheme where the interconnection among elements is presented with solid arrows. The main element is a control board capable of integrating other communication boards to achieve an embedded device. Arduino UNO [40] was chosen as control board because of its open-source implementation capability and efficiency of managing different hardware elements (i.e., activate only the LP-WAN communication and GPS receiver). Thus, both the GPS receiver and LP-WAN communication module are connected to the control board. In order to manually control the device, a keyboard was assembled with buttons and Light Emitting Diodes (LEDs) indicating the status of the device. The information about all the transmissions both successful or not successful is collected by executing a callback request to the LP-WAN provider server backend. Note that SIGFOXTM requires a subscription to collect that information.
Figure 4 represents the procedure of the prototype’s development. The Figure 4a shows all the hardware elements which the ITHACA-device is composed of. The assembly procedure of all the hardware elements on the PCB board is represented in Figure 4b. The Figure 4c displays the assembly between the PCB board (with the communication and control modules), a communication board to transfer the data from the PCB board to the Arduino and, the control board. Finally, the Figure 4d represents the ITHACA-device located inside a plastic shield to protect the hardware elements.
As shown in Figure 4, our ITHACA-prototype is composed of state-of-the-art hardware components. That fact allows an easy integration of communication modules provided by other LP-WAN providers or from other technologies such as LoRaWAN and NB-IoT. In addition, the firmware from our prototype can be modified to include the required configuration to work with the desired LP-WAN technology such as data rate and encryption.
4.3. ITHACA-Server
The ITHACA-server is in charge of receiving and keeping all messages received from the IoT service provider of the LP-WAN technology, SIGFOXTM. In a standard procedure, a subscriber of the IoT service can check the reception’s status of the transmitted message to the LP-WAN networkby accessing to the operator’s back-end. The report of information is collected from all the base stations of the LP-WAN network which received the message from the ITHACA-device. The ITHACA-server collects the information from the received messages automatically without accessing the operator’s back-end manually. The ITHACA-server is composed of an Apache HTTP server which executes a PHP code storing the messages received by the SIGFOXTM server. In terms of its performance, considering that the number of devices sending data could be very high, the ISM band regulation limits the channel to 1% of its capacity, allowing the transmission of one message each 10 min. Hence, the server load will be very low. Besides the ISM band regulation, our ITHACA-server executes, only when a new message is received at the SIGFOXTM backend, a simple PHP script which stores the received message to a text file. In addition, the server limitation to handle a high number of requests to execute the script is uniquely determined for its hardware characteristics, CPU and RAM, and its configuration. However, in a large scale implementation where hundreds of ITHACA-device are performing field trials, the text file will be substituted for a database storage system such as MySQL. About the integration of other technologies, the user should check the provider compatibility using the callback functionality. In case the provider does not use the callback function to process the received messages from their servers, we can use their API methods.
4.4. ITHACA-Tool
Once the information from the ITHACA-device and the LP-WAN network is collected, we need a tool to process and represent the results. The main function of the ITHACA-tool is displaying on a map our field trials performed with the ITHACA-device. The ITHACA tool has been developed with QT [41], a C++ framework under a GPL license. Figure 5 represents the ITHACA-tool’s scheme composed of different interconnected modules. The task of each module is as follows:
- Import-Device: Imports the data stored in the ITHACA-device. Its main function is to convert the original raw-data to a standard JSON format. In addition, this module allows to manage and handle the imported files.
- Import-Server: Imports the data stored in the ITHACA-server. Its main function is to convert the original raw-data to a standard JSON format. In addition, this module allows to manage and handle the imported files.
- Process-Data: Processes the data and obtains an output file in GeoJSON format. The input data is composed of the JSON format data from the ITHACA-device and ITHACA-server to obtain the geolocalization information and IoT service statistics, respectively.
- Display-Map: Displays the measured points along the field trials into a map. Each point is located in a given position thanks to the GPS coordinates and, by clicking on it, a pop-up window with the IoT service statistics is shown.
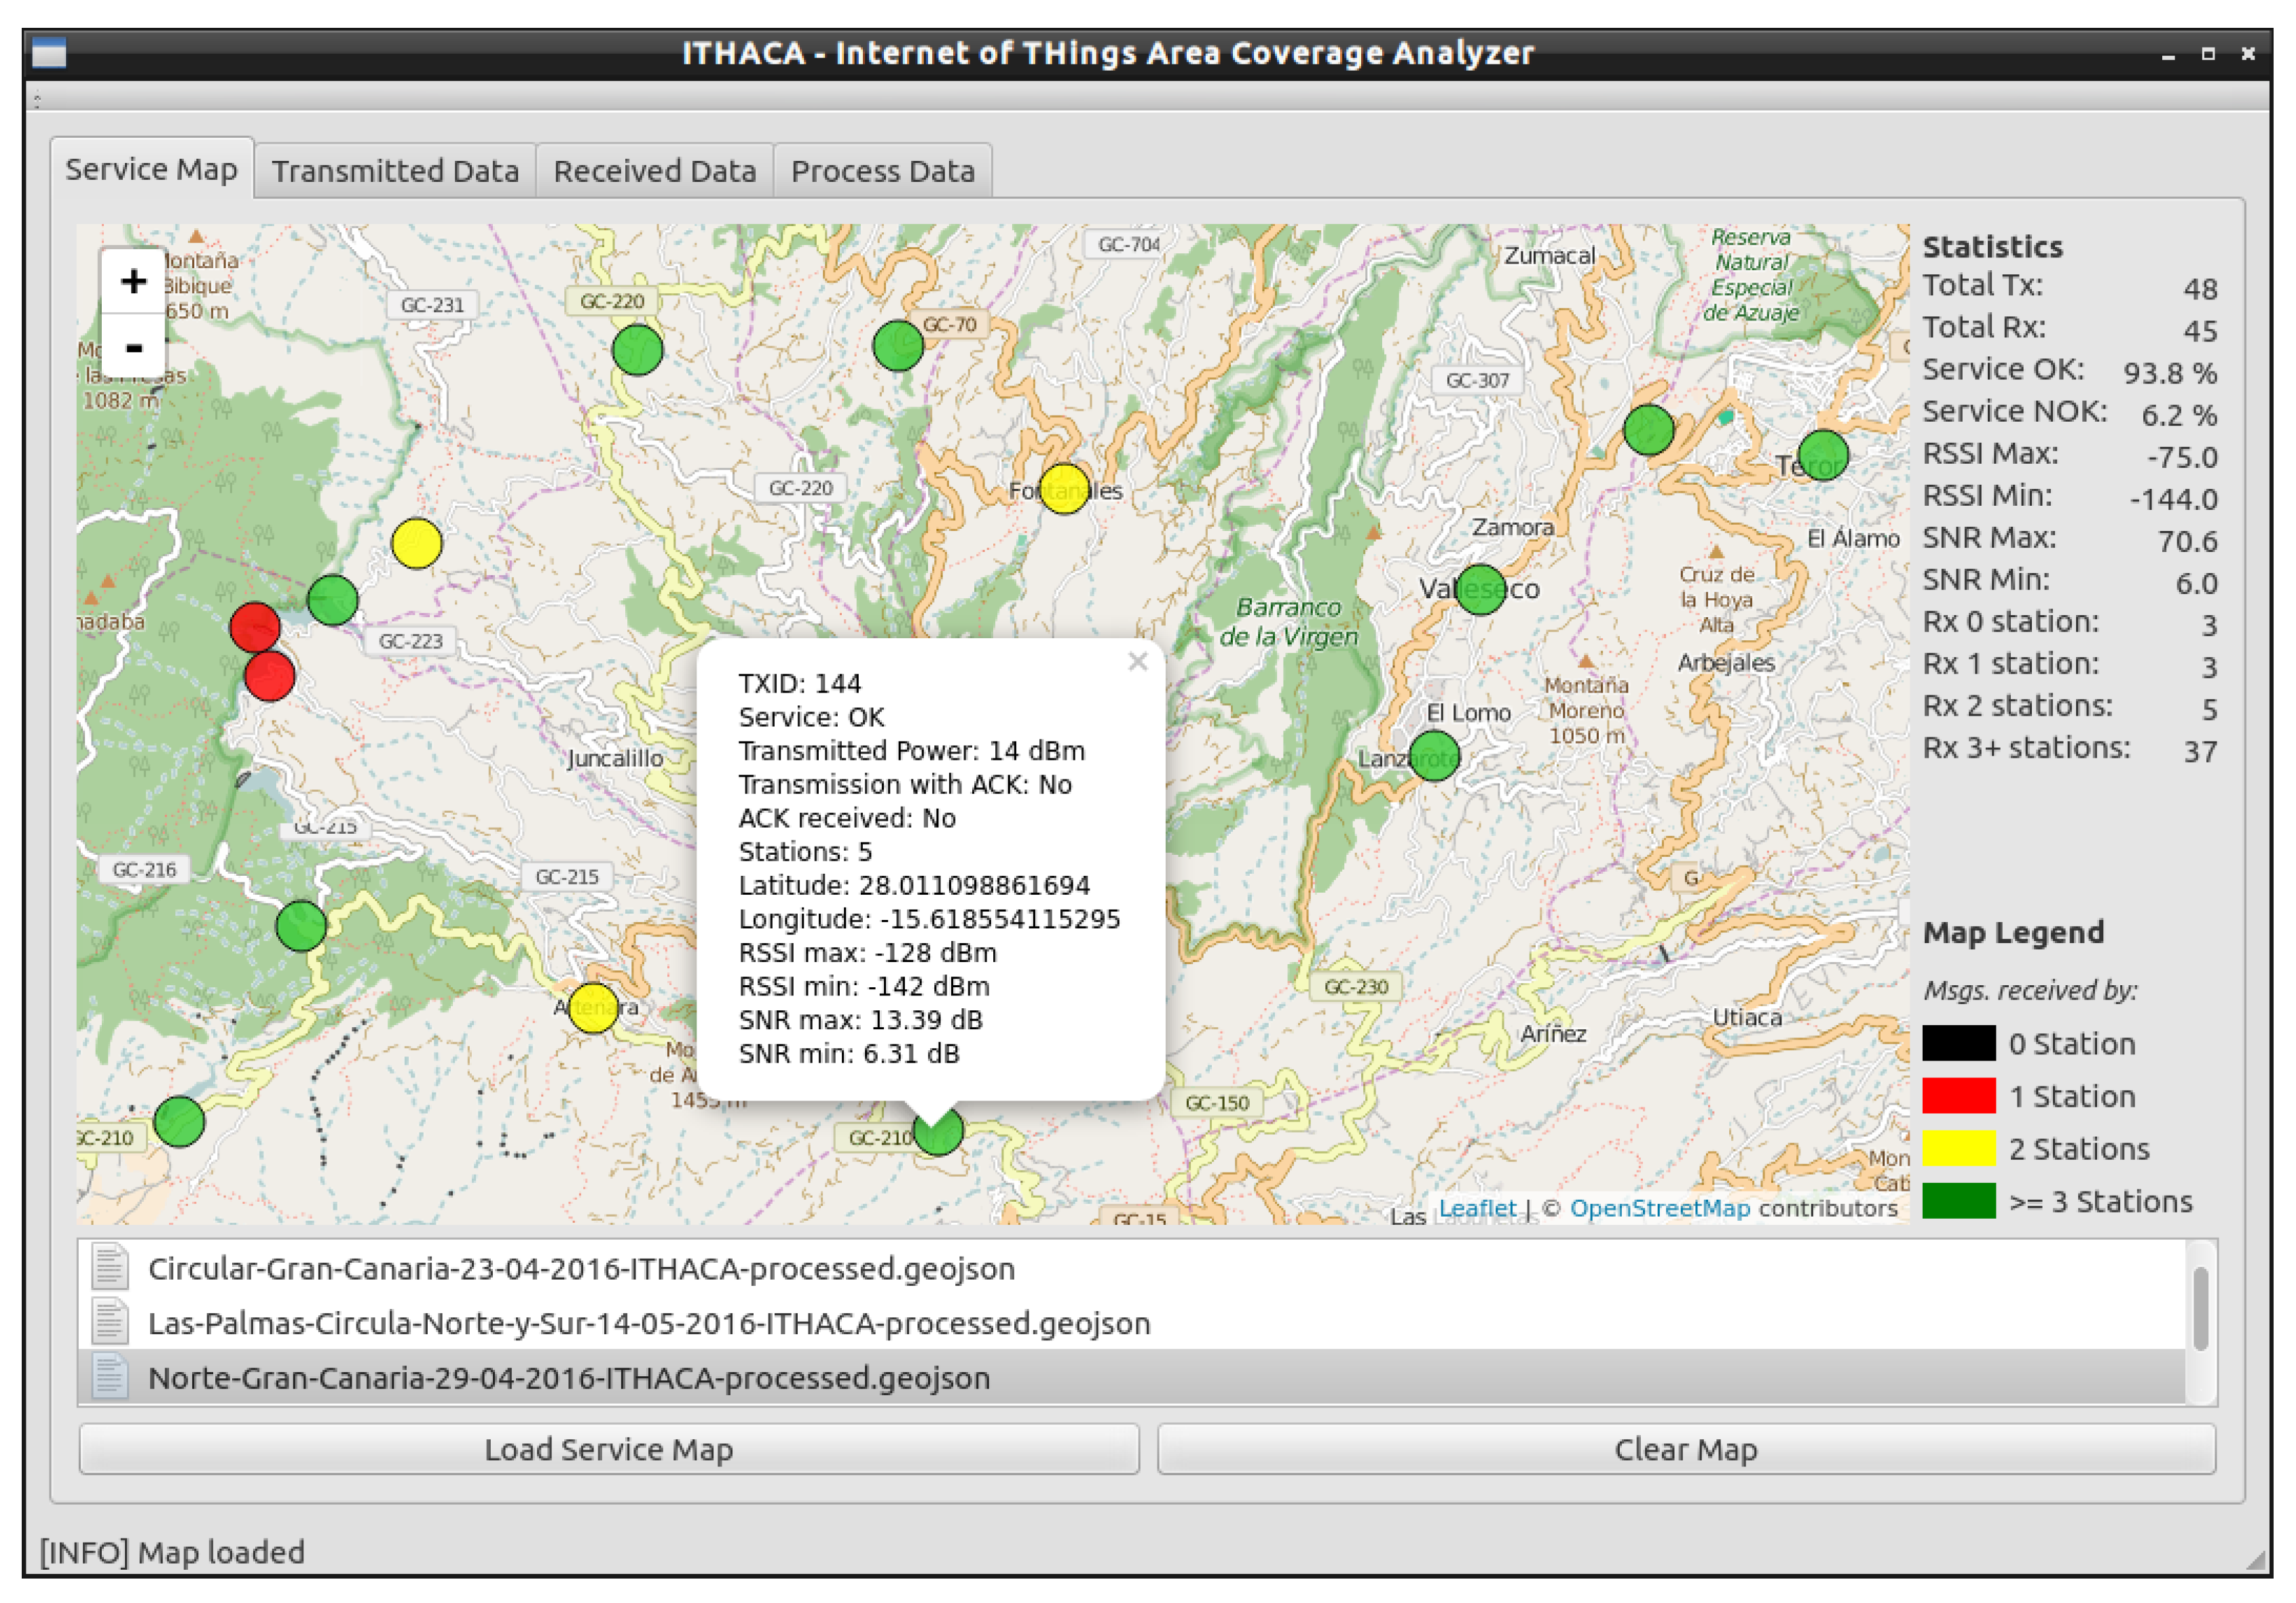
Figure 6 shows the ITHACA-tool environment. The Figure 6a is the Service-Map tab which displays on a map the measured positions along the field trials from a given GeoJSON file. On the right part of the window, the statistics are shown indicating a number of measured points, minimum and maximum signal power and further information. The Figure 6b presents the Transmitted Data tab where the user can import the information sent by the ITHACA-device through a serial port. The stored information in the ITHACA-server can be imported using the Received Data tab (cf. Figure 6c). Once the data from the ITHACA-device and ITHACA-server is imported, the information can be visualized in the Process Data tab (shown in Figure 6d). The Process Data tab is used to select the files generated from the ITHACA-device and the ITHACA-server, and process them by matching the data according to the transmission identifier to confirm the reception of the messages from the ITHACA-device. Moreover, it calculates the statistics such as the number of base stations, maximum RSSI, and maximum SNR. Finally, the Process Data tab generates a GeoJSON file with the results.
Note that the software which ITHACA-tool is composed of can be easily modified to obtain the messages from other providers’ network. We could check the statistics of successful and unsuccessful transmissions, however, other statistics such as base station redundancy, RSSI and SNR will depend on the providers’ network capabilities.
4.5. ITHACA Messages Format
Our ITHACA prototype manages different message formats, to be displayed on a map by converting information such as geolocation and timestamp in a proper format.
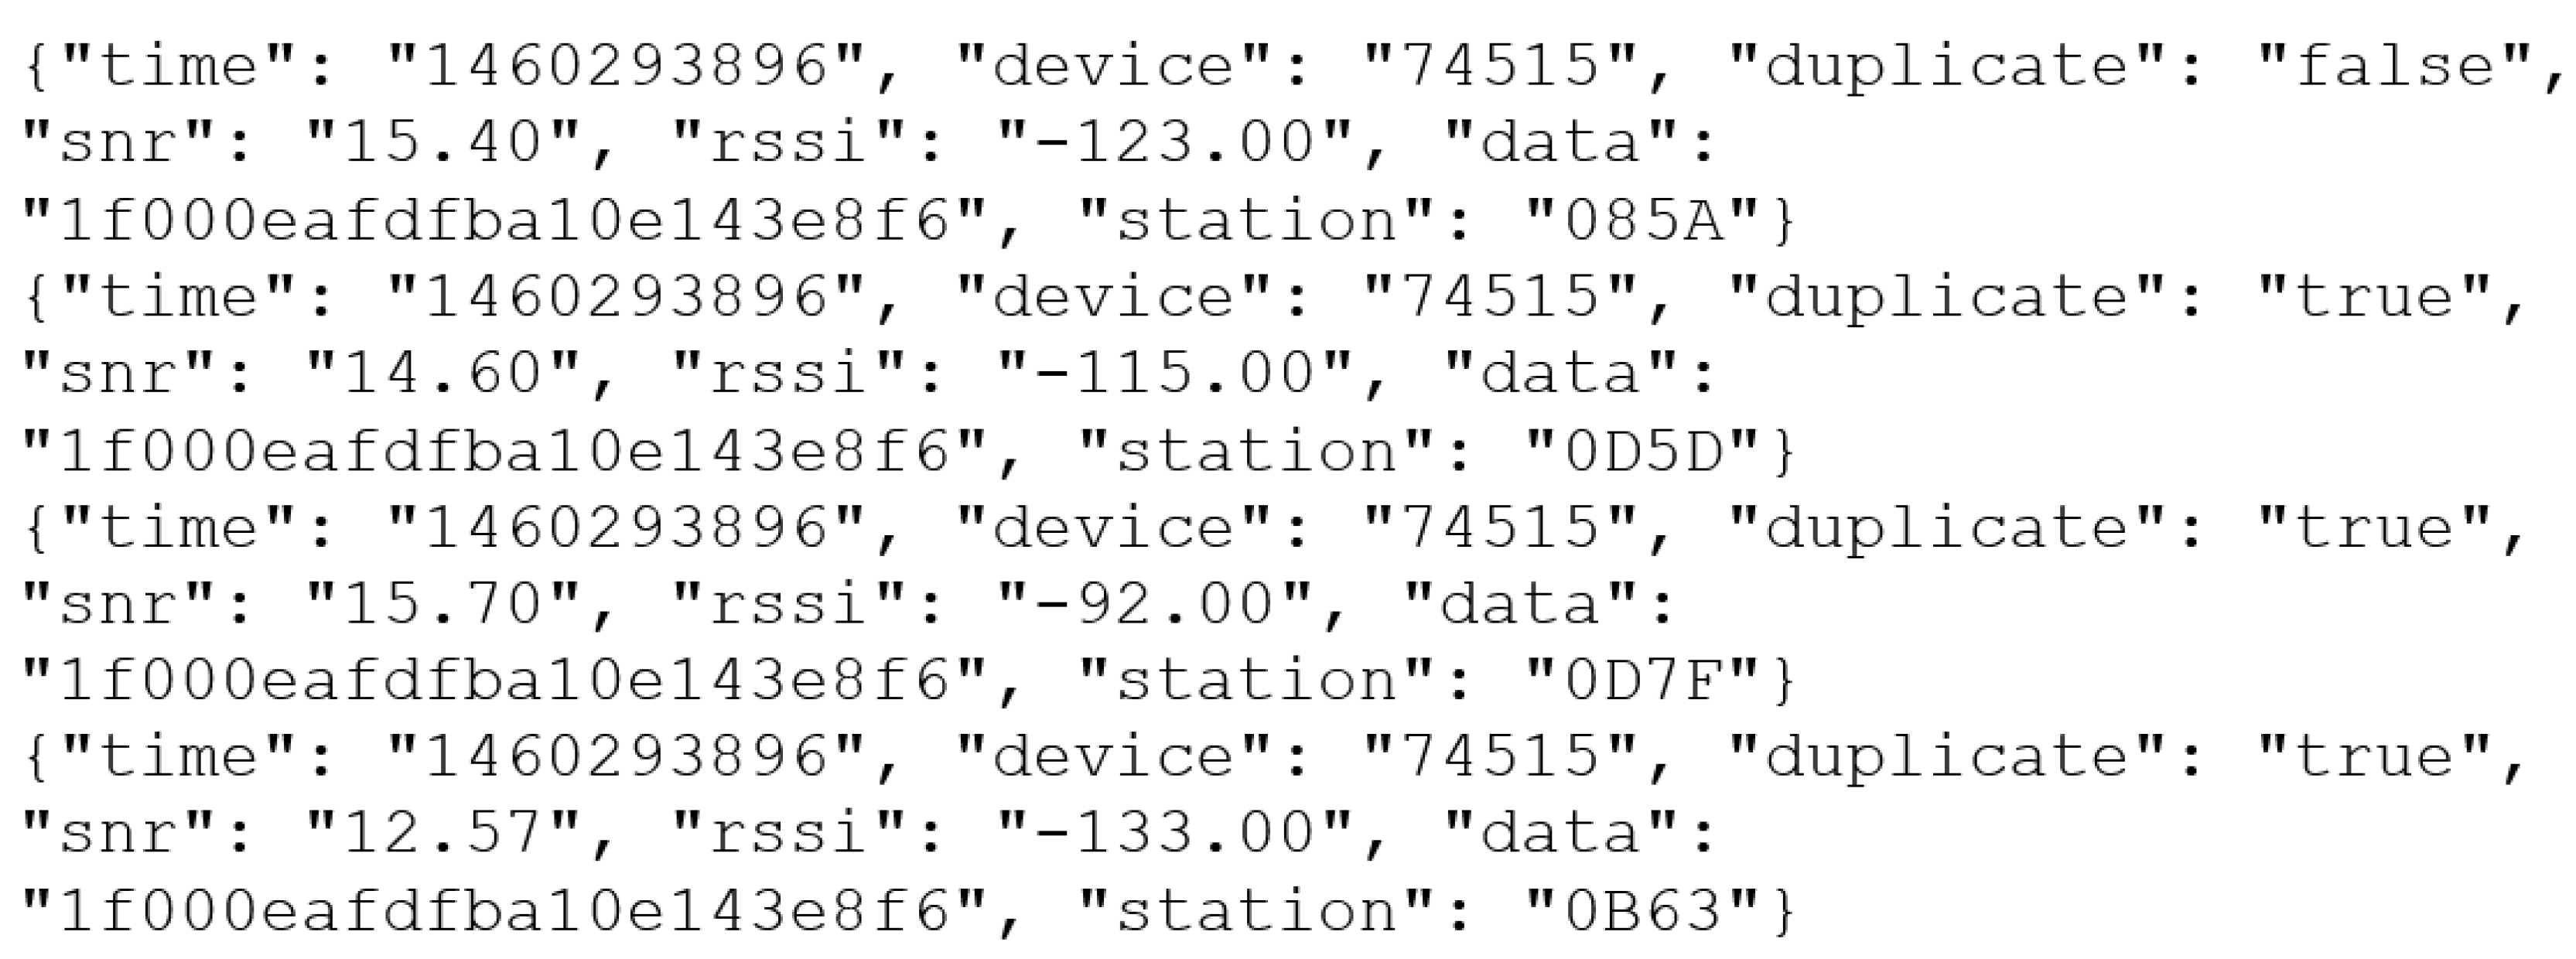
Figure 7 contains a sample of the raw data received from the base stations. Our system processes that information to convert it into a standard format. For instance, the “timestamp” field is expressed as Unix time. The field “device” identifies the ITHACA-prototype to the SIGFOXTM system. If the requested message has been sent for the first time to the SIGFOXTM server is indicated as false in the “device” field. Otherwise, it is indicated with true value. The quality how the message was received is shown in both the “snr” and the “rssi” fields expressed in dB and dBm, respectively. The “data” field allocates the message sent by the ITHACA-device which is explained below. Finally, the “station” field contains the base station identifier which has received the requested message from the ITHACA-device.
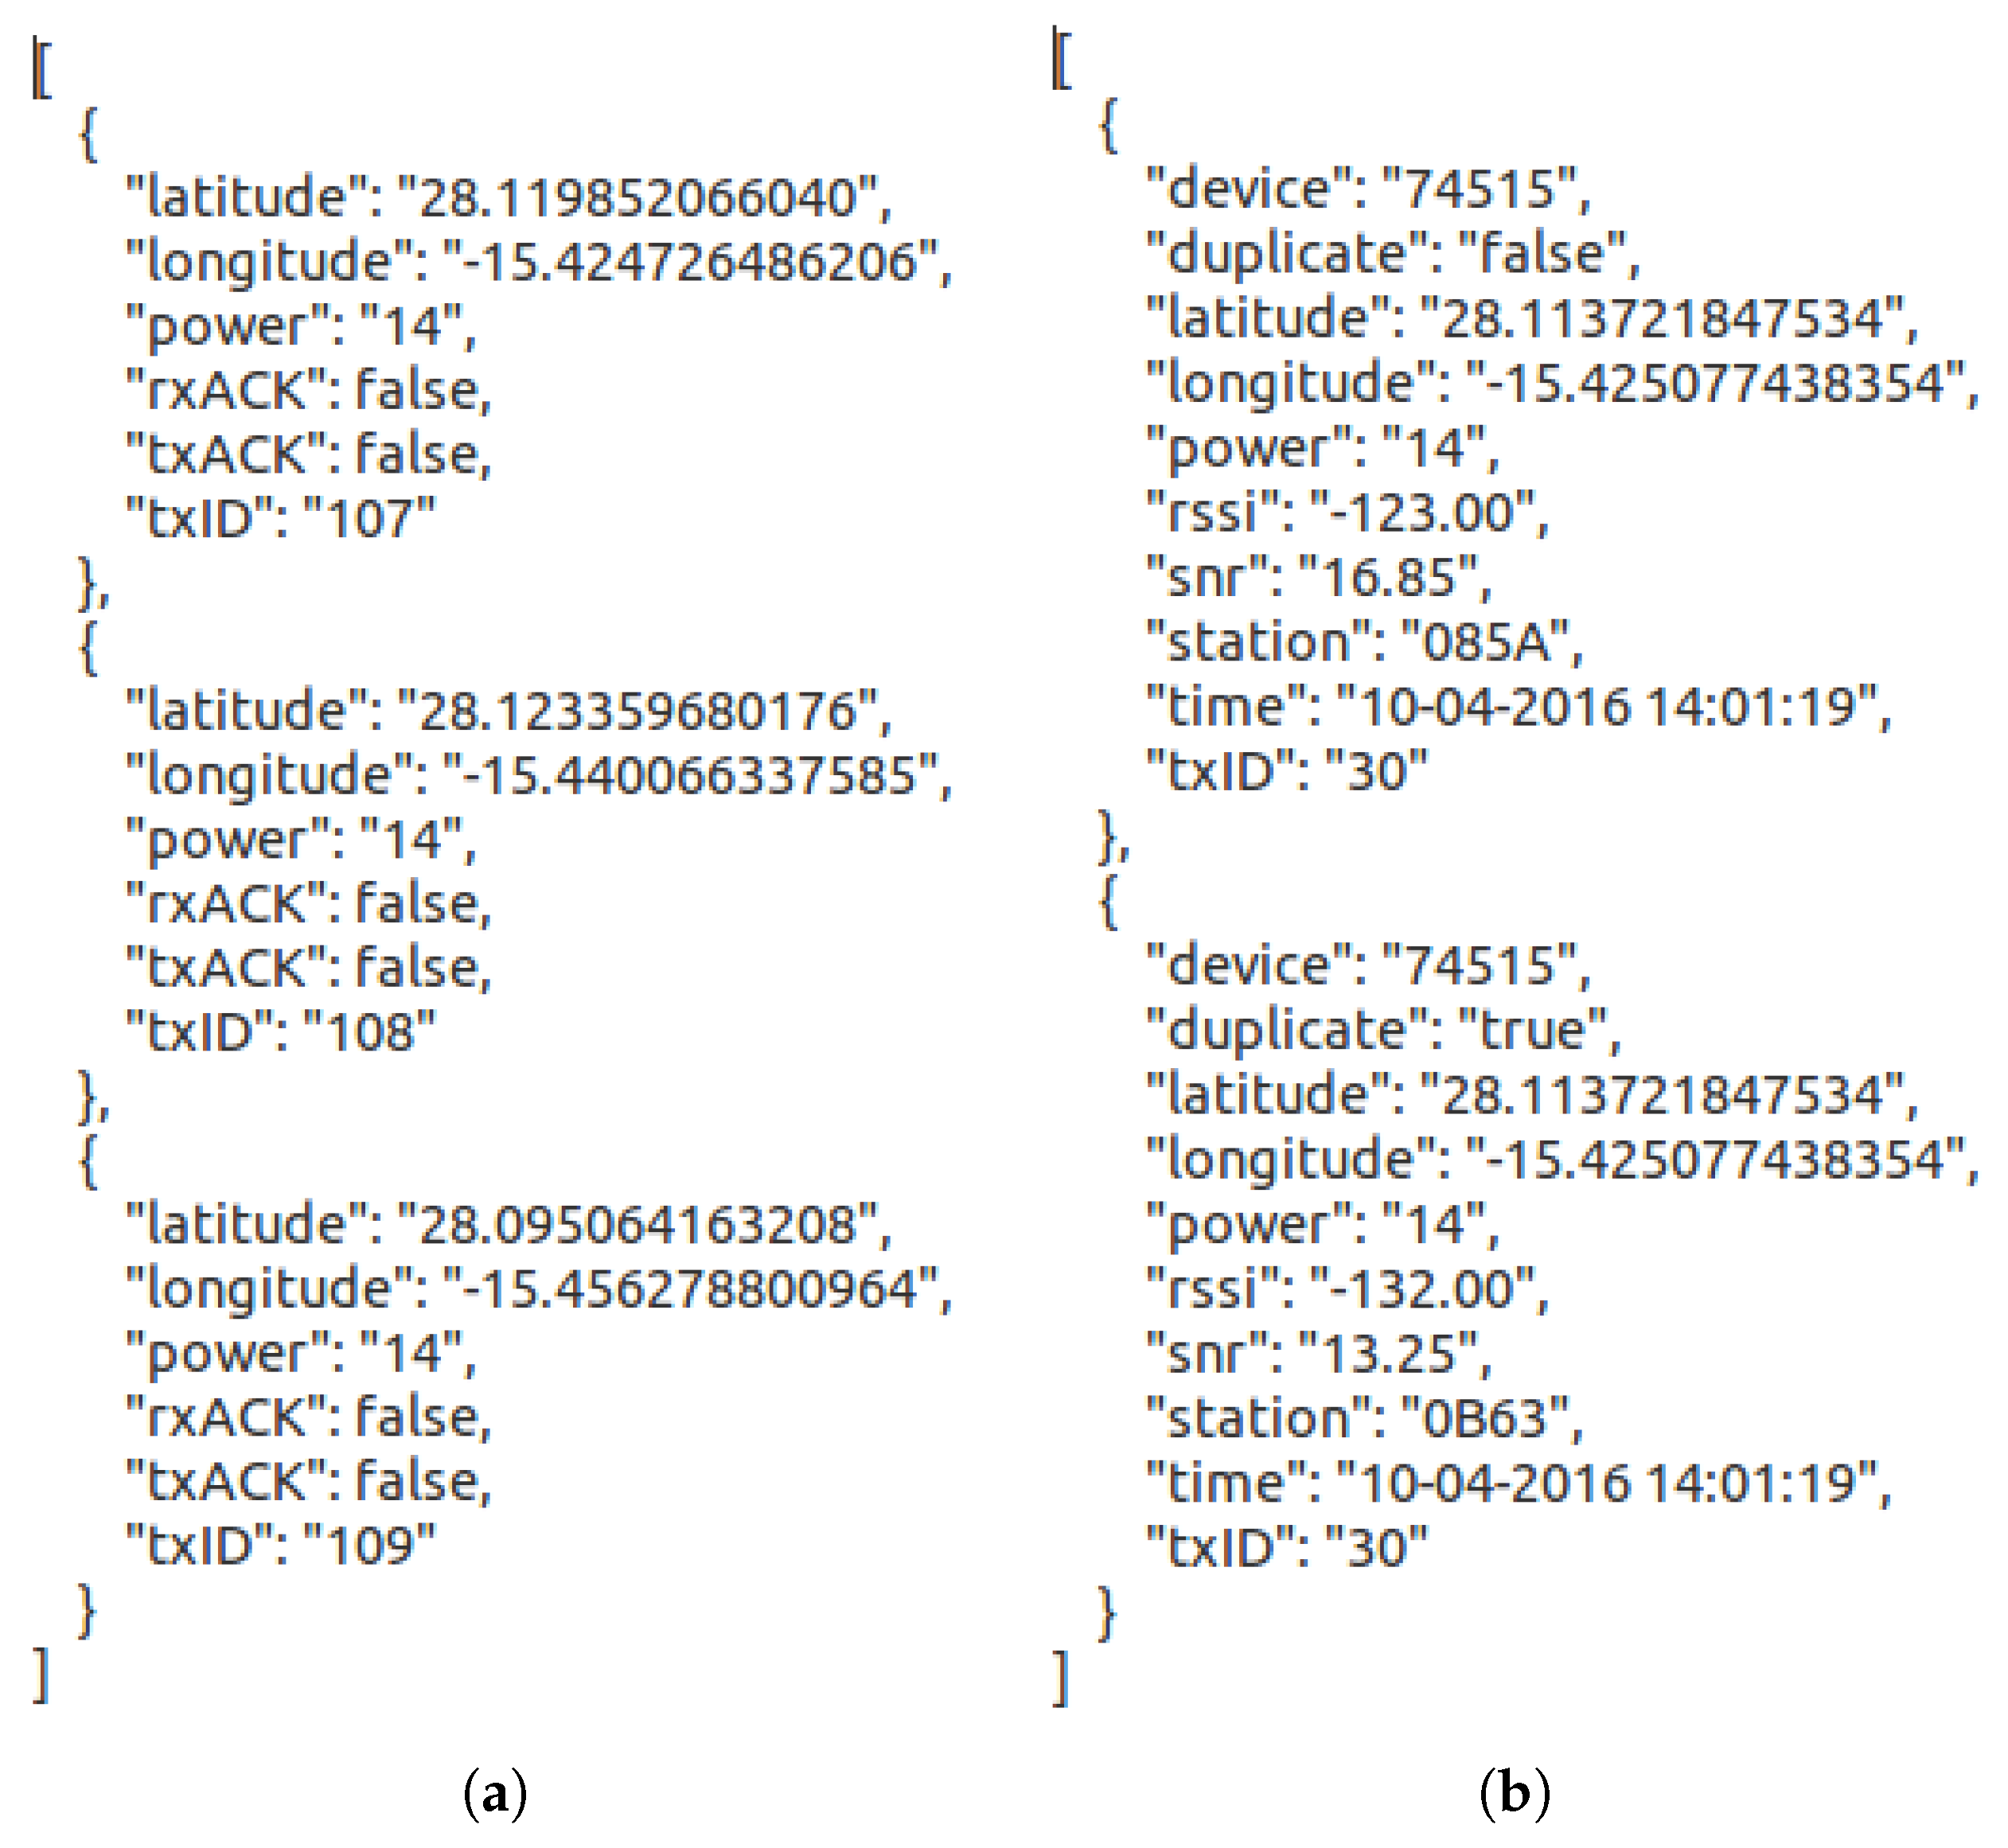
Figure 8a,b show two JSON messages imported from the ITHACA-device and the ITHACA-server, respectively. The message format imported from the ITHACA-device (a) has a length of 11 bytes, being 12 bytes the maximum allowed by the service provider. No specific format for those 12 bytes is required. Thus, in this case, our JSON message format is composed of a transmission identification number (TxID), where we used 2 bytes to allocate 65,536 different IDs, being enough for our field trial campaign. The message field “power” represents the transmitted power configured to send the request. Since the transmission power goes from 0 to 14 dBm, we need only 4 bits to accommodate the “power” value. The field “rxACK” and “txACK” are set as false since this feature is not considered in this paper. Finally, both the “latitude” and “longitude” field have 4 bytes to insert the geographical latitude and longitude position from where the message was transmitted. Note that both the latitude and longitude values are the units that represent the geographic coordinates and are measured in degrees. The JSON message format imported from the ITHACA-server (b) is collected from the SIGFOXTM server composed of different fields. The “device” field identifies the subscribed user to the SIGFOXTM system. Since the transmitted message could be received in more than one base station, the “duplicate” field indicates if the same message has been received by only one base station as false or by more than one base station as true. The “rssi” field shows the RSSI indicator in dBm, the “snr” field presents the SNR value in dB, the “station” field indicates the base station ID configured by the service provider and “time” field is the message reception timestamp by the base station. The fields “latitude”, “longitude”, “power” and “txID” are the same as explained for Figure 8a.
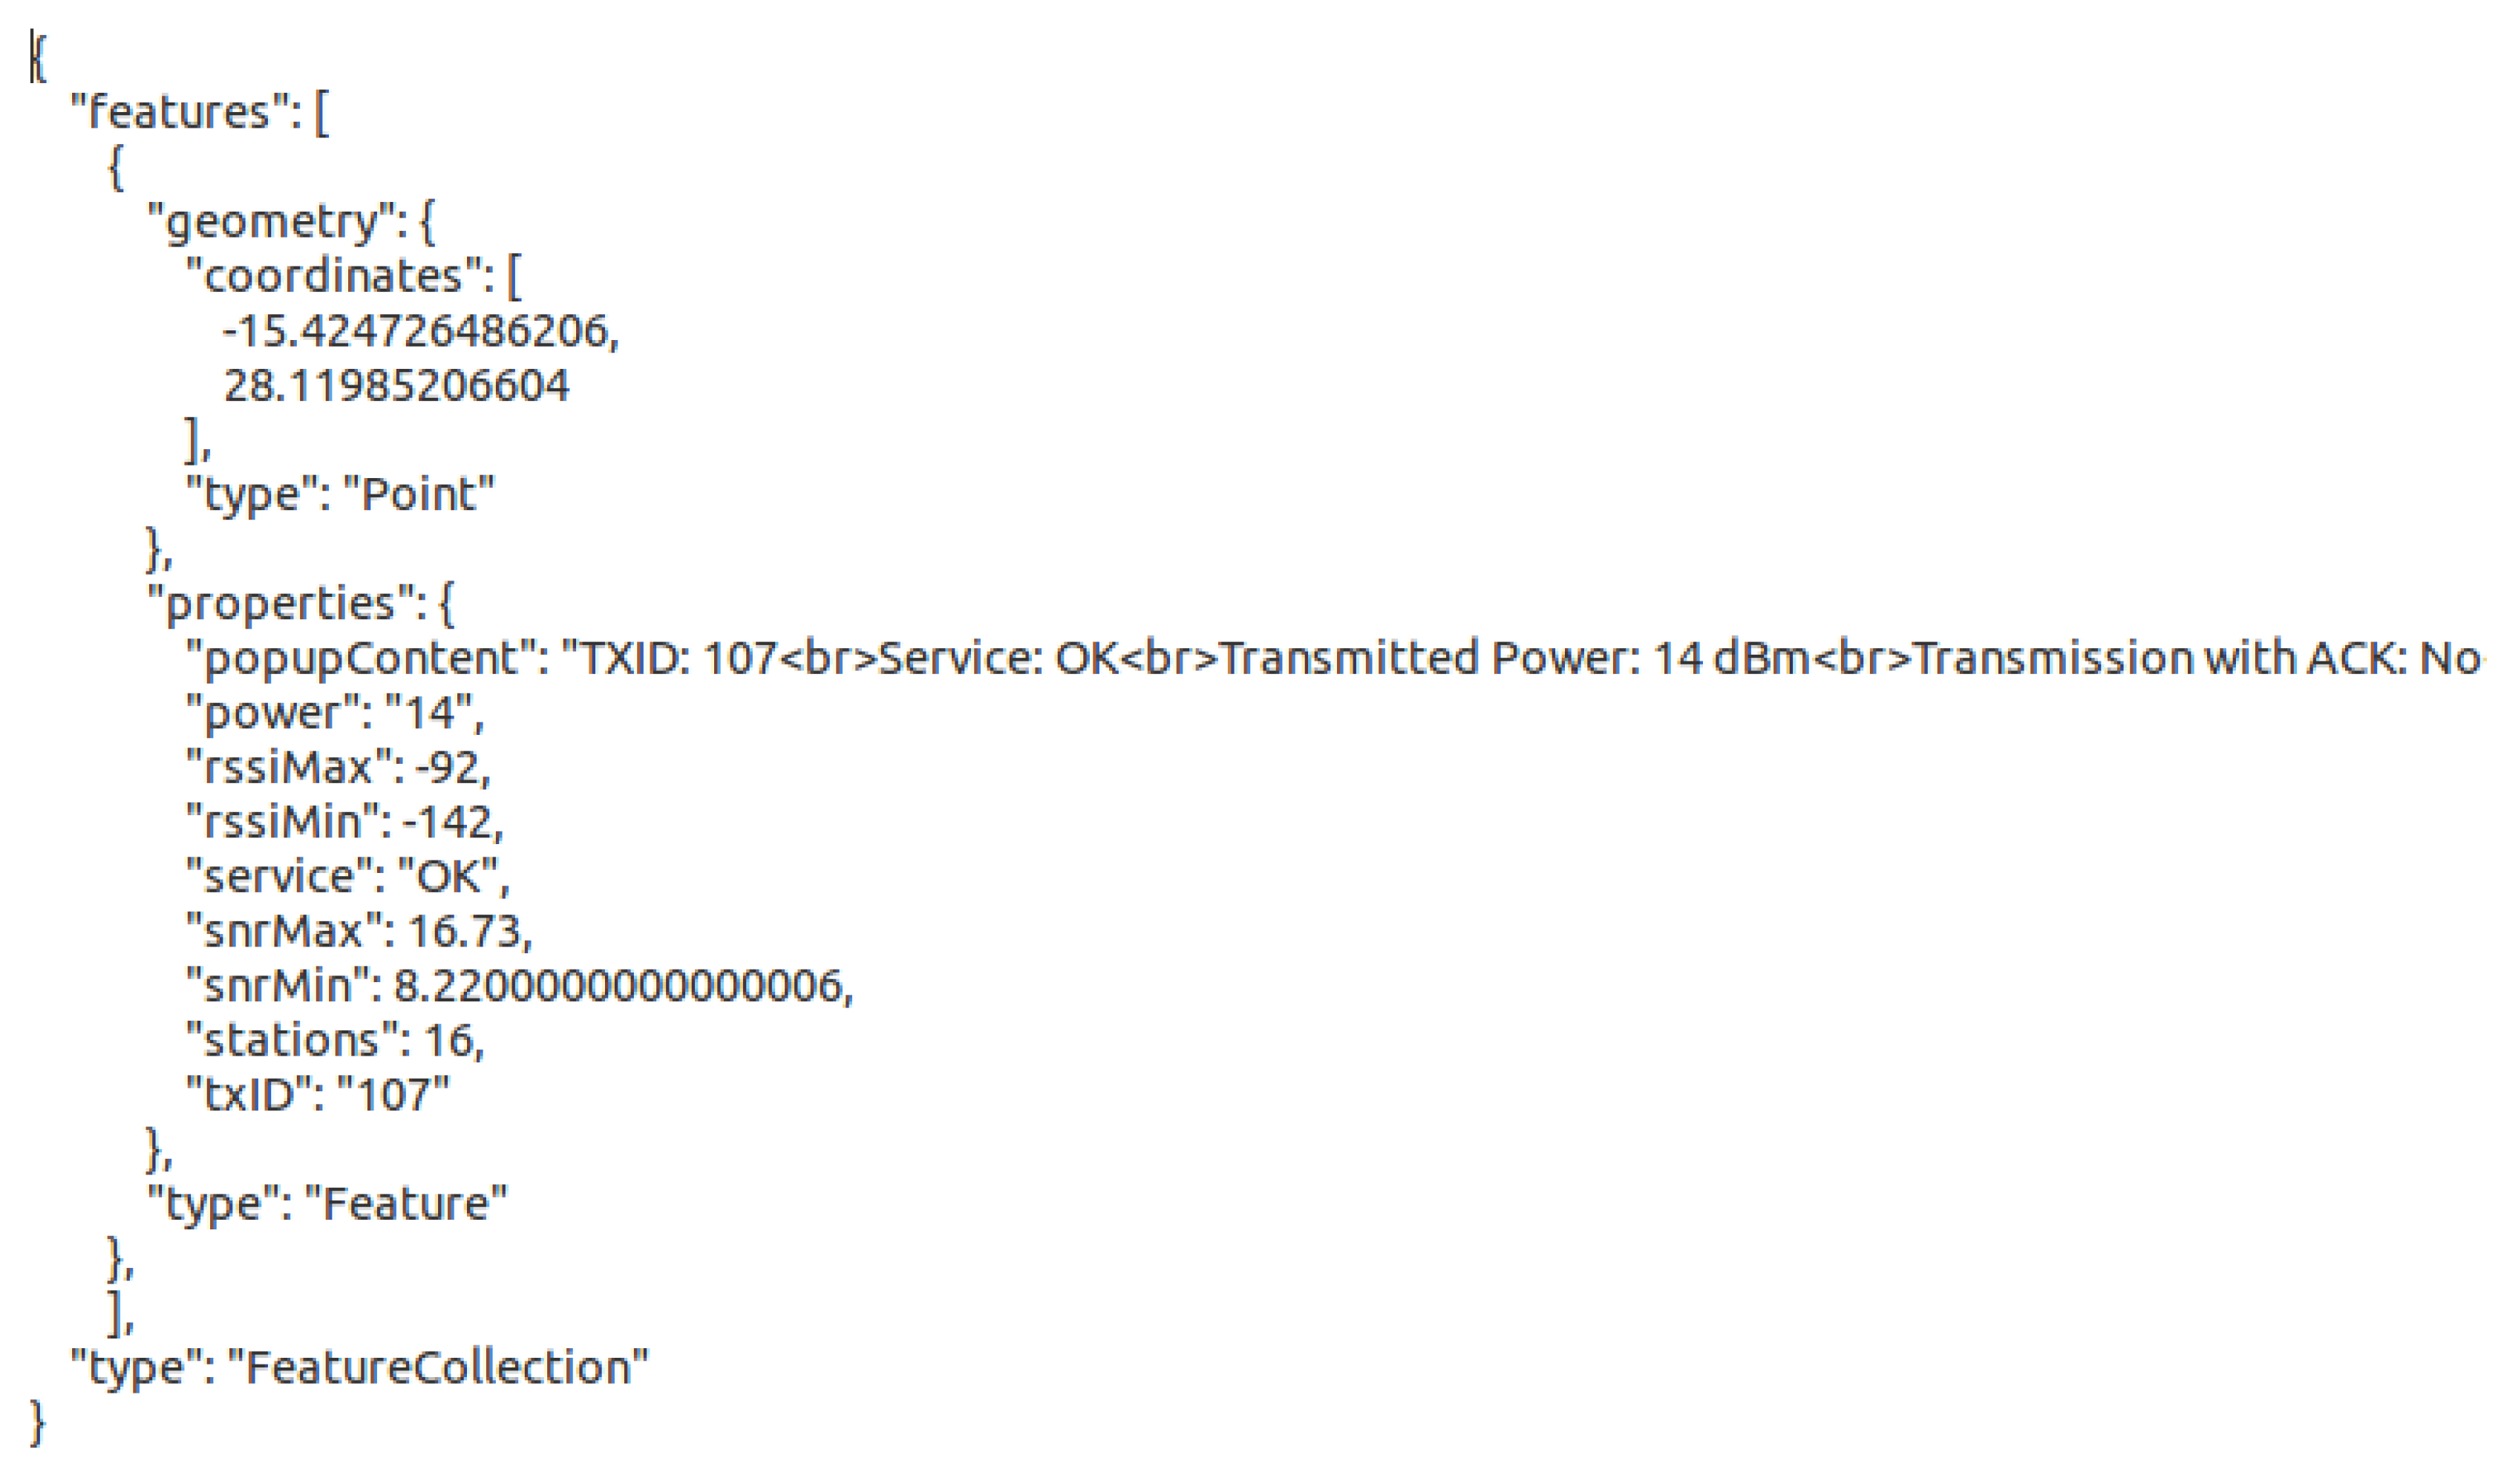
Figure 9 shows a GeoJSON message format processed through the combination of JSON messages from all the base stations which received the request. Note that this message contains useful fields for further analysis such as “rssiMax”, “rssiMin”, “snrMax” and “snrMin”. More important, the “stations” field provides the number of base stations which successfully received the request from the device, indicating the service quality at that geographical position. The “popupContent” field stores the information to be displayed on the map in the ITHACA-tool.
4.6. ITHACA Improvements
Although SIGFOXTM owns the field test device ADEUNIS [39] (cf. Section 3), it has not been designed to provide accurate service information on a map. However, ITHACA is a low-cost device based on an Arduino UNO microcontroller, XBee Shield, GPS (GY-GPS6MV2) and SIGFOX (TD1207) communication modules. Moreover, ITHACA allows collecting environmental data such as pollution level, temperature, and humidity for future M2M applications. Since our prototype allows the attachment of additional elements, modules from other LP-WAN providers can be connected. Table 4 compares different functionalities between the off-the-shelf and our proposed field test device.
Hence, our contribution in respect to related work is the design and implementation of a low-cost field test device which allows the attachment of additional elements for a complete study of the environment. In addition, our ITHACA prototype allows the configuration of the transmission power and detachable antenna to test the device with different antennas. In order to validate our tool, we will perform field trials in urban and rural environments in a complex topographical scenario.
5. Methodology and Experiments
To demonstrate the need for on-site coverage analysis in IoT, we designed and executed a set of field trials. We selected an area with complex topography as worst case scenario. Specifically, the field tests were performed in Gran Canaria, a Spanish island off the African coast, of volcanic origin. The island is 1560 square kilometers, with a maximum altitude of 1949 m. The island had a population of 845,195 inhabitants and density of 543.45 inhabitants per square kilometer in 2016. The rural environment is considered as the area where population lives in isolated houses in the field, or with less than 2000 inhabitants. On the other hand, urban environments are composed of locations with more than 10,000 inhabitants. The Gran Canaria island is divided into twenty-two municipalities where the capital, Las Palmas de Gran Canaria, is the ninth-most-populous city in Spain [42] with 378,998 inhabitants allocating about 45% of the island’s whole population. According to the urban/rural boundaries provided by the Canarian Government [7] together with the information of population from those municipalities over 10,000 inhabitants, both the urban and the rural environment represents the 70% (591,534) and 24% (201,257), respectively. Hence, the municipalities below 10,000 inhabitants, included in the rural environment, represent the rest 6% (52,404). The island presents good road connections thanks to a highway ring covering the North, South, and East, being the West the most complicated area composed of winding roads with cliffs. The rest of the island can be reached through a star mesh of secondary roads where the access from the coast to the mountain has an equidistant distance. The hilly and volcanic nature of the island requires constant monitoring of the mountain: i.e., landslides, temperature, etc. Hence, it is a suitable scenario to deploy an IoT network. Although we selected the Gran Canaria Island for its complex topography to perform our field trials, there are also relatively large urban areas like the island capital.
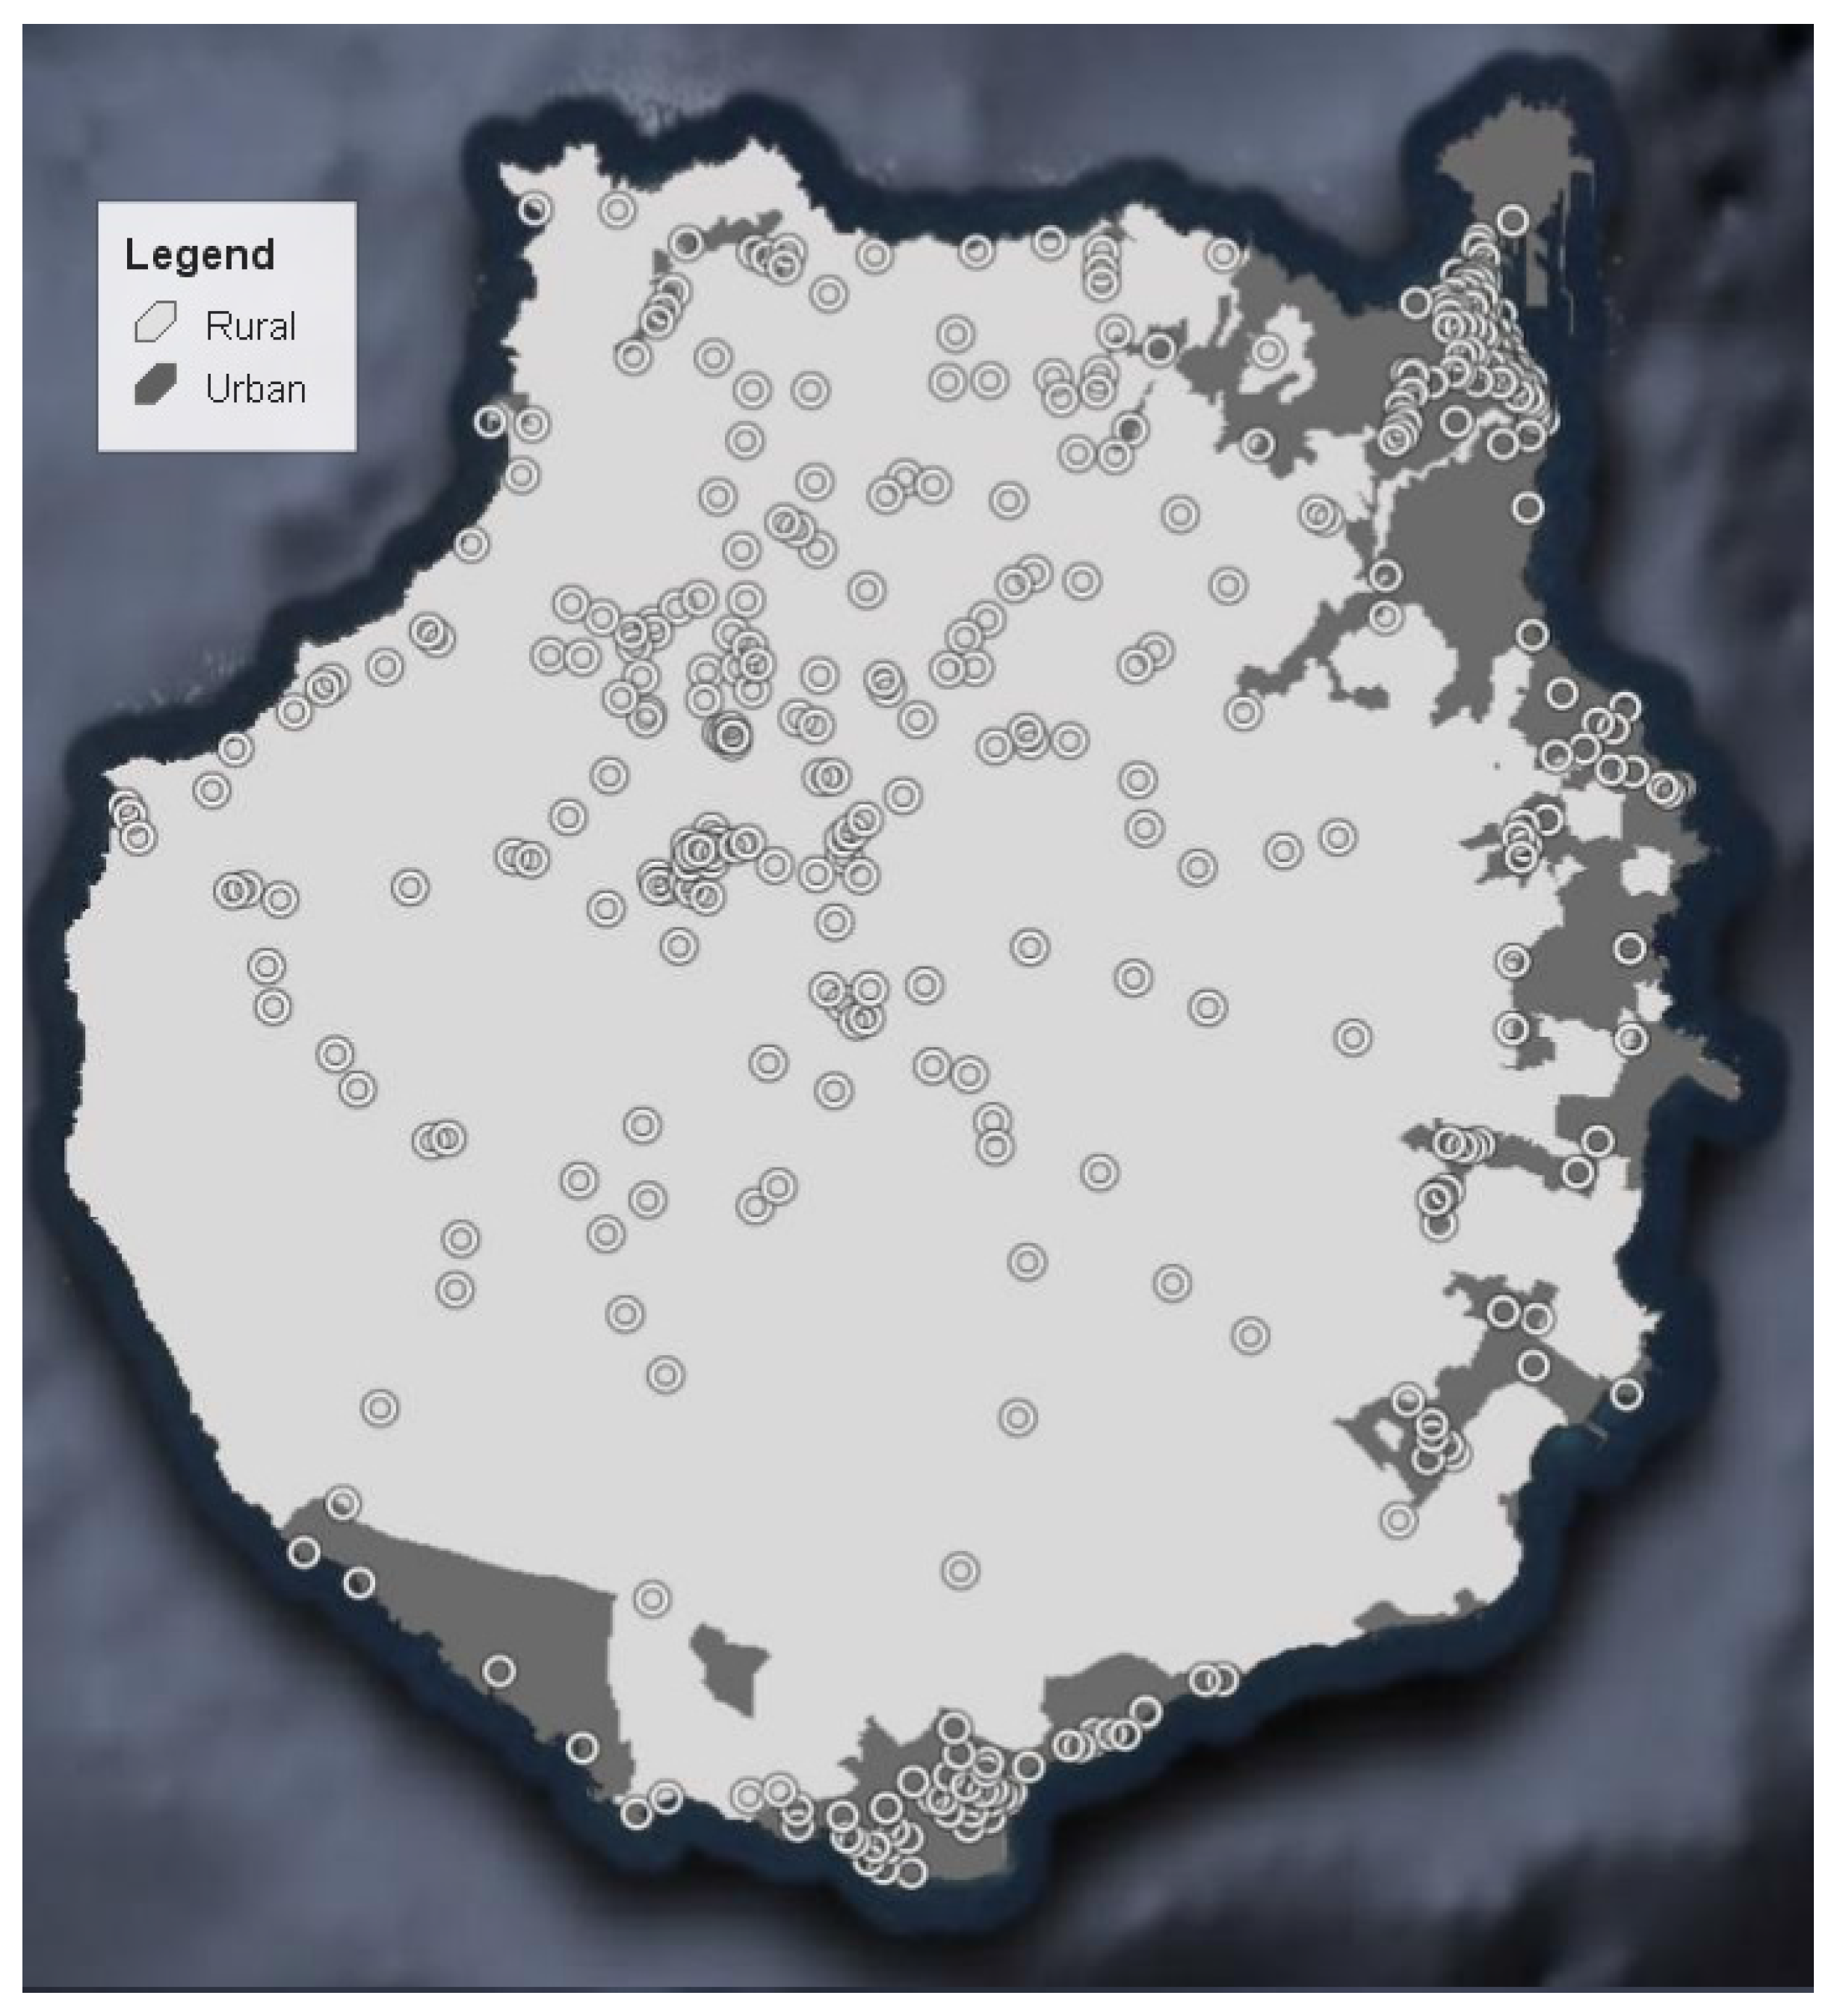
We performed a total of 400 coverage measurements divided into 200 and 200 measurements for both urban and rural environments, respectively. Since IoT M2M networks aim to be deployed in urban/rural environments, we found reasonable to perform the same number of measurement for each type of environment. The Gran Canaria Island is a proper scenario since it contains common urban environments and rural environments with complex topographies, which allows validating our tool in a worst-case scenario. Measurement points have been distributed in both urban and rural areas, according to the island characteristics [43]. Figure 10 shows the official [7] area delimitation for both urban and rural environments. In addition, the measurement points in both urban and rural environments are marked on the map with white circles.
The test-setup to perform all field trials consisted on attaching the ITHACA-device on the handlebar of a motorbike. In addition to our prototype, we attached the following auxiliary devices:
- Backup GPS: It is used to track the planned routes and verifying the measured positions.
- USB adapter: It is connected to the motorbike’s battery to feed the backup GPS.
- Backup battery: Although the motorbike’s battery can feed the ITHACA-device, for security we used a backup.
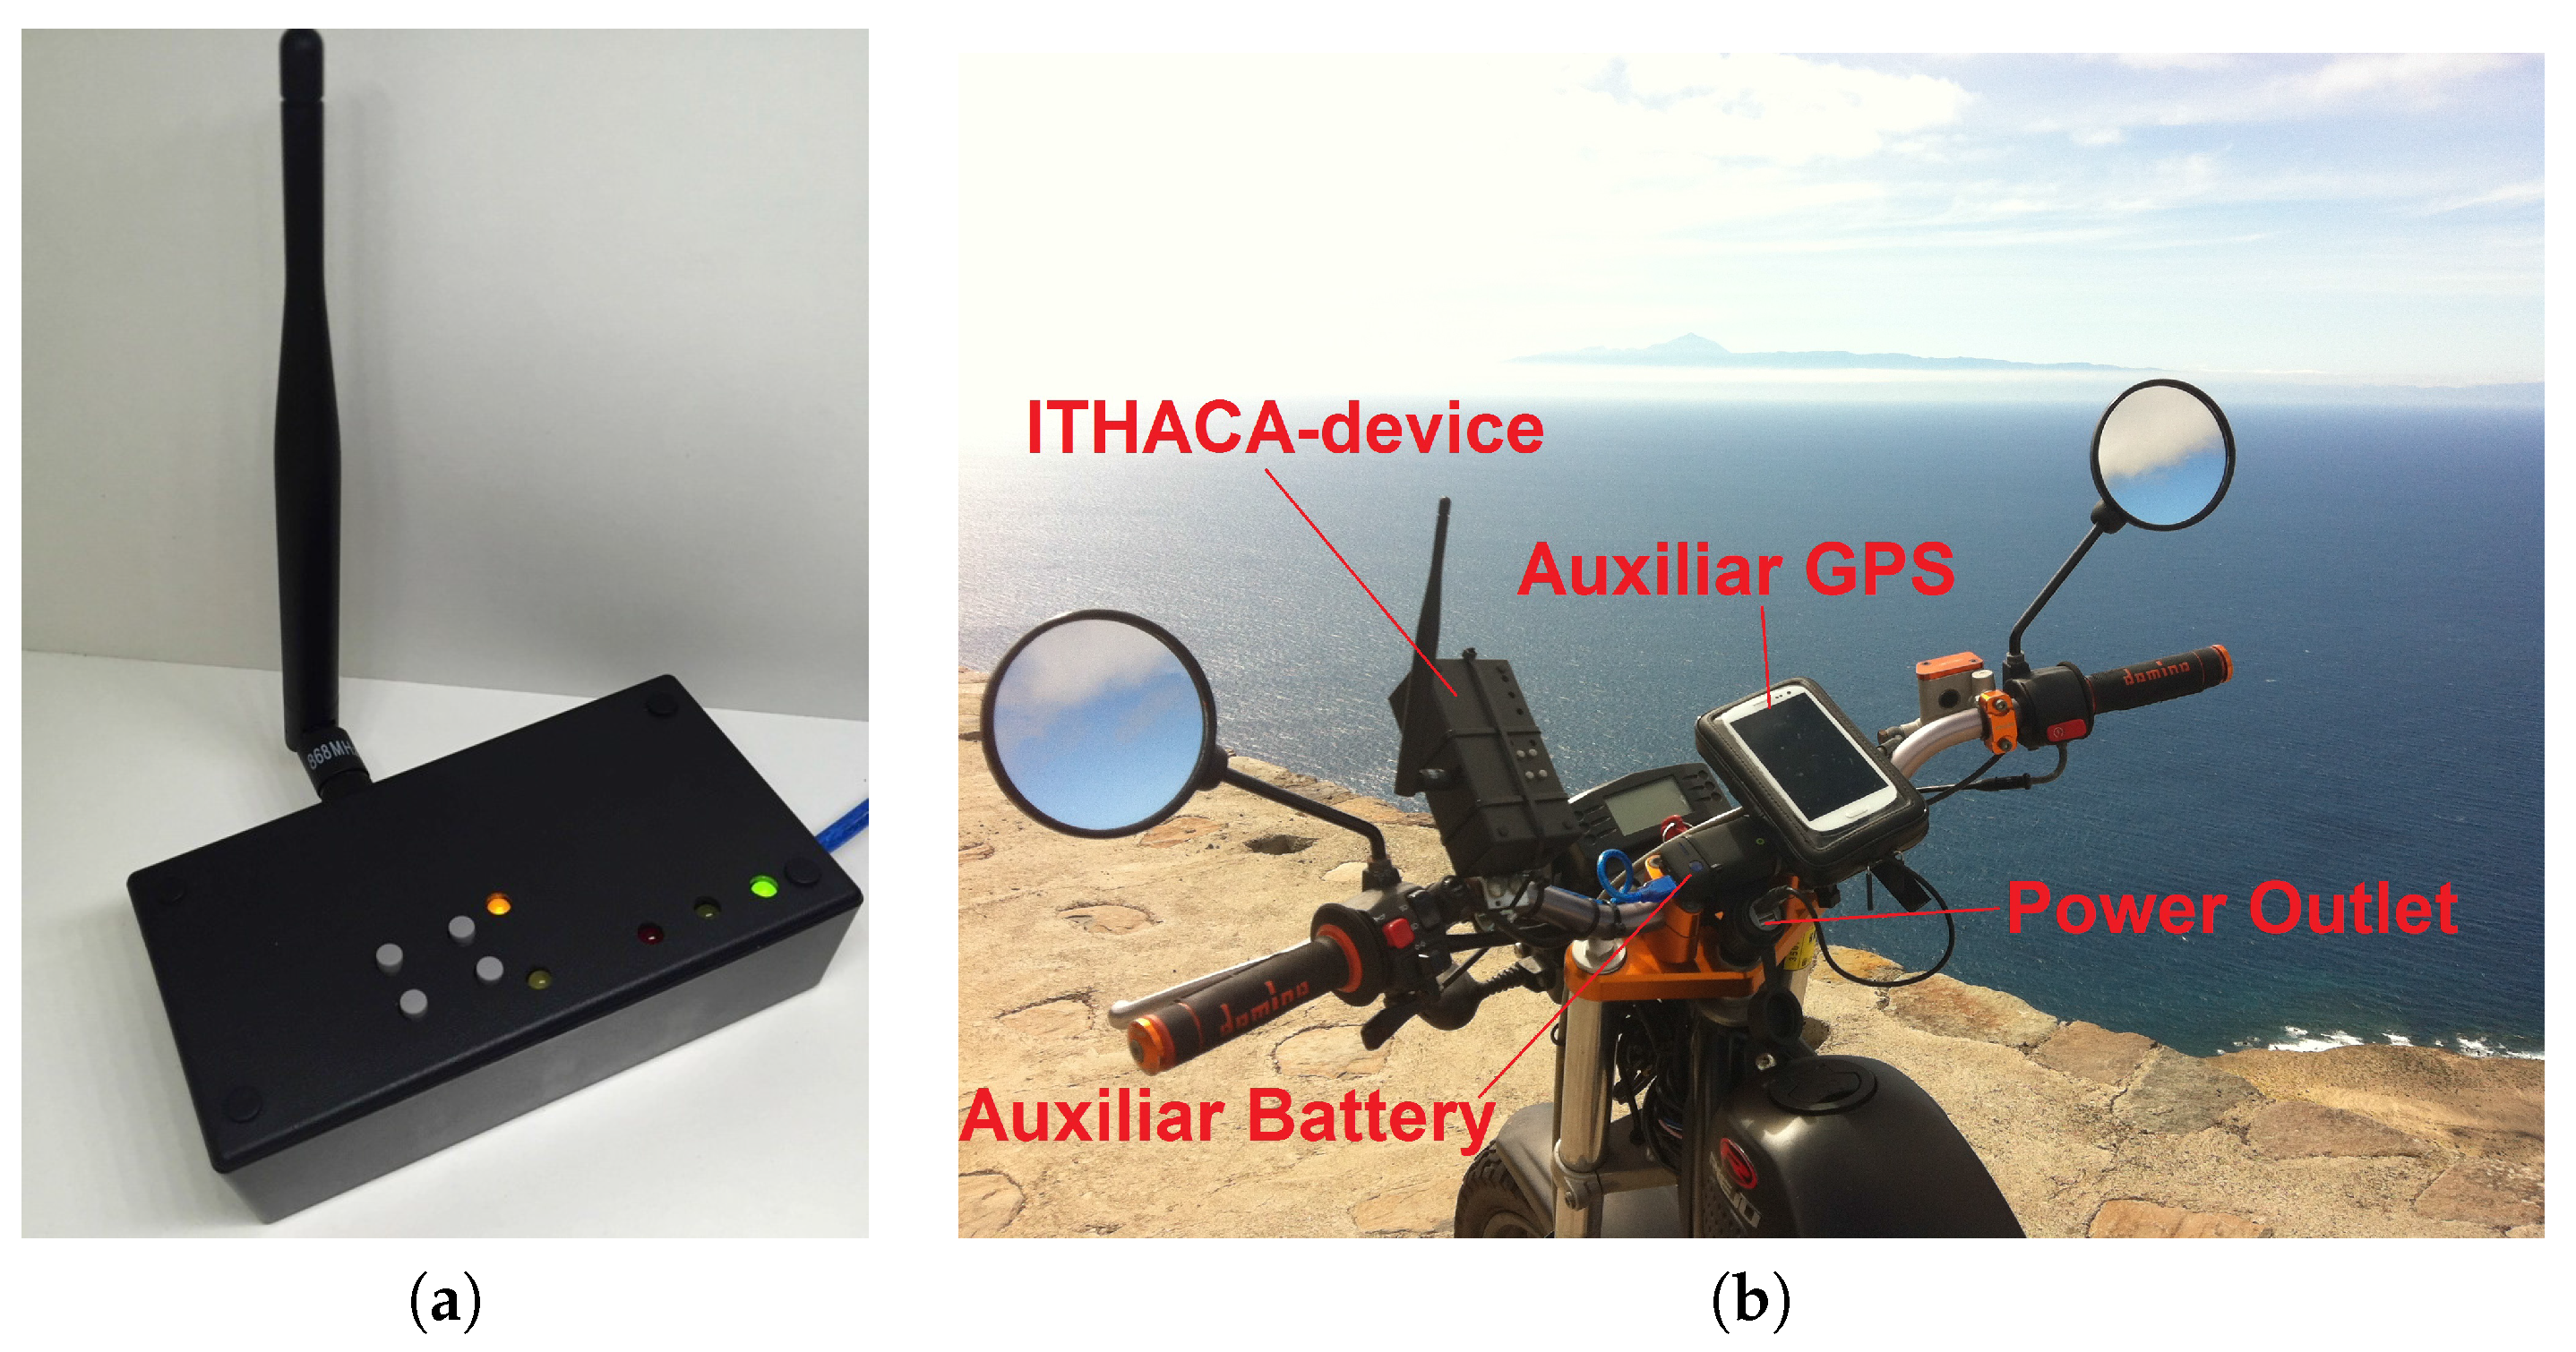
Figure 11 shows the elements to perform the field trials. The Figure 11a represents the ITHACA-device’s prototype ready. It is attached, together, with the other devices described above to a motorbike (cf. Figure 11b).
This ITHACA-device’s position allows maximizing the antenna’s gain since it remains vertical when the motorbike stays static. The height of the ITHACA-device in respect to the ground was of 1.2 m. Because the duty cycle European Telecommunication Standards Institute (ETSI)’s limitation is of 1% occupation of the ISM band within one hour (36 s occupancy) and the LP-WAN service provider’s transmission time per message is about 6 s, meaning 6 messages per hour. Thus, the transmission rate is 140 messages/day, about one each ten minutes. Hence, along with the field trial’s journey, we stopped to perform a request every ten minutes. All field trials are performed using 14 dBm, being the maximum available transmission power.
As a summary, the experimental procedure consisted of:
- Planning the routes for the journeys of field trials.
- Performing tests collecting the transmission identifiers and the GPS coordinates in the ITHACA-device’s memory.
- Transferring the message’s statistics from LP-WAN base stations to the ITHACA-server.
- Converting the data from the ITHACA-device and ITHACA-server to a more generic format for a further analysis.
- Processing the converted files from the ITHACA-device and ITHACA-server using the ITHACA-tool.
Figure 12 represents the Service Map tab from the ITHACA-tool displaying the statistics from given measurements along the field trial’s journey.
Notice that each measurement is represented in the map by a given color. That is because each color represents a LP-WAN availability service depending on the number of base stations which received the message from the ITHACA-device. Hence, the colors black, red, yellow and green refer to this redundancy as 0, 1, 2 and 3 (or more), respectively. Then, our criteria to judge the signal coverage in a given position is based on the number of base stations which received the requested message from the device [44]. Once the field trials performed and the results extracted, these are evaluated using the simulated map provided by SIGFOXTM to validate our tool.
6. Evaluation
This section evaluates the field trials performed in the Gran Canaria island using our ITHACA prototype. The evaluation includes: The study of successful transmissions from real measurements and comparison of coverage between real and simulated data from SIGFOXTM.
6.1. Real Measurements
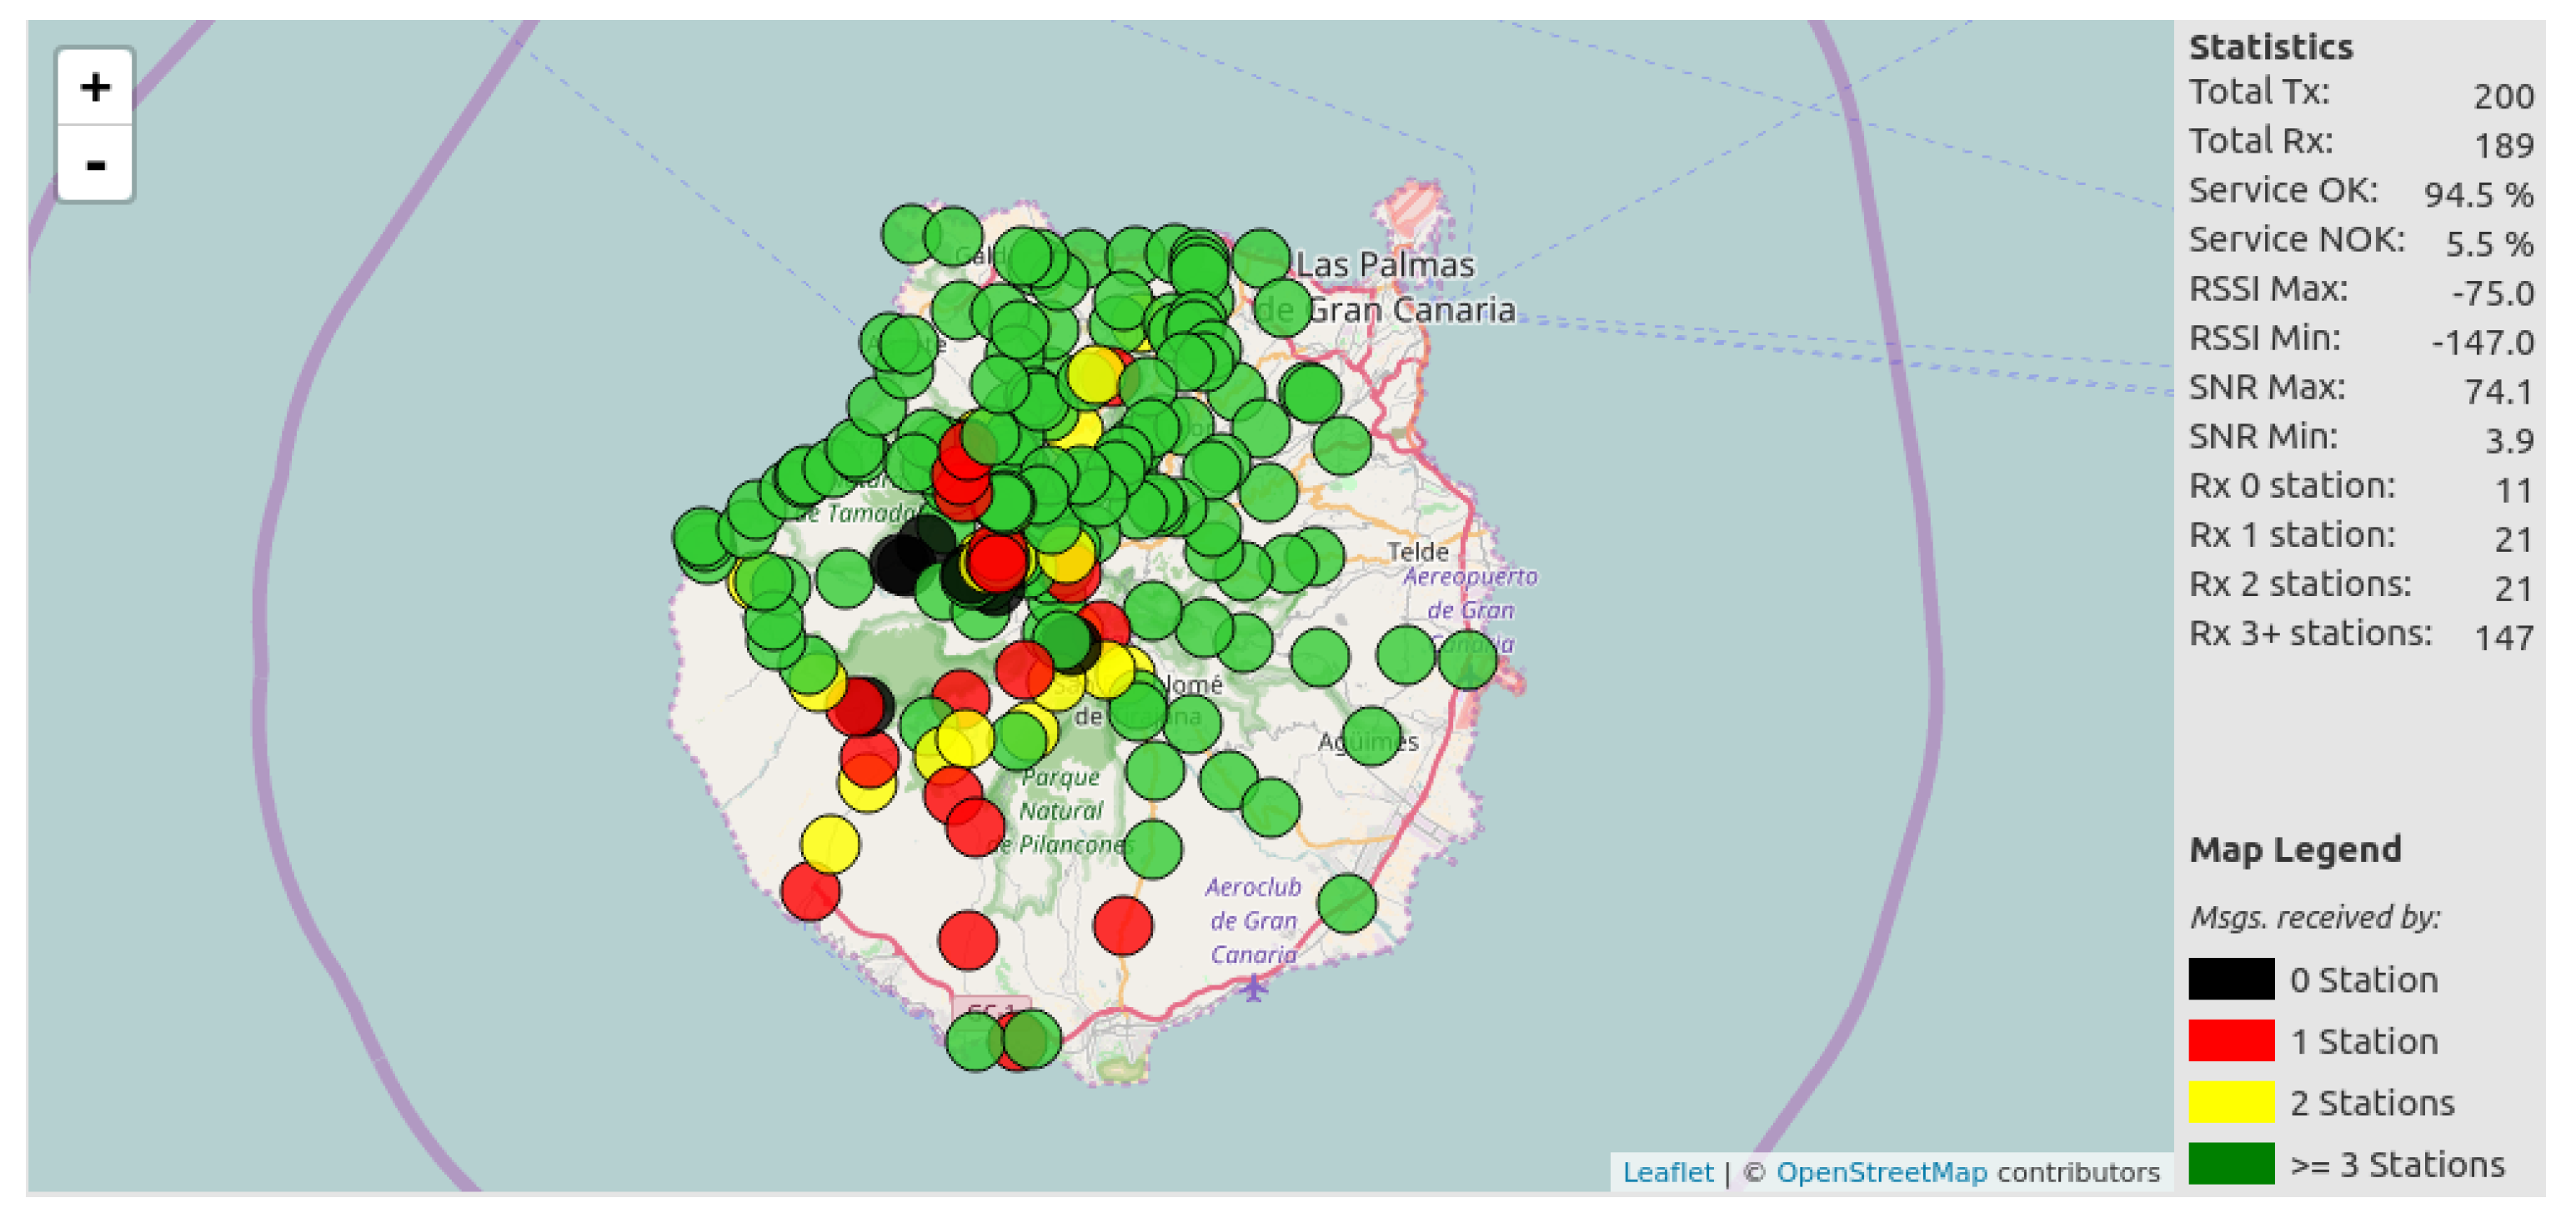
From the marked position showed in Figure 10, we performed real measurements using our ITHACA prototype with a transmission power of 14 dBm being the maximum value available and matching with the value used in the simulations by SIGFOXTM. We computed the transmissions statistics in both rural and urban environments based on the successful receptions from the SIGFOXTM base stations. Figure 13 shows the transmissions statistics in rural environments. We can observe how the majority of the transmissions were successfully received by more than three base stations (green) with a 73.5% in respect to all the transmission and 77.78% from all the successfully received for at least one station. On the other hand, only a 5.5% of the transmissions were not received by any station.
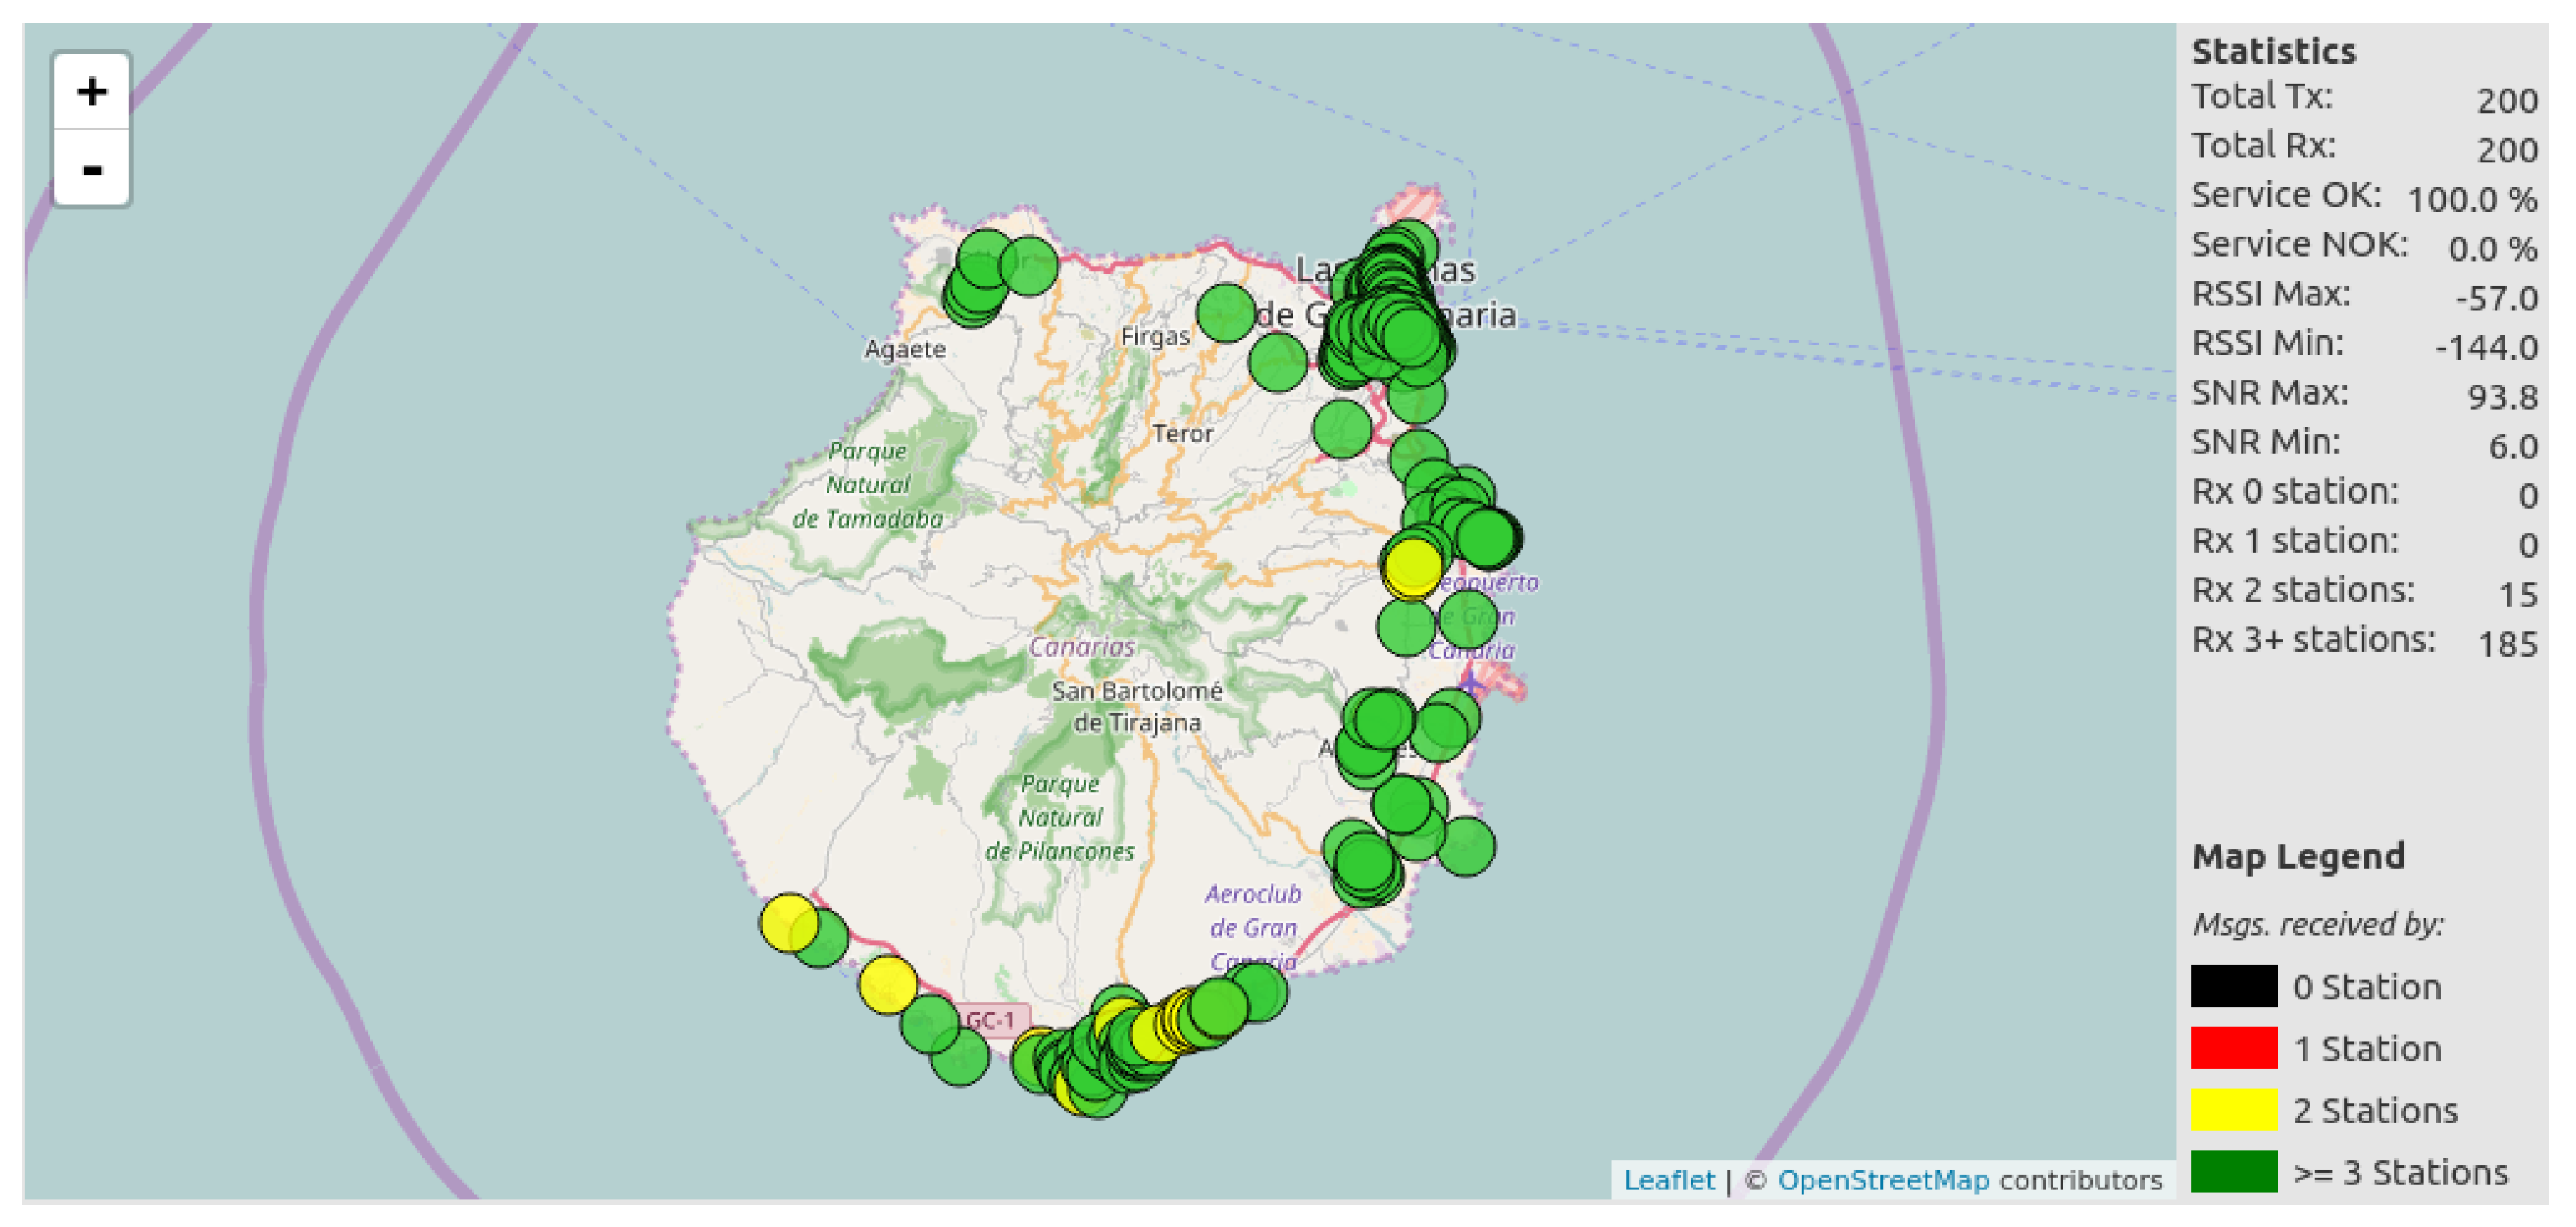
The map with the transmissions statistics from urban environments is shown in Figure 14.
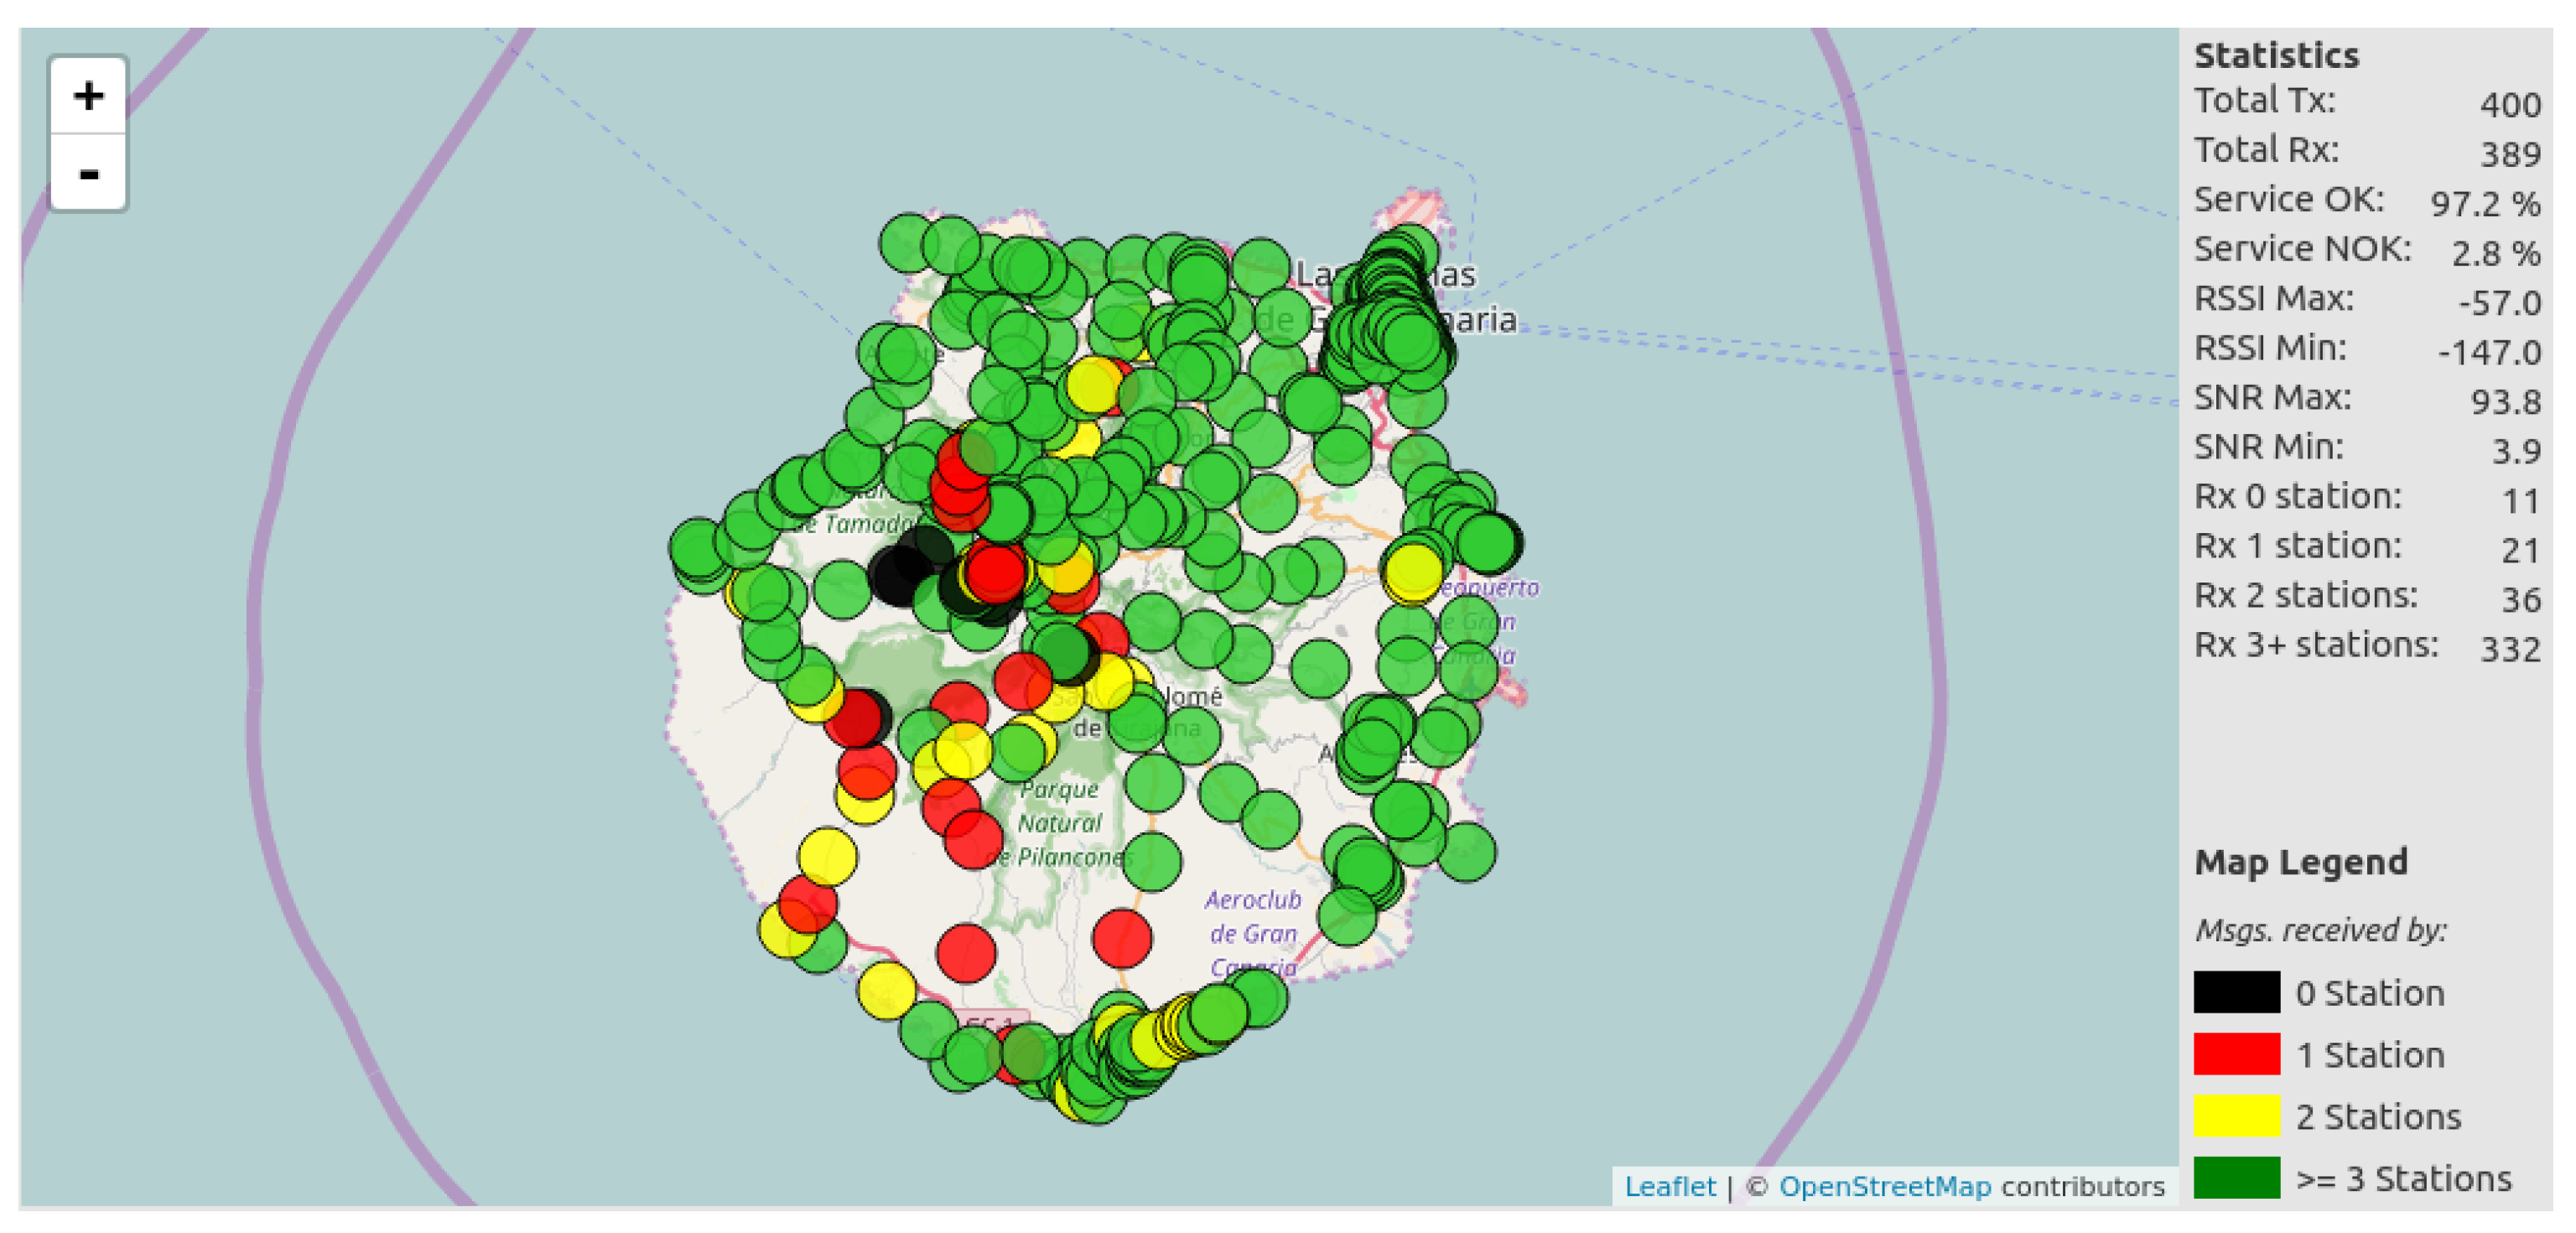
In this case, 100% of the transmissions were successfully received by at least two stations, and most of the transmissions by more than three stations (92.5%). A global map including the measurement results from rural and urban environments with their given transmission statistics is shown in Figure 15. To make the visualization of the results easier, we tabulate all the statistics in Table 5.
6.2. Comparison of Real and Simulated Data with SIGFOXTM Technology
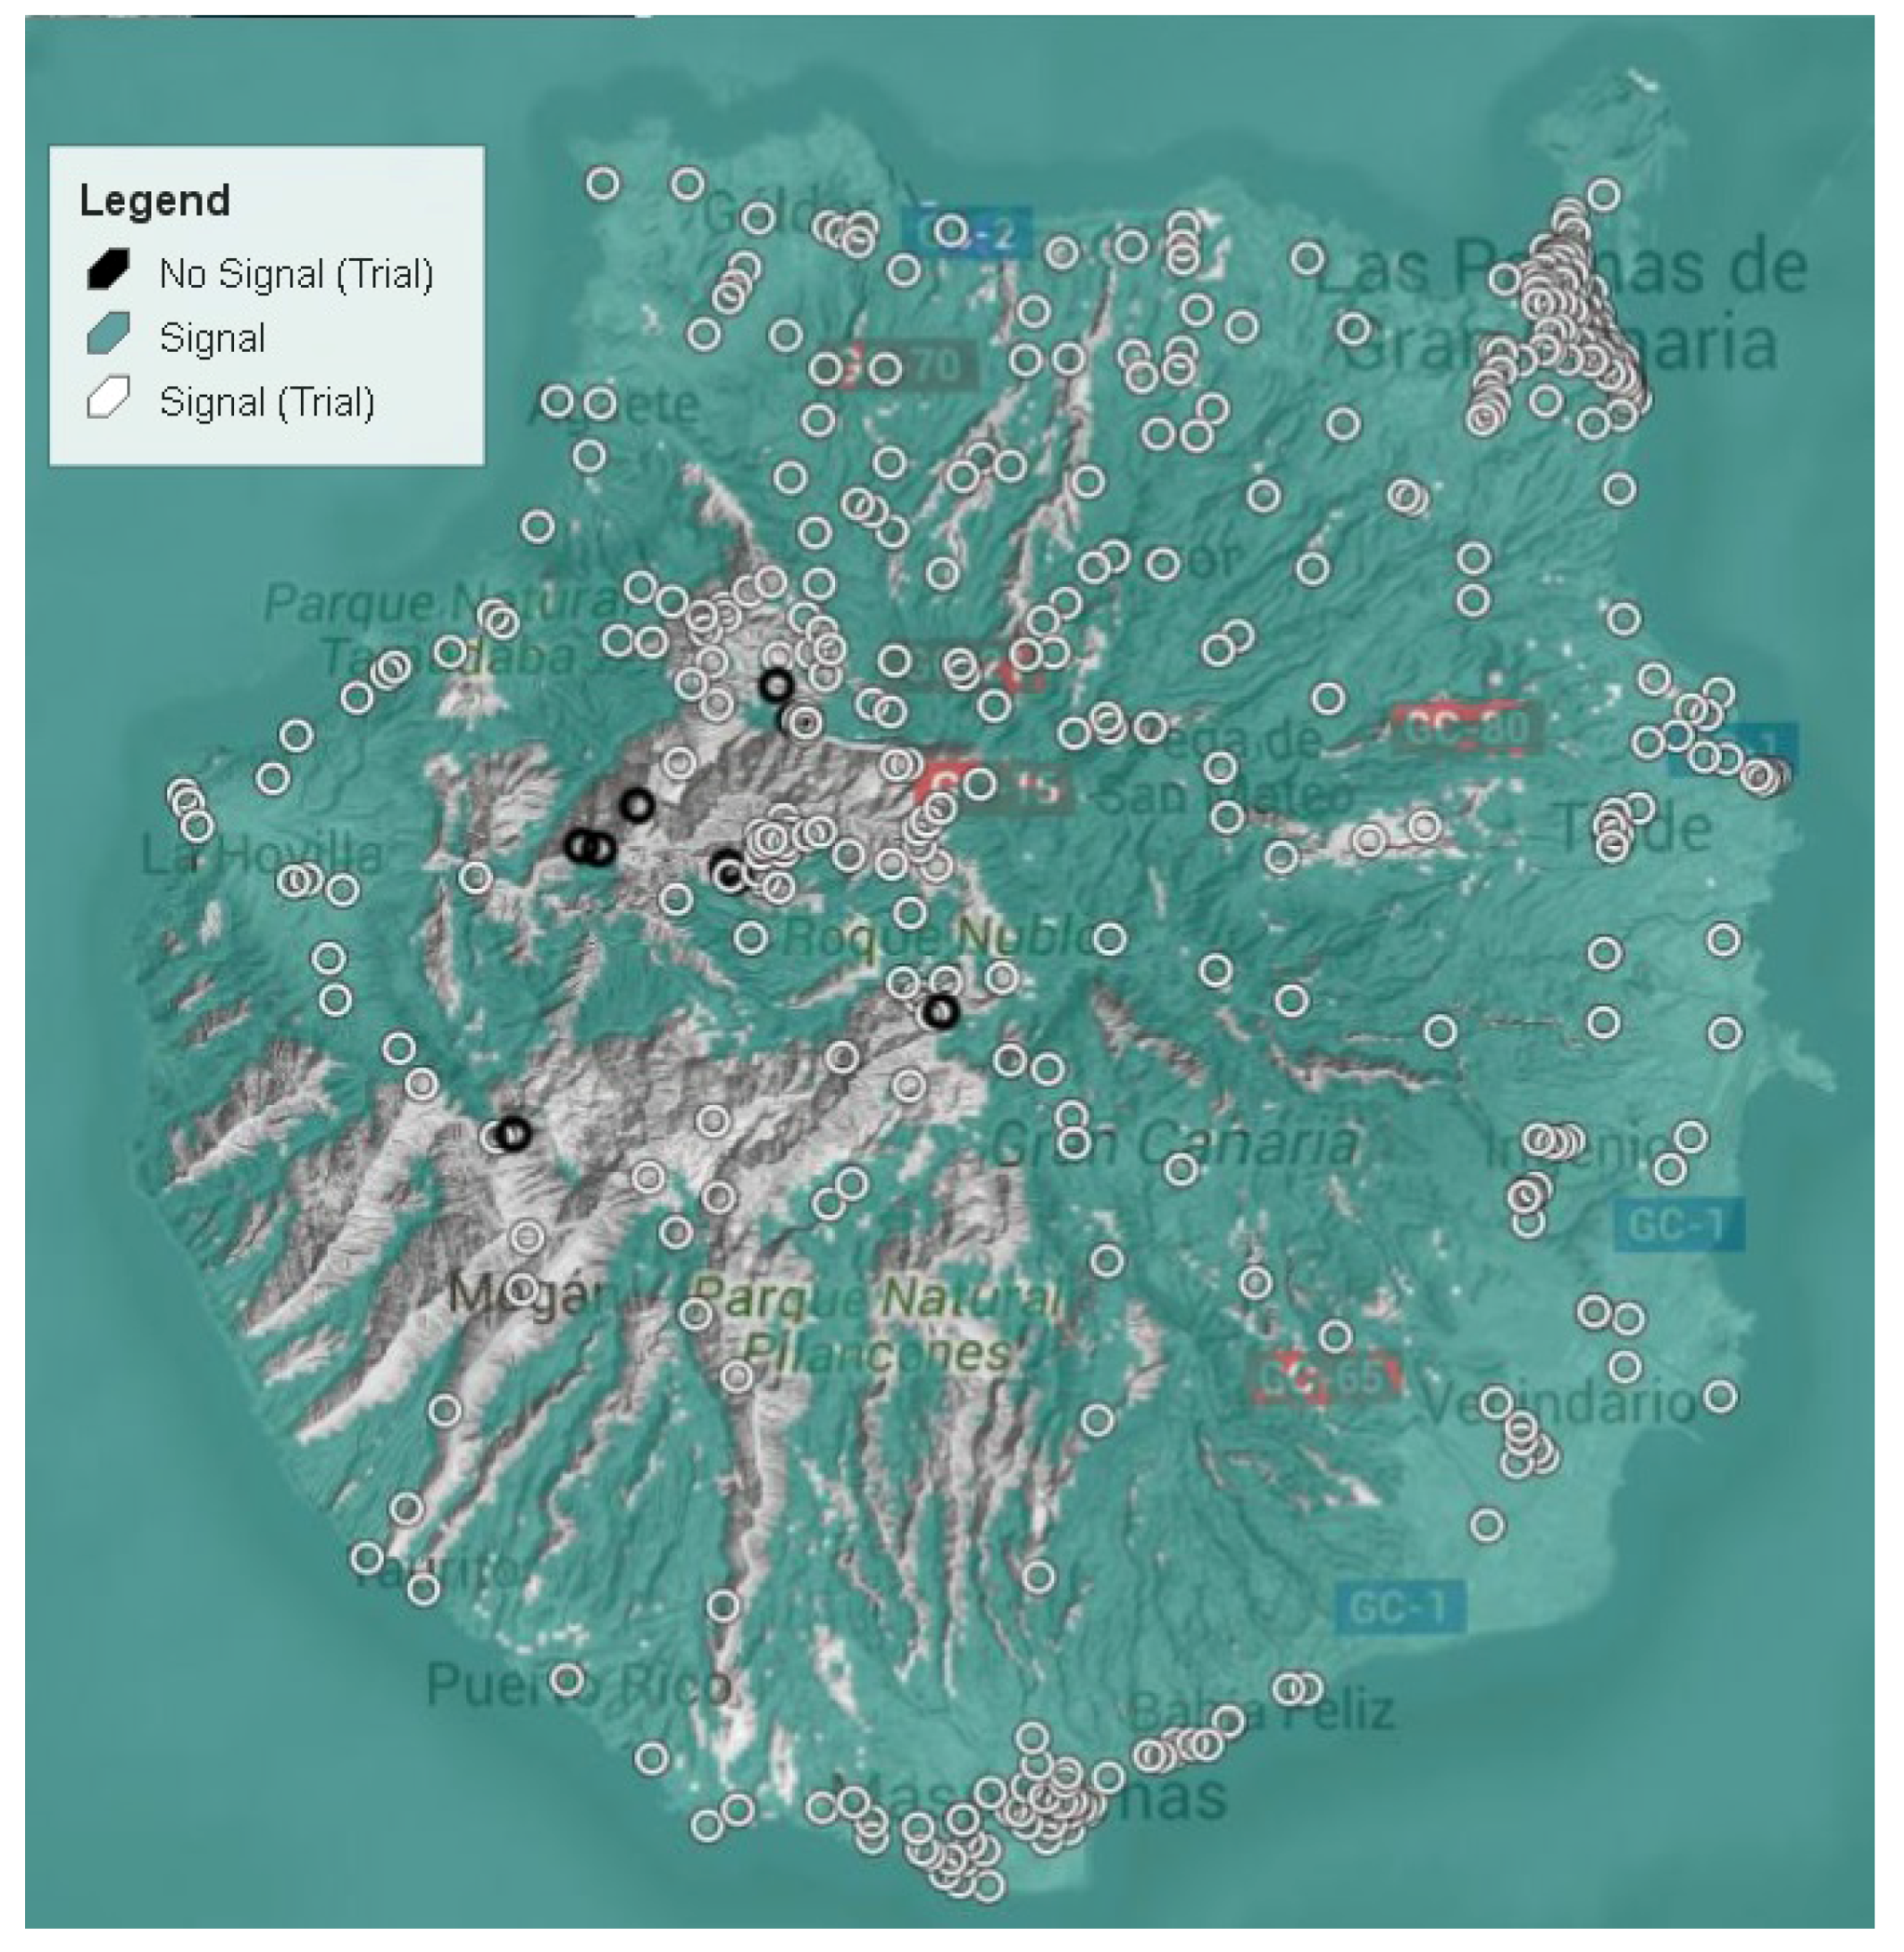
After obtaining the measurements from more than 400 spots in the field trials, we evaluated the obtained results compared with the simulated coverage of the Gran Canaria island provided by the service provider [2]. In order to confirm the accuracy of the simulation, we compared with actual measurements in field trials. We checked the number of measured points where at least one base station received the message from the ITHACA prototype, compared with the information provided by the simulated availability service. The area with available service is represented with color. Opposite, the non-color areas are not covered by the SIGFOXTM network. Both field trials and simulation are performed considering the maximum transmission power of 14 dBm. Figure 16 presents the overlapping of the simulated coverage map with the actual field trials measurements.
As a result, we can observe how most of the measured points with messages received by three or more base stations are within the covered area from the simulation. The measured points with messages received from up to two base stations, they are located in non-covered areas according to the simulation. That fact may be due to a strict high threshold on the received power from the simulation parameters. Last, the measured points which messages were not received by any base station fall in non-covered areas on the simulation. Table 6 summarizes the obtained results from Figure 16, differentiating between rural and urban areas.
A 100% (9/9) of the total measured points without service, according to the simulation, match to non-service availability from the field trials. We just did find one spot without coverage in areas with service availability reported by the provider. However, 11.25% (45/400) of spots differ between measurements and simulation. Specifically, we confirmed coverage in areas where the simulated map does not report service availability, all of them falling in rural areas. The fact that simulated service maps are not consistent in rural areas is especially relevant since many IoT use cases are focused in these environments (i.e., crop monitoring, mountain landslides, etc.). Hence, we confirm the need for on-site coverage measurements, being an overall 11.25%, a significant deviation from the simulated coverage service.
Finally, we analyzed the metrics on the accuracy of the simulated coverage map compared to the field tests. We consider a true positive (TP) when both field trial and simulation confirm coverage, true negative (TN) when both field trial and simulation does not confirm coverage, false positive (FP) when field trial does not confirm coverage but simulation does, and false negative (FN) when field trial confirm coverage but not simulation. Table 7 provides a summary of the accuracy metrics based on the above samples. We can observe how the absence of false positives makes the simulation precise. However, recall metrics are lower (88.4%) due to the false negatives, being 23.2% inferior in rural areas compared to urban areas. Overall accuracy metrics are similar to recall due to the reduced number of true negatives, being 88.8% the overall accuracy of the simulated coverage map.
As a conclusion, our real experiments performed with our proposed ITHACA prototype returned an average of successful transmissions, considering both urban and rural environments, above 97%. Analyzing both the successful and the unsuccessful transmission points from Figure 16 in respect to the simulations provided by SIGFOXTM, we can observe how the urban environment matches in terms of signal coverage in both the simulation and the measurements. This fact is important since the area with the 70% of the whole population has LP-WAN service. From those municipalities over 10,000 inhabitants which are considered as rural environment, the 21% of the population receives LP-WAN service according to SIGFOXTM simulation while the 24% is confirmed using our ITHACA prototype. Finally, those municipalities below 10,000 inhabitants composed of the 6% of the whole island population, the signal coverage simulation only reaches the 5%, while the experiments confirm the signal availability to all this percentage of the population. This difference of signal availability between the SIGFOXTM simulation and the ITHACA measurements is due to those non-covered municipalities, according to the SIGFOXTM simulation, which are located in valleys and the simulation requires a more realistic configuration.
7. Conclusions and Future Work
Within the challenges of the M2M technology, connecting a large number of devices, and achieving long-range distances, are two of the most relevant ones. The connection of devices allows the development of disruptive IoT applications to enhance services in the Smart City context. The traditional cellular networks provide service covering large areas. Specifically, the second-generation of cellular networks (a.k.a GSM) has proven to work in IoT scenarios. The more recent LP-WAN technology covers areas of kilometers with low-power transmissions, in exchange for low throughput rates. Within the LP-WAN technologies, UNB modulation (commercially known as SIGFOXTM) reaches more than 30 km in rural areas. We believe that with the yearly increment of devices, an optimal M2M technology is required to efficiently allocate the device-to-device communications. Specifically, both GSM and SIGFOXTM technologies provide a similar theoretical signal, however, infrastructure and user costs are lower for the latter.
With the recent deployment of SIGFOXTM networks, new opportunities for IoT applications designers have appeared. Thus, in order to provide service to customers, IoT service providers simulate their networks to map approximated coverage areas. However, simulations are not always reliable in complex topographical scenarios due to the terrain shape, hence, providing misleading information to Smart City projects decision makers.
We present ITHACA, a prototype to measure LP-WAN service using the SIGFOXTM. We evaluated the proposed prototype performing a set of field trials in the Gran Canaria island, Spain, of volcanic origin, and presenting complex topographical areas.
Our results returned around 97% successful transmissions from the 400 measured spots. We found an overall 11.25% of spots differing between the actual measurements and the simulated coverage map, where those noncovered spots belong to rural areas. Since many IoT use cases are focused in rural areas (i.e., crops monitoring, mountain landslides, etc.), we demonstrate the contribution of ITHACA to provide further information to Smart City projects decision makers about the proper communications infrastructure selection.
Our future work includes, but is not limited to:
- Improving the autonomy and capacity of the ITHACA prototype, also considering other LP-WAN technologies
- Measuring actual signal coverage with different transmission power levels (from 0 to 14 dBm) and antennas to improve information on IoT coverage
- Evaluating the system in different topographical scenarios
Acknowledgments
This work is partially supported by the Spanish Ministry of Economy and the FEDER regional development fund under SINERGIA project (TEC2015-71303-R).
Author Contributions
The contributions to the work reported was distributed as follows: R. Parada supervised the prototype design, experiments, and final results, and wrote parts of the paper; Daniel Cárdenes-Tacoronte conceived, designed and performed the experiments being the author of all the experimental contributions; Carlos Monzo and Joan Melià-Seguí supervised the design and analysis of the experiments, and wrote parts of the paper.
Conflicts of Interest
The authors declare no conflict of interest.
References
- Gartner, Inc. Gartner Says 8.4 Billion Connected “Things” Will Be in Use in 2017, Up 31 Percent From 2016, 2017. Available online: http://www.gartner.com/newsroom/id/3598917 (accessed on 22 September 2017).
- SIGFOX. Sigfox, the World’s Leading Internet of Things (IoT) Connectivity Service, 2009. Available online: https://www.sigfox.com/ (accessed on 22 September 2017).
- Kobayashi, T.; Murakoshi, H.; Mori, Y.; Ishijima, S. Optimal Path Planning Simulator for Garbage Trucks. In Proceedings of the 2006 SICE-ICASE International Joint Conference, Busan, South Korea, 18–21 October 2006; IEEE: Piscataway, NJ, USA, 2006; pp. 488–491. [Google Scholar]
- Xiaojun, C.; Xianpeng, L.; Peng, X. IOT-based air pollution monitoring and forecasting system. In Proceedings of the 2015 International Conference on Computer and Computational Sciences (ICCCS), Noida, India, 27–29 January 2015; IEEE: Piscataway, NJ, USA, 2015; pp. 257–260. [Google Scholar]
- Radu, E.; Dorin, P.; Toma, P.; Eniko, L. An islanded renewable energy microgrid emulator for geothermal, biogas, photovoltaic and lead acid battery storage. In Proceedings of the 2017 IEEE 26th International Symposium on Industrial Electronics (ISIE), Edinburgh, UK, 19–21 June 2017; IEEE: Piscataway, NJ, USA, 2017; pp. 2109–2114. [Google Scholar]
- Garg, A.; Munoth, P.; Goyal, R. Application of soil moisture sensors in agriculture: A review. In Proceedings of the International Conference on Hydraulics, Water Resources and Coastal Engineering (Hydro2016), CWPRS, Pune, India, 8–10 December 2016; Volume 21. [Google Scholar]
- Gobierno de Canarias. Programa de Desarrollo Rural de Canarias 2014–2020. 2016. Available online: http://www.pdrcanarias.org/index.php/el-pdr-de-canarias-2014-2020 (accessed on 22 September 2017).
- Huurdeman, A. The Worldwide History of Telecommunications; A Wiley-Interscience Publication, Wiley: Hoboken, NJ, USA, 2003. [Google Scholar]
- GSMA. Narrow Band—Internet of Things (NB-IoT). 2017. Available online: https://www.gsma.com/iot/narrow-band-internet-of-things-nb-iot/ (accessed on 22 September 2017).
- Andreev, S.; Galinina, O.; Pyattaev, A.; Gerasimenko, M.; Tirronen, T.; Torsner, J.; Sachs, J.; Dohler, M.; Koucheryavy, Y. Understanding the IoT connectivity landscape: A contemporary M2M radio technology roadmap. IEEE Commun. Mag. 2015, 53, 32–40. [Google Scholar] [CrossRef]
- Myers, T. Random Phase Multiple Access System with Meshing. U.S. Patent 7773664, 10 August 2010. [Google Scholar]
- Hornbuckle, C. Fractional-N Synthesized Chirp Generator. U.S. Patent 7791415, 7 September 2010. [Google Scholar]
- Fourtet, C.; Bailleul, T. Method for Using a Shared Frequency Resource, Method for Manufacturing Terminals, Terminals and Telecommunication System. U.S. Patent 9049732, 2 June 2015. [Google Scholar]
- Electronic Communications Committee. ERC Recommendation 70-03, 2016. Available online: https://cept.org/ecc/ (accessed on 22 September 2017).
- Sanchez-Iborra, R.; Cano, M.D. State of the Art in LP-WAN Solutions for Industrial IoT Services. Sensors 2016, 16, 708. [Google Scholar] [CrossRef] [PubMed]
- Margelis, G.; Piechocki, R.; Kaleshi, D.; Thomas, P. Low Throughput Networks for the IoT: Lessons learned from industrial implementations. In Proceedings of the 2015 IEEE 2nd World Forum on Internet of Things (WF-IoT), Milan, Italy, 14–16 December 2015; IEEE: Piscataway, NJ, USA, 2015; pp. 181–186. [Google Scholar]
- Link Labs. A Comprehensive Look at LPWAN For IoT Engineers & Decision Makers. 2016. Available online: https://www.link-labs.com/lpwan (accessed on 22 September 2017).
- Goursaud, C.; Gorce, J.M. Dedicated networks for IoT : PHY/MAC state of the art and challenges. EAI Endorsed Trans. Internet Things 2015. [Google Scholar] [CrossRef]
- SIGFOX. Sigfox Expands its Global Internet of Things (IoT) Network in Sweden in Partnership with IoT SWEDEN. 2017. Available online: https://www.sigfox.com/en/news/sigfox-expands-its-global-internet-things-iot-network-sweden-partnership-iot-sweden (accessed on 22 September 2017).
- IoT Global Network. SIGFOX M2M Network Access. 2016. Available online: http://www.iotglobalnetwork.com/products/single/id/571/sigfox-m2m-network-access (accessed on 22 September 2017).
- Vejlgaard, B.; Lauridsen, M.; Nguyen, H.; Kovács, I.; Mogensen, P.; Sørensen, M. Coverage and Capacity Analysis of Sigfox, LoRa, GPRS, and NB-IoT. In Proceedings of the IEEE 85th Vehicular Technology Conference, Sydney, Australia, 4–7 June 2017. [Google Scholar]
- Turau, V.; Witt, M.; Venzke, M. Field Trials with Wireless Sensor Networks: Issues and Remedies. In Proceedings of the 2006 International Conference on Wireless and Mobile Communications (ICWMC’06), Bucharest, Romania, 29–31 July 2006. [Google Scholar]
- Petajajarvi, J.; Mikhaylov, K.; Roivainen, A.; Hanninen, T.; Pettissalo, M. On the coverage of LPWANs: Range evaluation and channel attenuation model for LoRa technology. In Proceedings of the 2015 14th International Conference on ITS Telecommunications (ITST), Copenhagen, Denmark, 2–4 December 2015. [Google Scholar]
- Centenaro, M.; Vangelista, L.; Zanella, A.; Zorzi, M. Long-range communications in unlicensed bands: The rising stars in the IoT and smart city scenarios. IEEE Wirel. Commun. 2016, 23, 60–67. [Google Scholar] [CrossRef]
- Llaria, A.; Terrasson, G.; Arregui, H.; Hacala, A. Geolocation and monitoring platform for extensive farming in mountain pastures. In Proceedings of the 2015 IEEE International Conference on Industrial Technology (ICIT), Seville, Spain, 17–19 March 2015. [Google Scholar]
- Xiong, X.; Zheng, K.; Xu, R.; Xiang, W.; Chatzimisios, P. Low power wide area machine-to-machine networks: Key techniques and prototype. IEEE Commun. Mag. 2015, 53, 64–71. [Google Scholar] [CrossRef]
- Movistar. Mobile Coverage—Movistar. 2017. Available online: http://www.movistar.es/particulares/coberturas/movil/4G/ (accessed on 22 September 2017).
- Vodafone. Mobile Coverage—Vodafone. 2017. Available online: http://www.vodafone.es/conocenos/es/vodafone-espana/mapa-de-cobertura/consulta-de-cobertura-movil/ (accessed on 22 September 2017).
- Orange. Mobile Coverage—Orange. 2017. Available online: http://4g.orange.es/cobertura/ (accessed on 22 September 2017).
- Yoigo. Mobile Coverage—Yoigo. 2017. Available online: http://www.yoigo.com/cobertura-movil/ (accessed on 22 September 2017).
- Foremski, P.; Gorawski, M.; Grochla, K.; Polys, K. Energy-Efficient Crowdsensing of Human Mobility and Signal Levels in Cellular Networks. Sensors 2015, 15, 22060–22088. [Google Scholar] [CrossRef] [PubMed]
- OpenSignal. Understand and Improve Mobile Signal. 2010. Available online: https://opensignal.com/networks (accessed on 22 September 2017).
- Organización de Consumidores y Usuarios. CoberApp. 2017. Available online: http://www.ocu.org/tecnologia/telefono/calculadora/cobertura# (accessed on 22 September 2017).
- Generalitat de Catalunya. Cobertura Mòbil. 2009. Available online: http://presidencia.gencat.cat/ca/ambits_d_actuacio/tic/serveis_ciutadania/cercadors_cobertura/mobil (accessed on 22 September 2017).
- SignalMap. SignalMap. 2017. Available online: http://signalmap.com/ (accessed on 22 September 2017).
- Nperf. Nperf. 2017. Available online: https://www.nperf.com/en/map (accessed on 22 September 2017).
- Sensorly. Sensorly. 2017. Available online: http://www.sensorly.com/map/ (accessed on 22 September 2017).
- ROOT Metrics. ROOT Metrics. 2017. Available online: http://webcoveragemap.rootmetrics.com/ (accessed on 22 September 2017).
- SIGFOX. Adeunis Field Test Device 868. 2017. Available online: https://partners.sigfox.com/products/field-test-device-sigfox-868 (accessed on 22 September 2017).
- Arduino. Arduino UNO. 2017. Available online: https://www.arduino.cc/en/Main/ArduinoBoardUno (accessed on 22 September 2017).
- QT. Software Development Made Smarter. 2017. Available online: https://www.qt.io/ (accessed on 22 September 2017).
- Instituto Nacional de Estadística. Indicadores Urbanos 2017. 2017. Available online: http://www.ine.es/prensa/ua_2017.pdf (accessed on 22 September 2017).
- Gobierno de Canarias. Sistema de Información Territorial de Canarias—IDECanarias. 2017. Available online: http://visor.grafcan.es/visorweb/ (accessed on 22 September 2017).
- SIGFOX. Sigfox Service Map. 2017. Available online: https://confluence.sigfox.com/display/OPSDB/Sigfox+Service+map (accessed on 22 September 2017).
Figure 1.
Service Coverage Maps from SIGFOXTM and the cellular service provider. (a) SIGFOXTM Coverage Map; (b) Cellular service Coverage Map.
Figure 1.
Service Coverage Maps from SIGFOXTM and the cellular service provider. (a) SIGFOXTM Coverage Map; (b) Cellular service Coverage Map.

Figure 2.
ITHACA scheme.
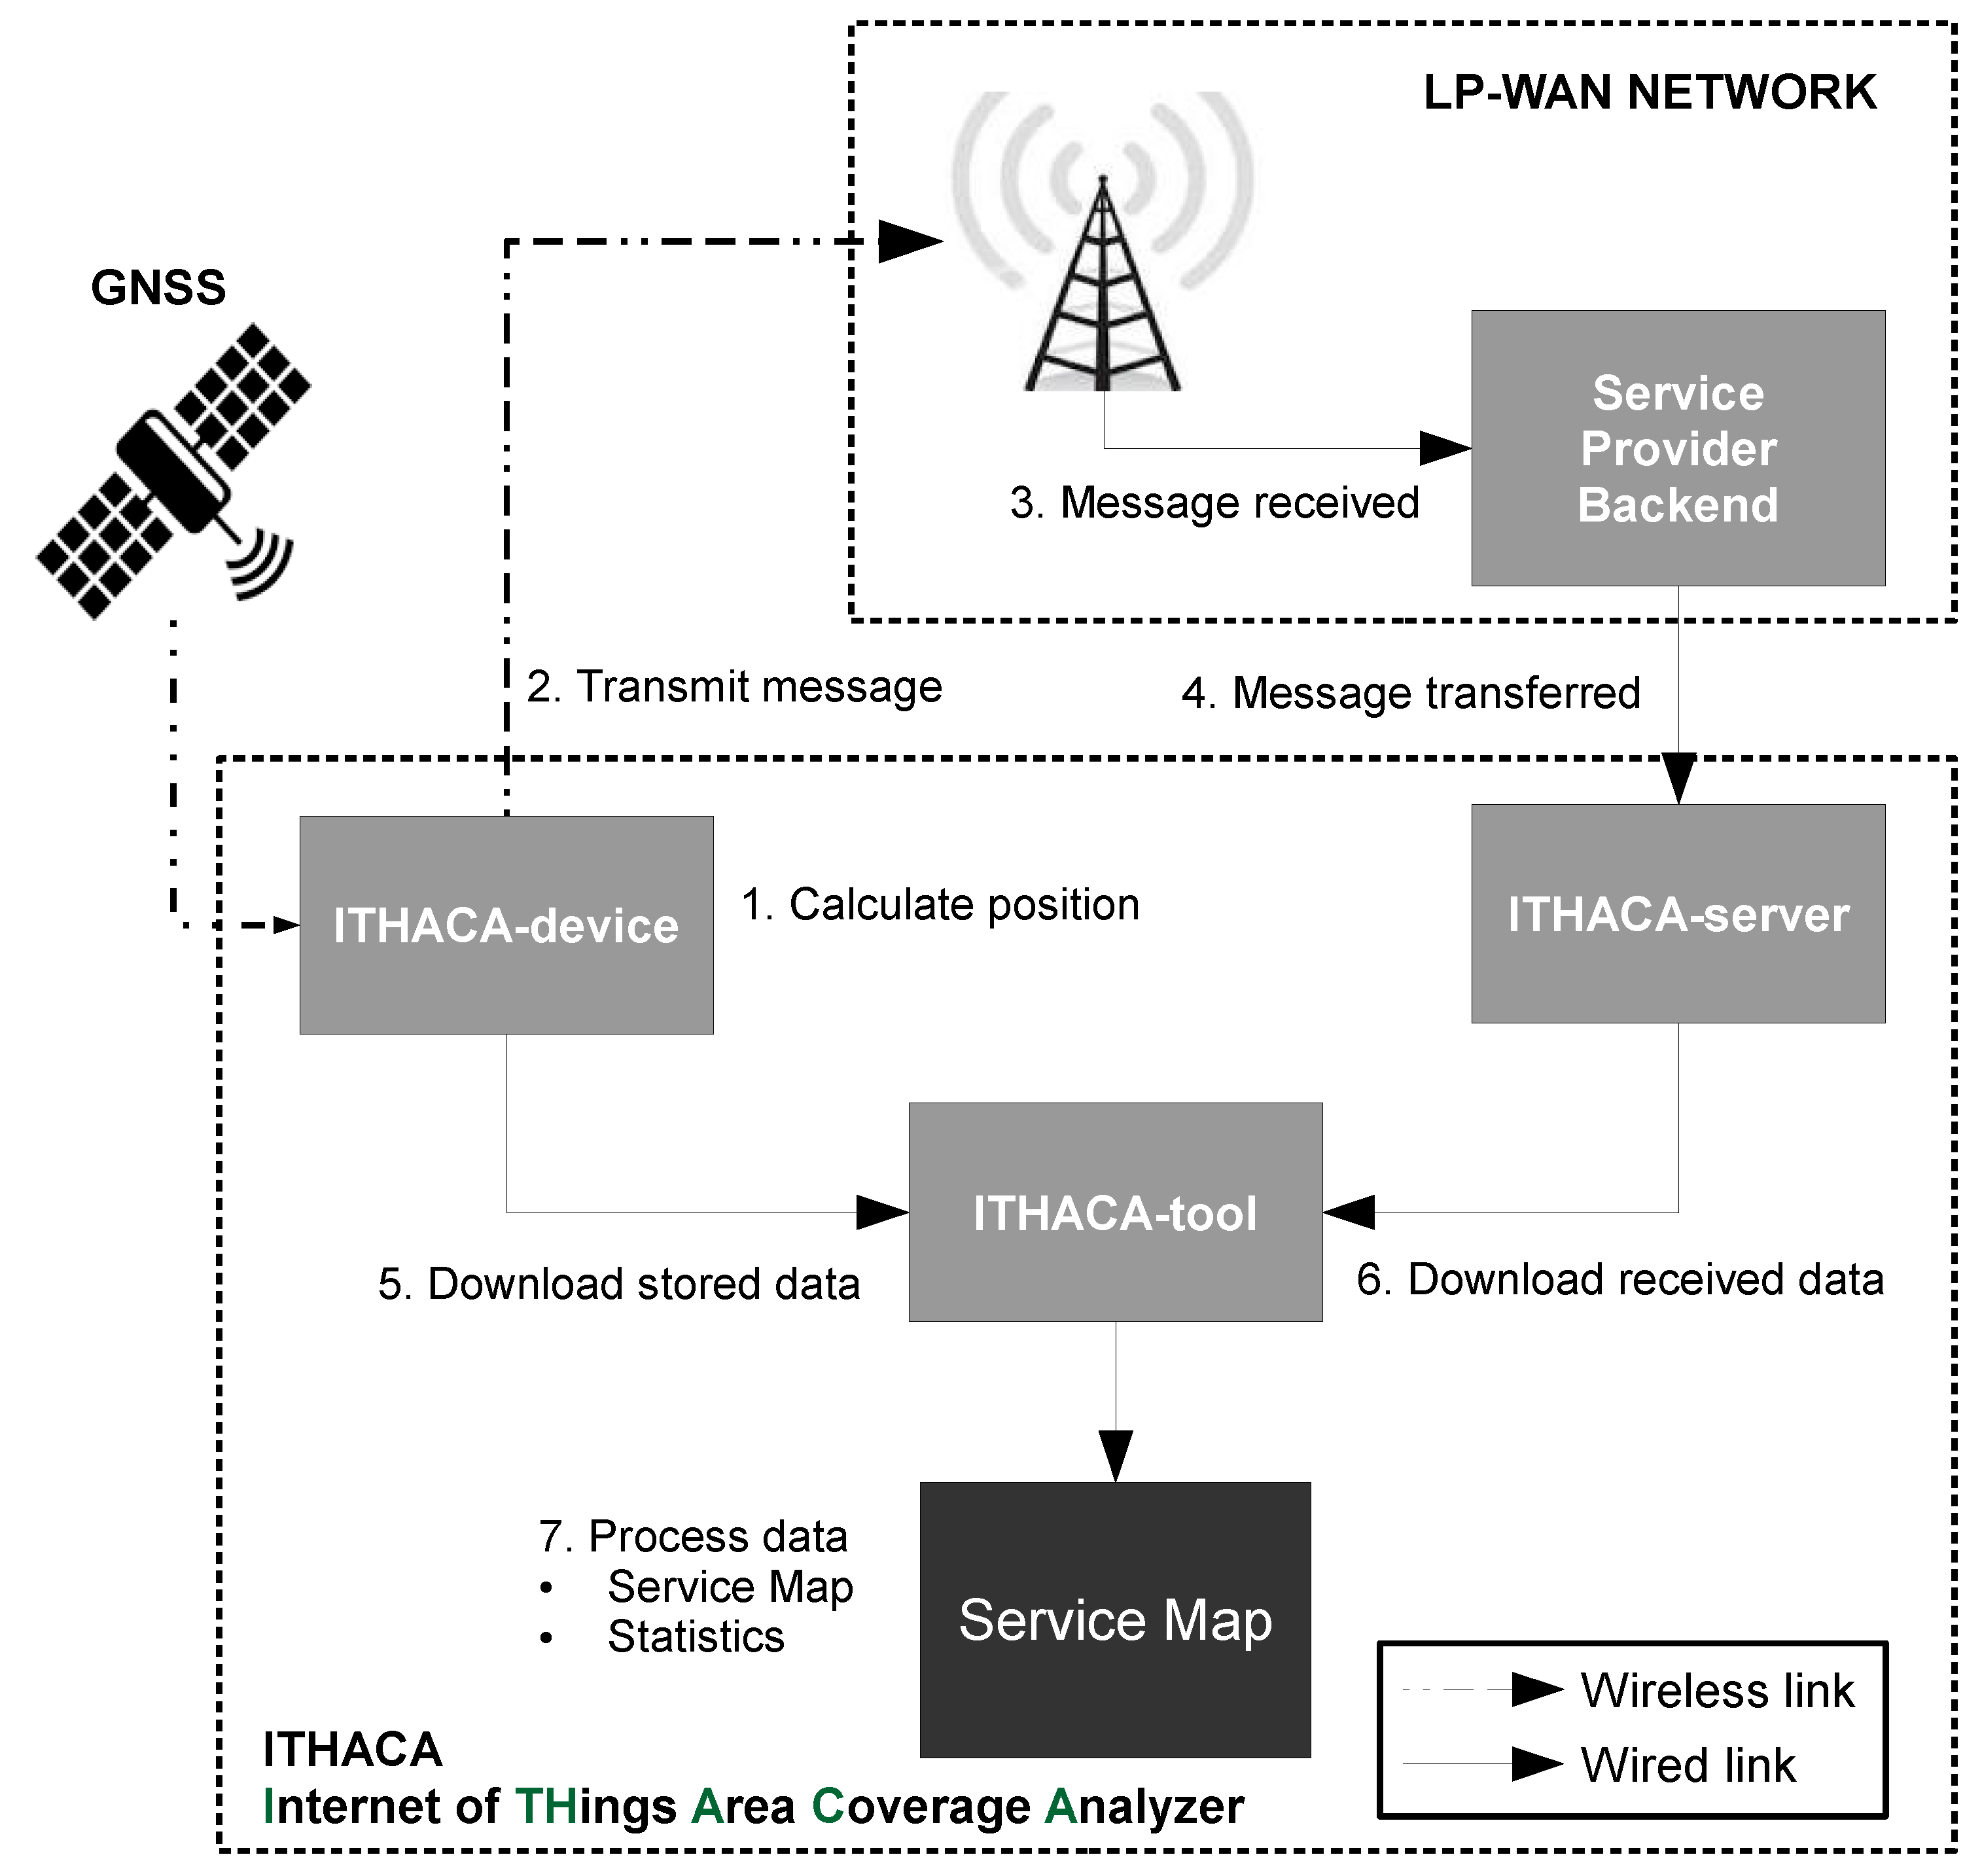
Figure 3.
ITHACA-device scheme.

Figure 4.
ITHACA prototype construction’s procedure. (a) Hardware elements; (b) Keyboard assembled; (c) Assembling communication layers; (d) Enclosing prototype.
Figure 4.
ITHACA prototype construction’s procedure. (a) Hardware elements; (b) Keyboard assembled; (c) Assembling communication layers; (d) Enclosing prototype.
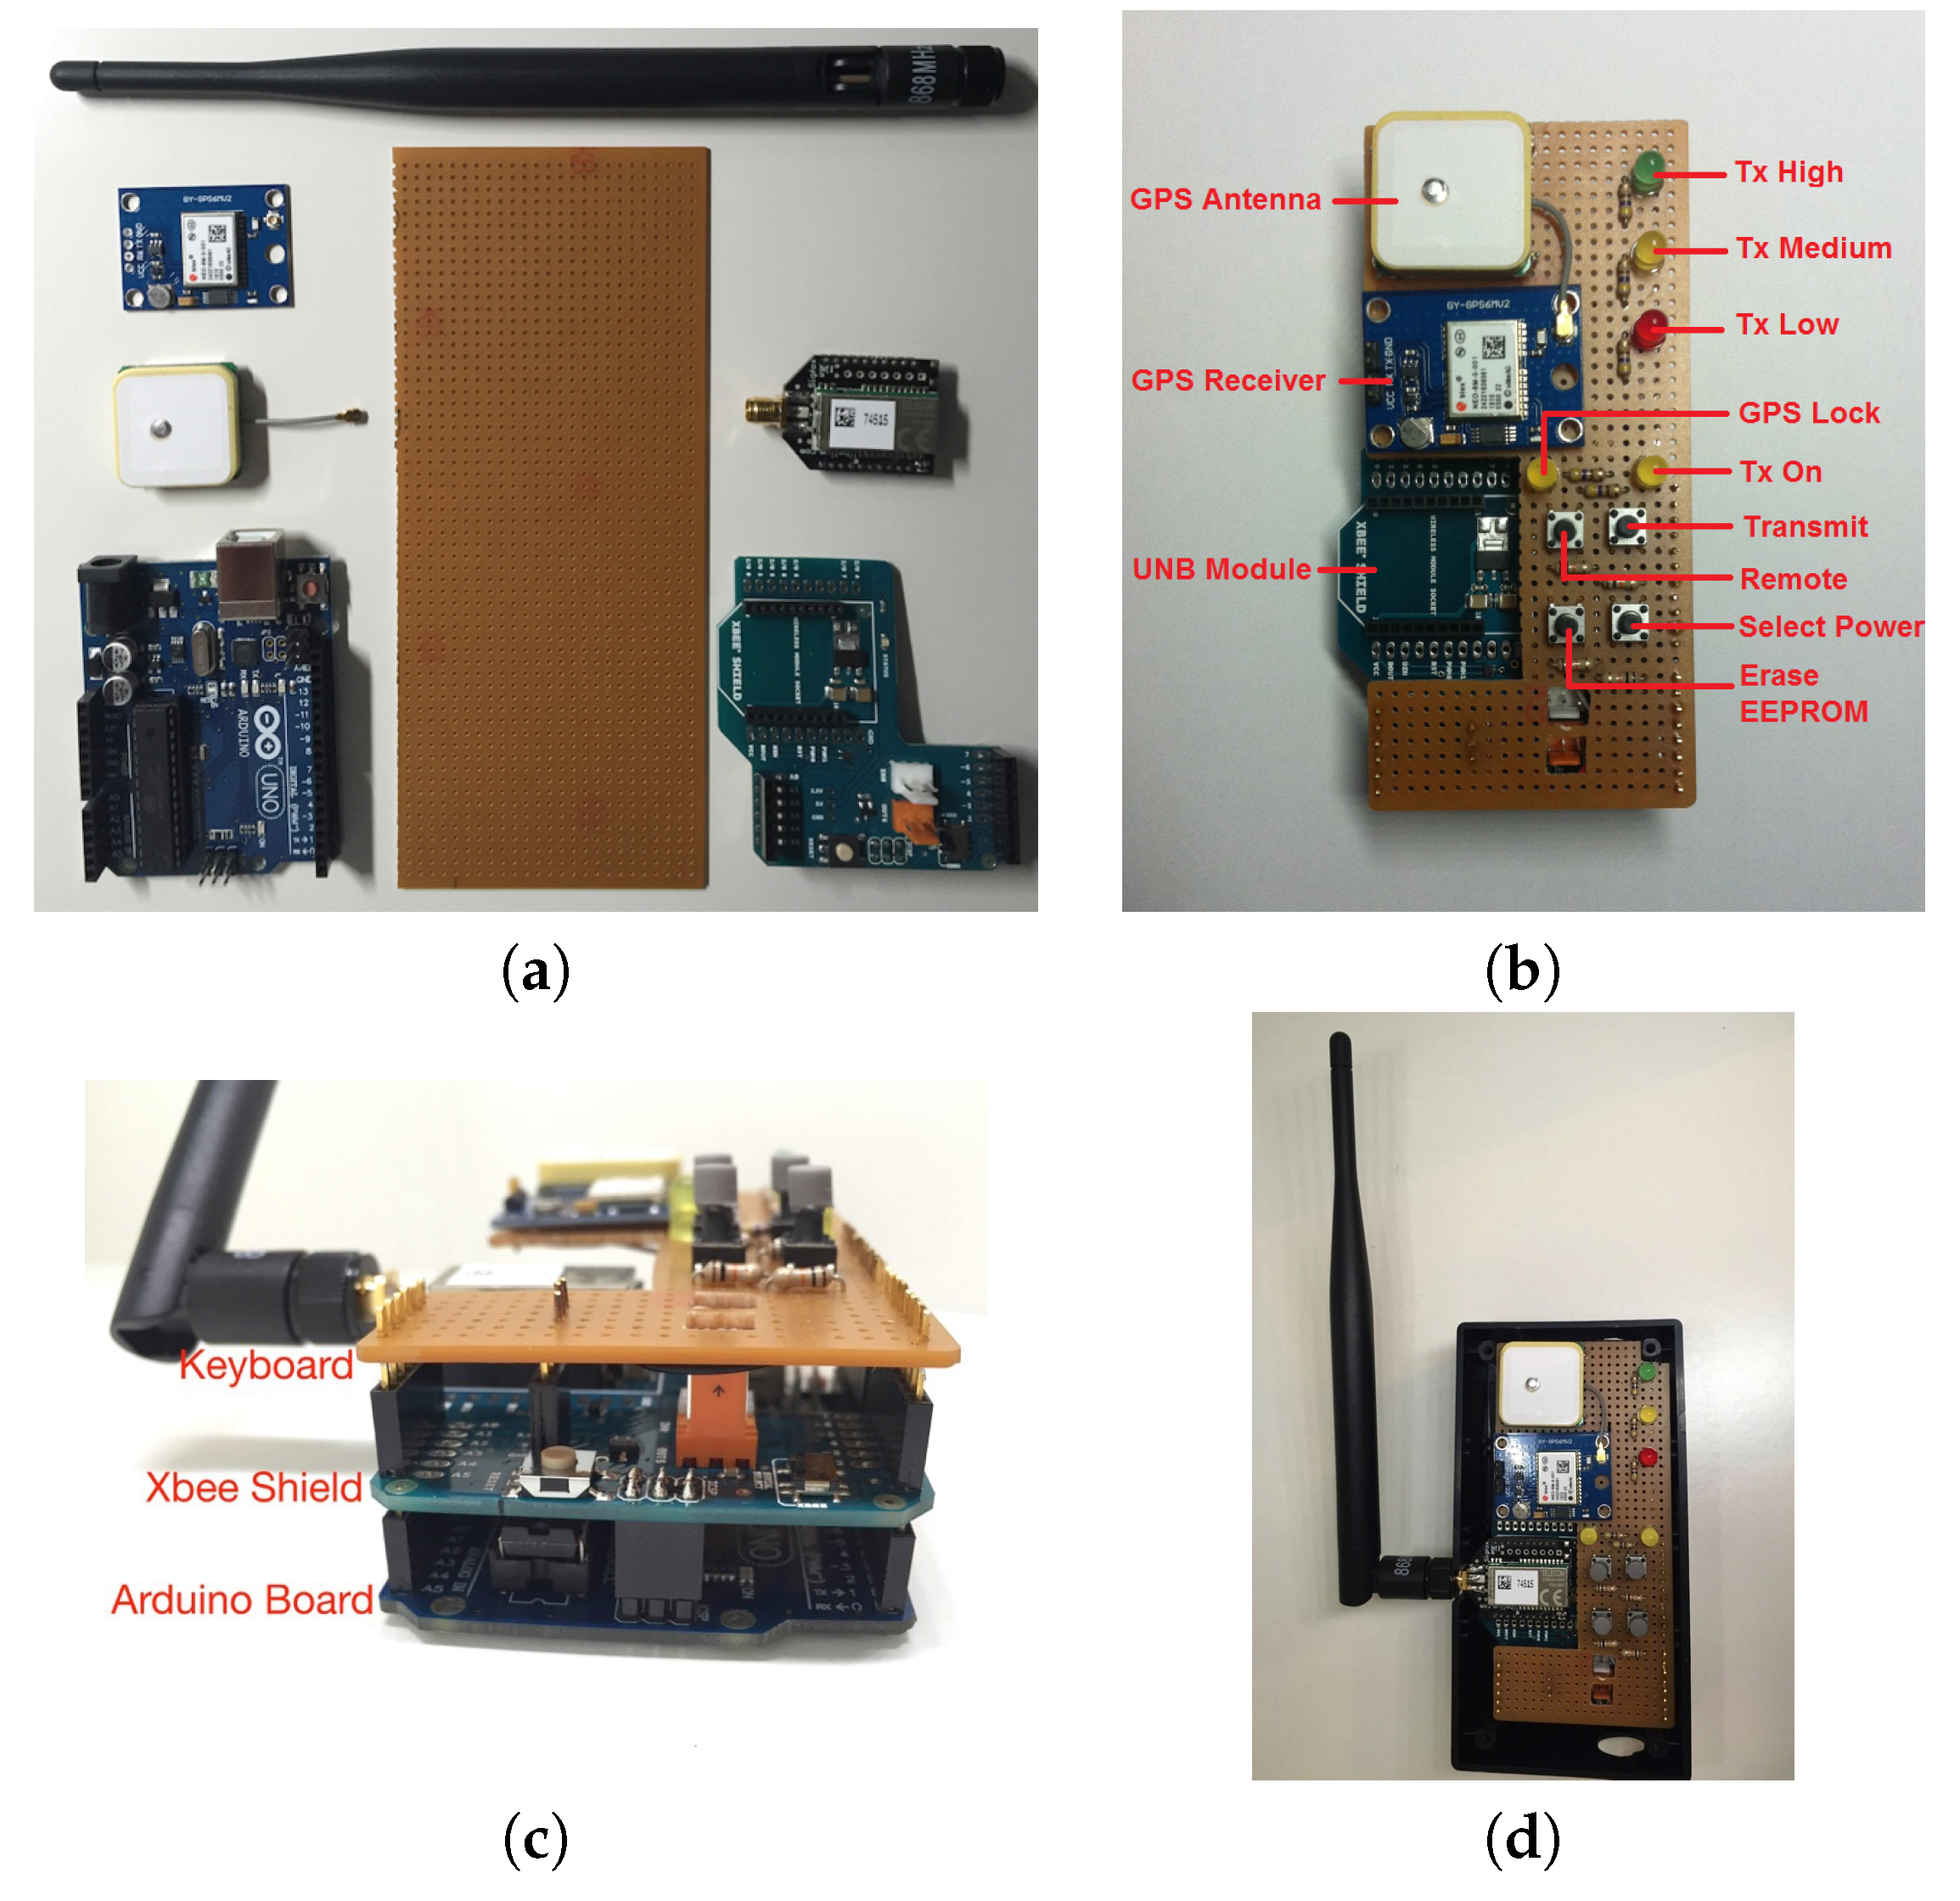
Figure 5.
ITHACA-tool scheme.
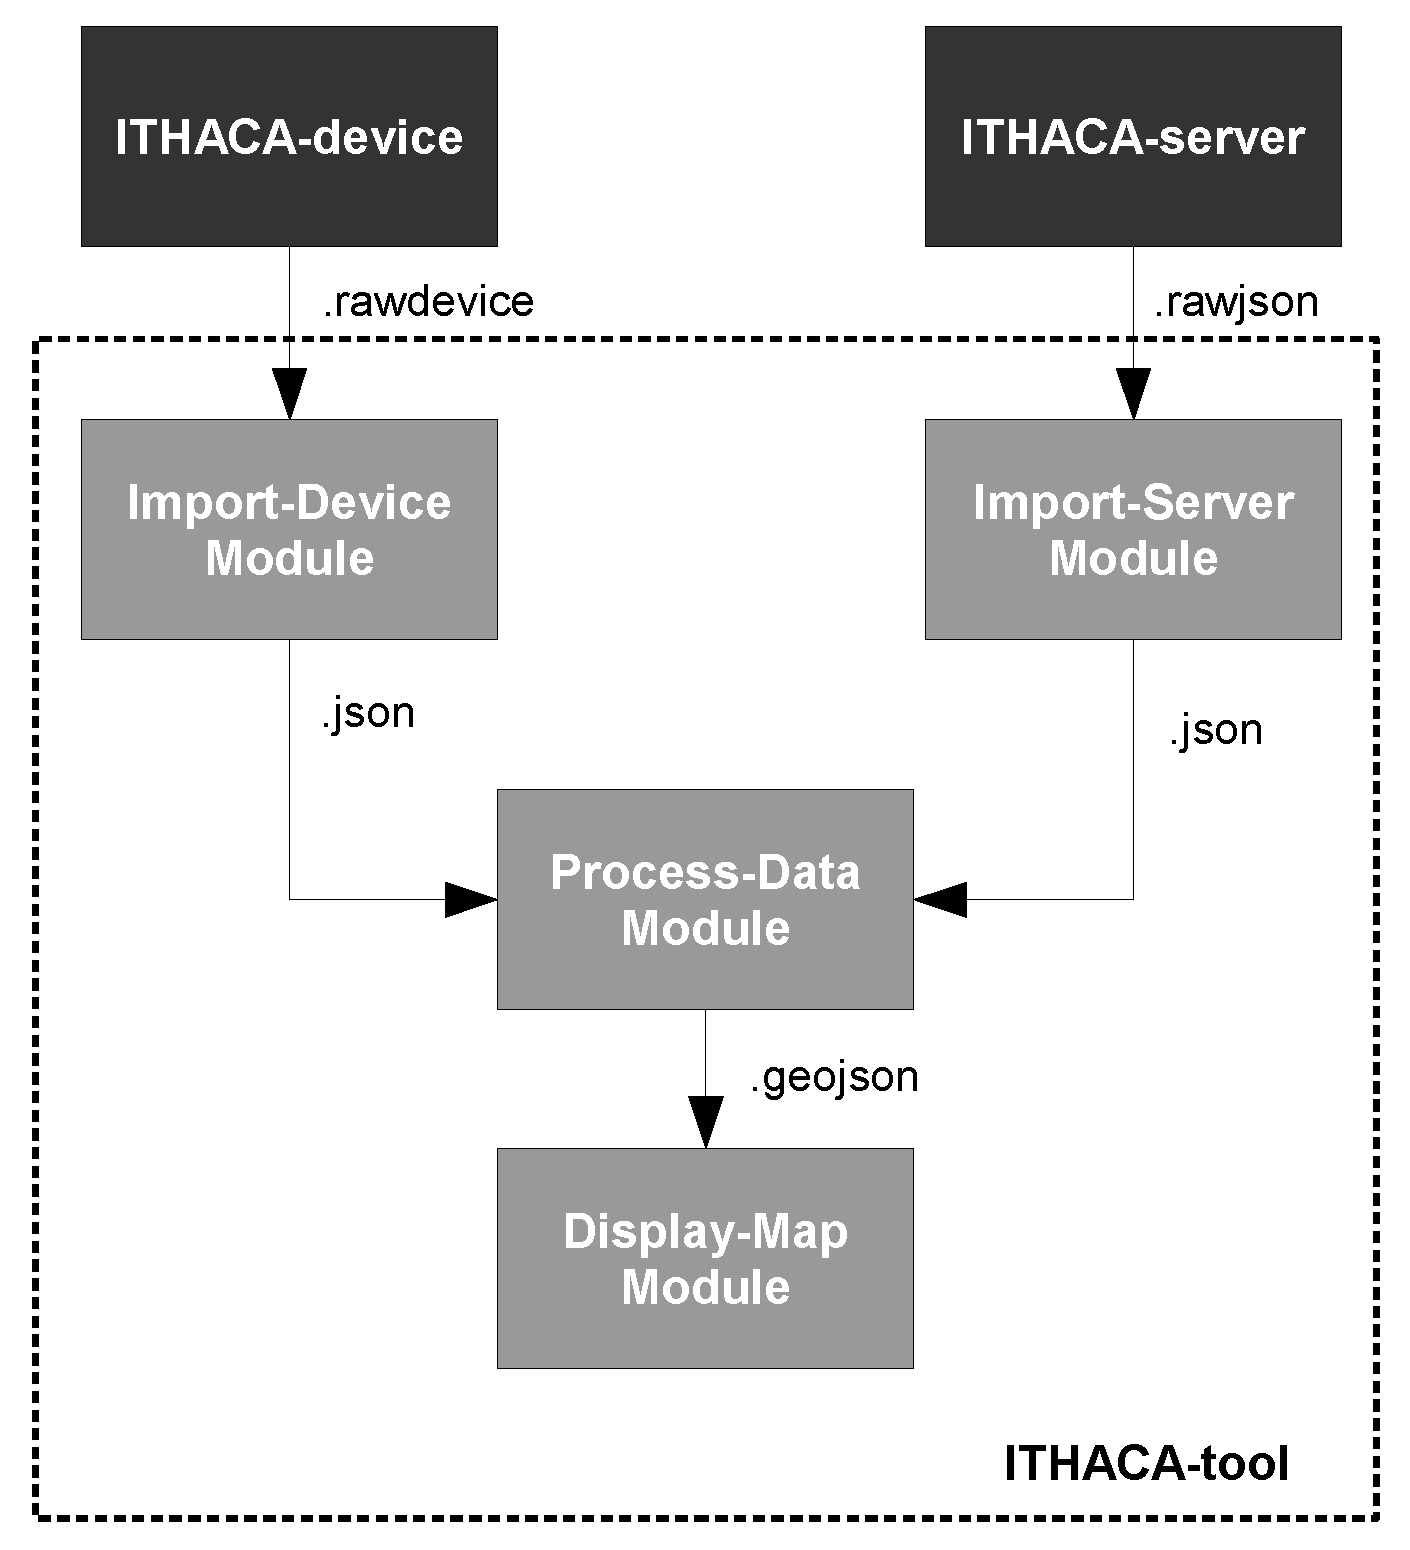
Figure 6.
ITHACA-tool environment. (a) Service Map tab; (b) Transmitted Data tab; (c) Received Data tab; (d) Process Data tab.
Figure 6.
ITHACA-tool environment. (a) Service Map tab; (b) Transmitted Data tab; (c) Received Data tab; (d) Process Data tab.
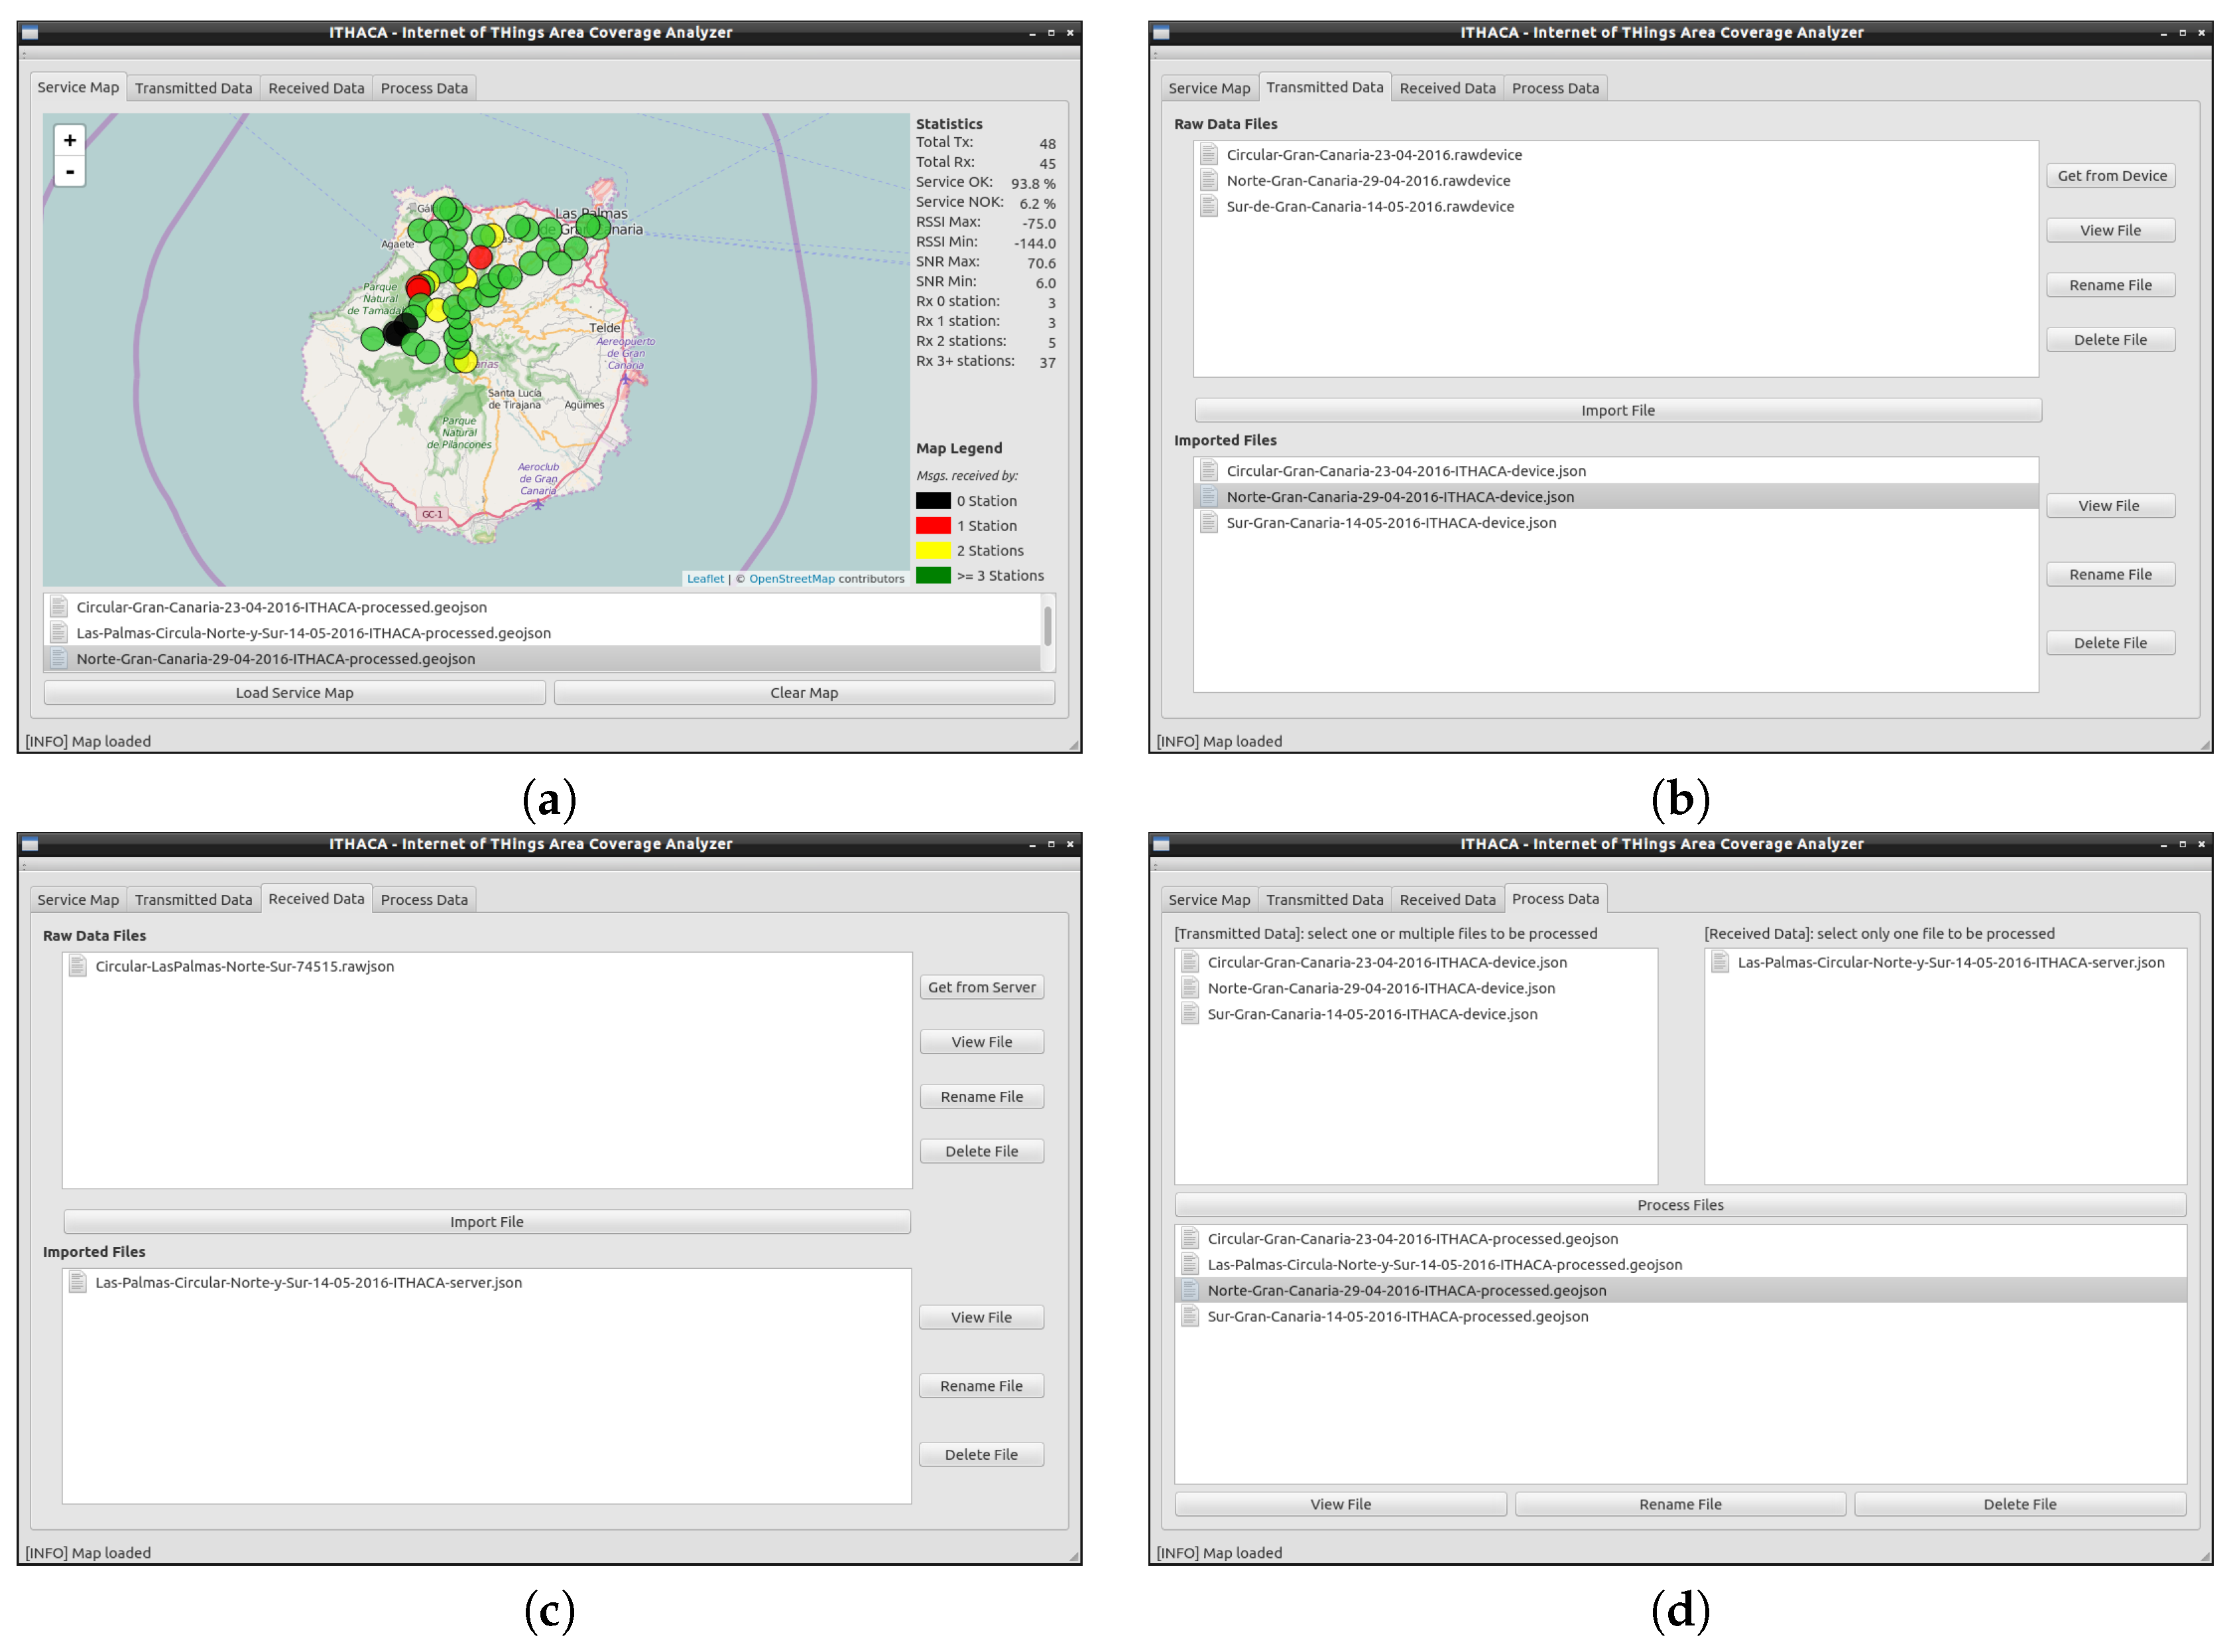
Figure 7.
RawJSON message format.

Figure 8.
JSON messages format. (a) JSON message format from ITHACA-device; (b) JSON message format from ITHACA-server.
Figure 8.
JSON messages format. (a) JSON message format from ITHACA-device; (b) JSON message format from ITHACA-server.

Figure 9.
GeoJSON message format.

Figure 10.
Urban/Rural area delimitation and measurement points.

Figure 11.
Elements used during the field trials. (a) ITHACA-device prototype; (b) Equipped motorbike to perform field trials.
Figure 11.
Elements used during the field trials. (a) ITHACA-device prototype; (b) Equipped motorbike to perform field trials.

Figure 12.
Service map tab from the ITHACA-tool showing the statistics of a measured point.

Figure 13.
Transmissions statistics in rural environments.

Figure 14.
Transmissions statistics in urban environments.

Figure 15.
Transmissions statistics in both the urban and the rural environments.

Figure 16.
Simulated coverage area provided by the service provider [2] with overlapped points from actual measurements.
Figure 16.
Simulated coverage area provided by the service provider [2] with overlapped points from actual measurements.

Table 1.
Comparison of LP-WAN technologies.
| Properties | Modulation | ||
|---|---|---|---|
| DSSS | CSS | UNB | |
| Range (km) | ≈15 | Rural: 10–15 Urban: 3–5 | Rural: 30–50 Urban: 3–10 |
| Frequencies (MHz) | 2400 | 868 (EU) 915 (US) | 868 (EU) 902 (US) |
| ISM band | Yes | Yes | Yes |
| Bidirectional link | No | Yes | Yes |
| Bit rate (Kbps) | 0.01–8 | 0.3–37.5 | 0.1 |
| Nodes per base station | ≈10 | ≈10 | ≈10 |
Table 2.
SIGFOXTM vs. GSM [20].
Table 2.
SIGFOXTM vs. GSM [20].
| Features | SIGFOXTM | GSM |
|---|---|---|
| Density of antennas to cover a city (1M inhabitants) | 3 | 60 |
| Density of antennas to cover a 1000 km2 rural area | 1–3 | 10–20 |
| Density of objects/Base station | High | Low |
| Radiated Power | Low | Medium to High |
| Typical stand-by-time (in years) for 2.5 Ah battery | 20 | 0.2 |
| Bit rate (kbps) | 0.1 | 9.6 (SMS) |
| Signal penetration into buildings | High | Medium |
| Modem cost estimation (with silicon integration) | Below 1 $ | 10 $ |
| Typical communications cost (yearly subs. + traffic per device) | <3 $ | 30 $ |
Table 3.
Crowdsourced signal strength applications.
| Website | Area | Technologies |
|---|---|---|
| OpenSignal [32] | Worldwide | 2G/3G/4G |
| OCU [33] | Spain | 2G/3G/4G |
| Cobertura Mòbil [34] | Catalonia (Spain) | 2G/3G/4G |
| SignalMap [35] | USA | Cellular |
| Nperf [36] | Worldwide | 2G/3G/4G/4G+ |
| Sensorly [37] | Worldwide | 2G/3G/4G/Wifi |
| Root Metrics [38] | Worldwide | Wireless |
Table 4.
Comparison functionalities between commercial field test device from SIGFOXTM and our proposed system.
Table 4.
Comparison functionalities between commercial field test device from SIGFOXTM and our proposed system.
| Functionality | ADEUNIS Field Test Device | ITHACA |
|---|---|---|
| Ability to transmit at the maximum power allowed by the regulation (14 dBm, device class 0U according to SIGFOX certification) | Yes | Yes |
| Automatic transmission at regular intervals | Yes | No |
| Ability to perform manual transmission | Yes | Yes |
| Message transmission with ACK request (Acknowledgment) | Yes | Yes |
| Message transmission without ACK request | No | Yes |
| GPS and Transmit Status Indicator | Yes | Yes |
| Ability to change transmitted power | No | Yes |
| Detachable Antenna | No | Yes |
| Internal storage capacity of transmitted data for further analysis | No | Yes |
| Presentation of points with coverage on map | Yes | Yes |
| Presentation of points without coverage on map | No | Yes |
| Ability to program the power to be transmitted | No | Yes |
| Software tool for analysis of coverage points and map generation | No | Yes |
| Presentation of the number of base stations covering the transmission point (redundancy level) | No | Yes |
| Presentation of maximum/minimum levels of the signal to noise ratio and of the power received by the base stations | No | Yes |
| Calculation of statistical data on a campaign of measures (percentage of points with service, redundancy, a total of points without coverage, etc.) | No | Yes |
Table 5.
Summary statistics.
| Parameter Under Study | Environment | ||
|---|---|---|---|
| Rural | Urban | Global | |
| Transmitted messages | 200 | 200 | 400 |
| Messages received by the SIGFOXTM network | 189 | 200 | 389 |
| Txs received by the SIGFOXTM network (%) | 94.5 | 100 | 97.25 |
| Txs not received by the SIGFOXTM network (%) | 5.5 | 0 | 2.75 |
| Maximum received signal (dBm) | –75 | –57 | –57 |
| Minimum received signal (dBm) | –147 | –144 | –147 |
| Maximum signal-noise ratio (dB) | 74.1 | 93.8 | 93.8 |
| Minimum signal-noise ratio (dB) | 3.9 | 6 | 3.9 |
| Txs not received for any base station | 11 | 0 | 11 |
| Txs received for only one base station | 21 | 0 | 21 |
| Txs received for only two base stations | 21 | 15 | 36 |
| Txs received for three or more base stations | 147 | 185 | 332 |
Table 6.
Results obtained by comparing the simulation and the field trials.
| Cases | # Spots in Rural Areas | # Spots in Urban Areas | # Spots in Total |
|---|---|---|---|
| Both field trial and simulation confirm coverage | 146 | 200 | 346 |
| Field trial confirms coverage but not simulation | 44 | 0 | 44 |
| Field trial does not confirm coverage but simulation does | 1 | 0 | 1 |
| Both field trial and simulation do not confirm coverage | 9 | 0 | 9 |
Table 7.
Simulated coverage area accuracy compared with actual field trials measurements.
| Metric | Rural Areas | Urban Areas | Total |
|---|---|---|---|
| Precision = TP/(TP+FP) | 0.993 | 1.000 | 0.997 |
| Recall = TP/(TP+FN) | 0.768 | 1.000 | 0.884 |
| Accuracy = (TP+TN)/(All) | 0.775 | 1.000 | 0.888 |
© 2017 by the authors. Licensee MDPI, Basel, Switzerland. This article is an open access article distributed under the terms and conditions of the Creative Commons Attribution (CC BY) license (http://creativecommons.org/licenses/by/4.0/).
Share and Cite
MDPI and ACS Style
Parada, R.; Cárdenes-Tacoronte, D.; Monzo, C.; Melià-Seguí, J. Internet of THings Area Coverage Analyzer (ITHACA) for Complex Topographical Scenarios. Symmetry 2017, 9, 237. https://doi.org/10.3390/sym9100237
AMA Style
Parada R, Cárdenes-Tacoronte D, Monzo C, Melià-Seguí J. Internet of THings Area Coverage Analyzer (ITHACA) for Complex Topographical Scenarios. Symmetry. 2017; 9(10):237. https://doi.org/10.3390/sym9100237
Chicago/Turabian StyleParada, Raúl, Daniel Cárdenes-Tacoronte, Carlos Monzo, and Joan Melià-Seguí. 2017. "Internet of THings Area Coverage Analyzer (ITHACA) for Complex Topographical Scenarios" Symmetry 9, no. 10: 237. https://doi.org/10.3390/sym9100237
Note that from the first issue of 2016, this journal uses article numbers instead of page numbers. See further details here.