Fishmeal Supplier Evaluation and Selection for Aquaculture Enterprise Sustainability with a Fuzzy MCDM Approach

1
Department of Business Administration, Nanjing University, Nanjing 210093, China
2
Department of Logistics and Shipping Management, Kainan University, Taoyuan 33857, Taiwan
*
Author to whom correspondence should be addressed.
Symmetry 2017, 9(11), 286; https://doi.org/10.3390/sym9110286
Submission received: 29 October 2017
/
Revised: 11 November 2017
/
Accepted: 14 November 2017
/
Published: 21 November 2017
(This article belongs to the Special Issue Fuzzy Techniques for Decision Making)
Abstract
:In the aquaculture industry, feed that is of poor quality or nutritionally imbalanced can cause problems including low weight, poor growth, poor palatability, and increased mortality, all of which can induce a decrease in aquaculture production. Fishmeal is considered a better source of protein and its addition as an ingredient in the aquafeed makes aquatic animals grow fast and healthy. This means that fishmeal is the most important feed ingredient in aquafeed for the aquaculture industry. For the aquaculture industry in Taiwan, about 144,000 ton/USD $203,245,000 of fishmeal was imported, mostly from Peru, in 2016. Therefore, the evaluation and selection of fishmeal suppliers is a very important part of the decision-making process for a Taiwanese aquaculture enterprise. This study constructed a multiple criteria decision-making evaluation model for the selection of fishmeal suppliers using the VlseKriterijumska Optimizacija I Kompromisno Resenje (VIKOR) approach based on the weights obtained with the entropy method in a fuzzy decision-making environment. This hybrid approach could effectively and conveniently measure the comprehensive performance of the main Peruvian fishmeal suppliers for practical applications. In addition, the results and processes described herein function as a good reference for an aquaculture enterprise in making decisions when purchasing fishmeal.
1. Introduction
On 17 September 2014, the Member States of the United Nations announced the Sustainable Development Goals (SDGs) as part of the 2030 Agenda for sustainable development. The 2030 Agenda set aims for the contribution and conduct of fisheries and aquaculture towards food security and nutrition, and the use of natural resources to ensure sustainable development in economic, social, and environmental terms. According to statistics from the Food and Agriculture Organization (FAO) of the United Nations, aquaculture provided only 7% of fish for human consumption in 1974, but this share has since increased to 26% in 1994, and 44% in 2014. Aquaculture has seen an impressive growth in the supply of farmed fish, which overtook that of wild-caught fish for human consumption in 2014 [1]. This makes the aquaculture industry an important source of aquatic food. Taiwan is one of the top 25 countries in this industry with a total production of 340,600 tons and ranked 19th in 2014 [1].
Aquafeed is a very significant factor for production in the aquaculture industry and it accounts for about 40–60% of the cultivation cost. In addition, the feed quality and its nutrient content greatly affects the growth of aquatic animals as poor-quality feed or nutrient imbalances can cause low weight, poor growth, feed inefficiency, and increase the mortality rate. Therefore, it is very important to choose the best source of feed for sustainable development in aquaculture production. Fishmeal is considered the most nutritious, digestible source of protein for farmed-fish feed. Fishmeal is added to the aquafeed to ensure that the aquatic animals grow fast and healthy, and can improve the quality of the related aquaculture products. Effective screening of the source of this important raw material is necessary to maintain the quality of related products and establish inherent goodwill in the industry. Therefore, an aquaculture enterprise cannot consider price alone as the major consideration for procurement. Meeting the required quality, supplying the appropriate quantity, timely delivery, and long-term partnerships are all factors that should be considered for the evaluation and selection of fishmeal vendors. Taiwan’s aquaculture industry imported about 144,000 ton/USD $203,245,000 of fishmeal from Peru, India, Thailand, and Vietnam in 2016. Peru is not only the world’s leading exporter of fishmeal, but also the largest supplier for Taiwan’s aquaculture industry. However, there are many suppliers of fishmeal in Peru and their supply capacity, product quality, delivery term, and cooperative attitude all vary. Therefore, setting up practical evaluation criteria and a method for the evaluation and selection of fishmeal suppliers from Peru would be helpful for Taiwan’s aquaculture enterprises. An example of raw material supplier selection is also given to demonstrate the proposed solution to this kind of problem.
The problems of supplier evaluation and selection have received considerable attention in academic study and in practice. Numerous multiple criteria decision making (MCDM) approaches have been proposed to tackle the problem such as the analytic hierarchy process (AHP), analytic network process (ANP), mathematical programming, technique for order preference by similarity to ideal solution (TOPSIS), preference ranking organization method for enrichment of evaluations (PROMETHEE), VlseKriterijumska Optimizacija I Kompromisno Resenje (VIKOR), and hybrid or extended fuzzy approaches (see Table 1) [2,3,4,5,6,7,8,9,10,11,12,13,14,15,16,17,18,19,20,21,22,23,24,25,26,27,28,29,30,31,32]. Amongst these methodologies, many approaches have used criteria weightings that have been determined by subjective evaluations by decision makers or experts for pairwise comparison or direct rating methods. Furthermore, for the VIKOR method, Opricovic and Tzeng [33] have described the advantages of its theory, and Opricovic and Tzeng [34] have compared it with other outranking methods, both of which illustrate the benefits of VIKOR. Therefore, to reduce uncertainties arising from subjective factors, this work adopted the entropy method to objectively determine the criteria weights. Then, based on the entropy weightings, the VIKOR approach was applied to process the performance rating of the alternatives. In addition, to capture and handle the human appraisal of ambiguity, uncertainty, and subjectivity, linguistic variables in the fuzzy sets were integrated into the supplier evaluation and selection process. This hybrid fuzzy MCDM technique was applied to evaluate and select fishmeal suppliers from Peru for Taiwan’s aquaculture enterprise. The VIKOR approach was used based on weightings obtained with the entropy method in a fuzzy decision-making environment. The advantage of this approach was that we only needed to evaluate the merits of the alternatives based on linguistic variables under each criterion. These linguistic variables were converted into scores, which were then utilized to calculate the fuzzy entropy weights to help clarify the importance of the criteria. These weights were then applied with the fuzzy VIKOR approach to derive a comprehensive performance evaluation for the complex supplier selection problem. Thus, the overall scores for each supplier in each criterion can be obtained, and the selection decision made accordingly. This method is more effective and convenient in practical applications and provides better decision-making quality. This paper also discusses an empirical case study to demonstrate how an aquaculture enterprise can implement this solution. The results and processes provide a good reference to assist an aquaculture enterprise in Taiwan in the making of fishmeal purchasing decisions.
The remainder of this paper is organized as follows. In Section 2, the criteria for raw material supplier selection are identified. In Section 3, the research methodology including fuzzy entropy and fuzzy VIKOR is introduced. Section 4 includes the numerical case study that uses a Taiwan aquaculture enterprise as an example, thus demonstrating the process of fishmeal supplier evaluation and selection from the proposed model, the procedure, and method. The results of the empirical research are also analyzed. In Section 5, some conclusions are offered.
2. Criteria for Fishmeal Supplier Selection
Supplier selection is the process of finding appropriate suppliers who are able to provide the buyer with the right quality products and/or services at an acceptable price and delivery time, and in the required quantities. This is one of the most critical activities in establishing an effective supply chain. Obviously, supplier selection is a multiple criteria decision making (MCDM) problem affected by several conflicting factors such as price, quality, delivery, and so on.
Historically, several methodologies have been developed for evaluating, selecting, and monitoring potential suppliers that take into account factors such as quality, logistics, and cost. Dickson [35], in one of the well-known studies on supplier selection, identified 23 important evaluation criteria for supplier selection. Barbarosoglu and Yazgac [36] helped a company find the proper supplier by adopting Dickson’s criteria to evaluate supplier performance. In recent years, a number of researchers have begun to identify some of the relevant criteria. Ng [37] constructed a simple and effective supplier evaluation model to deal with problems of supplier selection with supply variety, quality, delivery, and price as the evaluation criteria. Shemshadi et al. [17], Chen et al. [5], Boran et al. [12], and Yang et al. [10] identified product quality, effort to establish cooperation, the supplier’s technical level, delay on delivery, price/cost, profitability of supplier, relationship closeness, technological capability, conformance quality, conflict resolution, delivery performance, supplier profile, and risk as factors for determining the best supplier. Chen and Kumar [38] established an evaluation model to obtain the best supplier with the result to be given to a company as a strategy reference. They proposed the following five criteria: overall cost of the product, quality of the product, service performance of supplier, supplier’s profile, and risk factor. By consolidating several studies, Sanayei et al. [16] proposed five categories: product quality, on-time delivery, price/cost, supplier’s technological level, and flexibility. Shyur and Shih [39] introduced evaluation indictors including on-time delivery, product quality, price/cost, facility and technology, responsiveness to customer needs, professionalism of salespeople, and quality of relationship into the supplier evaluation process. Ávila et al. [40] defined product cost, financial stability, synergy potential, logistics cost, payment flexibility, after sales service cost, and production capacity as supplier evaluation criteria. There have been a significant number of studies discussing supplier selection and a wide range of mathematical methods have been used to provide solutions for supplier selection, as shown in Table 1.
In this study, based on the principles espoused in [35] and in consultation with the management team of a typical aquaculture company in Taiwan, we listed 22 factors that are often used for evaluating fishmeal suppliers in Taiwan’s aquaculture enterprise. To evaluate the importance of the factors from an expert viewpoint, questionnaires with responses given in the seven-point Likert scale (from one to seven) were used collect expert opinions, with preferences of very unimportant, essentially unimportant, weakly unimportant, fair, weakly important, essentially important, and very important. Seventeen experts with many years of work experience in Taiwan’s aquaculture industry were invited to evaluate the importance of these 22 factors. The demographic information of these 17 respondents is summarized in Table 2. The Cronbach’s α was 0.918, which represents excellent internal consistency reliability. The Kaiser-Meyer-Olkin (KMO) measuring sampling adequacy provides an index (between 0 and 1) of the proportion of variance among the variables that might be common variance. A high KMO indicates that sampling is adequate, indicating the existence of a statistically acceptable factor solution representing relationships between the parameters. In our study, the Kaiser-Meyer-Olkin (KMO) value was found to be 0.689, which was better than the suggested value of 0.6 [41]. The factors, as well as the importance of the factors, are summarized in Table 3. The importance values of the 22 factors fell in a range between 5.000 and 6.647. When the importance of factors was identified, it was unrealistic to consider all of the factors simultaneously given the limited time and resources. To improve the evaluation and selection process, 10 major factors were determined as the evaluation criteria given higher priority after discussion with the management team: “Stability of product quality”; “Stability of supply capability”; “Reasonableness of quoted price”; “Financial capability and condition”; “Flexibility in changing shipment schedule”; “Potential cooperation in the future”; “Operating control of pre-delivery”; “Satisfaction with claims for damages”; “Exactness for presenting documents to the bank”; and “Control capability of on-time delivery”, as shown in Table 4.
3. The Proposed Method
In the process of decision-making, decision-makers often make subjective judgments based on their own knowledge and experience in ambiguous or vague statements, such as good, poor, important, not important, and so on, given in linguistic terms. To deal with the ambiguity and subjectivity of human judgment, linguistic variables have been introduced with these judgments expressed by a membership function within a closed interval of [0, 1] as in fuzzy set theory [42]. Bellman and Zadeh [43] proposed a methodology for decision-making in a fuzzy environment to resolve the lack of precision in assigning the degree of importance of evaluation criteria and the ratings of alternatives based on the evaluation criteria. In this section, we introduce the concepts and processes used to define the linguistic variables, to calculate the entropy weights, and the VIKOR procedure.
3.1. Linguistic Variables and Fuzzy Numbers
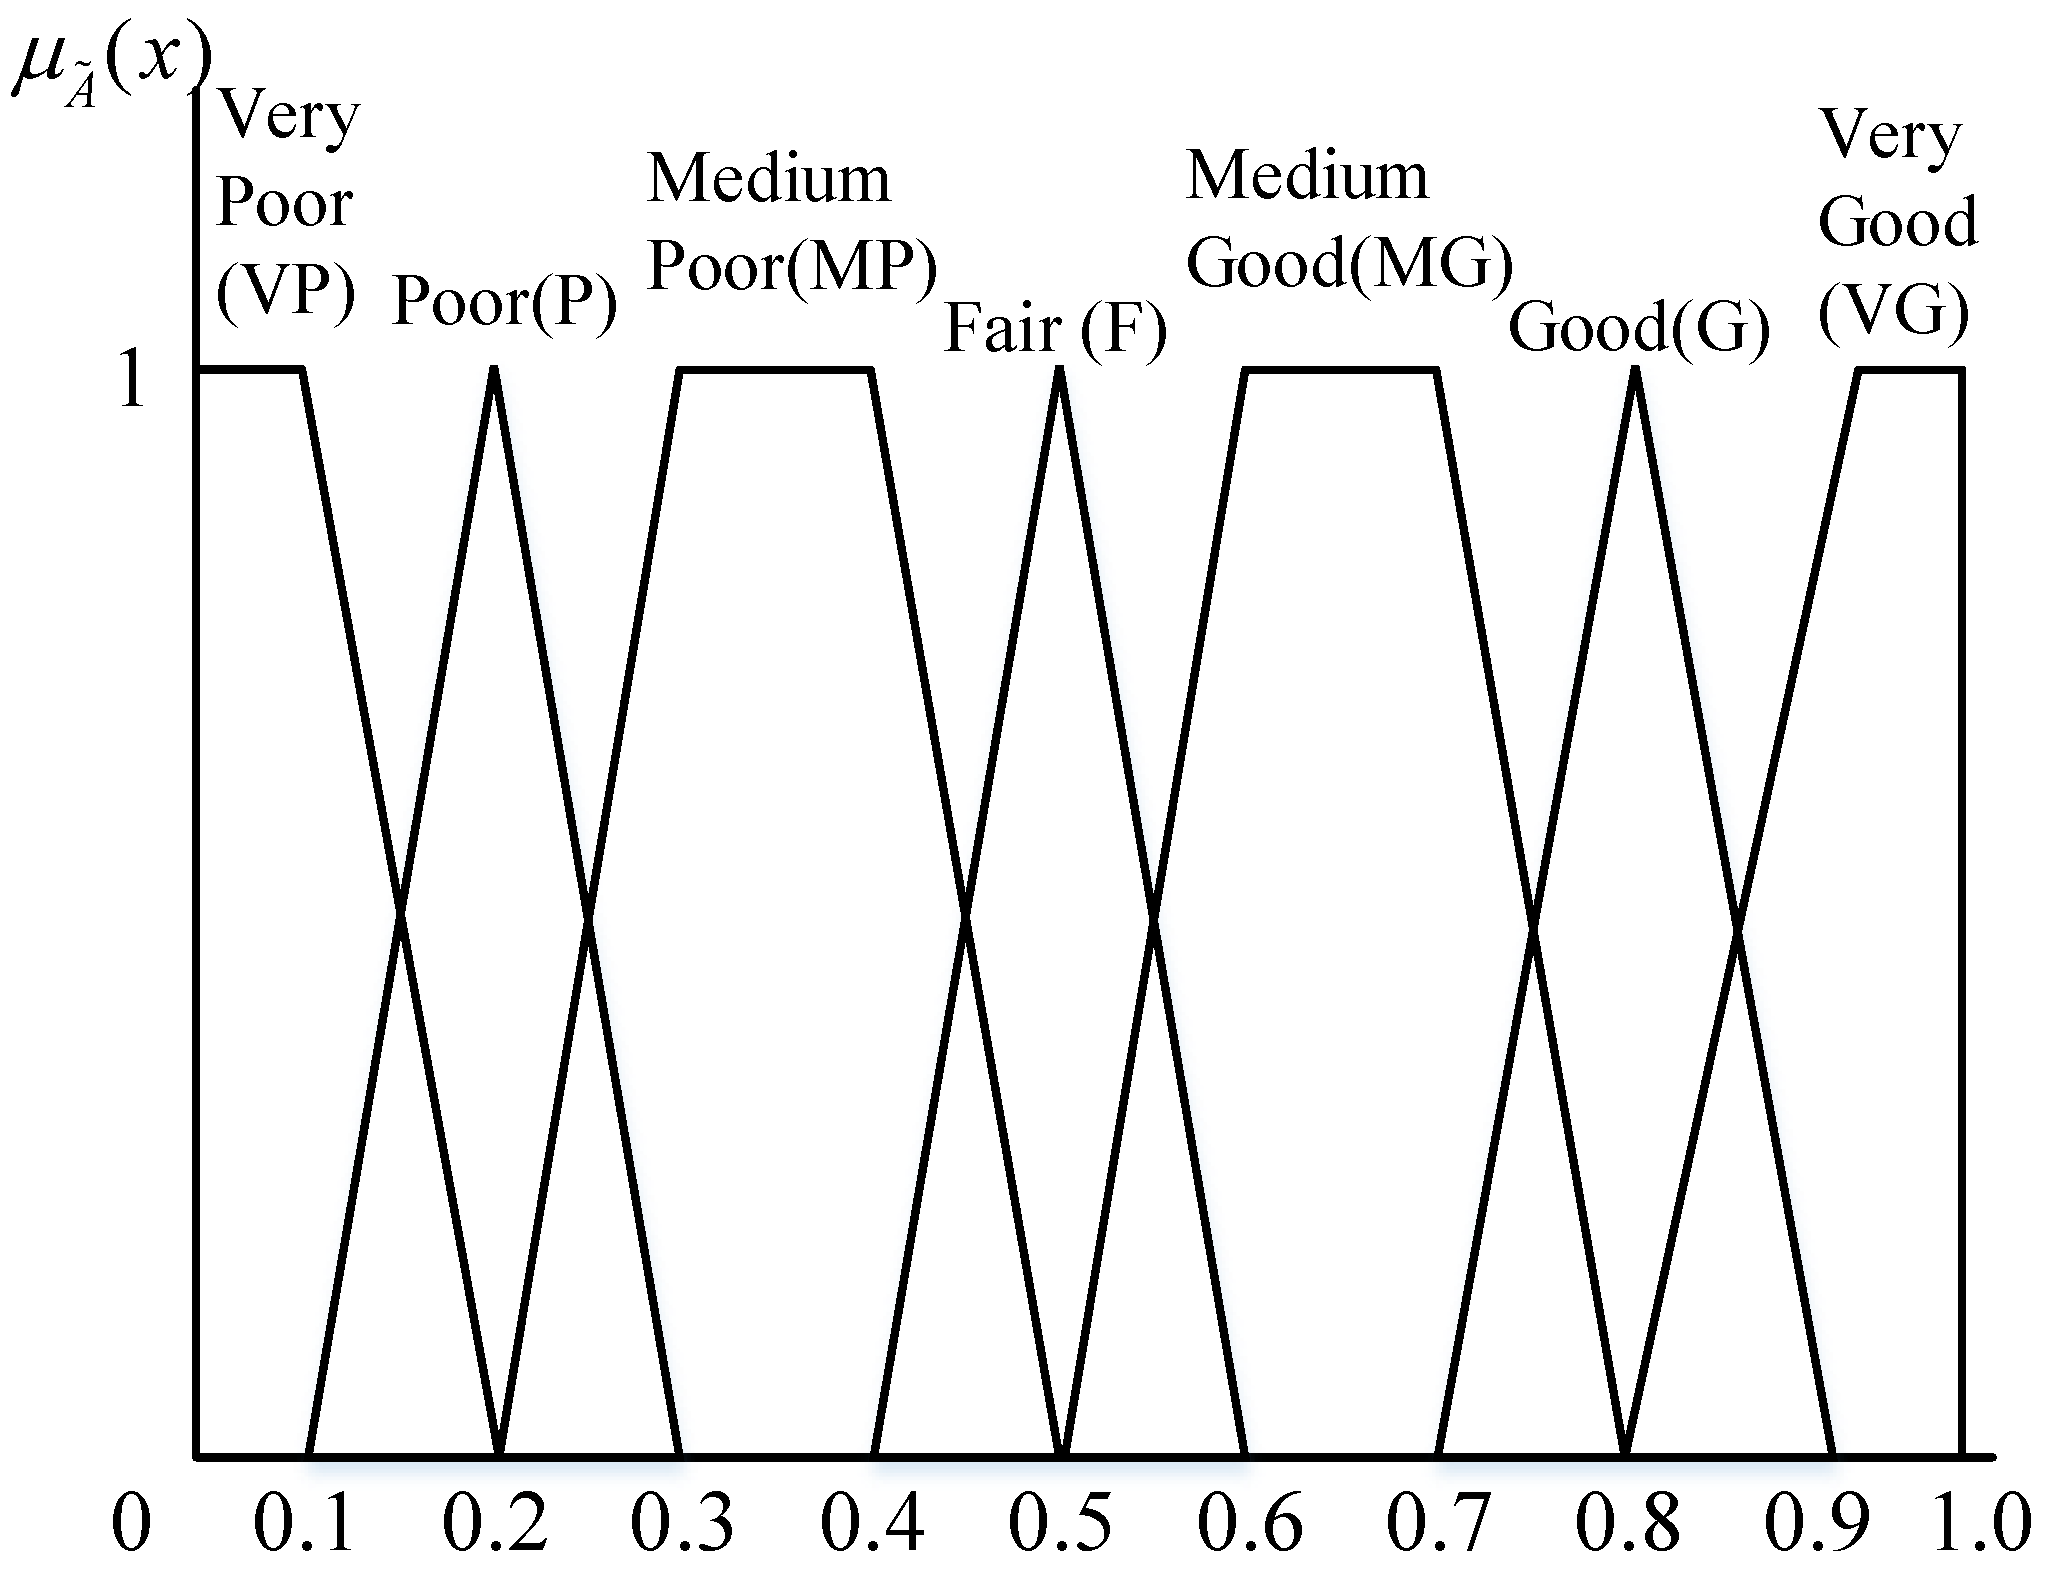
A linguistic term or linguistic variable is one whose value is given by words or sentences expressed in a natural language. In this study, we used these kinds of expression in linguistic terms to evaluate the performance of selected alternatives regarding each criterion: “Very poor”, “Poor”, “Medium poor”, “Fair”, “Medium good”, “Good”, and “Very good”, with respect to a trapezoidal fuzzy number (TFN) as proposed by [16,44]. A TFN is a fuzzy set on if its membership function is a mapping . The membership function of a fuzzy number can be described as follows:
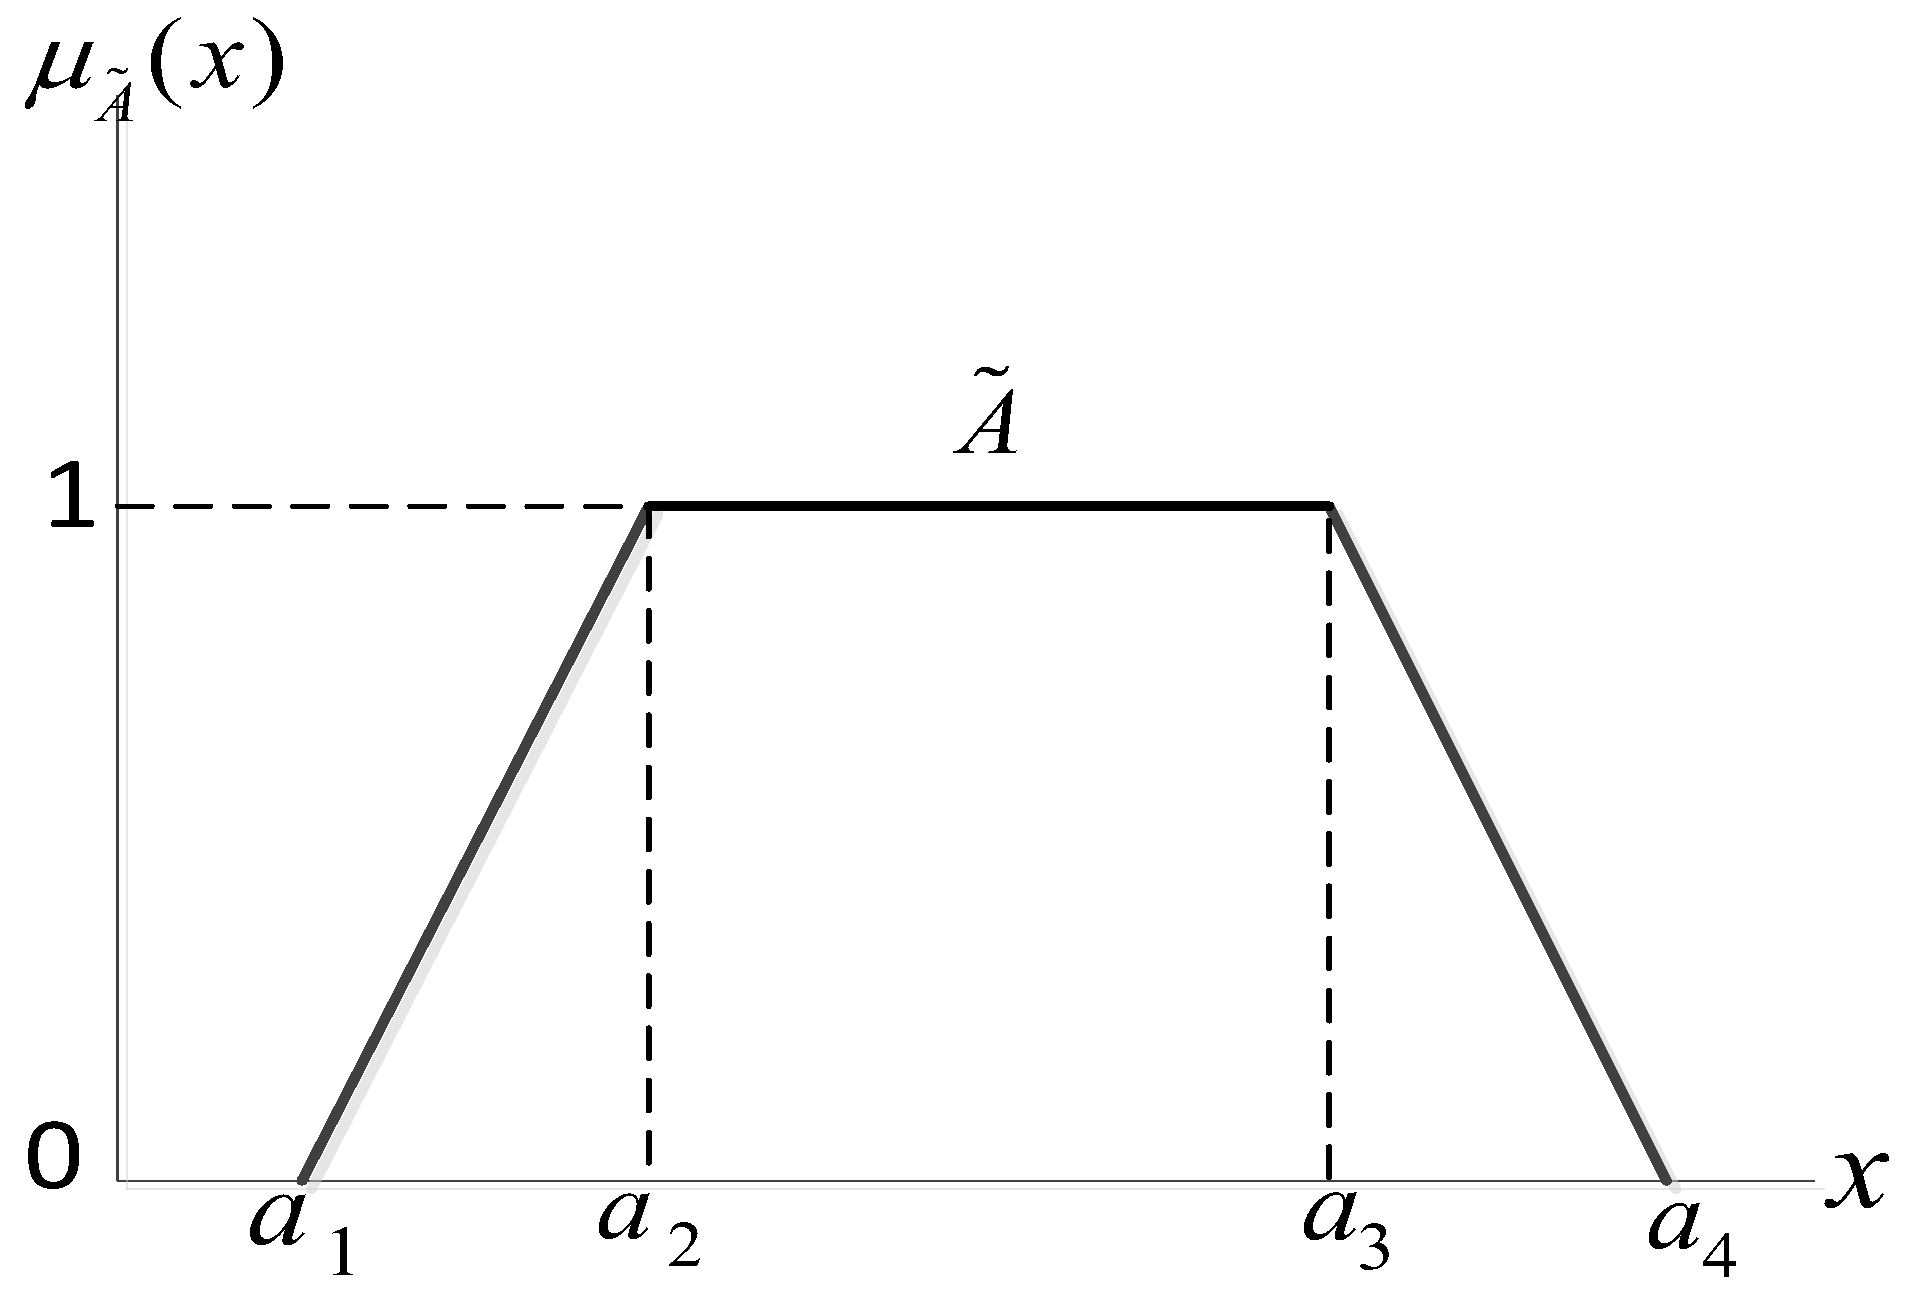
The trapezoidal fuzzy number can be denoted by , where which denotes the smallest possible, the most promising, and the largest possible values, respectively, as shown in Figure 1. Table 5 and Figure 2 show the corresponding TFN for each linguistic variable.
The algebraic operations for the two TFNs (addition, subtraction, multiplication, division and reciprocity) applied in this study were based on the arithmetic of special fuzzy numbers as introduced by [44].
After the evaluation process in the fuzzy environment, the results are still in the fuzzy number format. Therefore, it is necessary to further conduct defuzzification to transform the fuzzy numbers to crisp numbers. Based on the center of area (COA) method, TFN was defuzzified to a crisp value () as the centroid value of TFN , as follows:
3.2. Group Decision Making
A good decision-making process is not only comprised of arbitrary decisions made by individuals, but also requires a combination of professional judgments. In this study, for the sustainable management of an enterprise, we developed a method for the evaluation and selection process of fishmeal suppliers to obtain the appropriate and correct results. The group multiple criteria decision making (GMCDM) method includes the following elements: (1) m possible suppliers, ; (2) n evaluation criteria, ; and (3) k decision-makers, . The performance evaluation matrix of the supplier with respect to criteria by decision-maker using the fuzzy linguistic assessment variables can be constructed as follows:
where .
Therefore, for the k decision makers conducting the group evaluation process, the aggregated fuzzy performance rating of alternatives with respect to each criterion as an integrated fuzzy decision matrix can be calculated as:
where
3.3. Determination of Criteria Weightings
Shannon [45] introduced the concept of entropy into information theory, which is used to measure information and uncertainty, and to characterize and signal uncertainty for the information sources. If the entropy of an evaluation criterion is smaller, the amount of information provided by the criterion is greater, and the greater the role in the comprehensive evaluation process, the higher the weight. The entropy weight method mainly uses the uncertainty represented by the entropy value as determined by information theory to calculate the decision information that can be transmitted by each evaluation criterion, then obtains the relative weights between the criteria. The relative weight calculated by the entropy weight method is obtained by using the evaluation information for each alternative under each evaluation criterion where there are no subjective factors. In other words, this is an objective weight. For this study, the processes of computing entropy weights were as follows:
- (1)
- According to the established fuzzy decision evaluation matrix , the fuzzy decision evaluation matrix was defuzzified to a crisp value matrix bywhere
- (2)
- Normalize the evaluation matrix:
- (3)
- Calculate the Shannon entropy value of each evaluation criterion:
- (4)
- The entropy weights of each evaluation criterion were found as follows:
3.4. Evaluation and Selection of Alternatives
The VIKOR method proposed by [46] is one of the optimal compromise solution methods used in multiple criteria decision making. The basic concept is to define the positive ideal solution and the negative ideal solution. The so-called positive ideal solution refers to the best alternatives with respect to each evaluation criterion, while the negative ideal solution consists of the worst alternatives for each evaluation criterion. The alternatives are then prioritized by comparing the evaluation values of each alternative with their closeness to the positive ideal solution. To calculate the closeness of the alternatives to the positive ideal solution, the values of the evaluation criteria must be aggregated. In VIKOR, the aggregating function was developed from the Lp-metric through a compromise programming method [47] that focuses on ranking and selecting from a set of alternatives to determine a compromise solution that provides the maximum group utility for the majority, and a minimum of individual regret for the opponent, which can help the decision makers reach a final decision. The processes of applying VIKOR for alternative selections are as follows:
- (1)
- Determine the evaluation values of the best and the worst alternatives/suppliers for each criterion j: and
- (2)
- Compute the weighted distance ratio to the best value for every alternative/supplier with respect to each criterion: Si and Ri
- (3)
- Compute the values Qi as follows:Si is the weighted summation of the distance to the best evaluation value of alternative i with respect to all criteria; Ri is calculated by the maximum weighted distance to the best evaluation value of alternative i with respect to the jth criterion; and Si refers to the overall benefits of the ith alternative where the smaller the value, the larger the benefits. That is, , and . Ri refers to the individual regret of the ith alternative where the smaller the value, the smaller the individual regret of the opponent. That is, , and . Thus, the index Qi is based on the consideration of both the group utility and individual regret of the opponentwhere v is introduced as a weight for the strategy of maximum group utility, whereas 1 − v is the weight of the individual regret of the opponent.
- (4)
- Rank the alternatives by sorting the values , and in ascending order.
- (5)
- Propose as a comprise solution, alternative , which is best ranked by the measure Q (minimum), if the following two conditions are satisfied:
- C1
- Acceptable advantage:where is the alternative in the second position in the ranking list bounded by Q and .
- C2
- Acceptable stability in decision-making:The alternative must also be the best ranked by S and/or R. This compromise solution is stable within a decision-making process, which could be the strategy of maximum group utility (when v > 0.5 is needed), or “by consensus” v ≈ 0.5, or “with veto” (v < 0.5). Here, v is the weight of the decision-making strategy of the maximum group utility. If one of the conditions is not satisfied, then a set of compromise solutions is proposed, which consists of
- (a)
- Alternatives and only if condition C2 is not satisfied;
- (b)
- Alternatives , if condition C1 is not satisfied. is determined by the relation for maximum m (the positions of these alternatives are “in closeness”).
4. Case Study
For aquaculture enterprises, the most important ingredient in the aquafeed is fishmeal. There was a slight decline in global fishmeal production and trade in 2017, but global production is still concentrated among a few top producers. Peru accounts for one-fifth of global production and remains the world’s largest producer and exporter of fishmeal, accounting for nearly one-third of the global trade. There are two periods of time where fishing is allowed in the northern and central oceanic areas near Peru. The first period begins around April and runs to July, and the second fishing period starts from November and goes to January of the following year. The government of Peru realizes the importance of protecting its natural oceanic resources and has decided to reduce their fishing quota; therefore, fishermen must fish on the basis of published quotas, which has directly contributed to competitive tension in the supply side of the fisheries, causing a sharp fall in fishmeal production. Due to a decrease in supply due to the fishing quota, the fishmeal market is becoming more competitive. As a result, many small fishmeal factories in Peru have merged into larger main suppliers. About 80% of fishmeal production is now centralized.
To illustrate the proposed method, we considered an example where the managerial board of an aquaculture enterprise in Taiwan has to procure fishmeal for their aquatic stock. There are four main fishmeal companies in Peru considered as possible suppliers (see Table 6), and 10 important factors (as identified in Section 2) for evaluating these companies. To hedge risks, a committee of thirteen experts (decision-makers) with many years of work experience in the aquaculture industry of Taiwan was formed to select the most suitable fishmeal companies. Profiles of these experts are shown in Table 7.
The proposed model applied for fishmeal supplier selection for a firm operating in the field of aquaculture was comprised of the following steps:
- Step 1:
- Step 2:
- The linguistic evaluations shown in Table 9 was converted into trapezoidal fuzzy numbers. Then, the aggregated fuzzy rating of alternatives as calculated by Equation (4) to construct the fuzzy decision matrix, as shown in Table 10. Then, the data in Table 11 were defuzzified by Equation (2) and normalized by Equation (6). Table 11 shows these processes for calculating the weight of each criterion.
- Step 3:
- Step 4:
- Step 5:
- The values of Si, Ri, and Qi were calculated by Equations (10)–(12) for the four candidate suppliers, as shown in Table 13.
- Step 6:
- Step 7:
- As seen in Table 9, supplier A2 was ranked as the best by Q, but condition C1 was not satisfied . Therefore, A2 and A1 were both appropriate choices.
These results showed that the difference between the Q value of A2 and A1 was not satisfied with Equation (13), therefore, two candidate suppliers, A2 and A1, are both appropriate choices. A1 represents the largest fishmeal supplier in Peru, and A2 is the second largest, and they both owned and operated 16 and 5 fishmeal plants, respectively, in 2011. About 80% of fishmeal production is produced by main 7 suppliers in Peru. In 2011, the largest fishmeal supplier (A1) produced approximately 350,000 tons of fishmeal (27% of the total exported production), while A2 produced approximately 200,000 tons (15.4% of total exported production). Obviously, plant size and capacity are of concern.
Regarding the criteria weights, an entropy method was applied to obtain objective weights from the supplier evaluation results. This was different from other methods like AHP, where weights are based on the subjective opinions given by experts. The entropy method results showed that the top three most important criteria were: (1) the possibility of establishing long-term cooperation, C6 (0.17); (2) reasonableness of the quoted price, C3 (0.15); and (3) satisfaction with claims for damages C8 (0.15). The implication of these results is that aquaculture enterprises are concerned about a reduction in the quantities of fishmeal they can purchase due to a decrease in natural ocean resources. Therefore, their desire is to maintain long-term relationships with their supplier to ensure the quantity of supply. This not only affects the amount of aquaculture production, but also the sustainability of those operations. In addition, the reasonableness of the quoted price is also of concern. If the quoted price is too high, it will not attract purchasers to make procurement decisions and will hurt the profits of aquaculture. As seen from the weighting priorities, the related quality criterion C1 (Stability in product quality) ranked 7th with a weighting of only 7.2%. This showed that controlling the supply of fishmeal resources was more important to the aquaculture industry than the quality requirements. Fishmeal is a special raw material and market demand is greater than supply, therefore making the selection requirements different than usual.
5. Conclusions
In this study, four Peruvian main fishmeal suppliers were evaluated by thirteen experts, which is a typical supplier selection problem often encountered in practice. Fuzzy set theory was an appropriate tool for dealing with this kind of problem. In real decision-making processes, the decision-maker is often unwilling or unable to express their preferences precisely in numerical values, so evaluations are very often expressed in linguistic terms. In this paper, an extension of the VIKOR method with entropy weighting measures in a fuzzy environment was proposed to deal with the qualitative criteria for suitable supplier selections.
From a management perspective, this study dealt with a very practical issue for the aquaculture industry in the selection of fishmeal suppliers, given that fishmeal is a very important raw material. According to the description of the interviewers, the supplier selection processes in this industry are based on personal experience or interpersonal relationships, and lack a scientific or systematic model on which to base these decisions. Given this situation, the management of important raw material suppliers has become less systematic, and does not effectively assess changes in the existing supplier’s performance, which results in those suppliers with poor performance being more difficult to manage. Therefore, this study provides a management or evaluation tool for the industry in the event that a supplier is required to improve their performance. At the same time, to implement a concise and efficient questionnaire survey for these practitioners, a suitable research approach must be provided. The proposed method used in this study is expected to be able to obtain relevant information to effectively measure the weights of the evaluation criteria and the performance of the candidate suppliers through a simple questionnaire survey. That is, this study adopted the VIKOR approach based on entropy weights in a fuzzy decision-making environment. Not only can the entropy method reduce uncertainties arising from subjective factors, but also the advantage of this hybrid approach is that the merits of the alternatives can be evaluated with one questionnaire. This can greatly reduce the number of interviews with these fairly busy practitioners, which makes the application of this approach in the practical industry more effective and convenient. Thus, this framework for supplier selection in aquaculture should be helpful in making some progress in the management of the industry.
In addition, the use of fuzzy theory in this study to represent the fuzziness of human decision-making provides judgment linguistic variables that correspond to trapezoidal fuzzy numbers. For future work, if considering the dynamic and interactive group decision-making process, reference can be made to the model proposed by [48]. Alternatively, if future studies wish to consider the interactive consensus analysis of group decision making, it can refer to the integrated linguistic operator weighted average (ILOWA) approach introduced by [49] to obtain more detailed observations and discussion.
It is also worth considering, however, that, when selecting the best supplier, an awareness that all raw materials come from marine resources that can only be provided sustainably under sustainable fishing should be considered. The problem discussed here was based on how aquaculture enterprises make decisions to select the appropriate suppliers. However, if marine resources decrease, aquaculture enterprises will face a lack of raw materials to produce the relevant products, so income might not be enough to operate sustainably. In 2014, the contribution of the aquaculture sector to the supply of fish for human consumption overtook that of wild-caught fish for the first time. The importance of aquaculture in the future is clearly evident, and the best source of protein in the feed is provided by fishmeal. The question of how to provide high quality protein substitutes without relying on wild-caught fish is another topic worthy of discussion.
Acknowledgments
The authors are thankful to the anonymous referees for their valuable comments. The work was supported by the National Natural Science Foundation of China, Project 71372031.
Author Contributions
Tsung-Hsien Wu and Chia-Hsin Chen conceived of the work and wrote part of the manuscript; Ning Mao commented the work; Shih-Tong Lu analyzed the data and wrote part of the manuscript.
Conflicts of Interest
The authors declare no conflict of interest.
References
- Food and Agriculture Organization (FAO). Contributing to food security and nutrition for all. In The State of World Fisheries and Aquaculture; Fisheries and Aquaculture Department, Food and Agriculture Organization of the United Nations: Rome, Italy, 2016. [Google Scholar]
- Tam, M.C.Y.; Tummala, V.M. An Application of the AHP in vendor selection of a telecommunications system. Omega 2001, 29, 171–182. [Google Scholar] [CrossRef]
- Dulmin, R.; Mininno, V. Supplier selection using a multi-criteria decision aid method. J. Purch. Suppl. Manag. 2003, 9, 177–187. [Google Scholar] [CrossRef]
- Kumar, M.; Vrat, P.; Shankar, R. A fuzzy goal programming approach for vendor selection problem in a supply chain. Comput. Ind. Eng. 2004, 46, 69–85. [Google Scholar] [CrossRef]
- Chen, C.T.; Lin, C.; Huang, S.F. A fuzzy approach for supplier evaluation and selection in supply chain management. Int. J. Prod. Econ. 2006, 102, 289–301. [Google Scholar] [CrossRef]
- Kumar, M.; Vrat, P.; Shankar, R. A fuzzy programming approach for vendor selection problem in a supply chain. Int. J. Prod. Econ. 2006, 101, 273–285. [Google Scholar] [CrossRef]
- Gencer, C.; Gürpinar, D. Analytic network process in supplier selection: A case study in an electronic firm. Appl. Math. Model. 2007, 31, 2475–2486. [Google Scholar] [CrossRef]
- Xia, W.; Wu, Z. Supplier selection with multiple criteria in volume discount environments. Omega 2007, 35, 494–504. [Google Scholar] [CrossRef]
- Sanayei, A.; Mousavi, S.F.; Abdi, M.R.; Mohaghar, A. An integrated group decision-making process for supplier selection and order allocation using multi-attribute utility theory and linear programming. J. Frankl. Inst. 2008, 345, 731–747. [Google Scholar] [CrossRef]
- Yang, J.L.; Chiu, H.N.; Tzeng, G.H.; Yeh, R.H. Vendor selection by integrated fuzzy MCDM techniques with independent and interdependent relationships. Inform. Sci. 2008, 178, 4166–4183. [Google Scholar] [CrossRef]
- Amin, S.H.; Razmi, J. An integrated fuzzy model for supplier management: A case study of ISP selection and evaluation. Expert Syst. Appl. 2009, 36, 8639–8648. [Google Scholar] [CrossRef]
- Boran, F.E.; Genc, S.; Kurt, M.; Akay, D. A multi-criteria intuitionistic fuzzy group decision making for supplier selection with TOPSIS method. Expert Syst. Appl. 2009, 36, 11363–11368. [Google Scholar] [CrossRef]
- Wang, J.W.; Cheng, C.H.; Huang, K.C. Fuzzy hierarchical TOPSIS for supplier selection. Appl. Soft Comput. 2009, 9, 377–386. [Google Scholar] [CrossRef]
- Lin, Y.T.; Lin, C.L.; Ya, H.C.; Tzeng, G.H. A novel hybrid MCDM approach for outsourcing vendor selection A case study for a semiconductor company in Taiwan. Expert Syst. Appl. 2010, 37, 4796–4804. [Google Scholar] [CrossRef]
- Chamodrakas, I.; Batis, D.; Martakos, D. Supplier selection in electronic marketplaces using satisficing and fuzzy AHP. Expert Syst. Appl. 2010, 37, 490–498. [Google Scholar] [CrossRef]
- Sanayei, A.; Mousavi, S.F.; Yazdankhah, A. Group decision making process for supplier selection with VIKOR under fuzzy environment. Expert Syst. Appl. 2010, 37, 24–30. [Google Scholar] [CrossRef]
- Shemshadi, A.; Shirazi, H.; Toreihi, M.; Tarokh, M.J. A fuzzy VIKOR method for supplier selection based on entropy measure for objective weighting. Expert Syst. Appl. 2011, 38, 12160–12167. [Google Scholar] [CrossRef]
- Jahan, A.; Mustapha, F.; Ismail, M.Y.; Sapuan, S.M.; Bahraminasab, M. A comprehensive VIKOR method for material selection. Mater. Des. 2011, 32, 1215–1221. [Google Scholar] [CrossRef]
- Amin, S.H.; Razmi, J.; Zhang, G.Q. Supplier selection and order allocation based on fuzzy SWOT analysis and fuzzy linear programming. Expert Syst. Appl. 2011, 38, 334–342. [Google Scholar] [CrossRef]
- Kilincci, O.; Onal, S.A. Fuzzy AHP approach for supplier selection in a washing machine company. Expert Syst. Appl. 2011, 38, 9656–9664. [Google Scholar] [CrossRef]
- Feng, B.; Fan, Z.P.; Li, Y. A decision method for supplier selection in multi-service outsourcing. Int. J. Prod. Econ. 2011, 132, 240–250. [Google Scholar] [CrossRef]
- Zhao, K.; Yu, X. A case based reasoning approach on supplier selection in petroleum enterprises. Expert Syst. Appl. 2011, 38, 6839–6847. [Google Scholar] [CrossRef]
- Vahdani, B.; Iranmanesh, S.H.; Mousavi, S.M.; Abdollahzade, M. A locally linear neuro-fuzzy model for supplier selection in cosmetics industry. Appl. Math. Model. 2012, 36, 4714–4727. [Google Scholar] [CrossRef]
- Chatterjee, P.; Chakraborty, S. Material selection using preferential ranking methods. Mater. Des. 2012, 35, 384–393. [Google Scholar] [CrossRef]
- Hsua, C.H.; Wang, F.K.; Tzeng, G.H. The best vendor selection for conducting the recycled material based on a hybrid MCDM model combining DANP with VIKOR. Res. Conserv. Recycl. 2012, 66, 95–111. [Google Scholar] [CrossRef]
- Chen, Y.H.; Chao, R.J. Supplier selection using consistent fuzzy preference relations. Expert Syst. Appl. 2012, 39, 3233–3240. [Google Scholar] [CrossRef]
- Peng, A.H.; Xiao, X.M. Material selection using PROMETHEE combined with analytic network process under hybrid environment. Mater. Des. 2013, 47, 643–652. [Google Scholar] [CrossRef]
- Zhao, H.; Guo, S. Selecting Green Supplier of Thermal Power Equipment by Using a Hybrid MCDM Method for Sustainability. Sustainability 2014, 6, 217–235. [Google Scholar] [CrossRef]
- Kuo, T.C.; Hsu, C.W.; Li, J.Y. Developing a Green Supplier Selection Model by Using the DANP with VIKOR. Sustainability 2015, 7, 1661–1689. [Google Scholar] [CrossRef]
- Chung, C.C.; Chao, L.C.; Lou, S.J. The Establishment of a Green Supplier Selection and Guidance Mechanism with the ANP and IPA. Sustainability 2016, 8, 259. [Google Scholar] [CrossRef]
- Yazdani, M.; Chatterjee, P.; Zavadskas, E.K.; Zolfani, S.H. Integrated QFD-MCDM framework for green supplier selection. J. Clean. Prod. 2017, 142 Pt 4, 3728–3740. [Google Scholar] [CrossRef]
- Wan, S.P.; Xua, G.-L.; Dong, J.Y. Supplier selection using ANP and ELECTRE II in interval 2-tuple linguistic environment. Inform. Sci. 2017, 385–386, 19–38. [Google Scholar] [CrossRef]
- Opricovic, S.; Tzeng, G.H. Compromise solution by MCDM methods: A comparative analysis of VIKOR and TOPSIS. Eur. J. Oper. Res. 2004, 156, 445–455. [Google Scholar] [CrossRef]
- Opricovic, S.; Tzeng, G.H. Extended VIKOR method in comparison with outranking methods. Eur. J. Oper. Res. 2007, 178, 514–529. [Google Scholar] [CrossRef]
- Dickson, G.W. An analysis of vendor selection systems and decisions. J. Purch. 1966, 2, 5–17. [Google Scholar] [CrossRef]
- Barbarosoglu, G.; Yazgac, T. An application of the analytic hierarchy process to the supplier selection problem. Prod. Inventory Manag. J. 1997, 38, 14–21. [Google Scholar]
- Ng, W.L. An efficient and simple model for multiple criteria supplier selection problem. Eur. J. Oper. Res. 2008, 186, 1059–1067. [Google Scholar] [CrossRef]
- Chan, F.T.S.; Kumar, N. Global supplier development considering risk factors using fuzzy extended AHP-based approach. Omega 2007, 35, 417–431. [Google Scholar] [CrossRef]
- Shyur, J.H.; Shih, H.S. A hybrid MCDM model for strategic vendor selection. Math. Comput. Model. 2006, 44, 749–761. [Google Scholar] [CrossRef]
- Ávila, P.; Mota, A.; Pires, A.; Bastos, J.; Putnik, G.; Teixeira, J. Supplier’s Selection Model based on an Empirical Study. Proced. Technol. 2012, 5, 625–634. [Google Scholar] [CrossRef]
- Shieh, J.I.; Wu, H.H.; Huang, K.K. A DEMATEL method in identifying key success factors of hospital service quality. Knowl. Based Syst. 2010, 23, 277–282. [Google Scholar] [CrossRef]
- Zadeh, L.A. Fuzzy sets. Inform. Control 1965, 8, 338–353. [Google Scholar] [CrossRef]
- Bellman, R.E.; Zadeh, L.A. Decision-Making in a Fuzzy Environment. Manag. Sci. 1970, 17, 141–164. [Google Scholar] [CrossRef]
- Chen, S.J.; Hwang, C.L. Fuzzy Multiple Attribute Decision Making: Methods and Applications; Springer: New York, NY, USA, 1992. [Google Scholar]
- Shannon, C.E. A mathematical theory of communication. Bell Syst. Tech. J. 1948, 27, 379–423. [Google Scholar] [CrossRef]
- Opricovic, S.; Tzeng, G.H. Multicriteria planning of post-earthquake sustainable reconstruction. Comput.-Aided Civ. Infrastruct. Eng. 2002, 17, 211–220. [Google Scholar] [CrossRef]
- Zeleny, M. Multiple Criteria Decision Making; McGraw-Hill: New York, NY, USA, 1982. [Google Scholar]
- Bucolo, M.; Fortuna, L.; La Rosa, M. Complex Dynamics through Fuzzy Chains. IEEE Trans. Fuzzy Syst. 2004, 12, 289–295. [Google Scholar] [CrossRef]
- Rodger, J.A.; George, J.A. Triple bottom line accounting for optimizing natural gas sustainability: A statistical linear programming fuzzy ILOWA optimized sustainment model approach to reducing supply chain global cybersecurity vulnerability through information and communications technology. J. Clean. Prod. 2017, 142, 1931–1949. [Google Scholar]
Figure 1.
Trapezoidal fuzzy number .

Figure 2.
Linguistic variables for the fuzzy rates of alternatives.


Table 1.
Related research for supplier selection.
| Authors | Approaches | Field of Empirical Study |
|---|---|---|
| Tam and Tummala, 2001 | AHP | Telecommunications company |
| Dulmin and Mininno, 2003 | PROMETHEE-GAIA | Public road and rail transportation |
| Kumar et al., 2004 | Fuzzy integer goal programming | Auto-parts company |
| Chen et al., 2006 | Fuzzy TOPSIS | High-tech company |
| Kumar et al., 2006 | Fuzzy programming | Auto-parts company |
| Gencer and Gürpinar, 2007 | ANP | Electronic firm |
| Xia and Wu, 2007 | AHP | CPU supplier |
| Sanayei et al., 2008 | MAUT and LP | Automobile manufacturer |
| Yang et al., 2008 | Fuzzy AHP | High-tech industries |
| Amin and Razmi, 2009 | Fuzzy set theory | Internet service provider |
| Boran et al., 2009 | Fuzzy TOPSIS | Automotive company |
| Wang et al., 2009 | Fuzzy AHP and TOPSIS | Lithium-ion battery protection IC |
| Lin et al., 2010 | ANP | Semiconductor industry |
| Chamodrakas et al., 2010 | Fuzzy AHP and programming | Electronic marketplaces |
| Sanayei et al., 2010 | Fuzzy VIKOR | Automobile part manufacturing |
| Shemshadi, et al., 2011 | Fuzzy VKOR and Entropy | Petrochemical factory |
| Jahan et al., 2011 | VIKOR | Health care |
| Amin et al., 2011 | fuzzy SWOT and LP | Auto parts company |
| Kilincci and Onal, 2011 | Fuzzy AHP | Washing machine company |
| Feng et al., 2011, | Multi-objective 0–1 programming | CSA company |
| Zhao and Yu, 2011 | Information entropy | Petroleum enterprises |
| Vahdani et al., 2012 | Locally linear neuro-fuzzy | Cosmetics industry |
| Chatterjee and Chakraborty, 2012 | PROMETHEE II and Gray relation | Rotating machine part |
| Hsua et al., 2012 | DANP with VIKOR | Decoration corporation |
| Chen and Chao, 2012 | AHP and CFPR | Electronic company |
| Peng and Xiao, 2013 | PROMETHEE and ANP | Bush materials |
| Zhao and Guo, 2014 | fuzzy-entropy and fuzzy-TOPSIS | Thermal power equipment |
| Kuo et al., 2015 | DANP with VIKOR | Green Electronics Company |
| Chung et al., 2016 | ANP and IPA | Bicycle manufacturer |
| Yazdani et al., 2017 | DEMATEL | Food-based production company |
| Wan et al., 2017 | ANP and ELECTRE II | Auto manufacture company |
Table 2.
Demographic information of the experts who evaluated the criteria.
| Demographic Information | Frequency | |
|---|---|---|
| Gender | Male | 3 |
| Female | 14 | |
| Age | 30–35 | 10 |
| 35–40 | 3 | |
| 40–55 | 4 | |
| Working experience | Under 5 | 4 |
| 5–10 | 6 | |
| Above 10 | 7 | |
| Education level | College | 3 |
| Bachelor | 10 | |
| Master | 4 | |
| Occupation | Purchasing manager | 2 |
| Purchasing specialist | 15 | |
Table 3.
Importance of the 22 factors.
| Factors | Importance | Ranking |
|---|---|---|
| 1. The ratio of supply quantity to total purchase quantity | 5.118 | 18 |
| 2. Stability of supply capability | 6.235 | 2 |
| 3. Stability of product quality | 6.647 | 1 |
| 4. Completeness of product packaging | 5.294 | 15 |
| 5. Operating control of products before delivery | 5.529 | 7 |
| 6. Control capability for on-time delivery | 5.824 | 4 |
| 7. Records of claim for damages or complaints | 5.000 | 22 |
| 8. Satisfaction with handling claims for damages | 5.471 | 8 |
| 9. Efficiency of handling claims for damages | 5.059 | 19 |
| 10. Facilities and equipment of production plant | 5.059 | 19 |
| 11. Financial capability and condition | 5.471 | 8 |
| 12. Efficiency of communication | 5.176 | 17 |
| 13. Exactness in presenting documents to the bank | 5.471 | 8 |
| 14. Operating control of shipping documents | 5.353 | 13 |
| 15. Brand awareness | 5.235 | 16 |
| 16. Reasonableness of quoted price | 5.882 | 3 |
| 17. Reasonableness of shipping freight quotes | 5.412 | 11 |
| 18. Flexibility and coordination of order modification | 5.412 | 11 |
| 19. Flexibility for changing shipment schedule | 5.706 | 5 |
| 20. Service attitudes of operational staff | 5.353 | 13 |
| 21. Closeness of previous business relationship | 5.059 | 19 |
| 22. Possibility of establishing long-term cooperation | 5.588 | 6 |
Table 4.
Fishmeal supplier selection evaluation criteria.
| Evaluation Criteria | Importance | |
|---|---|---|
| C1 | Stability of product quality | 6.647 |
| C2 | Stability of supply capability | 6.235 |
| C3 | Reasonableness of quoted price | 5.882 |
| C4 | Control capability of on-time delivery | 5.824 |
| C5 | Flexibility for changing shipment schedule | 5.706 |
| C6 | Possibility of establishing long-term cooperation | 5.588 |
| C7 | Operating control of product before delivery | 5.529 |
| C8 | Satisfaction with handling claims for damages | 5.471 |
| C9 | Exactness for presenting documents to the bank | 5.471 |
| C10 | Financial capability and conditions | 5.471 |
Table 5.
Fuzzy linguistic assessment variables.
| Linguistic Variables | Trapezoidal Fuzzy Number (TFN) |
|---|---|
| Very poor, VP | (0.0, 0.0, 0.1, 0.2) |
| Poor, P | (0.1, 0.2, 0.2, 0.3) |
| Medium poor, MP | (0.2, 0.3, 0.4, 0.5) |
| Fair, F | (0.4, 0.5, 0.5, 0.6) |
| Medium good, MG | (0.5, 0.6, 0.7, 0.8) |
| Good, G | (0.7, 0.8, 0.8, 0.9) |
| Very good, VG | (0.8, 0.9, 1.0, 1.0) |
Table 6.
Profiles of candidate fishmeal suppliers.
| Condition | A1 | A2 | A3 | A4 |
|---|---|---|---|---|
| Status | Listed | Non-Listed | Non-Listed | Non-Listed |
| Incorporation Date | 25 July 1994 | 1 August 1945 | 13 January 1986 | 5 February 2006 |
| Total Employees | 2073 | 3502 | 7444 | 1495 |
| Plants | 5 | 16 | 9 | 7 |
| Products | Fishmeal Fish oil | Fishmeal Fish oil | Fishmeal Fish oil Canned food Frozen food | Fishmeal Fish oil Frozen fish |
Table 7.
Profiles of experts evaluating the alternatives.
| Demographic Information | Frequency | |
|---|---|---|
| Gender | Male | 3 |
| Female | 10 | |
| Age | 30–35 | 6 |
| 35–40 | 3 | |
| 40–55 | 4 | |
| Working experience | Under 5 | 4 |
| 5–10 | 6 | |
| Above 10 | 3 | |
| Education level | College | 3 |
| Bachelor | 8 | |
| Master | 2 | |
| Occupation | Purchasing manager | 2 |
| Purchasing specialist | 11 | |
Table 8.
Linguistic evaluation of suppliers with respect to criteria by the decision-makers.
| Expert/Criteria | C1 | C2 | C3 | C4 | C5 | C6 | C7 | C8 | C9 | C10 | |
|---|---|---|---|---|---|---|---|---|---|---|---|
| D1 | A1 | G | MG | G | G | G | G | F | F | MG | G |
| A2 | G | G | G | G | G | VG | MG | MG | MG | MG | |
| A3 | VG | MG | MG | MG | MG | MG | F | MG | MG | MG | |
| A4 | G | G | MG | MG | MG | VG | G | MG | MG | G | |
| D2 | A1 | G | VG | G | G | G | VG | G | G | G | G |
| A2 | MG | G | G | G | G | VG | MG | MG | MG | MG | |
| A3 | G | G | G | G | G | G | MG | MG | MG | MG | |
| A4 | G | G | MG | MG | MG | G | MG | F | F | G | |
| D3 | A1 | G | G | VG | G | MG | VG | F | MG | MG | MG |
| A2 | MG | VG | VG | G | G | VG | F | MG | MG | MG | |
| A3 | VG | MG | MG | MG | MG | G | F | MG | MG | MG | |
| A4 | VG | VG | G | G | G | VG | G | MG | MG | VG | |
| D4 | A1 | G | G | VG | MG | MG | VG | F | MG | MG | MG |
| A2 | MG | VG | VG | G | G | VG | F | MG | MG | MG | |
| A3 | VG | MG | MG | MG | MG | G | F | MG | MG | MG | |
| A4 | VG | VG | G | G | G | VG | G | MG | MG | VG | |
| D5 | A1 | G | G | VG | MG | MG | VG | F | MG | MG | MG |
| A2 | G | VG | VG | G | G | VG | F | MG | MG | MG | |
| A3 | VG | MG | MG | MG | MG | G | F | MG | MG | MG | |
| A4 | G | G | G | G | G | VG | G | MG | MG | G | |
| D6 | A1 | G | G | VG | G | MG | VG | F | MG | F | MG |
| A2 | MG | VG | VG | G | G | VG | MG | MG | MG | MG | |
| A3 | VG | MG | MG | MG | MG | G | F | F | MG | MG | |
| A4 | VG | VG | G | G | G | VG | G | MG | MG | G | |
| D7 | A1 | G | G | VG | G | MG | VG | F | MG | MG | MG |
| A2 | G | VG | VG | G | G | VG | MG | MG | MG | G | |
| A3 | VG | MG | MG | MG | MG | G | F | F | F | MG | |
| A4 | VG | VG | G | G | G | VG | G | MG | MG | G | |
| D8 | A1 | G | G | VG | G | MG | VG | F | MG | MG | G |
| A2 | MG | VG | VG | G | G | VG | MG | MG | MG | VG | |
| A3 | VG | MG | MG | MG | MG | G | F | F | F | MG | |
| A4 | VG | VG | G | MG | G | VG | G | MG | MG | G | |
| D9 | A1 | MG | G | MG | MG | G | G | MG | F | MG | MG |
| A2 | MG | G | MG | MG | G | G | G | F | MG | MG | |
| A3 | MG | MG | MG | F | MG | G | F | MP | F | MG | |
| A4 | MG | G | MG | MG | G | G | MG | F | MG | MG | |
| D10 | A1 | MG | G | MG | MG | MG | G | MG | MG | MG | G |
| A2 | MG | G | MG | MG | G | G | MG | F | MG | MG | |
| A3 | VG | VG | MG | MG | MG | G | MG | F | F | MG | |
| A4 | MG | MG | MG | F | F | F | F | F | F | F | |
| D11 | A1 | G | G | G | G | MG | VG | F | MG | MG | MG |
| A2 | MG | VG | VG | G | G | G | F | MG | MG | MG | |
| A3 | G | G | MG | MG | MG | G | MG | F | F | MG | |
| A4 | F | F | F | F | F | F | F | F | F | F | |
| D12 | A1 | MG | G | MG | MG | G | G | MG | F | MG | MG |
| A2 | MG | G | MG | MG | G | G | MG | F | MG | MG | |
| A3 | MG | G | MG | MG | G | G | MG | F | MG | MG | |
| A4 | MG | G | MG | MG | G | G | MG | F | MG | MG | |
| D13 | A1 | G | G | VG | G | MG | VG | F | MG | MG | MG |
| A2 | MG | VG | VG | G | G | VG | MG | MG | MG | MG | |
| A3 | VG | MG | MG | MG | MG | G | F | MG | MG | MG | |
| A4 | VG | G | G | G | G | VG | G | MG | MG | G | |
Table 9.
Fuzzy numbers of supplier evaluations with respect to the criteria.
| Expert | C1 | C2 | C3 | C4 | C5 | |
|---|---|---|---|---|---|---|
| D1 | A1 | (0.7, 0.8, 0.8, 0.9) | (0.5, 0.6, 0.7, 0.8) | (0.7, 0.8, 0.8, 0.9) | (0.7, 0.8, 0.8, 0.9) | (0.7, 0.8, 0.8, 0.9) |
| A2 | (0.7, 0.8, 0.8, 0.9) | (0.7, 0.8, 0.8, 0.9) | (0.7, 0.8, 0.8, 0.9) | (0.7, 0.8, 0.8, 0.9) | (0.7, 0.8, 0.8, 0.9) | |
| A3 | (0.8, 0.9, 1.0, 1.0) | (0.5, 0.6, 0.7, 0.8) | (0.5, 0.6, 0.7, 0.8) | (0.5, 0.6, 0.7, 0.8) | (0.5, 0.6, 0.7, 0.8) | |
| A4 | (0.7, 0.8, 0.8, 0.9) | (0.7, 0.8, 0.8, 0.9) | (0.5, 0.6, 0.7, 0.8) | (0.5, 0.6, 0.7, 0.8) | (0.5, 0.6, 0.7, 0.8) | |
| D2 | A1 | (0.7, 0.8, 0.8, 0.9) | (0.8, 0.9, 1.0, 1.0) | (0.7, 0.8, 0.8, 0.9) | (0.7, 0.8, 0.8, 0.9) | (0.7, 0.8, 0.8, 0.9) |
| A2 | (0.5, 0.6, 0.7, 0.8) | (0.7, 0.8, 0.8, 0.9) | (0.7, 0.8, 0.8, 0.9) | (0.7, 0.8, 0.8, 0.9) | (0.7, 0.8, 0.8, 0.9) | |
| A3 | (0.7, 0.8, 0.8, 0.9) | (0.7, 0.8, 0.8, 0.9) | (0.7, 0.8, 0.8, 0.9) | (0.7, 0.8, 0.8, 0.9) | (0.7, 0.8, 0.8, 0.9) | |
| A4 | (0.7, 0.8, 0.8, 0.9) | (0.7, 0.8, 0.8, 0.9) | (0.5, 0.6, 0.7, 0.8) | (0.5, 0.6, 0.7, 0.8) | (0.5, 0.6, 0.7, 0.8) | |
| D3 | A1 | (0.7, 0.8, 0.8, 0.9) | (0.7, 0.8, 0.8, 0.9) | (0.8, 0.9, 1.0, 1.0) | (0.7, 0.8, 0.8, 0.9) | (0.5, 0.6, 0.7, 0.8) |
| A2 | (0.5, 0.6, 0.7, 0.8) | (0.8, 0.9, 1.0, 1.0) | (0.8, 0.9, 1.0, 1.0) | (0.7, 0.8, 0.8, 0.9) | (0.7, 0.8, 0.8, 0.9) | |
| A3 | (0.8, 0.9, 1.0, 1.0) | (0.5, 0.6, 0.7, 0.8) | (0.5, 0.6, 0.7, 0.8) | (0.5, 0.6, 0.7, 0.8) | (0.5, 0.6, 0.7, 0.8) | |
| A4 | (0.8, 0.9, 1.0, 1.0) | (0.8, 0.9, 1.0, 1.0) | (0.7, 0.8, 0.8, 0.9) | (0.7, 0.8, 0.8, 0.9) | (0.7, 0.8, 0.8, 0.9) | |
| D4 | A1 | (0.7, 0.8, 0.8, 0.9) | (0.7, 0.8, 0.8, 0.9) | (0.8, 0.9, 1.0, 1.0) | (0.5, 0.6, 0.7, 0.8) | (0.5, 0.6, 0.7, 0.8) |
| A2 | (0.5, 0.6, 0.7, 0.8) | (0.8, 0.9, 1.0, 1.0) | (0.8, 0.9, 1.0, 1.0) | (0.7, 0.8, 0.8, 0.9) | (0.7, 0.8, 0.8, 0.9) | |
| A3 | (0.8, 0.9, 1.0, 1.0) | (0.5, 0.6, 0.7, 0.8) | (0.5, 0.6, 0.7, 0.8) | (0.5, 0.6, 0.7, 0.8) | (0.5, 0.6, 0.7, 0.8) | |
| A4 | (0.8, 0.9, 1.0, 1.0) | (0.8, 0.9, 1.0, 1.0) | (0.7, 0.8, 0.8, 0.9) | (0.7, 0.8, 0.8, 0.9) | (0.7, 0.8, 0.8, 0.9) | |
| D5 | A1 | (0.7, 0.8, 0.8, 0.9) | (0.7, 0.8, 0.8, 0.9) | (0.8, 0.9, 1.0, 1.0) | (0.5, 0.6, 0.7, 0.8) | (0.5, 0.6, 0.7, 0.8) |
| A2 | (0.7, 0.8, 0.8, 0.9) | (0.8, 0.9, 1.0, 1.0) | (0.8, 0.9, 1.0, 1.0) | (0.7, 0.8, 0.8, 0.9) | (0.7, 0.8, 0.8, 0.9) | |
| A3 | (0.8, 0.9, 1.0, 1.0) | (0.5, 0.6, 0.7, 0.8) | (0.5, 0.6, 0.7, 0.8) | (0.5, 0.6, 0.7, 0.8) | (0.5, 0.6, 0.7, 0.8) | |
| A4 | (0.7, 0.8, 0.8, 0.9) | (0.7, 0.8, 0.8, 0.9) | (0.7, 0.8, 0.8, 0.9) | (0.7, 0.8, 0.8, 0.9) | (0.7, 0.8, 0.8, 0.9) | |
| D6 | A1 | (0.7, 0.8, 0.8, 0.9) | (0.7, 0.8, 0.8, 0.9) | (0.8, 0.9, 1.0, 1.0) | (0.7, 0.8, 0.8, 0.9) | (0.5, 0.6, 0.7, 0.8) |
| A2 | (0.5, 0.6, 0.7, 0.8) | (0.8, 0.9, 1.0, 1.0) | (0.8, 0.9, 1.0, 1.0) | (0.7, 0.8, 0.8, 0.9) | (0.7, 0.8, 0.8, 0.9) | |
| A3 | (0.8, 0.9, 1.0, 1.0) | (0.5, 0.6, 0.7, 0.8) | (0.5, 0.6, 0.7, 0.8) | (0.5, 0.6, 0.7, 0.8) | (0.5, 0.6, 0.7, 0.8) | |
| A4 | (0.8, 0.9, 1.0, 1.0) | (0.8, 0.9, 1.0, 1.0) | (0.7, 0.8, 0.8, 0.9) | (0.7, 0.8, 0.8, 0.9) | (0.7, 0.8, 0.8, 0.9) | |
| D7 | A1 | (0.7, 0.8, 0.8, 0.9) | (0.7, 0.8, 0.8, 0.9) | (0.8, 0.9, 1.0, 1.0) | (0.7, 0.8, 0.8, 0.9) | (0.5, 0.6, 0.7, 0.8) |
| A2 | (0.7, 0.8, 0.8, 0.9) | (0.8, 0.9, 1.0, 1.0) | (0.8, 0.9, 1.0, 1.0) | (0.7, 0.8, 0.8, 0.9) | (0.7, 0.8, 0.8, 0.9) | |
| A3 | (0.8, 0.9, 1.0, 1.0) | (0.5, 0.6, 0.7, 0.8) | (0.5, 0.6, 0.7, 0.8) | (0.5, 0.6, 0.7, 0.8) | (0.5, 0.6, 0.7, 0.8) | |
| A4 | (0.8, 0.9, 1.0, 1.0) | (0.8, 0.9, 1.0, 1.0) | (0.7, 0.8, 0.8, 0.9) | (0.7, 0.8, 0.8, 0.9) | (0.7, 0.8, 0.8, 0.9) | |
| D8 | A1 | (0.7, 0.8, 0.8, 0.9) | (0.7, 0.8, 0.8, 0.9) | (0.8, 0.9, 1.0, 1.0) | (0.7, 0.8, 0.8, 0.9) | (0.5, 0.6, 0.7, 0.8) |
| A2 | (0.5, 0.6, 0.7, 0.8) | (0.8, 0.9, 1.0, 1.0) | (0.8, 0.9, 1.0, 1.0) | (0.7, 0.8, 0.8, 0.9) | (0.7, 0.8, 0.8, 0.9) | |
| A3 | (0.8, 0.9, 1.0, 1.0) | (0.5, 0.6, 0.7, 0.8) | (0.5, 0.6, 0.7, 0.8) | (0.5, 0.6, 0.7, 0.8) | (0.5, 0.6, 0.7, 0.8) | |
| A4 | (0.8, 0.9, 1.0, 1.0) | (0.8, 0.9, 1.0, 1.0) | (0.7, 0.8, 0.8, 0.9) | (0.5, 0.6, 0.7, 0.8) | (0.7, 0.8, 0.8, 0.9) | |
| D9 | A1 | (0.5, 0.6, 0.7, 0.8) | (0.7, 0.8, 0.8, 0.9) | (0.5, 0.6, 0.7, 0.8) | (0.5, 0.6, 0.7, 0.8) | (0.7, 0.8, 0.8, 0.9) |
| A2 | (0.5, 0.6, 0.7, 0.8) | (0.7, 0.8, 0.8, 0.9) | (0.5, 0.6, 0.7, 0.8) | (0.5, 0.6, 0.7, 0.8) | (0.7, 0.8, 0.8, 0.9) | |
| A3 | (0.5, 0.6, 0.7, 0.8) | (0.5, 0.6, 0.7, 0.8) | (0.5, 0.6, 0.7, 0.8) | (0.4, 0.5, 0.5, 0.6) | (0.5, 0.6, 0.7, 0.8) | |
| A4 | (0.5, 0.6, 0.7, 0.8) | (0.7, 0.8, 0.8, 0.9) | (0.5, 0.6, 0.7, 0.8) | (0.5, 0.6, 0.7, 0.8) | (0.7, 0.8, 0.8, 0.9) | |
| D10 | A1 | (0.5, 0.6, 0.7, 0.8) | (0.7, 0.8, 0.8, 0.9) | (0.5, 0.6, 0.7, 0.8) | (0.5, 0.6, 0.7, 0.8) | (0.5, 0.6, 0.7, 0.8) |
| A2 | (0.5, 0.6, 0.7, 0.8) | (0.7, 0.8, 0.8, 0.9) | (0.5, 0.6, 0.7, 0.8) | (0.5, 0.6, 0.7, 0.8) | (0.7, 0.8, 0.8, 0.9) | |
| A3 | (0.8, 0.9, 1.0, 1.0) | (0.8, 0.9, 1.0, 1.0) | (0.5, 0.6, 0.7, 0.8) | (0.5, 0.6, 0.7, 0.8) | (0.5, 0.6, 0.7, 0.8) | |
| A4 | (0.5, 0.6, 0.7, 0.8) | (0.5, 0.6, 0.7, 0.8) | (0.5, 0.6, 0.7, 0.8) | (0.4, 0.5, 0.5, 0.6) | (0.4, 0.5, 0.5, 0.6) | |
| D11 | A1 | (0.7, 0.8, 0.8, 0.9) | (0.7, 0.8, 0.8, 0.9) | (0.7, 0.8, 0.8, 0.9) | (0.7, 0.8, 0.8, 0.9) | (0.5, 0.6, 0.7, 0.8) |
| A2 | (0.5, 0.6, 0.7, 0.8) | (0.8, 0.9, 1.0, 1.0) | (0.8, 0.9, 1.0, 1.0) | (0.7, 0.8, 0.8, 0.9) | (0.7, 0.8, 0.8, 0.9) | |
| A3 | (0.7, 0.8, 0.8, 0.9) | (0.7, 0.8, 0.8, 0.9) | (0.5, 0.6, 0.7, 0.8) | (0.5, 0.6, 0.7, 0.8) | (0.5, 0.6, 0.7, 0.8) | |
| A4 | (0.4, 0.5, 0.5, 0.6) | (0.4, 0.5, 0.5, 0.6) | (0.4, 0.5, 0.5, 0.6) | (0.4, 0.5, 0.5, 0.6) | (0.4, 0.5, 0.5, 0.6) | |
| D12 | A1 | (0.5, 0.6, 0.7, 0.8) | (0.7, 0.8, 0.8, 0.9) | (0.5, 0.6, 0.7, 0.8) | (0.5, 0.6, 0.7, 0.8) | (0.7, 0.8, 0.8, 0.9) |
| A2 | (0.5, 0.6, 0.7, 0.8) | (0.7, 0.8, 0.8, 0.9) | (0.5, 0.6, 0.7, 0.8) | (0.5, 0.6, 0.7, 0.8) | (0.7, 0.8, 0.8, 0.9) | |
| A3 | (0.5, 0.6, 0.7, 0.8) | (0.7, 0.8, 0.8, 0.9) | (0.5, 0.6, 0.7, 0.8) | (0.5, 0.6, 0.7, 0.8) | (0.7, 0.8, 0.8, 0.9) | |
| A4 | (0.5, 0.6, 0.7, 0.8) | (0.7, 0.8, 0.8, 0.9) | (0.5, 0.6, 0.7, 0.8) | (0.5, 0.6, 0.7, 0.8) | (0.7, 0.8, 0.8, 0.9) | |
| D13 | A1 | (0.7, 0.8, 0.8, 0.9) | (0.7, 0.8, 0.8, 0.9) | (0.8, 0.9, 1.0, 1.0) | (0.7, 0.8, 0.8, 0.9) | (0.5, 0.6, 0.7, 0.8) |
| A2 | (0.5, 0.6, 0.7, 0.8) | (0.8, 0.9, 1.0, 1.0) | (0.8, 0.9, 1.0, 1.0) | (0.7, 0.8, 0.8, 0.9) | (0.7, 0.8, 0.8, 0.9) | |
| A3 | (0.8, 0.9, 1.0, 1.0) | (0.5, 0.6, 0.7, 0.8) | (0.5, 0.6, 0.7, 0.8) | (0.5, 0.6, 0.7, 0.8) | (0.5, 0.6, 0.7, 0.8) | |
| A4 | (0.8, 0.9, 1.0, 1.0) | (0.7, 0.8, 0.8, 0.9) | (0.7, 0.8, 0.8, 0.9) | (0.7, 0.8, 0.8, 0.9) | (0.7, 0.8, 0.8, 0.9) | |
| Expert | C6 | C7 | C8 | C9 | C10 | |
| D1 | A1 | (0.7, 0.8, 0.8, 0.9) | (0.4, 0.5, 0.5, 0.6) | (0.4, 0.5, 0.5, 0.6) | (0.5, 0.6, 0.7, 0.8) | (0.7, 0.8, 0.8, 0.9) |
| A2 | (0.8, 0.9, 1.0, 1.0) | (0.5, 0.6, 0.7, 0.8) | (0.5, 0.6, 0.7, 0.8) | (0.5, 0.6, 0.7, 0.8) | (0.5, 0.6, 0.7, 0.8) | |
| A3 | (0.5, 0.6, 0.7, 0.8) | (0.4, 0.5, 0.5, 0.6) | (0.5, 0.6, 0.7, 0.8) | (0.5, 0.6, 0.7, 0.8) | (0.5, 0.6, 0.7, 0.8) | |
| A4 | (0.8, 0.9, 1.0, 1.0) | (0.7, 0.8, 0.8, 0.9) | (0.5, 0.6, 0.7, 0.8) | (0.5, 0.6, 0.7, 0.8) | (0.7, 0.8, 0.8, 0.9) | |
| D2 | A1 | (0.8, 0.9, 1.0, 1.0) | (0.7, 0.8, 0.8, 0.9) | (0.7, 0.8, 0.8, 0.9) | (0.7, 0.8, 0.8, 0.9) | (0.7, 0.8, 0.8, 0.9) |
| A2 | (0.8, 0.9, 1.0, 1.0) | (0.5, 0.6, 0.7, 0.8) | (0.5, 0.6, 0.7, 0.8) | (0.5, 0.6, 0.7, 0.8) | (0.5, 0.6, 0.7, 0.8) | |
| A3 | (0.7, 0.8, 0.8, 0.9) | (0.5, 0.6, 0.7, 0.8) | (0.5, 0.6, 0.7, 0.8) | (0.5, 0.6, 0.7, 0.8) | (0.5, 0.6, 0.7, 0.8) | |
| A4 | (0.7, 0.8, 0.8, 0.9) | (0.5, 0.6, 0.7, 0.8) | (0.4, 0.5, 0.5, 0.6) | (0.4, 0.5, 0.5, 0.6) | (0.7, 0.8, 0.8, 0.9) | |
| D3 | A1 | (0.8, 0.9, 1.0, 1.0) | (0.4, 0.5, 0.5, 0.6) | (0.5, 0.6, 0.7, 0.8) | (0.5, 0.6, 0.7, 0.8) | (0.5, 0.6, 0.7, 0.8) |
| A2 | (0.8, 0.9, 1.0, 1.0) | (0.4, 0.5, 0.5, 0.6) | (0.5, 0.6, 0.7, 0.8) | (0.5, 0.6, 0.7, 0.8) | (0.5, 0.6, 0.7, 0.8) | |
| A3 | (0.7, 0.8, 0.8, 0.9) | (0.4, 0.5, 0.5, 0.6) | (0.5, 0.6, 0.7, 0.8) | (0.5, 0.6, 0.7, 0.8) | (0.5, 0.6, 0.7, 0.8) | |
| A4 | (0.8, 0.9, 1.0, 1.0) | (0.7, 0.8, 0.8, 0.9) | (0.5, 0.6, 0.7, 0.8) | (0.5, 0.6, 0.7, 0.8) | (0.8, 0.9, 1.0, 1.0) | |
| D4 | A1 | (0.8, 0.9, 1.0, 1.0) | (0.4, 0.5, 0.5, 0.6) | (0.5, 0.6, 0.7, 0.8) | (0.5, 0.6, 0.7, 0.8) | (0.5, 0.6, 0.7, 0.8) |
| A2 | (0.8, 0.9, 1.0, 1.0) | (0.4, 0.5, 0.5, 0.6) | (0.5, 0.6, 0.7, 0.8) | (0.5, 0.6, 0.7, 0.8) | (0.5, 0.6, 0.7, 0.8) | |
| A3 | (0.7, 0.8, 0.8, 0.9) | (0.4, 0.5, 0.5, 0.6) | (0.5, 0.6, 0.7, 0.8) | (0.5, 0.6, 0.7, 0.8) | (0.5, 0.6, 0.7, 0.8) | |
| A4 | (0.8, 0.9, 1.0, 1.0) | (0.7, 0.8, 0.8, 0.9) | (0.5, 0.6, 0.7, 0.8) | (0.5, 0.6, 0.7, 0.8) | (0.8, 0.9, 1.0, 1.0) | |
| D5 | A1 | (0.8, 0.9, 1.0, 1.0) | (0.4, 0.5, 0.5, 0.6) | (0.5, 0.6, 0.7, 0.8) | (0.5, 0.6, 0.7, 0.8) | (0.5, 0.6, 0.7, 0.8) |
| A2 | (0.8, 0.9, 1.0, 1.0) | (0.4, 0.5, 0.5, 0.6) | (0.5, 0.6, 0.7, 0.8) | (0.5, 0.6, 0.7, 0.8) | (0.5, 0.6, 0.7, 0.8) | |
| A3 | (0.7, 0.8, 0.8, 0.9) | (0.4, 0.5, 0.5, 0.6) | (0.5, 0.6, 0.7, 0.8) | (0.5, 0.6, 0.7, 0.8) | (0.5, 0.6, 0.7, 0.8) | |
| A4 | (0.8, 0.9, 1.0, 1.0) | (0.7, 0.8, 0.8, 0.9) | (0.5, 0.6, 0.7, 0.8) | (0.5, 0.6, 0.7, 0.8) | (0.7, 0.8, 0.8, 0.9) | |
| D6 | A1 | (0.8, 0.9, 1.0, 1.0) | (0.4, 0.5, 0.5, 0.6) | (0.5, 0.6, 0.7, 0.8) | (0.4, 0.5, 0.5, 0.6) | (0.5, 0.6, 0.7, 0.8) |
| A2 | (0.8, 0.9, 1.0, 1.0) | (0.5, 0.6, 0.7, 0.8) | (0.5, 0.6, 0.7, 0.8) | (0.5, 0.6, 0.7, 0.8) | (0.5, 0.6, 0.7, 0.8) | |
| A3 | (0.7, 0.8, 0.8, 0.9) | (0.4, 0.5, 0.5, 0.6) | (0.4, 0.5, 0.5, 0.6) | (0.5, 0.6, 0.7, 0.8) | (0.5, 0.6, 0.7, 0.8) | |
| A4 | (0.8, 0.9, 1.0, 1.0) | (0.7, 0.8, 0.8, 0.9) | (0.5, 0.6, 0.7, 0.8) | (0.5, 0.6, 0.7, 0.8) | (0.7, 0.8, 0.8, 0.9) | |
| D7 | A1 | (0.8, 0.9, 1.0, 1.0) | (0.4, 0.5, 0.5, 0.6) | (0.5, 0.6, 0.7, 0.8) | (0.5, 0.6, 0.7, 0.8) | (0.5, 0.6, 0.7, 0.8) |
| A2 | (0.8, 0.9, 1.0, 1.0) | (0.5, 0.6, 0.7, 0.8) | (0.5, 0.6, 0.7, 0.8) | (0.5, 0.6, 0.7, 0.8) | (0.7, 0.8, 0.8, 0.9) | |
| A3 | (0.7, 0.8, 0.8, 0.9) | (0.4, 0.5, 0.5, 0.6) | (0.4, 0.5, 0.5, 0.6) | (0.4, 0.5, 0.5, 0.6) | (0.5, 0.6, 0.7, 0.8) | |
| A4 | (0.8, 0.9, 1.0, 1.0) | (0.7, 0.8, 0.8, 0.9) | (0.5, 0.6, 0.7, 0.8) | (0.5, 0.6, 0.7, 0.8) | (0.7, 0.8, 0.8, 0.9) | |
| D8 | A1 | (0.8, 0.9, 1.0, 1.0) | (0.4, 0.5, 0.5, 0.6) | (0.5, 0.6, 0.7, 0.8) | (0.5, 0.6, 0.7, 0.8) | (0.7, 0.8, 0.8, 0.9) |
| A2 | (0.8, 0.9, 1.0, 1.0) | (0.5, 0.6, 0.7, 0.8) | (0.5, 0.6, 0.7, 0.8) | (0.5, 0.6, 0.7, 0.8) | (0.8, 0.9, 1.0, 1.0) | |
| A3 | (0.7, 0.8, 0.8, 0.9) | (0.4, 0.5, 0.5, 0.6) | (0.4, 0.5, 0.5, 0.6) | (0.4, 0.5, 0.5, 0.6) | (0.5, 0.6, 0.7, 0.8) | |
| A4 | (0.8, 0.9, 1.0, 1.0) | (0.7, 0.8, 0.8, 0.9) | (0.5, 0.6, 0.7, 0.8) | (0.5, 0.6, 0.7, 0.8) | (0.7, 0.8, 0.8, 0.9) | |
| D9 | A1 | (0.7, 0.8, 0.8, 0.9) | (0.5, 0.6, 0.7, 0.8) | (0.4, 0.5, 0.5, 0.6) | (0.5, 0.6, 0.7, 0.8) | (0.5, 0.6, 0.7, 0.8) |
| A2 | (0.7, 0.8, 0.8, 0.9) | (0.7, 0.8, 0.8, 0.9) | (0.4, 0.5, 0.5, 0.6) | (0.5, 0.6, 0.7, 0.8) | (0.5, 0.6, 0.7, 0.8) | |
| A3 | (0.7, 0.8, 0.8, 0.9) | (0.4, 0.5, 0.5, 0.6) | (0.2, 0.3, 0.4, 0.5) | (0.4, 0.5, 0.5, 0.6) | (0.5, 0.6, 0.7, 0.8) | |
| A4 | (0.7, 0.8, 0.8, 0.9) | (0.5, 0.6, 0.7, 0.8) | (0.4, 0.5, 0.5, 0.6) | (0.5, 0.6, 0.7, 0.8) | (0.5, 0.6, 0.7, 0.8) | |
| D10 | A1 | (0.7, 0.8, 0.8, 0.9) | (0.5, 0.6, 0.7, 0.8) | (0.5, 0.6, 0.7, 0.8) | (0.5, 0.6, 0.7, 0.8) | (0.7, 0.8, 0.8, 0.9) |
| A2 | (0.7, 0.8, 0.8, 0.9) | (0.5, 0.6, 0.7, 0.8) | (0.4, 0.5, 0.5, 0.6) | (0.5, 0.6, 0.7, 0.8) | (0.5, 0.6, 0.7, 0.8) | |
| A3 | (0.7, 0.8, 0.8, 0.9) | (0.5, 0.6, 0.7, 0.8) | (0.4, 0.5, 0.5, 0.6) | (0.4, 0.5, 0.5, 0.6) | (0.5, 0.6, 0.7, 0.8) | |
| A4 | (0.4, 0.5, 0.5, 0.6) | (0.4, 0.5, 0.5, 0.6) | (0.4, 0.5, 0.5, 0.6) | (0.4, 0.5, 0.5, 0.6) | (0.4, 0.5, 0.5, 0.6) | |
| D11 | A1 | (0.8, 0.9, 1.0, 1.0) | (0.4, 0.5, 0.5, 0.6) | (0.5, 0.6, 0.7, 0.8) | (0.5, 0.6, 0.7, 0.8) | (0.5, 0.6, 0.7, 0.8) |
| A2 | (0.7, 0.8, 0.8, 0.9) | (0.4, 0.5, 0.5, 0.6) | (0.5, 0.6, 0.7, 0.8) | (0.5, 0.6, 0.7, 0.8) | (0.5, 0.6, 0.7, 0.8) | |
| A3 | (0.7, 0.8, 0.8, 0.9) | (0.5, 0.6, 0.7, 0.8) | (0.4, 0.5, 0.5, 0.6) | (0.4, 0.5, 0.5, 0.6) | (0.5, 0.6, 0.7, 0.8) | |
| A4 | (0.4, 0.5, 0.5, 0.6) | (0.4, 0.5, 0.5, 0.6) | (0.4, 0.5, 0.5, 0.6) | (0.4, 0.5, 0.5, 0.6) | (0.4, 0.5, 0.5, 0.6) | |
| D12 | A1 | (0.7, 0.8, 0.8, 0.9) | (0.5, 0.6, 0.7, 0.8) | (0.4, 0.5, 0.5, 0.6) | (0.5, 0.6, 0.7, 0.8) | (0.5, 0.6, 0.7, 0.8) |
| A2 | (0.7, 0.8, 0.8, 0.9) | (0.5, 0.6, 0.7, 0.8) | (0.4, 0.5, 0.5, 0.6) | (0.5, 0.6, 0.7, 0.8) | (0.5, 0.6, 0.7, 0.8) | |
| A3 | (0.7, 0.8, 0.8, 0.9) | (0.5, 0.6, 0.7, 0.8) | (0.4, 0.5, 0.5, 0.6) | (0.5, 0.6, 0.7, 0.8) | (0.5, 0.6, 0.7, 0.8) | |
| A4 | (0.7, 0.8, 0.8, 0.9) | (0.5, 0.6, 0.7, 0.8) | (0.4, 0.5, 0.5, 0.6) | (0.5, 0.6, 0.7, 0.8) | (0.5, 0.6, 0.7, 0.8) | |
| D13 | A1 | (0.8, 0.9, 1.0, 1.0) | (0.4, 0.5, 0.5, 0.6) | (0.5, 0.6, 0.7, 0.8) | (0.5, 0.6, 0.7, 0.8) | (0.5, 0.6, 0.7, 0.8) |
| A2 | (0.8, 0.9, 1.0, 1.0) | (0.5, 0.6, 0.7, 0.8) | (0.5, 0.6, 0.7, 0.8) | (0.5, 0.6, 0.7, 0.8) | (0.5, 0.6, 0.7, 0.8) | |
| A3 | (0.7, 0.8, 0.8, 0.9) | (0.4, 0.5, 0.5, 0.6) | (0.5, 0.6, 0.7, 0.8) | (0.5, 0.6, 0.7, 0.8) | (0.5, 0.6, 0.7, 0.8) | |
| A4 | (0.8, 0.9, 1.0, 1.0) | (0.7, 0.8, 0.8, 0.9) | (0.5, 0.6, 0.7, 0.8) | (0.5, 0.6, 0.7, 0.8) | (0.7, 0.8, 0.8, 0.9) | |
Table 10.
Aggregated Fuzzy numbers of supplier evaluations with respect to the criteria.
| C1 | C2 | C3 | C4 | C5 | |
|---|---|---|---|---|---|
| A1 | (0.5, 0.754, 0.777, 0.9) | (0.5, 0.792, 0.808, 1.0) | (0.5, 0.808, 0.885, 1.0) | (0.5, 0.723, 0.762, 0.9) | (0.5, 0.662, 0.731, 0.9) |
| A2 | (0.5,0.646,0.723,0.9) | (0.7, 0.862, 0.923, 1.0) | (0.5, 0.815, 0.900, 1.0) | (0.5, 0.754, 0.777, 0.9) | (0.7, 0.800, 0.800, 0.9) |
| A3 | (0.5,0.838,0.923,1.0) | (0.5, 0.669, 0.746, 1.0) | (0.5, 0.615, 0.708, 0.9) | (0.4, 0.608, 0.692, 0.9) | (0.5, 0.631, 0.715, 0.9) |
| A4 | (0.4,0.777,0.846,1.0) | (0.4, 0.800, 0.846, 1.0) | (0.4, 0.700, 0.738, 0.9) | (0.4, 0.677, 0.715, 0.9) | (0.4, 0.723, 0.738, 0.9) |
| C6 | C7 | C8 | C9 | C10 | |
| A1 | (0.7, 0.869, 0.938, 1.0) | (0.4, 0.546, 0.569, 0.9) | (0.4, 0.592, 0.662, 0.9) | (0.4, 0.608, 0.692, 0.9) | (0.5, 0.662, 0.731, 0.9) |
| A2 | (0.7, 0.869, 0.938, 1.0) | (0.4, 0.585, 0.646, 0.9) | (0.4, 0.577, 0.654, 0.8) | (0.5, 0.600, 0.700, 0.8) | (0.5, 0.638, 0.731, 1.0) |
| A3 | (0.5, 0.785, 0.792, 0.9) | (0.4, 0.531, 0.562, 0.8) | (0.2, 0.531, 0.585, 0.8) | (0.4, 0.562, 0.623, 0.8) | (0.5, 0.600, 0.700, 0.8) |
| A4 | (0.4, 0.815, 0.877, 1.0) | (0.4, 0.708, 0.731, 0.9) | (0.4, 0.562, 0.623, 0.8) | (0.4, 0.577, 0.654, 0.8) | (0.4, 0.738, 0.769, 1.0) |
Table 11.
Aggregated values and weights of supplier evaluations.
| C1 | C2 | C3 | C4 | C5 | C6 | C7 | C8 | C9 | C10 | |
|---|---|---|---|---|---|---|---|---|---|---|
| Defuzzified | ||||||||||
| A1 | 0.723 | 0.767 | 0.786 | 0.715 | 0.699 | 0.871 | 0.618 | 0.641 | 0.650 | 0.699 |
| A2 | 0.694 | 0.867 | 0.791 | 0.723 | 0.800 | 0.871 | 0.637 | 0.606 | 0.650 | 0.725 |
| A3 | 0.800 | 0.734 | 0.685 | 0.650 | 0.689 | 0.730 | 0.581 | 0.521 | 0.597 | 0.650 |
| A4 | 0.741 | 0.744 | 0.675 | 0.666 | 0.678 | 0.753 | 0.674 | 0.597 | 0.606 | 0.719 |
| Normalized | ||||||||||
| A1 | 0.244 | 0.247 | 0.268 | 0.260 | 0.244 | 0.270 | 0.246 | 0.271 | 0.260 | 0.250 |
| A2 | 0.235 | 0.278 | 0.269 | 0.262 | 0.279 | 0.270 | 0.254 | 0.256 | 0.260 | 0.260 |
| A3 | 0.270 | 0.236 | 0.233 | 0.236 | 0.241 | 0.226 | 0.231 | 0.220 | 0.239 | 0.233 |
| A4 | 0.251 | 0.239 | 0.230 | 0.242 | 0.236 | 0.233 | 0.269 | 0.252 | 0.242 | 0.257 |
| Entropy weights | ||||||||||
| Hj | 0.9990 | 0.9984 | 0.9980 | 0.9993 | 0.9984 | 0.9976 | 0.9990 | 0.9980 | 0.9994 | 0.9994 |
| 1−Hj | 0.0010 | 0.0016 | 0.0020 | 0.0007 | 0.0016 | 0.0024 | 0.0010 | 0.0020 | 0.0006 | 0.0006 |
| wj | 7.2% | 11.8% | 14.7% | 5.4% | 12.0% | 17.5% | 7.7% | 14.9% | 4.0% | 4.8% |
Table 12.
The best and the worst values for each criterion and the S value of the suppliers.
| C1 | C2 | C3 | C4 | C5 | C6 | C7 | C8 | C9 | C10 | |
|---|---|---|---|---|---|---|---|---|---|---|
| f+ | 0.800 | 0.867 | 0.791 | 0.723 | 0.800 | 0.871 | 0.674 | 0.641 | 0.650 | 0.725 |
| f− | 0.694 | 0.734 | 0.675 | 0.650 | 0.678 | 0.730 | 0.581 | 0.521 | 0.597 | 0.650 |
| S value | ||||||||||
| A1 | 0.052 | 0.089 | 0.006 | 0.006 | 0.100 | 0.000 | 0.046 | 0.000 | 0.000 | 0.017 |
| A2 | 0.072 | 0.000 | 0.000 | 0.000 | 0.000 | 0.000 | 0.030 | 0.044 | 0.000 | 0.000 |
| A3 | 0.000 | 0.118 | 0.134 | 0.054 | 0.109 | 0.175 | 0.077 | 0.149 | 0.040 | 0.048 |
| A4 | 0.040 | 0.110 | 0.147 | 0.042 | 0.120 | 0.146 | 0.000 | 0.055 | 0.034 | 0.004 |
Table 13.
The values and rankings of S, R, and Q of each fishmeal supplier.
| Si | Ranking | Ri | Ranking | Qi | Ranking | |
|---|---|---|---|---|---|---|
| A1 | 0.3154 | 2 | 0.0998 | 2 | 0.247 | 2 |
| A2 | 0.1460 | 1 | 0.0720 | 1 | 0.000 | 1 |
| A3 | 0.9038 | 4 | 0.1745 | 4 | 1.000 | 4 |
| A4 | 0.6968 | 3 | 0.1469 | 3 | 0.729 | 3 |
© 2017 by the authors. Licensee MDPI, Basel, Switzerland. This article is an open access article distributed under the terms and conditions of the Creative Commons Attribution (CC BY) license (http://creativecommons.org/licenses/by/4.0/).
Share and Cite
MDPI and ACS Style
Wu, T.-H.; Chen, C.-H.; Mao, N.; Lu, S.-T. Fishmeal Supplier Evaluation and Selection for Aquaculture Enterprise Sustainability with a Fuzzy MCDM Approach. Symmetry 2017, 9, 286. https://doi.org/10.3390/sym9110286
AMA Style
Wu T-H, Chen C-H, Mao N, Lu S-T. Fishmeal Supplier Evaluation and Selection for Aquaculture Enterprise Sustainability with a Fuzzy MCDM Approach. Symmetry. 2017; 9(11):286. https://doi.org/10.3390/sym9110286
Chicago/Turabian StyleWu, Tsung-Hsien, Chia-Hsin Chen, Ning Mao, and Shih-Tong Lu. 2017. "Fishmeal Supplier Evaluation and Selection for Aquaculture Enterprise Sustainability with a Fuzzy MCDM Approach" Symmetry 9, no. 11: 286. https://doi.org/10.3390/sym9110286
Note that from the first issue of 2016, this journal uses article numbers instead of page numbers. See further details here.