
Optimizing Availability of a Framework in Series Configuration Utilizing Markov Model and Monte Carlo Simulation Techniques

 , , ,
, , ,
Abstract
:1. Introduction and Literature Review
2. Markov Model and Monte Carlo Simulation for Deteriorating Frameworks
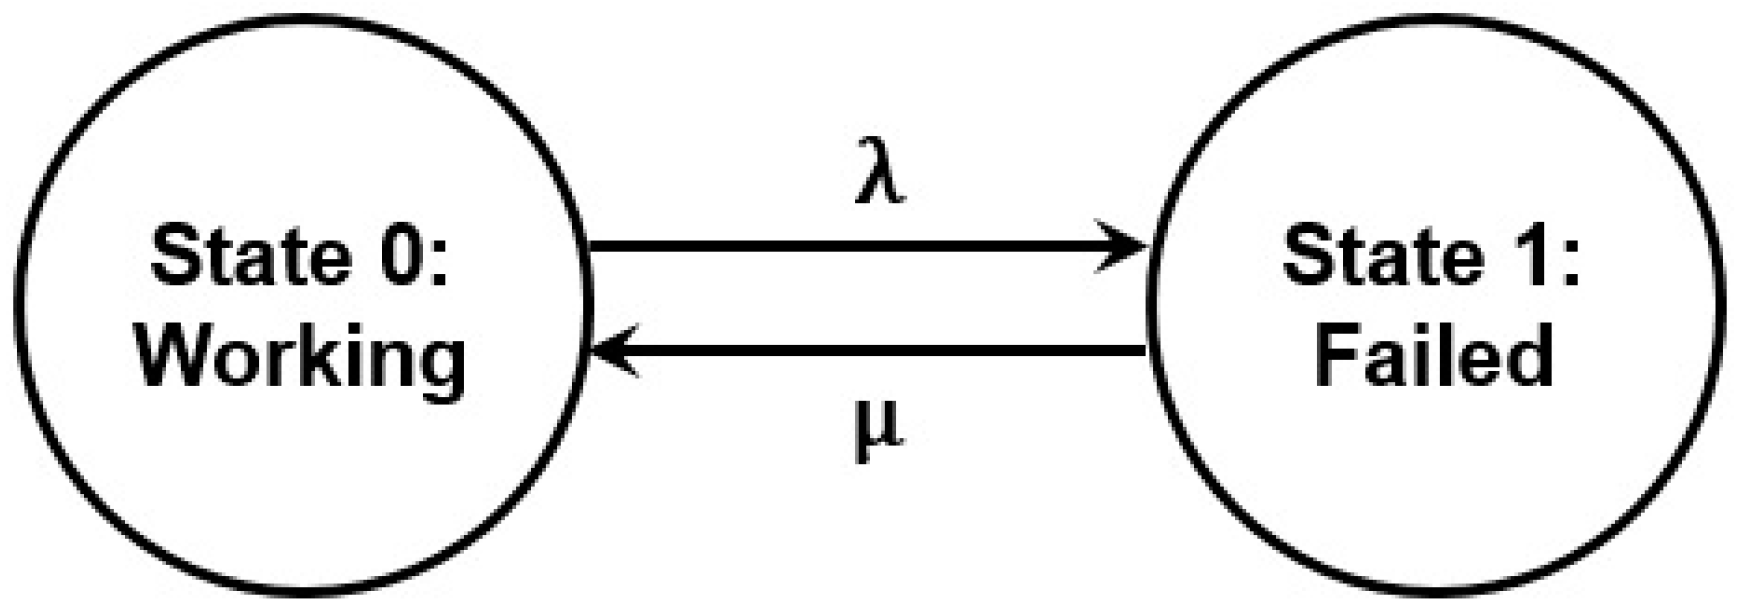
2.1. Markov Model
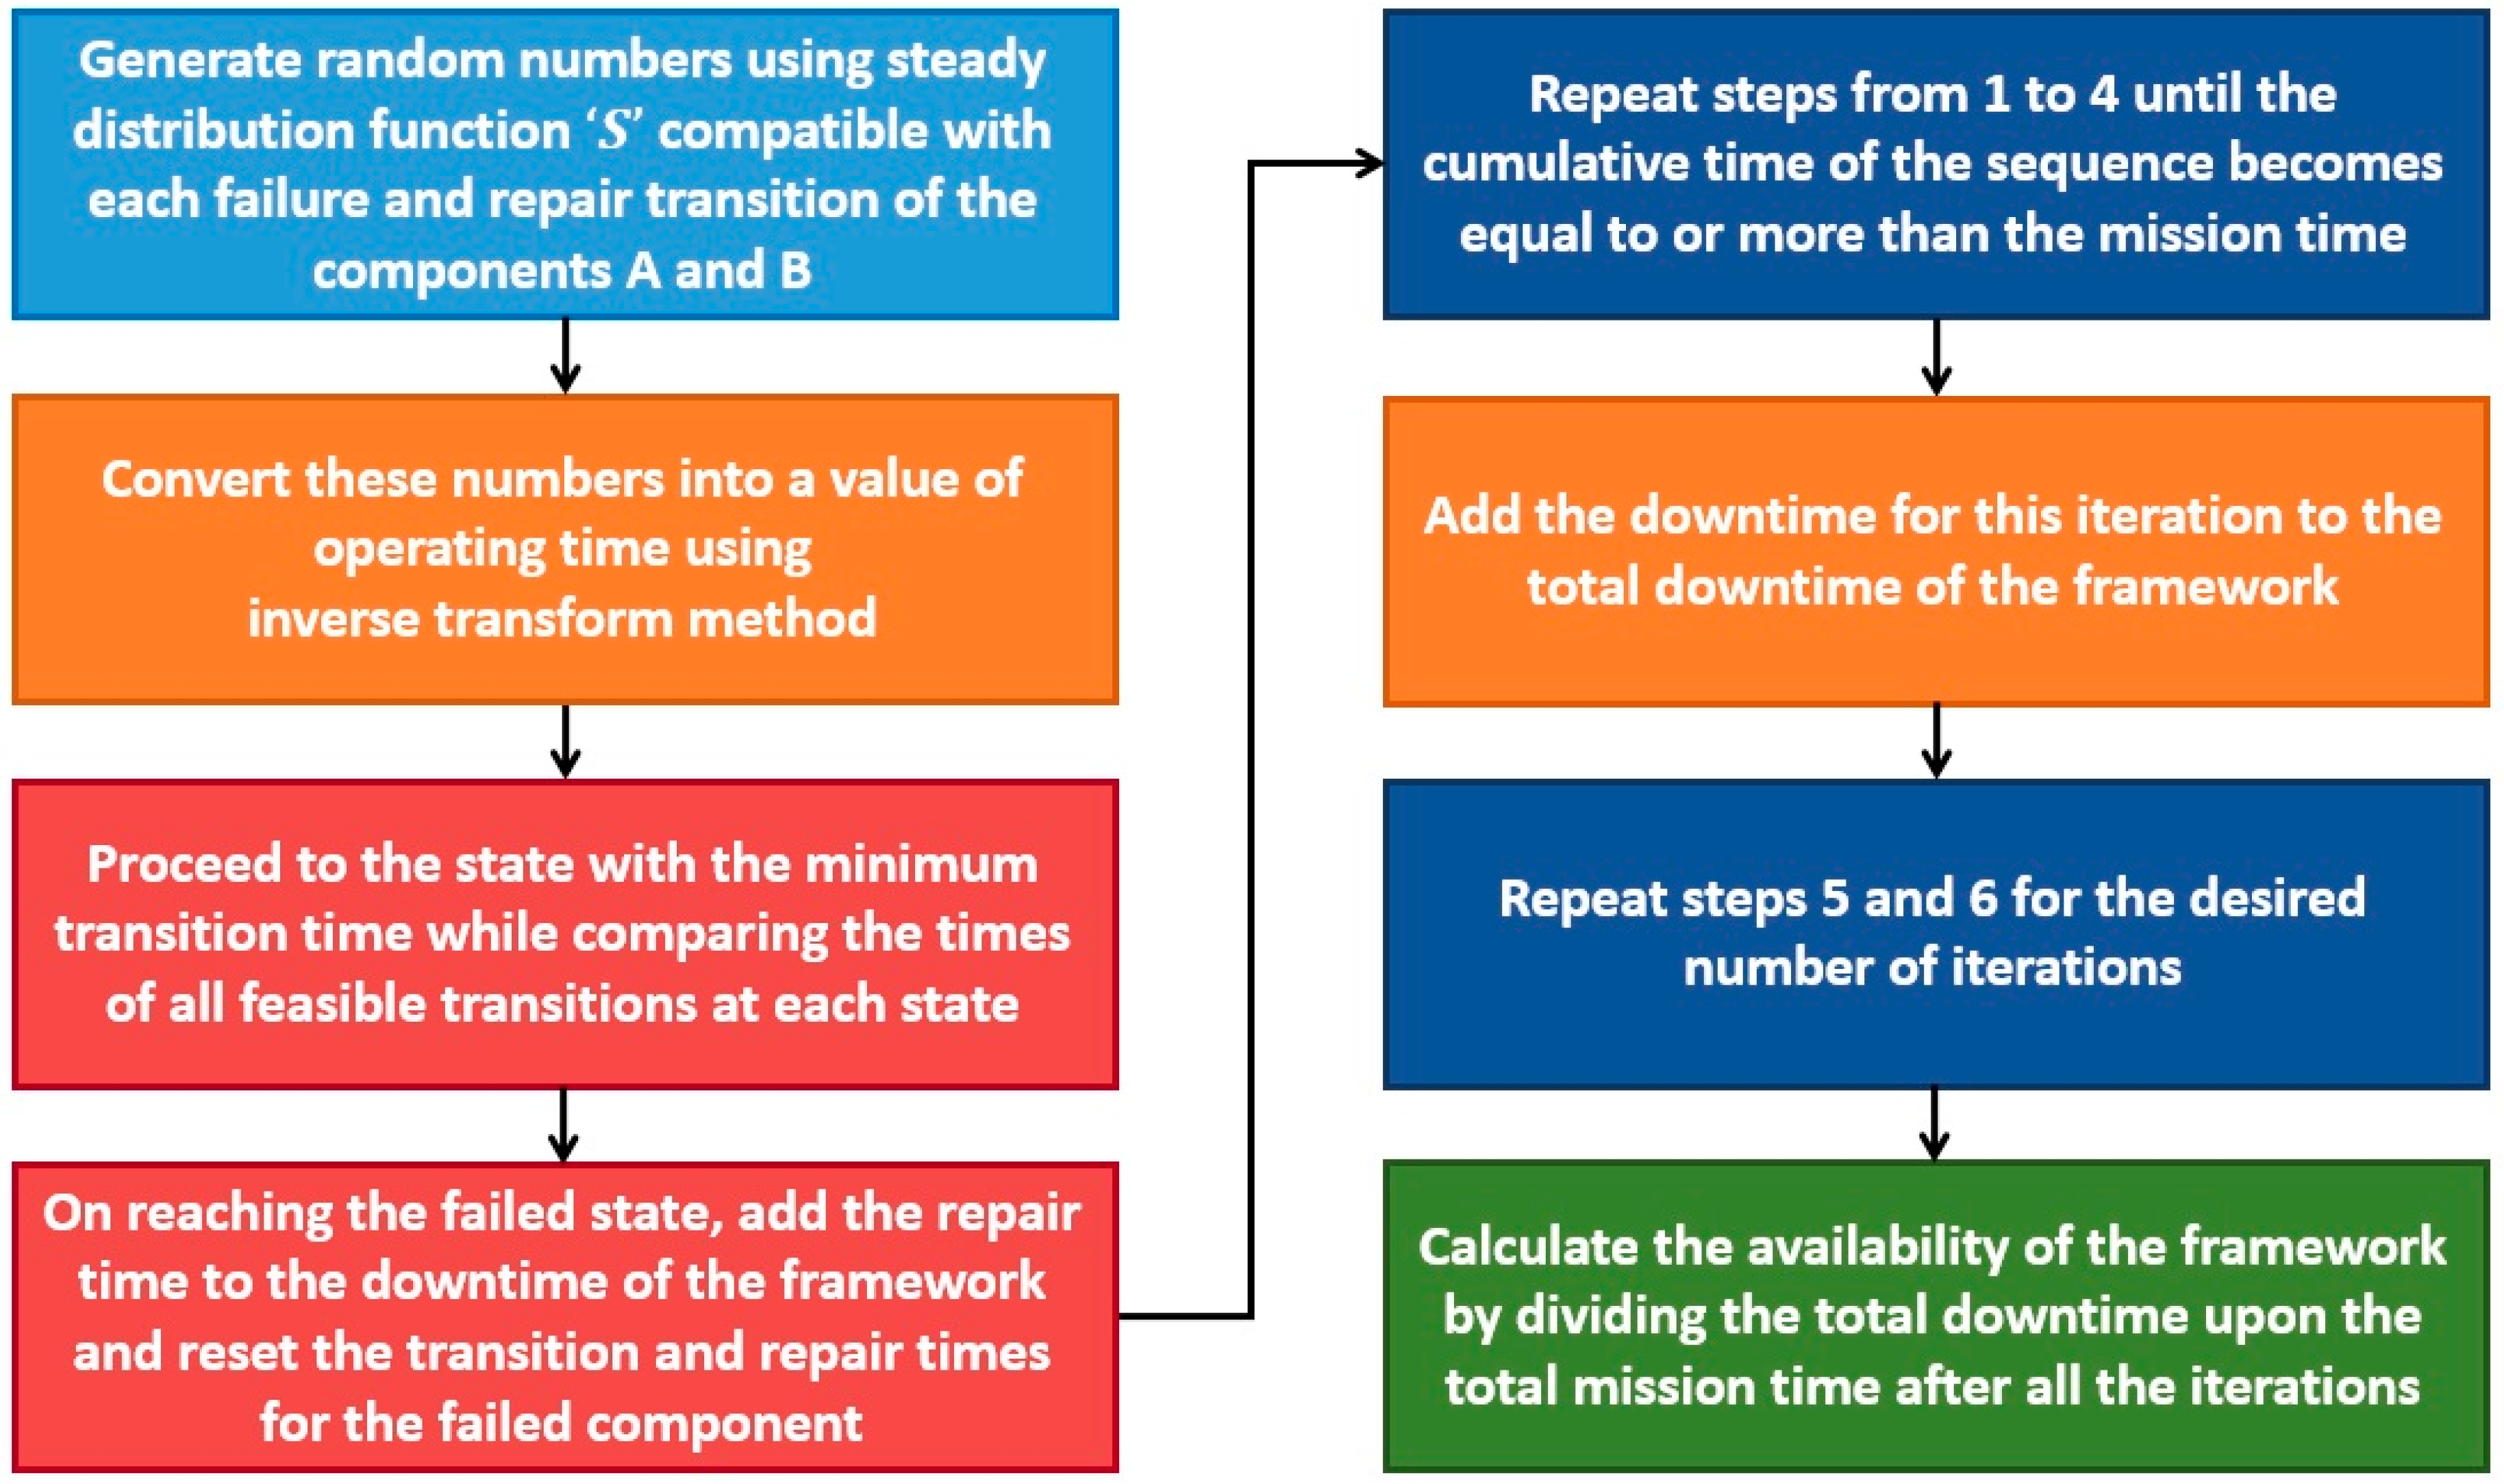
2.2. MC Simulation
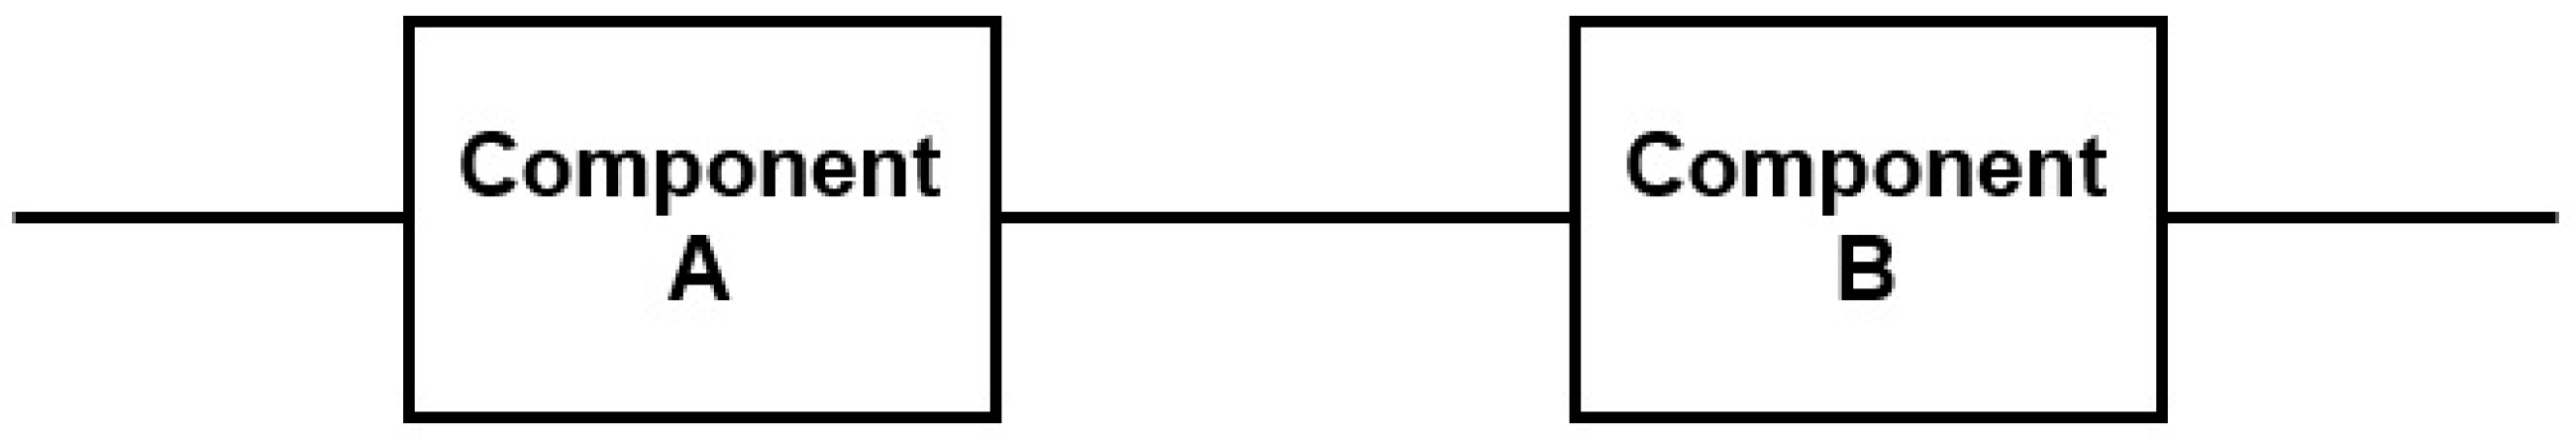
3. Description of the Framework
3.1. Multi-Level Deterioration Modeling
- State 1—Fully Operational State;
- State 2—Partially Operational State; and,
- State 3—Failed State.
3.2. Repair Procedure
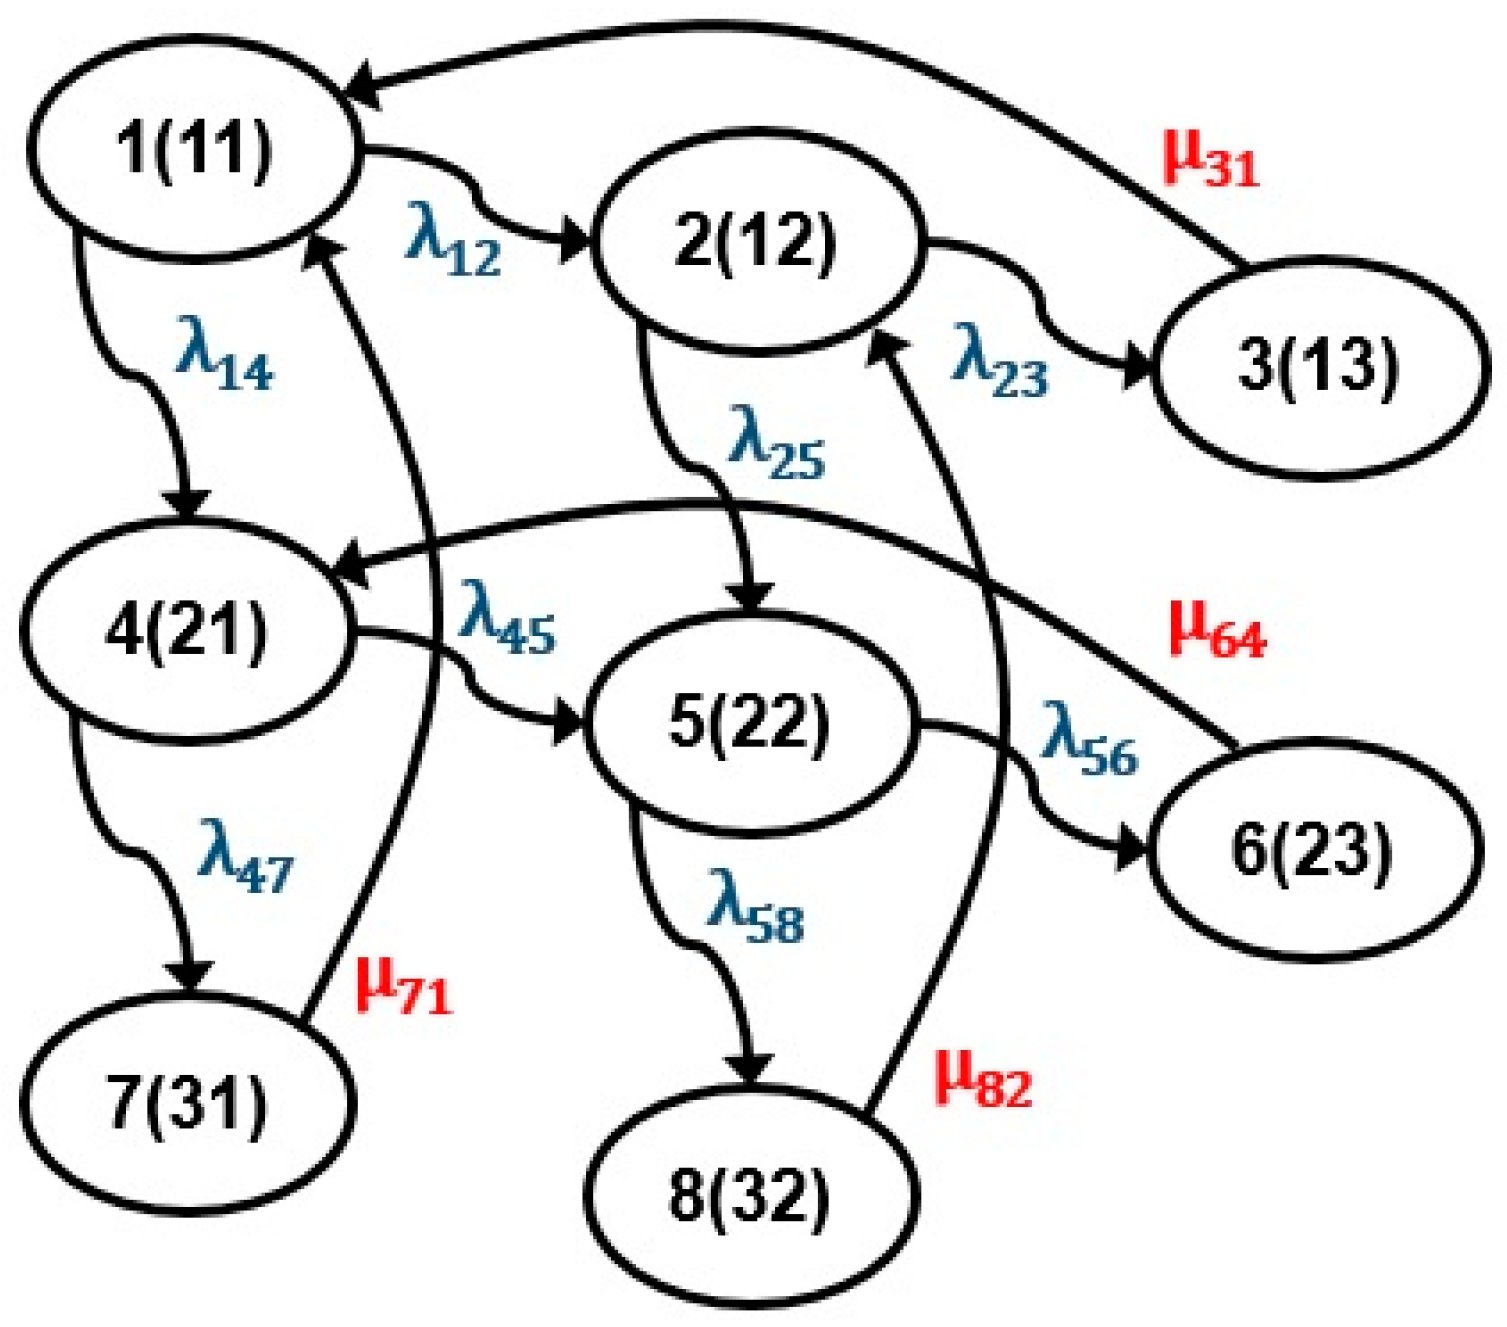
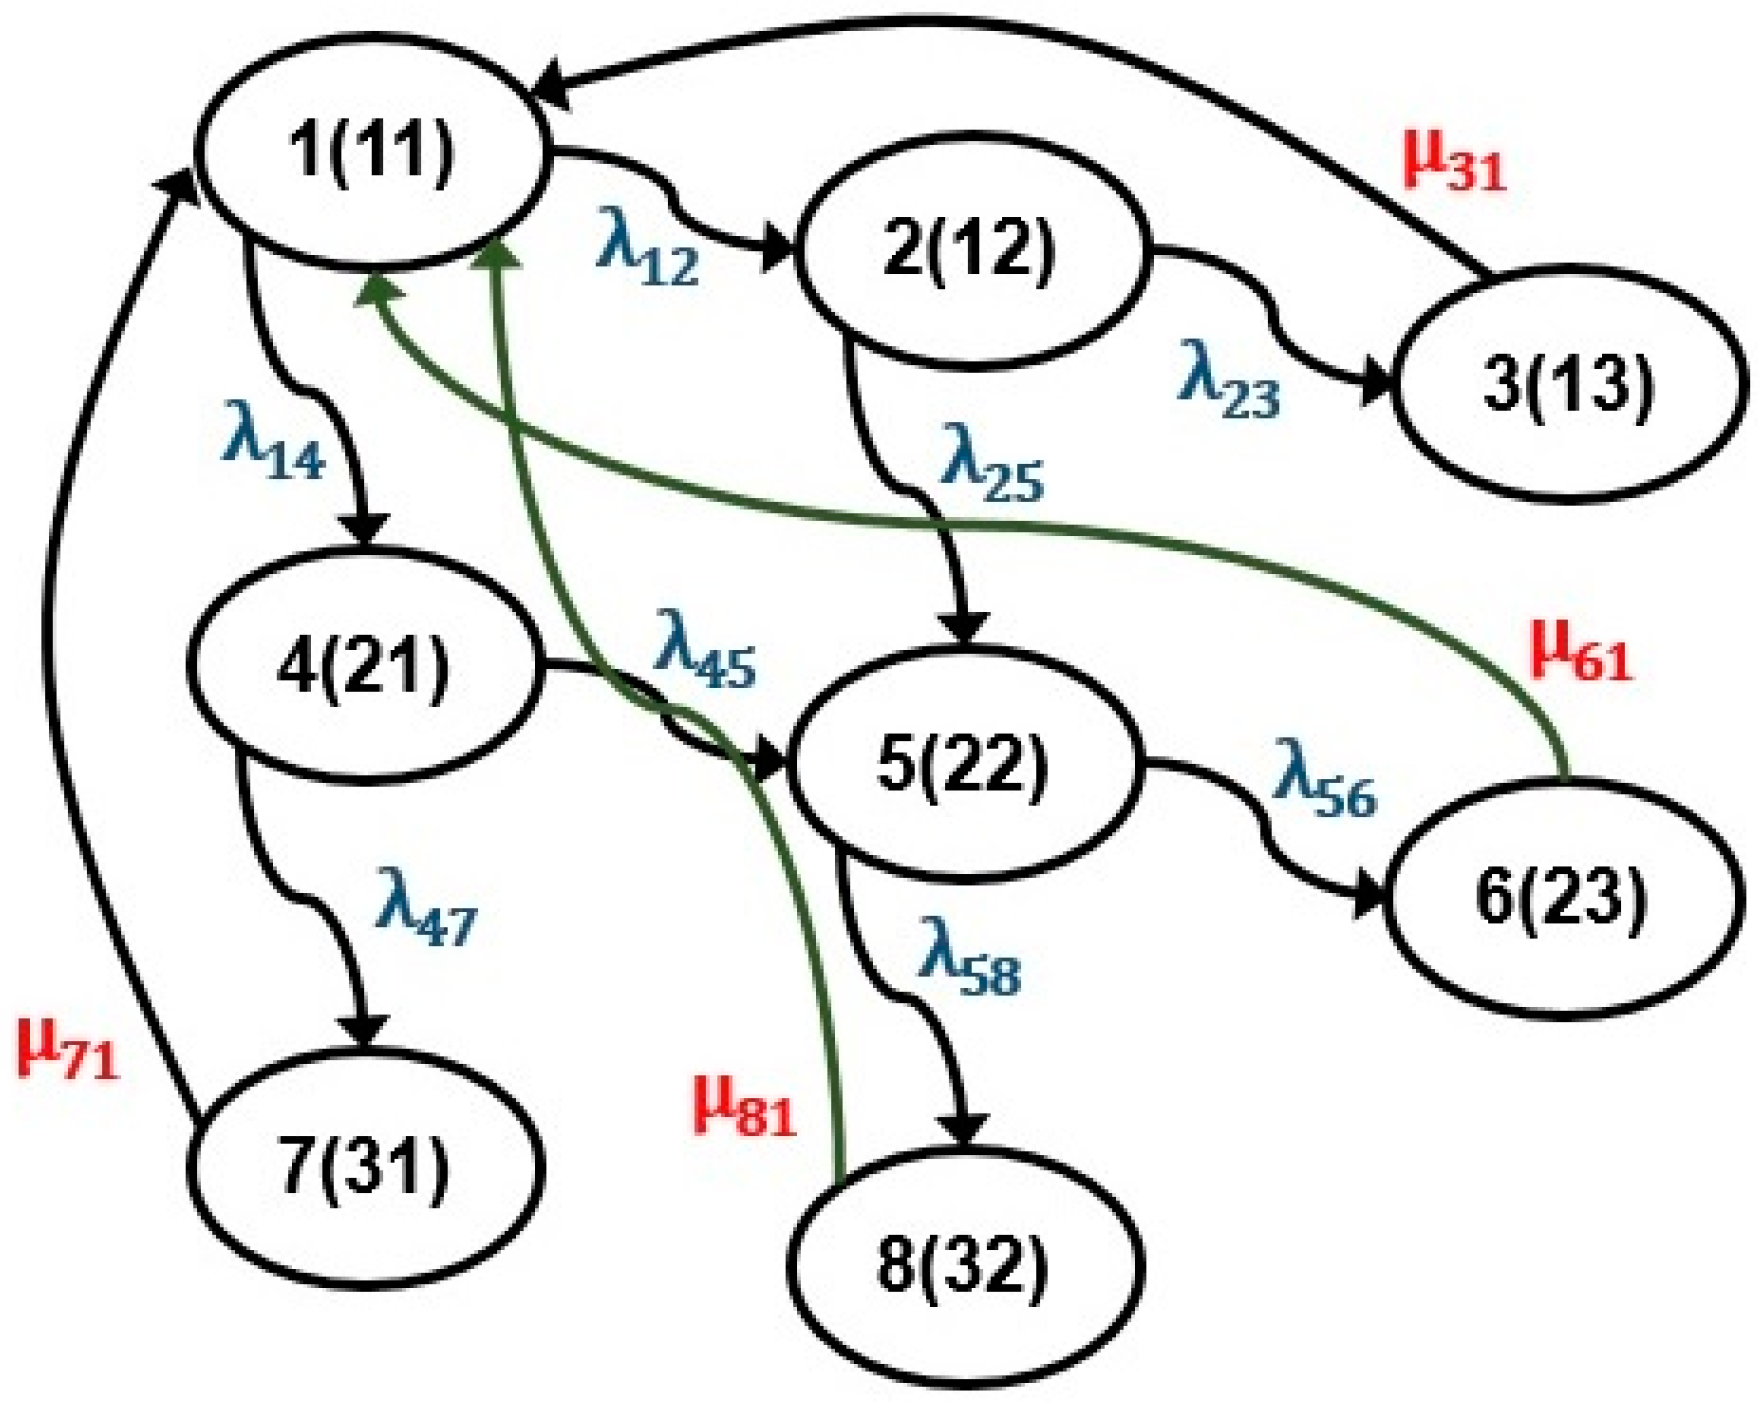
3.3. Developing the Model
- The opportunistic maintenance process will finish before the completion of repair process for the failed unit.
- The unit can perform its intended task in fully operational and partially operational states only.
4. Implementation of Analytical and Simulation Approaches for Problem Solving
4.1. Analytical Approach—Markov Model
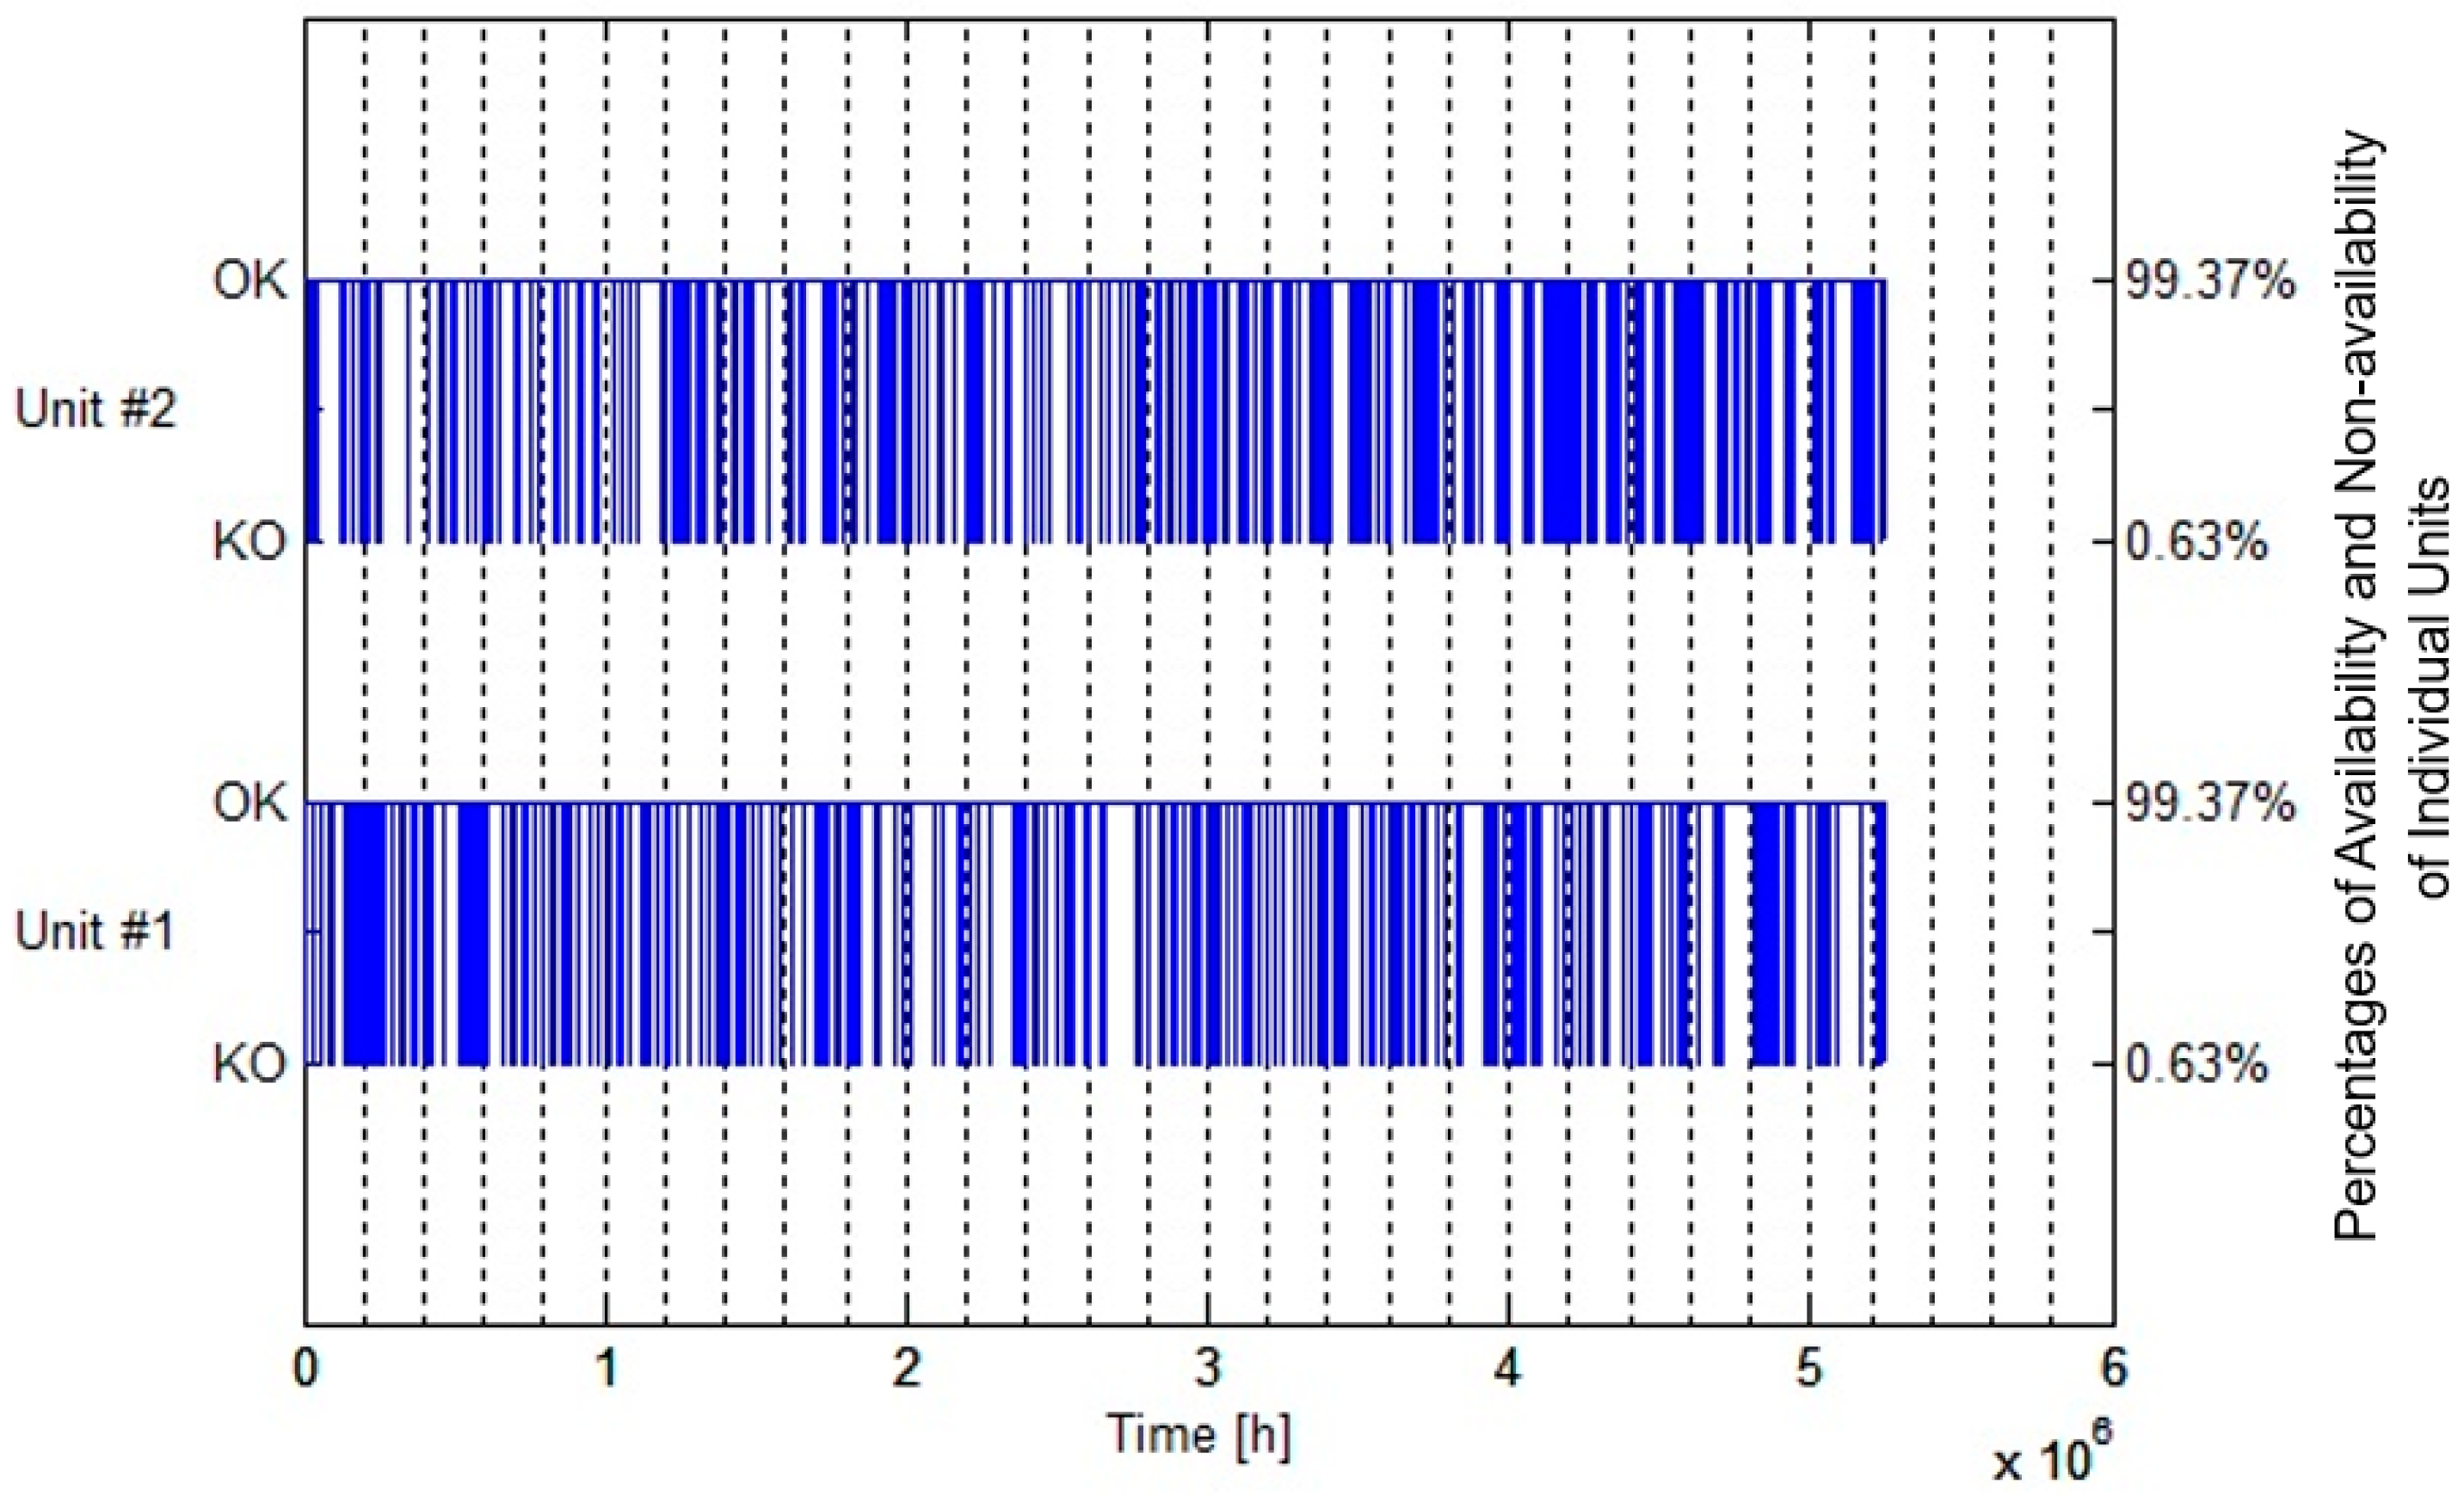
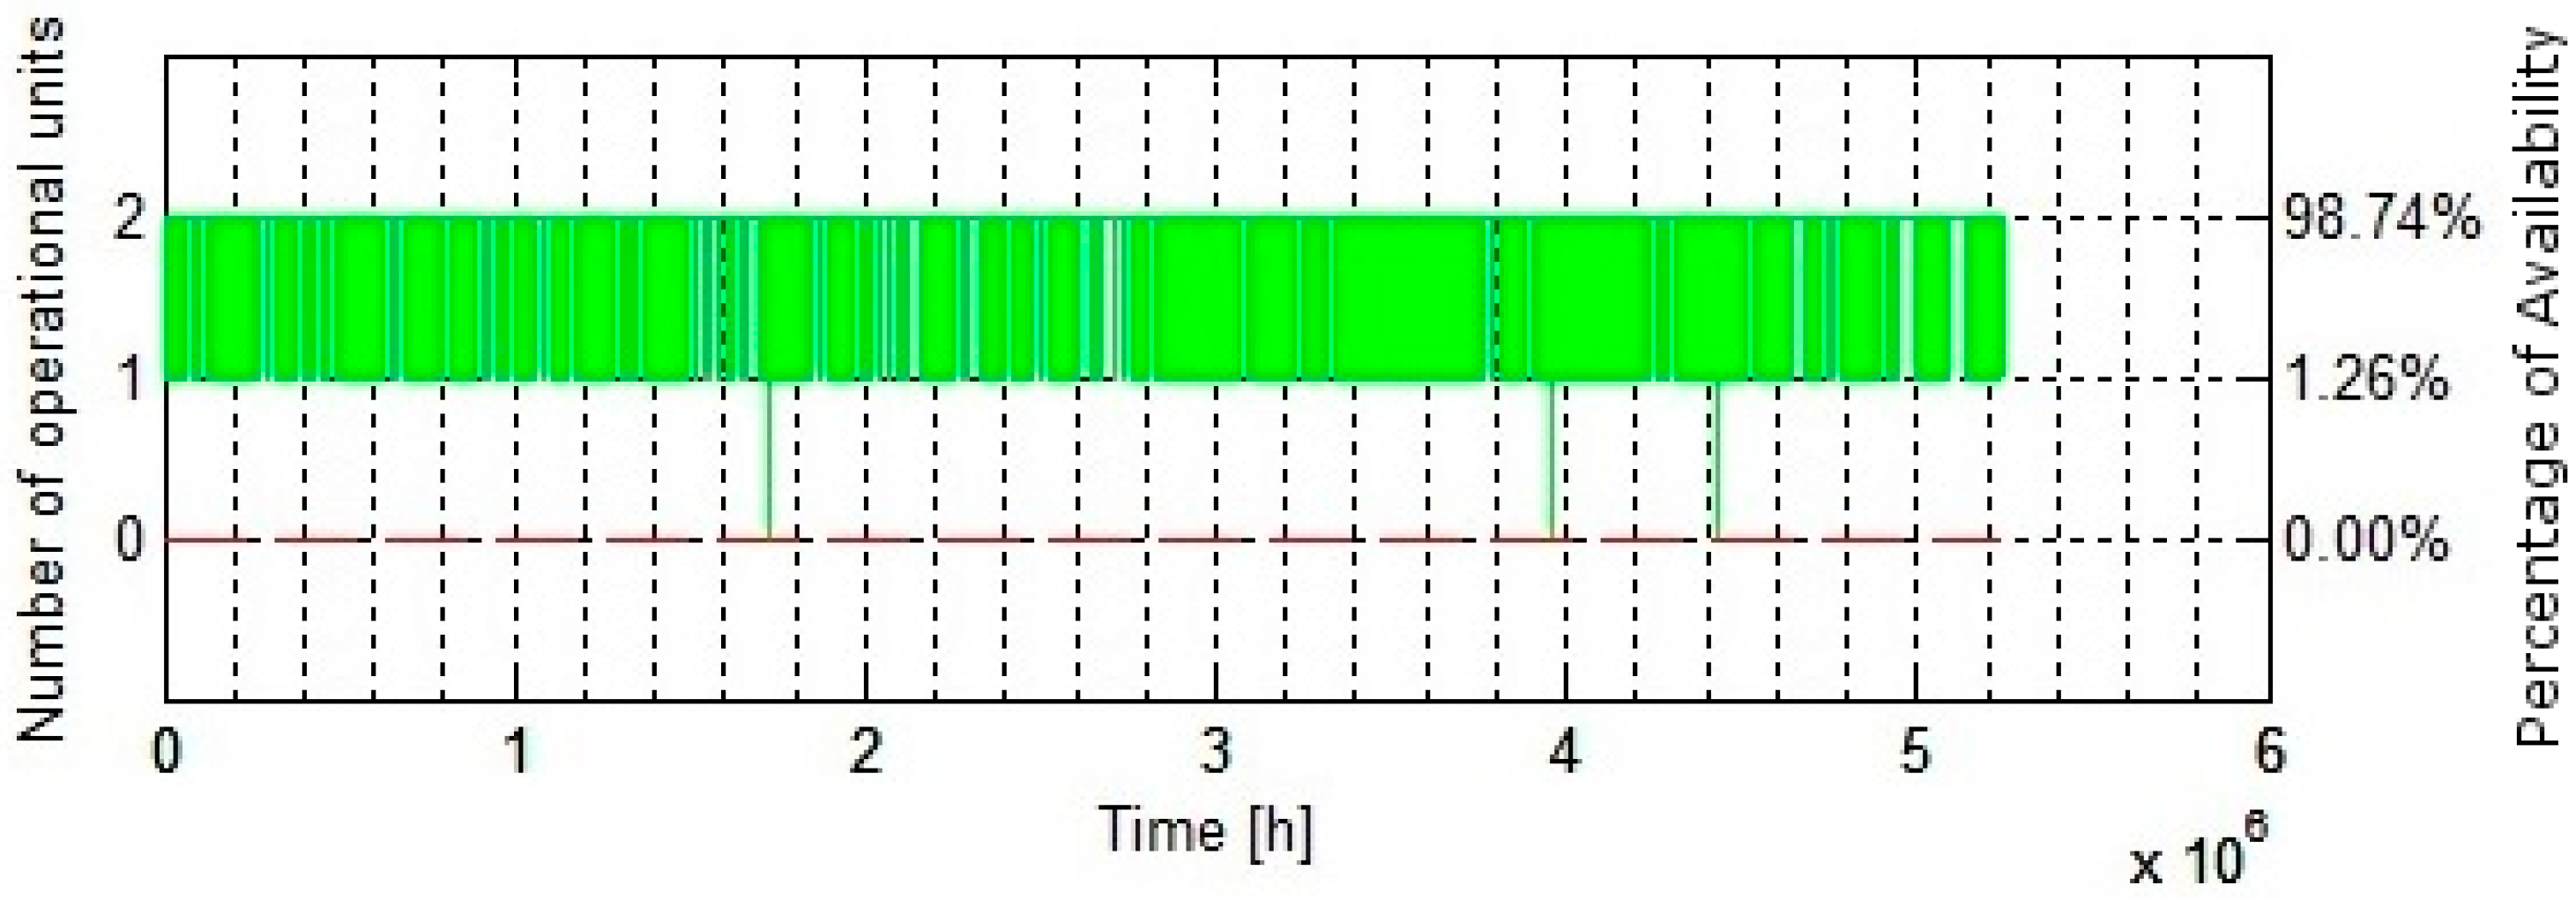
4.2. Simulation Approach—MC Simulation
5. Case Study
5.1. Problem Formulation
5.2. Numerical Solution to the Problem
5.3. Graphical Solution to the Problem
6. Conclusions
Acknowledgments
Author Contributions
Conflicts of Interest
Appendix A. System of DEs Corresponding to the State Diagram Illustrated as Figure 5
Appendix B. System of DEs Corresponding to the State Diagram Illustrated as Figure 6
References
- Collection and Exchange of Reliability and Maintenance Data for Equipment (ISO 14224); International Standards Organization: Geneva, Switzerland, 2006.
- Huang, J.S.; Okogbaa, O.G. Preventive Replacement/Maintenance Program Development and Evaluation for Multi-unit Systems with Economic Dependency: Stochastic Modeling and Simulation Study. Ph.D. Thesis, University of South Florida, Tampa, FL, USA, 1993. [Google Scholar]
- Chiacchio, F.; D’Urso, D.; Manno, G.; Compagno, L. Stochastic hybrid automaton model of a multi-state system with aging: Reliability assessment and design consequences. Reliab. Eng. Syst. Saf. 2016, 149, 1–13. [Google Scholar] [CrossRef]
- Chiacchio, F.; D’Urso, D.; Compagno, L.; Pennisi, M.; Pappalardo, F.; Manno, G. SHyFTA, a Stochastic Hybrid Fault Tree Automaton for the modelling and simulation of dynamic reliability problems. Expert Syst. Appl. 2016, 47, 42–57. [Google Scholar] [CrossRef]
- Li, Y.; Cui, L.; Lin, C. Modeling and analysis for multi-state systems with discrete-time Markov regime-switching. Reliab. Eng. Syst. Saf. 2017. [Google Scholar] [CrossRef]
- Lu, J.M.; Wu, X.Y. Reliability evaluation of generalized phased-mission systems with repairable components. Reliab. Eng. Syst. Saf. 2014, 121, 136–145. [Google Scholar] [CrossRef]
- Shrestha, A.; Xing, L.; Dai, Y. Reliability analysis of multistate phased-mission systems with unordered and ordered states. IEEE Trans. Syst. Man Cybern. Part A Syst. Hum. 2011, 41, 625–636. [Google Scholar] [CrossRef]
- Nicolai, R.P.; Dekker, R. Optimal maintenance of multi-component systems: A review. In Complex System Maintenance Handbook; Springer: London, UK, 2008; pp. 263–286. [Google Scholar]
- Radner, R.; Jorgenson, D.W. Opportunistic replacement of a single part in the presence of several monitored parts. Manag. Sci. 1963, 10, 70–84. [Google Scholar] [CrossRef]
- Van Der Duyn Schouten, F.A.; Vanneste, S.G. Analysis and computation of (n, N)-strategies for maintenance of a two-component system. Eur. J. Op. Res. 1990, 48, 260–274. [Google Scholar] [CrossRef]
- Wang, H.; Pham, H. Optimal preparedness maintenance of multi-unit systems with imperfect maintenance and economic dependence. Reliab. Optim. Maint. 2006, 135–150. [Google Scholar] [CrossRef]
- Pham, H. System Reliability Concepts. In System Software Reliability; Springer: London, UK, 2006; pp. 9–75. [Google Scholar]
- Castanier, B.; Grall, A.; Bérenguer, C. A condition-based maintenance policy with non-periodic inspections for a two-unit series system. Reliab. Eng. Syst. Saf. 2005, 87, 109–120. [Google Scholar] [CrossRef]
- Ambani, S.; Li, L.; Ni, J. Condition-based maintenance decision-making for multiple machine systems. J. Manuf. Sci. Eng. 2009, 131, 1–9. [Google Scholar] [CrossRef]
- Zhang, Z.; Wu, S.; Li, B. A condition-based and opportunistic maintenance model for a two-unit deteriorating system. In Proceedings of the 2011 International Conference on Quality, Reliability, Risk, Maintenance, and Safety Engineering, Xi’an, China, 17–19 June 2011; pp. 590–595. [Google Scholar]
- Jain, S. Opportunistic Maintenance Policy of a Multi-Unit System under Transient State. Ph.D. Thesis, University of South Florida, Tampa, FL, USA, 2005. [Google Scholar]
- Aizpurua, J.I.; Catterson, V.M.; Papadopoulos, Y.; Chiacchio, F.; Manno, G. Improved dynamic dependability assessment through integration with prognostics. IEEE Trans. Reliab. 2017, 1–21. [Google Scholar] [CrossRef]
- Aizpurua, J.I.; Catterson, V.M.; Papadopoulos, Y.; Chiacchio, F.; D’Urso, D. Supporting group maintenance through prognostics-enhanced dynamic dependability prediction. Reliab. Eng. Syst. Saf. 2017. [Google Scholar] [CrossRef]
- Fuqua, N.B. The Applicability of Markov Analysis Methods to Reliability, Maintainability, and Safety; Selected Topic in Assurance Related Technologies (START); Reliability Analysis Center: Rome, NY, USA, 2003; Volume 2, pp. 1–8. [Google Scholar]
- Zio, E. Availability analysis: Concepts and methods. In Wiley Encyclopaedia of Operations Research and Management Science; John Wiley and Sons, Inc.: Hoboken, NJ, USA, 2010. [Google Scholar] [CrossRef]
- Padma, G.; Vijayalakshmi, C. An analysis of continuous time Markov chains using generator matrices. Int. J. Comput. Appl. 2011, 35, 20–24. [Google Scholar]
- Amo, R.G. Handbook, Electronic Reliability Design; MIL-HDBK-338B; Air Force Research Laboratory/IFTB: Rome, NY, USA, 1998. [Google Scholar]
- Alexander, D. Application of Monte Carlo simulations to system reliability analysis. In Proceedings of the 20th International Pump User Symposium, Texas A&M University, Houston, TX, USA, 17–20 March 2003; pp. 91–94. [Google Scholar]
- Papoulis, A.; Pillai, S.U. Probability, Random Variables, and Stochastic Processes; Tata McGraw-Hill Education: New Delhi, India, 2002. [Google Scholar]
- Roos, F.; Lindah, S. Distribution system component failure rates and repair times—An overview. In Proceedings of the Nordic Distribution and Asset Management Conference, Espoo, Finland, 23–24 August 2004; pp. 1–6. [Google Scholar]


| Units | Failure Rate | Average Repair Time | ||
|---|---|---|---|---|
| Temporary | Sustained | Average | ||
| Transformer (33–110 kV) | 0.4 year per 100 transformers | 0.6 year per 100 transformers | 0.5 year per 100 transformers | 115.983 ≈ 116 h |
| Safety unit for transformer (33–110 kV) | 0.9 year per 100 transformers | 0.6 year per 100 transformers | 0.75 year per 100 transformers | 14.8 ≈ 15 h |
| Serial | Unit A | Unit B | ||
|---|---|---|---|---|
| Failure Rates | Repair Rates | Failure Rates | Repair Rates | |
| 1 | ||||
| 2 | ||||
| Types of Corrective Repairs | Availability of the Framework | |||
|---|---|---|---|---|
| Using Markov Model | Using MC Simulation | |||
| Without Opportunistic Maintenance | With Opportunistic Maintenance | Without Opportunistic Maintenance | With Opportunistic Maintenance | |
| Perfect Repair | 97.71% | 98.73% | 97.71% | 98.74% |
| Imperfect Repair | 97.95% | 98.91% | 97.94% | 98.89% |
© 2017 by the authors. Licensee MDPI, Basel, Switzerland. This article is an open access article distributed under the terms and conditions of the Creative Commons Attribution (CC BY) license (http://creativecommons.org/licenses/by/4.0/).
Share and Cite
Siddiqui, M.A.; Butt, S.I.; Gilani, O.; Jamil, M.; Maqsood, A.; Zhang, F. Optimizing Availability of a Framework in Series Configuration Utilizing Markov Model and Monte Carlo Simulation Techniques. Symmetry 2017, 9, 96. https://doi.org/10.3390/sym9070096
Siddiqui MA, Butt SI, Gilani O, Jamil M, Maqsood A, Zhang F. Optimizing Availability of a Framework in Series Configuration Utilizing Markov Model and Monte Carlo Simulation Techniques. Symmetry. 2017; 9(7):96. https://doi.org/10.3390/sym9070096
Chicago/Turabian StyleSiddiqui, Mansoor Ahmed, Shahid Ikramullah Butt, Omer Gilani, Mohsin Jamil, Adnan Maqsood, and Faping Zhang. 2017. "Optimizing Availability of a Framework in Series Configuration Utilizing Markov Model and Monte Carlo Simulation Techniques" Symmetry 9, no. 7: 96. https://doi.org/10.3390/sym9070096