
Recognition of Traffic Sign Based on Bag-of-Words and Artificial Neural Network


1
Department of Artificial Intelligence, Faculty of Computer Science & Information Technology, University of Malaya, Kuala Lumpur 50603, Malaysia
2
Department of Information Systems, Faculty of Computer Science & Information Technology, University of Malaya, Kuala Lumpur 50603, Malaysia
3
Department of Computer Science, Sukkur Institute of Business Administration, Sukkur 56200, Pakistan
*
Author to whom correspondence should be addressed.
Symmetry 2017, 9(8), 138; https://doi.org/10.3390/sym9080138
Submission received: 25 April 2017
/
Revised: 14 July 2017
/
Accepted: 27 July 2017
/
Published: 30 July 2017
(This article belongs to the Special Issue Advanced in Artificial Intelligence and Cloud Computing)
Abstract
:The traffic sign recognition system is a support system that can be useful to give notification and warning to drivers. It may be effective for traffic conditions on the current road traffic system. A robust artificial intelligence based traffic sign recognition system can support the driver and significantly reduce driving risk and injury. It performs by recognizing and interpreting various traffic sign using vision-based information. This study aims to recognize the well-maintained, un-maintained, standard, and non-standard traffic signs using the Bag-of-Words and the Artificial Neural Network techniques. This research work employs a Bag-of-Words model on the Speeded Up Robust Features descriptors of the road traffic signs. A robust classifier Artificial Neural Network has been employed to recognize the traffic sign in its respective class. The proposed system has been trained and tested to determine the suitable neural network architecture. The experimental results showed high accuracy of classification of traffic signs including complex background images. The proposed traffic sign detection and recognition system obtained 99.00% classification accuracy with a 1.00% false positive rate. For real-time implementation and deployment, this marginal false positive rate may increase reliability and stability of the proposed system.
1. Introduction
The road traffic signs must be installed and placed appropriately to ensure that they are clearly visibility to the road users. Though the traffic sign has standard physical structure and appearance, various natural issues and human errors cause the variation in color, shape, or both. Moreover, most of the time a valuable sign is ignored by the driver and puts them in a potentially dangerous situation because of the lack of attention and unclear visibility [1]. Additionally, in many places, the visibility of road traffic signs may get obscured; consequently drivers may unintentionally ignore them.
Though road users can recognize and classify distinct road signs without any mistake or delay, robust and fully automated detection and recognition of the road sign remains a challenge for autonomous vehicles. Currently, many researchers and vehicle manufacturing companies are designing autonomous vehicles [2]. These vehicles can operate without the intervention of a human driver. Hence, such autonomous vehicles need the robust traffic sign detection and recognition system to be in place for them to operate on the road safely.
Recognition of traffic signs has been receiving more attention in recent years due to the advanced integrated system for smart vehicles. Due to upgrading to a higher living standard, the communication and transportation system has improved, and the use of vehicles has also increased. With the increasing number of vehicles, the rate of traffic accidents has also increased. At present, road traffic accidents have become one of the most frequent causes of death worldwide [3]. By 2030, road accidents will be the fifth most common cause of death around the world [4], including in Malaysia [5]. Numerous research organizations are currently working to reduce road-related incidents by integrating transportation systems with artificial intelligence as an advanced driver assistance system. An advanced driver assistance system automatically detects traffic signs by using a camera mounted on the dashboard of a vehicle; this functions as a road sign recognition system. This system helps the driver to be aware of the road and traffic signs, rules of driving along the road and notifies the driver of the said signs which ultimately help reduce the possibility of having an accident.
An intelligent traffic sign classification system is a vital function of an intelligent transport system [6,7]. The automatic traffic sign identification involves two main stages namely, detection, and recognition. The detection stage is performed to identify the region of interest (ROI) generally by using the color segmentation, followed by some form of shape identification. Detected traffic sign candidates are then either recognized or rejected through the recognition stage. The recognition stage is performed with some machine learning techniques such as the artificial neural network (ANN) [8,9,10,11,12,13,14], support vector machine (SVM) [1,15,16,17,18,19,20,21,22] or the template matching [23].
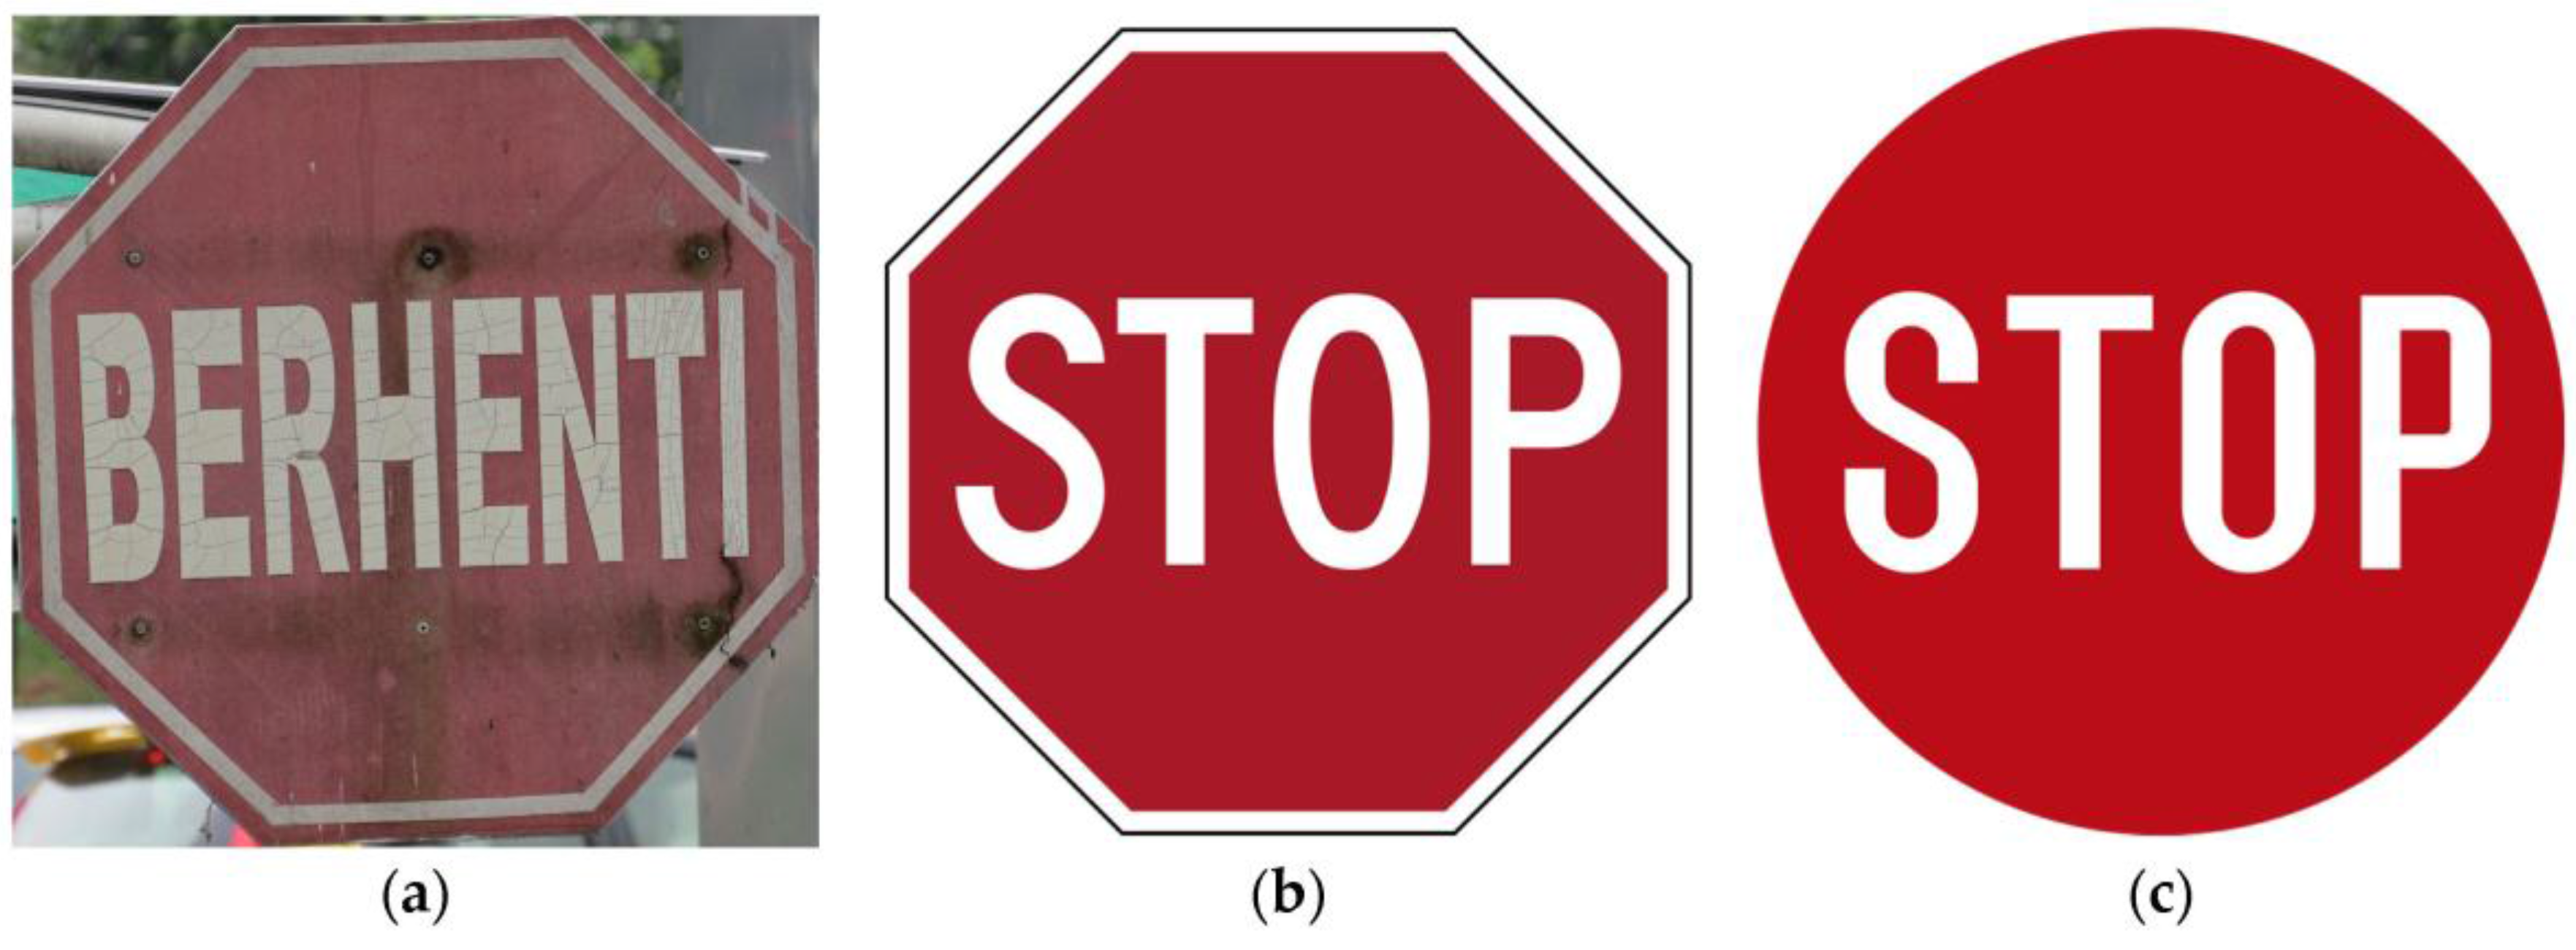
Recently, many researchers have proposed various traffic sign detection and recognition systems and they achieved satisfactory results [24]. Though existing systems can achieve fast processing speed and classification accuracy, the existing systems can only detect and recognize well-maintained and standard traffic signs. Moreover, these existing systems may not work properly for un-maintained and non-standard traffic signs. In many developing countries, to maintain the traffic sign may not be the top priority of respective authorities and these signs may get affected by environmental factors such as rain, illumination, pollution, damage due to accident or human error, etc. For instance, consider Figure 1a where the traffic sign has been faded due to continues sunlight. Furthermore, many countries have different colors and shapes for traffic signs identification because of their climate and other environmental factors. For instance, Figure 1b shows the standard ‘Stop’ traffic sign used by various developed countries such as USA, Canada, etc. On the other hand, Figure 1c shows the alternative traffic sign ‘Stop’ that is used in Vanuatu. Here, we can see, in Figure 1b,c the shape of the symbol ‘Stop’ is different for different countries.
Therefore, in this research, an intelligent and robust traffic sign detection and recognition system is developed that can identify the well-maintained, un-maintained, standard, and non-standard road traffic signs. The proposed system is developed using machine learning approaches. In the proposed system, the features were extracted using visual Bag-of-Words (BoW), and the discriminative features were chosen using k-means clustering approach. Finally, for the classification of the traffic sign, three different classifiers were employed namely, ANN, SVM, and Ensemble subspace kNN (k-nearest neighbors) classifiers. Our experimental results showed 99.00% accuracy for traffic sign recognition using ANN classifier.
This remainder of the paper is organized in the following way. Section 2 presents the related work. Research methodology is presented in Section 3. Section 4 shows experimental results. Section 5 presents the discussion based on obtained results. In Section 6, the significance of our proposed method is compared with one state-of-the-art baseline. Moreover, in addition to the collected dataset, the performance of the proposed method is also evaluated on one publicly available dataset of traffic sign images [25]. Finally, this research work is concluded in Section 7.
2. Related Work
Various traffic sign detection and recognition methods and algorithms have been developed. In recent years, several studies have proposed the intelligent traffic sign classification systems to classify ideogram-based traffic signs in real-time [16,26,27,28,29,30]. Ohgushi et al. [27] developed a traffic sign classification system that utilized color information and Bags of Features (BoF) using SVM classifier to classify traffic signs. Their proposed system failed to recognize traffic signs in two instances, when the traffic sign is intensively illuminated and when the traffic sign has partially been occluded with the same color object. Some researchers carried out the investigation to just detect traffic signs without the use of classification [31,32], whereby some researchers were focused on detection and recognition of the traffic signs [33]. Round road sign detection on Chinese highways was proposed by Wu et al. [31]. The limitation of [31] is it can only apply to the detection and recognition of round shaped road signs and cannot identify any other shaped traffic sign.
Wali et al. [15] proposed a method which had three main phases: the first phase was image pre-processing, the second phase was detection and the last phase was recognition. In the detection phase, they used color segmentation with shape matching. Finally, SVM classifier was used to perform recognition and it achieved 95.71% system accuracy. Lai et al. [34] proposed a sign recognition method for intelligent vehicles with smart mobile phones. Color detection was employed to perform in hue, saturation, and value (HSV) color space segmentation. Shape recognition based on template matching was done by using a similarity calculation. The optical character recognition (OCR) was utilized on the pixels inside the shape border to decide provided a match to the authentic sign. However, their proposed system was limited to only red color traffic signs. Moreover, very limited types of signs were used for classification.
Virupakshappa et al. [35] proposed a method of bag-of-visual-words technique with Speeded Up Robust Features (SURF) descriptors and SVM classifier which was used to identify the traffic signs. Their experimental results obtained an accuracy of 95.20%. Shams et al. [36] introduced a multi-class traffic sign recognition system based on the BoW features model and extended it further by using a spatial histogram that incorporates rough layout of images and greatly improves the classification. Their proposed recognition system is performed by SVM. A two-stage fuzzy inference model was introduced by Lin et al. [37] to detect the road traffic signs from a video frame and SVM was employed for recognition of road traffic signs. However, their proposed method was limited to only prohibitory and warning traffic signs.
Yin et al. [24] introduced a different technique for detection and recognition of traffic signs in real-time. They used Hough transformation to identify the ROI point to the traffic sign. Rotation invariant binary pattern (RIBP) was used to extract features and ANN was used for traffic signs classification. Lin et al. [38] proposed a low-multifaceted speed limit detection and recognition process which not only supported distinctive sorts of speed breaking point signs from different nations but also maintained a great identification rate under severe climates. However, their proposed system was only limited to the speed limit traffic signs.
As a subject of dynamic scholarly research, traffic sign recognition is additionally a technology that is being researched and enforced within the business industries. Many vehicle manufacturers (such as Tesla, Inc., Palo Alto, CA, USA; Continental AG, Hanover, Germany) develop the technology to detect and recognize the road traffic signs as a part of the smart vehicle. In 2010, the BMW-5 series (BMW, Munich, Germany) initiated the project of production of a traffic sign recognition system [39]. Moreover, BMW and several vehicle manufacturers also revealed some other models of this similar technology [40]. Volkswagen has also introduced it on the Audi A8 [41] (Audi, Ingolstadt, Germany). Furthermore, Mercedes-Benz has developed traffic sign recognition systems on their E and S class vehicles. Additionally, Google (Santa Clara, CA, USA) has also industrialized an automotive technology which lets a vehicle self-drive. A combination of the utilized information is stored in its map database, and that information is collected from its real-time environment. Google’s autonomous vehicle is able to securely operate in complex urban situations [42]. However, there is one incident that occurred with Google’s autonomous vehicle, when a driver ran a red light and collided with the passenger side door [43]. Recently, the Tesla Team announced that all of their new manufactured vehicles will possess full self-driving hardware [44].
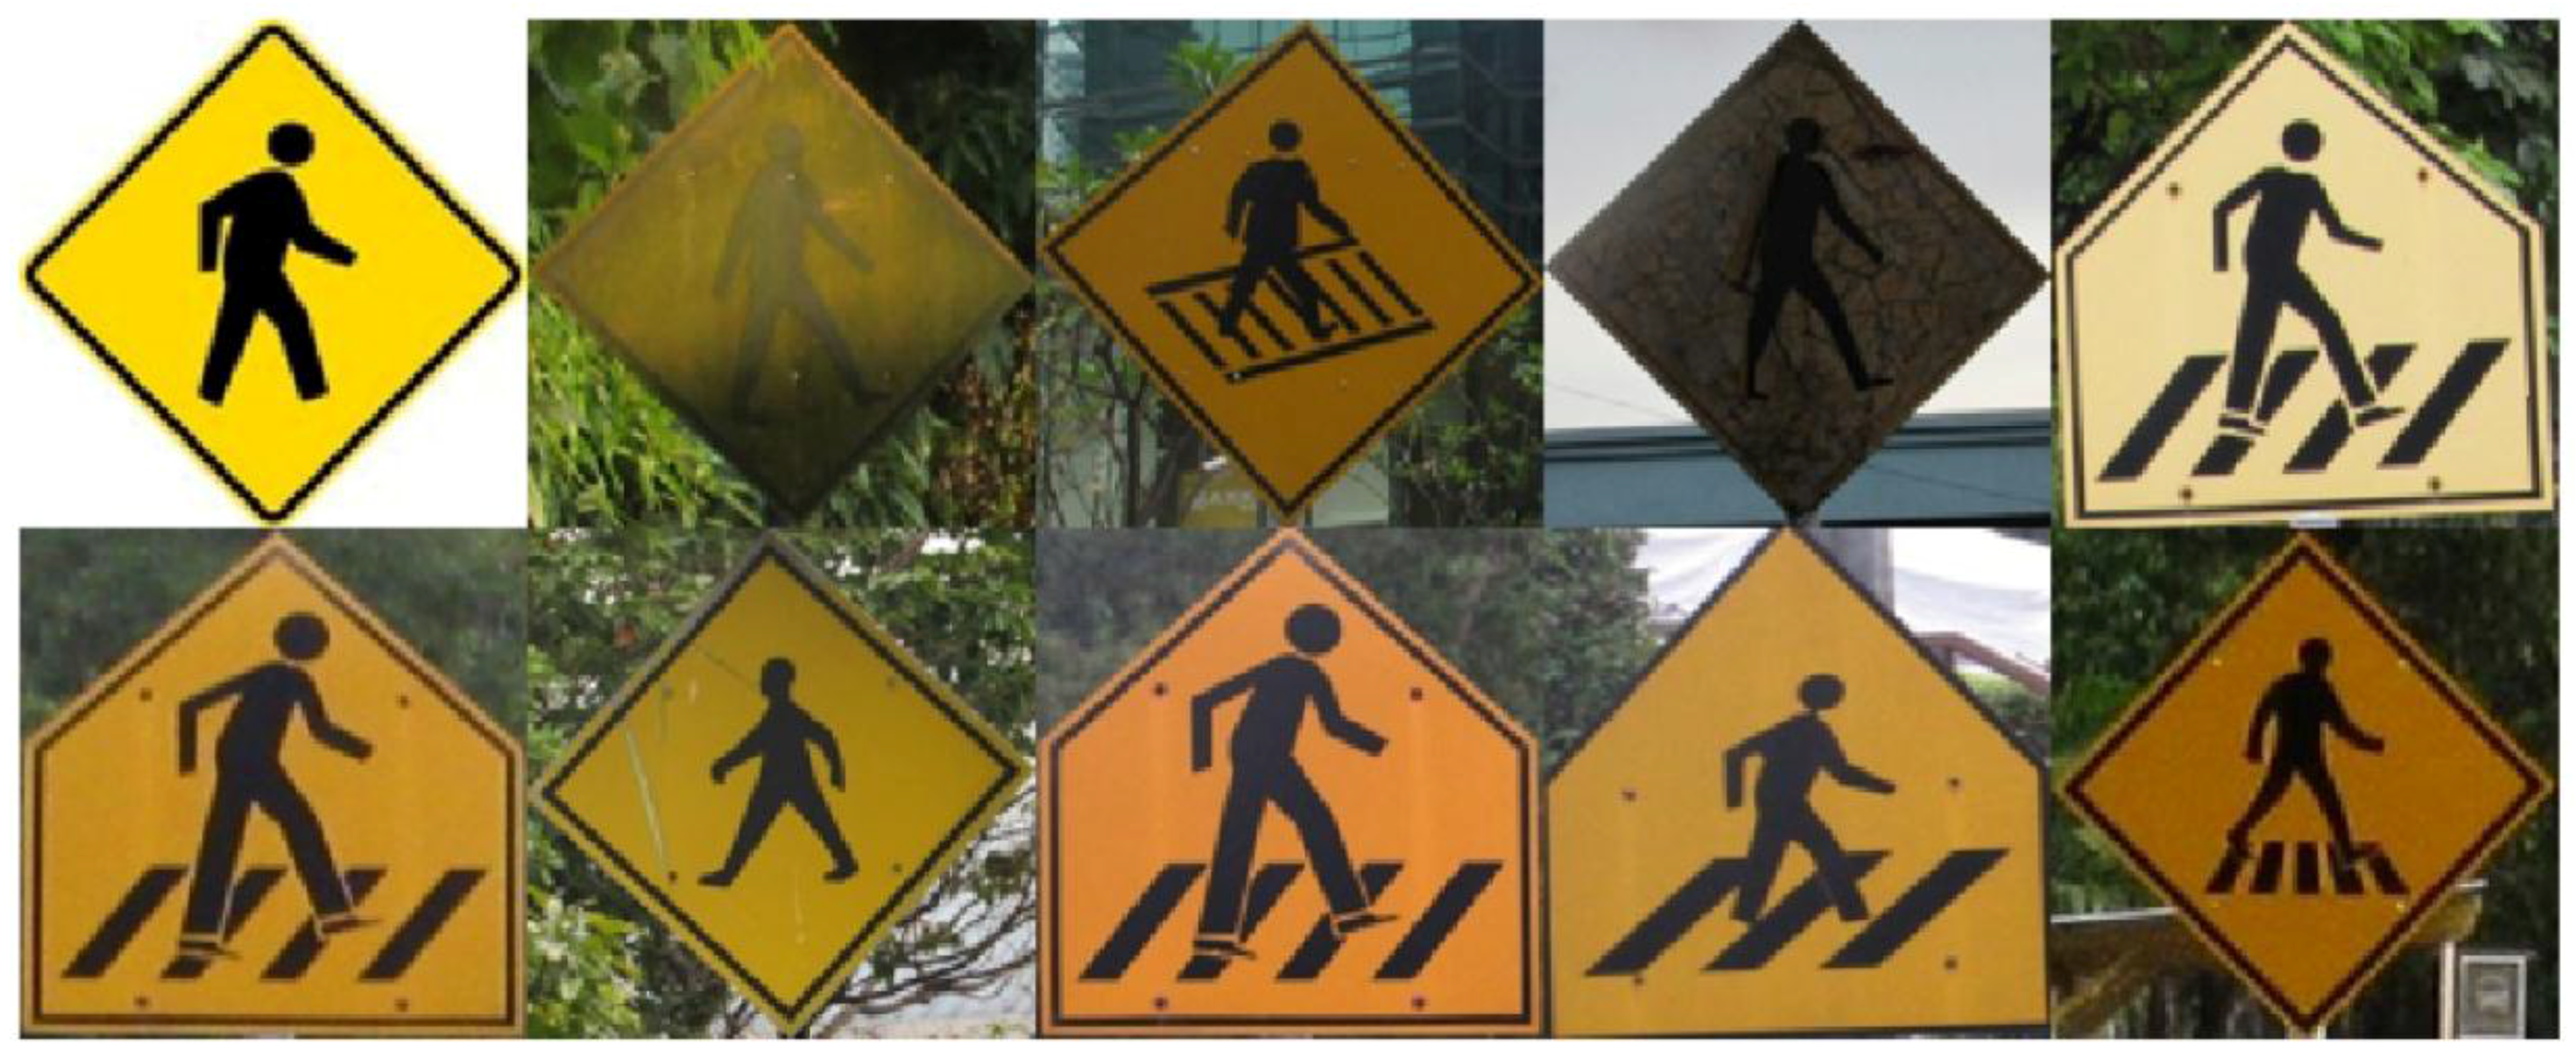
The existing academic literature shows that there are a variety of traffic sign detection and recognition systems. However, these existing systems are trained and tested on good quality images. Moreover, these systems are specifically designed for developed countries such as America, Canada, Germany, Finland, etc. In these countries, traffic signs are regularly and strictly maintained by the relevant authorities. Hence, the existing systems can undoubtedly work better in developed countries where these signs are maintained regularly. However, in many developing countries, these signs are not maintained on a top priority basis. Moreover, in many different countries, different symbols are used for the same purpose (as shown in Figure 1b,c). However, aforementioned studies did not consider this issue of non-standardization of traffic signs among various countries or even one country (such as Malaysia where different symbols are used for the pedestrian sign, as shown in Figure 2). Therefore, in this study, an intelligent, efficient, and effective traffic sign recognition system is developed that can detect and recognize un-maintained and non-standard traffic signs.
3. Research Methodology
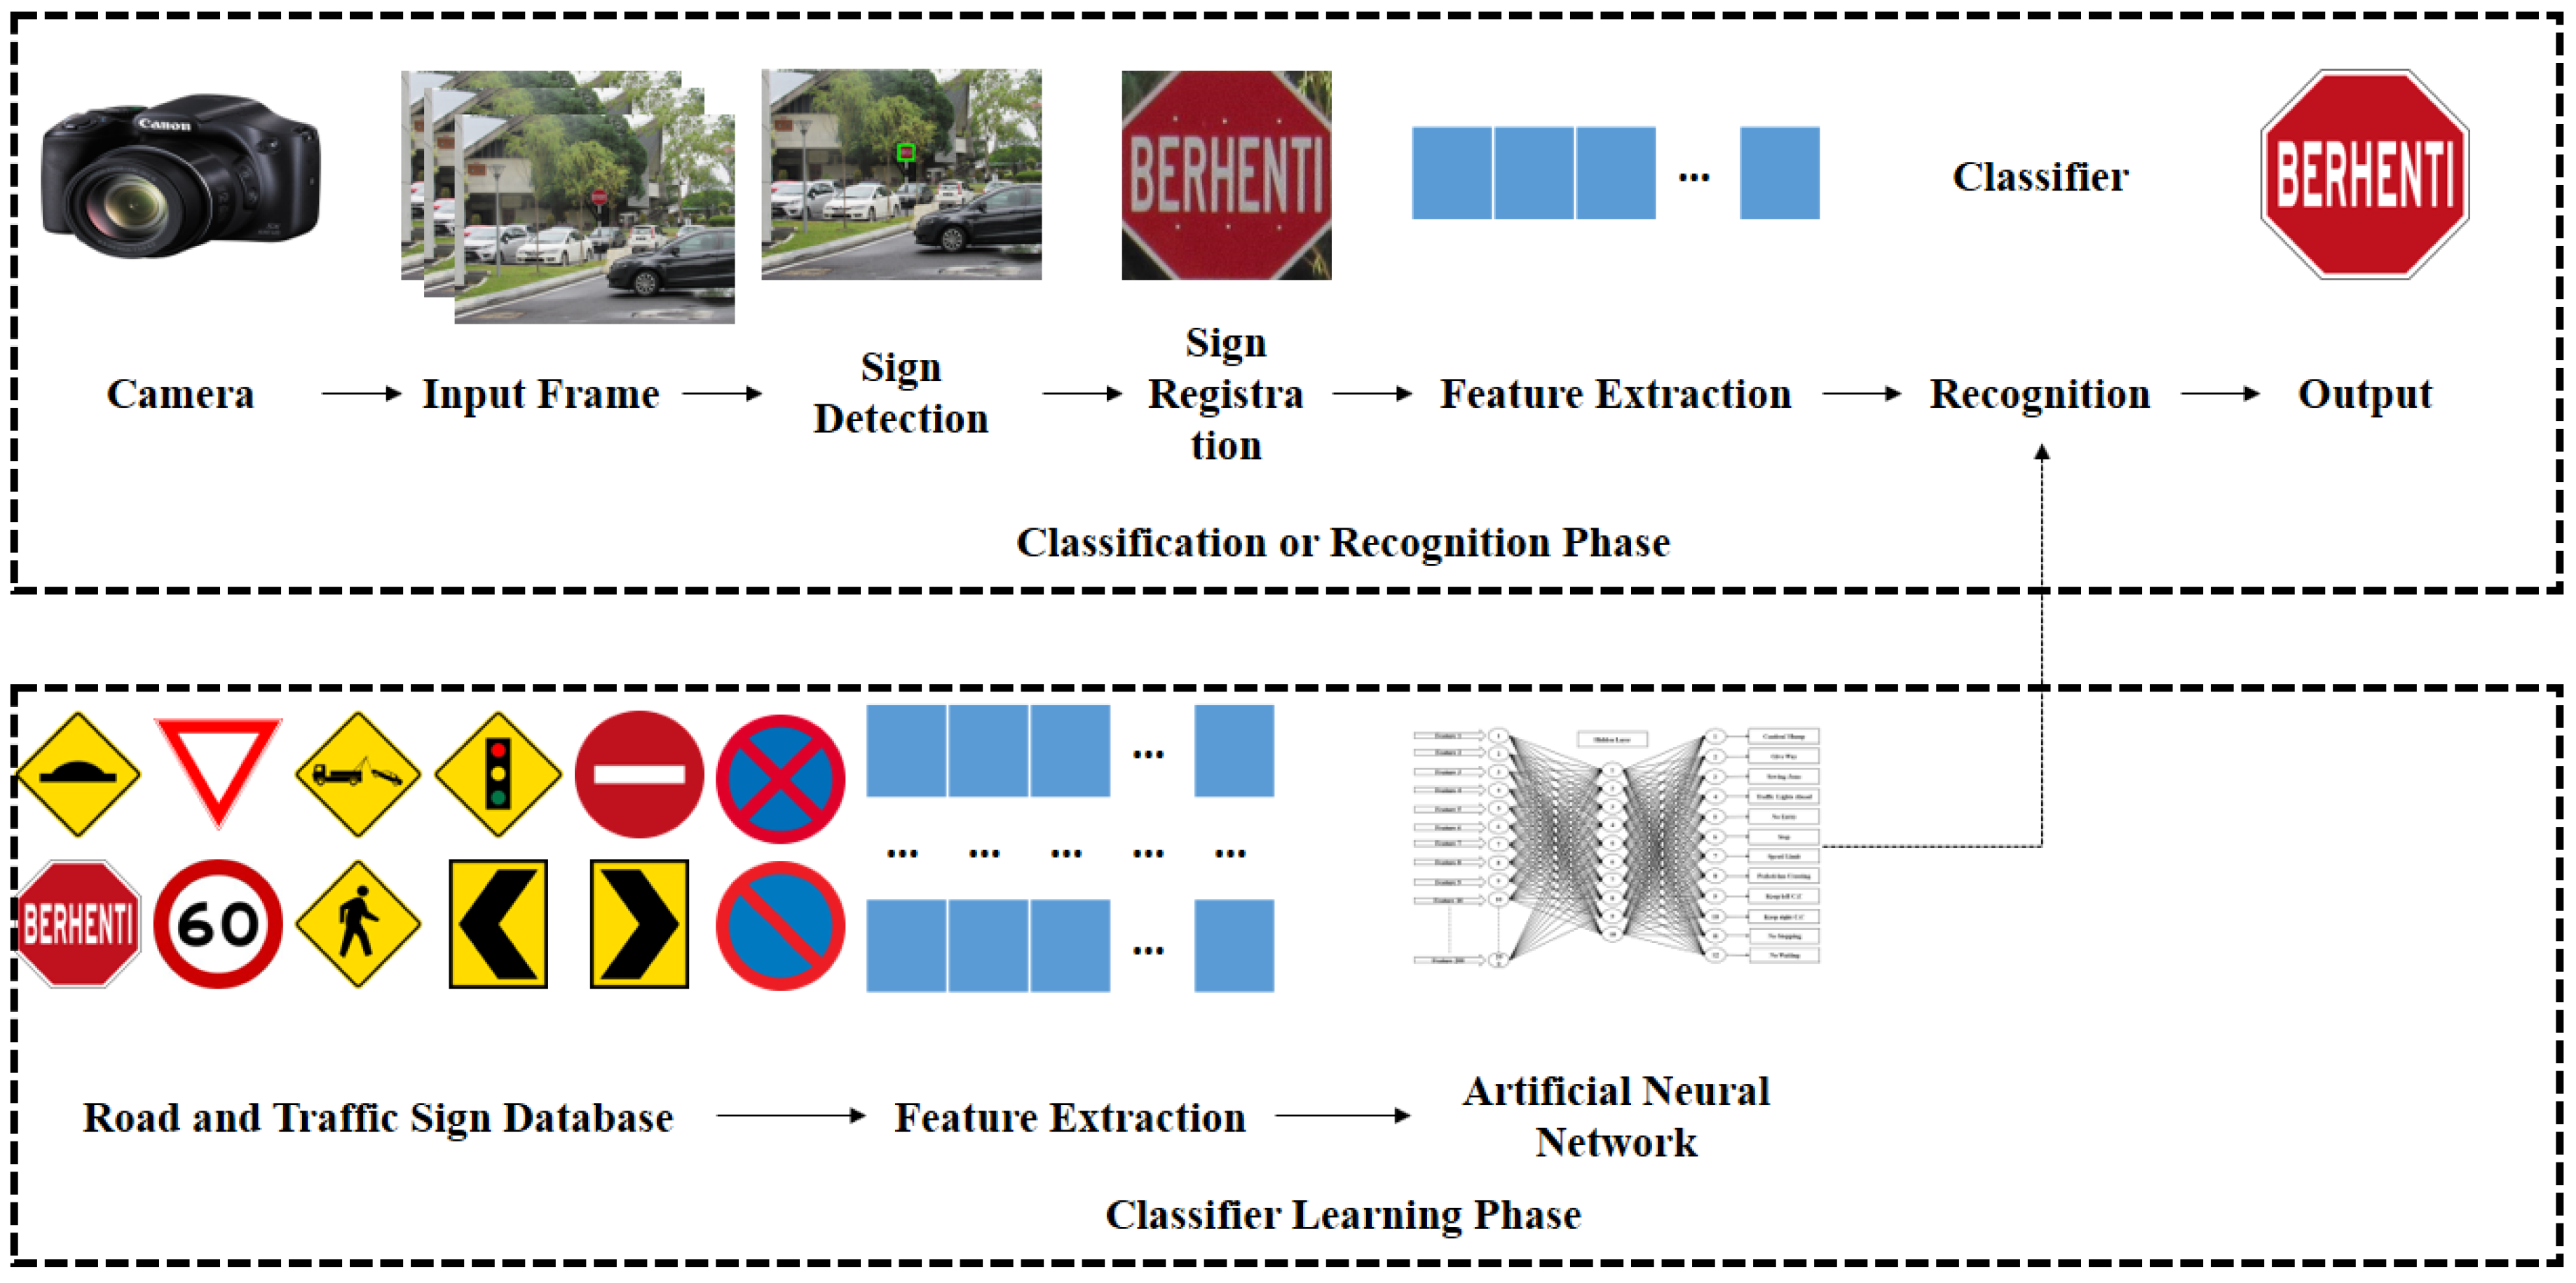
The research methodology of the proposed system is depicted in Figure 3. Here, the figure shows the learning and classification phases of the traffic signs recognition classifier. In the learning phase, various traffic signs were used to train the classifier. Various features were extracted from these images to create a master feature vector. This master feature vector is then fed to the classifier as an input to construct the classification model. In recognition or classification phase, a traffic sign is detected from the image, then features are extracted from the detected image to convert the detected sign into a feature vector. Finally, the constructed classifier recognizes the detected traffic sign. This process is discussed in more detail in subsequent sections.
3.1. Acquisition of Image
The sample images are collected by capturing them with a low-cost onboard digital camera (Canon Power Shot SX530 HS (Canon Inc., Tokyo, Japan)) which is placed in a moving vehicle. Under the several environmental conditions, sample images were captured from different route locations in Malaysia. As the Malaysian road is left handed, an onboard digital camera is mounted on the left-hand side of the dashboard. This camera position is suitable for capturing the left sided images of traffic signs. The main objective of this segment is to implement a traffic image database. It should be noted that our collected image datasets include standard, non-standard, maintained and the un-maintained set of traffic sign images. The training and testing images were captured in all kinds of weather such as rainy, sunny, and cloudy. The images were captured at various day and evening times ranging from 7:00 AM to 7:00 PM. The frame rate of the captured real-time images was 29 frames per second with an average of 60 km/h vehicle speed.
Our image dataset contains 12 different classes of traffic signs, namely Caution! Hump, Give Way, Towing Zone, Traffic Lights Ahead, No Entry, Stop, Speed Limit, Pedestrian Crossing, Keep Left Curve Chevron, Keep Right Curve Chevron, No Stopping, and No Parking. These 12 classes of traffic signs were captured because these signs have different colors, shapes, and pictograms throughout Malaysia. Moreover, these signs are frequently installed in many places. For each class, 100 samples were used for training purposes. For testing, 1200 real-time test images were used to detect and recognize the class of particular traffic sign. Hence, overall, our dataset comprised of 2400 training and testing images.
3.2. Traffic Sign Detection Phase
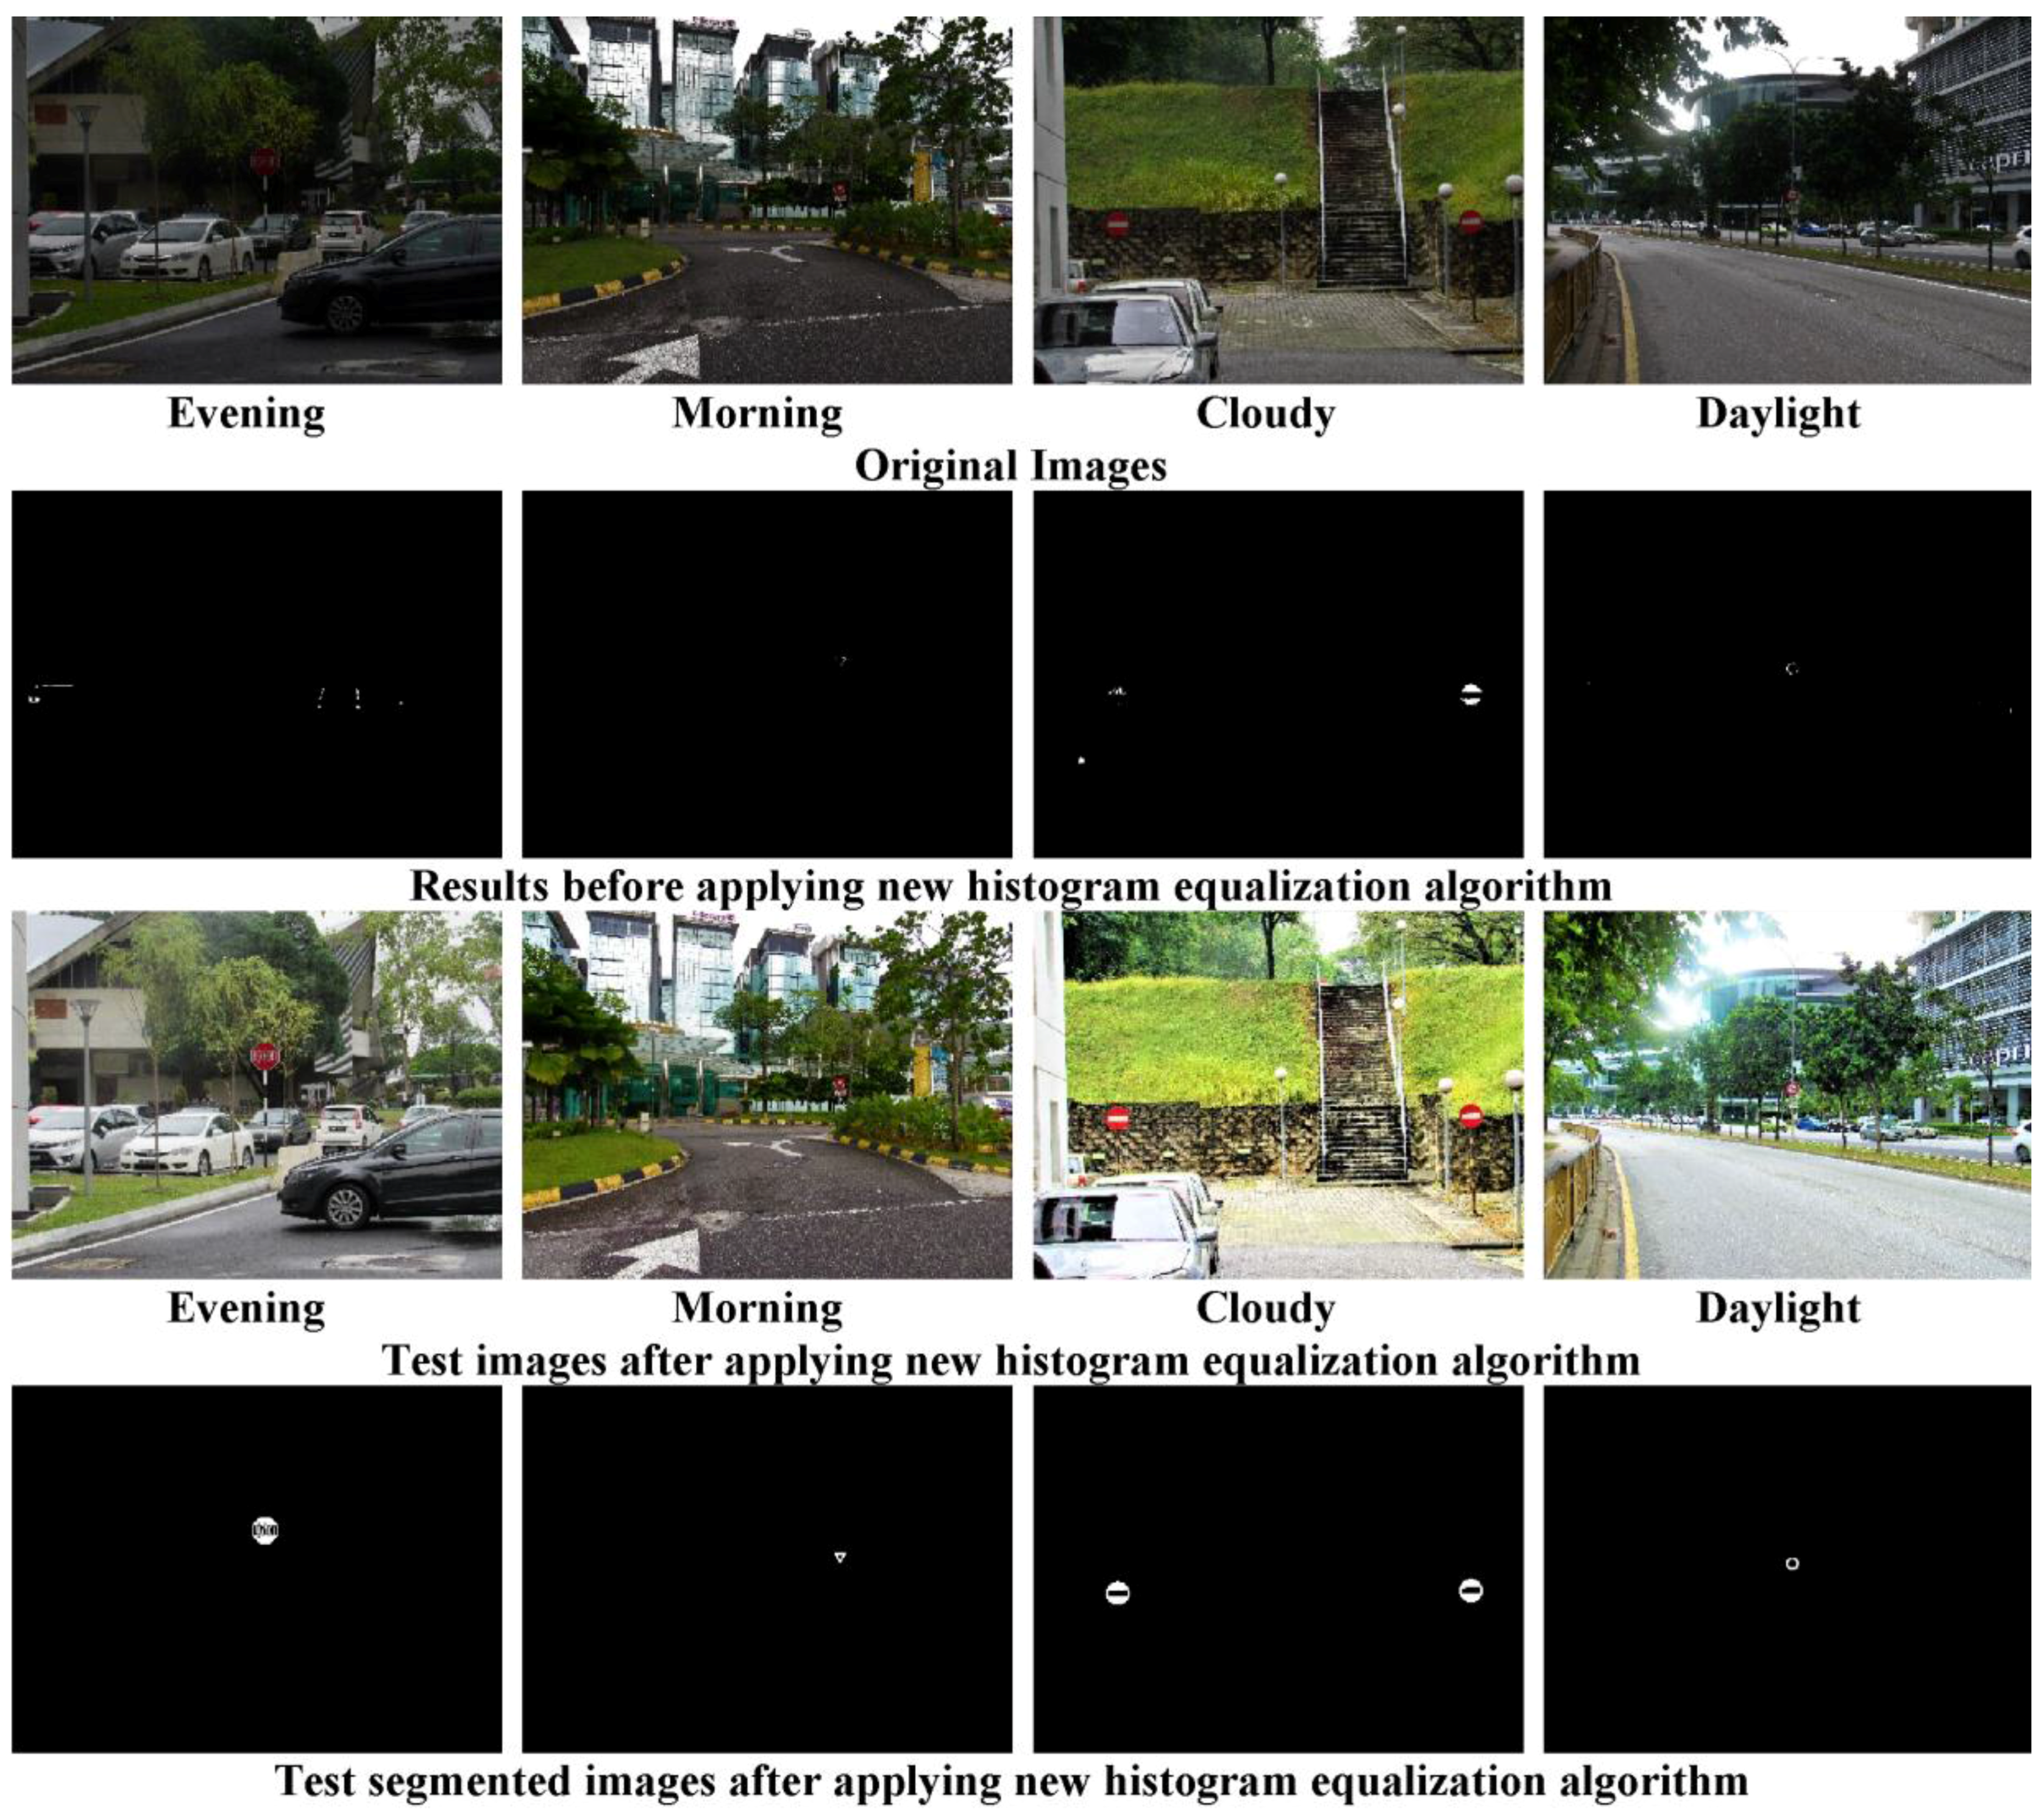
To detect a traffic sign from a captured real-time image, initially image pre-processing was performed to eliminate the noise of unwanted background, normalizing the intensity of the different elements of the images, eliminating reflections, and image portions masking. Afterward, to improve the image quality in terms of brightness, and contrasts, histogram equalization technique was employed, as shown in Figure 4.
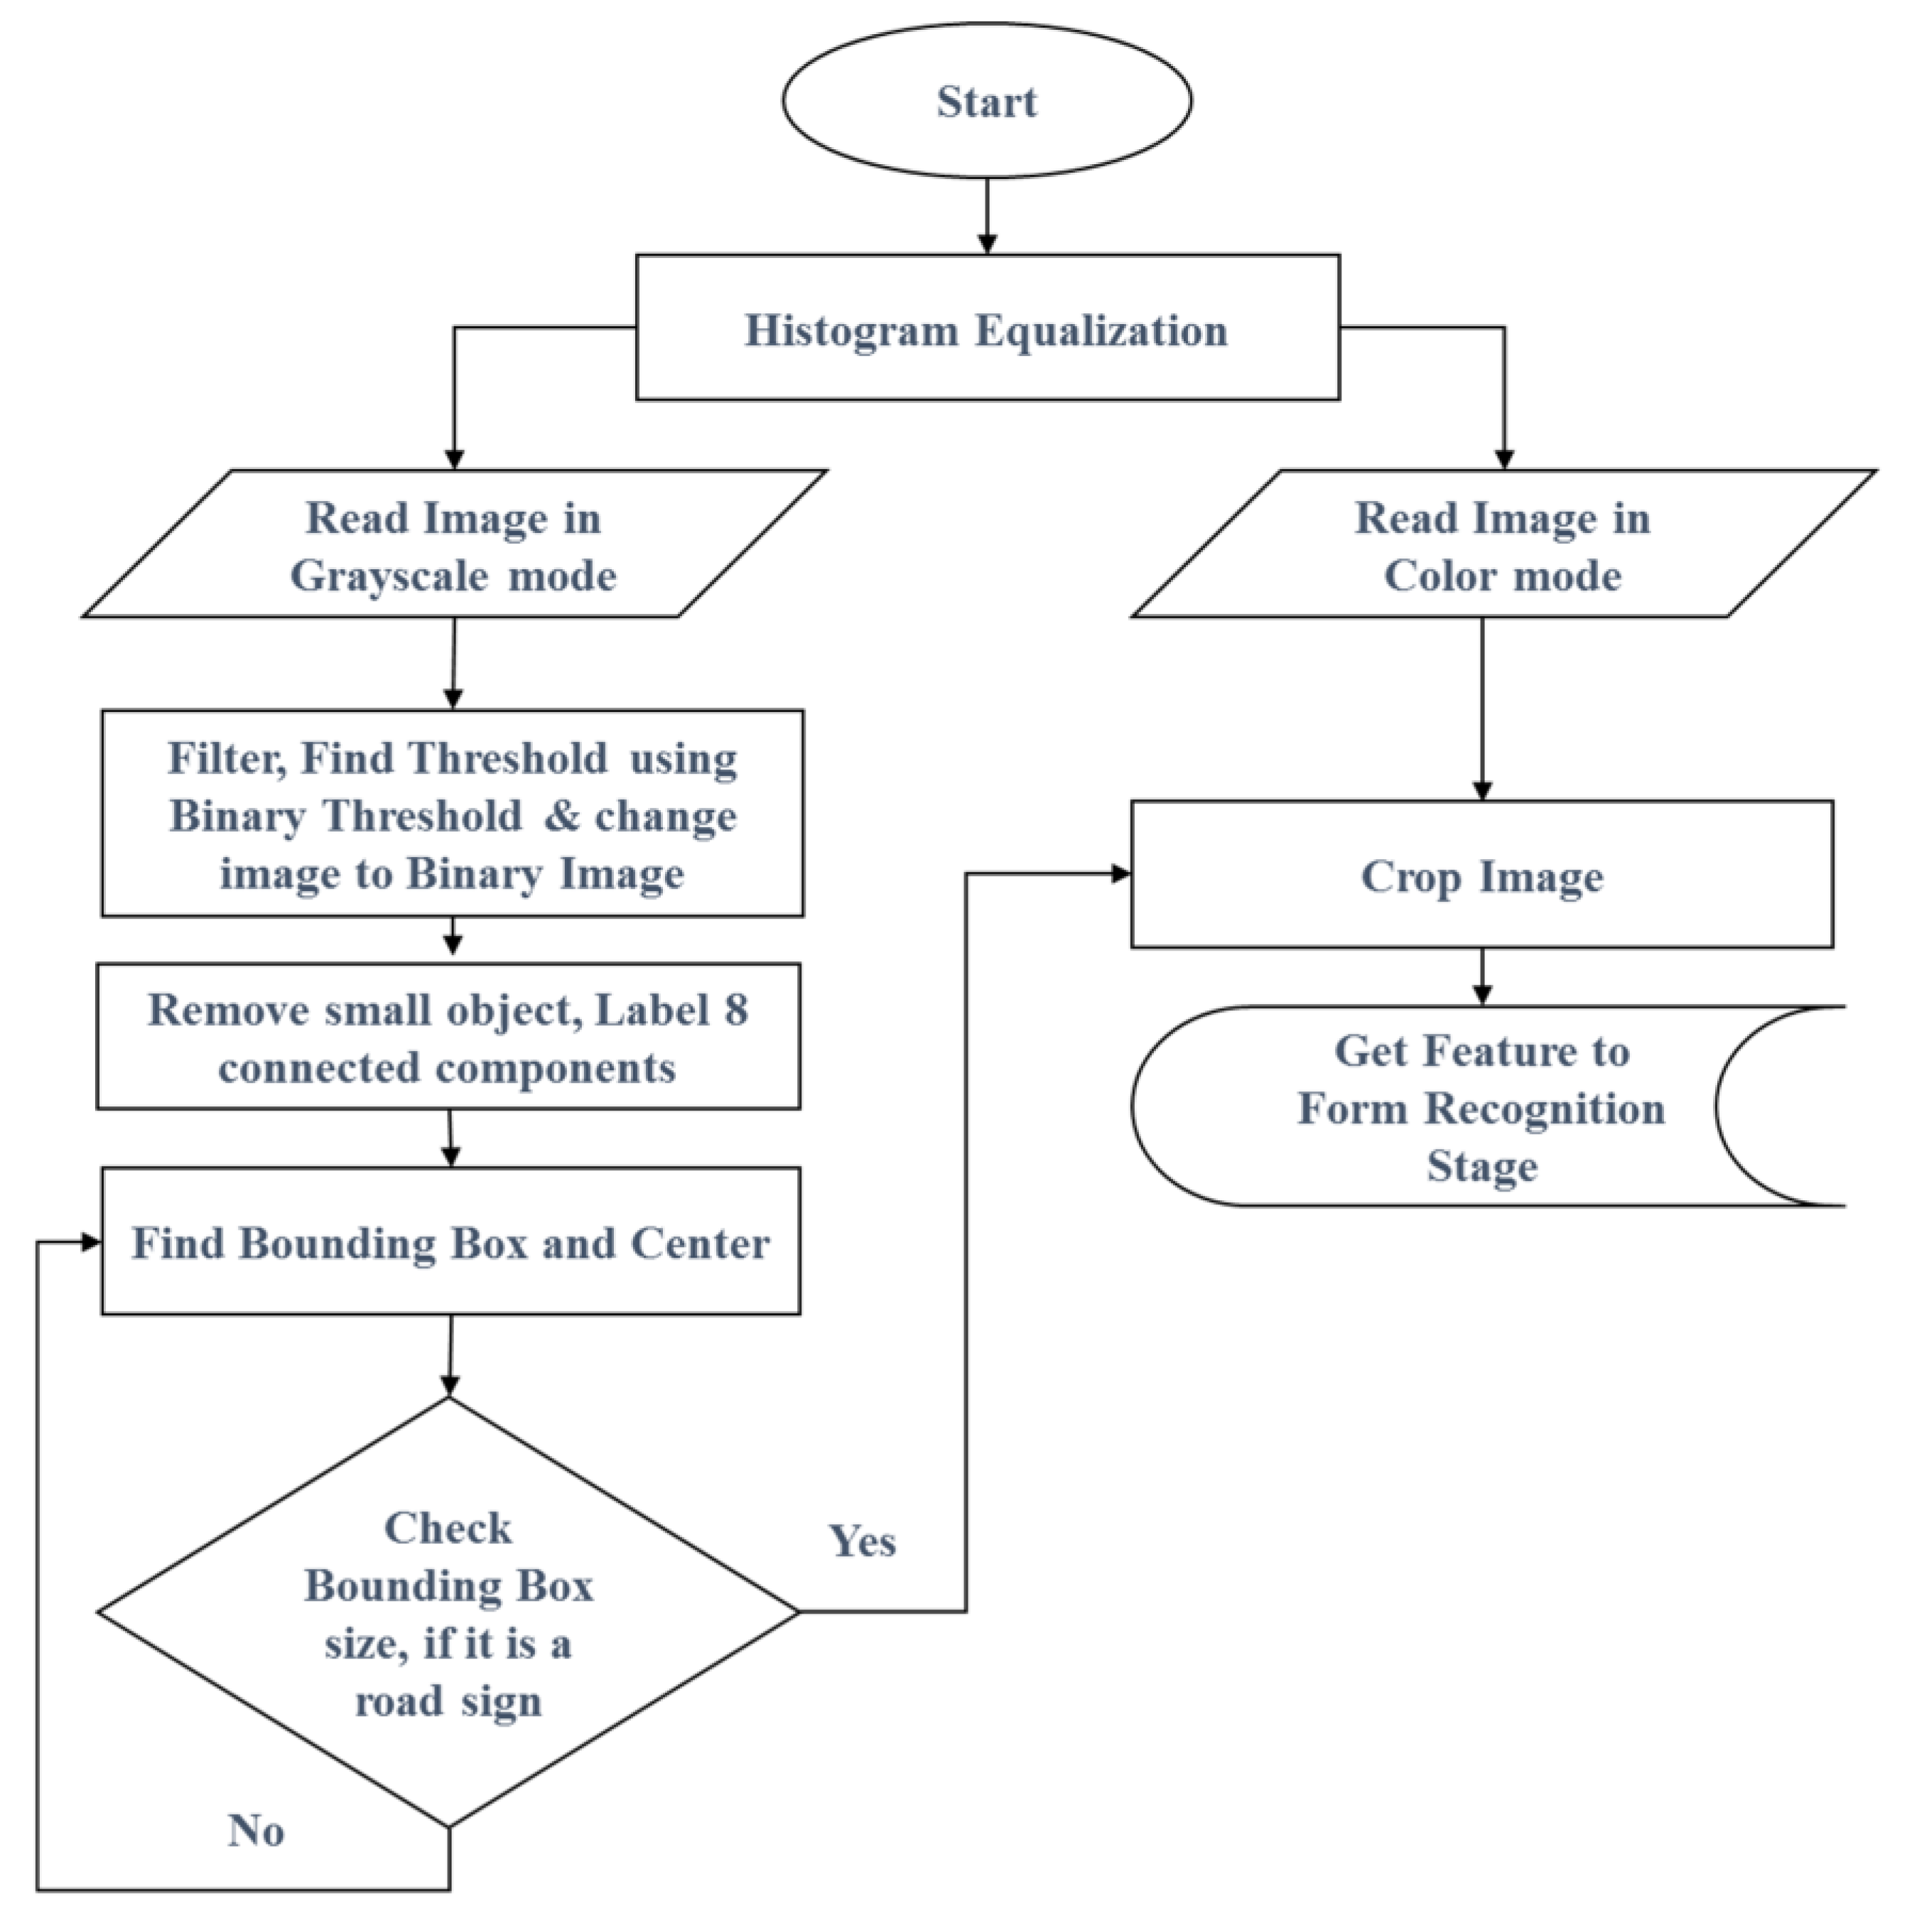
Finally, the traffic sign was detected from the captured image using detection phase as shown in Figure 5. As shown here, the quality of raw input image was enhanced by using the histogram equalization and it was read into color and grayscale mode. Moreover, a median filter was used to remove existing noise from the grayscale image and then the grayscale image was converted into a binary image using the threshold level of 0.18. This threshold level was used because it gives the best performance for sign detection. Afterward, small objects from the binary image were removed. Additionally, the target traffic signs’ property such as center, width, and height were calculated by using shape measurement to determine the ROI. Finally, based on the calculated ROI, the detected traffic sign was extracted from the original red, green, blue (RGB) colored image in colored mode.
An example illustration of the detection system has been shown in Figure 6. Here, Figure 6a is representing an image frame having a complex background, and Figure 6b is representing an image frame having an ordinary background. As shown here, in our proposed system, the detection phase can extract both the image frame’s ROI and it can also extract target traffic sign candidates.
3.3. Traffic Sign Recognition Phase
Once the detection phase detects the traffic sign candidate from the captured image, that traffic sign will be passed to recognition phase to classify that sign into a specific class. There are two main steps involved to recognize or classify the detected traffic sign, particularly feature extraction and classification. These steps are discussed in detail in subsequent sections.
3.3.1. Feature Extraction
The process of feature extraction and selection obtain useful parts of an image to represent it in a compact feature vector [45]. For extracting useful features from a detected traffic sign, BoW was employed. The BoW uses SURF and k-means clustering to obtain the most discriminative features of an image.
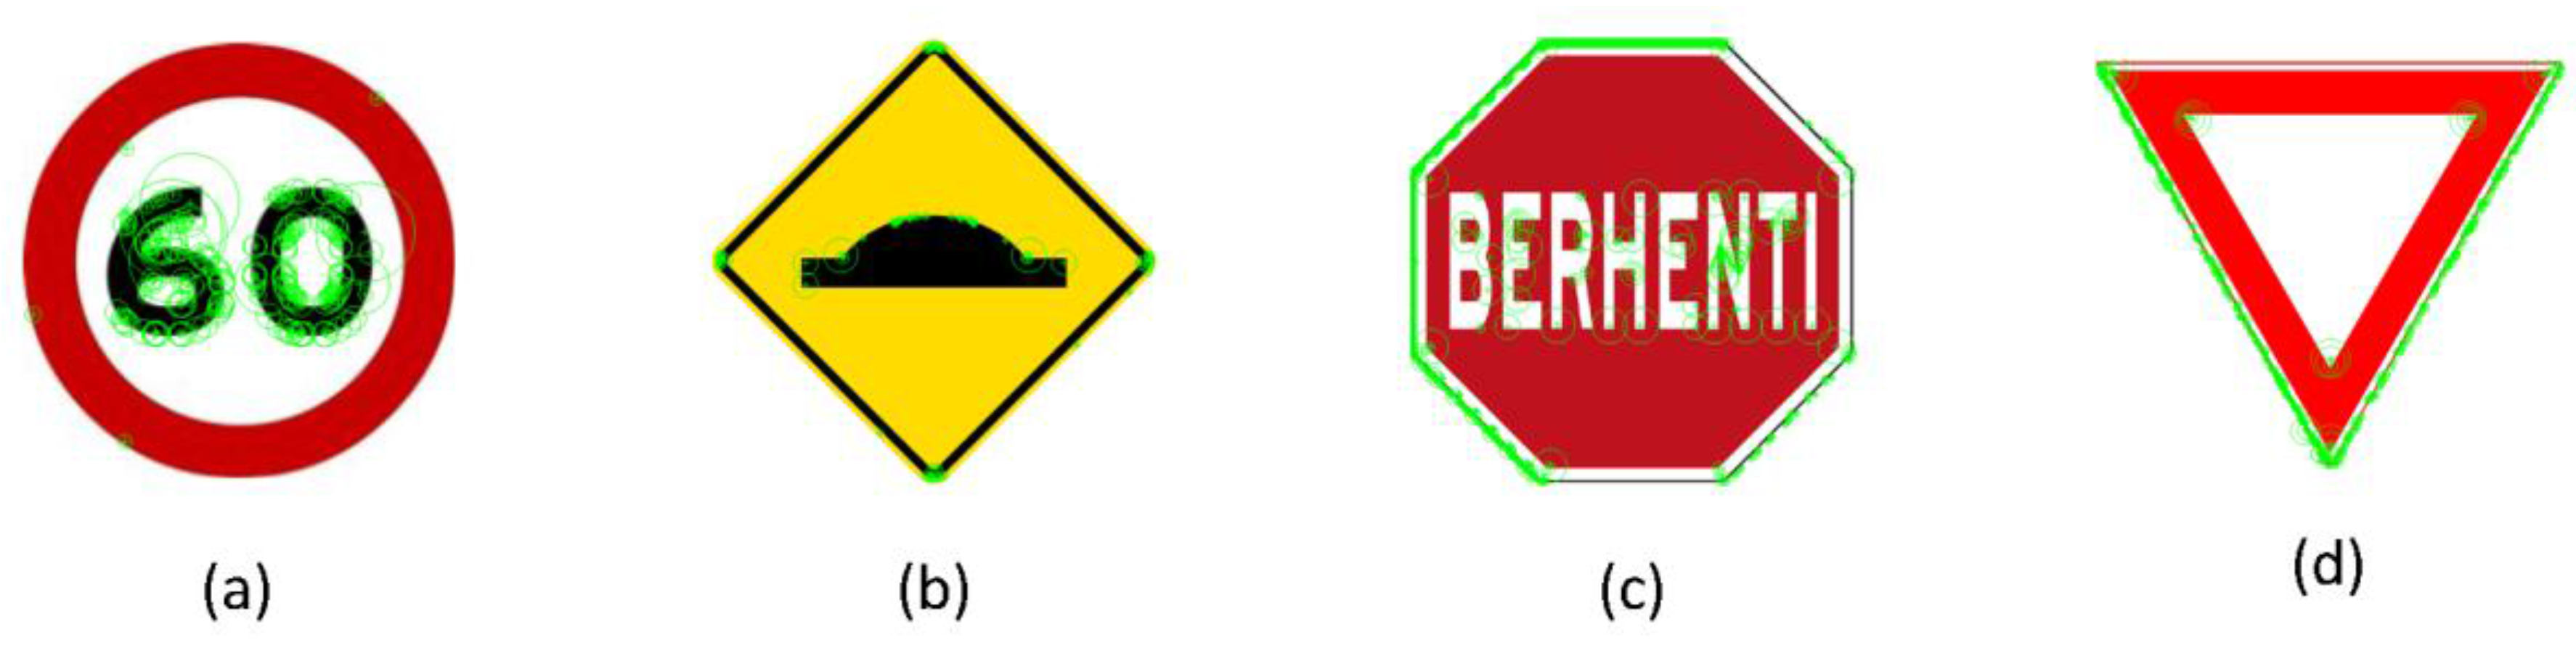
In the computer vision, SURF [46] approach is used to extract local feature descriptor. This approach can be utilized with machine learning classifier to identify an object from an image. This technique was developed as a variant of traditional Scale Invariant Feature Transform (SIFT) descriptor and is much faster than tradition SIFT. For the image feature extraction, using SURF descriptor is the most important step of this proposed system of traffic sign recognition. SURF delivers the sign of Laplacian, position, orientation, and scale as shown in Figure 7.
For the descriptors and the interest point extraction, SURF involves multiple steps of the image features calculation. To find the interest points, SURF uses a Hessian-based blob detector. The element of a Hessian matrix expression, the extent of the response is an expression of the local change around the area. In the following stages, the raw images are calculated and are used to improve the system performance. The following equations are known as a Hessian matrix [47].
where
In Equation (1) Lxx(x, σ) represents the convolution of the image with the second derivative of the Gaussian. The essential parameter of SURF is non-maximal-suppression of determinants of Hessian matrices. The convolutions are very expensive to compute, hence, these are approximated and fasten with a utilization of approximated kernels and integral images. An input image I(x) is an image where each point x = (x, y)T is stored as the sum of all pixels in rectangular area between origo and x shown in the Equation (2).
In an image representation using the BoW model, an image may be presented as a document. Similarly, “word” in images also need to be defined. To achieve this, the following three phases are usually required, first is features detection, second is features description, and third is clustering [48]. A simple definition of the BoW for an image may be the “histogram representation of an image based on independent features” [49]. This is utilized to change over the 64 measurement descriptors into histograms of codes. This method is utilized to take up with the SURF descriptors to its different picture. If the output of SURF descriptors area unit is used as an input for ANN then ANN might be unable to understand the decision boundaries. The BoW outputs are going to be a group of codes for every descriptor and a thin bar chart of those codes represent every traffic sign distinctively.
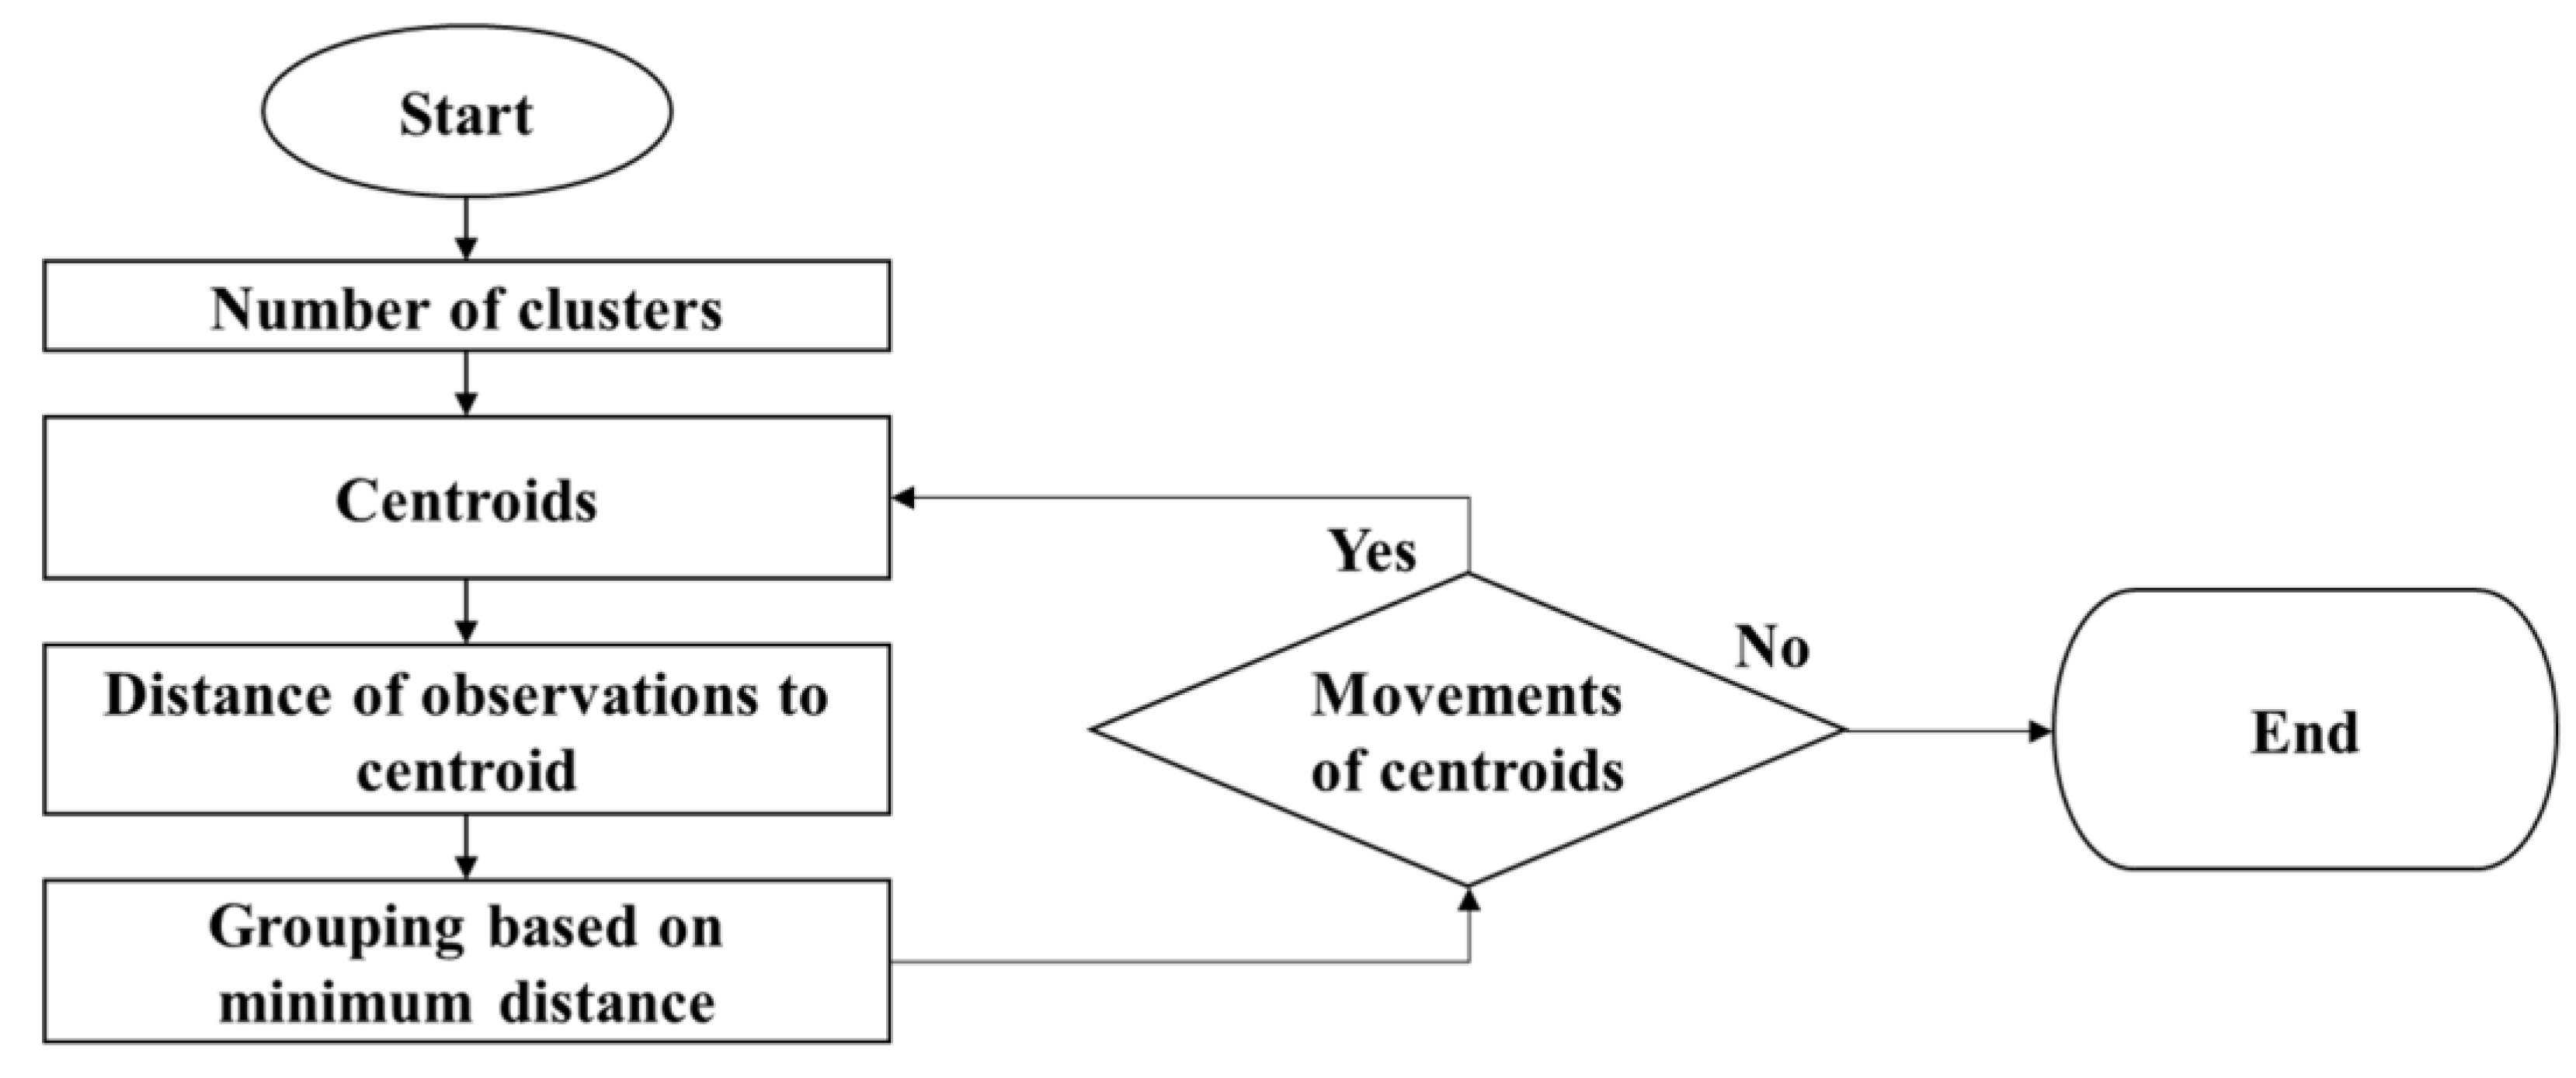
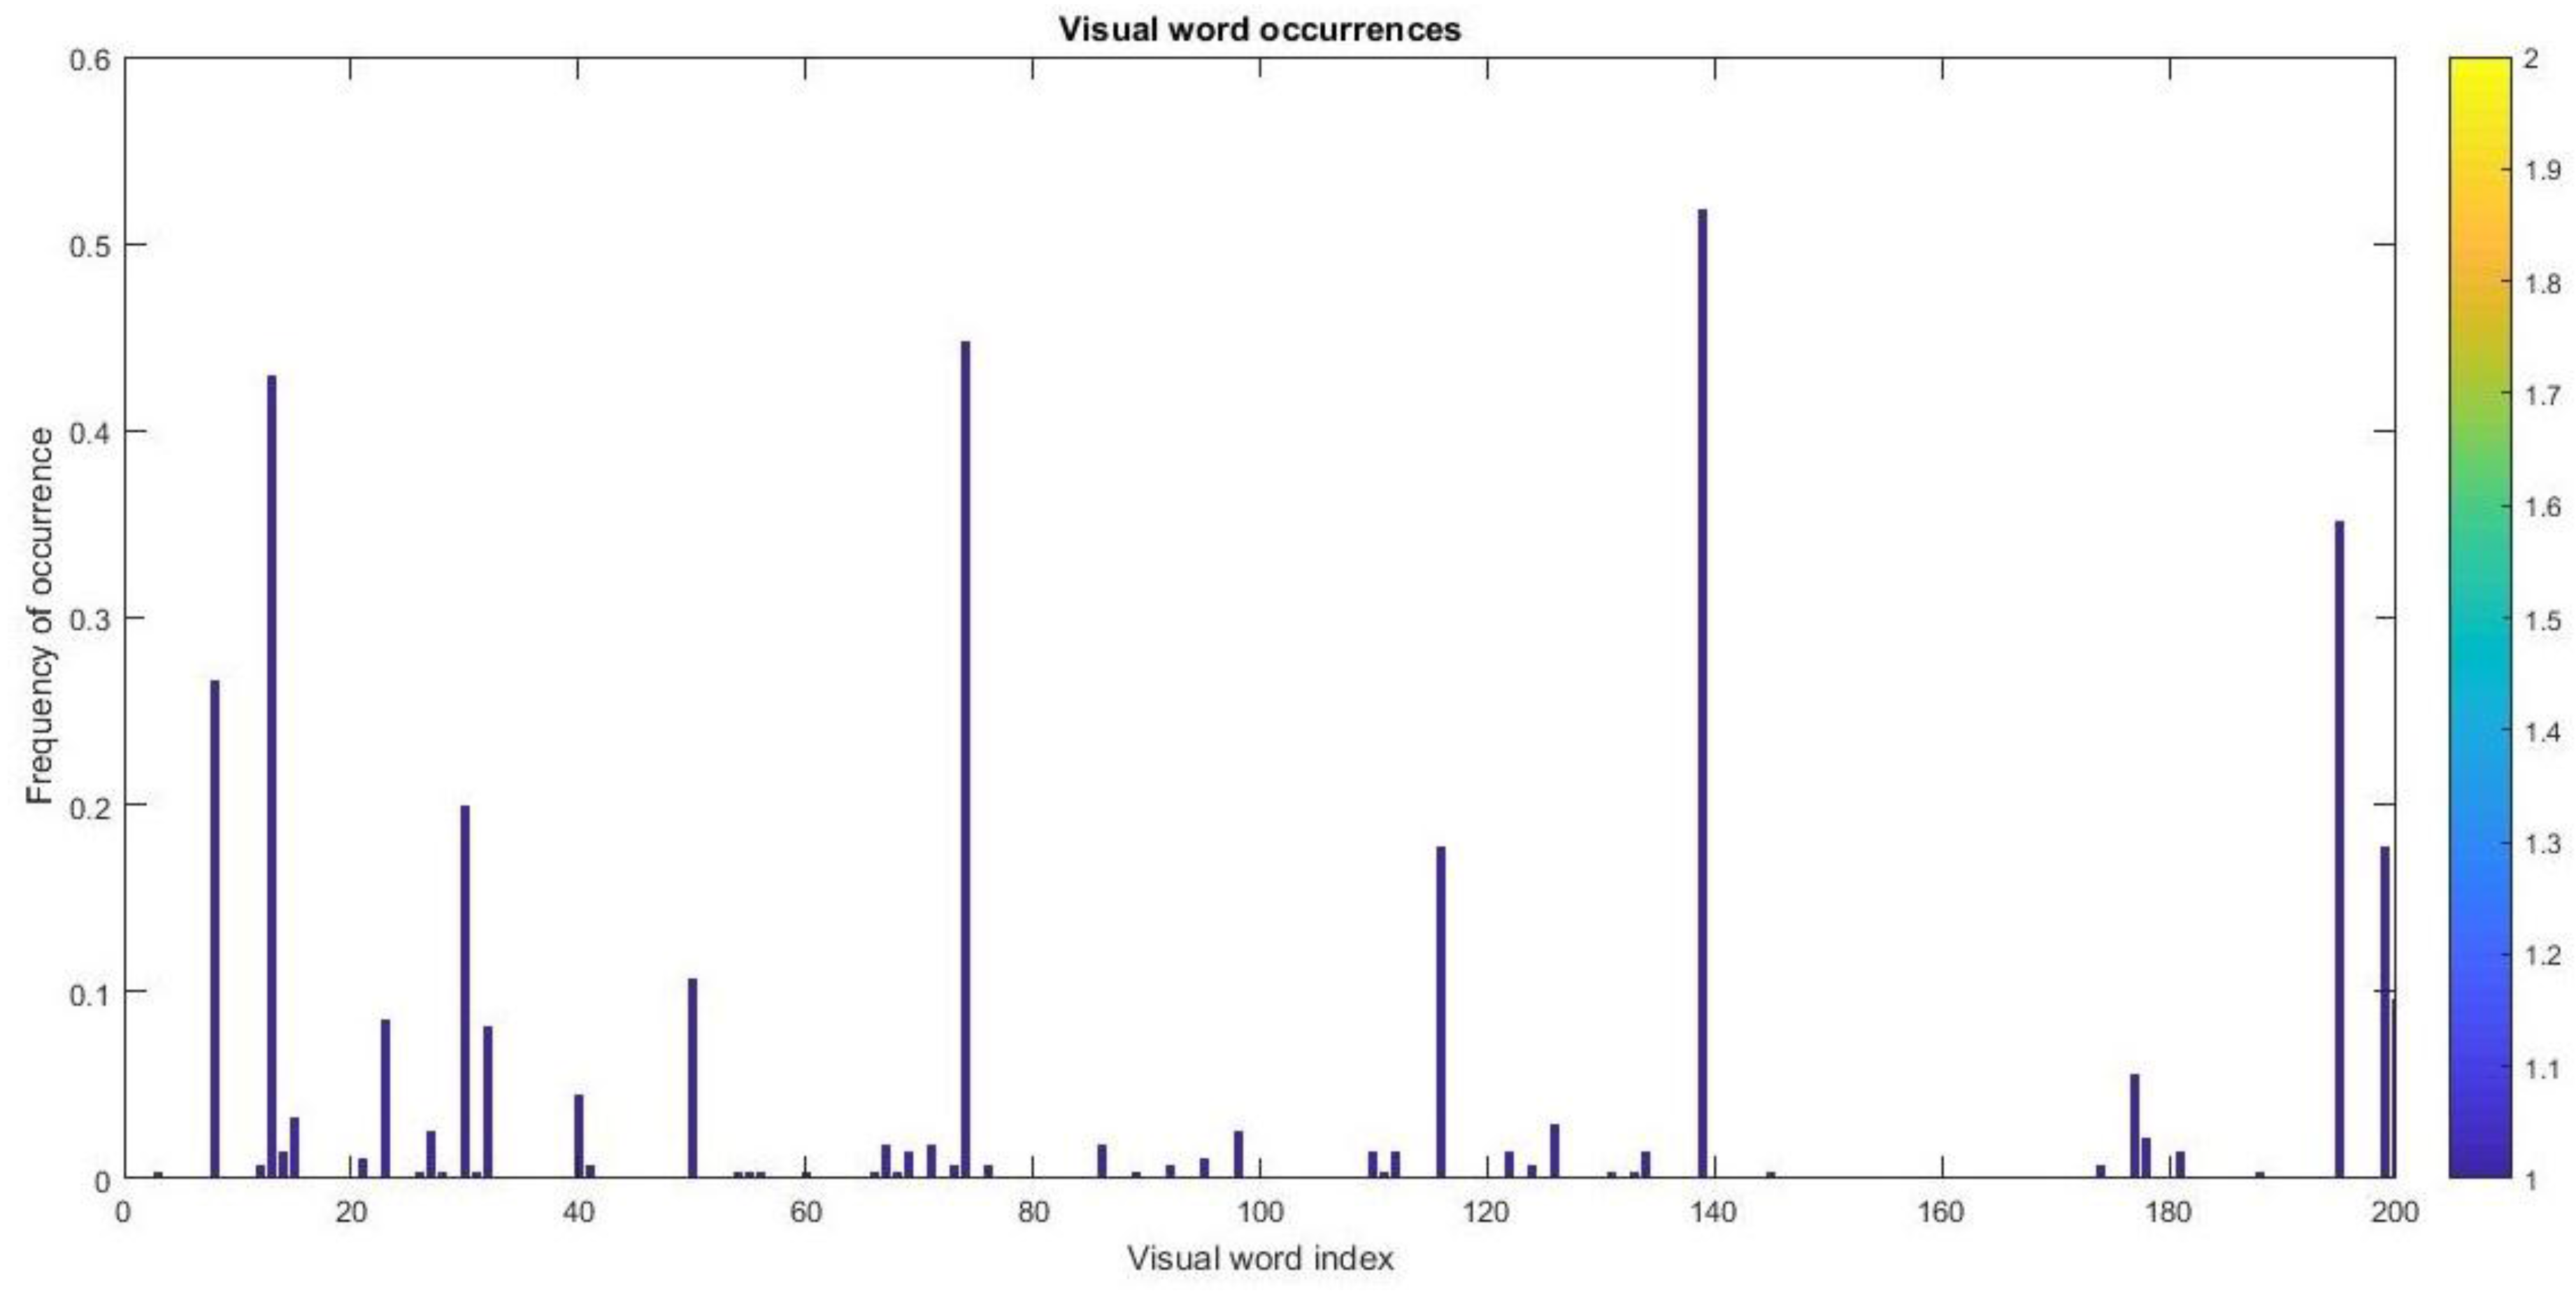
K-means clustering is commonly used with BoW process. However, finding the centroid of the clusters is the most critical step. K-means clustering [50] is a technique of vector quantization. It initially comes from signal processing, however, these days, it is also extensively used for the classification of an image. The main objective of k-means clustering is to make a section of n observations into k clusters, whereby, every observation will be a part of a cluster with the nearest mean, as shown in Figure 8. Clustering may be implemented by using several ways and methods, however, mostly all of the methods are especially used in a mathematical or computational process. In this computational process method, the preliminary centroids mean value has been provided to use for a task stage and update stage. The task stage works to the distribution of every updated observation to the closest mean by using the Within-Cluster-Sum-of-Squares (WCSS), through this up to date stage another mean value is computed by including the new perception. This technique is involved in repetition until every one of the perceptions is mulled over or the quantity of repetitions achieves the operator given value. The k-means++ technique in MATLAB (MathWorks, Natick, MA, USA) is utilized to determine the preliminary mean value. This technique specified a code if the centroid is found. For our proposed system, the number of k was set to 200. The number of k = 200 means that every sign is encoded with 200 features to identify the class of detected sign. The value for k = 200 has been used because this number showed the best performing results.
Afterward, the updated data will be associated with the closest centroid by applying Euclidean distance function [51]. The minimum Euclidian distance is the neighboring centroid to the new data. This technique of defining the neighboring centroid is also called minimum Euclidean distance measure [52]. Afterward, the subsequent data is allocated with the new code, which is linked with centroid as depicted in Figure 9.
Figure 10 shows the BoW feature vector visualization of one traffic sign where the number of visual word index is 200 because every sign is encoded with 200 features.
3.3.2. Classification of Traffic Sign
The abovementioned feature extraction process outcome is numeric feature vector. This numeric feature vector is fed as an input to machine learning classifier to classify or recognize the traffic sign into respective class. In our proposed system, three different machine learning classifiers were employed namely, SVM, ANN, and Ensemble subspace kNN classifier to evaluate which one is more accurate and robust in our dataset. These three classifiers were chosen because Delgado et al. [53] tested 179 classifiers, and concluded that SVM, ANN, RF, and kNN produce better results in image classification.
SVM
The SVM decision model is based on statistical theory. It obtains reasonable accuracy in image processing and other related applications. SVM learns from training data, where each data instance has n data points followed by a class of the instance. In SVM, classes are separated by applying an optimum hyperplane by decreasing the distance between classes. These hyperplanes are known as support vector, where each side of the vector contains the instances of different classes [54].
Ensemble Subspace kNN
In Ensemble subspace kNN classifiers, each member of Ensemble classifiers has access to a random feature subset. This random feature subset is delegated to classifiers by using random subspace algorithm. The outcomes of these multiple nearest neighbor classifiers are combined for final decision using majority voting method [55].
ANN
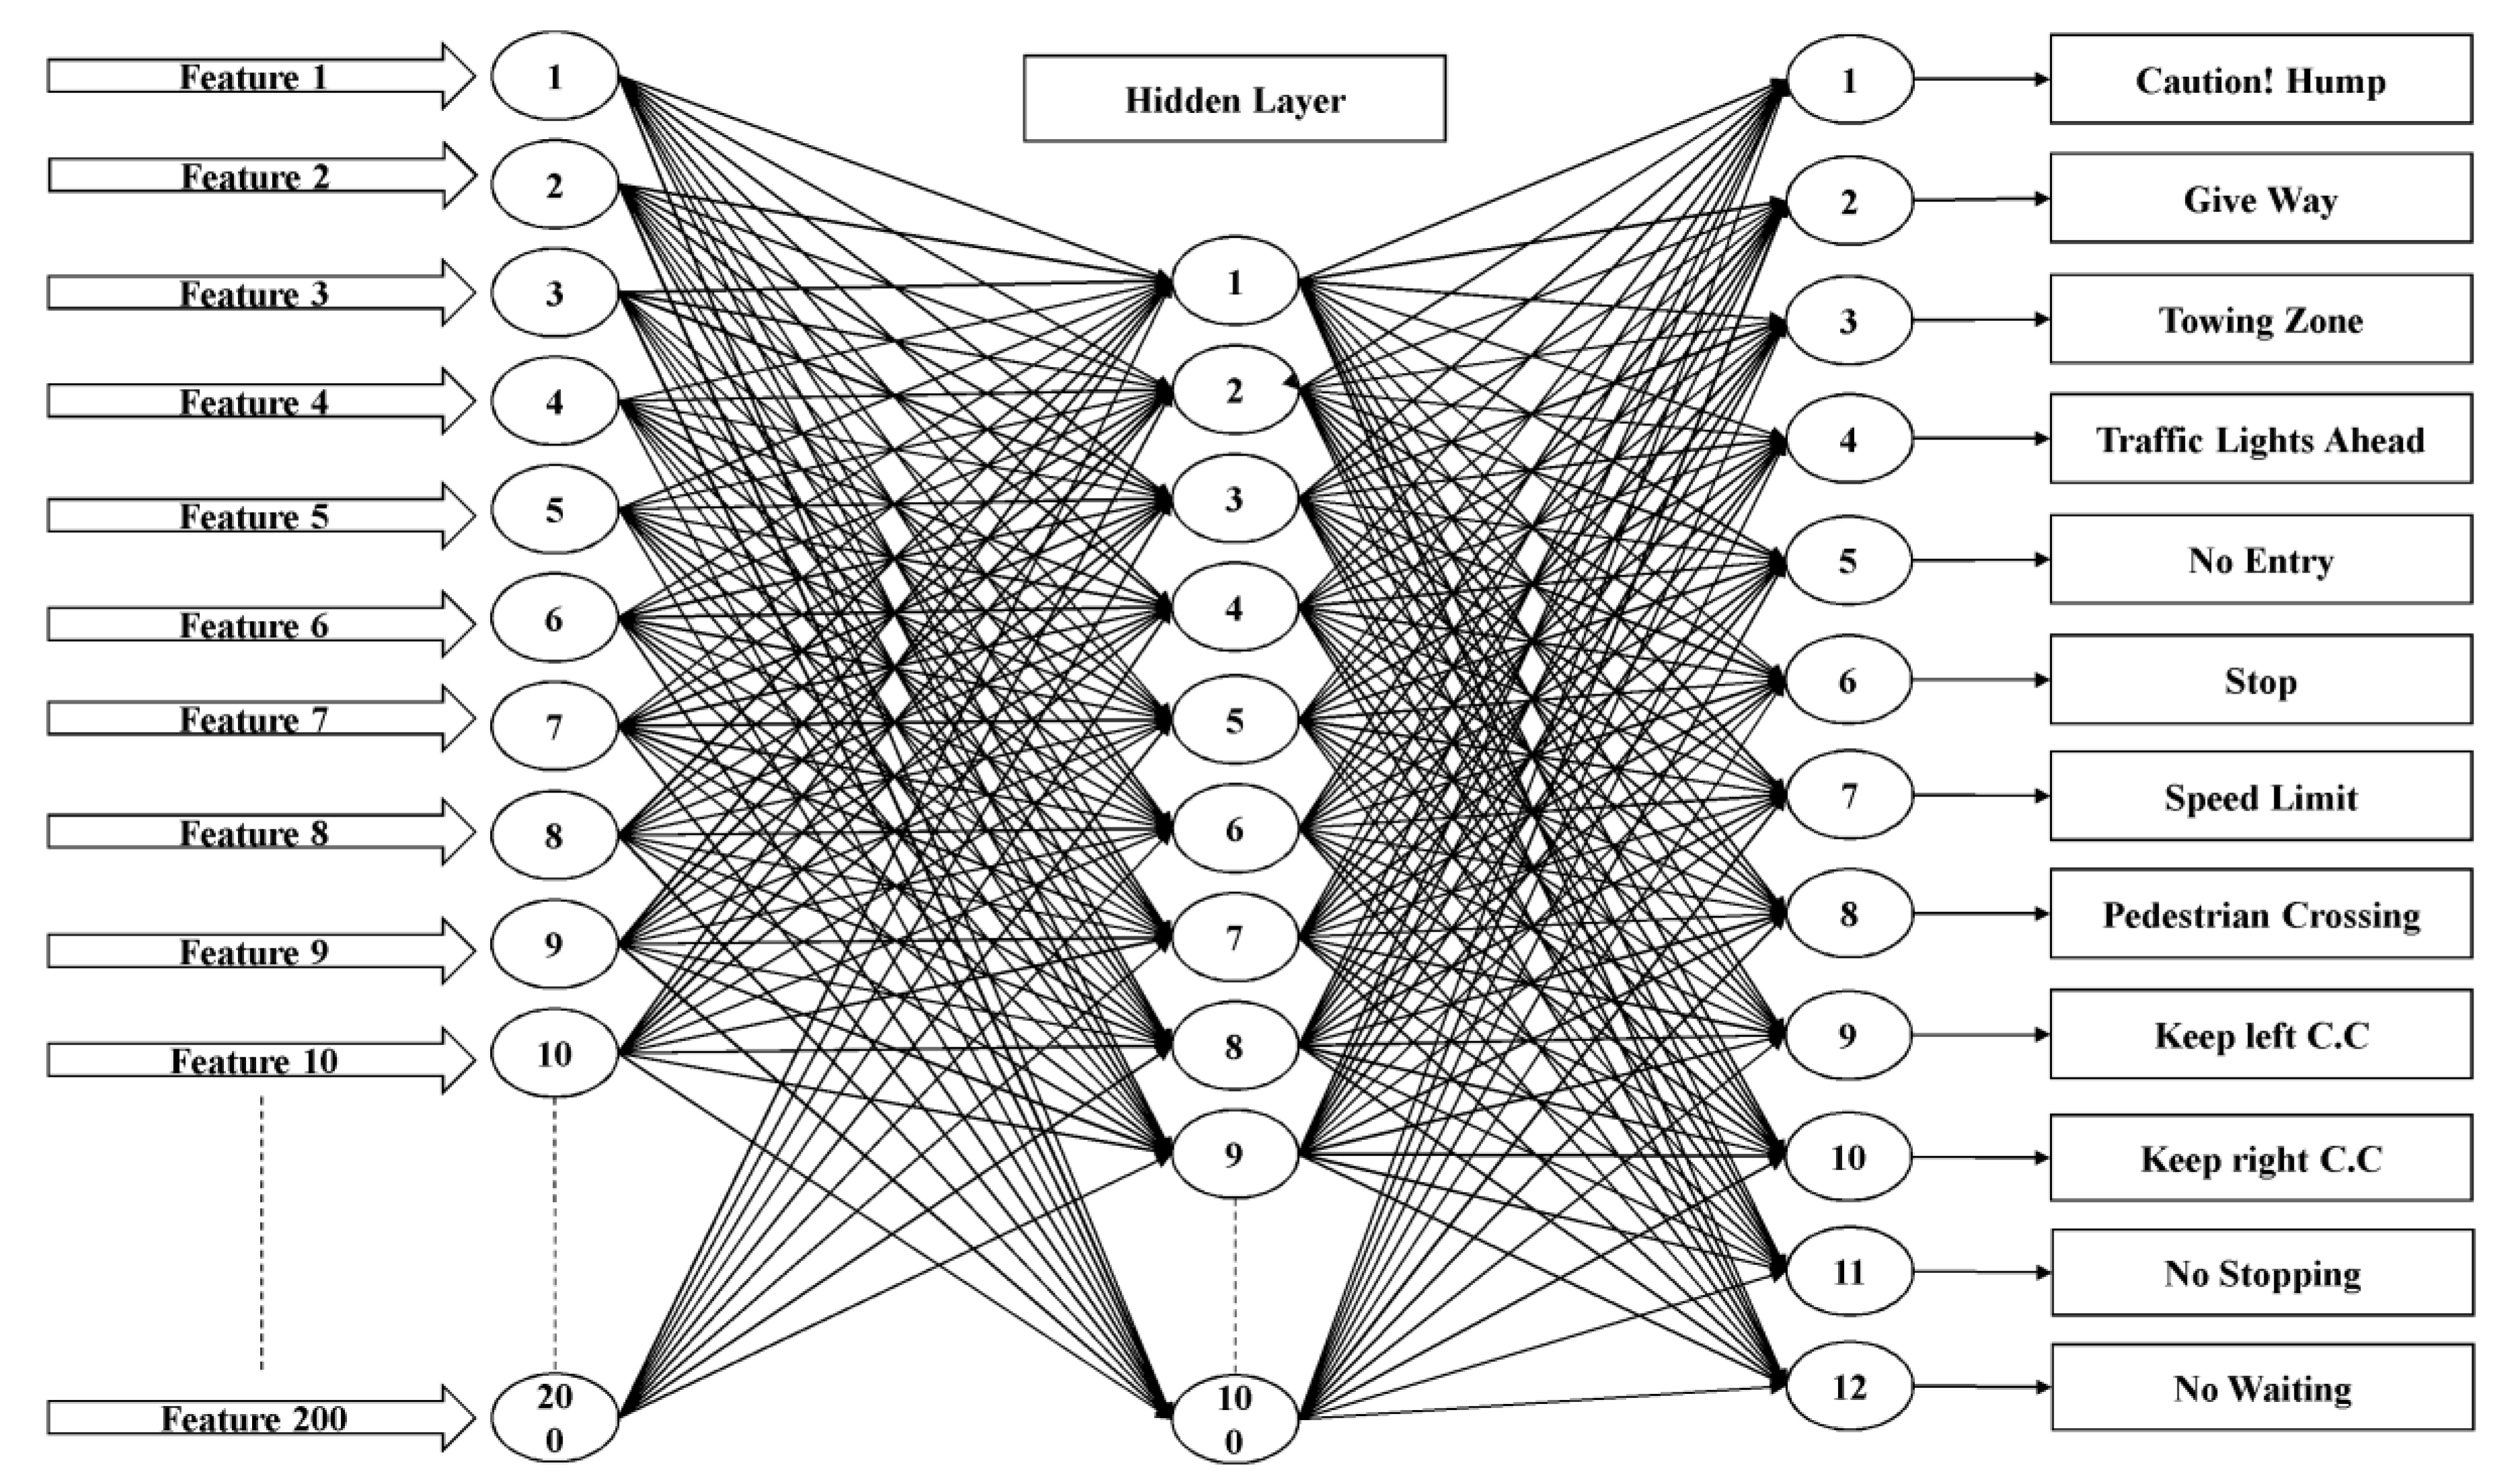
An ANN is implemented by using the neural network pattern recognition tool in MATLAB. The implemented ANN is a two-layer feedforward neural network. The sigmoid transfer function is applied in the hidden layer, and a softmax transfer function has been used with output layer. For the training of multiple layer ANN, a systematic method is applied with the back propagation learning algorithm to the network. The number of the hidden neurons is set to 100 because this configuration produced the best results in terms of processing time and error percentage, as shown in Table 1.
As the input layer contains 200 neurons and the output layer consists of 12 neurons, the number of neurons of the hidden layer had to be constrained to these limits [56]. The output neuron number is set to 12, as our dataset was also comprised of 12 different traffic signs. The main objective of the training is to adjust the weight so that the input produces to get the desired output. The proposed ANN architecture is shown in Figure 11.
3.4. Experimental Setup
All the experiments were run in MATLAB with the image processing toolbox, computer vision toolbox, classification learner app, and neural network toolbox is used to implement this system. Intel Core-i5 (Intel, Santa Clara, CA, USA) 2.50GHz CPU computer with 4GB of RAM is used to run this program to recognize the traffic sign. Creating Bag-of-Features from 12 image sets, feature extraction selects the feature point locations using the detector method. Then extracting SURF features from the selected feature point locations, the detecting SURF features are used to detect key points for feature extraction. The balance of features across all image sets is done to increase the quality of clustering. Subsequently, the algorithm uses the most discriminative 3141 features from each image set. The k-means clustering is then used to create a 200-word visual vocabulary. The overall extracted features were 37,692, and the number of clusters (k) is 200. Clustering is completed by 29/100 iterations (~0.60 s/iteration) and converged in 29 iterations. Finally encoding 12 image sets are done by using Bag-of-Features. This feature vector is then fed as an input to the ANN, SVM, and Ensemble subspace kNN to recognize the class of detected road sign. To measure the performance of classification task, accuracy was used as the performance metric.
4. Experimental Results
Our experimental results showed that ANN outperformed SVM and Ensemble subspace kNN. Moreover, there is a very marginal difference between the results obtained by SVM and Ensemble subspace kNN.
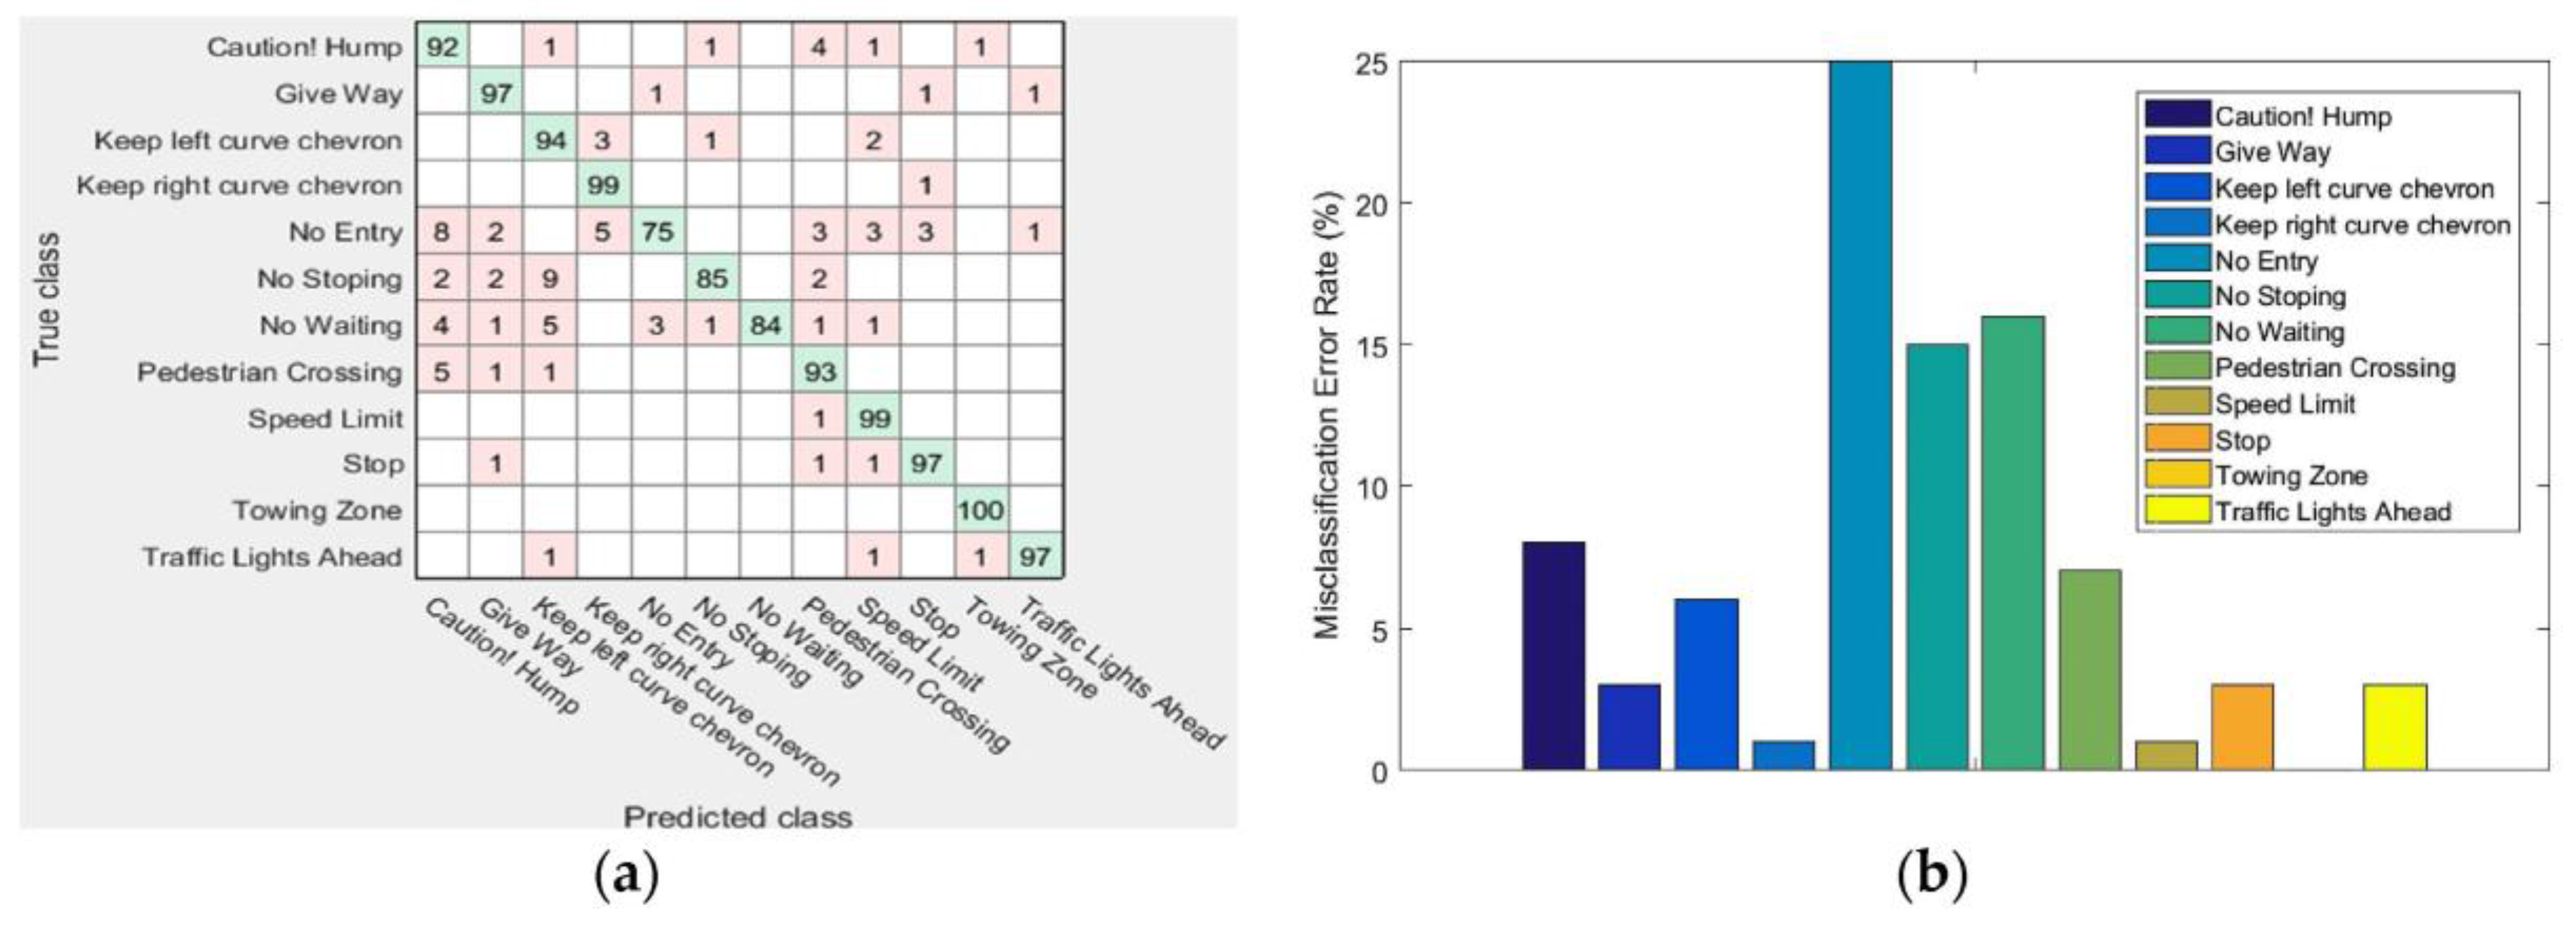
The SVM classifier achieved 92.30% accuracy when it was tested on real-time images. The detailed confusion matrix and misclassification error rate of SVM classifier are shown in Figure 12a,b respectively. The SVM classifier obtained the maximum misclassification error rate of 16%, 14%, and 13% for the classes ‘No Waiting’, ‘Keep Left Curve Chevron’, and ‘No Entry’ respectively. Moreover, SVM obtained the lowest misclassification error rate of 1% for classes ‘Stop’ and ‘Towing Zone’.
The Ensemble subspace kNN classifier achieved 92.70% accuracy when it was tested on real-time images. The detailed confusion matrix and misclassification error rate of Ensemble subspace kNN classifier are shown in Figure 13a,b respectively. The Ensemble subspace kNN classifier obtained the maximum misclassification error rate of 25%, 16%, and 15% for the classes ‘No Entry’, ‘No Waiting’, and ‘No Stopping’ respectively. Moreover, Ensemble subspace kNN classifier obtained no error for class ‘Towing Zone’ and 1% error rate for classes ‘Keep Right Curve Chevron’ and ‘Speed Limit’.
The ANN classifier achieved 99.00% accuracy when it was tested on real-time images. The detailed confusion matrix and misclassification error rate of ANN classifier are shown in Figure 14a,b respectively. Figure 14a shows the correct classification results in green squares and the incorrect classification results in red squares. In addition, the lower right blue square illustrates the overall accuracy of ANN classifier. As shown in Figure 14b, the ANN classifier obtained the maximum misclassification error rate of 7% for class ‘No Waiting’. Moreover, it obtained 2% misclassification error rate for classes ‘Keep Left Curve Chevron’, ‘No Entry’, and ‘Speed Limit’. For all other remaining classes, the ANN showed 0% misclassification error rate.
As shown in experimental results, ANN classifier outperformed SVM, and Ensemble subspace kNN classifier. Hence, to compare the performance of our proposed system with baselines, we have compared the results of the ANN classifier. The compare the performance of our proposed system, we compare our results with eight baselines [1,15,17,24,35,37,57,58]. The evaluation results showed the outperformance of our proposed system when compared to eight baselines. The detailed results are shown in Table 2. Here, it can be seen that all these compared studies have used the traffic sign dataset to classify traffic signs using machine learning approaches. However, our proposed method of traffic sign detection and recognition is quite different from the existing studies. In our proposed system, we have employed the state-of-the-art BoW model for feature extraction. This model uses SURF for the identification of feature descriptors. Moreover, to determine the best interest points of a traffic sign, our proposed method uses the k-means clustering approach. Moreover, we have used the ANN, which is robust classifier as compared to other related classifiers. Figure 15 shows some real-time experimental results of our developed system using ANN classifier.
5. Discussion
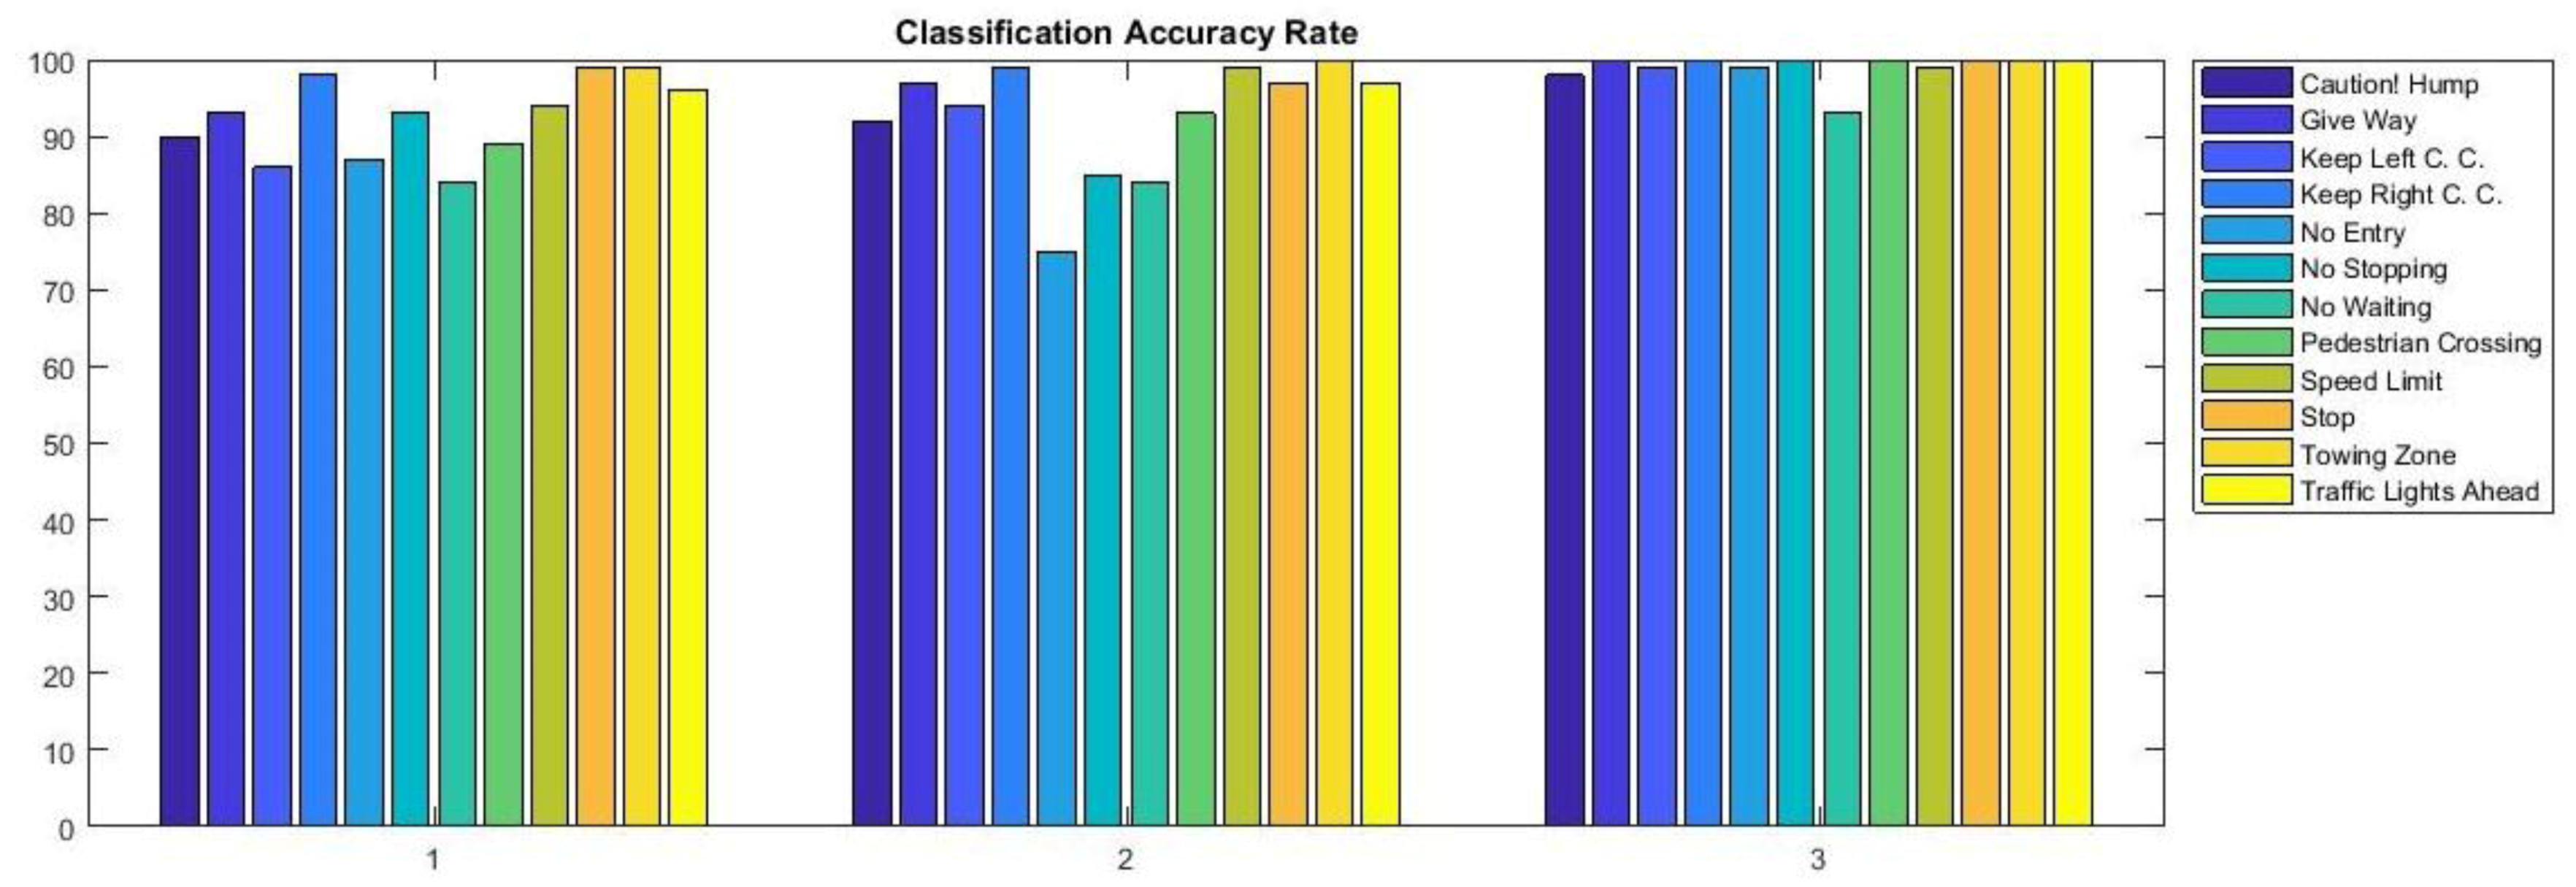
According to the ‘no free lunch’ theorem [59], there is no single machine learning algorithm that performs best in all application areas. Hence, a variety of decision models should be tested. Therefore, we evaluated the performance of three different classifiers namely SVM, Ensemble subspace kNN, and ANN. Our experimental results showed that the SVM performance was lower than the performance of Ensemble subspace kNN and ANN classifiers. Although the quadratic SVM and the Ensemble subspace kNN produce good classification results, on our dataset ANN showed the best performance results for this proposed system, as shown in Figure 16. Therefore, traffic sign recognition system based on the BoW and ANN (instead of BoW and SVM, and BoW and Ensemble subspace kNN) is recommended for real-time implementation.
The performance of SVM lies in the choice of kernel [60]. The selection of proper SVM kernel and kernel function parameters, such as width or sigma parameter, may further increase the SVM performance [61,62,63]. Moreover, the optimal design for multi-class SVM classifier is still a challenging task for many researchers. There may be various reasons behind the poor performance of Ensemble subspace kNN classifier including many Ensemble methods for weak learners such as kNN do not improve the classification performance [64]. Moreover, such Ensemble subspace kNN is very sensitive to input features of images. Moreover, this classifier assumes that all input features are independent of each other and there is no dependency in the input image features [55]. The other reason behind the poor performance of kNN is that it does not consider the issue of a soft boundary of the input images where an image appears on either side of a class boundary. There may be several reasons behind the outperformance of ANN classifier. For instance, ANN is a non-parametric model that does not need much statistical computation. Moreover, these decision models are very useful for complex or abstract issues such as image classification. Another reason may be that ANN predicts the best feature weights recursively with the help of input neuron, hidden neurons, and output neurons. This kind of underlying architecture makes ANN a robust classifier compare to other statistical classifiers [65,66].
Moreover, in our classification results, we found that the traffic signs belong to class ‘No waiting’ and ‘No Stopping’ showed the highest misclassification error rate in SVM and Ensemble kNN classifiers. This is because the shape and color of these two signs resemble a lot. Hence, the SVM classifier and Ensemble kNN classifier could not accurately classify these two signs. In addition, the ANN classier accurately classified ‘No Stopping’ class and also in ANN the misclassification of ‘No Waiting’ class reduced as compared to SVM and Ensemble kNN. In addition, the traffic sign belonging to class ‘Pedestrian Crossing’ has multiple variations on color and shapes in our dataset, therefore, SVM and Ensemble subspace kNN classifiers obtained high misclassification error rate. Conversely, ANN classifier achieved reasonable classification accuracy with lowest misclassification error rate for the same ‘Pedestrian Crossing’ class. Another related case is with the class ‘No Entry’ where SVM and Ensemble subspace kNN classifiers showed high misclassification error results, whereby, ANN obtained the lowest misclassification error rate.
6. Significance of Dataset and Proposed Approach
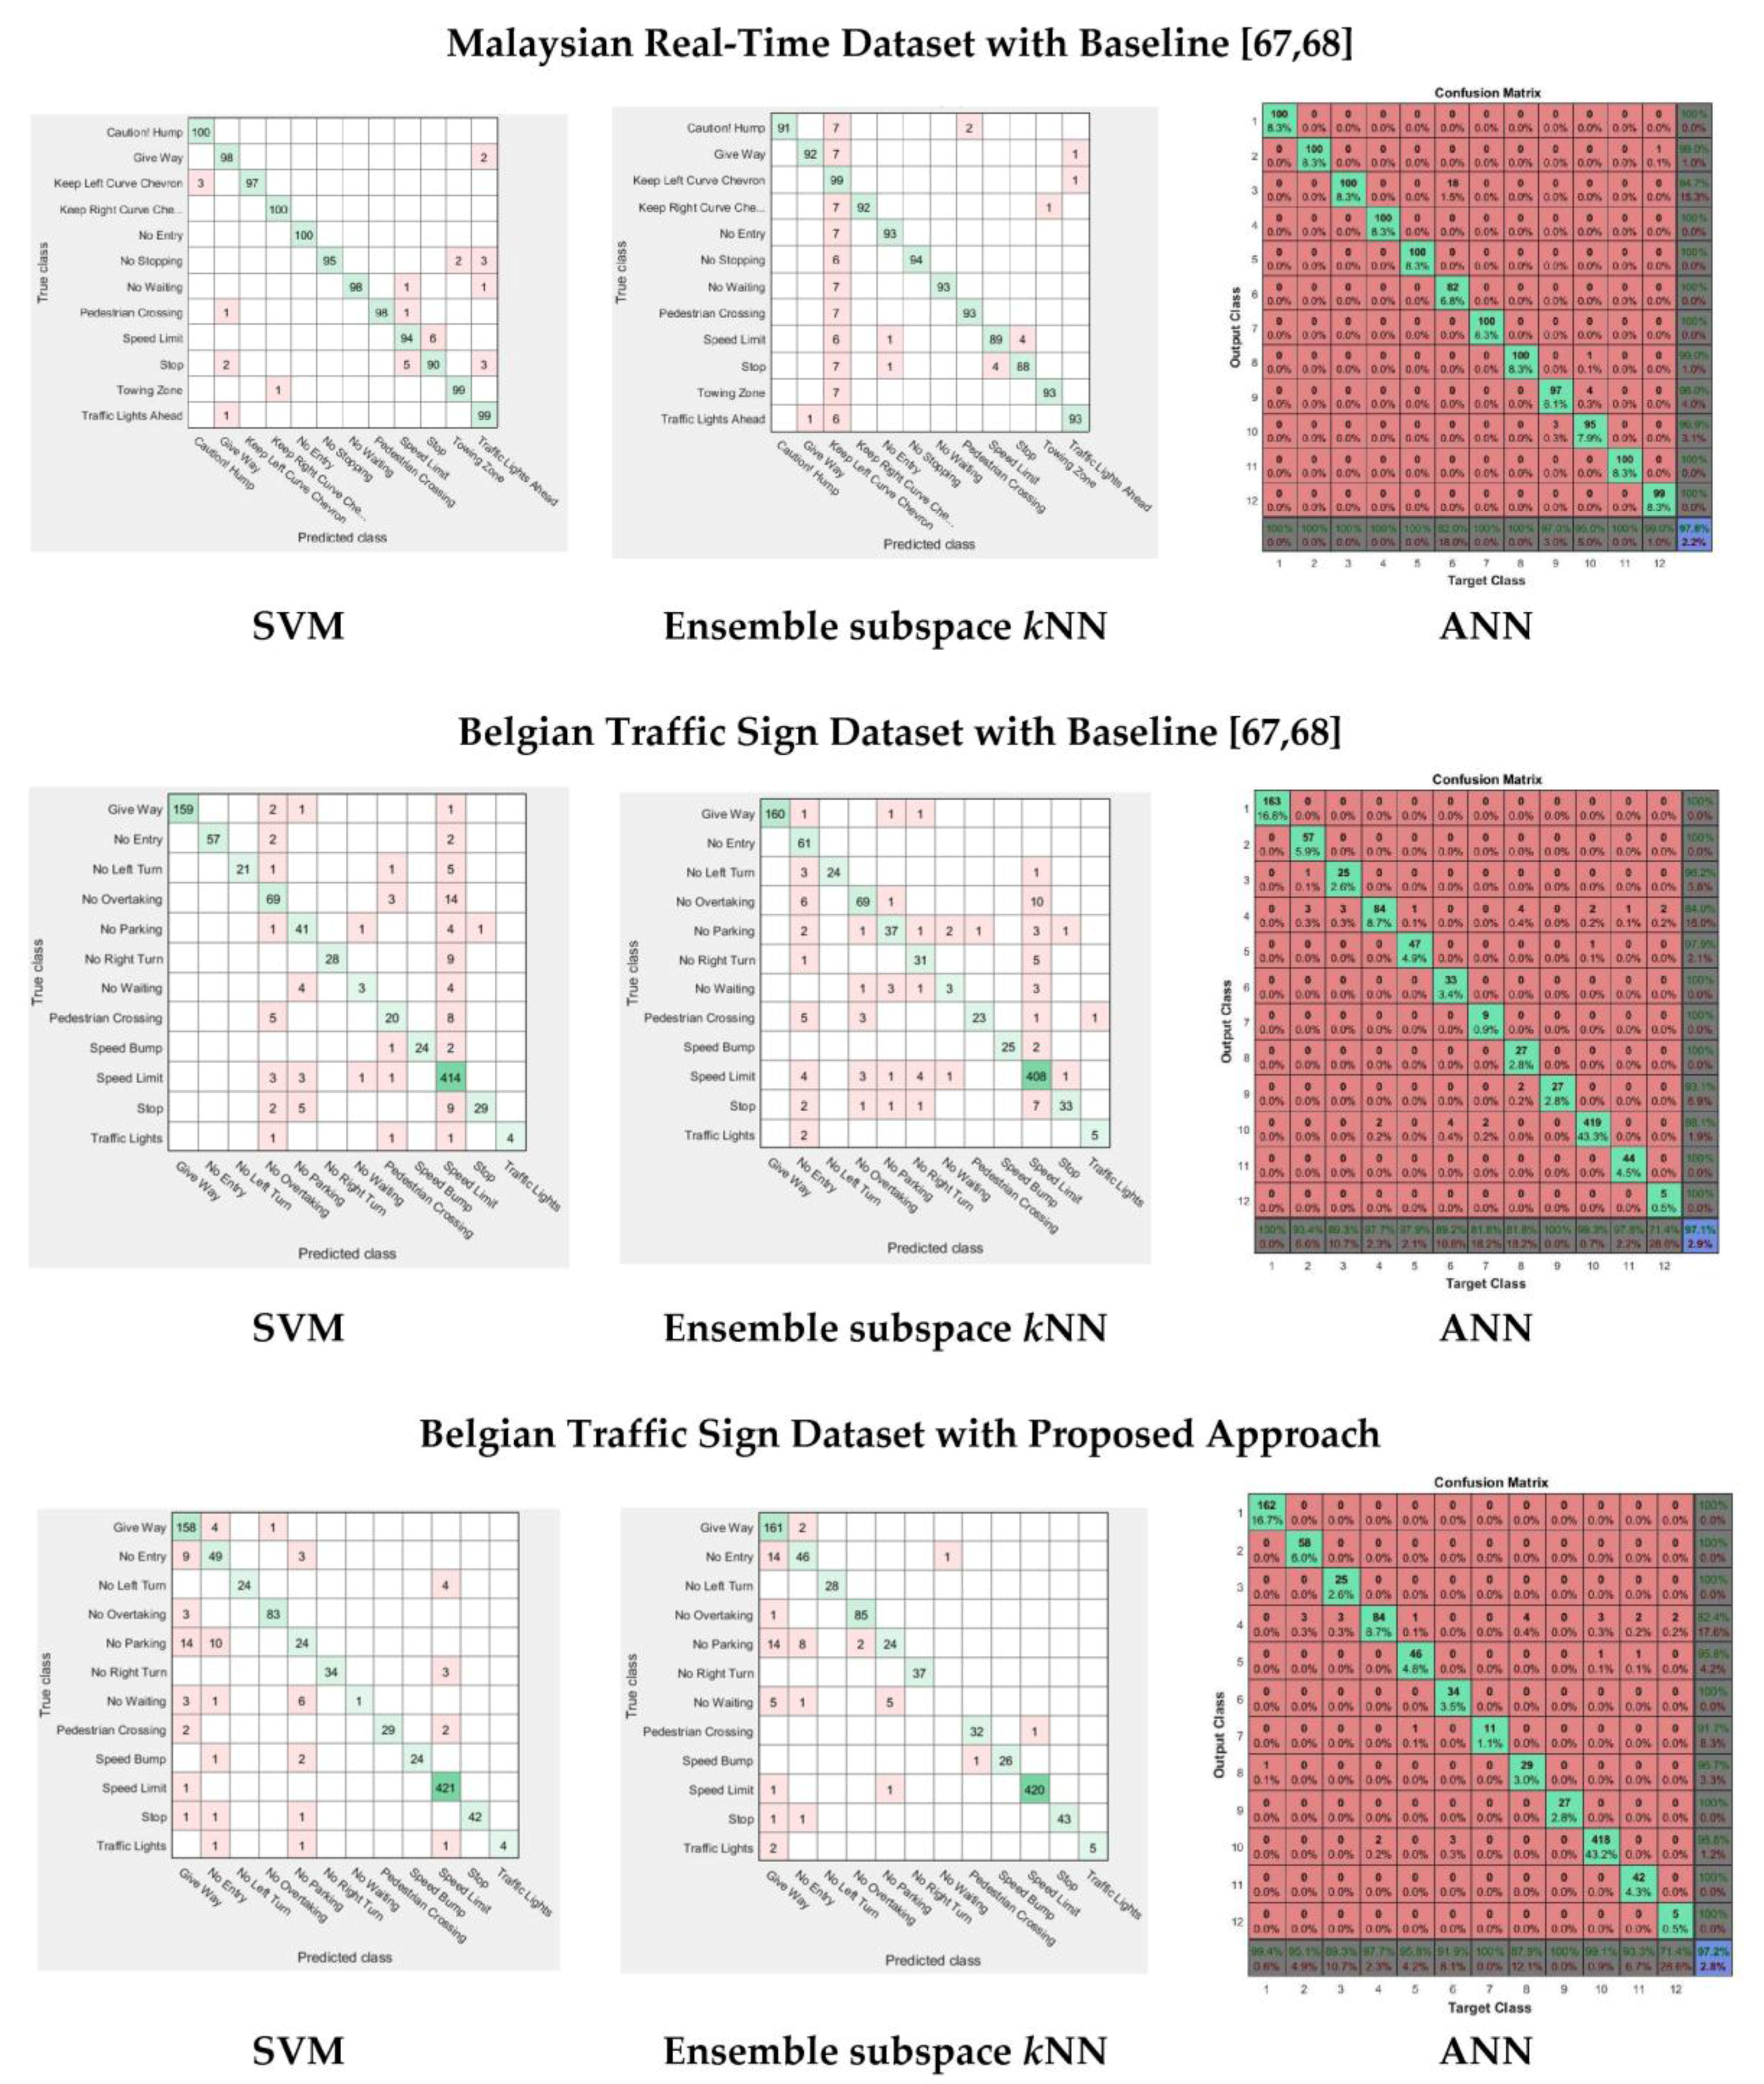
The BoF feature extraction approach with ANN classifier is proposed in this study to detect and recognize non-standard traffic signs. To examine the significance of our proposed method, one baseline was created from the collected dataset for this research, namely, the histogram of oriented gradients (HOG) technique proposed in [67,68]. In [67] hybrids of HOG and SURF features descriptor was used with ANN classifier to select the most important and discriminative features. In [68] HOG based feature extraction technique with SVM and Random Forest, classifiers were used to recognize traffic sign images. Additionally, the performance of our proposed approach was also evaluated by using publicly available dataset (BTSD) of traffic sign images. To conduct the experiments with the BTSD dataset, 12 class of Belgian traffic sign image samples are taken into consideration because they are also commonly used in Malaysia. To compare, we have conducted nine additional experiments to show the significance of dataset and proposed approach. The findings of these experiments are shown in Figure 17 with confusion matrices.
These experiments were conducted to measure the overall accuracy of all three classifiers using the baseline and collected dataset and BTSD dataset. The baseline accuracy was compared with the accuracy of the proposed method. The accuracy of the baseline approach and proposed approach is shown in Table 3. As shown here, the proposed method outperformed the baseline method in both datasets. Moreover, in classifiers ANN outperformed others.
7. Conclusions
Although signs constitute a part of the visual language, the recognition of traffic signs is a part of intelligent transportation systems. The sign recognition system for traffic signs can be used to warn or notify the road users or for both where potential restriction may be effective on the present traffic condition. In this research, an intelligent traffic sign detection and recognition system were developed to detect well-maintained, un-maintained, standard, and non-standard traffic signs using state-of-the-art image classification techniques. The existing traffic sign detection and recognition systems mostly trained and tested on well-maintained and quality images of traffic signs. However, in real-time these images of traffic signs may not be well-maintained (especially in developing countries). Therefore, in this research, we addressed and developed a system that will resolve this issue. In our developed system, traffic sign detection was performed using histogram equalization with several thresholding and shape measurement processes. BoW with ANN were employed to recognize the traffic signs. In addition, the quadratic SVM and Ensemble subspace kNN classifiers were tested and evaluated. Ultimately, ANN showed the best accuracy of 99.00% to recognize the traffic signs. Furthermore, the proposed system outperformed when compared to eight existing baselines. As the recognition of a traffic sign is vision-based, traffic signs which are obscured by different vehicles, trees or even another sign, might not be recognized.
Acknowledgments
This Research is fully funded by University of Malaya Research Grant (UMRG)—RP026A-14AET.
Author Contributions
Kh Tohidul Islam conceived, designed and performed the experiments; Kh Tohidul Islam, and Ram Gopal Raj analyzed the data; Kh Tohidul Islam, Ghulam Mujtaba, and Ram Gopal Raj contributed reagents/materials/analysis tools; Kh Tohidul Islam and Ghulam Mujtaba wrote the paper. Ram Gopal Raj has provided numerous comments and suggestions for the experiments, manuscript correction, and general guidance during the whole research.
Conflicts of Interest
The authors declare no conflict of interest.
References
- Greenhalgh, J.; Mirmehdi, M. Real-time detection and recognition of road traffic signs. IEEE Trans. Intell. Transp. Syst. 2012, 13, 1498–1506. [Google Scholar] [CrossRef]
- Hengstler, M.; Enkel, E.; Duelli, S. Applied artificial intelligence and trust—The case of autonomous vehicles and medical assistance devices. Technol. Forecast. Soc. Chang. 2016, 105, 105–120. [Google Scholar] [CrossRef]
- Stewart, B.T.; Yankson, I.K.; Afukaar, F.; Medina, M.C.H.; Cuong, P.V.; Mock, C. Road traffic and other unintentional injuries among travelers to developing countries. Med. Clin. N. Am. 2016, 100, 331–343. [Google Scholar] [CrossRef] [PubMed]
- World Health Organization. Global Status Report on Road Safety: Time for Action; WHO: Geneva, Switzerland, 2009. [Google Scholar]
- Sarani, R.; Rahim, S.A.S.M.; Voon, W.S. Predicting Malaysian Road Fatalities for Year 2020. In Proceedings of the 4th International Conference on Road Safety and Simulations (RSS2013), Rome, Italy, 22–25 October 2013; pp. 23–25. [Google Scholar]
- De La Escalera, A.; Moreno, L.E.; Salichs, M.A.; Armingol, J.M. Road traffic sign detection and classification. IEEE Trans. Ind. Electron. 1997, 44, 848–859. [Google Scholar] [CrossRef] [Green Version]
- Malik, R.; Khurshid, J.; Ahmad, S.N. Road sign detection and recognition using colour segmentation, shape analysis and template matching. In Proceedings of the 2007 International Conference on Machine Learning and Cybernetics, Hong Kong, China, 19–22 August 2007; pp. 3556–3560. [Google Scholar]
- Lim, K.H.; Seng, K.P.; Ang, L.-M. MIMO Lyapunov theory-based RBF neural classifier for traffic sign recognition. Appl. Comput. Intell. Soft Comput. 2012, 2012, 7. [Google Scholar] [CrossRef]
- Saha, S.K.; Chakraborty, D.; Bhuiyan, A.A. Neural network based road sign recognition. Int. J. Comput. Appl. 2012, 50, 35–41. [Google Scholar]
- Stallkamp, J.; Schlipsing, M.; Salmen, J.; Igel, C. Man vs. Computer: Benchmarking machine learning algorithms for traffic sign recognition. Neural Netw. 2012, 32, 323–332. [Google Scholar] [CrossRef] [PubMed]
- Yamamoto, J.; Karungaru, S.; Terada, K. Japanese road signs recognition using neural networks. In Proceedings of the Sice Annual Conference, Nagoya, Japan, 14–17 September 2013; pp. 1144–1150. [Google Scholar]
- Miah, M.B.A. A real time road sign recognition using neural network. Int. J. Comput. Appl. 2015, 114, 1–5. [Google Scholar]
- Li, Y.; Mogelmose, A.; Trivedi, M.M. Pushing the “speed limit”: Towards high-accuracy U.S. Traffic sign recognition with convolutional neural networks. IEEE Trans. Intell. Veh. 2016, 1, 167–176. [Google Scholar] [CrossRef]
- Islam, K.; Raj, R. Real-time (vision-based) road sign recognition using an artificial neural network. Sensors 2017, 17, 853. [Google Scholar] [CrossRef] [PubMed]
- Wali, S.B.; Hannan, M.A.; Hussain, A.; Samad, S.A. An automatic traffic sign detection and recognition system based on colour segmentation, shape matching, and svm. Math. Probl. Eng. 2015, 2015, 11. [Google Scholar] [CrossRef]
- Pazhoumand-Dar, H.; Yaghobi, M. Dtbsvms: A New Approach for Road Sign Recognition. In Proceedings of the 2010 2nd International Conference on Computational Intelligence, Communication Systems and Networks, Liverpool, UK, 28–30 July 2010; pp. 314–319. [Google Scholar]
- Maldonado-Bascon, S.; Lafuente-Arroyo, S.; Gil-Jimenez, P.; Gomez-Moreno, H.; Lopez-Ferreras, F. Road-sign detection and recognition based on support vector machines. IEEE Trans. Intell. Transp. Syst. 2007, 8, 264–278. [Google Scholar] [CrossRef]
- Wei, L.; Chen, X.; Duan, B.; Hui, D.; Pengyu, F.; Yuan, H.; Zhao, H. A system for road sign detection, recognition and tracking based on multi-cues hybrid. In Proceedings of the 2009 IEEE Intelligent Vehicles Symposium, Xi’an, China, 3–5 June 2009; pp. 562–567. [Google Scholar]
- Min, K.i.; Oh, J.S.; Kim, B.W. Traffic sign extract and recognition on unmanned vehicle using image processing based on support vector machine. In Proceedings of the 2011 11th International Conference on Control, Automation and Systems, Gyeonggi-do, Korea, 26–29 October 2011; pp. 750–753. [Google Scholar]
- Liu, C.; Chang, F.; Chen, Z. High performance traffic sign recognition based on sparse representation and svm classification. In Proceedings of the 2014 10th International Conference on Natural Computation (ICNC), Xiamen, China, 19–21 August 2014; pp. 108–112. [Google Scholar]
- Mammeri, A.; Khiari, E.H.; Boukerche, A. Road-sign text recognition architecture for intelligent transportation systems. In Proceedings of the 2014 IEEE 80th Vehicular Technology Conference (VTC2014-Fall), Vancouver, BC, Canada, 14–17 September 2014; pp. 1–5. [Google Scholar]
- García-Garrido, M.A.; Ocaña, M.; Llorca, D.F.; Arroyo, E.; Pozuelo, J.; Gavilán, M. Complete vision-based traffic sign recognition supported by an I2V communication system. Sensors 2012, 12, 1148–1169. [Google Scholar] [CrossRef] [PubMed]
- Gu, Y.; Yendo, T.; Tehrani, M.P.; Fujii, T.; Tanimoto, M. A new vision system for traffic sign recognition. In Proceedings of the 2010 IEEE Intelligent Vehicles Symposium, San Diego, CA, USA, 21–24 June 2010; pp. 7–12. [Google Scholar]
- Yin, S.; Ouyang, P.; Liu, L.; Guo, Y.; Wei, S. Fast traffic sign recognition with a rotation invariant binary pattern based feature. Sensors 2015, 15, 2161–2180. [Google Scholar]
- Mathias, M.; Timofte, R.; Benenson, R.; Van Gool, L. Traffic sign recognition—How far are we from the solution? In Proceedings of the 2013 International Joint Conference on Neural Networks (IJCNN), Dallas, TX, USA, 4–9 August 2013; pp. 1–8. [Google Scholar]
- Vitabile, S.; Pollaccia, G.; Pilato, G.; Sorbello, F. Road signs recognition using a dynamic pixel aggregation technique in the HSV color space. In Proceedings of the 11th International Conference on Image Analysis and Processing, Palermo, Italy, 26–28 September 2001; pp. 572–577. [Google Scholar]
- Ohgushi, K.; Hamada, N. Traffic sign recognition by bags of features. In Proceedings of the TENCON 2009—2009 IEEE Region 10 Conference, Singapore, 23–26 January 2009; pp. 1–6. [Google Scholar]
- Kang, D.S.; Griswold, N.C.; Kehtarnavaz, N. An invariant traffic sign recognition system based on sequential color processing and geometrical transformation. In Proceedings of the IEEE Southwest Symposium on Image Analysis and Interpretation, Dallas, TX, USA, 21–24 April 1994; pp. 88–93. [Google Scholar]
- Fleyeh, H. Traffic sign recognition without color information. In Proceedings of the 2015 Colour and Visual Computing Symposium (CVCS), Gjovik, Norway, 25–26 August 2015; pp. 1–6. [Google Scholar]
- Zeng, Y.; Lan, J.; Ran, B.; Wang, Q.; Gao, J. Restoration of motion-blurred image based on border deformation detection: A traffic sign restoration model. PLoS ONE 2015, 10, e0120885. [Google Scholar] [CrossRef] [PubMed]
- Wu, J.; Si, M.; Tan, F.; Gu, C. Real-time automatic road sign detection. In Proceedings of the Fifth International Conference on Image and Graphics (ICIG ’09), Xi’an, China, 20–23 September 2009; pp. 540–544. [Google Scholar]
- Belaroussi, R.; Foucher, P.; Tarel, J.P.; Soheilian, B.; Charbonnier, P.; Paparoditis, N. Road sign detection in images: A case study. In Proceedings of the 20th International Conference on Pattern Recognition (ICPR), Istanbul, Turkey, 23–26 August 2010; pp. 484–488. [Google Scholar]
- Shoba, E.; Suruliandi, A. Performance analysis on road sign detection, extraction and recognition techniques. In Proceedings of the 2013 International Conference on Circuits, Power and Computing Technologies (ICCPCT), Nagercoil, India, 20–21 March 2013; pp. 1167–1173. [Google Scholar]
- Lai, C.H.; Yu, C.C. An efficient real-time traffic sign recognition system for intelligent vehicles with smart phones. In Proceedings of the 2010 International Conference on Technologies and Applications of Artificial Intelligence, Hsinchu, Taiwan, 18–20 November 2010; pp. 195–202. [Google Scholar]
- Virupakshappa, K.; Han, Y.; Oruklu, E. Traffic sign recognition based on prevailing bag of visual words representation on feature descriptors. In Proceedings of the 2015 IEEE International Conference on Electro/Information Technology (EIT), Dekalb, IL, USA, 21–23 May 2015; pp. 489–493. [Google Scholar]
- Shams, M.M.; Kaveh, H.; Safabakhsh, R. Traffic sign recognition using an extended bag-of-features model with spatial histogram. In Proceedings of the 2015 Signal Processing and Intelligent Systems Conference (SPIS), Tehran, Iran, 16–17 December 2015; pp. 189–193. [Google Scholar]
- Lin, C.-C.; Wang, M.-S. Road sign recognition with fuzzy adaptive pre-processing models. Sensors 2012, 12, 6415–6433. [Google Scholar] [CrossRef] [PubMed]
- Lin, Y.T.; Chou, T.; Vinay, M.S.; Guo, J.I. Algorithm derivation and its embedded system realization of speed limit detection for multiple countries. In Proceedings of the 2016 IEEE International Symposium on Circuits and Systems (ISCAS), Montreal, QC, Canada, 22–25 May 2016; pp. 2555–2558. [Google Scholar]
- Continental. Traffic Sign Recognition. Available online: http://www.conti-online.com/generator/www/de/en/continental/automotive/general/chassis/safety/hidden/verkehrszeichenerkennung_en.html (accessed on 20 April 2017).
- Choi, Y.; Han, S.I.; Kong, S.-H.; Ko, H. Driver status monitoring systems for smart vehicles using physiological sensors: A safety enhancement system from automobile manufacturers. IEEE Signal Process. Mag. 2016, 33, 22–34. [Google Scholar] [CrossRef]
- Levinson, J.; Askeland, J.; Becker, J.; Dolson, J.; Held, D.; Kammel, S.; Kolter, J.Z.; Langer, D.; Pink, O.; Pratt, V. Towards fully autonomous driving: Systems and algorithms. In Proceedings of the Intelligent Vehicles Symposium (IV), Baden-Baden, Germany, 5–9 June 2011; pp. 163–168. [Google Scholar]
- Markoff, J. Google Cars Drive Themselves, in Traffic. The New York Times, 9 October 2010. [Google Scholar]
- Guardian News and Media Limited. Google’s self-driving car in broadside collision after other car jumps red light. The Guardian, 26 September 2016. [Google Scholar]
- The Tesla Team. All Tesla Cars Being Produced Now Have Full Self-Driving Hardware. Available online: https://www.tesla.com/blog/all-tesla-cars-being-produced-now-have-full-self-driving-hardware (accessed on 19 October 2016).
- Nixon, M.S.; Aguado, A.S. Feature Extraction and Image Processing for Computer Vision; Academic Press: Cambridge, MA, USA, 2012. [Google Scholar]
- Ce, L.; Yaling, H.; Limei, X.; Lihua, T. Salient traffic sign recognition based on sparse representation of visual perception. In Proceedings of the 2012 International Conference on Computer Vision in Remote Sensing, Xiamen, China, 16–18 December 2012; pp. 273–278. [Google Scholar]
- Xu, R.; Hirano, Y.; Tachibana, R.; Kido, S. Classification of diffuse lung disease patterns on high-resolution computed tomography by a bag of words approach. In Medical Image Computing and Computer-Assisted Intervention—MICCAI 2011; Fichtinger, G., Martel, A., Peters, T., Eds.; Springer: Berlin/Heidelberg, Germany, 2011; Volume 6893, Part III; pp. 183–190. [Google Scholar]
- Fei-Fei, L.; Perona, P. A bayesian hierarchical model for learning natural scene categories. In Proceedings of the 2005 IEEE Computer Society Conference on Computer Vision and Pattern Recognition (CVPR’05), San Diego, CA, USA, 20–25 June 2005; pp. 524–531. [Google Scholar]
- Qiu, G. Indexing chromatic and achromatic patterns for content-based colour image retrieval. Pattern Recognit. 2002, 35, 1675–1686. [Google Scholar] [CrossRef]
- Cordeiro de Amorim, R.; Mirkin, B. Minkowski metric, feature weighting and anomalous cluster initializing in k-means clustering. Pattern Recognit. 2012, 45, 1061–1075. [Google Scholar] [CrossRef]
- Danielsson, P.-E. Euclidean distance mapping. Comput. Graph. Image Process. 1980, 14, 227–248. [Google Scholar] [CrossRef]
- Deb, K.; Pratap, A.; Agarwal, S.; Meyarivan, T. A fast and elitist multiobjective genetic algorithm: NSGA-II. IEEE Trans. Evol. Comput. 2002, 6, 182–197. [Google Scholar] [CrossRef]
- Fernández-Delgado, M.; Cernadas, E.; Barro, S.; Amorim, D. Do we need hundreds of classifiers to solve real world classification problems. J. Mach. Learn. Res. 2014, 15, 3133–3181. [Google Scholar]
- Cristianini, N.; Shawe-Taylor, J. An Introduction to SVM; Cambridge University Press: Cambridge, UK, 1999. [Google Scholar]
- Gul, A.; Perperoglou, A.; Khan, Z.; Mahmoud, O.; Miftahuddin, M.; Adler, W.; Lausen, B. Ensemble of a subset of knn classifiers. Adv. Data Anal. Classif. 2016, 1–14. [Google Scholar] [CrossRef]
- Shin-ike, K. A two phase method for determining the number of neurons in the hidden layer of a 3-layer neural network. In Proceedings of the SICE Annual Conference 2010, Taipei, Taiwan, 18–21 August 2010; pp. 238–242. [Google Scholar]
- García-Garrido, M.A.; Ocaña, M.; Llorca, D.F.; Sotelo, M.A.; Arroyo, E.; Llamazares, A. Robust traffic signs detection by means of vision and V2I communications. In Proceedings of the 2011 14th International IEEE Conference on Intelligent Transportation Systems (ITSC), Washington, DC, USA, 5–7 October 2011; pp. 1003–1008. [Google Scholar]
- Bui-Minh, T.; Ghita, O.; Whelan, P.F.; Hoang, T. A robust algorithm for detection and classification of traffic signs in video data. In Proceedings of the International Conference on Control, Automation and Information Sciences (ICCAIS), Ho Chi Minh, Vietnam, 26–29 November 2012; pp. 108–113. [Google Scholar]
- Wolpert, D.H.; Macready, W.G. No Free Lunch Theorems for Search; Technical Report SFI-TR-95-02-010; The Santa Fe Institute: Santa Fe, Mexico, 1995. [Google Scholar]
- Burges, C.J. A tutorial on support vector machines for pattern recognition. Data Min. Knowl. Discov. 1998, 2, 121–167. [Google Scholar] [CrossRef]
- Mujtaba, G.; Shuib, L.; Raj, R.G.; Rajandram, R.; Shaikh, K.; Al-Garadi, M.A. Automatic ICD-10 multi-class classification of cause of death from plaintext autopsy reports through expert-driven feature selection. PLoS ONE 2017, 12, e0170242. [Google Scholar] [CrossRef] [PubMed]
- Mujtaba, G.; Shuib, L.; Raj, R.G.; Rajandram, R.; Shaikh, K. Automatic text classification of ICD-10 related CoD from complex and free text forensic autopsy reports. In Proceedings of the 15th IEEE International Conference on Machine Learning and Applications (ICMLA), Anaheim, CA, USA, 18–20 December 2016; pp. 1055–1058. [Google Scholar]
- Siddiqui, M.F.; Reza, A.W.; Kanesan, J. An automated and intelligent medical decision support system for brain MRI scans classification. PLoS ONE 2015, 10, e0135875. [Google Scholar] [CrossRef] [PubMed]
- Domeniconi, C.; Yan, B. Nearest neighbor ensemble. In Proceedings of the 17th International Conference on Pattern Recognition (ICPR 2004), Cambridge, UK, 26 August 2004; pp. 228–231. [Google Scholar]
- Malek, S.; Salleh, A.; Baba, M.S. A comparison between neural network based and fuzzy logic models for chlorophll-a estimation. In Proceedings of the Second International Conference on Computer Engineering and Applications (ICCEA), Bali Island, Indonesia, 19–21 March 2010; pp. 340–343. [Google Scholar]
- Jain, A.K.; Mao, J.; Mohiuddin, K.M. Artificial neural networks: A tutorial. Computer 1996, 29, 31–44. [Google Scholar] [CrossRef]
- Abedin, M.Z.; Dhar, P.; Deb, K. Traffic sign recognition using hybrid features descriptor and artificial neural network classifier. In Proceedings of the 19th International Conference on Computer and Information Technology (ICCIT), Dhaka, Bangladesh, 18–20 December 2016; pp. 457–462. [Google Scholar]
- Ellahyani, A.; El Ansari, M.; El Jaafari, I. Traffic sign detection and recognition based on random forests. Appl. Soft Comput. 2016, 46, 805–815. [Google Scholar] [CrossRef]
Figure 1.
Traffic sign (Stop); (a) Faded stop sign used in Malaysia, (b) Stop sign used in USA, Canada, Australia; (c) Stop sign used in Vanuatu.
Figure 1.
Traffic sign (Stop); (a) Faded stop sign used in Malaysia, (b) Stop sign used in USA, Canada, Australia; (c) Stop sign used in Vanuatu.

Figure 2.
Standard, non-standard, un-maintained Pedestrian Crossing sign in Malaysia.

Figure 3.
Proposed system for traffic sign detection and recognition.

Figure 4.
Histogram equalization technique.

Figure 5.
Block diagram of traffic sign detection phase.

Figure 6.
Traffic sign detection phase illustration; (a) Complex background; (b) Ordinary background.
Figure 6.
Traffic sign detection phase illustration; (a) Complex background; (b) Ordinary background.
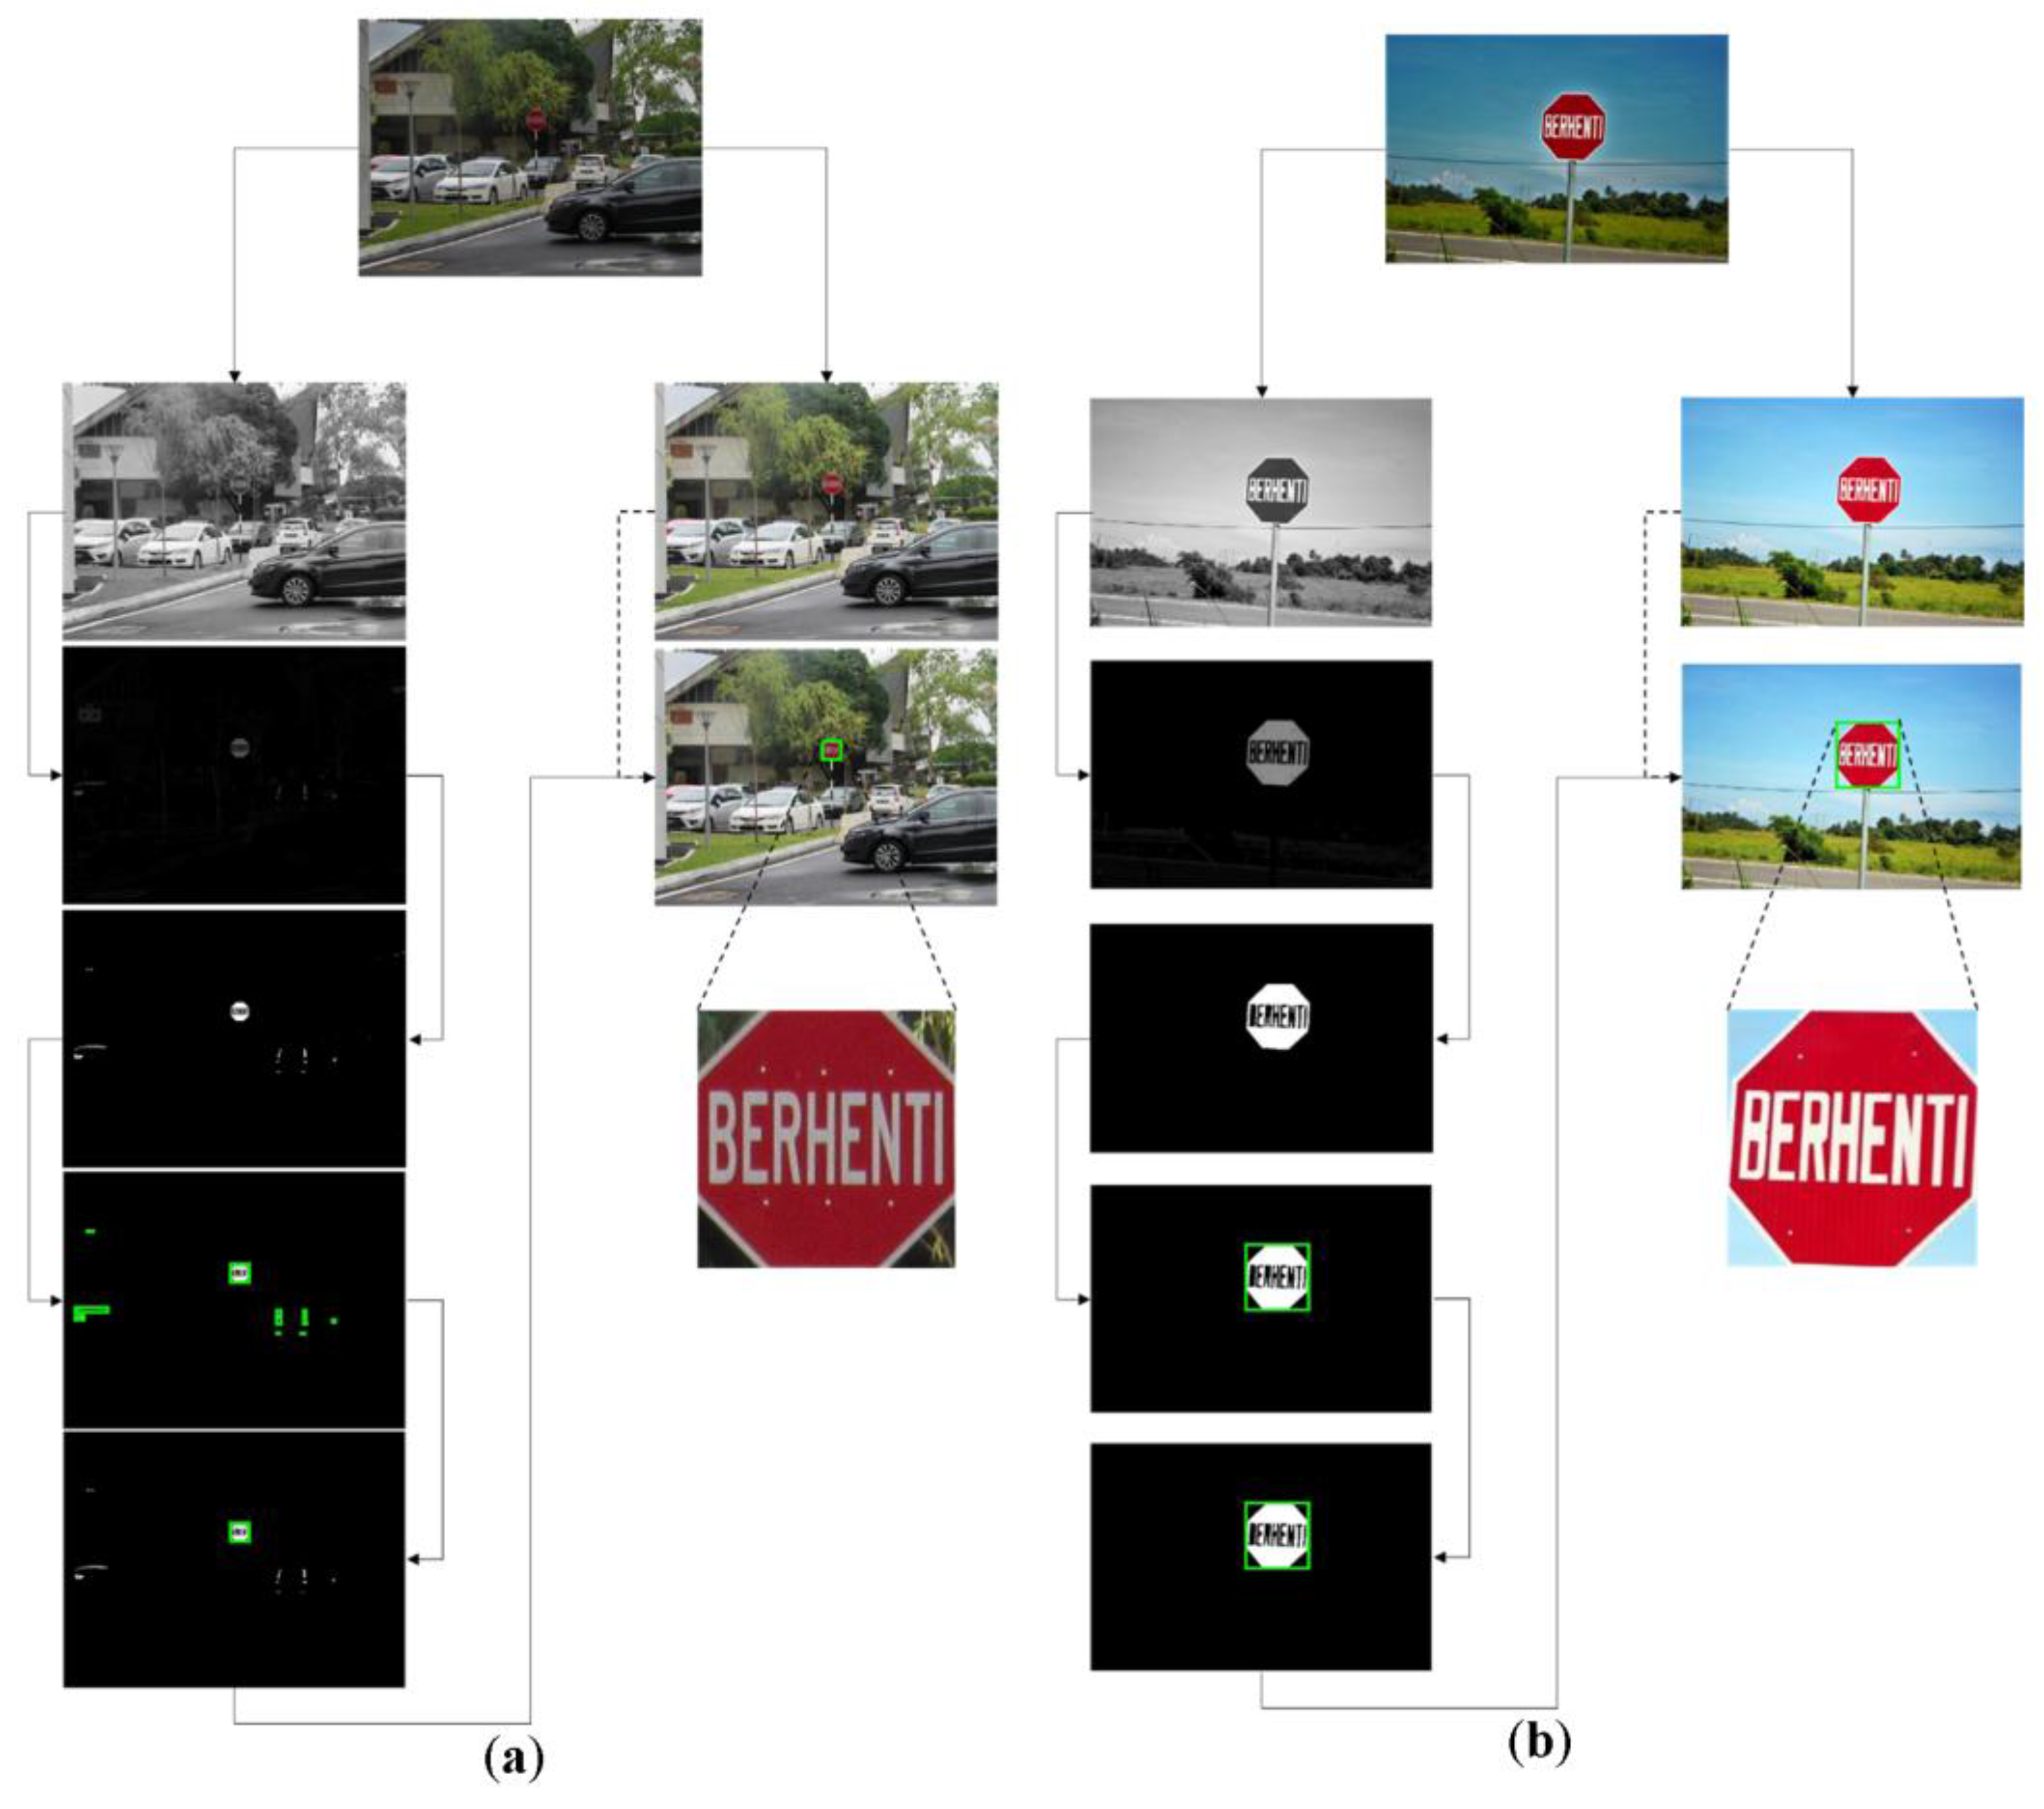
Figure 7.
Interest points of Speeded Up Robust Features (SURF); (a) Speed limit; (b) Hump; (c) Stop; (d) Give way.
Figure 7.
Interest points of Speeded Up Robust Features (SURF); (a) Speed limit; (b) Hump; (c) Stop; (d) Give way.

Figure 8.
K-means clustering flowchart.

Figure 9.
K-means clustering and Bag-of-Words (BoW).
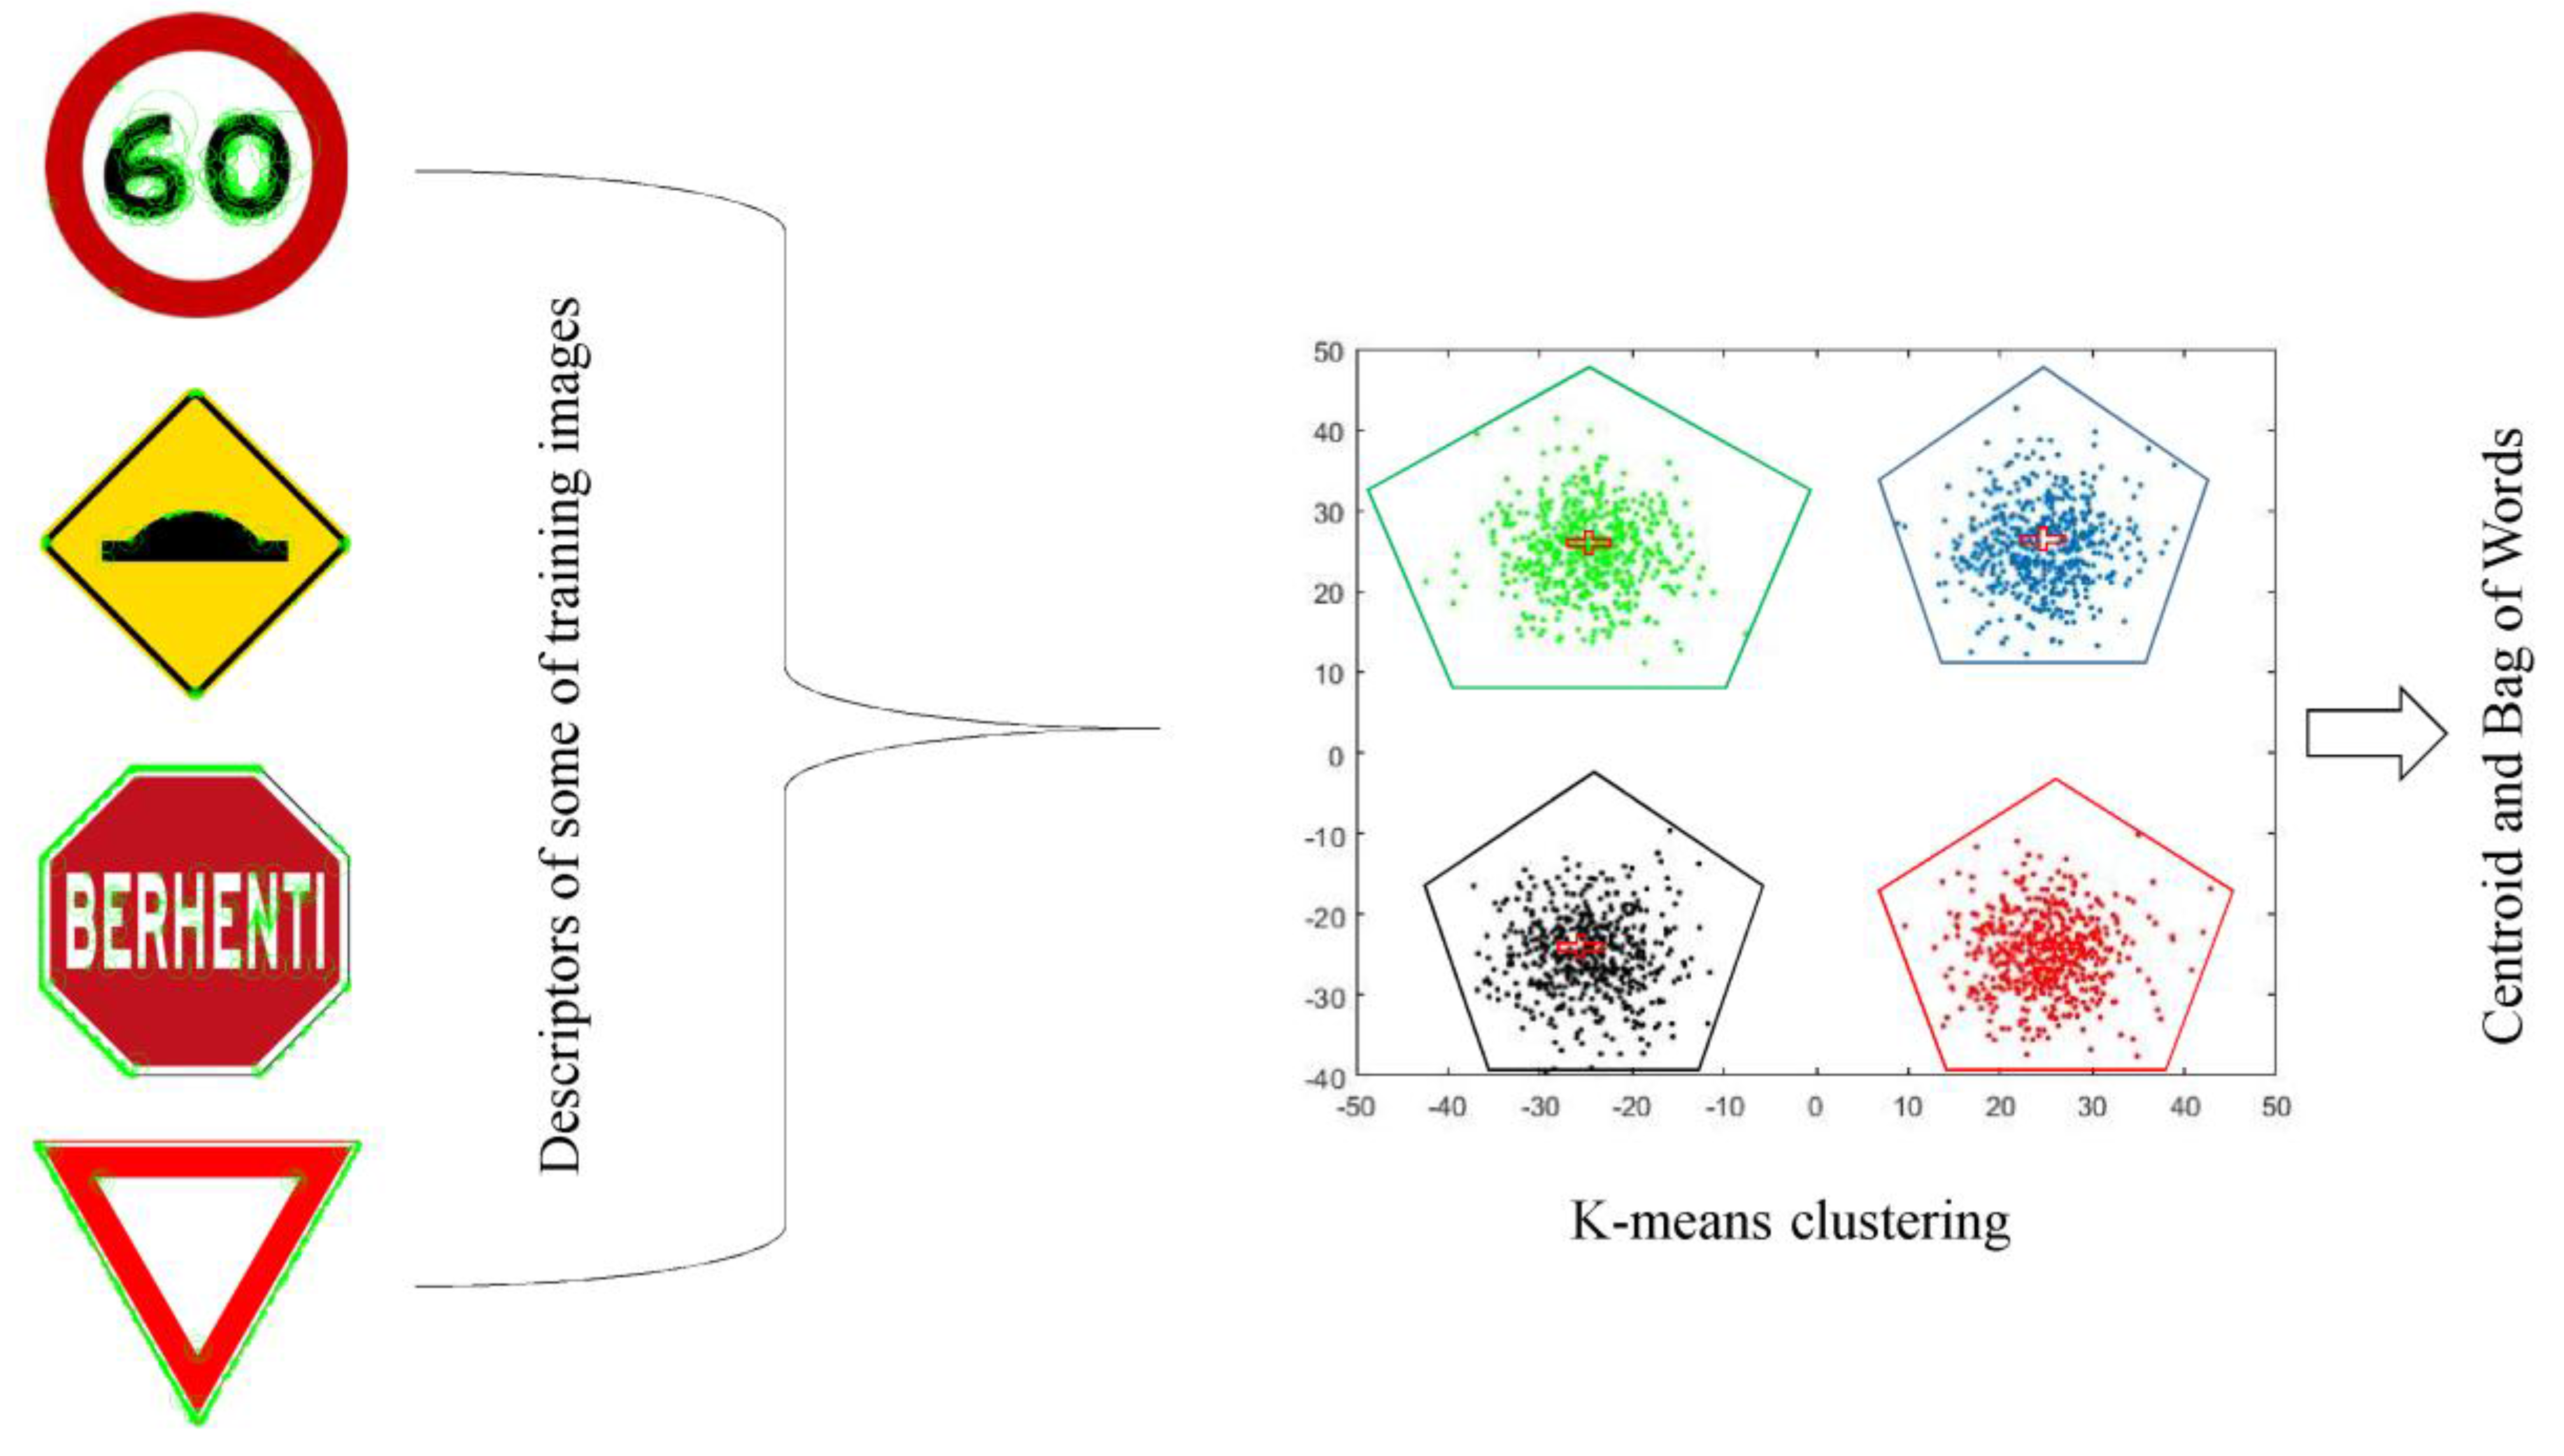
Figure 10.
BoW feature vector visualization.

Figure 11.
Artificial neural network (ANN) architecture.

Figure 12.
Support vector machine (SVM) classifier result; (a) Confusion matrix; (b) Misclassification error rate.
Figure 12.
Support vector machine (SVM) classifier result; (a) Confusion matrix; (b) Misclassification error rate.
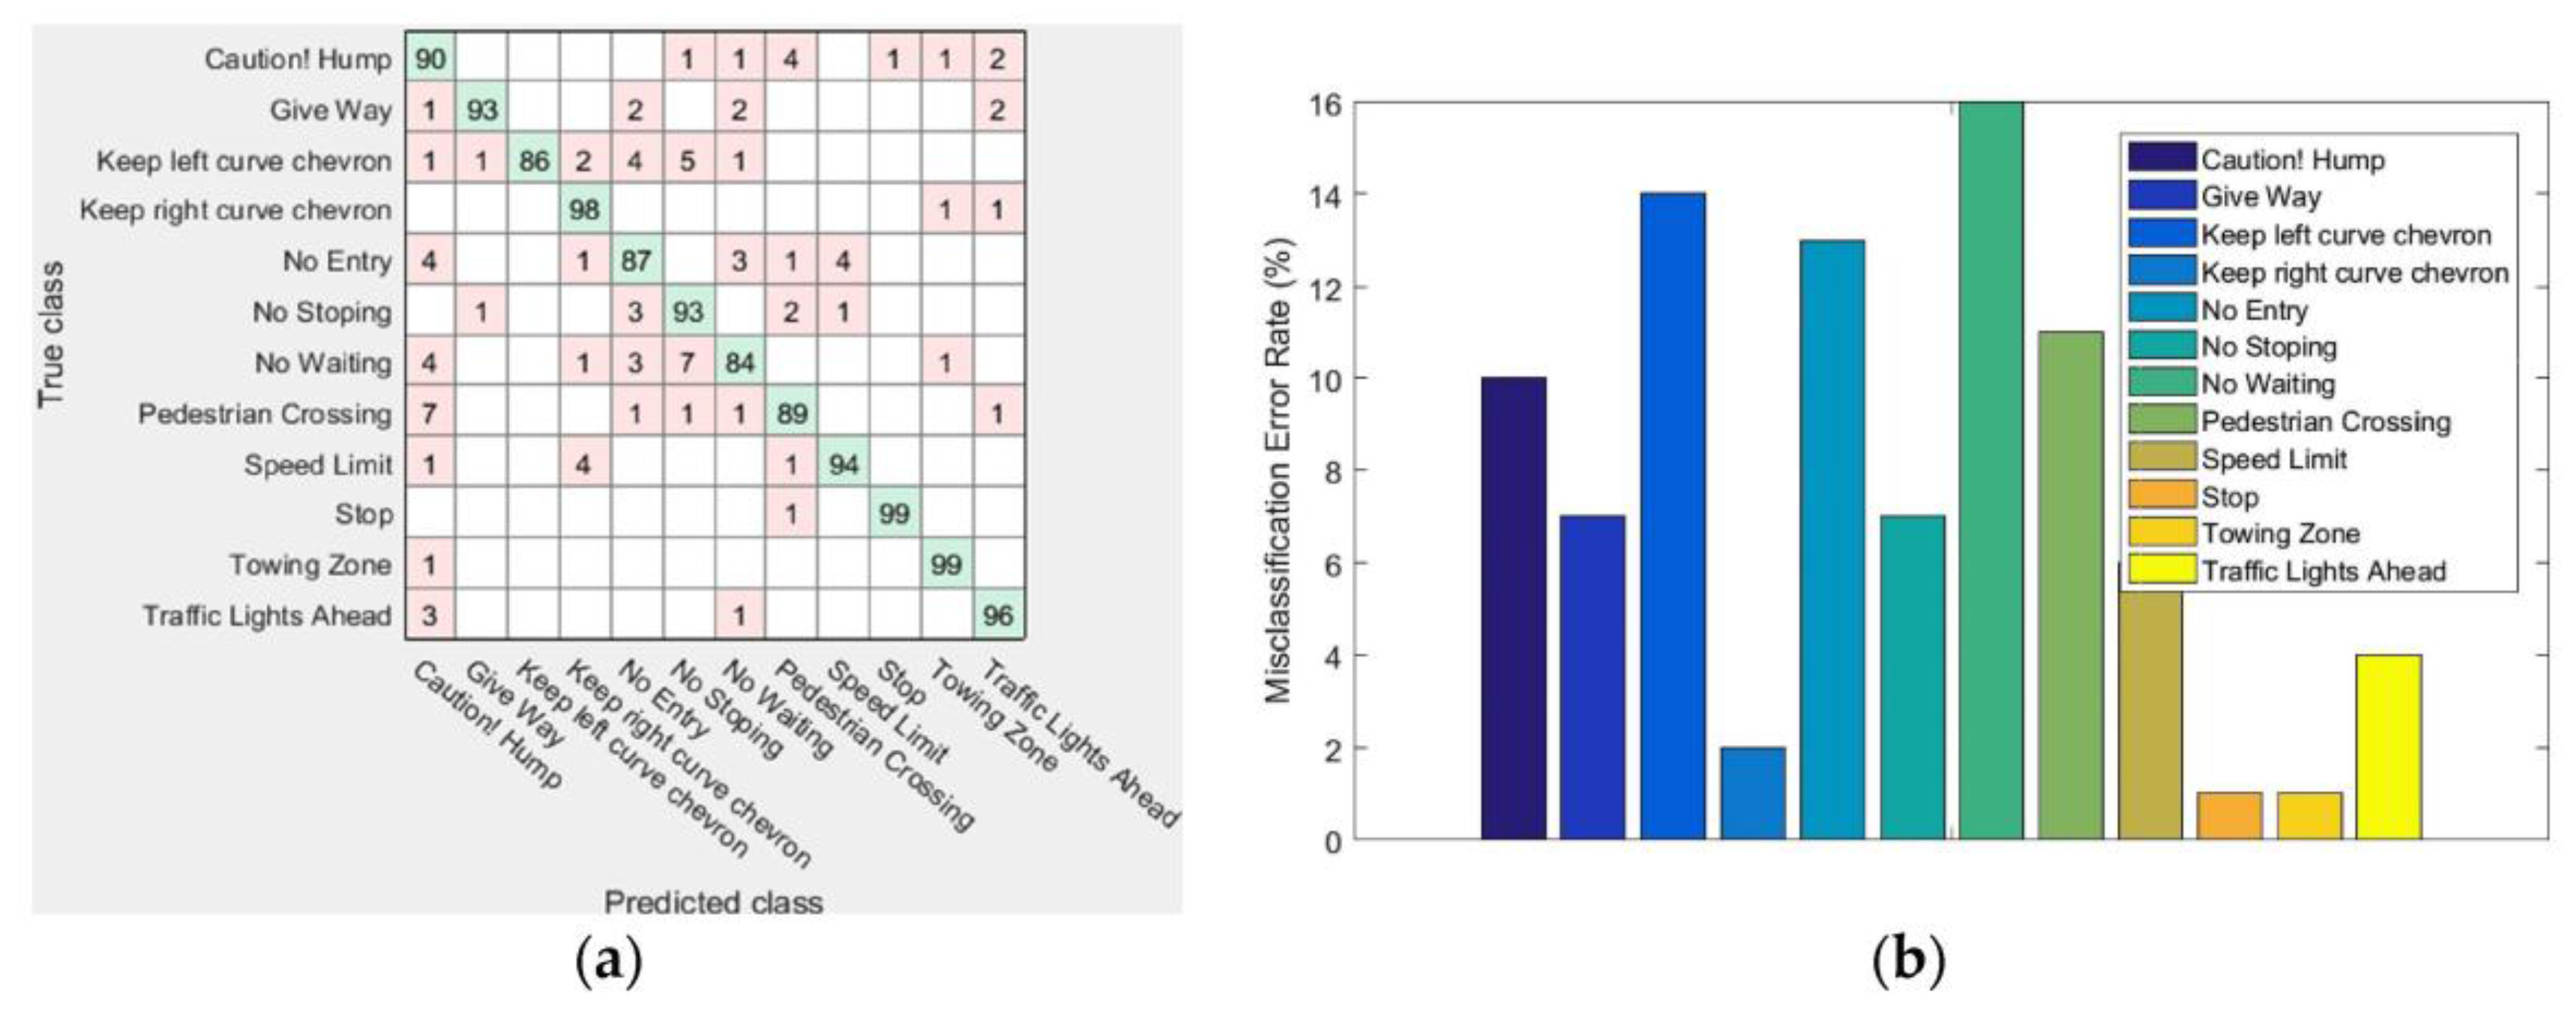
Figure 13.
Ensemble subspace k-nearest neighbors (kNN) classifier result; (a) Confusion matrix; (b) Misclassification error rate.
Figure 13.
Ensemble subspace k-nearest neighbors (kNN) classifier result; (a) Confusion matrix; (b) Misclassification error rate.

Figure 14.
ANN classifier result; (a) Confusion matrix; (b) Misclassification error rate.
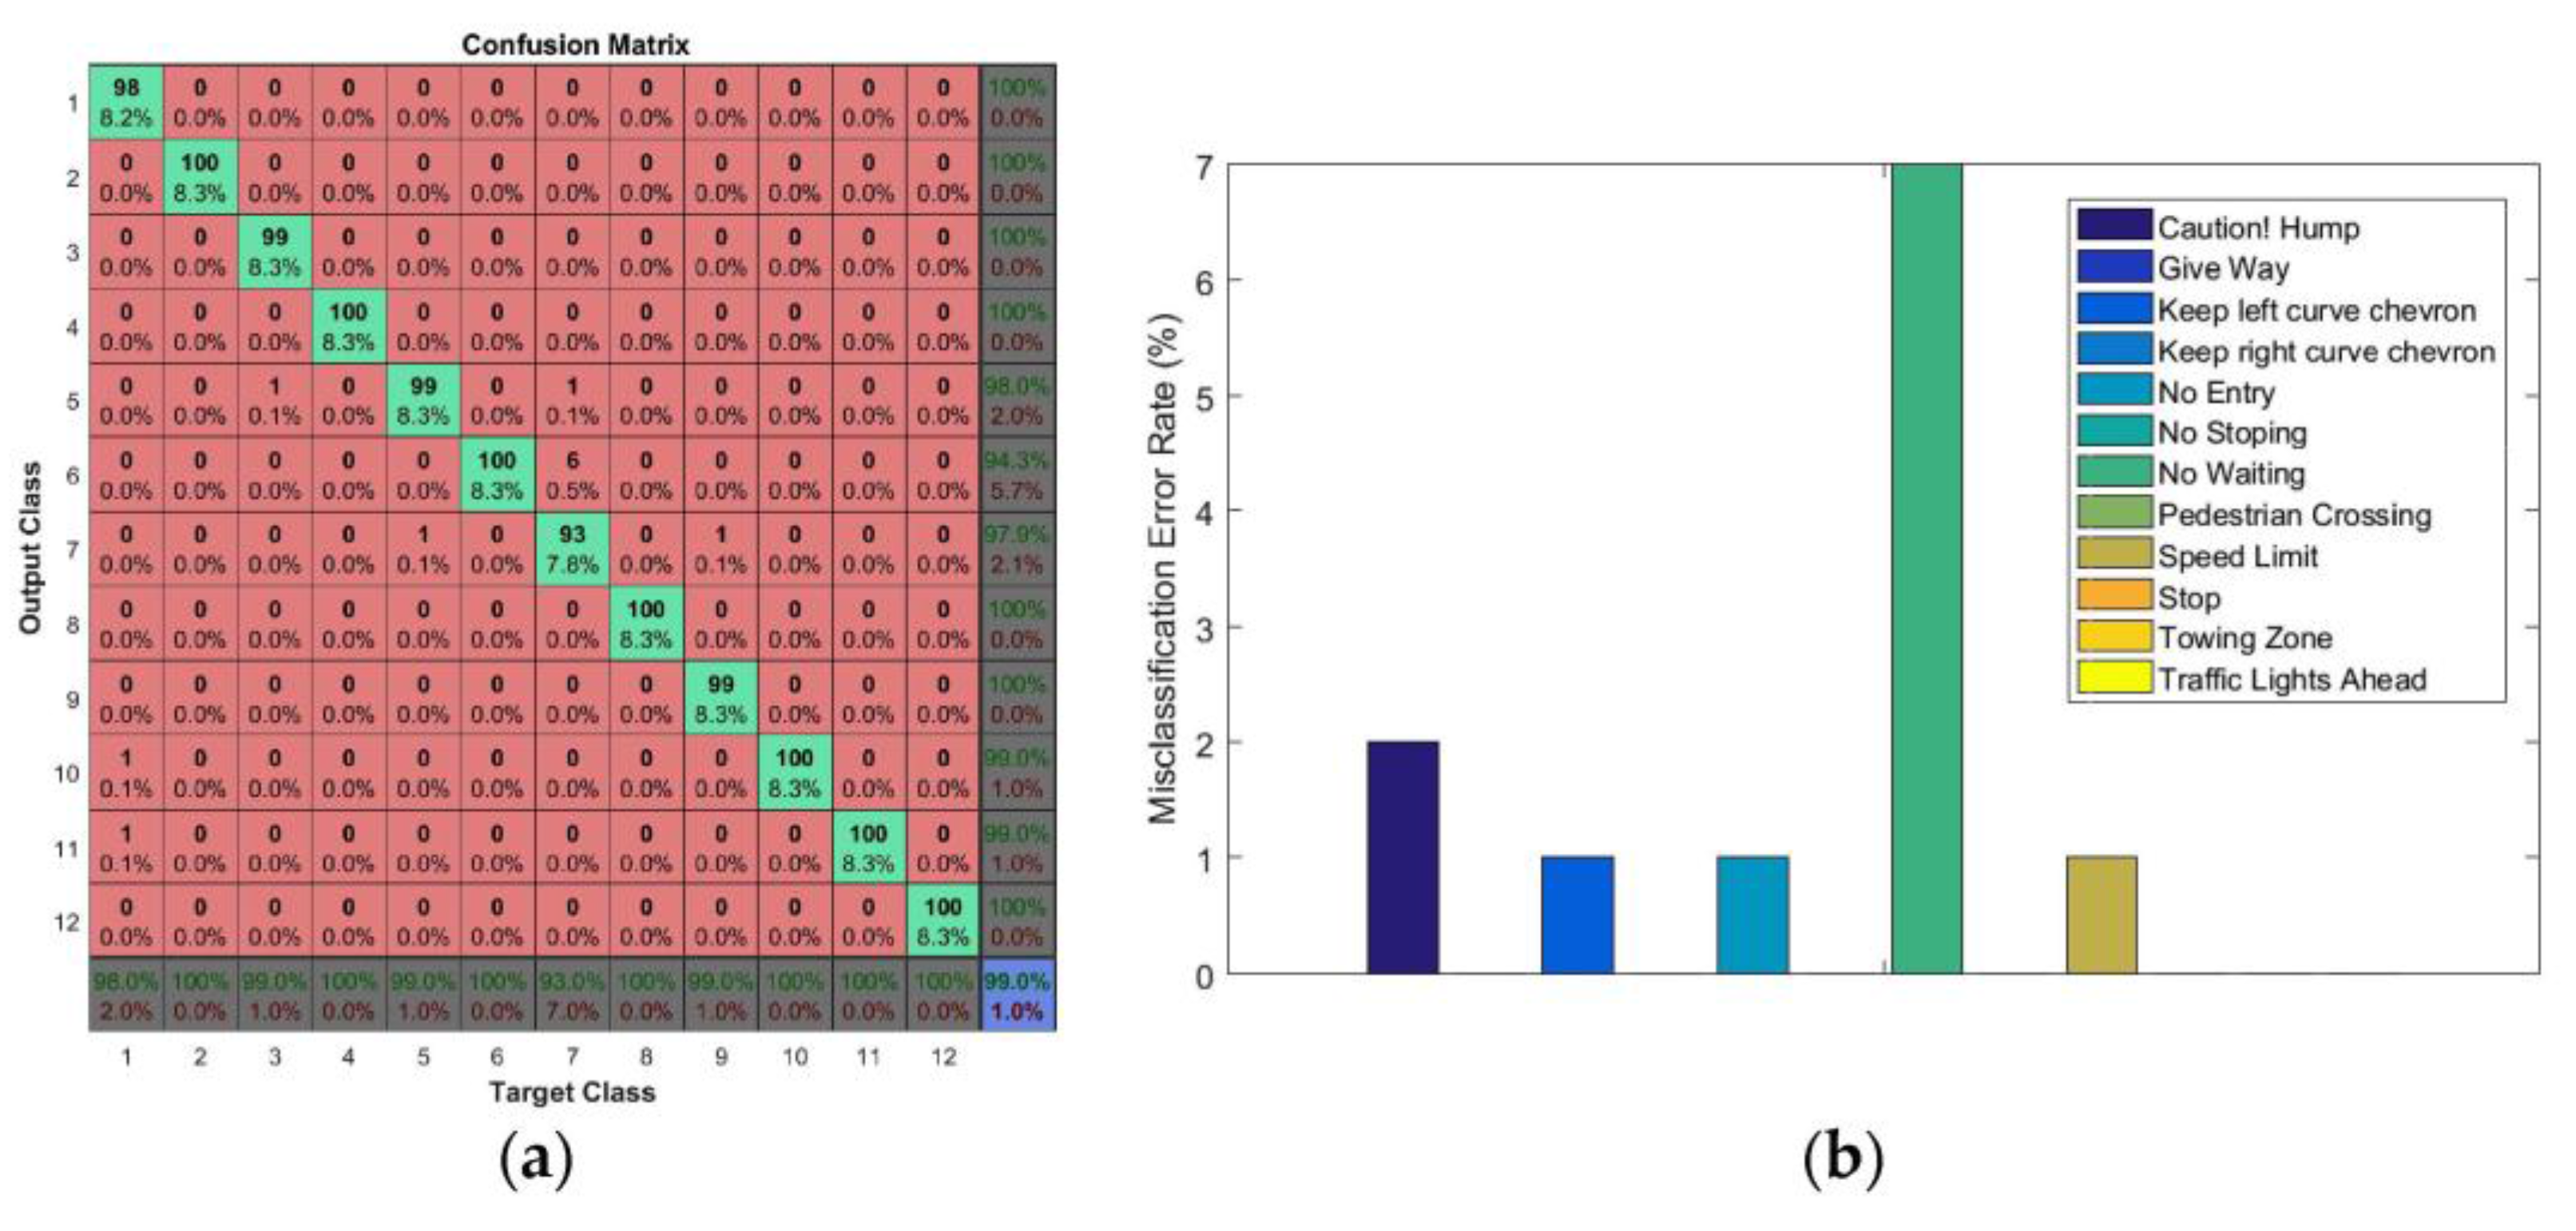
Figure 15.
Real-time experimental results.
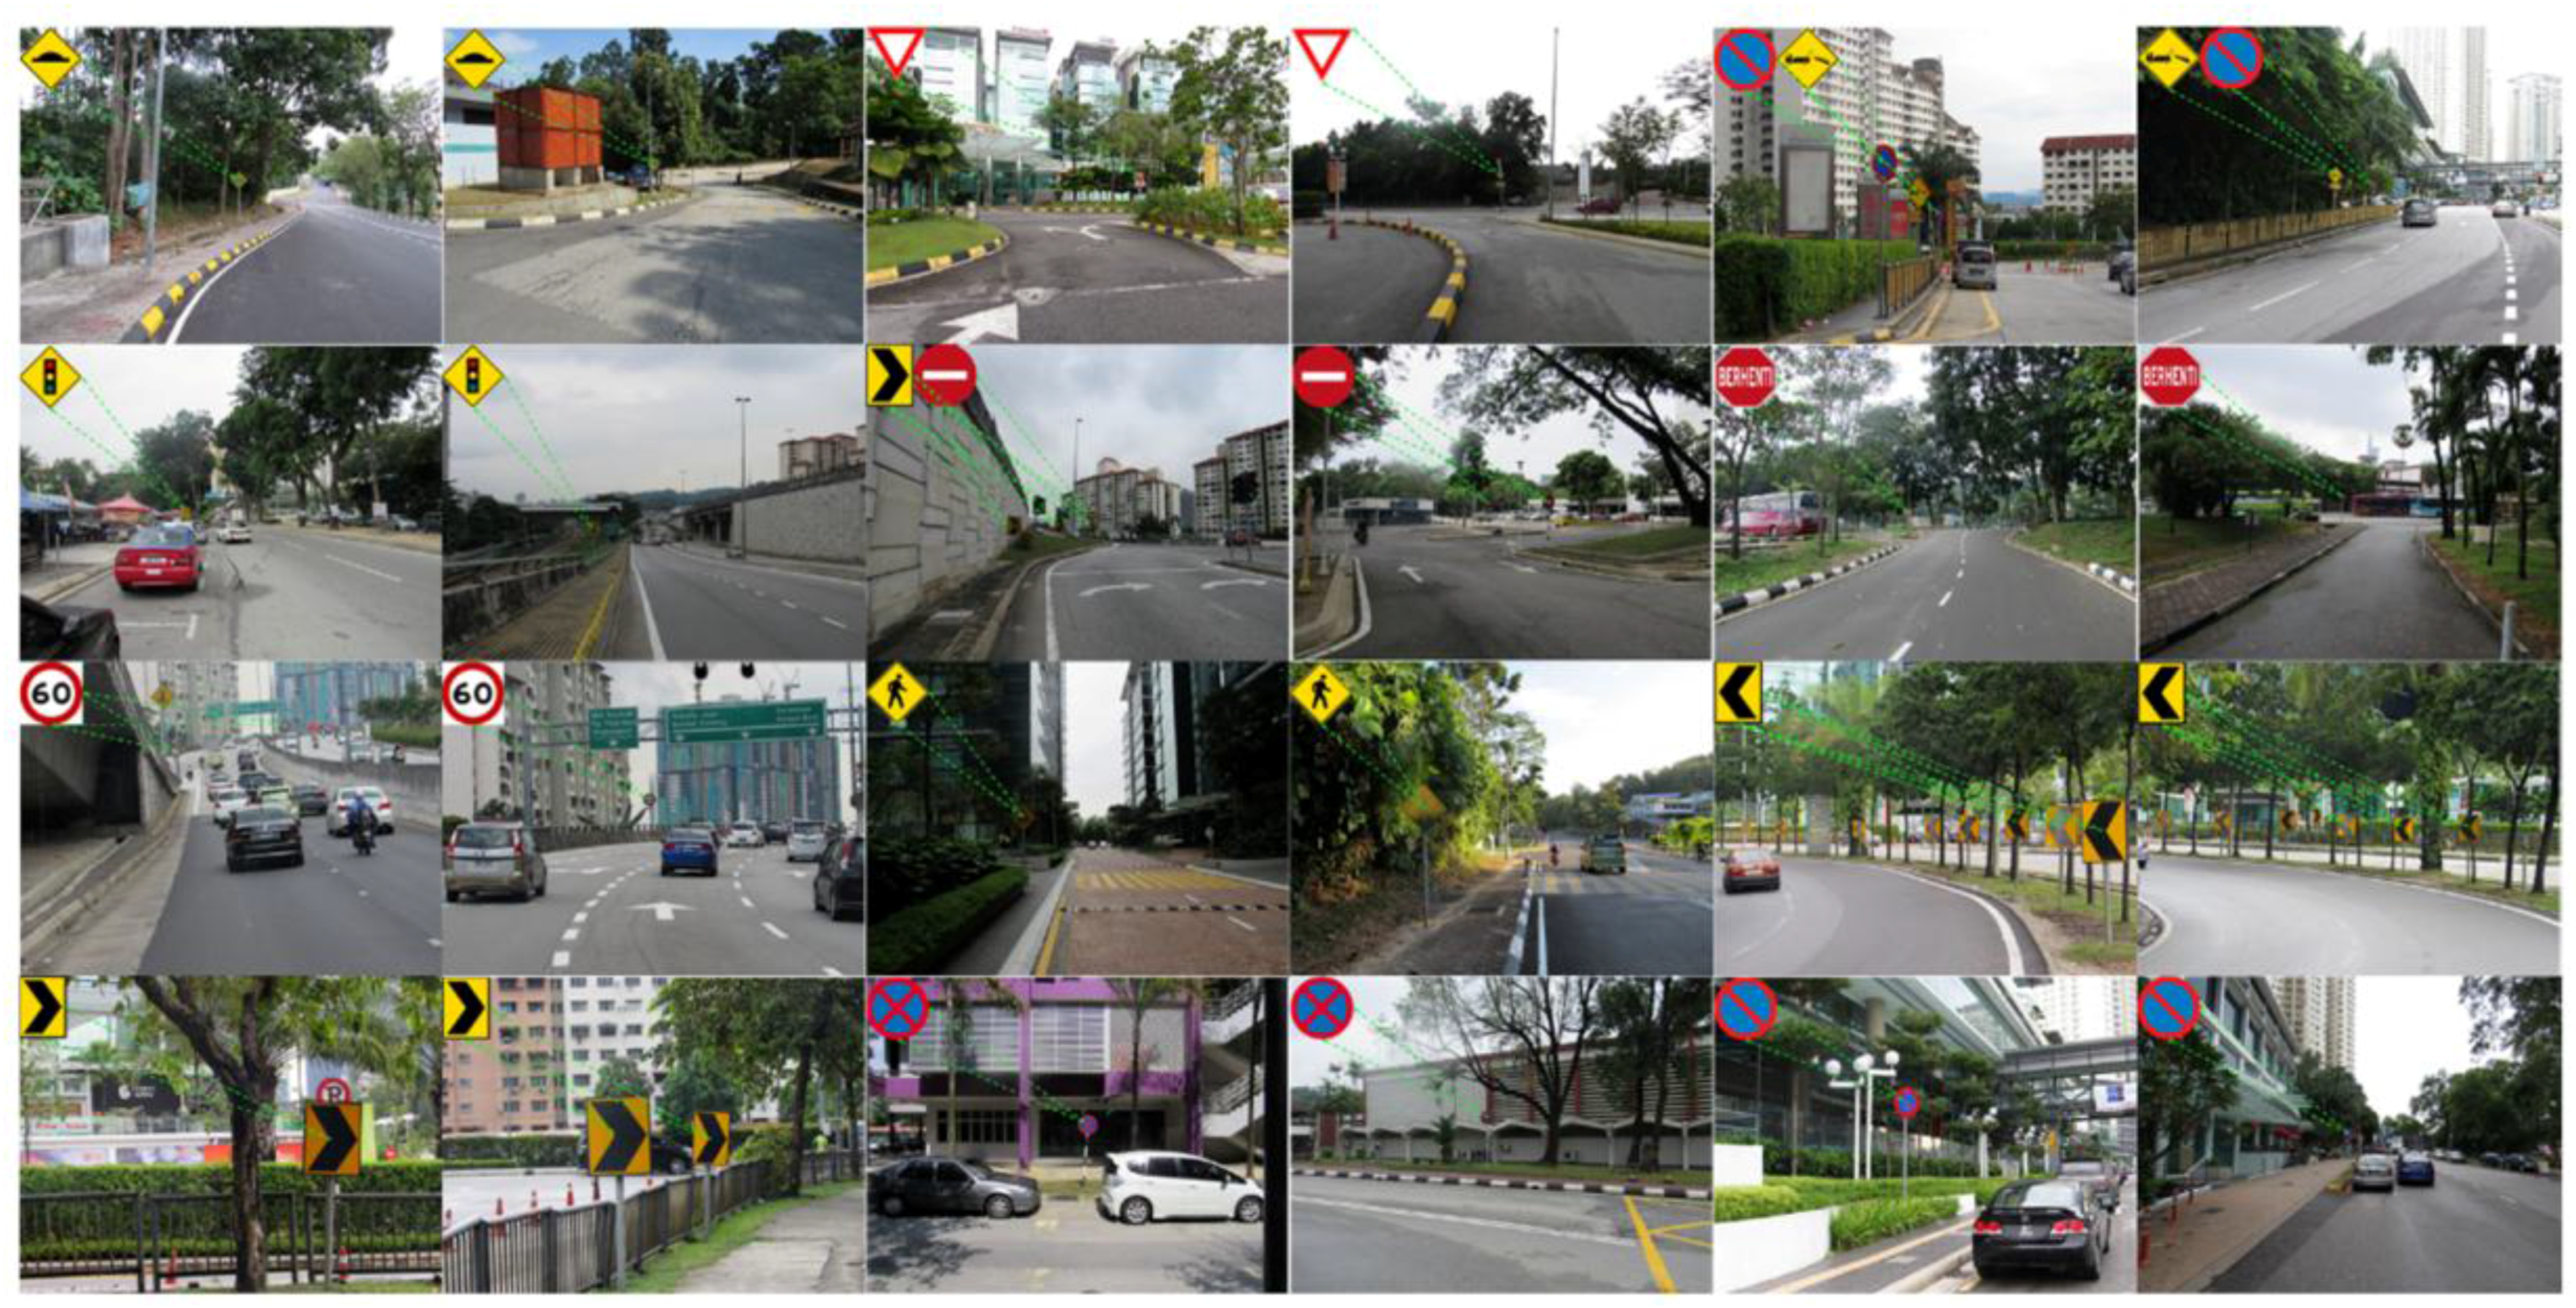
Figure 16.
Classification accuracy rate; (1) SVM; (2) Ensemble Subspace kNN; and (3) ANN.

Figure 17.
Confusion matrices of nine additional experiments.


Table 1.
Neural network performance with number of hidden neurons in hidden layer.
| Number of Hidden Neurons | Iterations | Training Time | Performance | Gradient | Results | |
|---|---|---|---|---|---|---|
| Cross Entropy Error | Percentages of Error (%E) | |||||
| 10 | 152 | 0:00:01 | 0.0174 | 0.0237 | 0.4874 | 10.5833 |
| 20 | 112 | 0:00:01 | 0.00428 | 0.0143 | 0.1905 | 4.7500 |
| 30 | 123 | 0:00:01 | 0.00322 | 0.0126 | 0.1568 | 3.9167 |
| 40 | 115 | 0:00:01 | 0.00239 | 0.00758 | 0.4729 | 2.8333 |
| 50 | 115 | 0:00:01 | 0.00363 | 0.00931 | 0.1484 | 3.6667 |
| 60 | 101 | 0:00:01 | 0.00627 | 0.0212 | 0.1912 | 3.6667 |
| 70 | 98 | 0:00:01 | 0.00348 | 0.0177 | 0.1647 | 4.0000 |
| 80 | 102 | 0:00:01 | 0.00304 | 0.0110 | 0.1388 | 3.7500 |
| 90 | 136 | 0:00:01 | 0.00192 | 0.00739 | 0.3469 | 2.4167 |
| 100 | 132 | 0:00:01 | 0.00234 | 0.00740 | 0.2021 | 1.0000 |
| 110 | 115 | 0:00:02 | 0.00197 | 0.00492 | 0.1935 | 1.4167 |
Table 2.
Evaluation between others existing method and proposed method.
| Reference | Overall Accuracy (%) | Processing Time (s) |
|---|---|---|
| [1] | 97.60 | - |
| [15] | 95.71 | 0.43 |
| [17] | 93.60 | - |
| [24] | 98.62 | 0.36 |
| [35] | 95.20 | - |
| [37] | 92.47 | - |
| [57] | 90.27 | 0.35 |
| [58] | 86.70 | - |
| Proposed method | 99.00 | 0.28 |
Table 3.
Comparison of accuracy results of baseline approach and proposed approach.
| Database | Classifier | Baseline [67,68] | Proposed Approach |
|---|---|---|---|
| Malaysian Real-Time Dataset | SVM | 97.30 | 92.30 |
| Ensemble subspace kNN | 92.50 | 92.70 | |
| ANN | 97.80 | 99.00 | |
| Belgian Traffic Sign Dataset [25] | SVM | 89.80 | 92.30 |
| Ensemble subspace kNN | 90.80 | 93.70 | |
| ANN | 97.10 | 97.20 |
© 2017 by the authors. Licensee MDPI, Basel, Switzerland. This article is an open access article distributed under the terms and conditions of the Creative Commons Attribution (CC BY) license (http://creativecommons.org/licenses/by/4.0/).
Share and Cite
MDPI and ACS Style
Islam, K.T.; Raj, R.G.; Mujtaba, G. Recognition of Traffic Sign Based on Bag-of-Words and Artificial Neural Network. Symmetry 2017, 9, 138. https://doi.org/10.3390/sym9080138
AMA Style
Islam KT, Raj RG, Mujtaba G. Recognition of Traffic Sign Based on Bag-of-Words and Artificial Neural Network. Symmetry. 2017; 9(8):138. https://doi.org/10.3390/sym9080138
Chicago/Turabian StyleIslam, Kh Tohidul, Ram Gopal Raj, and Ghulam Mujtaba. 2017. "Recognition of Traffic Sign Based on Bag-of-Words and Artificial Neural Network" Symmetry 9, no. 8: 138. https://doi.org/10.3390/sym9080138
Note that from the first issue of 2016, this journal uses article numbers instead of page numbers. See further details here.