Gait Characteristics Associated with Trip-Induced Falls on Level and Sloped Irregular Surfaces

Abstract
: Same level falls continue to contribute to an alarming number of slip/trip/fall injuries in the mining workforce. The objective of this study was to investigate how walking on different surface types and transverse slopes influences gait parameters that may be associated with a trip event. Gait analysis was performed for ten subjects on two orientations (level and sloped) on smooth, hard surface (control) and irregular (gravel, larger rocks) surfaces. Walking on irregular surfaces significantly increased toe clearance compared to walking on the smooth surface. There was a significant (p < 0.05) decrease in cadence (steps/min), stride length (m), and speed (m/s) from control to gravel to larger rocks. Significant changes in external rotation and increased knee flexion while walking on irregular surfaces were observed. Toe and heel clearance requirements increased on irregular surfaces, which may provide an explanation for trip-induced falls; however, the gait alterations observed in the experienced workers used as subjects would likely improve stability and recovery from a trip.1. Introduction
According to the U.S. Bureau of Labor Statistics, same level falls contributed to over one million lost work days (LWD) between 2005 and 2008 [1]. The source of injury reported by nearly 21% of cases was the floor or ground surface. Injuries associated with slips and falls are of particular interest to the mining industry. Between 2003–2007, of the 17,773 underground mine accident/injuries included in the Mine Safety and Health Administration (MSHA) database, 2,563 (14.4%) related to slip or fall of the worker, and of the 35,331 surface mine accident/injuries included in the MSHA database, 8,032 (22.7%) related to slip or fall of the worker [2]. Slip or fall of the worker was also a frequent injury classification for coal mining contractors, representing 21.9% of nonfatal lost-time injuries for coal contractor companies in 2006, 27.9% of nonfatal lost-time injuries for non-coal contractor companies in 2006, and 25.9% of all nonfatal lost-time injuries for sand and gravel operators in 2007 [3-5]. The prevention of traumatic injuries relating to slips and falls has been identified by the National Institute for Occupational Safety and Health (NIOSH) as one of the strategic goals of their mine safety research program [6].
There is a substantial amount of research focused on the biomechanics of trip-induced falls on level or uphill/downhill walking on smooth surfaces and treadmills, but little has been done to understand gait alterations on irregular surfaces [7-12]. Gait adaptations on a cross-slope (transverse plane slope), characterized by a surface with a slope running from left to right or right to left has been examined by others [13,14], but the relationship to trip-induced falls has not been clearly established.
Trips generally occur when the swing foot contacts the ground, or when the stance foot prematurely contacts the ground before initial support [15]. Minimum foot clearance (MFC), minimum toe clearance (MTC), MTC variability, and foot velocity at MFC appear to be important parameters related to a trip-induced fall [8,16,17]. Variability of frontal plane ankle kinematics during walking on irregular surfaces has been reported [13]; however, no data are available with respect to the influence of surface composition and slope (transverse/cross-slope) on other gait adaptations that may be related to trips. The feasibility of performing gait analysis on irregular surfaces, including collection of ground reaction forces, has recently been successfully demonstrated [18,19]. These studies have opened new opportunities for research on irregular surfaces using traditional gait analysis techniques and custom adjustable walkways.
More recently the influence of irregular surfaces on lower limb muscle electromyography and joint moments has been published [20]. They observed an increase in muscle activity as a result of additional co-contraction required during gait on irregular surfaces. These findings suggest that fatigue may also play an important role in trip-induced falls.
The purpose of this study was to investigate gait adaptations while ambulating over irregular surfaces and determine how surface composition and slope in the transverse plane may influence the likelihood of a trip event. Temporal spatial parameters were examined, as well as a measure of surface condition irregularity and toe/foot clearance during the swing phase of a gait cycle.
2. Methods
Three-dimensional gait data from ten healthy males with experience walking on irregular surfaces (age (years) = 37.1 ± 8.9; height (cm) = 180 ± 8; mass (kg) = 84 ± 14.1; years of experience = 8.4 ± 7.7) were analyzed in the Ergonomics and Safety Laboratory of the University of Utah. All participants had occupational experience in walking on irregular surfaces and undertook informed consent procedures approved by the University of Utah's Institutional Review Board prior to participation.
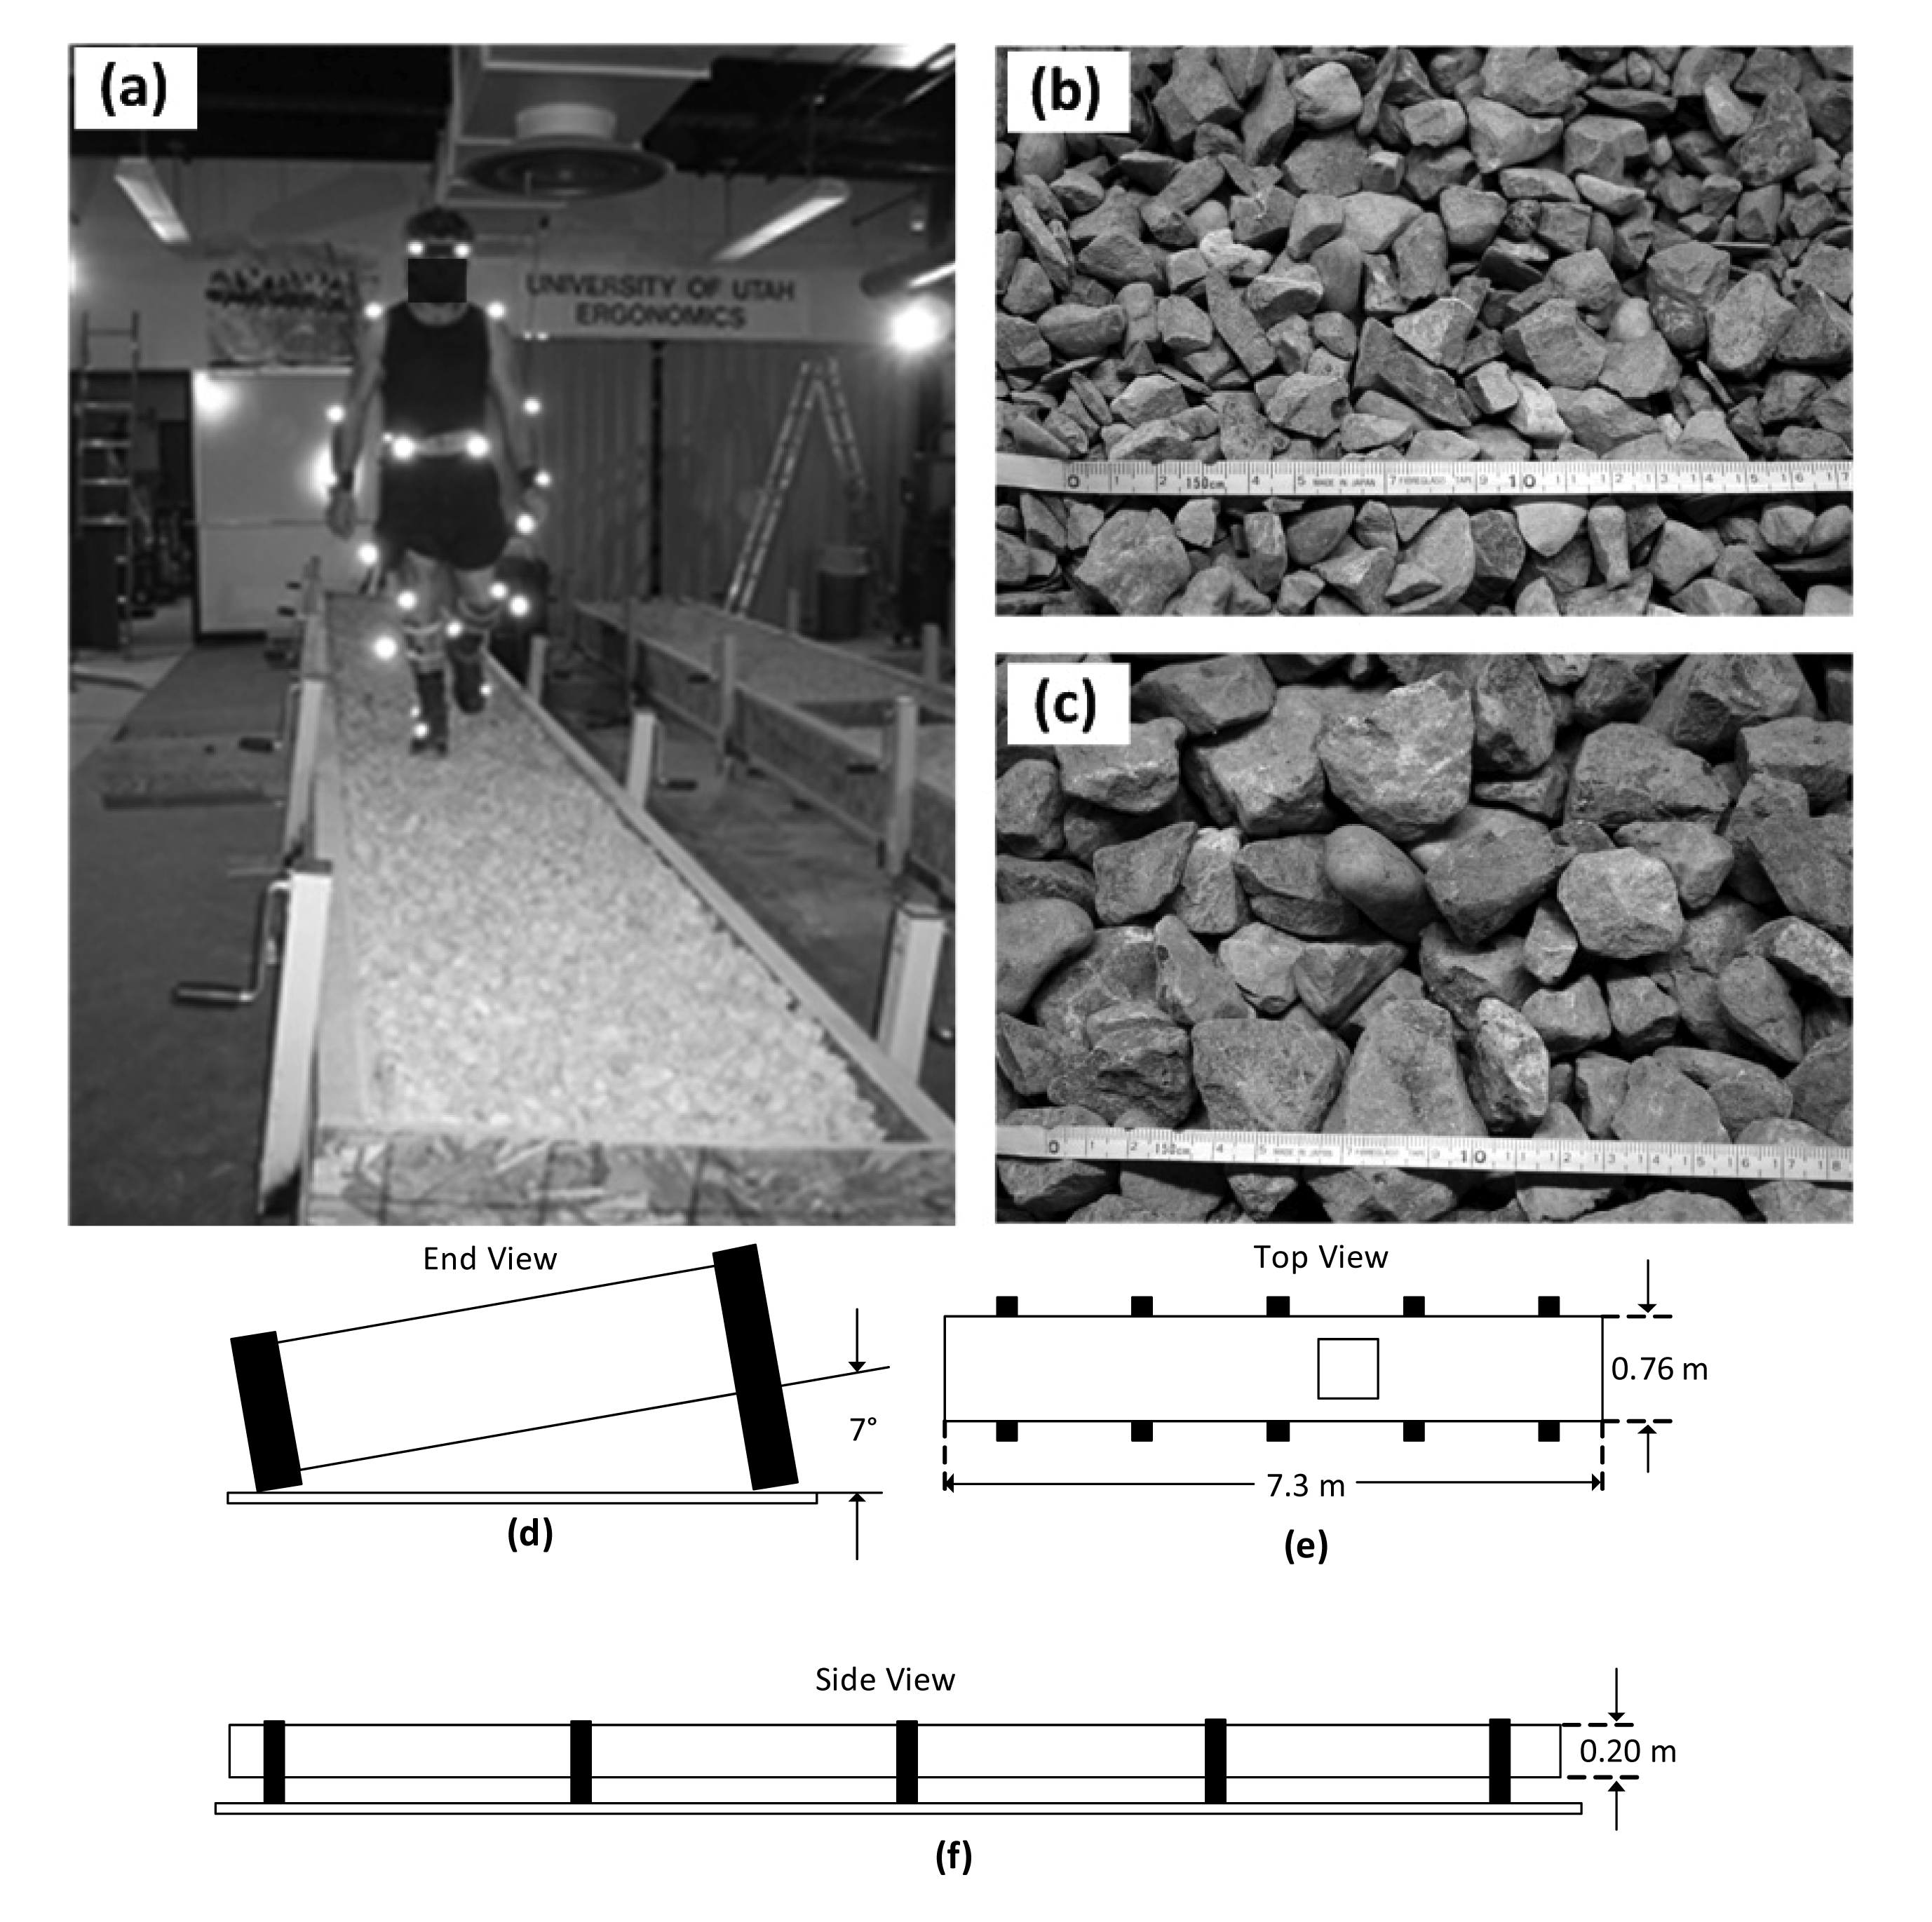
Custom walkways 76 cm wide and 7.3 m long and 20 cm deep were designed to contain larger rocks (2.5–5.5 cm) and gravel (1.1–2.7 cm). See Figure 1(a–f). The walkways were constructed on ten adjustable jacks to provide an adjustable surface in the transverse plane of up to 14°. The final walking surface on each walkway was raised slightly (approximately 52 cm) from the laboratory floor. Three walking surface types: larger rocks (LR), gravel (G), and hard surface (HS) (structural plywood sheeting), and two walkway configurations, level and sloped (7°) were examined in this study.
The slope in this study was chosen as 7° to compare to research reported by others [13] and transverse slope gait adaptations on a 6° slope [14,21].
Temporal/spatial parameters (i.e., cadence (steps/min), stride length (m), speed (m/s), single support (%gait cycle), double support (%gait cycle), stance/swing time (second)) and kinematic parameters (toe and heel clearance, knee external rotation, knee flexion) were measured using ViconMotus (ViconPeak, Centennial, CO, USA) with 5 Panasonic GS55 digital video cameras. An AMTI, OR6-5 force plate (Advanced Mechanical Technologies, Inc., Watertown, MA, USA) located beneath the gravel and larger rocks was used to improve event detection for calculating temporal parameters. Motion data were recorded at a sampling rate of 60 Hz and force plate data were recorded with a sampling frequency of 1,200 Hz. Analog data were scaled and matched to the 60 Hz video data for analyses.
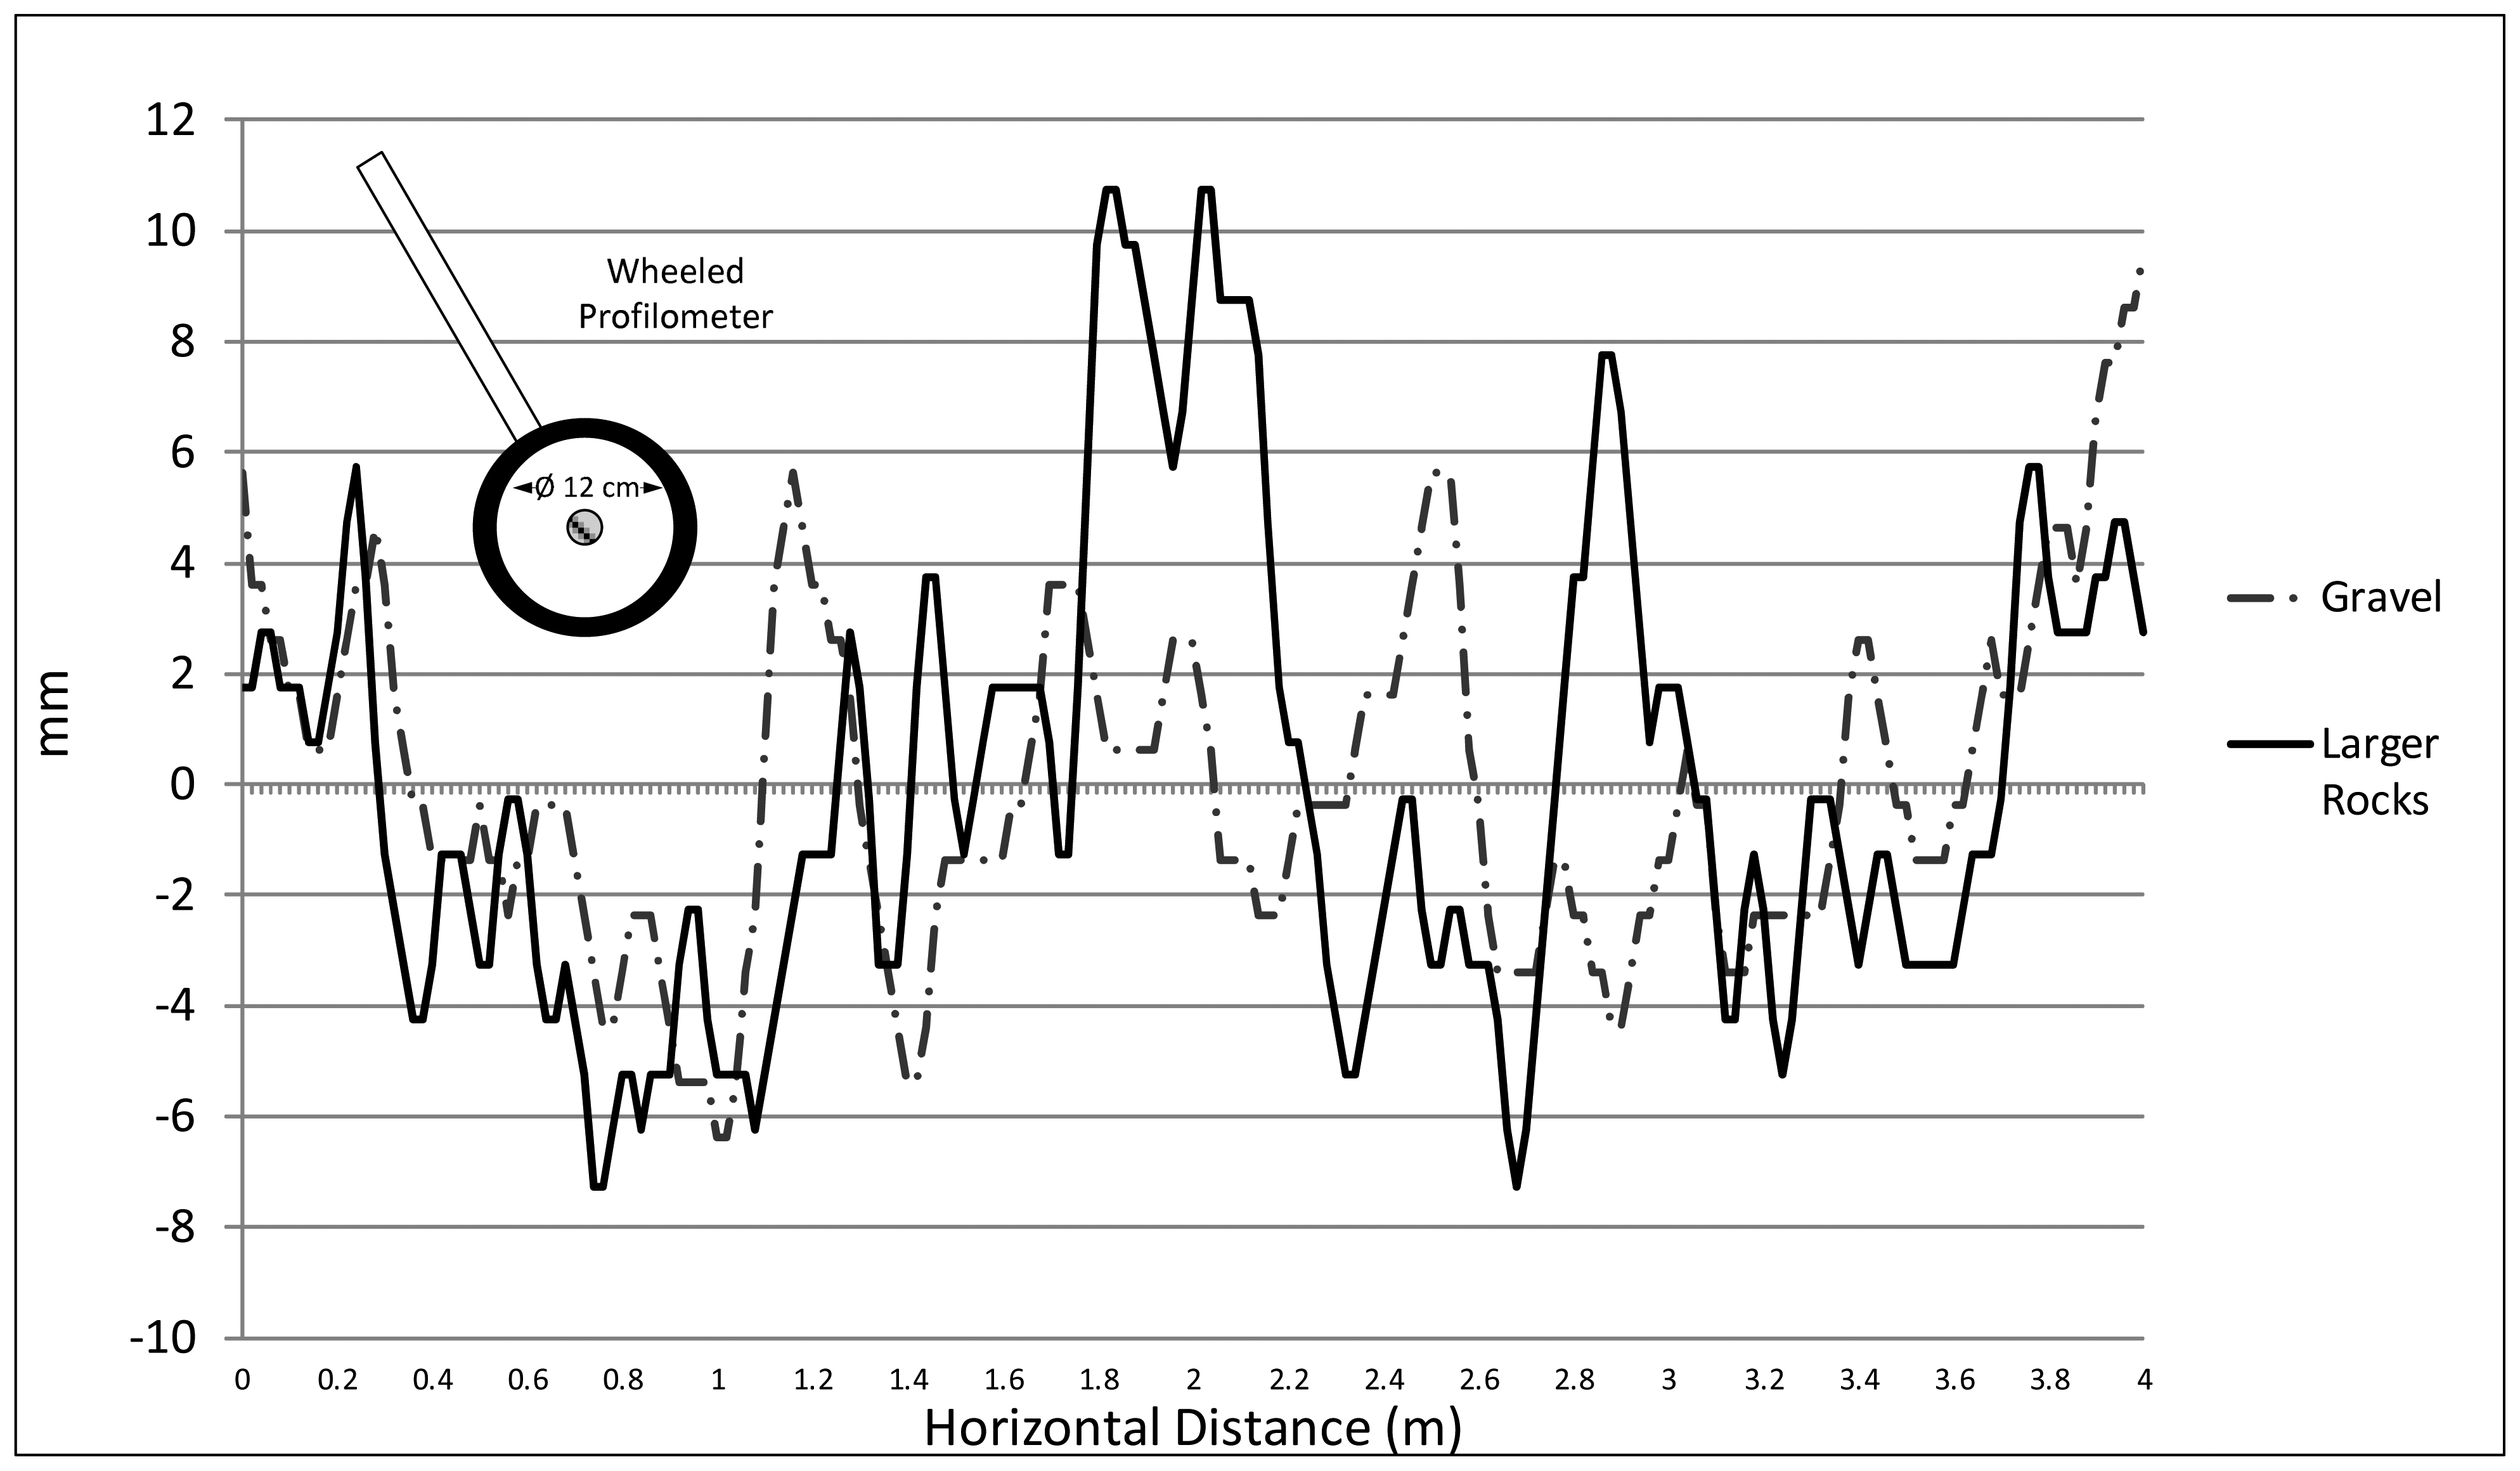
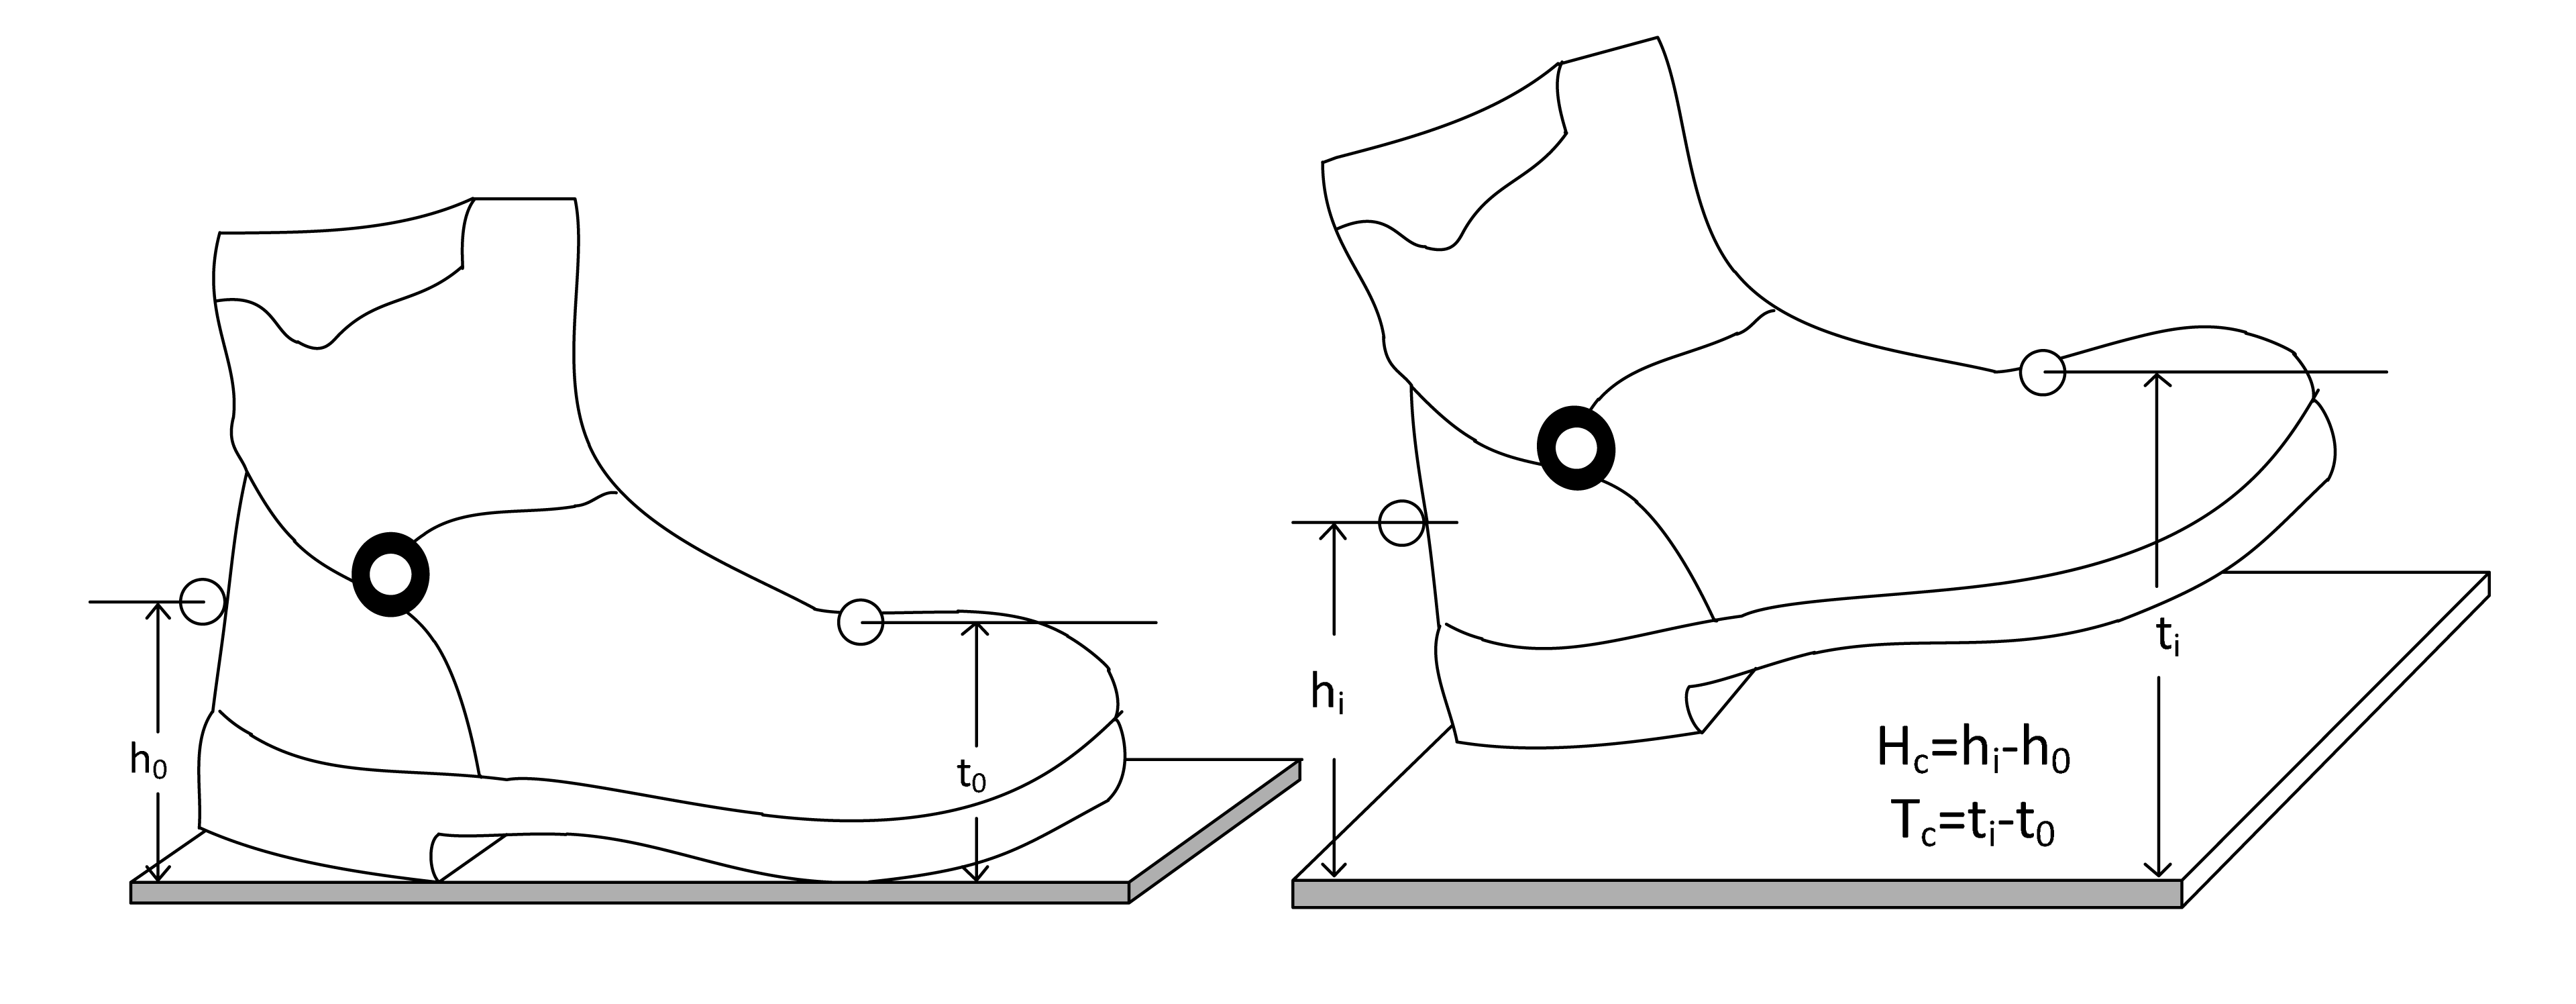
A measurement of surface irregularities for each walkway was derived using a rolling measurement wheel (profilometer) 12 cm in diameter by 2.5 cm wide, instrumented with a retro-reflective marker at the axis of rotation. Measurements were taken at 3 locations on the track (center, 30 cm right of center and 30 cm left of center). Data were recorded in two separate trials for each location to calculate a mean irregularity measure for each irregular surface (Figure 2). The trajectory of the marker located at the axis of the wheel provided a measure of vertical displacement over the length of the irregular surface. This value represented the irregularity of each sample along the walkway. Measurements of displacement and foot clearance were obtained by taking the difference between the vertical location of the foot markers (toe and heel) during stance, when the foot was planted on the surface, and the vertical location of these markers during swing during the gait cycle where foot contact on the force plate occurred (Figure 3). The mean irregularity represented the “smoothness” of each surface. Irregularity values were measured as the difference from this mean, where negative values indicated a “trough” or “valley” and positive values indicated a “peak”. It should be noted that the reported distances for heel and toe clearance are not true amounts of actual clearance from the irregular surface, but a measurement of the difference between the vertical heights of the toe and heel markers during stance and swing.
Each participant was fitted with a new pair of model 2408 Red Wing work boots to standardize footwear. It is recognized that these boots are lighter and more comfortable than some types of footwear worn in mines; they are representative of quality footwear often worn in this type of working environment. The conclusions of this research, however, are most appropriate for this general type of footwear than for other types. The markers on the foot and ankle were placed on the boots bilaterally over the second metatarsal, heel, and lateral malleolus. All lower limb markers were placed according to a modified Helen Hayes Hospital marker set for gait, as referenced by Vaughan et al. [22] and included markers on the left and right anterior superior iliac spine, femoral condyles, femoral wand, and tibial wand and sacrum. Additional marker locations included, a headband, acromium process, lateral epicondyle of the humerus (elbow joint), distal radius (wrist joint), center of the hand, and C7 process (Figure 1(a)). Participants were randomly assigned a surface/configuration block. Six experimental conditions were presented in blocked format (10 trials each). Three surface conditions (hard, gravel, larger rocks) were presented in two orientations (level, sloped). Between each surface/orientation combination (block) a 20-minute waiting period was provided while researchers setup the next block and conditioned the walkway by raking the irregular surface to prevent a “path” from forming where the participants previously walked.
After a participant wearing the marker set became accustomed to walking on a surface/slope, a total of ten successful trials were collected for each of the six surface/configuration conditions (hard, gravel, larger rocks) × (level, sloped) for a total of 60 trials per subject. A successful trial was measured by a clean foot contact on the force plate. Force and moment data from the force plate have not been used in this study. However, to improve gait event detection, a minimum force plate threshold (20 N) was used to detect heel strike and toe off during a gait cycle to improve temporal parameter estimates. These computed events were verified by visual inspection for each force plate contact, and manually selected for each non-force plate contact. Participants were instructed to focus on a camera at eye level at the end of each walkway to reduce the chance of targeting the force plate. If targeting was suspected, the trial was repeated. The left limb was always on the downhill side of the slope during all trials (right-to-left cross-slope). The average amount of time to complete all 60 trials including consent, anthropometric measurements, marker-set placement, and walking was just under four hours for each participant, and was performed in a single session. It should be emphasized that the effects of fatigue and poor lighting were not considered in this research. The effect of fatigue and poor lighting variables will be considered for inclusion in future gait research.
Statistical analyses were conducted using a standard least squares regression model in JMP v8.0.2 (SAS Institute INC., Cary, NC, USA) to evaluate differences with a 3 (Surface: Hard, Large Aggregate, Small Aggregate) × 2 (Configuration: Slope, Level) design and post-hoc analyses using the Tukey-Kramer HSD method for multiple pairwise comparisons. A p-value of 0.05 was used for statistical tests. Continuous data were analyzed for all gait parameters and trials were normalized to 100% gait cycle for comparisons between surface conditions and slopes.
3. Results
Table 1 presents temporal parameters associated with normal gait for males reported in the literature for comparison with the current study [20,23-28]. The cadence (steps/min) for the control surface was significantly greater (p < 0.05) than the cadence for both irregular surfaces and slopes. Overall, the speed (m/s) and cadence measured in this study was generally lower than reported by others for normal gait on hard surfaces; however these values are similar to those reported by Wade et al. [20]. A significant trend was observed with an increase in cadence and speed with a smoother surface. Cycle time (s) was longer, but stride length (m) was very similar between surfaces. All control trials had a markedly faster gait speed than the irregular surface trials. The speed on the level surfaces was faster than each matched sloped surface. Stride length was longer for the level control compared to irregular surfaces, but the mean stride length on sloped surfaces was similar across surface types. The double support time and single support time as a percentage of the total gait cycle were similar across all surfaces. The summation of double support time with single support time multiplied by 2, form 100% of a gait cycle.
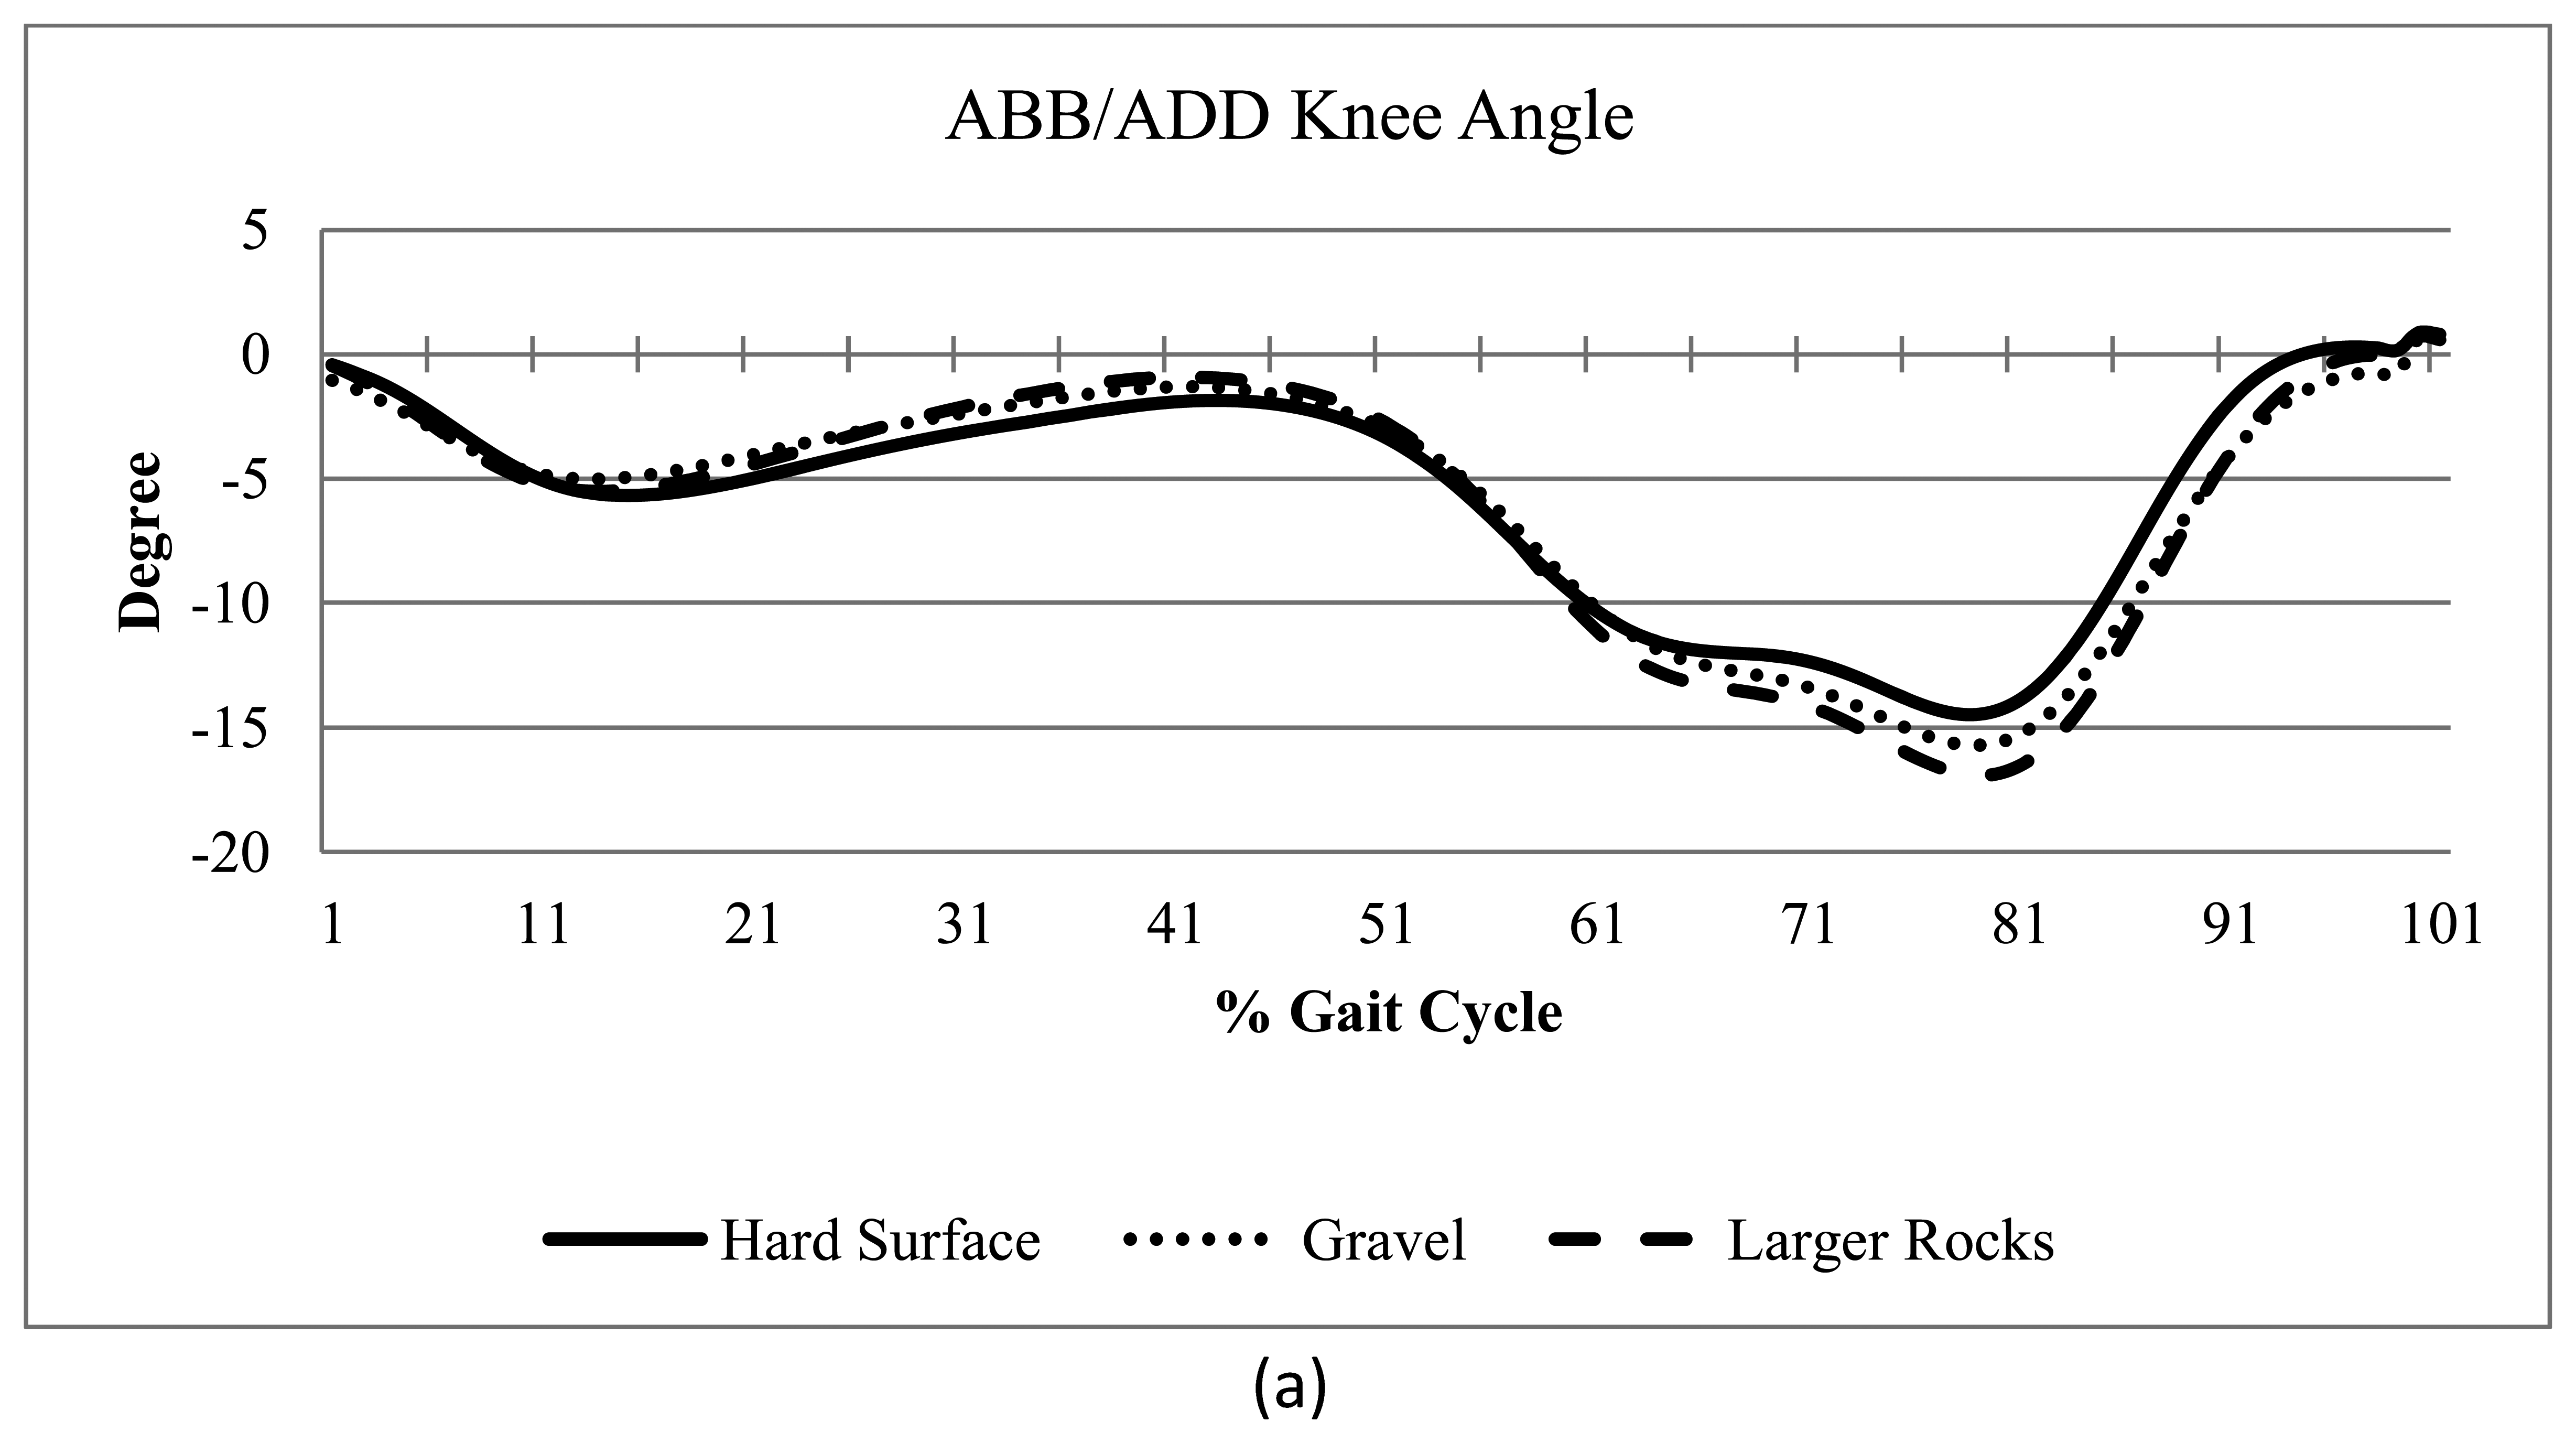
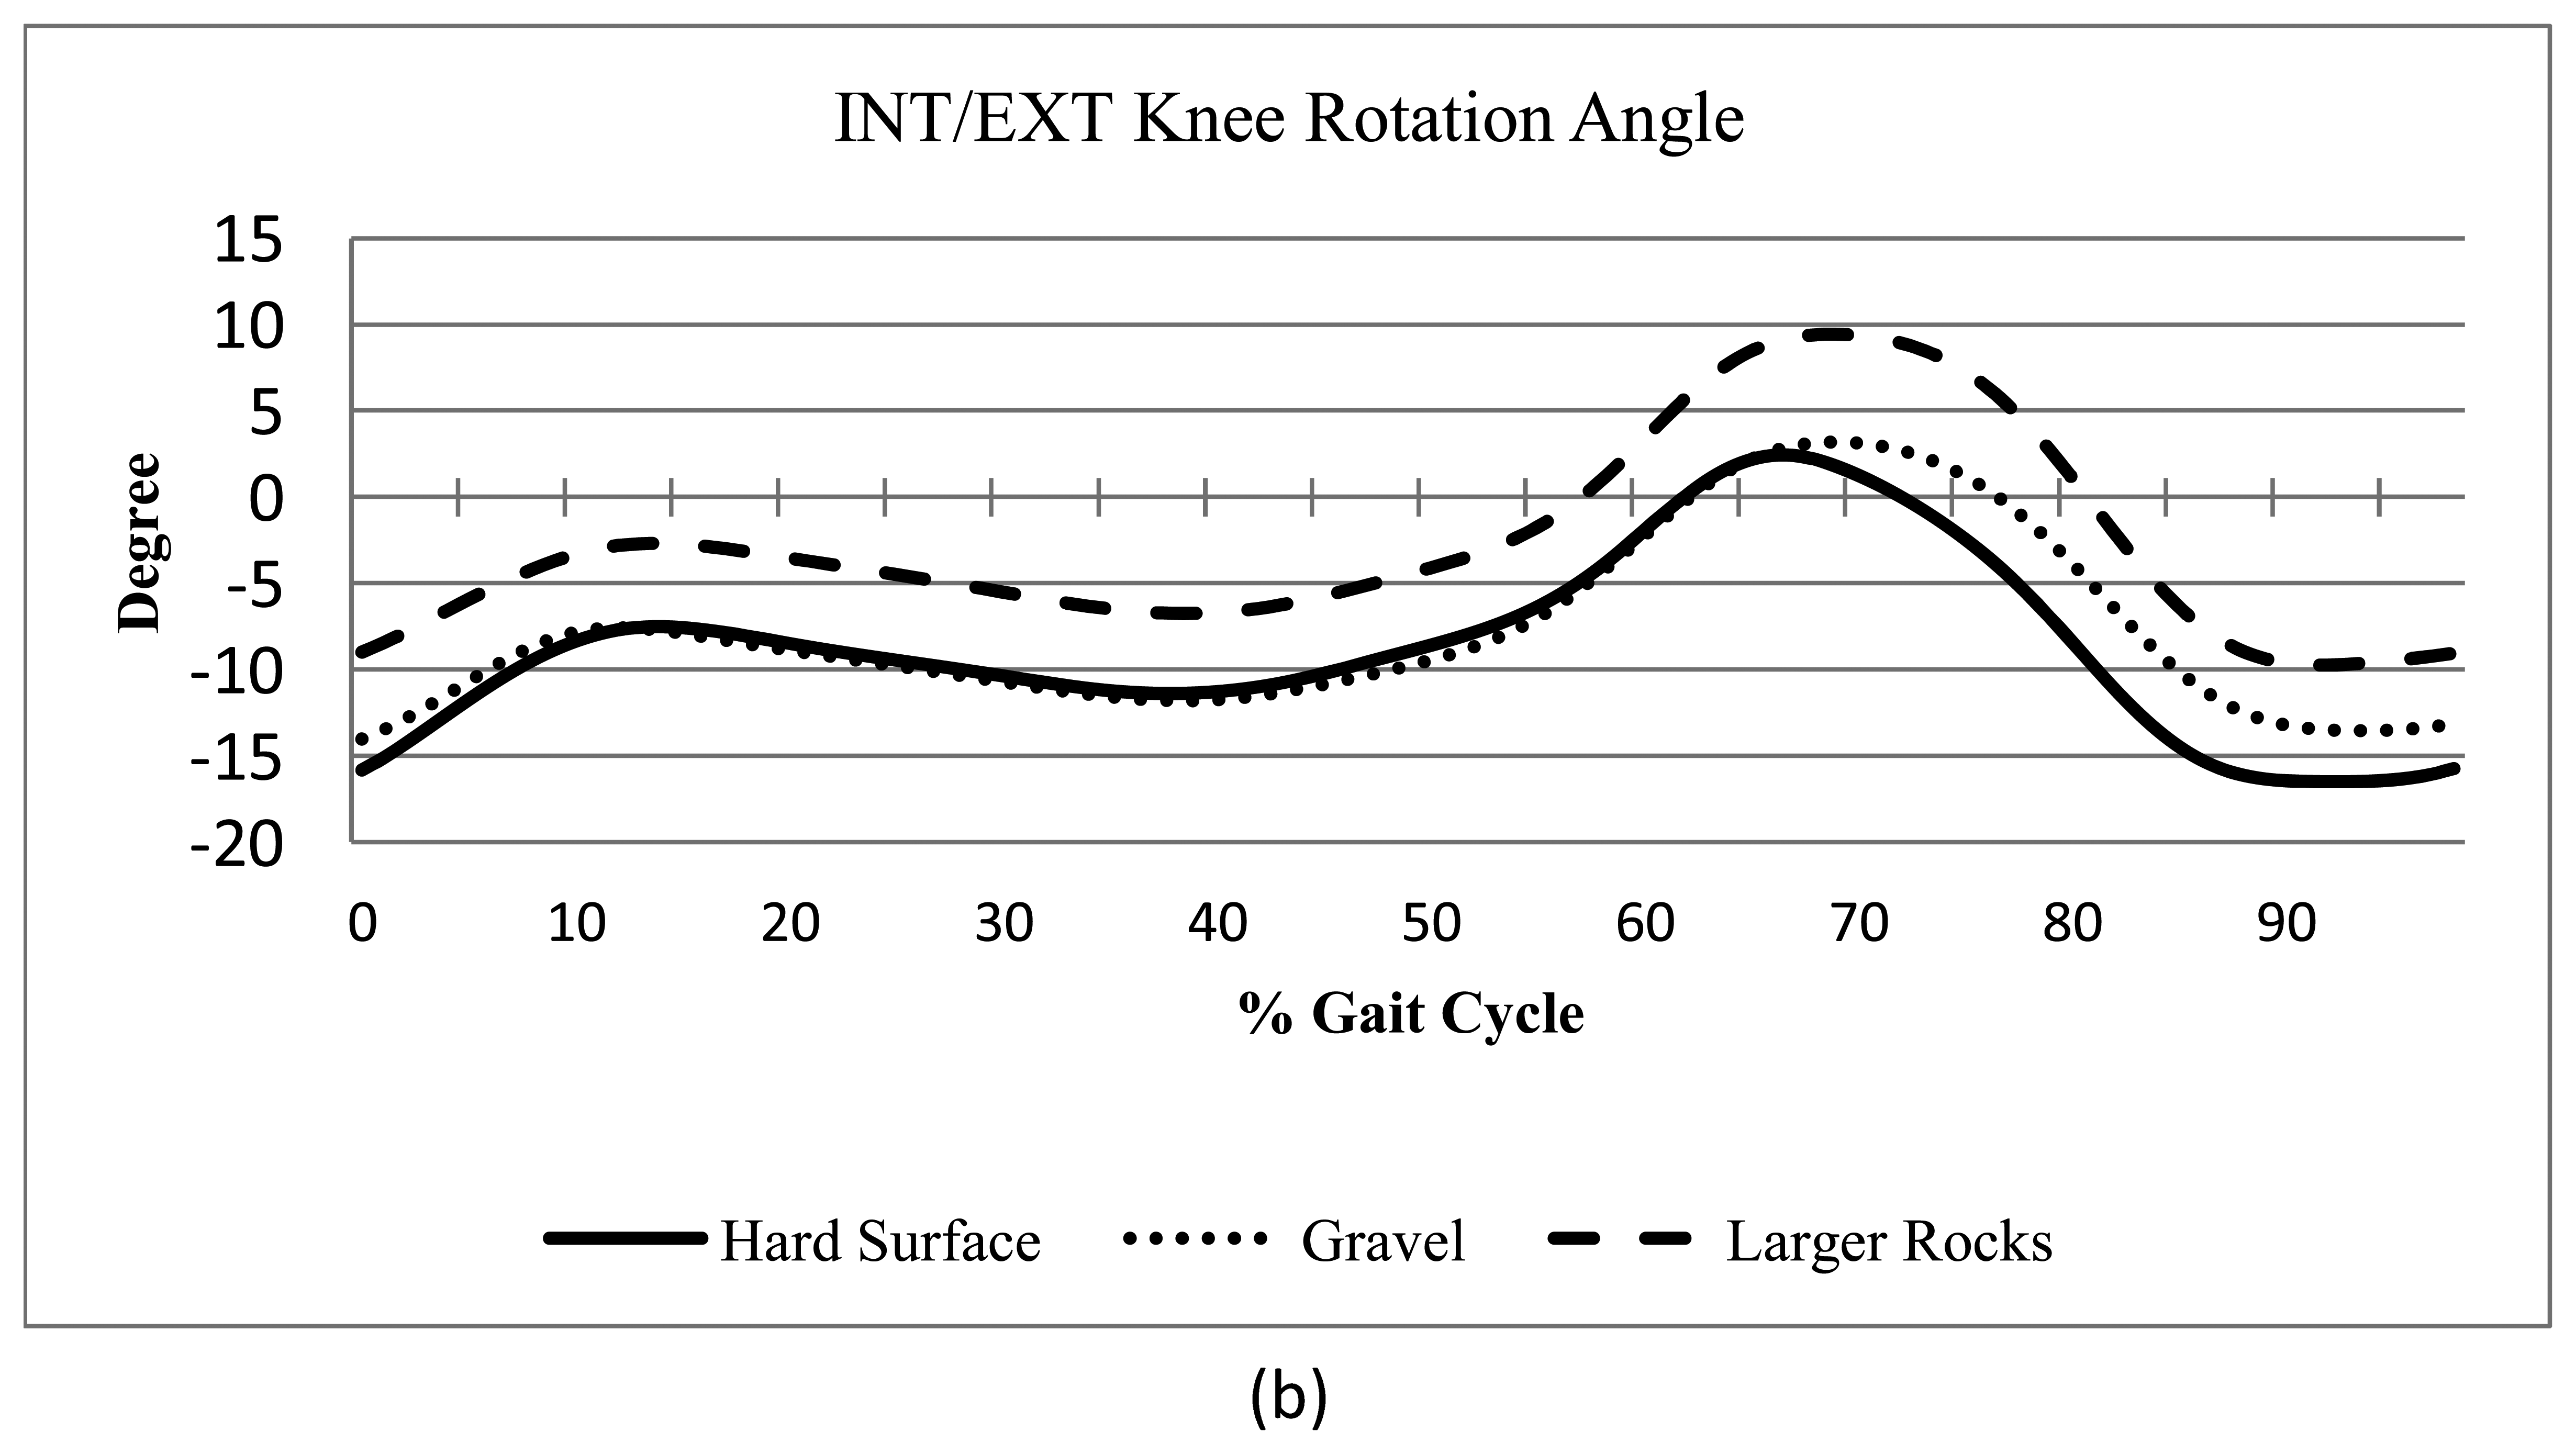
Lower limb kinematics in the transverse plane, were significantly altered by surface condition. Walking posture became slightly more crouched, as defined by the increase in knee flexion, with a wider stance, and increase in knee external rotation was observed (Figure 4(a)). Posture in the frontal plane was not as affected by type of irregular surface as seen in Figure 4(b). Larger rocks significantly increased knee external rotation over gravel (p < 0.0001), corresponding with an increase in step width. These differences compared by slope were not significantly different (p = 0.388). The INT/EXT knee angles were significantly different between uphill and downhill limbs (p < 0.0001). Knee flexion angle was greatest on gravel.
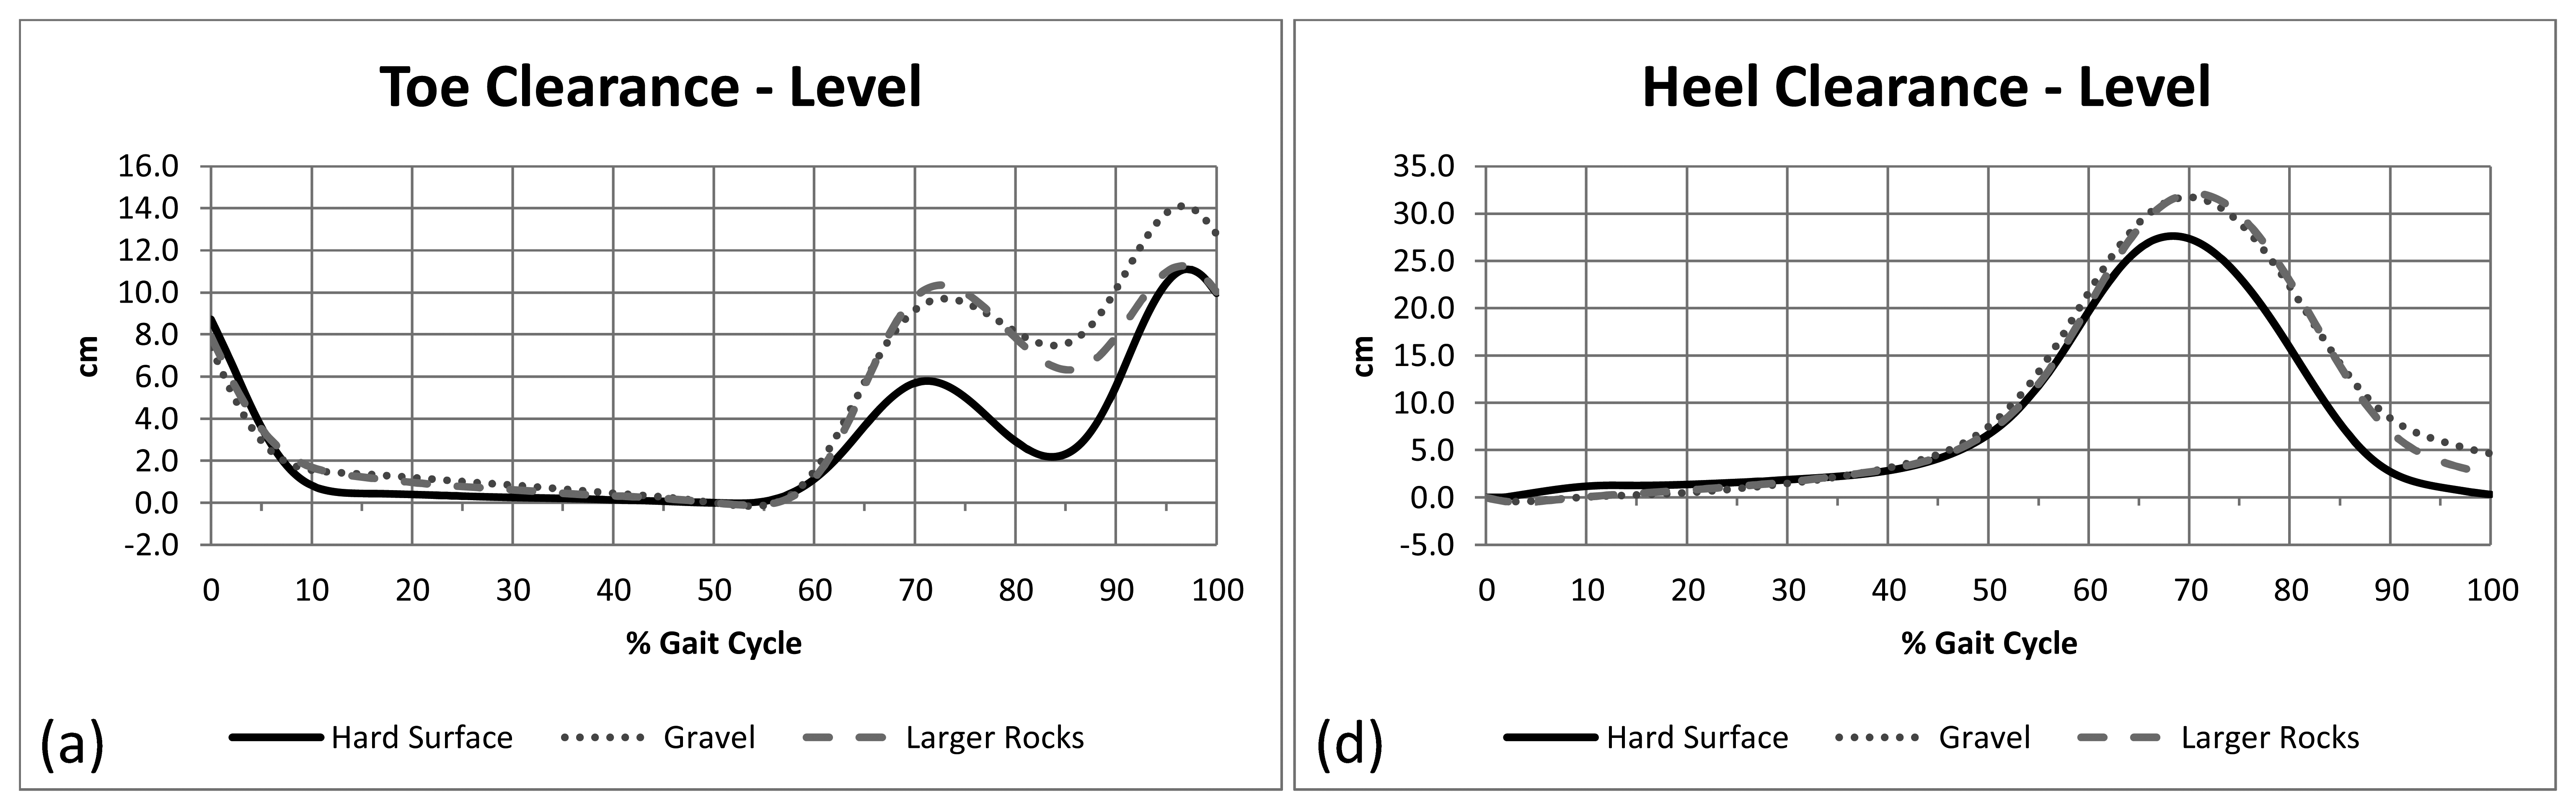
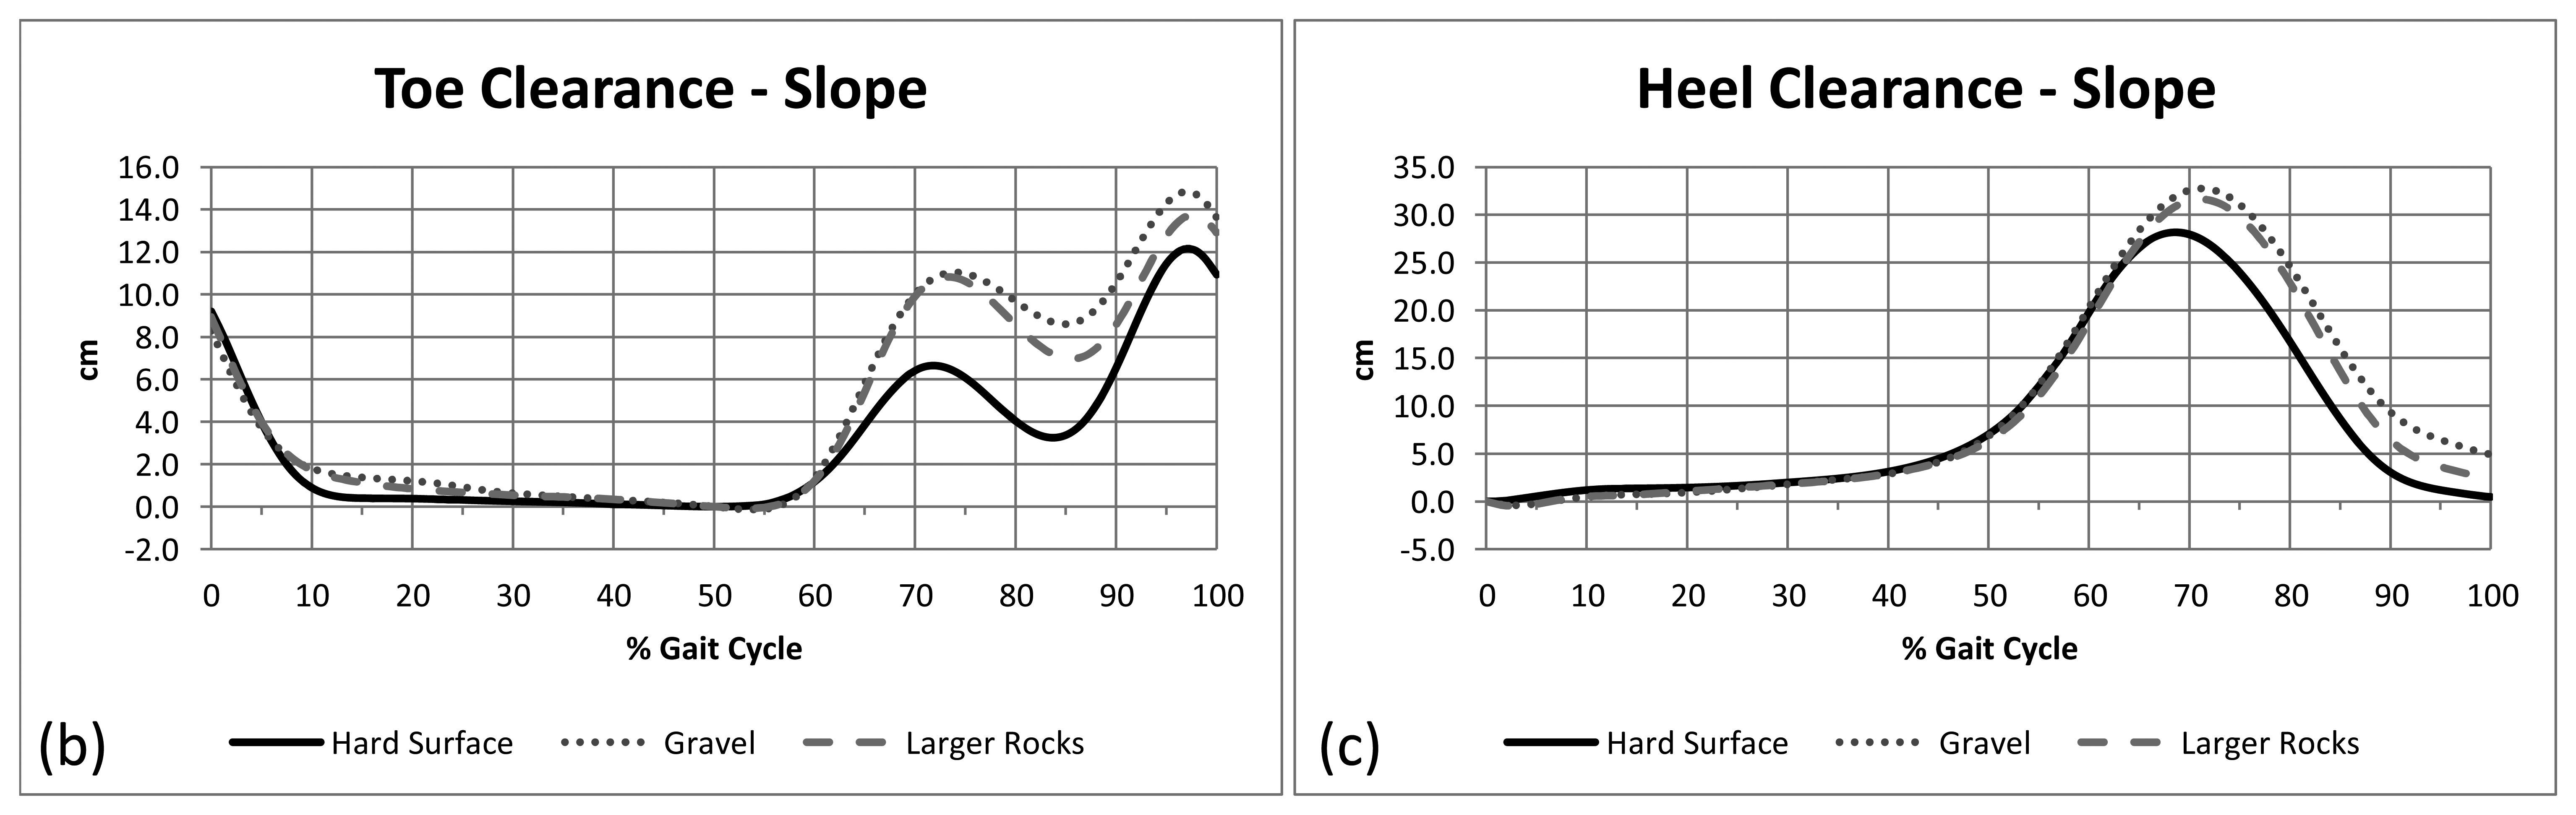
The mean (±s.d.) surface irregularity of 6.8 cm (±2.3) for larger rocks was significantly greater (p < 0.001) than the mean irregularity for gravel of 4.9 cm (±1.1). A summary of mean and standard deviation values for all surfaces by slope is presented in Table 2, where the arithmetic mean over the duration of the gait cycle was computed. There was a significant difference between surfaces and toe clearance for both level and sloped configurations (p < 0.0001). Mean toe clearance (Figure 5(a,b)) was significantly different by surface condition (p < 0.001). Further investigation with post-hoc analyses confirmed that there were differences between all surfaces, when controlling for slope, except for right toe clearance on the sloped surface, where larger rocks and hard surface were similar (p = 0.957), but different from gravel (p < 0.001). No differences were found between surfaces for right heel clearance (level: p = 0.316, slope: p = 0.512) or left heel clearance (level: p = 0.073, slope: p = 0.0117) as shown in Figure 5(c,d). The data patterns are similar for all surfaces and slopes; however notable variability is seen on the irregular surfaces, and slopes compared to the hard surface, with an increase in the relationship between heel and toe clearance by surface type.
4. Discussion
The results of this study suggest that there is a significant association with altered gait parameters and surface types and slope. Temporal parameters were similar to others, with few significant differences between surfaces and slopes (Table 1). A decreased cadence was observed for all trials compared to other published values (Table 1). This is not likely the result of the elevated walkway, as similar results were reported by Wade et al. [20] with gravel/rocks covering the floor surface at no elevation. It is possible that participants walked more cautiously because of being encumbered by the work boots. As there was no comparison made to walking on a level smooth surface without work boots, this relationship remains unclear.
A decrease in walking speed with increasing rock size was observed for level, but not slope configurations. A decrease was found from level to slope for each surface type. Similar walking speeds on sloped surfaces may indicate that the gait adaptations adopted while walking on irregular surfaces may occur more as the result of the surface type than of the slope. Additional slopes would be needed to confirm this relationship. The difference in cadence between irregular surface types was not significant, although it was observed that cadence decreased with increasing surface irregularities. It is possible that these alterations were adopted because of the participants' anticipation of instability on irregular surfaces over the hard, smooth control. Similar conclusions were made by Wade et al., 2010 [20] where increased co-contraction of stabilizing muscles in the lower extremity was observed with increasing rock size.
Walking speed has been noted as a significant factor in determining falls after a trip in older adults [29]. However, increased walking speed has been attributed to a greater ability to recover stability after a slip [30]. Differences in scientific literature on slips and trips strengthen the discussion that the causal mechanisms for trips and slips are slightly different, and should therefore be considered independently. It is clear that widely adopted gait alterations of decreased stride length, increased step width, and decreased walking speed occur when a slippery condition is anticipated [31]. However, these changes have not been previously reported on irregular surfaces, or on a transverse slope. These results suggest that similar control strategies are likely adopted on irregular surfaces as a mechanism to improve stability.
An increase in external knee rotation was seen on larger rocks more than gravel. This would likely improve stability by increasing the stance width, and may also be a mechanism to reduce knee loading by effectively reducing the external adduction moment as observed by others [20]. These gait adaptations may be compensatory mechanisms to improve lateral whole-body stability and reduce the likelihood of a trip-induced fall, or as a protective mechanism to reduce stress to the limbs while traversing irregular terrain. It has been demonstrated that individuals anticipating obstacles or changes in walking surfaces alter their gait [32,33]. These alterations have been observed in populations where fear of falling is present, or previous experience on a similar surface exists. The participants in our study were all experienced with working on irregular surfaces. Experiences in the field likely contributed to their behavior and gait adaptations, which may explain why there were fewer significant differences between surfaces compared to data reported elsewhere [20]. We did not study a comparison population of subjects unaccustomed to working on irregular surfaces to formally test this hypothesis.
Peak knee flexion angle during swing also increased while traversing irregular surfaces. Greatest peak flexion angles occurred on gravel, which was unexpected. It was hypothesized that knee flexion would increase with the increasing surface irregularities associated with the larger rocks; however, this was not directly supported by our results. A possible explanation for this is that walking on a deformable surface like gravel/rocks creates larger deviations in the vertical displacement of the center of mass. To compensate for this difference, additional elevation of the foot accomplished by increasing knee flexion would prevent premature foot contact with the surface and provide less interrupted gait on an irregular surface.
Larger rocks had the largest measured variation in surface height fluctuations as observed from the data collected using the wheeled device. Toe clearance was not greater on larger rocks, indicating the likelihood of a premature contact with the surface during swing is greater on larger rocks compared to gravel.
Few of these differences in clearance parameters from level to slope were statistically significant (Table 2). Toe clearance and variability was greatest on gravel. The result of an increase in mean toe clearance and greater knee flexion angle alone is likely to result in higher energy costs leading to fatigue. Fatigue was not directly measured in this study; however increased vertical displacement would require additional energy, therefore it seems reasonable that the energy demands of walking would also increase. Gait on sand has also been shown to increase metabolic demands [34]. These findings need support from a study specifically designed to measure fatigue while ambulating on irregular surfaces to confirm these explanations. Toe clearance was greater for both irregular surface types, but not for heel clearance. The mean surface irregularity measured for larger rocks was 6.8 cm (s.d. = 2.27 cm) and for gravel 4.9 cm (s.d. = 1.11 cm). The definition of toe and heel clearance in this study was not truly representative of actual clearance between the surface and the footwear. Further analysis of a measurement technique to measure surface irregularities in 3D, time matched with clearance data, would provide an improved description of actual foot clearances during a gait cycle as a function of surface profile irregularities. Additional probability functions and trip-likelihood ratios could be established from these data using a modification of the methods described for this study.
It has been noted by others that transverse slope walking induces little change in kinematic patterns in the transverse plane. However, adaptive gait strategies occur that change toe clearance to permit foot clearance, comfortable locomotion, and vertical balance [14,21]. Similarly, the combination of transverse slope and irregular surface type resulted in obvious gait adaptations. These changes noted by slope, were smaller than those by surface, indicating that the surface influences gait modification more than the slope. The slope tested in this study was small (7°), so the generalizability of these results to greater slopes is uncertain.
5. Conclusions
Gait adaptations were observed that would inherently modify balance by providing a greater stance width and a coping strategy to improve comfortable locomotion on a transversely sloped surface. The observation of increased toe clearance during swing may indicate increased energy demands while walking on a transverse slope compared to level. The results suggest that walking on irregular surfaces may contribute to increased fatigue and may be a contributing factor to trip-induced falls. Foot clearance demands increase while walking on irregular surfaces. To avoid premature contact between the surface and footwear, greater clearance and knee flexion angles were observed. The likelihood of a trip may increase as a result of greater surface irregularities and less margin of error between the footwear and surface. Larger rocks resulted in greater surface irregularities and less toe clearance during swing than gravel. Presumably this would result in a greater chance of a trip-induced fall. However, because of the observed gait alterations (decreased walking speed, increased external knee rotation and step width, and a more “careful” gait) the ability to recover from a trip might also improve, thereby reducing the number of trip-induced falls.
Greater surface irregularity combined with measures of ground clearance is likely related to an increased probability of a trip-induced fall, specifically if the foot during swing prematurely contacts a surface irregularity. A broader examination of fatigue and balance is warranted to investigate the effects of altered gait on varied surface terrains to support the results suggested in this study.


| Source | Cadence (Step/min) | Cycle Time (s) | Stride Length (m) | Speed (m/s) | Stance Duration* | Swing Duration* | Double Support* | Single Support* |
|---|---|---|---|---|---|---|---|---|
| Whittle 1996 | 116.5 | 1.07 | 1.55 | 1.46 | -- | -- | -- | -- |
| −(32.5) | −(0.25) | −(0.3) | −(0.36) | -- | -- | -- | -- | |
| Giannini 1994 | 102 | -- | 1.51 | 1.24 | 59 | -- | 9.4 | 41 |
| −(6) | -- | −(0.2) | −(0.25) | 2 | -- | −(2.3) | −(2) | |
| Winter 1990 | 111 | -- | 1.55 | -- | 62.3 | -- | -- | -- |
| −(8.7) | -- | −(0.103) | -- | −(1.55) | -- | -- | -- | |
| Kadaba 1990 | 112 | 1.08 | 1.41 | 1.34 | 61 | -- | 10.2 | -- |
| −(9) | −(0.08) | −(0.14) | −(0.22) | −(2.1) | -- | −(1.5) | -- | |
| Chao 1983 | 104 | -- | 1.56 | 1.27 | 59 | -- | 8.8 | 41 |
| −(5) | -- | −(0.15) | −(0.21) | −(2) | -- | −(1.9) | −(2) | |
| Wade 2010a | ||||||||
| Hard | 98.9 | -- | 1.49 | 1.22 | 61.3 | 38.7 | 20.1 | 41.2 |
| −(3.2) | -- | −(0.18) | −(0.16) | −(1.4) | −(1.4) | −(1.61) | −(2.03) | |
| Gravel | 97.1 | -- | 1.4 | 1.13 | 63.9 | 36.1 | 23.6 | 40.3 |
| −(3.8) | -- | −(0.19) | −(0.21) | −(1.9) | −(2) | −(2.13) | −(2.34) | |
| Larger Rocks | 95.3 | -- | 1.36 | 1.08 | 65.8 | 34.2 | 27.4 | 38.4 |
| −(5.6) | -- | −(0.23) | −(0.19) | −(2.6) | −(2.7) | −(1.98) | −(2.05) | |
| Current Study | ||||||||
| Hard Level | 99.2 | 1.20 | 1.53 | 1.26 | 63.1 | 36.9 | 25.0 | 38.1 |
| −(4) | −(0.05) | −(0.12) | −(0.12) | −(1.9) | −(1.9) | −(3.4) | −(2.5) | |
| Gravel Level | 96.9 | 1.24 | 1.48 | 1.19 | 62.5 | 37.5 | 24.7 | 37.9 |
| −(5.1) | −(0.07) | −(0.12) | −(0.12) | -(2.8) | −(2.8) | −(3.9) | −(2.4) | |
| Larger Rocks Level | 96.2 | 1.24 | 1.47 | 1.18 | 63.1 | 36.9 | 25.0 | 38.1 |
| −(4.7) | −(0.06) | −(0.1) | −(0.08) | −(2.36) | −(2.4) | −(3.2) | −(2.3) | |
| Hard Slope | 99.8 | 1.20 | 1.52 | 1.25 | 62.4 | 37.6 | 24.1 | 38.3 |
| −(4.3) | −(0.05) | −(0.1) | −(0.11) | −(2.2) | −(2.2) | −(2.8) | −(2) | |
| Gravel Slope | 95 | 1.27 | 1.52 | 1.19 | 62.1 | 37.9 | 24.3 | 37.8 |
| −(4.8) | −(0.07) | −(0.12) | −(0.10) | −(2.4) | −(2.4) | −(3.8) | −(2.4) | |
| Larger Rocks Slope | 94.3 | 1.27 | 1.50 | 1.19 | 61.8 | 38.2 | 23.7 | 38.1 |
| −(5.9) | −(0.08) | −(0.11) | −(0.12) | −(2.4) | −(2.4) | −(4.1) | −(3.1) | |
Note: Mean*Percentage of total Gait Cycle, may not sum to 100% due to rounding; (s.d.)aBallast Research Comparable to Current Study.
| Level | Slope | |||||
|---|---|---|---|---|---|---|
| Parameter (cm) | Hard Surface | Gravel | Larger Rocks | Hard Surface | Gravel | Larger Rocks |
| R Heel Clearance | 15.68 | 16.23 | 16.02 | 16.23 | 16.61 | 16.23 |
| (9.51) | (10.42) | (9.97) | (9.97) | (10.87) | (10.44) | |
| R Toe Clearance | 11.81 | 13.27 | 12.53 | 12.48 | 13.33 | 12.53 |
| (3.97) | (4.63) | (3.98) | (4.52) | (4.79) | (3.9) | |
| L Heel Clearance | 15.5 | 16.09 | 16.28 | 16.23 | 16.68 | 15.96 |
| (9.5) | (9.59) | (10.28) | (9.78) | (9.7) | (9.88) | |
| L Toe Clearance | 11.56 | 13.09 | 12.7 | 12.37 | 14.27 | 12.82 |
| (4.08) | (3.8) | (3.89) | (4.8) | (4.69) | (4.42) | |
Acknowledgments
This work was supported (in part) by the Rocky Mountain Center for Occupational and Environmental Health (RMCOEH) at the University of Utah. RMCOEH is an Education and Research Center supported by Training Grant No. T42/OH 008414 from the Centers for Disease Control and Prevention/National Institute for Occupational Safety and Health. The contents are solely the responsibility of the authors and do not necessarily represent the official views of the National Institute for Occupational Safety and Health. We are also very grateful for the dedicated staff and students who helped with data collection, processing, and manuscript preparation.
References
- US Bureau of Labor Statistics (BLS). Number of Nonfatal Occupational Injuries and Illnesses Involving Days Away from Work by Selected Worker and Case Characteristics and Event or Exposure, All US, Private Industry, 2005–2008—Fall on Same Level (Occupational Injuries/Illnesses and Fatal Injuries Profiles); US Department of Labor: Washington, DC, USA, 2009. [Google Scholar]
- Coleman, P.J.; Brune, J.; Martini, L. Characteristics of the top five most frequent injuries in United States mining operations, 2003–2007. Trans. Soc. Min. Metal. Explor. 2010, 326, 61–70. [Google Scholar]
- Department of Health and Human Services (NIOSH). Coal Contractor Mining Facts—2006; CDC, DHHS(NIOSH) Publication: Washington, DC, USA, 2008; pp. 2008–164. [Google Scholar]
- Department of Health and Human Services (NIOSH). Noncoal Contractor Mining Facts—2005; CDC DHHS (NIOSH) Publication: Washington, DC, USA, 2008; pp. 2008–156. [Google Scholar]
- Department of Health and Human Services (NIOSH). Sand & Gravel Operator Mining Facts—2007; CDC DHHS (NIOSH) Publication: Washington, DC, USA, 2009; pp. 2009–163. [Google Scholar]
- Esterhuizen, G.S.; Gurtunca, R.G. Coal mine safety achievements in the USA and the contribution of NIOSH research. South Afr. Inst. Min. Metal. 2006, 106, 813–820. [Google Scholar]
- Barrett, R.S.; Mills, P.M.; Begg, R.K. A systematic review of the effect of ageing and falls history on minimum foot clearance characteristics during level walking. Gait Posture 2010, 32, 429–435. [Google Scholar]
- Begg, R.; Best, R.; Dell'Oro, L.; Taylor, S. Minimum foot clearance during walking: Strategies for the minimisation of trip-related falls. Gait Posture 2007, 25, 191–198. [Google Scholar]
- Eng, J.J.; Winter, D.A.; Patla, A.E. Strategies for recovery from a trip in early and late swing during human walking. Exp. Brain Res. 1994, 102, 339–349. [Google Scholar]
- Pijnappels, M.; Bobbert, M.F.; van Dieen, J.H. Changes in walking pattern caused by the possibility of a tripping reaction. Gait Posture 2001, 14, 11–18. [Google Scholar]
- Schulz, B.W.; Lloyd, J.D.; Lee, W.E. The effects of everyday concurrent tasks on overground minimum toe clearance and gait parameters. Gait Posture 2010, 32, 18–22. [Google Scholar]
- Van der Burg, J.C.; Pijnappels, M.; van Dieen, J.H. Out-of-plane trunk movements and trunk muscle activity after a trip during walking. Exp. Brain Res. 2005, 165, 407–412. [Google Scholar]
- Andres, R.O.; Holt, K.G.; Kubo, M. Impact of railroad ballast type on frontal plane ankle kinematics during walking. Appl. Ergon. 2005, 36, 529–534. [Google Scholar]
- Damavandi, M.; Dixon, P.C.; Pearsall, D.J. Kinematic adaptations of the hindfoot, forefoot, and hallux during cross-slope walking. Gait Posture 2010, 32, 411–415. [Google Scholar]
- Dixon, P.C.; Pearsall, D.J. Gait dynamics on a cross-slope walking surface. J. Appl. Biomech. 2010, 26, 17–25. [Google Scholar]
- Tinetti, M.E.; Speechley, M.; Ginter, S.F. Risk factors for falls among elderly persons living in the community. N. Engl. J. Med. 1988, 319, 1701–1707. [Google Scholar]
- Khandoker, A.H.; Taylor, S.B.; Karmakar, C.K.; Begg, R.K.; Palaniswami, M. Investigating scale invariant dynamics in minimum toe clearance variability of the young and elderly during treadmill walking. IEEE Trans. Neural Syst. Rehabil. Eng. 2008, 16, 380–389. [Google Scholar]
- Mills, P.M.; Barrett, R.S.; Morrison, S. Toe clearance variability during walking in young and elderly men. Gait Posture 2008, 28, 101–107. [Google Scholar]
- Merryweather, A. Lower Limb Biomechanics of Walking on Slanted and Level Railroad Ballast.; Unpublished Dissertation, University of Utah: Salt Lake, UT, USA, 2008. [Google Scholar]
- Wade, C.; Redfern, M.S. Ground reaction forces during human locomotion on railroad ballast. J. Appl. Biomech. 2007, 23, 322–329. [Google Scholar]
- Wade, C.; Redfern, M.S.; Andres, R.O.; Breloff, S.P. Joint kinetics and muscle activity while walking on ballast. Hum. Factors 2010, 52, 560–573. [Google Scholar]
- Vaughan, C.L.; Davis, C.; O'Conner, J. Dynamics of Human Gait, 2nd ed.; Vaughan Publisher: Rockville, MD, USA, 1999. [Google Scholar]
- Chao, E.Y.; Laughman, R.K.; Schneider, E.; Stauffer, R.N. Normative data of knee joint motion and ground reaction forces in adult level walking. J. Biomech. 1983, 16, 219–233. [Google Scholar]
- Giannini, S.; Catani, F.; Benedetti, M.G.; Leardini, A. Gait Analysis Methodologies and Clinical Applications; IOS Press: Amsterdam, The Netherlands, 1994. [Google Scholar]
- Kadaba, M.P.; Ramakrishnan, H.K.; Wootten, M.E.; Gainey, J.; Gorton, G.; Cochran, G.V. Repeatability of kinematic, kinetic, and electromyographic data in normal adult gait. J. Orthop. Res. 1989, 7, 849–860. [Google Scholar]
- Kadaba, M.P.; Ramakrishnan, H.K.; Wootten, M.E. Measurement of lower extremity kinematics during level walking. J. Orthop. Res. 1990, 8, 383–392. [Google Scholar]
- Whittle, M.W. Gait Analysis an Introduction, 2nd ed.; Reed Educational and Profesional Publishing Ltd: Oxford, UK, 1996. [Google Scholar]
- Winter, D.A.; Patla, A.E.; Frank, J.S.; Walt, S.E. Biomechanical walking pattern changes in the fit and healthy elderly. Phys. Ther. 1990, 70, 340–347. [Google Scholar]
- Pavol, M.J.; Owings, T.M.; Foley, K.T.; Grabiner, M.D. Mechanisms leading to a fall from an induced trip in healthy older adults. J. Gerontol. A Biol. Sci. Med. Sci. 2001, 56, M428–M437. [Google Scholar]
- Bhatt, T.; Wening, J.D.; Pai, Y.C. Influence of gait speed on stability: Recovery from anterior slips and compensatory stepping. Gait Posture 2005, 21, 146–156. [Google Scholar]
- Fong, D.T.; Hong, Y.; Li, J.X. Lower-extremity gait kinematics on slippery surfaces in construction worksites. Med. Sci. Sports Exerc. 2005, 37, 447–454. [Google Scholar]
- Cham, R.; Redfern, M.S. Changes in gait when anticipating slippery floors. Gait Posture 2002, 15, 159–171. [Google Scholar]
- Heiden, T.L.; Sanderson, D.J.; Inglis, J.T.; Siegmund, G.P. Adaptations to normal human gait on potentially slippery surfaces: The effects of awareness and prior slip experience. Gait Posture 2006, 24, 237–246. [Google Scholar]
- Zamparo, P.; Perini, R.; Orizio, C.; Sacher, M.; Ferretti, G. The energy cost of walking or running on sand. Eur. J. Appl. Physiol. Occup. Physiol. 1992, 65, 183–187. [Google Scholar]
© 2011 by the authors; licensee MDPI, Basel, Switzerland. This article is an open access article distributed under the terms and conditions of the Creative Commons Attribution license (http://creativecommons.org/licenses/by/3.0/).
Share and Cite
Merryweather, A.; Yoo, B.; Bloswick, D. Gait Characteristics Associated with Trip-Induced Falls on Level and Sloped Irregular Surfaces. Minerals 2011, 1, 109-121. https://doi.org/10.3390/min1010109
Merryweather A, Yoo B, Bloswick D. Gait Characteristics Associated with Trip-Induced Falls on Level and Sloped Irregular Surfaces. Minerals. 2011; 1(1):109-121. https://doi.org/10.3390/min1010109
Chicago/Turabian StyleMerryweather, Andrew, Byungju Yoo, and Donald Bloswick. 2011. "Gait Characteristics Associated with Trip-Induced Falls on Level and Sloped Irregular Surfaces" Minerals 1, no. 1: 109-121. https://doi.org/10.3390/min1010109