Thermal Disturbances in Permafrost Due to Open Pit Mining and Tailings Impoundment


1
Department of Civil Engineering, University of Calgary, Calgary, AB T2N 1N4, Canada
2
Canadian Nuclear Safety Commission, Ottawa, ON K1P 5S9, Canada
*
Author to whom correspondence should be addressed.
Minerals 2020, 10(1), 35; https://doi.org/10.3390/min10010035
Submission received: 3 December 2019
/
Accepted: 21 December 2019
/
Published: 30 December 2019
(This article belongs to the Special Issue Nuclear Waste Disposal)
Abstract
:The paper is concerned with thermal disturbances in continuous permafrost due to open pit mining and tailings impoundment in the cold regions of Northern Canada. Numerical simulations were conducted to investigate issues of thermal regime changes and permafrost degradation in both the short term and the long term in connection with the proposed Kiggavik project in Nunavut, Canada. The results of numerical simulations indicate that no open talik would form below the East Zone and Center Zone pits during the estimated mining and milling operation period of 14 years, although a thin thawed zone would develop surrounding the open pits. For the Main Zone pit where the excavation would break through permafrost, the open talik remains following an extended operation period of 25 years with a 5 to 30 m thawed zone along the pit side walls. In the long term, with a plausible climate change scenario of 5 °C increase in the mean annual ground surface temperature during the next 100 years, the permafrost surrounding the in-pit tailings management facilities (TMFs) would reduce greatly in about 500 years. However, an approximately 40 m thick permafrost layer would remain on the top of the TMFs, which is impervious and would prevent any tailings pore water from migrating upward to reach the ground surface.
1. Introduction
The presence of permafrost and its susceptibility to naturally freeze and thaw under changes in the environment, whether natural (climate change) or anthropogenic (engineering activities), is one of the major concerns in cold regions such as Northern Canada. Perennially frozen ground underlies nearly 50% of Canada’s land surface [1], which greatly complicates engineering activities in cold regions.
Climate variations or human activities can cause permafrost to warm and thaw, and the ground may become unstable. A talik is an unfrozen zone within permafrost [2,3,4], and taliks occur beneath waterbodies. Depending on the size of the lake, the talik may be open or closed. Taliks may cause thaw settlement and further permafrost degradation, decreasing the ability of permafrost to support a load and seriously affecting the performance of structures constructed in permafrost regions [5].
Permafrost presents a challenge to mining in the north. The excavation of open pits and subsequent backfilling with tailings and water can result in warming and thawing of the underlying permafrost. Permafrost degradation complicates mining activities, as talik formation may lead to the development of potential groundwater pathways, allowing the transport of contaminants to other water bodies. The mechanisms of talik formation are somewhat well-known, but its proper numerical analysis depends on the accuracy of the initial underground temperature profile, the thermal boundary conditions, the surface temperature changes characterizing the ground disturbance and climate change, the water depth, and the configuration of permafrost beneath the lake. While approximate analytical solutions for determining the depth of a talik formed below a lake as a function of size and geometry are given by Burn [4], numerical simulations of talik development beneath lakes and other water bodies, and permafrost evolution are attributed to the work of many studies [6,7,8,9,10,11,12,13,14,15,16,17,18,19], which provide insights into the long-term evolution of the ground thermal regime.
This paper presents a case study analyzing both the short-term and the long-term impacts of mining activities and tailings management with the consideration of climate change on the underlying permafrost at a proposed uranium mine, the Kiggavik project, in Nunavut, Canada. Based on the proposed mine plan, uranium ores will be extracted with open pits and underground excavations. Three excavated open pits at the Kiggavik site will then be converted to tailings management facilities (TMFs) to deposit mill processing tailings containing hazardous and radioactive materials, which are then decommissioned on site for the long term.
The expected prevailing contaminants in the tailings mass, both metals and radionuclides, from the proposed project include Aluminum (Al), Antimony (Sb), Arsenic (As), Cadmium (Cd), Cobalt (Co), Copper (Cu), Lead (Pb), Manganese (Mn), Molybdenum (Mo), Nickel (Ni), Polonium (Po), Radium (Ra), Selenium (Se), Strontium (Sr), Thorium (Th), Uranium (U), Vanadium (V), and Zinc (Zn). The benefit of constructing a liner to minimize the release of contaminants from the tailings mass was evaluated as part of the initial tailings management facility design by the proponent [20]. The liner alternatives considered include a full pit liner with materials including synthetic flexible membrane liner (FML) such as polyvinyl chloride, polyethylene, and butyl rubber; admixed materials such as asphalt, concrete, and soil asphalt; compacted native materials such as till and crushed sandstone; native soil/rock material potentially amended with bentonite; and no liner. The computer modeling conducted by the proponent indicating that a full liner, if constructed with a very low permeability, similar to tailings mass, would be slightly more effective than a no liner design in minimizing diffusive contaminant flux to the surroundings. However, maintaining proper construction quality assurance and quality control for a low permeability liner was determined to be very difficult, in a flooded pit condition, especially during winter conditions. Consequently, a full pit liner was not considered further by the proponent. Therefore, for the environmental assessment stage, the proponent considered that a pit liner will not be necessary given the low hydraulic conductivity of both the consolidated tailings and the surrounding frozen rock mass. However, it is recognized that such a liner installed on the floor of the deepest part of the Main Zone pit might be a reasonable TMF engineering option reinforcing the isolation of the tailings from the sub-permafrost aquifer. As such, an independent study was initiated by Canadian Nuclear Safety Commission (CNSC) as a nuclear regulator to understand the potential disturbance in permafrost surrounding the pits/TMFs during the open pit mining and the subsequent long-term tailings management. The results obtained from the study provide valuable independent knowledge to assess the potential long-term impact of mining and tailings management in northern environments, and specifically to the proposed Kiggavik project, should it proceed to the licensing phase under the Nuclear Safety and Control Act.
2. The Proposed Kiggavik Project
The Kiggavik project [20], located in the Kivalliq region of Nunavut, Canada, approximately 80 km west of the community of Baker Lake, is a proposed uranium ore mining and milling operation within the continuous permafrost zone of Canada, as shown in Figure 1.
The project includes the development of three open-pit mines (the Main Zone, the Center Zone, and the East Zone) at the Kiggavik site and an open-pit mine and an underground mine at the Sissons site. The Center Zone (110 m deep) and the East Zone (100 m deep) will be excavated within permafrost, while the Main Zone (235 m deep) and the open pit (275 m deep) at Sissons will penetrate the permafrost layer. The mined ore will be milled, and the tailings will be disposed of into the three open pits at the Kiggavik site. To prevent the deposited tailings in the TMFs from freezing and also avoid tailings dust generation, the mill tailings will be disposed of underneath a layer of water for the operational period.
2.1. Geology of the Kiggavik Project Area
Permafrost at the Kiggavik site extends between 210 m and 240 m below the ground surface, while permafrost at the Sissons site ranges from 260 m to 280 m below the ground surface. The overburden consists of a thin organic layer underlain by glacial till varying in thickness from less than a meter on ridges to several meters in depressions, overlying bedrock. The thickness of the active layer is variable between 1 m and 2 m, except where bedrock is found close to the surface or is outcropping. The ground ice content of permafrost soils and rocks in the project area varies between 0% and 10% based on regional scale compilation data [20]. Locally, there are likely areas of higher ice content. A high artesian pressure due to the permafrost constraint was measured at both the Kiggavik and Sissons sites, and was found to be higher than the ground surface.
Based on local geological data, regional and local major faults exist in the project area, and some faults directly cut through the open pits. The basement host rocks are composed of metasediments, and to a lesser extent, altered granite and intrusive rocks. Uranium mineralization in the Kiggavik project area is hosted mostly in altered metasedimentary rocks, and to a much lesser extent in altered granite and intrusive rocks. In the vicinity of the project, both metasedimentary and igneous rocks are composed mainly of quartz and feldspar minerals, which could lead to moderate to high thermal conductivity.
2.2. Climate Data of the Kiggavik Site
The nearest Environment Canada weather station is in Baker Lake with data collected on site since 2009. While the climate data collected from the Baker Lake weather station are used for the short-term numerical simulations, Table 1 and Table 2 present the monthly air temperatures between 2009 and 2010 collected on site [20].
2.3. The Proposed Mine and Tailings Management Plan
The mining plan has been integrated with the tailings management strategy to ensure that there is sufficient mined-out pit volume available at all times for tailings storage. The expected life of the project is influenced by the available ore reserves and the production rate. Based on the known resources and production schedule, operation activities would be complete after approximately 14 years. However, it is expected that additional resources would be found during the life of the project, and the project could operate for up to 25 years [20]. Although the numerical simulations of operation conducted in this study are based on the current tailings volume estimation, the simulation was carried out for a time period of 25 years to show its thermal regime at that time.
Table 3 shows the overall development schedule for mining and the tailings backfilling of the three open pits at the Kiggavik site. Table 4 shows the proposed excavation and backfilling steps of the three open pits, which will be considered for numerical simulations. The excavation of the East Zone pit is expected to take one year. The ore from the East Zone will be stockpiled until completion of the open pit. Once this zone has been mined out, the pit will be prepared and converted into an in-pit TMF, and the tailings are expected to be disposed of into the East Zone TMF in year 3. The excavation of the Center Zone pit would take one year, and the tailings would start to be disposed of into the pit in year 4. The excavation of the Main Zone pit is expected to take five years, and the tailings is expected to be disposed of into the pit in year 6.
Closure of the three TMFs will progress in a multi-stage operation that includes tailings consolidation, tailings water cover removal, the placement of mine waste rocks on top of the tailings mass and further consolidation, and construction of the surface engineered cover. One of the important stages during the operation and closure of all the TMFs is the tailings consolidation process. The tailings backfilling and consolidation would take place in steps, as shown in Table 4. After tailings’ consolidation under its self-weight is completed in steps, the mine waste rocks will then be placed on top of the tailings to facilitate the tailings’ consolidation and close the TMFs. This process is depicted schematically in Figure 2 and is taken into account in the numerical simulations as the time-dependent tailings consolidation changes the material properties within the TMFs.
3. Climate Change Considered for Long-Term Simulations
Based on the recent studies on climate change, various global and local scenarios are proposed for future climate conditions. In the IPCC (Intergovernmental Panel on Climate Change) assessment report [21], considering climate change studies for the region of interest, the temperature increase in the area on the east side of the Hudson Bay in Northern Canada is predicted to be between 2 and 3 °C according to the low emission scenario, and between 5 and 6 °C for the high emission scenario up to the end of the 21st century. For the purpose of this study, it is assumed that 5 °C increase in the mean annual ground surface temperature could happen up to the end of the 21st century, which represents a plausible climate change scenario for the long-term simulation. The current mean annual ground surface temperature of the site is about −6 °C based on the measurement data on site, so the mean annual ground surface temperature of the site would increase to −1 °C after about 100 years.
4. Numerical Simulation of Thermal Disturbances in Permafrost
Numerical modeling approaches were used in this study to assess thermal disturbances in continuous permafrost during open-pit mining and tailings impoundment and in the long-term with consideration of climate change. The thermal modeling captures heat transfer with phase change, and importantly, any changes in the material bulk properties are accounted for as the tailings consolidates in the long term.
4.1. Heat Transfer with Phase Change in Porous Media
Pore spaces in the frozen rocks in permafrost are filled with a mixture of frozen and unfrozen water depending on the ground temperature. Therefore, the governing equation of heat transfer should consider different material properties in addition to the possibility of phase change during the heat transfer process.
In order to derive the governing equation for heat transfer in a porous media, various physics including fluid flow through pore spaces, mass balance, and energy balance should be considered. Thus, the equation of flow in the homogenized (equivalent) medium is classically given by Darcy’s law, i.e.,
where u (m/s) is the Darcy velocity, k (m2) is the intrinsic permeability of the medium, μ (Pa.s) is the fluid viscosity, and ∇p (Pa/m) is the fluid pressure gradient.
The mass conservation equation may be written in the form of
where is the porosity and ρf (kg/m3) is the fluid density.
The average energy equation including both conductive and convective heat transfer is written for the equivalent medium to give:
where (ρC)eq (J/Km3) is the equivalent heat capacity of the material, (W/mK) is the equivalent thermal conductivity, Cpf (J/K) is the heat capacity of the fluid, and Q (J) is a heat source.
To simplify the problem, it is assumed that the flow velocity u is slow enough so that the temperatures of the solid and the adjacent fluid are equal. Moreover, according to the study conducted by Dagher et al. [22], the effects of heat transfer due to convection are negligible compared to conduction in the ground materials at the Kiggavik site. Thus, considering heat transfer only occurring by conduction, one gets:
Both an equivalent volumetric heat capacity and an equivalent thermal conductivity are herein introduced to account for the thermal effects of freezing and thawing in the presence of three phases, i.e., rock matrix, ice, and water, through the definition of volume fractions θv (v = m,w,i) referring to matrix, water, and ice, respectively, where
As such, the three-phase medium is basically characterized by , the porosity of the rock, and Θ, the fraction by volume of the pore space occupied by water, i.e., water saturation.
While the equivalent thermal conductivity and the equivalent heat capacity of permafrost materials can be calculated with method proposed by Booshehrian and Wan [23], a discontinuity in heat flux is to be expected at the interface between ice and water where complicated processes occur within the porous medium in the presence of a so-called mushy zone (i.e., a mixture of solid and liquid phases between the solidus and liquidus temperatures). As such, this is idealized through the addition of energy sources (sinks) due to freezing (thawing) involving a normalized ‘pulse’ ( around the transition temperature. The integral of must be equal to unity to satisfy the condition that the ‘pulse’ width denotes the range between the liquidus and solidus temperatures [24,25].
Figure 3 illustrates the functional shape of the equivalent heat capacity with the ‘pulse’ to accommodate for latent heat during phase change. The equivalent heat capacity is also able to describe non-isothermal phase change with variable solidification/melting temperatures. This aspect is particularly relevant to permafrost, involving very fine porous materials such as rocks with microfractures at Kiggavik where super-cooling due to capillarity may exist, i.e., Kelvin’s effect [26].
4.2. Freezing Point Depression
The interface of ice–water in a microcapillary at a stable thermodynamic condition is highly curved. The curved interface forms a contact angle with the capillary walls depending on the excess interfacial energies between the solid, liquid, and the wall [27]. The relationship between pressure, temperature, and the curvature of the interface in capillaries is described by the Kelvin equation [26]. The equation was later extended to define the change in equilibrium temperature of a curved solid–liquid interface at constant pressure, which is known as the “Gibbs–Thomson” relation [28]. According to this relation, the capillary induced freezing point depression is
where νs (m3/kg) is the specific volume of the solid phase; σLS (J/m2) is the interfacial excess energy per unit area of solid–liquid interface; L (J/kg) is the latent heat of fusion; (m−1) is the mean interface curvature; and TE (K) is the normal equilibrium temperature of the solid–liquid interface (e.g., 273.15 K for the ice–water interface).
On the other hand, the salinity concentration at the solid–liquid interface decreases the equilibrium interface temperature. This change in the freezing point is called the osmotic freezing point depression. Therefore, the freezing point of a liquid in a capillary is the summation of the capillary and the osmotic depressions:
Freezing Point Depression at the Proposed Kiggavik Project
In order to consider the impact of capillary forces on the freezing point depression of ground material, it can be assumed that the microfractures of the basement rocks at the Kiggavik site are capillary tubes with the mean radius as small as 1 μm. Therefore, considering L = 3.33 × 10⁵ J/kg; νs ≈ 0.0011 m3/kg; σLS = 3.2 × 10⁻² J/m2 [29]; and κ = 2/r, the freezing point depression due to capillary forces (ΔTcap) would be about 0.057 K.
It is assumed [20] that the composition of tailings in the Kiggavik project would be comparable to those in McClean Lake and Rabbit Lake, which are two other uranium mines in northern Saskatchewan. Hence, the impact of the salinity would be a 0.18 K reduction in the pore water freezing point, similar to the other two mining projects.
Therefore, the total freezing point depression for the pore water in the vicinity of the tailing facilities at Kiggavik would be about 0.24 K. The discontinuity in heat flux at the interface between ice and water during the face change is idealized by considering a normalized pulse. Based on the freezing point depression calculations, the pulse is defined in such a way that the center is located at −0.24 °C (272.91 K). It is also assumed that the transition between solid and liquid phases is occurring between −0.50 °C and 0 °C, as shown schematically in Figure 3.
4.3. Initial and Boundary Conditions
Based on site investigations, the initial and boundary conditions are defined as follows. During the mining, the thermal initial and boundary conditions are depicted in Figure 4. Figure 4 gives the natural ground layout with the relevant rock layers and associated thicknesses in the vicinity of the Kiggavik project. These together with the specified thermal boundary conditions are used to define the initial configuration of the finite element mesh that is two-dimensional. The finite element simulations based on heat transfer in two dimensions followed the excavation sequence, including backfilling with tailings material. Numerically, elements were removed to simulate excavation and added to represent backfilling. Various element sizes were used in the numerical simulations to minimize the errors. The maximum element size was limited to 10 m, and the maximum time step was 1 day for the simulations. The ground surface temperature is defined based on the air temperature and the ground surface n-factors. The air temperature during one year can be defined, based on the collected climate data, as a sine function as:
where the MAAT (°C) represents the mean annual air temperature, and A is the amplitude of the sine curve of the air temperature. To match the proposed sine function with the measured climate data collected during more than 30 years in the Baker Lake climate station, the MAAT was set to −12 °C and the air temperature amplitude (A) was considered as +25 °C, which resulted in air temperature variation between +13 °C and −37 °C.
The ground surface n-factors can be expressed as:
where FDDs, TDDs and FDDa, TDDa are the freezing and thawing degree-days for the surface and air, respectively [30]. Thawing degree-days (TDD) are defined as the summation of daily mean temperatures above the freezing point (0 °C) during the thawing season, and freezing degree-days (FDD) are the summation of daily mean temperatures below freezing point (0 °C) during the freezing season.
The lateral thermal condition is defined as a thermally insulated boundary (i.e., zero thermal flux). The ground below 210 m is considered unfrozen, and its temperature gradient depends on the geothermal heat flux, q, which is estimated to be 0.08 W/m2 [20].
During the tailings deposition, a water cover with an average thickness of 5 m will be maintained on top of the deposited tailings to avoid tailings from freezing and dust generation [20]. As noticed by the proponent [20], when the thickness of the water within the lakes and ponds near the project is greater than 1.5 m, the water will not freeze completely during the winter season, and the temperature of water at the bottom of those lakes remains at approximately +3 °C. This is also coincidently consistent with the observation of lake-bottom temperature in Tundra Lakes at Richards islands, western arctic coast, Canada (Burn 2002) [4]. Numerical modelings conducted by the proponent with the projected site condition also indicate that no frozen tailings would occur if 3 m of water cover is maintained during operation. Thus, the temperature at the bottom of the 5 m water cover is assumed at around 3 °C as warming tailings are disposed of into the TMFs with sub-aqueous tailings disposal method. Therefore, to model the effect of water cover, the thermal boundary condition at the top of the tailings is considered as 3 °C (Scenario 1). When the water cover is removed, the tailings in the TMFs will be exposed directly to air temperature (Scenario 2), which is considered to vary following the sine curve as represented by Equation (8).
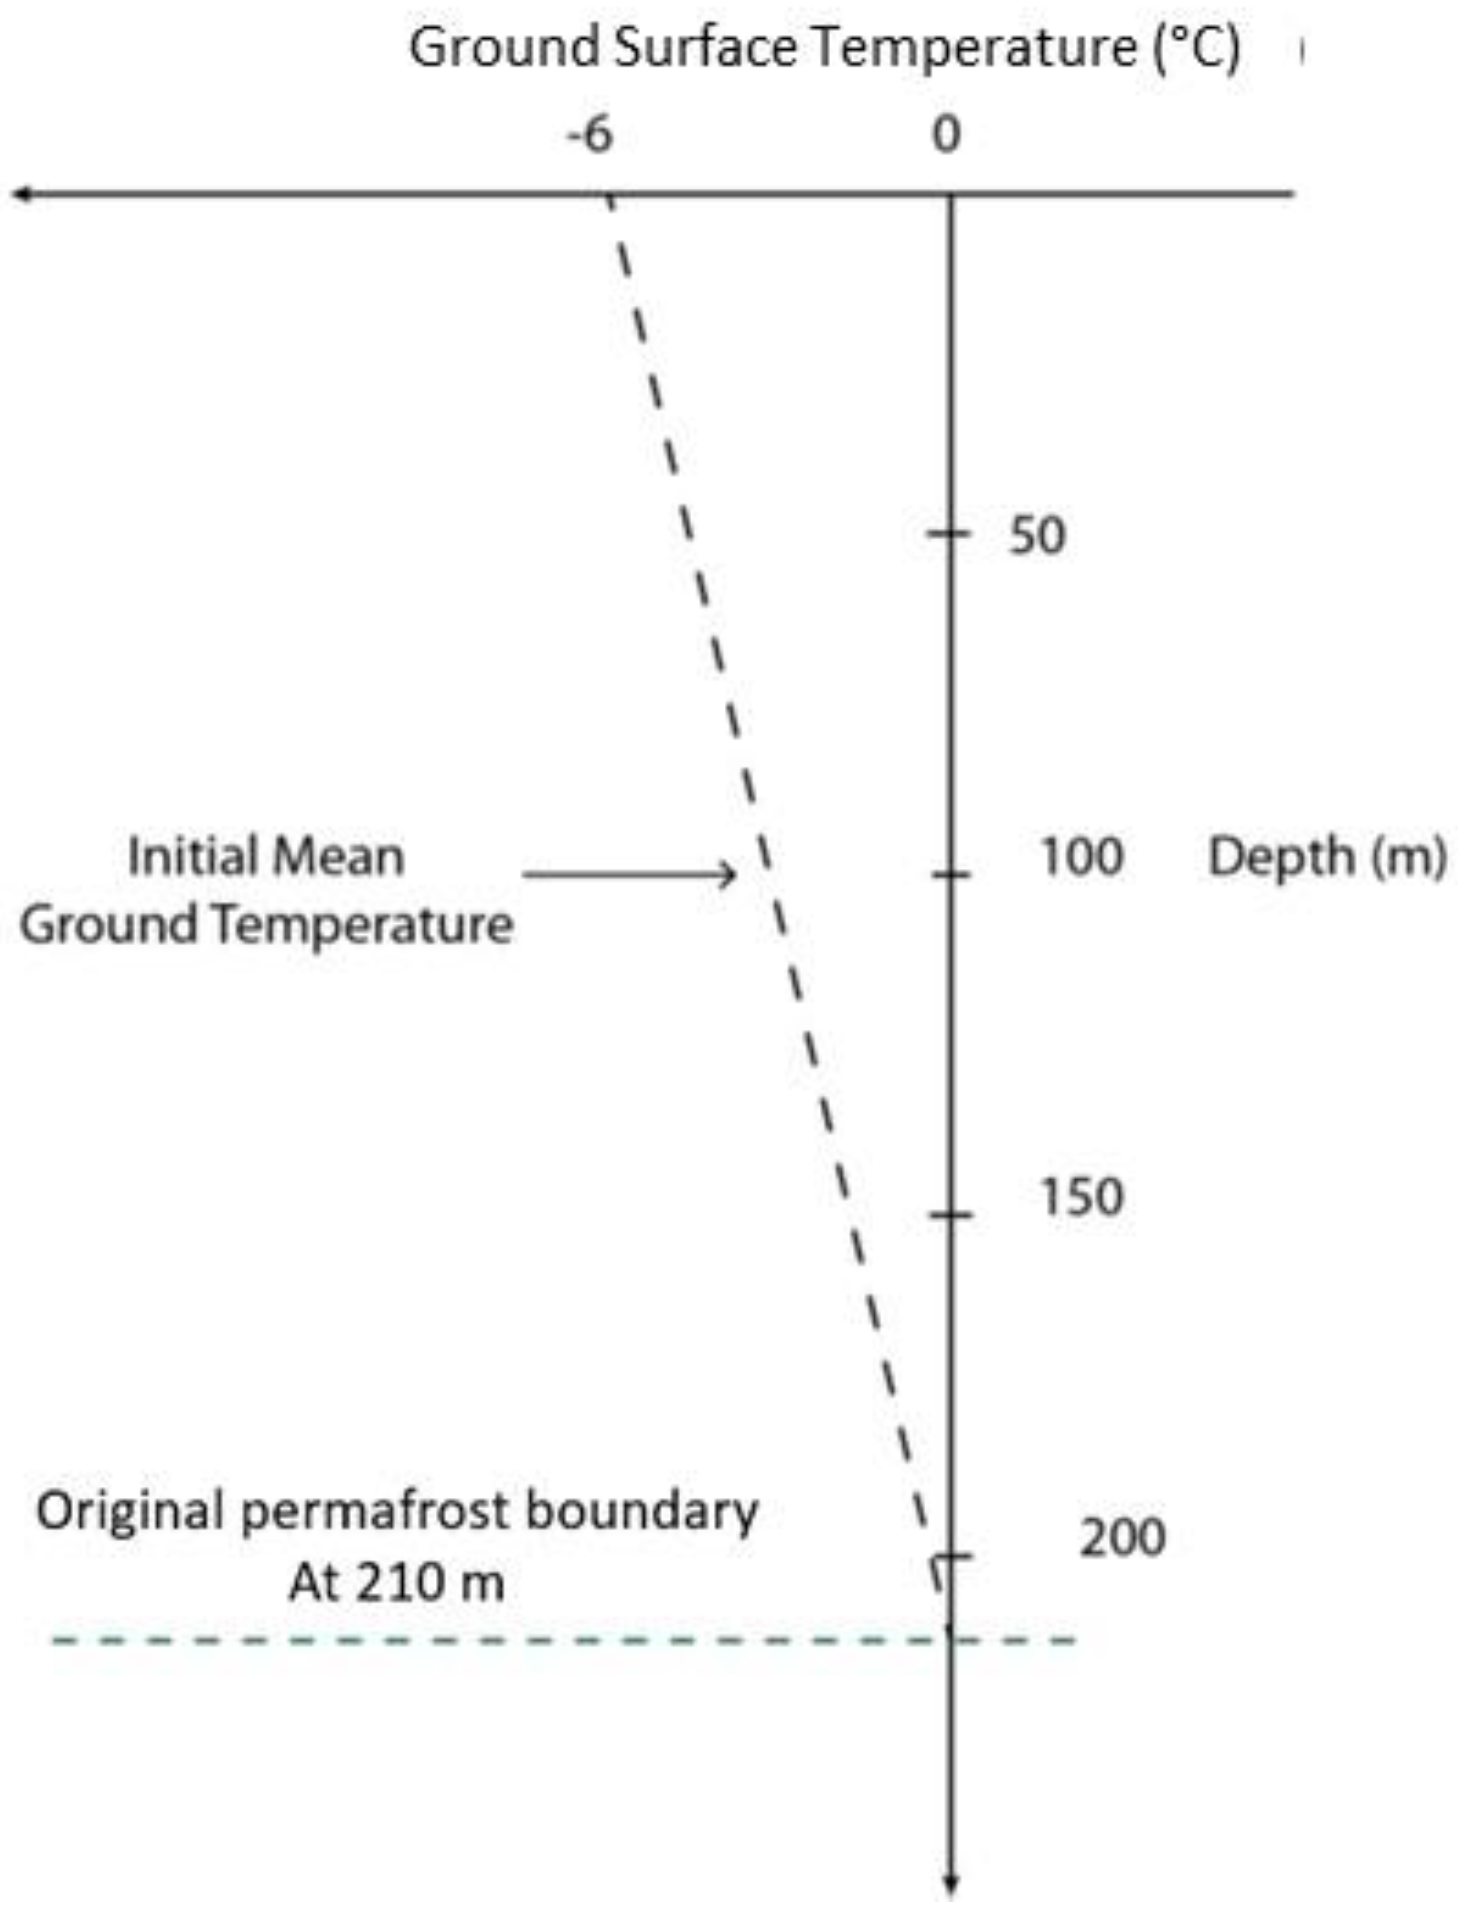
For the long-term analysis, it is assumed that temperature of the permafrost layer is increasing from the mean annual ground temperature of −6 °C at the ground surface to 0 °C at 210 m below the ground surface as shown in Figure 5, where the temperature gradient depends on the geothermal heat flux, as stated for the short-term analysis. The ground surface temperature was collected from the project site historically from 1988 to 1991, and more recent data was collected from 2007 to 2011. Temperature probes were installed 15 cm depth into tundra soil in a relatively flat area to measure the ground surface temperature. Shallow thermistor cables with multiple sensors were installed to a depth of several tens of meters in drill holes to measure shallow ground temperatures. For the climate change scenario considered, the mean annual ground surface temperature would increase 5 °C from −6 °C to −1 °C at the end of the 21st century and then remain constant in the future.
4.4. Material Properties
Material properties used for the simulation are determined based on laboratory experiments and field measurements by the proponent [20] with model calibrations or analytical calculations. The thermal properties of host rocks were measured from the cores taken from different depths of boreholes drilled at the Kiggavik Main Zone and then calibrated with ground temperature profiles at the Kiggavik Main Zone (i.e., Borehole MZ-07-03 and Borehole MZ-09-02). The thermal properties of the tailings under fully frozen and fully thawed conditions over a range of likely saturated water contents were measured by the proponent, which were used to back-calculate the likely quartz content and mineral specific heat capacity. Then, these values were applied to a range of water contents and void ratios as the tailings may have. The thermal properties of the in situ material and tailings deposited in the TMFs are presented in Table 5. The thermal properties of tailings at different consolidation stages depend on their porosities (water content) and frozen states, which can be calculated with thermal properties of the solid parts of tailings and thermal properties of ice/water content.
While the following relationships (Equations (10) and (11)) for the tailings compressibility and hydraulic conductivity were implemented in the numerical simulations, respectively, the tailings consolidation process within the tailings management facilities of the Kiggavik project would take between 12 and 25 years. Since coupling the thermal analysis with the large strain simulations resulted into numerical divergence, a staged approach was thereafter selected in the numerical simulations to circumvent the aforementioned computational difficulties. In this approach, the tailings properties (i.e., water content, heat capacity, and thermal conductivity) were updated every 5 years up to the completion of consolidation. It was assumed that the tailings properties would be constant between the updated time period of 5 years.
where e is the void ratio, σ′ is the effective stress (kPa), and K is the hydraulic conductivity (m/s).
5. Results and Discussion
Both the short-term (i.e., during operation) and the long-term evolution (i.e., post decommissioning) of the permafrost surrounding the open pits/TMFs are simulated under two-dimensional conditions using COMSOL Multiphysics (2012) software (4.3a, COMSOL Inc., Los Angeles, CA, USA) with the consideration of climate change in the long term. The simulation results are presented in the following sections.
5.1. Thermal Disturbances during the Mine and Mill Operation
For the thermal regime change and permafrost degradation surrounding the open pits/TMFs, numerical simulations have been carried out with consideration of different initial tailings temperatures (i.e., 5 °C and 10 °C) and time sequences. The analyses results indicate that the initial tailings temperature has little impact on the permafrost evolution, although the time needed to reach the freezing point is slightly longer for tailings with higher (i.e., 10 °C) initial temperatures. In other words, the ground thermal profiles with time are slightly different for the two initial tailings temperatures, but the final state of permafrost is almost the same. Figure 6 shows the thermal profile within the Main Zone TMF after 2000 years for two different initial tailing temperatures. Herein, only salient results with an initial tailings temperature of 10 °C are presented for the open pits/TMFs. By consideration of the similarity between the East Zone and the Center Zone in size, depth, and the ground thermal regime, the simulation results of the Center Zone are presented in this paper.
5.1.1. The Center Zone
Figure 7 shows the thermal regime after the excavation is completed over a period of 2.5 years. After the open pit boundaries are exposed directly to the air without any snow or vegetation cover, there are some noticeable thermal changes occurring over a thin layer. Figure 8 shows the modeling results with a 5 m water cover on the top of the tailings surface, 6 months after the first layer of tailings is placed, indicating a thawing of the permafrost near the pit/tailings interface over a thin zone of approximately 3 m.
Over the next 10 years, the thawed zone on the pit bottom increases to more than 10 m for scenarios with and without water cover (Figure 9). As stated previously, the temperature on the top surface of the tailings with water cover is assumed at 3 °C during the modeling period. When the water cover is removed, the tailings are simply exposed to air temperatures following a sine curve expressed in Equation (8), and the thermal regime is shown in Figure 9b. Figure 10 shows the evolution of the temperature profiles for a vertical section underneath the bottom of the pit at different times for both scenarios. A warming trend is observed during the post backfilling period, which spans over 10 years. However, this warming trend does not result in complete thawing of the frozen ground beneath the open pit. No open talik would be formed during a 14-year period.
5.1.2. The Main Zone
The Main Zone pit is the largest pit at the Kiggavik site, which penetrates the permafrost layer. The ground thermal condition at the end of excavation is shown in Figure 11. The thermal disturbance is observed around the vicinity of the exposed pit surface. The subsequent backfilling of the pit with tailings occurs in six steps taking 7 years approximately, as shown in Table 3. The permafrost degradation along the side walls of the pit can be observed for both scenarios with and without water cover (Figure 12). At the end of 25 years, the talik has extended laterally over a distance of approximately 30 m along the lower side walls of the pit. By that time, the vertical extension of the talik along the side walls of the pit has progressed to a length of about 150 m above the bottom of the pit.
5.2. Long-Term Thermal Disturbance with Consideration of Climate Change
As shown above, thermal changes would be imposed to the original permafrost layer surrounding the open pits/TMFs during the mining and milling operation. To specify the initial ground thermal condition close to the TMFs for the long-term analysis, the simulations started from the beginning of the operational period with an average tailings void ratio and water content at each stage.
For the climate change scenario of 5 °C increase in the mean annual ground surface temperature in 100 years, it is expected that the permafrost thickness will be reduced in the long term. However, the tailings with high water content will have different thermal properties and as such impact the thermal regime of the TMFs.
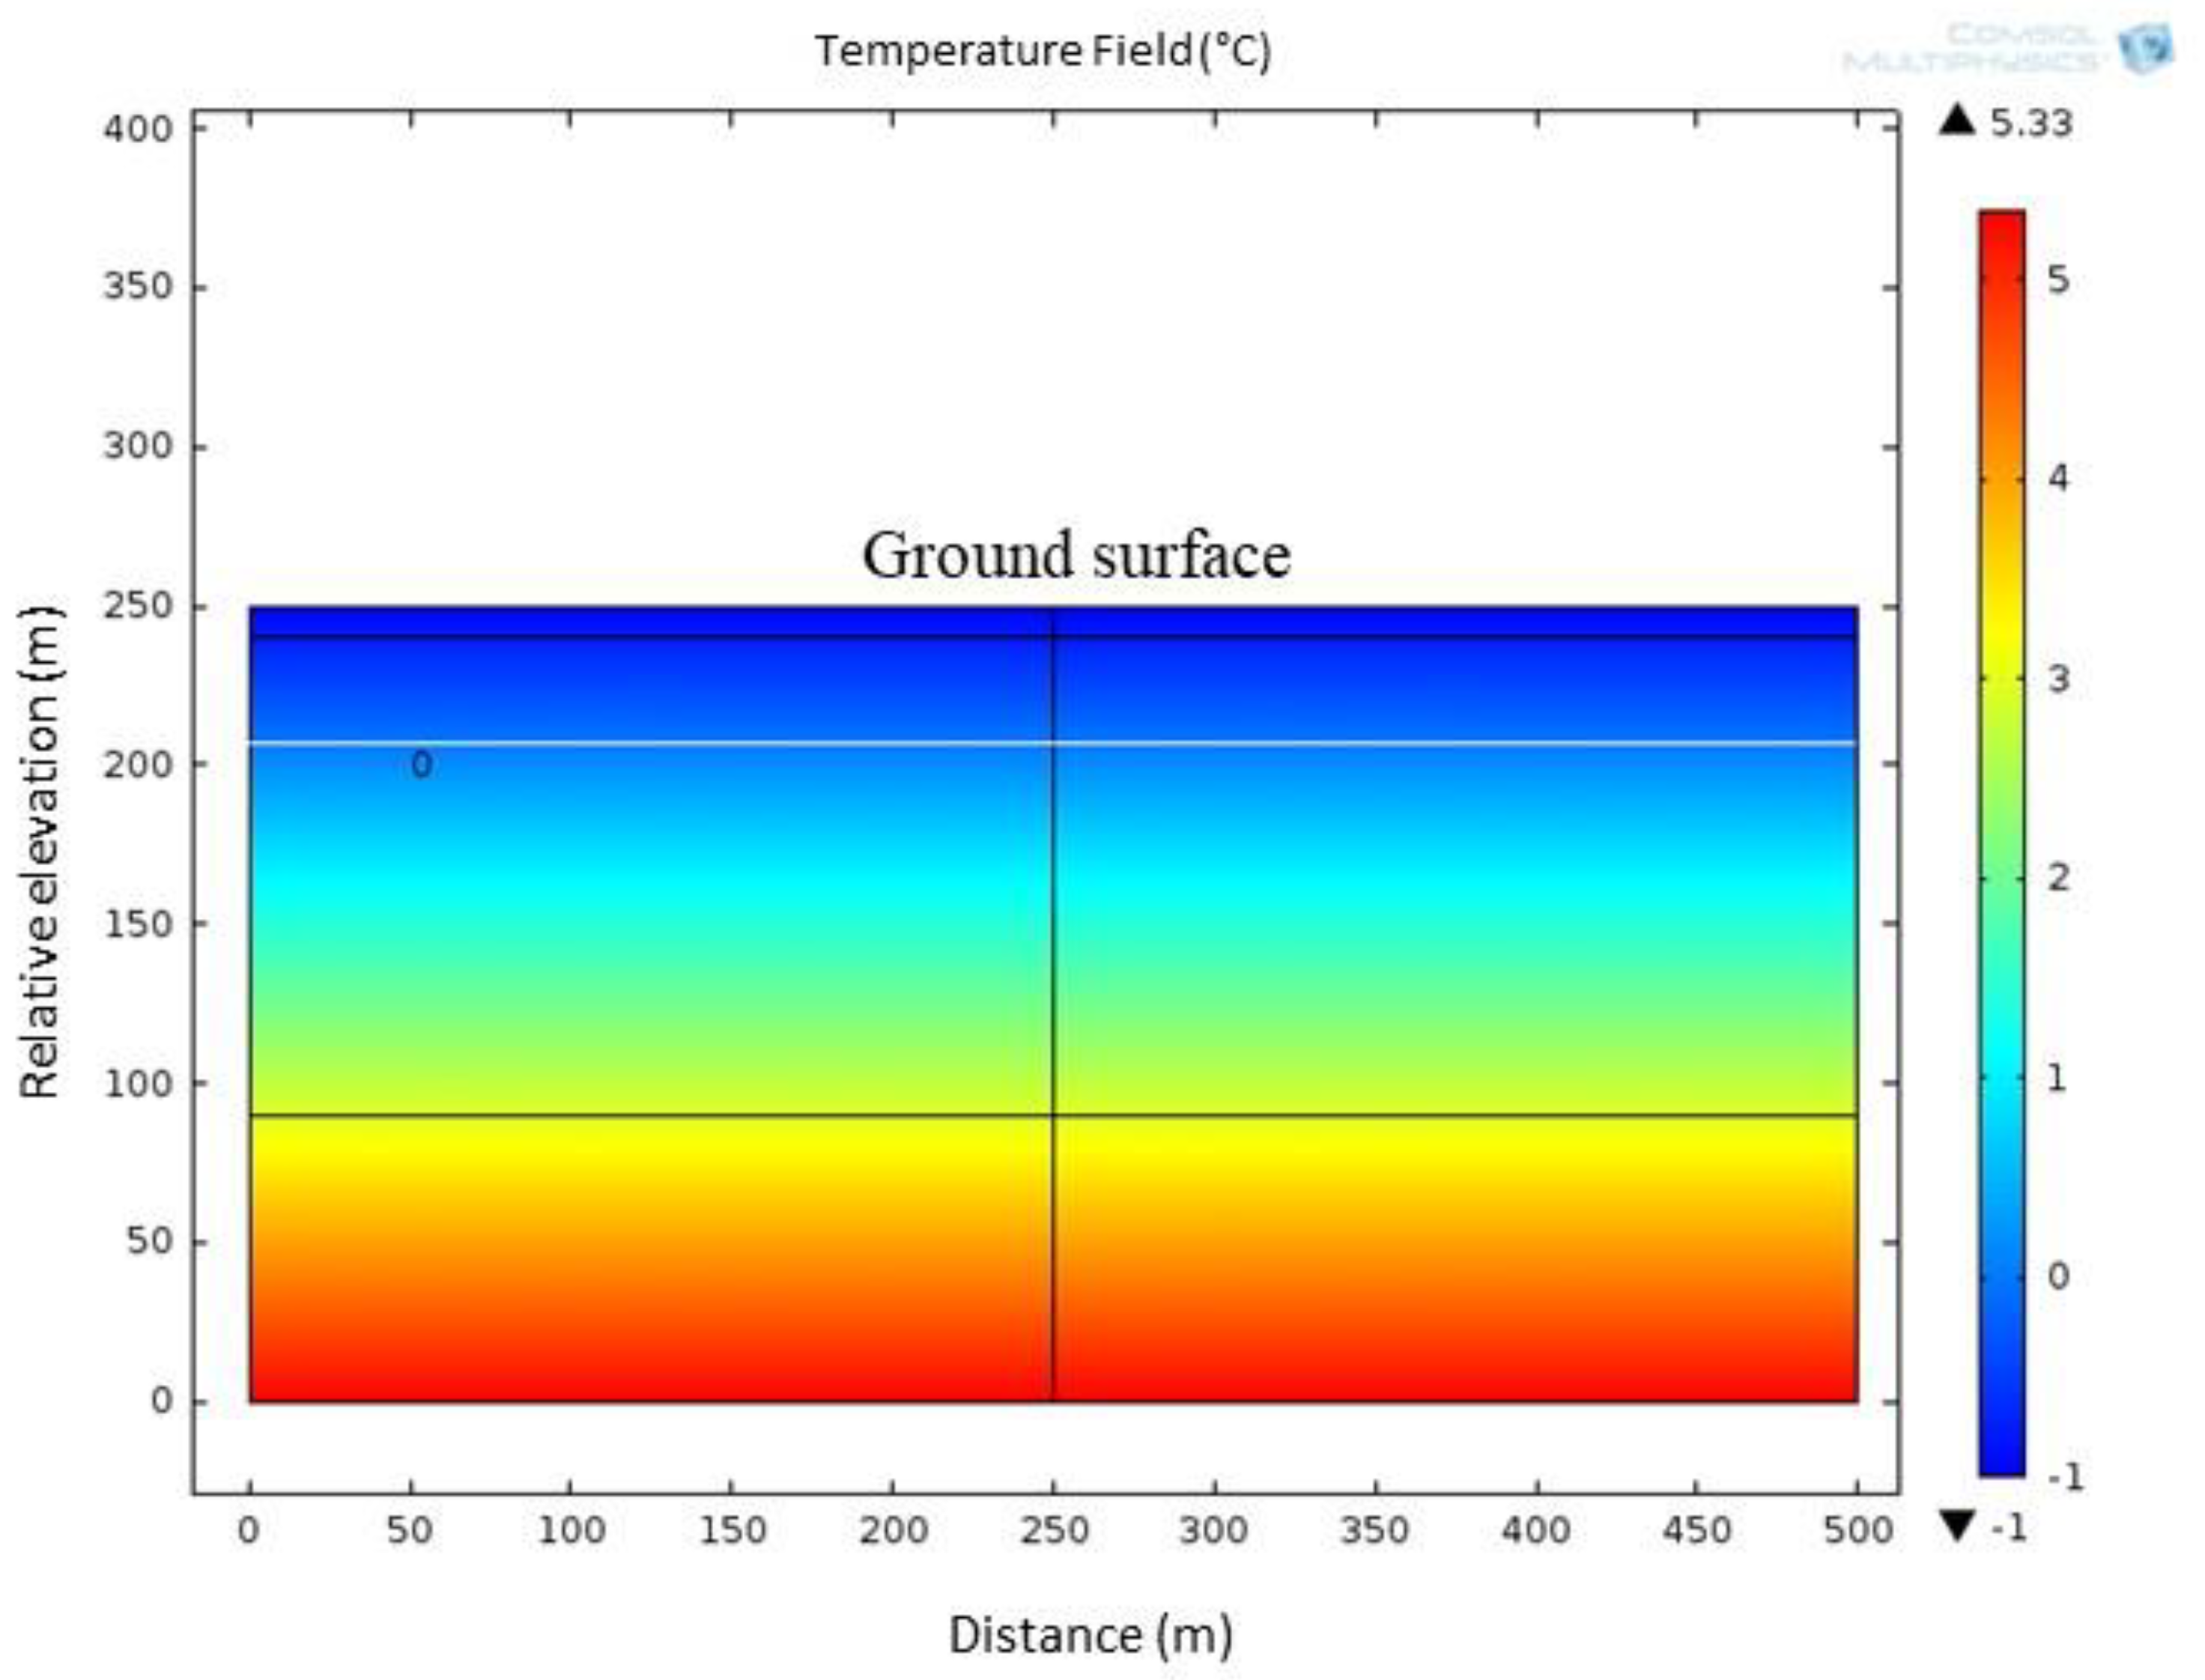
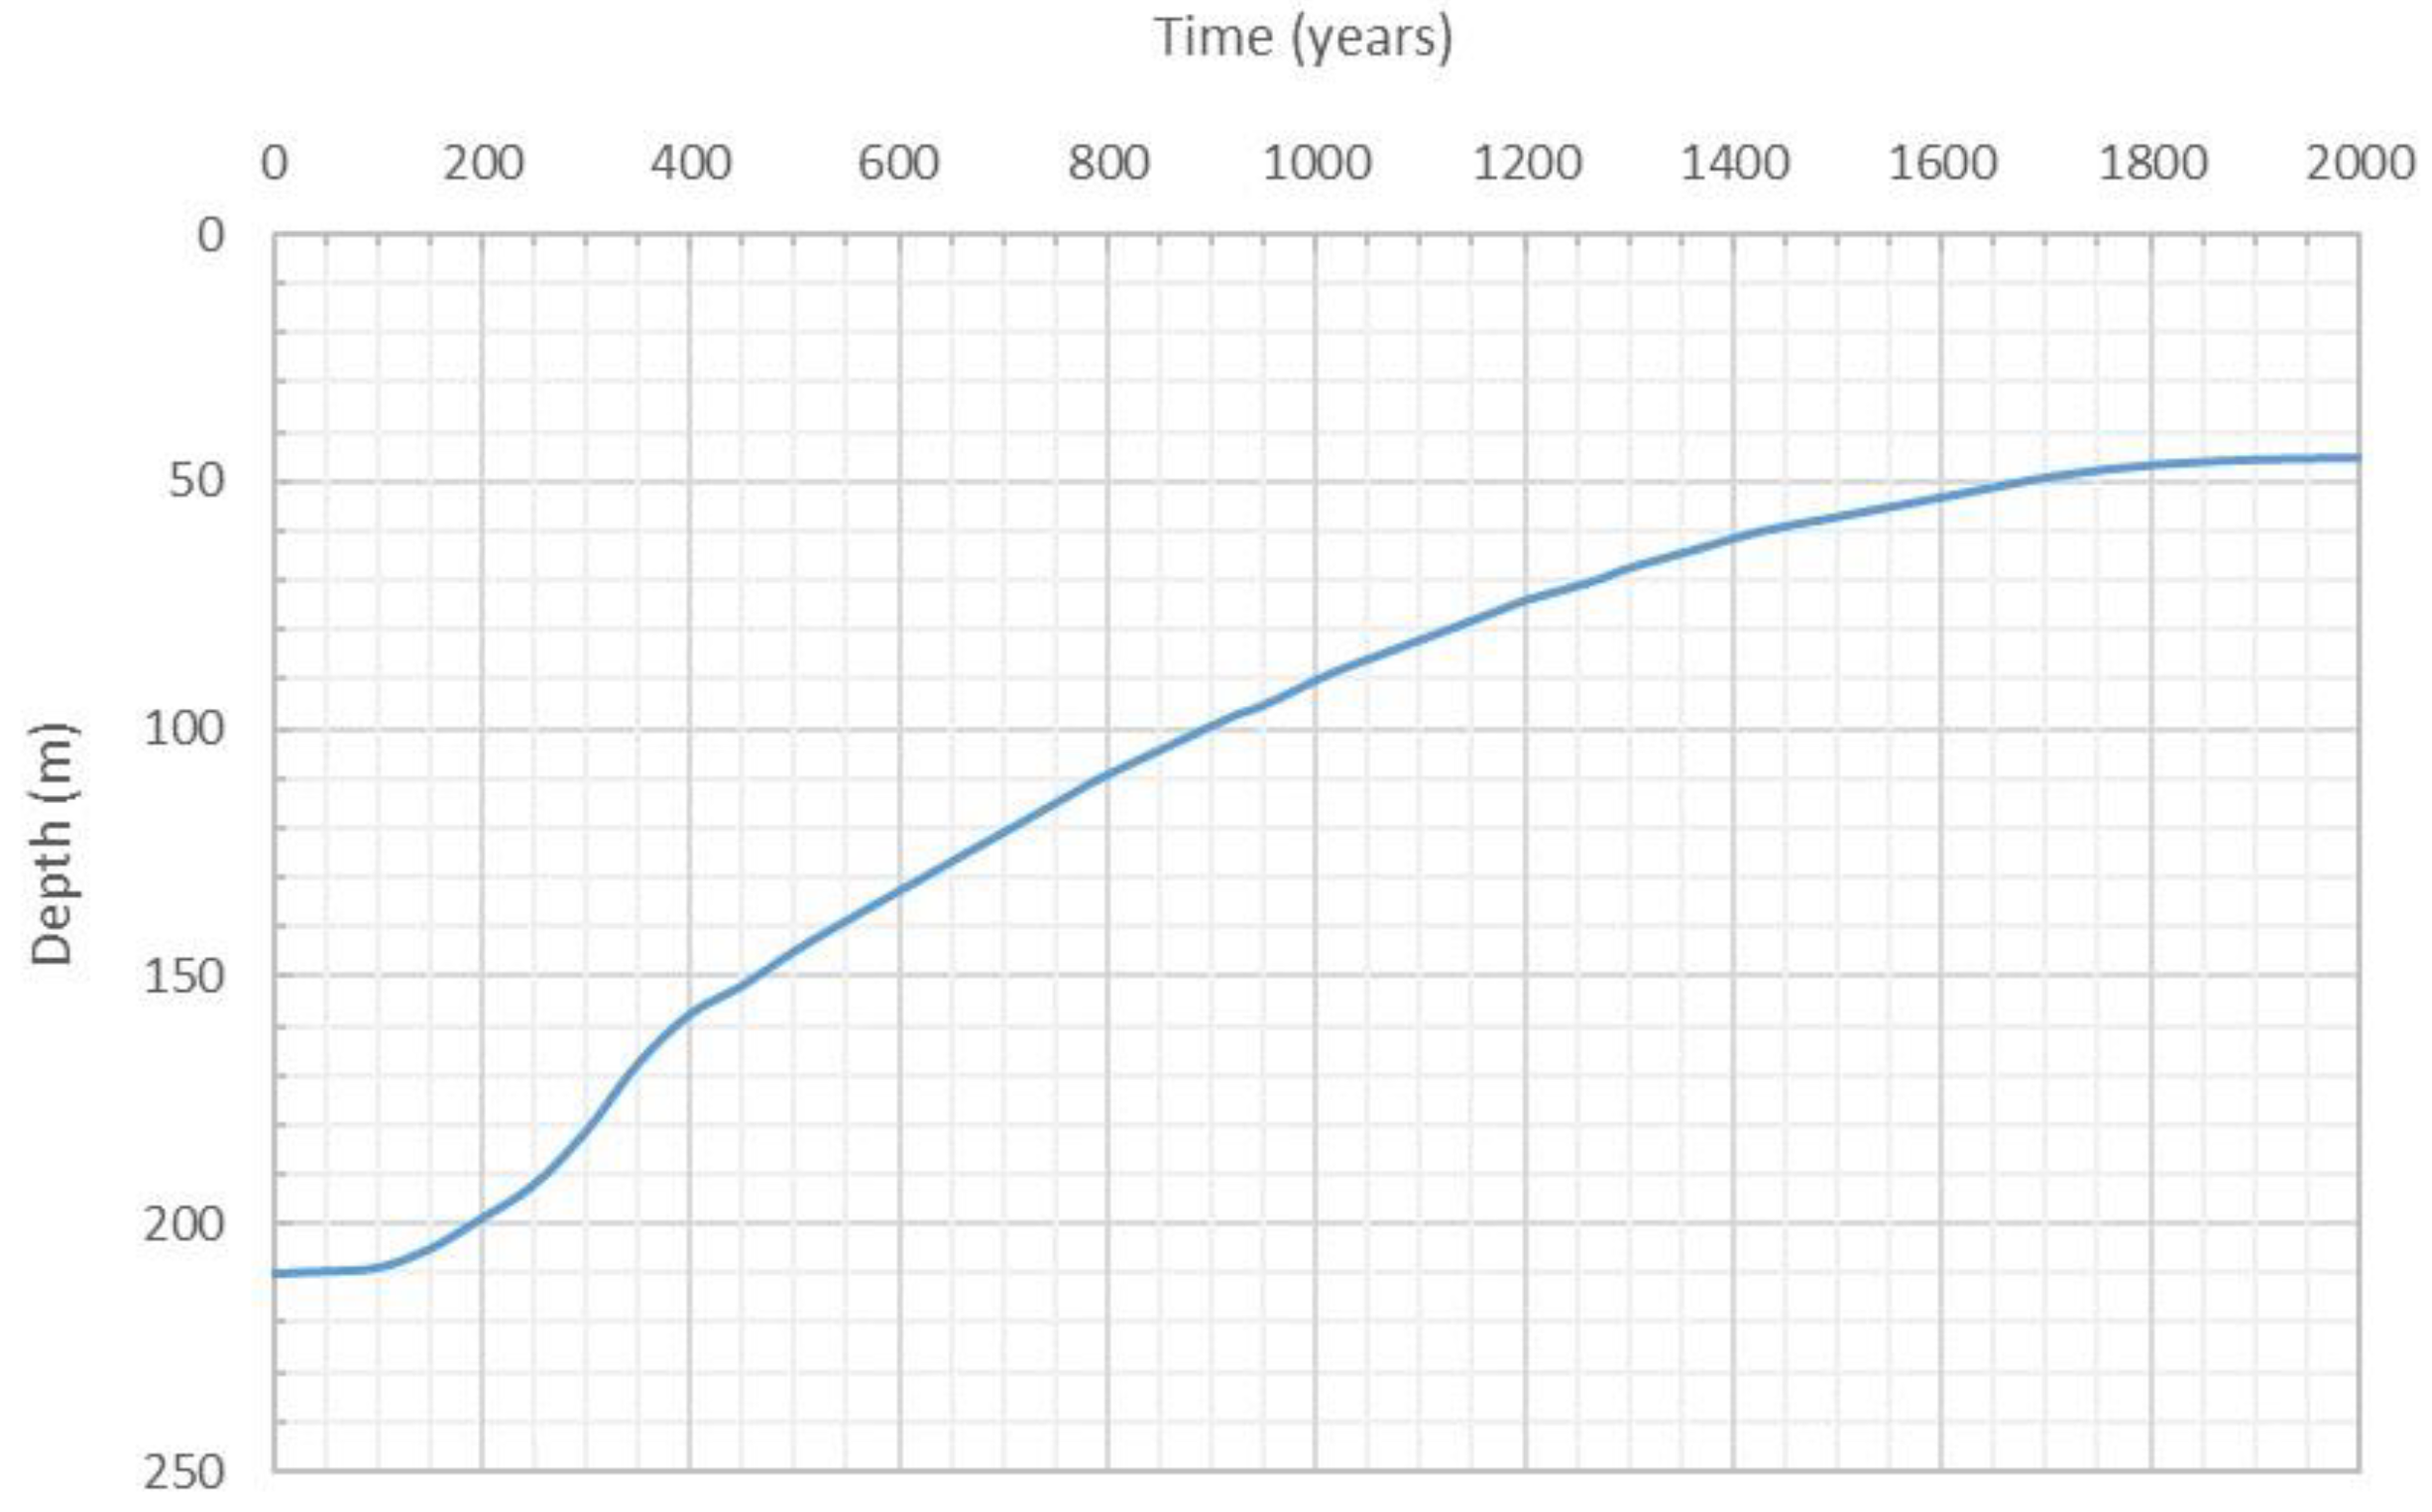
Before investigating the impact of climate change on the thermal regime of the TMFs, as a base case, we examined what would happen to the permafrost without the open pits/TMFs in the long term under climate change. Figure 13 shows the thermal regime of permafrost after 2000 years at the Kiggavik site when the mean annual ground surface temperature increases from −6 °C to −1 °C. The change in the lower boundary of permafrost as a function of time is shown in Figure 14. It is seen that the lower permafrost boundary would reach a depth of about 45 m below the ground surface after 2000 years.
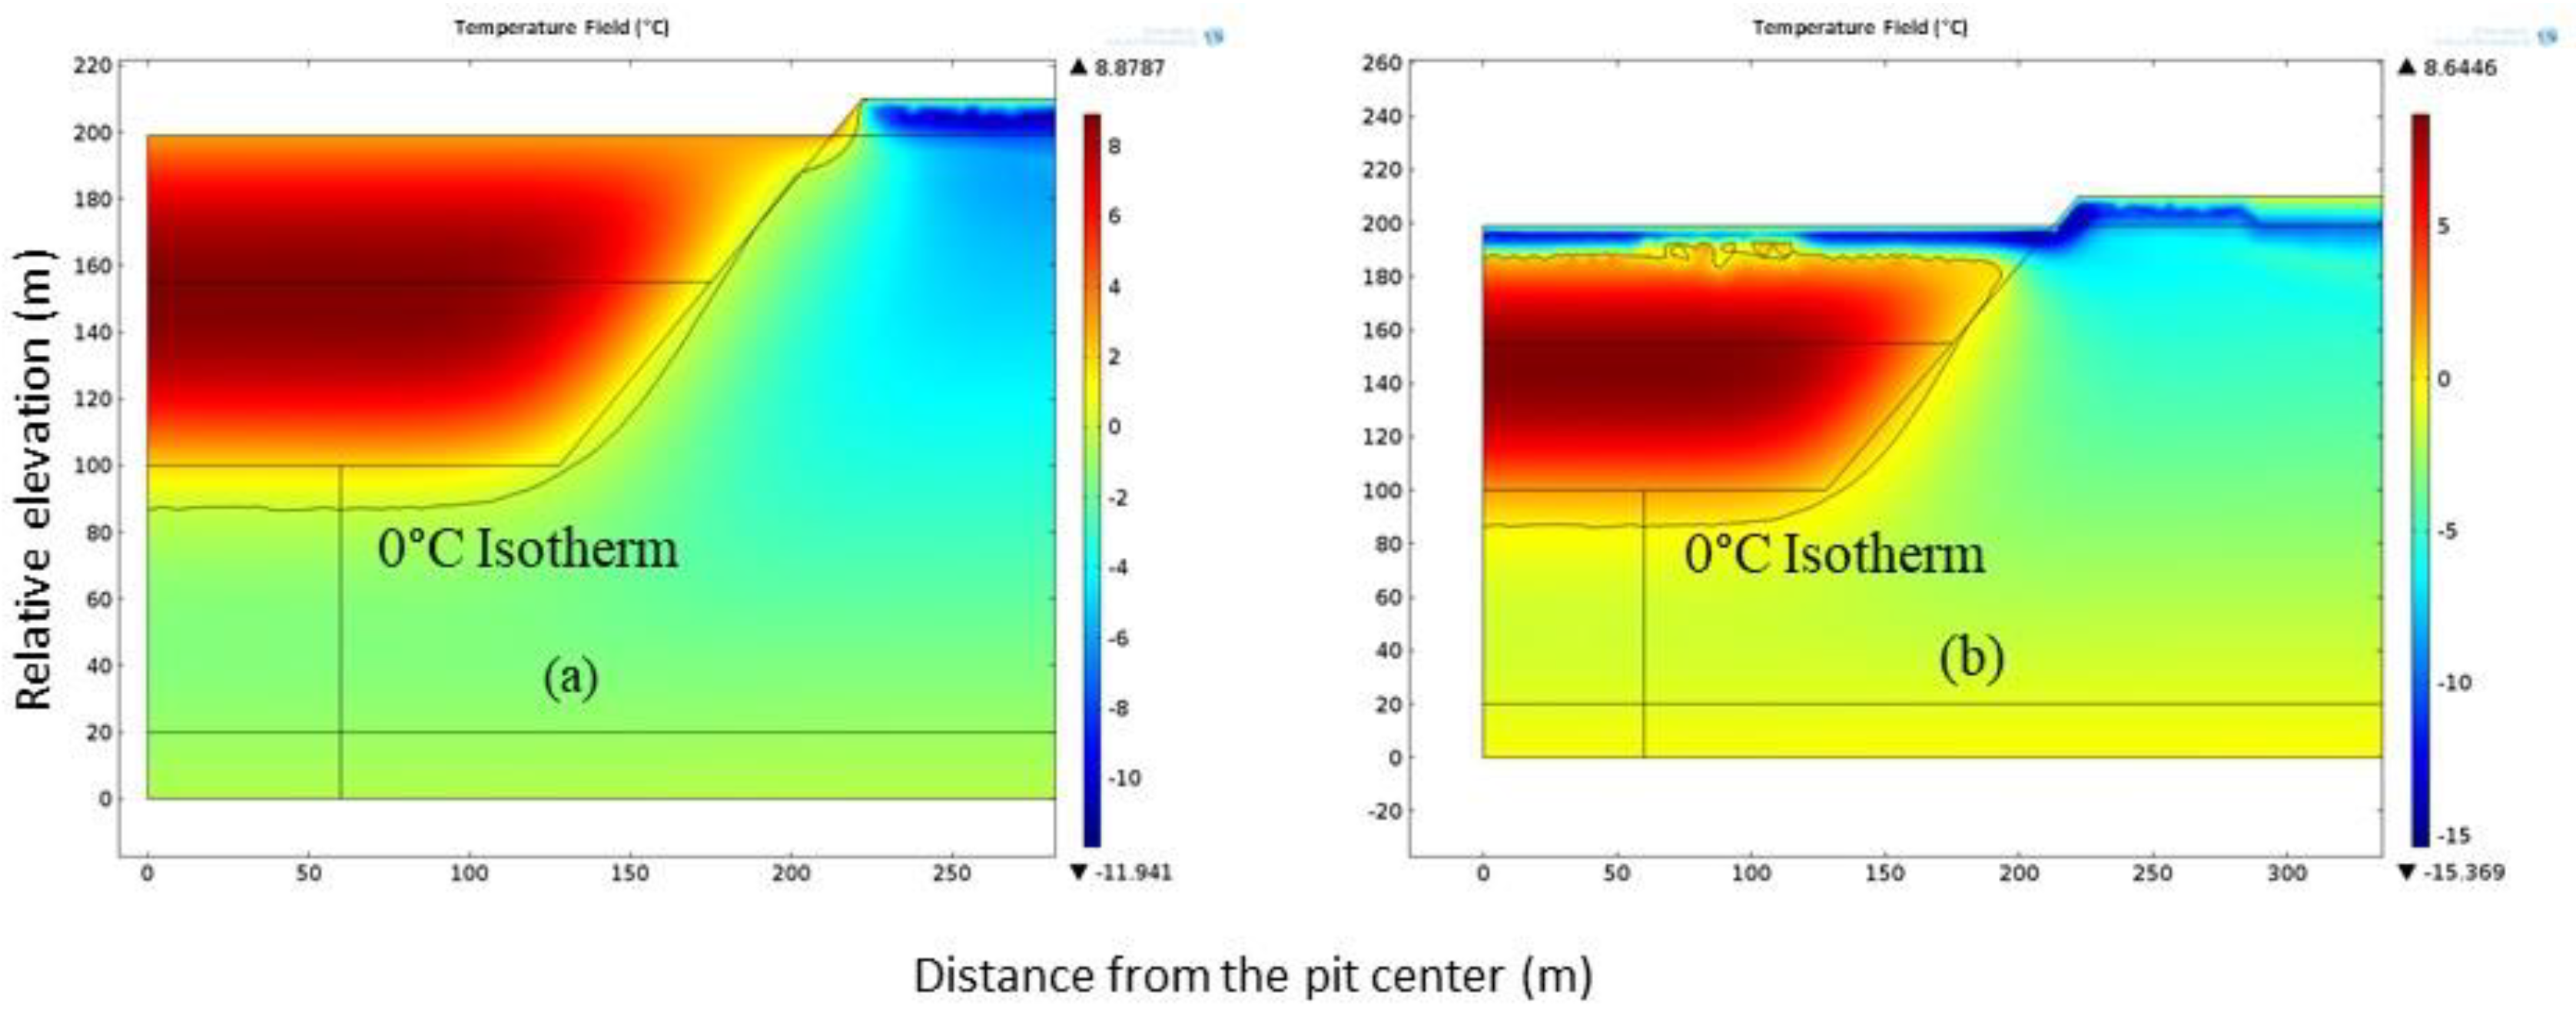
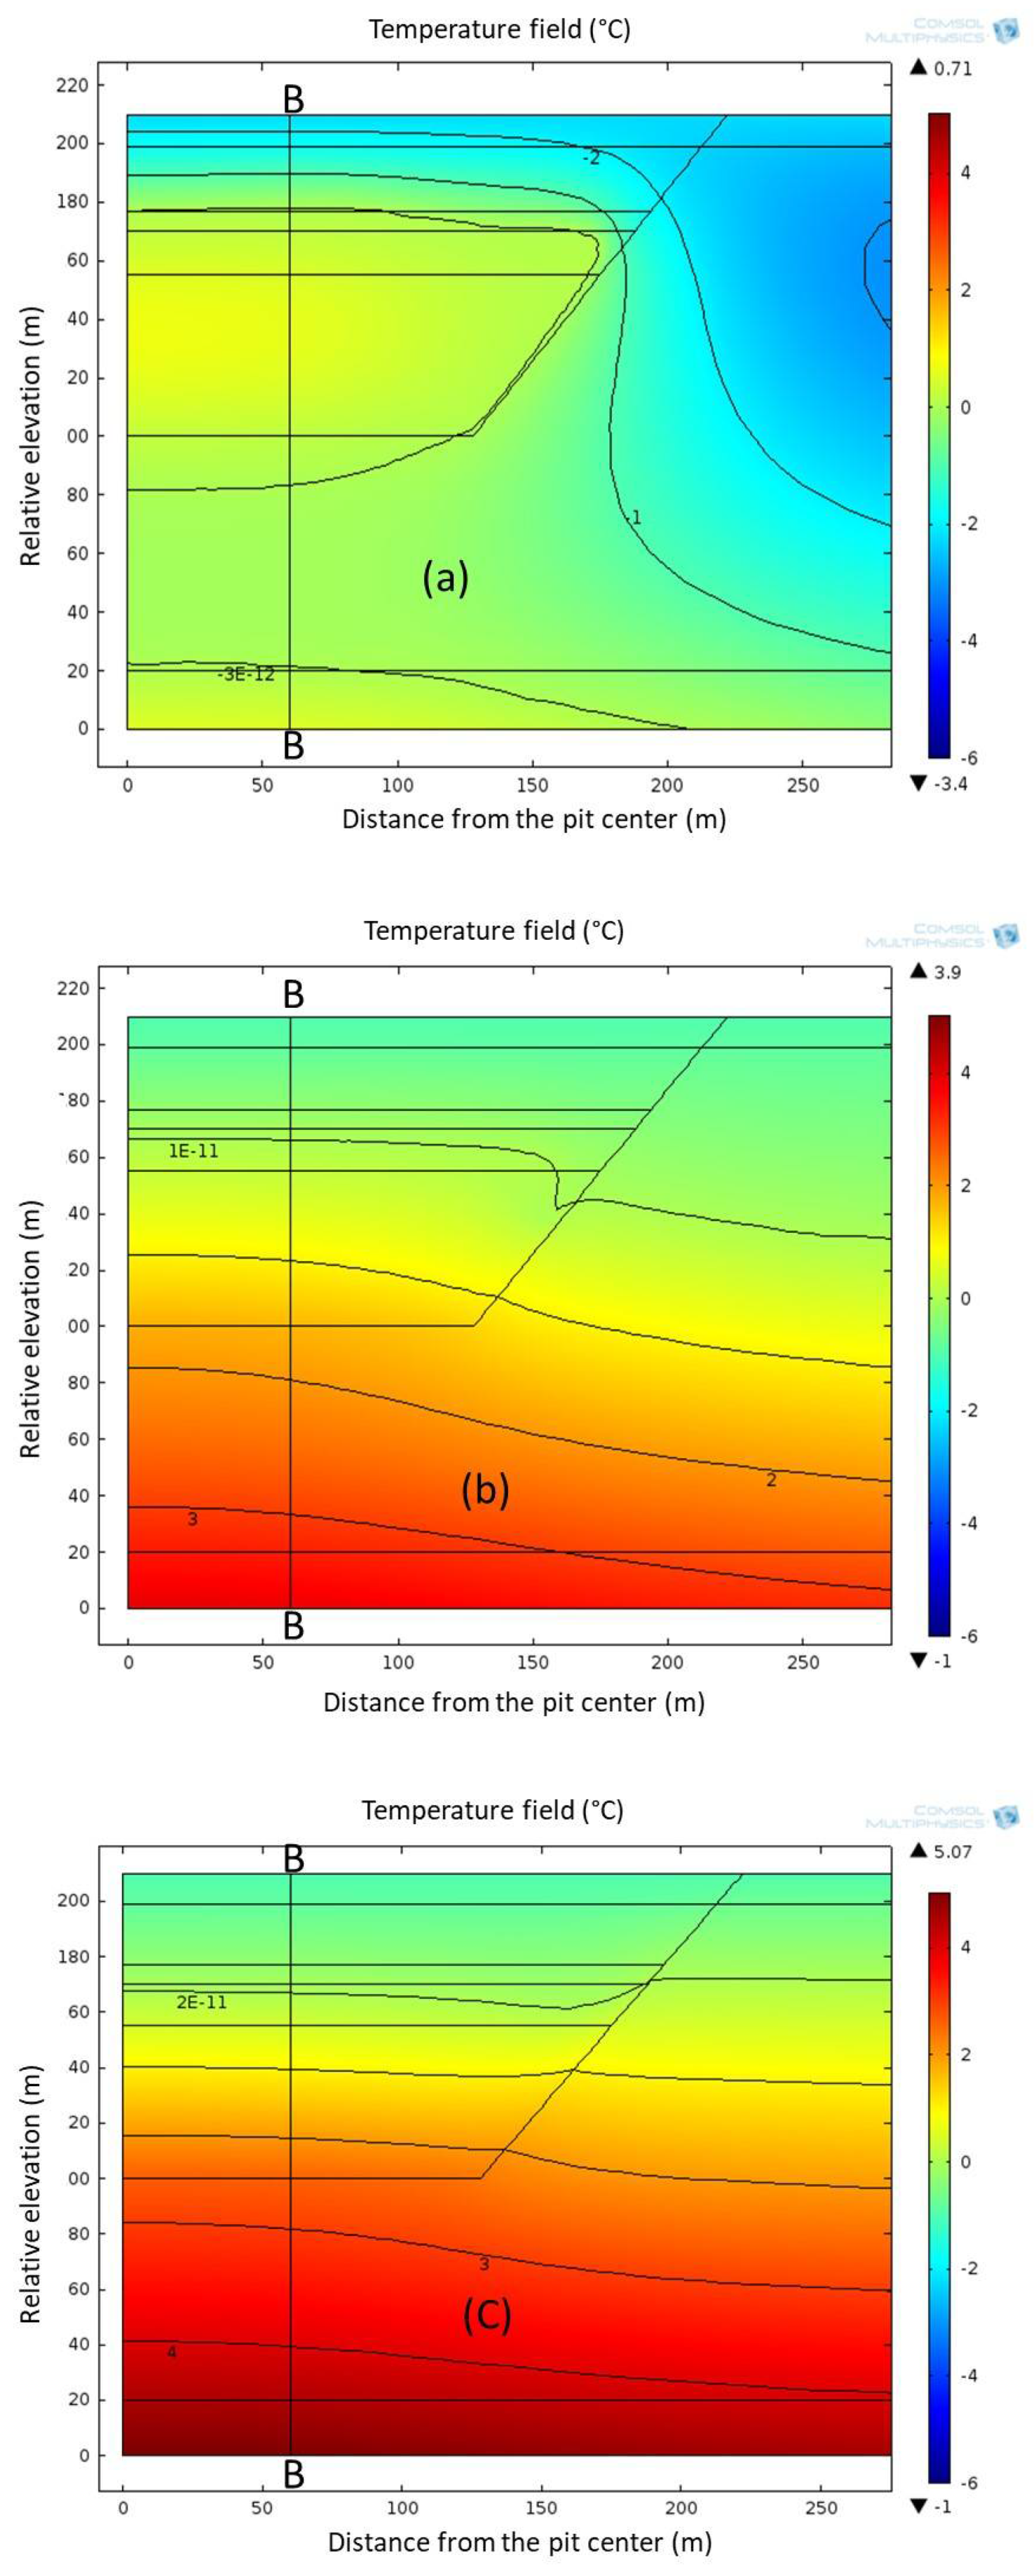
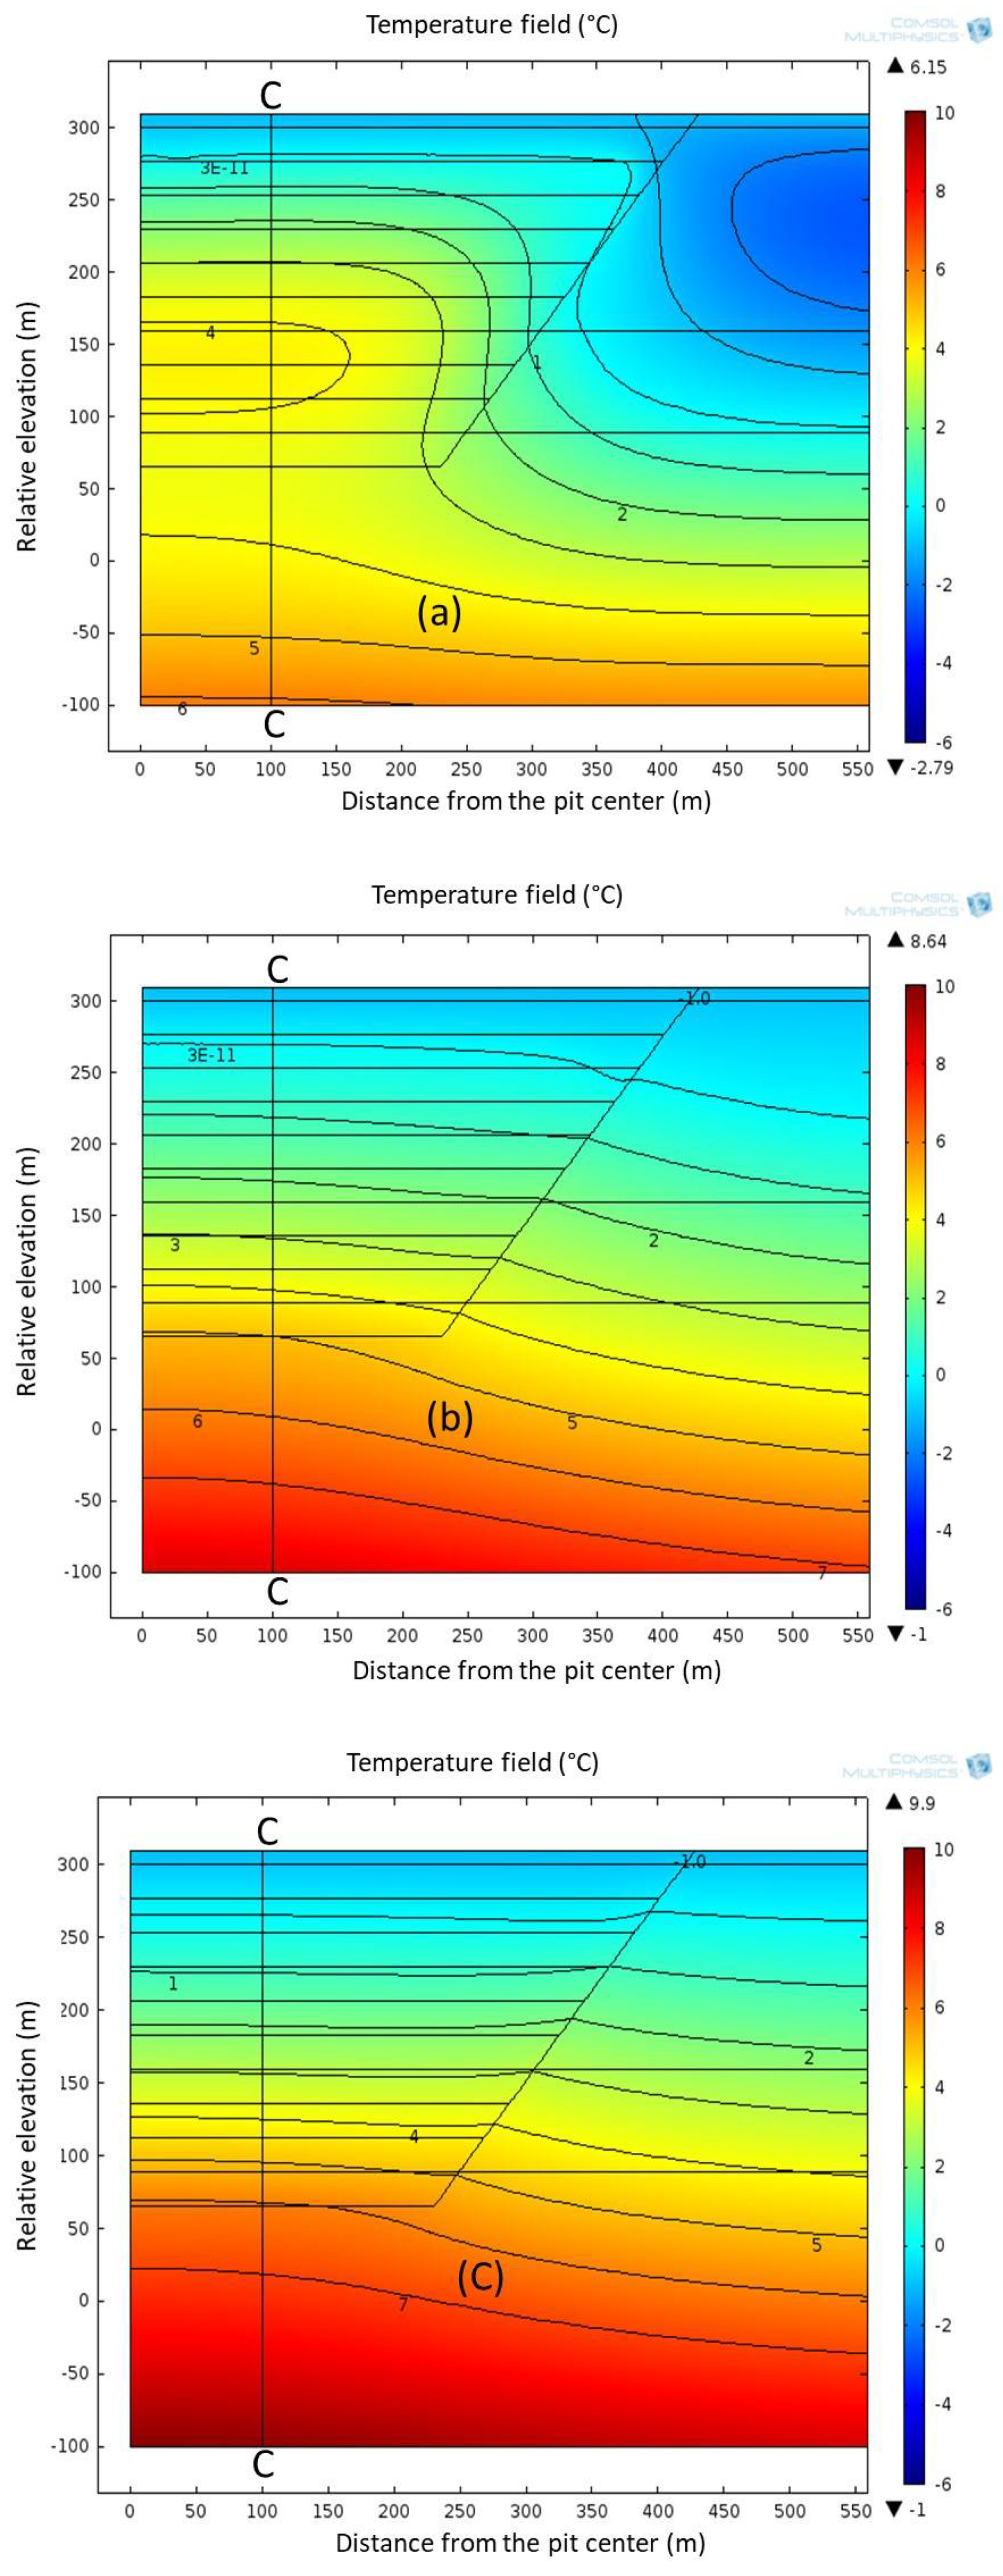
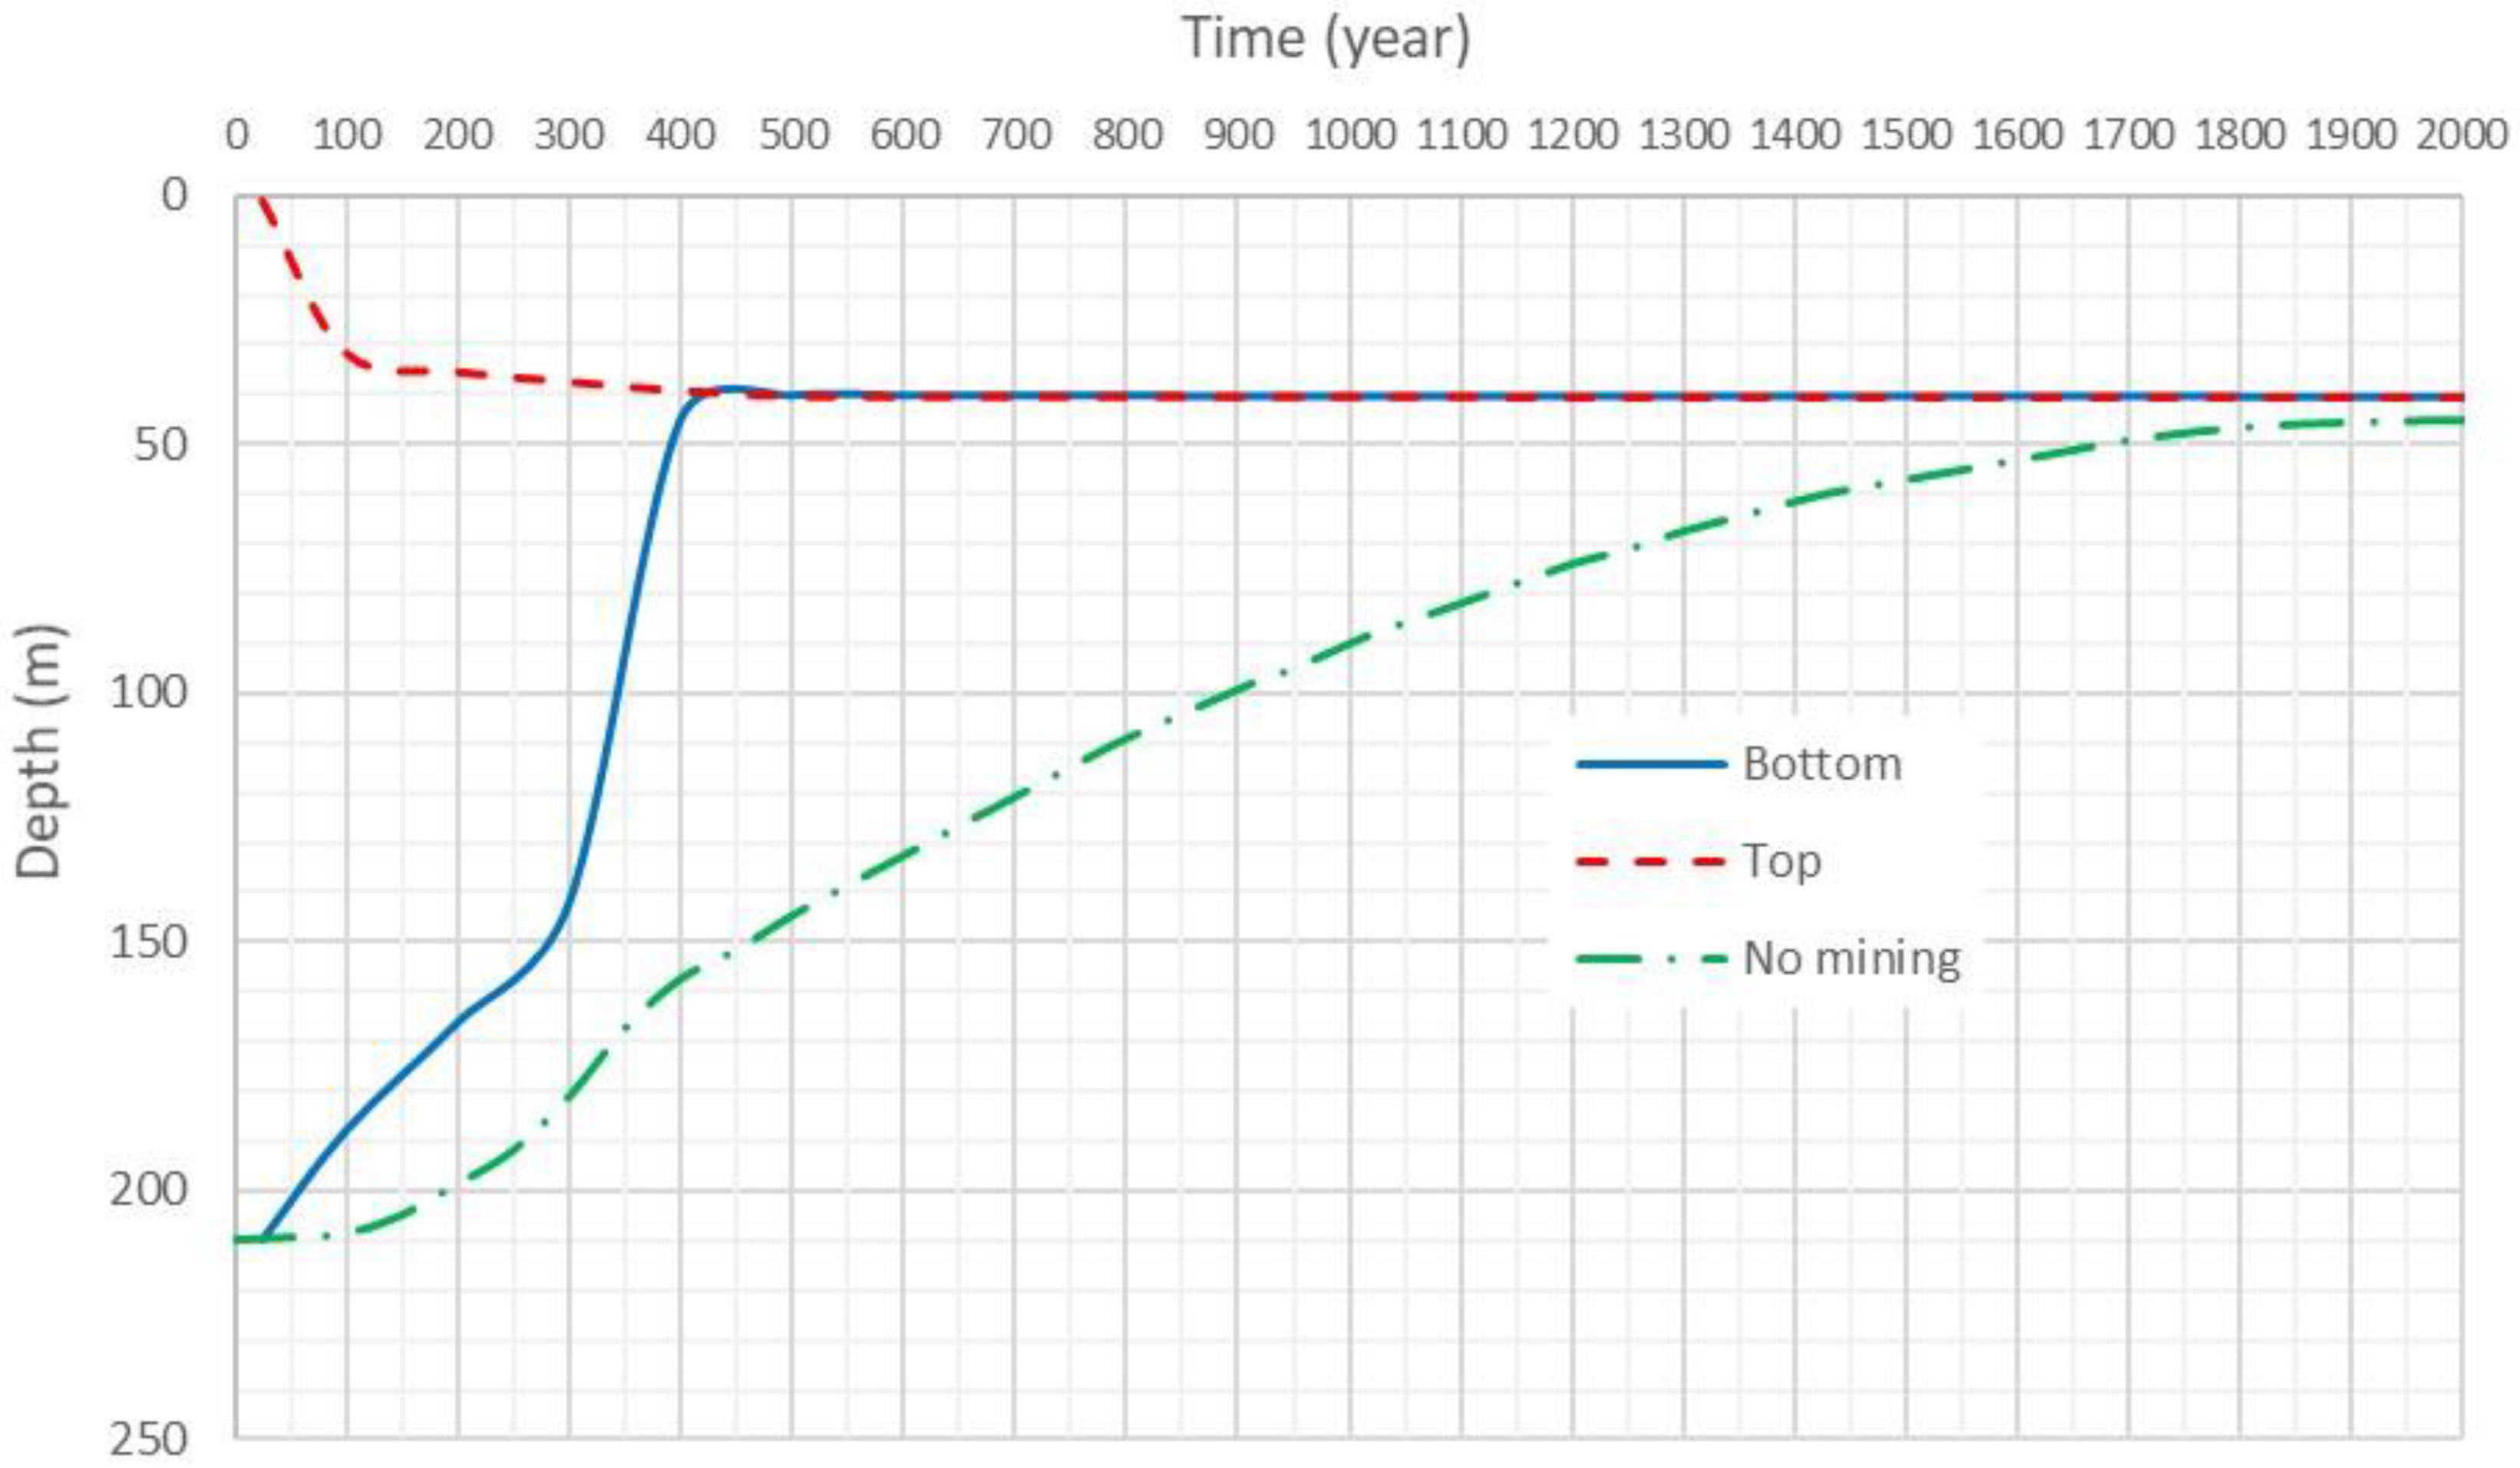
After the ores are mined out from three open pits and tailings are backfilled, Figure 15 and Figure 16 show the thermal regimes of the Center Zone and the Main Zone TMFs at different times (100 years, 1000 years, and 2000 years) after decommissioning. Figure 17 and Figure 18 show the thermal profiles within the Center Zone and the Main Zone TMFs up to 2000 years after decommissioning. Figure 19 shows the thermal profiles along section B-B (in Figure 15) of the Center Zone and section C-C (in Figure 16) of the Main Zone TMFs at 2000 years after decommissioning. Figure 20 shows the permafrost evolution surrounding the Center Zone TMF up to 2000 years after decommissioning. For comparison, the results shown in Figure 14 are also plotted in Figure 20.
It is found that the lower permafrost boundary would reach a depth of approximately 40 m below the ground surface about 500 years after decommissioning. The ground thermal regime around the TMFs are not identical for all TMFs, which is also in contrast with the case where no TMFs exist and the permafrost bottom in this case would reach a depth of approximately 45 m below the ground surface after 2000 years. The main reason for this difference is because the water content of the tailings is higher than that of the original ground materials, which need more thermal energy for tailings to be frozen.
Figure 14 and Figure 20 show the permafrost evolution of the original permafrost ground as a result of climate change and of the Center Zone TMF as a result of both mining and climate change, respectively. For the original frozen ground without mining, the permafrost thickness would gradually decrease from about 210 m to about 45 m eventually after 2000 years due to climate change and the geothermal gradient. The thawing rate of the permafrost bottom is slower in the first 500 years when comparing with the case of mining. Meanwhile, within the Center Zone TMF where the frozen ores are mined out, the tailings disposed of into the TMFs would be freezing from the top, while the permafrost would be thawing from the bottom. The thawing rate of the permafrost bottom is faster, i.e., reaching approximately 40 m below the ground surface at about 500 years when the permafrost bottom is approximately 150 m below ground surface for the case without mining. The freezing rate from the top is slow after the consideration of climate change (i.e., after 100 years) as the mean annual ground surface temperature is at −1 °C, and the tailings have relatively high water content. Eventually, the freezing front and the thawing front merge together at approximately 40 m below the ground surface about 500 years after decommissioning for the Center Zone TMF.
For the climate change scenario of 5 °C increase in the mean annual ground surface temperature in 100 years, although most of the permafrost would be thawed after 500 years, approximately 40 m of thick frozen ground would be formed on the top of the TMFs. This layer of frozen ground is impervious and would prevent the tailings pore water from migrating upwards to reach the ground surface. The study carried out by Booshehrian et al. [31], assuming a worst climate change scenario of 7 °C increase in the mean annual ground surface temperature and using a coupled thermal–hydraulic modeling, indicates that although all permafrost would eventually disappear in about 450 years, the ground water level in the vicinity of the TMFs would be approximately 35 m below the ground surface. However, as most permafrost (for the case of a 5 °C increase in the mean annual ground surface temperature in 100 years) or all permafrost (for the case of a 7 °C increase in the mean annual ground surface temperature in 100 years) would be thawed, the tailings pore water could flow laterally to reach other downstream water bodies and flow down-gradient to reach the underneath aquifer. As contaminant transport is not an objective of this study, no simulations were carried out on this matter. However, solute transport calculations conducted by the proponent [20] indicate that all the predicted solute concentrations in the downstream surface environment (i.e., Pointer Lake) are well below applicable water quality objectives and most constituents’ incremental concentrations calculated for both the current permafrost and conservative non-permafrost conditions are negligible in relation to baseline concentrations.
Although our independent analysis has been conducted using a scientifically sound theoretical framework with careful choice of material parameters that are available from Areva’s technical studies [20], uncertainties and limitations do exist. For the short-term analysis, regional climate data were used, which will impact on the thermal regime of permafrost surrounding the TMFs. However, the integrity of permafrost would not be expected to be affected during the mining and milling operational period (i.e., the short term). For the long term, the climate change scenario considered (i.e., a 5 °C increase in the mean annual ground surface temperature in 100 years) was based on the current understanding of climate change. If the climate change scenario is different from what was used for this study, the thermal regime and permafrost evolution surrounding the TMFs would be different. Another uncertainty is related to the future precipitation, which was not taken into account in this study. If precipitation increases in the future due to climate change, together with an increase in temperature, the thermal regime and evolution of permafrost would be different. The water level in the TMFs if the permafrost is fully thawed would also be different, which will need to be taken into account during decommissioning of the site when more information on climate change is expected to be available at that time.
6. Summary and Conclusion
The results of numerical simulations of thermal disturbances in permafrost due to open pit mining and subsequent tailings impoundment indicate the thawing of a thin zone of 3 to 5 m of permafrost on the side walls of the East Zone and the Center Zone TMFs of the proposed Kiggavik project. The thawed area at the bottom of the TMFs extends to a depth of approximately 10 to 15 m. However, no open taliks would form at the East Zone and the Center Zone TMFs, which means that the permafrost integrity at these two TMFs would be maintained. The tailings and its pore water would be contained within the TMFs that is surrounded by permafrost. By contrast, for the Main Zone TMF where the excavation breaks through the permafrost, an open talik would remain. The thawed zone would extend laterally over 30 m along the lower side walls of the TMF at the end of an extended operational period of 25 years, and the vertical extension of the talik along the side walls of the TMF would be over a distance of about 150 m above the bottom of the pit. Although an open talik would remain for the Main Zone TMF, the artesian pore water pressure at the site facilitates the ground water flowing toward the pit during the operational period.
Climate studies have indicated that increases in temperature and changes in precipitation are probable in the near future. Based on the recent studies on climate change, a plausible long-term climate change scenario considering a 5 °C increase in the mean annual ground surface temperature was simulated to investigate the thermal disturbance and permafrost evolution. Simulation results indicate that most of the permafrost surrounding the TMFs would be thawed in about 500 years due to the climate change and the geothermal gradient. However, approximately 40 m thick of frozen ground would be formed on the top of the TMFs, which is impervious and would prevent the tailings pore water from migrating upwards to reach the ground surface. Whereas, for the original frozen ground without mining, the permafrost thickness would gradually decrease from about 210 m to about 45 m eventually after 2000 years due to climate change and the geothermal gradient.
Author Contributions
Conceptualization, A.B., R.W. and G.S.; methodology, A.B., R.W. and G.S.; formal analysis, A.B.; investigation, A.B.; resources, University of Calgary; data curation, A.B. and G.S.; writing—original draft preparation, A.B. and G.S.; writing—review and editing, R.W. and G.S.; visualization, G.S.; supervision, R.W.; project administration, G.S.; funding acquisition, G.S. All authors have read and agreed to the published version of the manuscript.
Funding
This research was funded by Canadian Nuclear Safety Commission; Contract No. 87055-11-0480.
Acknowledgments
Special thanks to Orano Canada Inc. (formally Areva Resources Canada Inc.) for the Kiggavik data in this study.
Conflicts of Interest
The authors declare no conflict of interest.
References
- Heginbottom, J.A.; Dubreuil, M.A.; Harker, P.A. Canada: Permafrost. National Atlas of Canada, 5th ed. In Natural Resources of Canada: MCR 4177; Natural Resources Canada: Ottawa, ON, Canada, 1995. [Google Scholar]
- Lachenbruch, A.H.; Brewer, M.C.; Greene, G.W.; Marshall, B.V. Temperatures in Permafrost, in Temperature—Its Measurement and Control in Science and Industry; Reinhold: New York, NY, USA, 1962; Volume 3, pp. 791–803. [Google Scholar]
- Mackay, J.R. A full-scale field experiment (1978–1995) on the growth of permafrost by means of lake drainage, western Arctic coast: A discussion of the method and some results. Can. J. Earth Sci. 1997, 34, 17–33. [Google Scholar] [CrossRef]
- Burn, C.R. Tundra lakes and permafrost, Richards Island, Western Arctic Coast, Canada. Can. J. Earth Sci. 2002, 39, 1281–1298. [Google Scholar] [CrossRef]
- Johnston, G.H.; Brown, R.J.E. Some Observations on Permafrost Distribution at a Lake in the Mackenzie Delta, N.W.T.: Canada. Arctic 1964, 17, 162–175. [Google Scholar] [CrossRef] [Green Version]
- Ling, F.; Zhang, T. Numerical simulation of permafrost thermal regime and talik development under shallow thaw lakes on the Alaskan Arctic Coastal Plain. J. Geophys. Res. 2003, 108, 4511. [Google Scholar] [CrossRef]
- Zhou, W.; Huang, S.L. Modeling impacts of thaw lakes to ground thermal regime in northern Alaska. J. Cold Reg. Eng. 2004, 18, 70–87. [Google Scholar] [CrossRef]
- West, J.J.; Plug, L.J. Time-dependent morphology of thaw lakes and taliks in deep and shallow ground ice. J. Geophys. Res. 2008, 113, F01009. [Google Scholar] [CrossRef] [Green Version]
- Plug, L.J.; West, J.J. Thaw lake expansion in a two-dimensional coupled model of heat transfer, thaw subsidence, and mass movement. J. Geophys. Res. 2009, 114, F01002. [Google Scholar] [CrossRef]
- Rowland, J.C.; Travis, B.J.; Wilson, C.J. The role of advective heat transport in talik development beneath lakes and ponds in discontinuous permafrost. Geophys. Res. Lett. 2011, 38, L17504. [Google Scholar] [CrossRef]
- Jafarov, E.E.; Marchenko, S.S.; Romanovsky, V.E. Numerical modeling of permafrost dynamics in Alaska using a high spatial resolution dataset. Cryosphere 2012, 6, 613–624. [Google Scholar] [CrossRef] [Green Version]
- Kessler, M.A.; Plug, L.J.; Walter, K.M. Simulating the decadal—To millennial-scale dynamics of morphology and sequestered carbon mobilization of two thermokarst lakes in NW Alaska. J. Geophys. Res. 2012, 117, G00M06. [Google Scholar] [CrossRef]
- Matell, N.; Anderson, R.S.; Overeem, I.; Wobus, C.; Urban, F.E.; Clow, G.D. Modeling the subsurface thermal impact of Arctic thaw lakes in a warming climate. Comput. Geosci. 2013, 53, 69–79. [Google Scholar] [CrossRef]
- Li, S.; Zhan, H.; Lai, Y.; Sun, Z.; Pei, W. The coupled moisture-heat process of permafrost around a thermokarst pond in Qinghai-Tibet Plateau under global warming. J. Geophys. Res. 2014, 119, 836–853. [Google Scholar] [CrossRef]
- Ling, F.; Wu, Q.B.; Niu, F.J.; Zhang, T.J. Modeled response of talik development under thermokarst lakes to permafrost thickness on the Qinghai-Tibet Plateau. Sci. Cold Arid Reg. 2014, 6, 0521–0530. [Google Scholar] [CrossRef]
- Jafarov, E.E.; Coon, E.T.; Harp, D.R.; Wilson, C.J.; Painter, S.L.; Atchley, A.L.; Romanovsky, V.E. Modelling the role of preferential snow accumulation in through talik development and hillslope groundwater flow in a transitional permafrost landscape. Environ. Res. Lett. 2018, 13, 105006. [Google Scholar] [CrossRef]
- Ling, F.; Zhang, T. Progress in numerical simulation of long-term impact of thermokarst lakes on permafrost thermal regime. Adv. Earth Sci. 2018, 33, 51–66. [Google Scholar]
- Yin, G.; Zheng, H.; Niu, F.; Luo, J.; Lin, Z.; Liu, M. Numerical Mapping and Modeling Permafrost Thermal Dynamics across the Qinghai-Tibet Engineering Corridor, China Integrated with Remote Sensing. Remote Sens. 2018, 10, 2069. [Google Scholar] [CrossRef] [Green Version]
- Ling, F.; Pan, F. Quantifying Impacts of Mean Annual Lake Bottom Temperature on Talik Development and Permafrost Degradation below Expanding Thermokarst Lakes on the Qinghai-Tibet Plateau. Water 2019, 11, 706. [Google Scholar] [CrossRef] [Green Version]
- Areva Resources Canada Inc. Kiggavik Project Final Environmental Impact Statement; Areva Resources Canada Inc.: Saskatoon, SK, Canada, 2014. [Google Scholar]
- International Panel on Climate Change. Climate Change 2014—Impacts, Adaptation and Vulnerability: Regional Aspects; Cambridge University Press: Cambridge, UK; New York, NY, USA, 2014. [Google Scholar]
- Dagher, E.E.; Nguyen, T.S.; Su, G. Numerical Modelling of Coupled Heat Transfer and Groundwater Flow: Applications to Tailings Management Facility in Permafrost Environments in Northern Canada. In Proceedings of the 65th Canadian Geotechnical Conference, Winnipeg, MB, Canada, 30 September–3 October 2012. [Google Scholar]
- Booshehrian, A.; Wan, R. Numerical Modelling of Mining Operational Sequences and Related Issues, Part 2 of Final Report for Contract 870055-11-0480: R493.1; Canadian Nuclear Safety Commission: Ottawa, ON, Canada, 2015.
- Mottaghy, D.; Rath, V. Latent heat effects in subsurface heat transport modelling and their impact on palaeo-temperature reconstructions. Int. J. Geophys. 2006, 164, 236–245. [Google Scholar] [CrossRef]
- Noetzli, J.; Gruber, S. Transient thermal effects in Alpine permafrost. Cryosphere 2009, 3, 85–99. [Google Scholar] [CrossRef] [Green Version]
- Thomson, W. On equilibrium of vapour at a curved surface of a liquid. Philo. Mag. 1871, 42, 448–452. [Google Scholar] [CrossRef]
- Liu, Z.; Muldrew, K.; Wan, R.G.; Elliot, J.A.W. Measurement of freezing point depression of water in glass capillaries and the associated ice front shape. Phys. Rev. E 2003, 67, 061602. [Google Scholar] [CrossRef] [Green Version]
- Woodruff, D.P. The Solid-Liquid Interface; Cambridge University Press: London, UK, 1973. [Google Scholar]
- Hiling, W.B. Measurement of interface free energy for ice/water system. J. Cryst. Growth 1998, 183, 463–468. [Google Scholar]
- Klene, A.E.; Nelson, F.E.; Shiklomanov, N.I.; Hinkel, K.M. The N-Factor in Natural Landscapes: Variability of Air and Soil-Surface Temperatures, Kuparuk River Basin, Alaska, USA. Arct. Antarct. Alp. Res. 2001, 33, 140–148. [Google Scholar] [CrossRef]
- Booshehrian, A.; Wan, R.; Su, X. Hydraulic variations in permafrost due to open-pit mining and climate change: A case study in the Canadian Arctic. Acta Geotech. 2019. [Google Scholar] [CrossRef]
Figure 1.
The proposed Kiggavik project (a) (satellite image) and permafrost distribution in Canada (b).
Figure 1.
The proposed Kiggavik project (a) (satellite image) and permafrost distribution in Canada (b).

Figure 2.
Schematic tailings consolidation and backfilling processes for tailings management facilities (TMFs) in the proposed Kiggavik project.
Figure 2.
Schematic tailings consolidation and backfilling processes for tailings management facilities (TMFs) in the proposed Kiggavik project.

Figure 3.
Incorporation of latent heat through an equivalent heat capacity with a pulse.
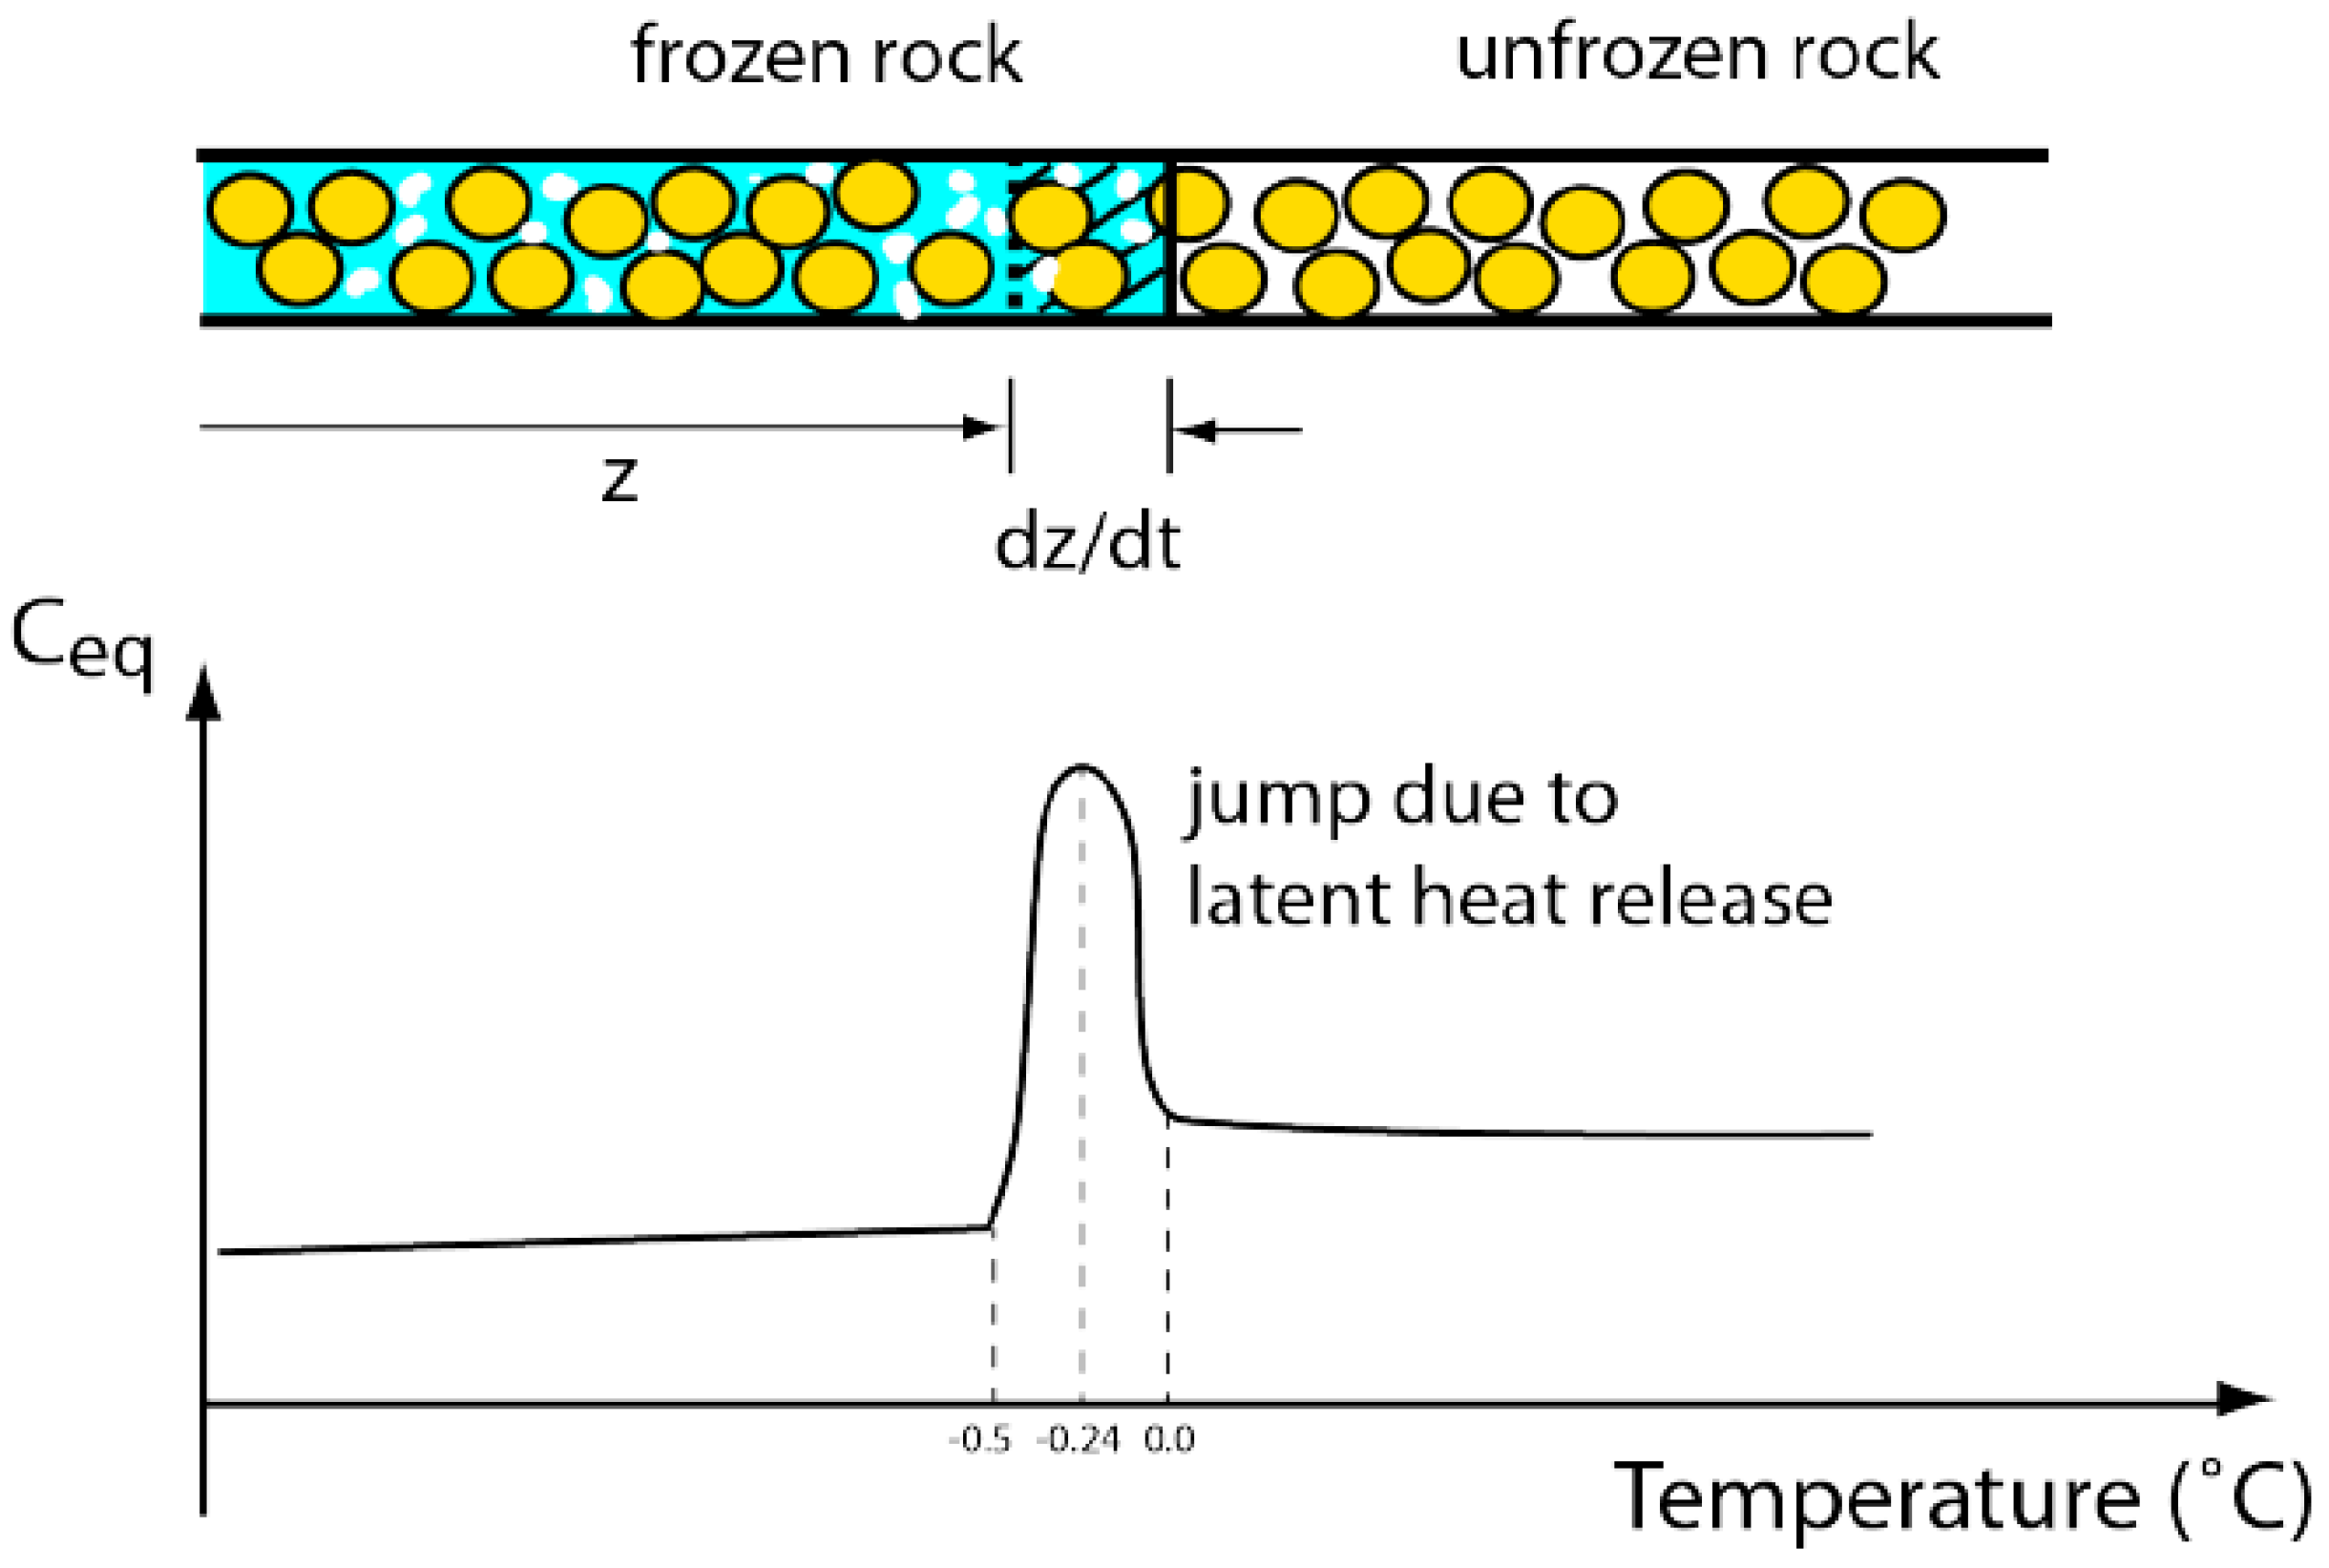
Figure 4.
Initial and boundary conditions during mining.

Figure 5.
Initial ground thermal condition for long-term analysis.

Figure 6.
Ground thermal profiles within the Main Zone TMF after 2000 years from decommissioning for two different initial tailings temperatures.
Figure 6.
Ground thermal profiles within the Main Zone TMF after 2000 years from decommissioning for two different initial tailings temperatures.

Figure 7.
Thermal regime of the Center Zone pit, 2.5 years after the start of excavation (before backfilling starts).
Figure 7.
Thermal regime of the Center Zone pit, 2.5 years after the start of excavation (before backfilling starts).

Figure 8.
Thermal regime of the Center Zone TMF, six months after placing the first layer of tailings.
Figure 8.
Thermal regime of the Center Zone TMF, six months after placing the first layer of tailings.

Figure 9.
Thermal regime of the Center Zone TMF, 14 years after tailings is placed, (a) with water cover, (b) without water cover.
Figure 9.
Thermal regime of the Center Zone TMF, 14 years after tailings is placed, (a) with water cover, (b) without water cover.

Figure 10.
Thermal profiles beneath the Center Zone TMF at different times after tailings deposition, (a) with water cover, (b) without water cover.
Figure 10.
Thermal profiles beneath the Center Zone TMF at different times after tailings deposition, (a) with water cover, (b) without water cover.
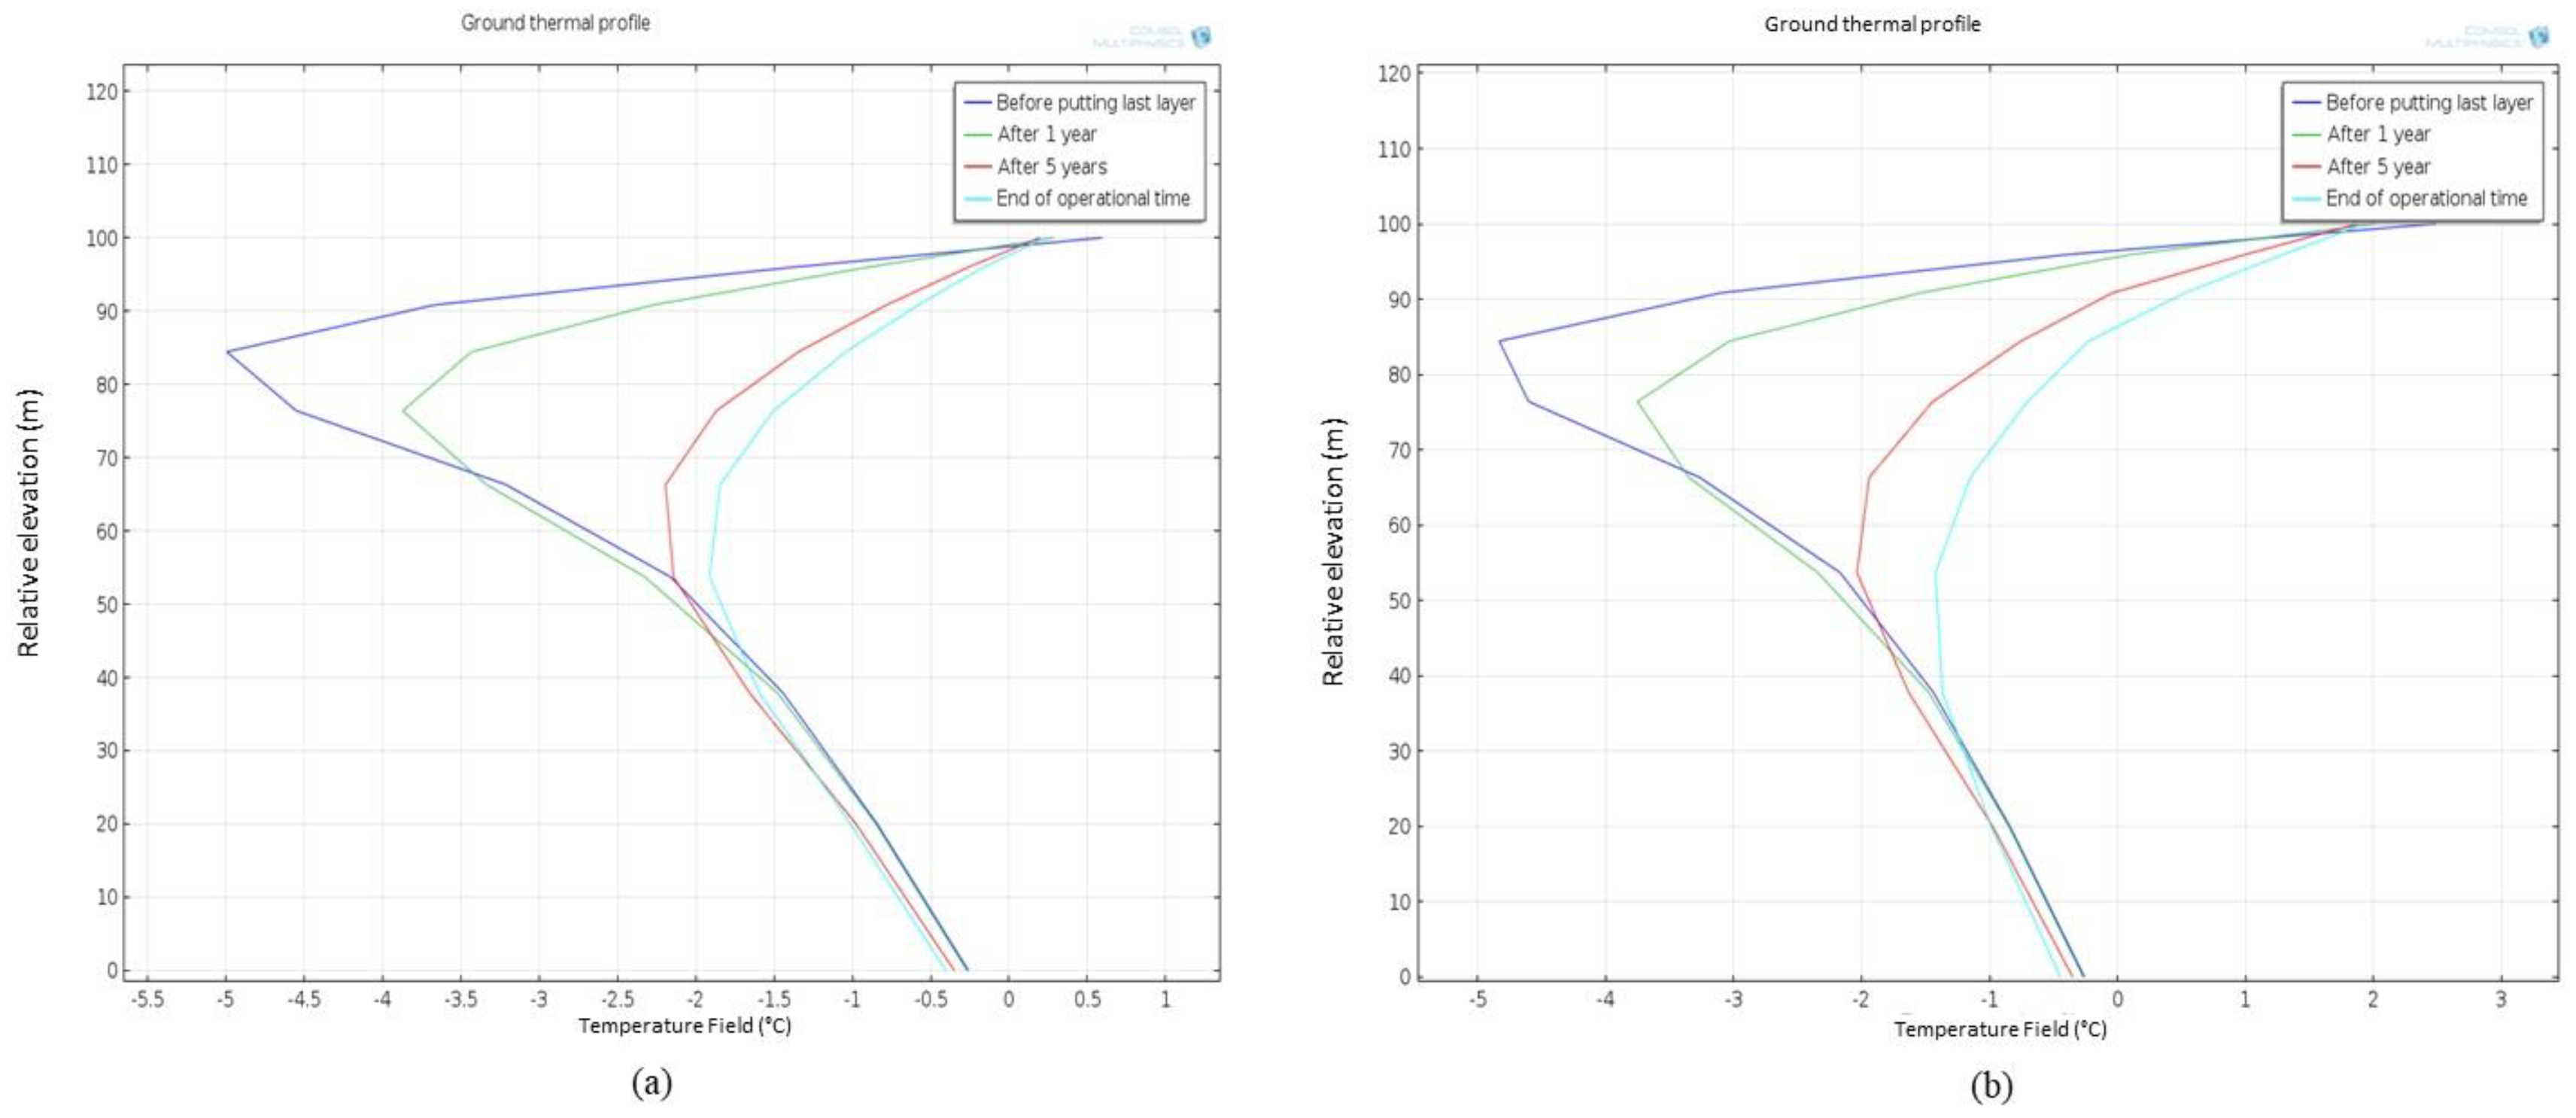
Figure 11.
Thermal regime of the Main Zone pit at the end of excavation.

Figure 12.
Thermal regimes of the Main Zone TMF at the end of 25 years, (a) with water cover, (b) without water cover.
Figure 12.
Thermal regimes of the Main Zone TMF at the end of 25 years, (a) with water cover, (b) without water cover.
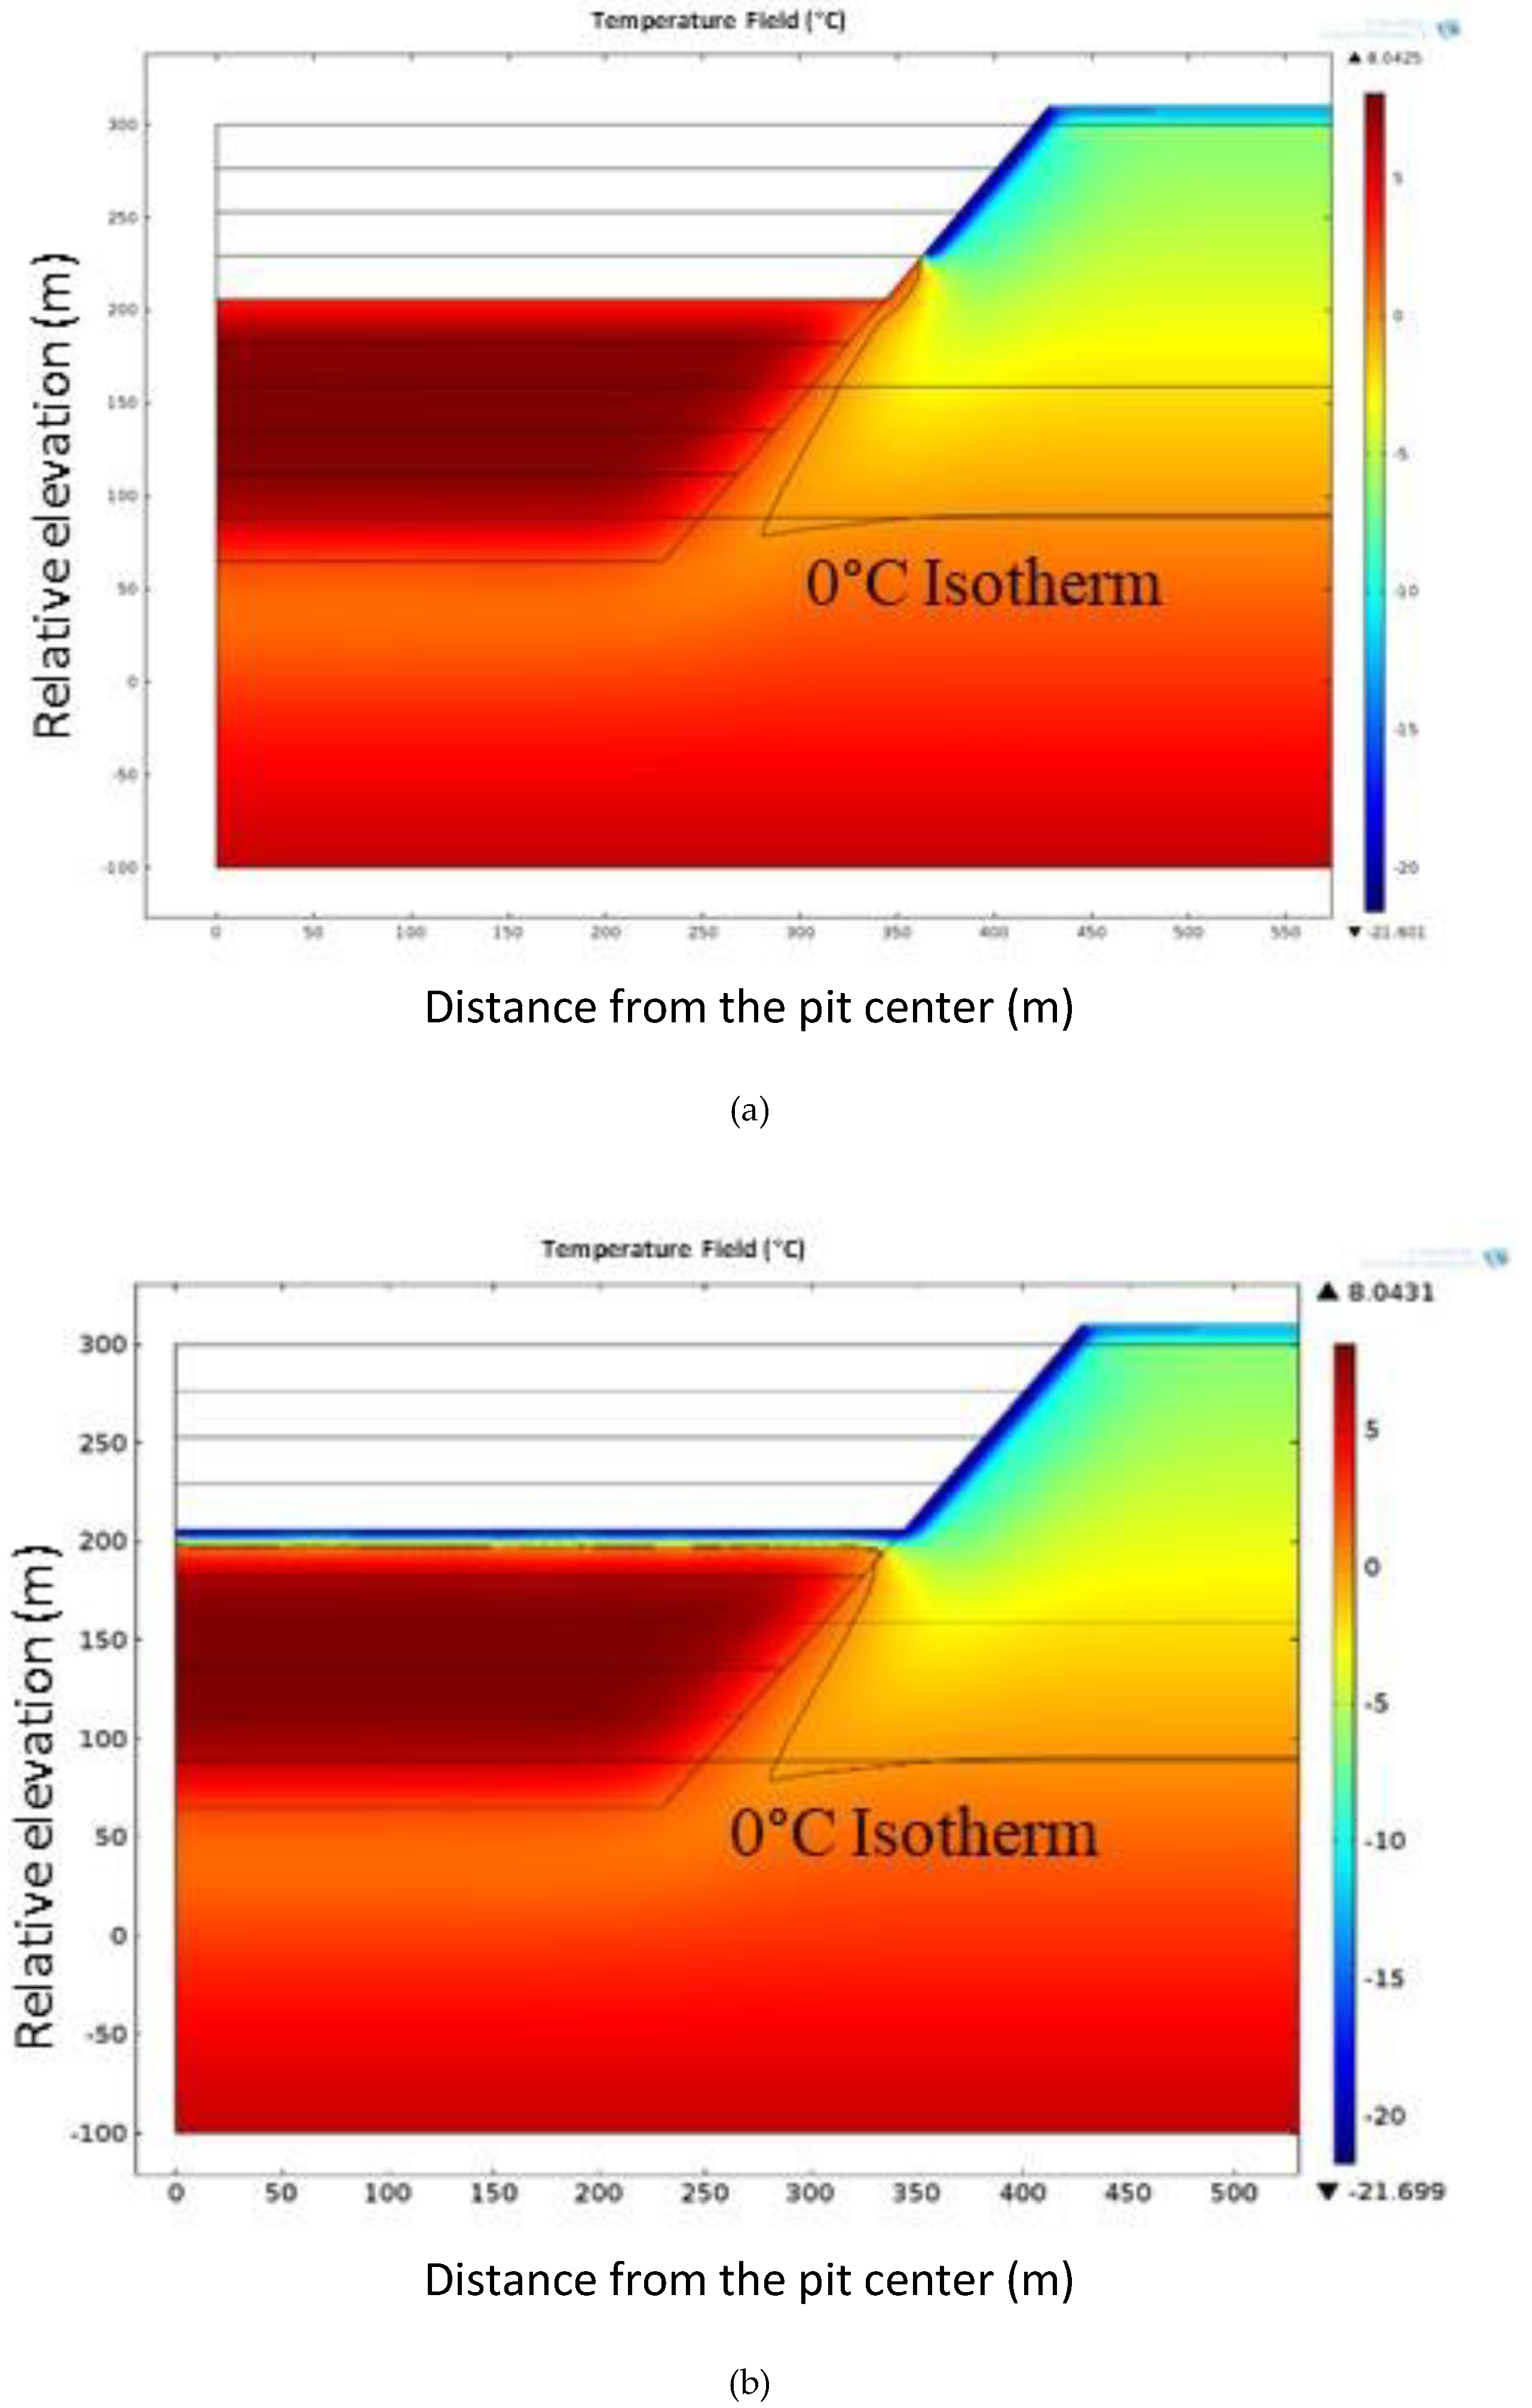
Figure 13.
Ground thermal regime of the Kiggavik site at 2000 years with consideration of climate change (no mining).
Figure 13.
Ground thermal regime of the Kiggavik site at 2000 years with consideration of climate change (no mining).

Figure 14.
Evolution of the lower permafrost boundary at the Kiggavik site with consideration of climate change (no mining).
Figure 14.
Evolution of the lower permafrost boundary at the Kiggavik site with consideration of climate change (no mining).

Figure 15.
Thermal regimes of the Center Zone TMF at different times after decommissioning ((a) 100 years, (b) 1000 years, (c) 2000 years).
Figure 15.
Thermal regimes of the Center Zone TMF at different times after decommissioning ((a) 100 years, (b) 1000 years, (c) 2000 years).

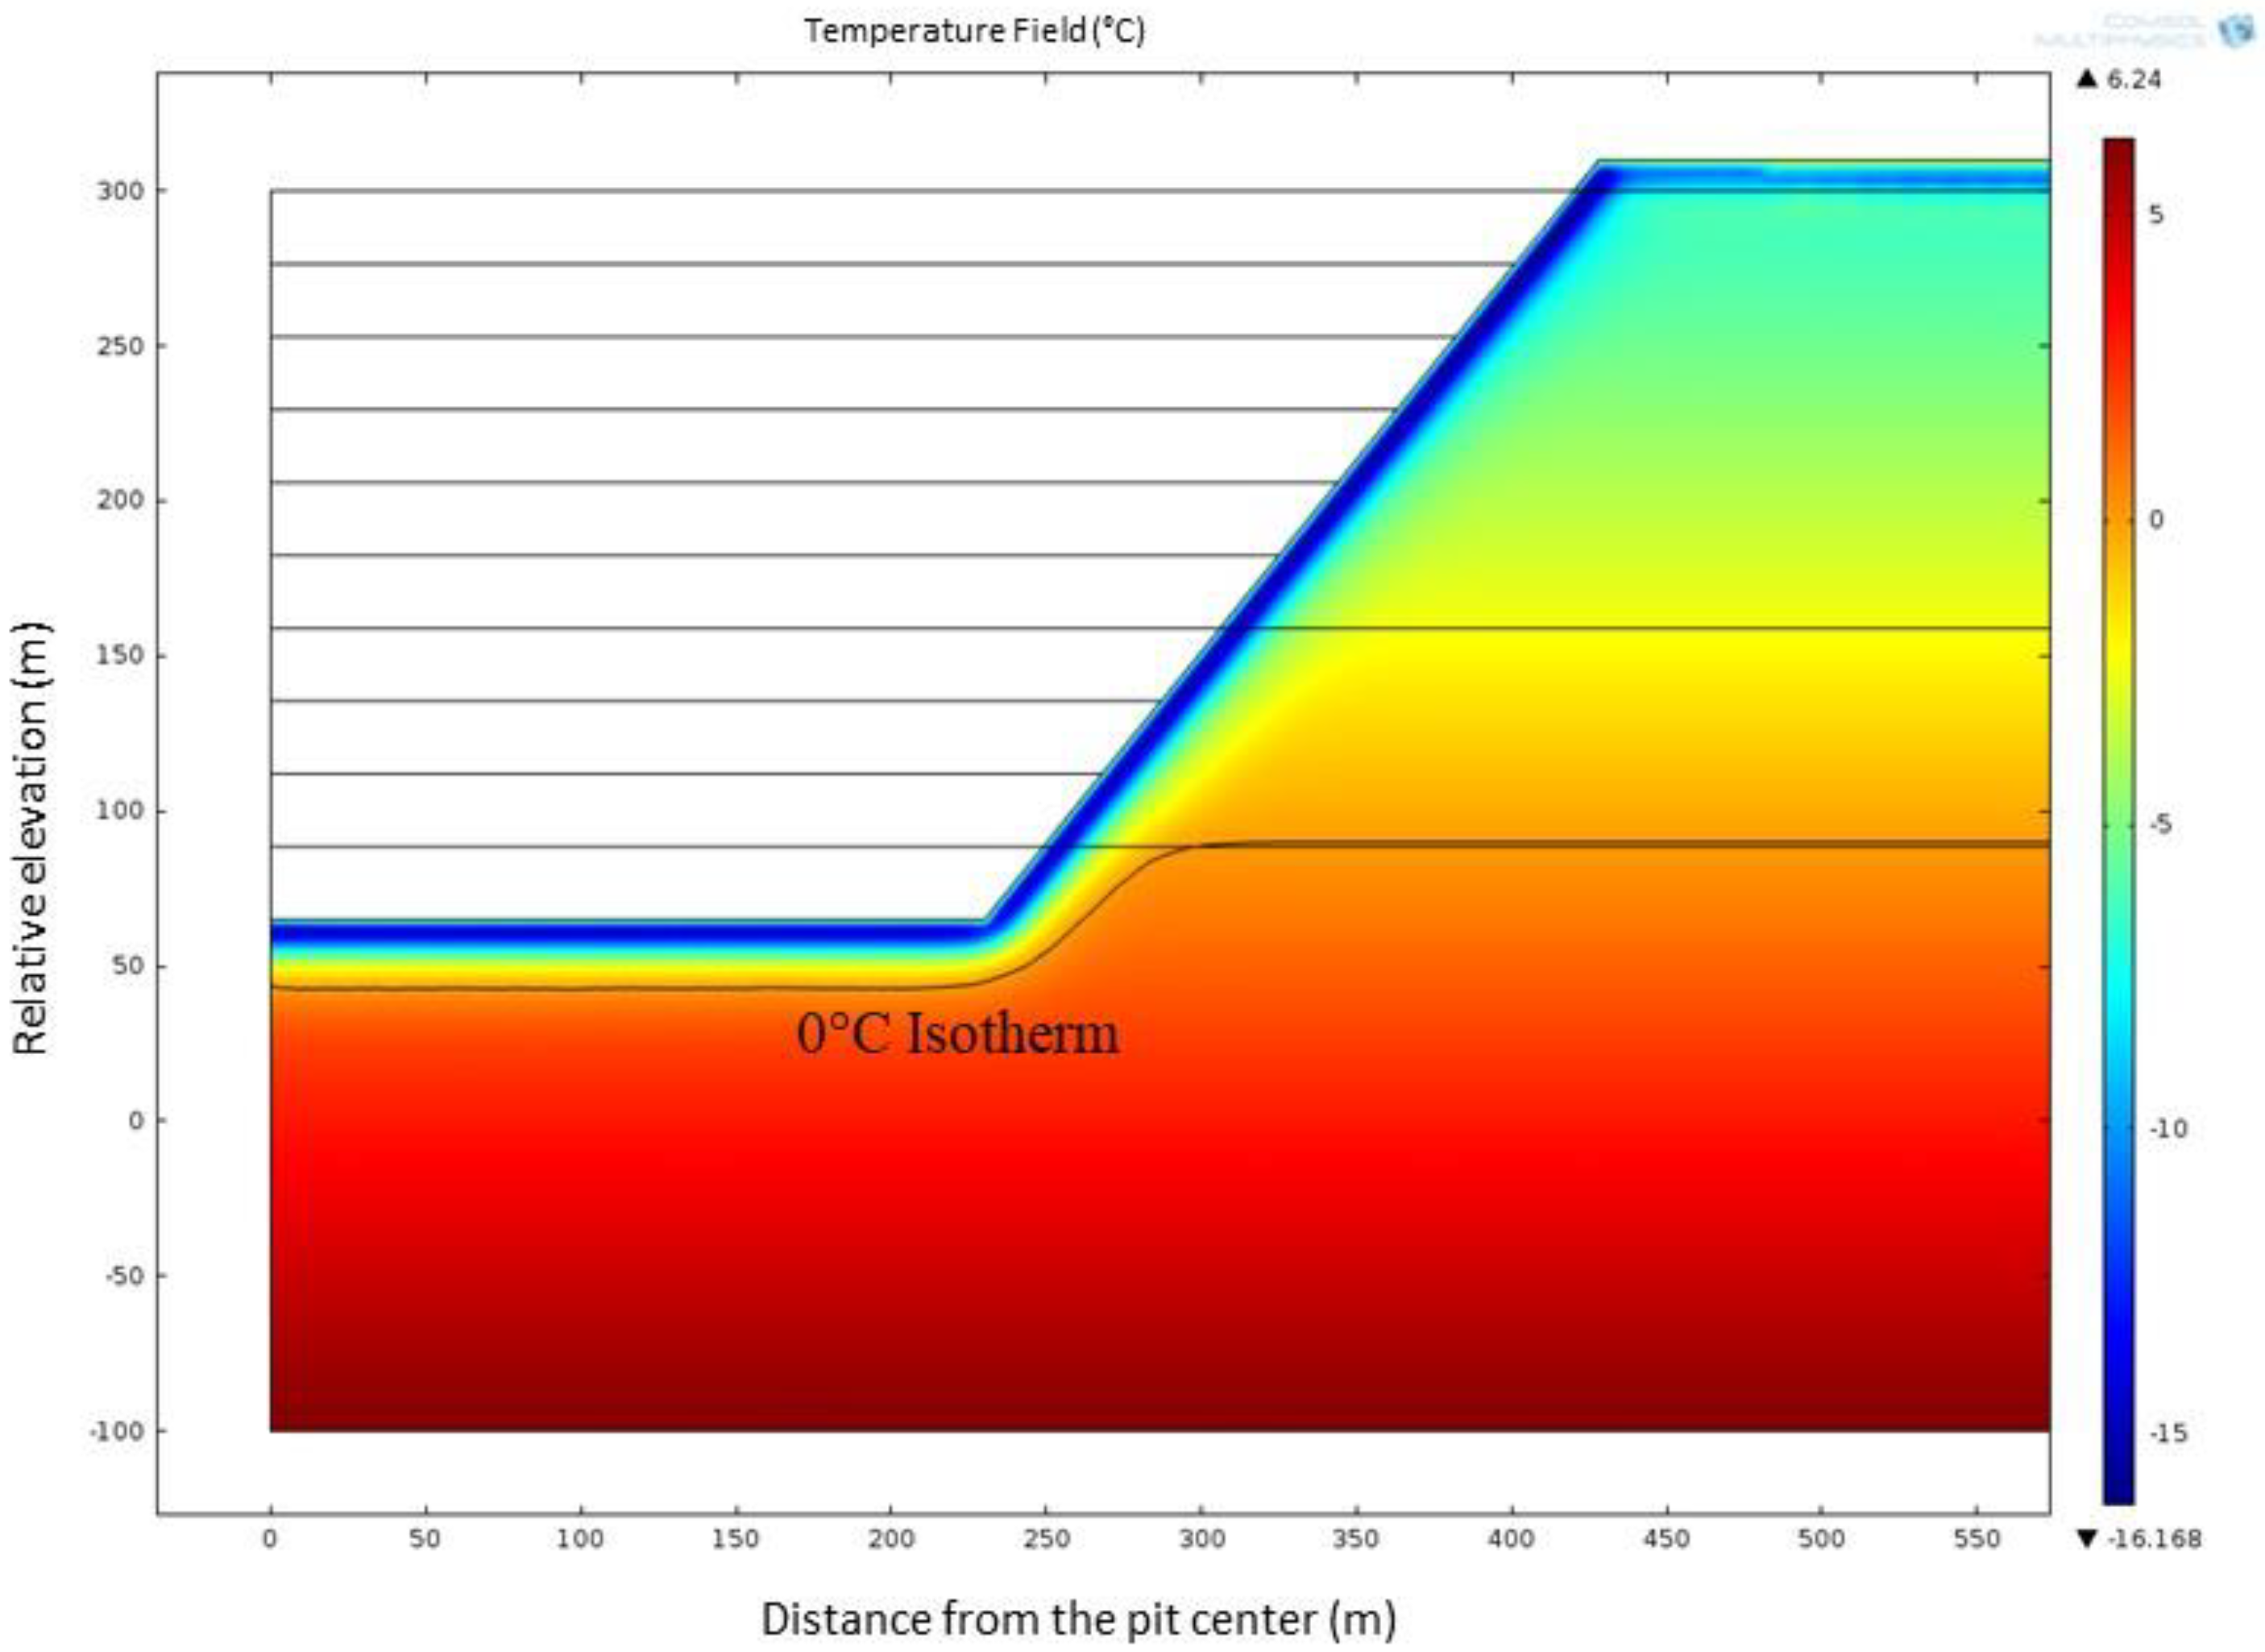
Figure 16.
Thermal regimes of the Main Zone TMF at different times after decommissioning ((a) 100 years, (b) 1000 years, (c) 2000 years).
Figure 16.
Thermal regimes of the Main Zone TMF at different times after decommissioning ((a) 100 years, (b) 1000 years, (c) 2000 years).

Figure 17.
Thermal profiles within the Center Zone TMF up to 2000 years after decommissioning (thermal profiles are plotted with a 100-year increase from right after decommissioning to 2000 years after decommissioning).
Figure 17.
Thermal profiles within the Center Zone TMF up to 2000 years after decommissioning (thermal profiles are plotted with a 100-year increase from right after decommissioning to 2000 years after decommissioning).

Figure 18.
Thermal profiles within the Main Zone TMF up to 2000 years after decommissioning (thermal profiles are plotted with a 100-year increase from right after decommissioning to 2000 years after decommissioning).
Figure 18.
Thermal profiles within the Main Zone TMF up to 2000 years after decommissioning (thermal profiles are plotted with a 100-year increase from right after decommissioning to 2000 years after decommissioning).

Figure 19.
The thermal profiles along section B-B (Center Zone TMF) and section C-C (Main Zone TMF) at 2000 years after decommissioning.
Figure 19.
The thermal profiles along section B-B (Center Zone TMF) and section C-C (Main Zone TMF) at 2000 years after decommissioning.

Figure 20.
Permafrost evolution within the Center Zone TMF up to 2000 years after decommissioning.


Table 1.
Air temperature data at the Kiggavik site, May to December 2009.
| Month | Warmest and Coldest Day in the Month | Mean Monthly °C | |||
|---|---|---|---|---|---|
| Extremes | Means | ||||
| Maximum °C | Minimum °C | Maximum °C | Minimum °C | ||
| May (a) | −0.9 | −18.9 | −7.4 | −12.0 | −9.6 |
| June | 20.8 | −6.6 | 8.4 | 0.2 | 4.6 |
| July | 22.4 | 1.3 | 16.3 | 6.6 | 11.7 |
| August | 22.3 | 0.3 | 14.2 | 5.5 | 9.8 |
| September (b) | 11.5 | 3.7 | - | - | - |
| October | 2.3 | −23.9 | −6.0 | −9.7 | −7.8 |
| November | −5.2 | −24.2 | −12.9 | −18.8 | −15.8 |
| December | −8.1 | −34.6 | −20.7 | −25.8 | −23.4 |
(a) May data was the mean for 7 May to 31 May 2009, (b) September data is limited to 1 September 2009.
Table 2.
Air temperature data at the Kiggavik site, January to August 2010.
| Month | Warmest and Coldest Day in the Month | Mean Monthly °C | |||
|---|---|---|---|---|---|
| Extremes | Means | ||||
| Maximum °C | Minimum °C | Maximum °C | Minimum °C | ||
| January | −8.3 | −33.9 | −22.0 | −28.1 | −25.2 |
| February | −11.8 | −39.1 | −22.7 | −27.6 | −25.1 |
| March | −5.8 | −31.9 | −15.4 | −21.1 | −18.2 |
| April | 0.6 | −19.4 | −5.5 | −10.6 | −7.9 |
| May | −1.2 | −17.1 | −5.7 | −10.1 | −7.7 |
| June | 18.7 | −5.4 | 7.5 | 0.8 | 4.4 |
| July | 23.8 | 2.7 | 17.2 | 8.2 | 12.9 |
| August (a) | 21.8 | 1.6 | 14.6 | 6.3 | 10.4 |
(a) August 2010 data is the mean for 1 August to 24 August 2010.
Table 3.
Proposed excavation and backfilling schedule.

 Not Excavated;
  Excavated;
  Backfilled with Tailings.
Table 4.
Proposed excavation and backfilling steps of three open pits.
| Open Pit | Excavation Duration (Year) | Proposed Excavation Steps | Proposed Backfilling Steps | Open Pit Depth (m) | Thickness of Excavation Layers (m) | Thickness of Backfilling Layers (m) |
|---|---|---|---|---|---|---|
| East Zone | 1 | 2 | 2 | 100 | 50 | 50 |
| Center Zone | 1 | 2 | 2 | 110 | 55 | 55 |
| Main Zone | 5 | 10 | 6 | 235 | 23.5 | 23.5 |
Table 5.
Thermal properties of materials.
| Material | Thermal Conductivity W/m·K | Volumetric Heat Capacity KJ/m3·K | Porosity | Volumetric Ice/Water Content % | ||
|---|---|---|---|---|---|---|
| Unfrozen | Frozen | Unfrozen | Frozen | |||
| Overburden | 1.90 | 2.00 | 1678 | 1565 | 0.20 | 5 |
| Metasediment | 2.90 | 2.97 | 1880 | 1812 | 0.03 | 3 |
| Granite | 2.97 | 2.99 | 1832 | 1810 | 0.01 | 1 |
| Tailings | 1.35 | 2.35 | 3055 | 1885 | 0.52 | 52 |
| Waste rock traffic | 1.56 | 1.86 | 2099 | 1722 | 0.30 | 18 |
| Waste rock | 0.82 | 0.86 | 1597 | 1471 | 0.30 | 6 |
© 2019 by the authors. Licensee MDPI, Basel, Switzerland. This article is an open access article distributed under the terms and conditions of the Creative Commons Attribution (CC BY) license (http://creativecommons.org/licenses/by/4.0/).
Share and Cite
MDPI and ACS Style
Booshehrian, A.; Wan, R.; Su, G. Thermal Disturbances in Permafrost Due to Open Pit Mining and Tailings Impoundment. Minerals 2020, 10, 35. https://doi.org/10.3390/min10010035
AMA Style
Booshehrian A, Wan R, Su G. Thermal Disturbances in Permafrost Due to Open Pit Mining and Tailings Impoundment. Minerals. 2020; 10(1):35. https://doi.org/10.3390/min10010035
Chicago/Turabian StyleBooshehrian, Ahmad, Richard Wan, and Grant Su. 2020. "Thermal Disturbances in Permafrost Due to Open Pit Mining and Tailings Impoundment" Minerals 10, no. 1: 35. https://doi.org/10.3390/min10010035
Note that from the first issue of 2016, this journal uses article numbers instead of page numbers. See further details here.