Surface Subsidence Prognosis above an Underground Longwall Excavation and Based on 3D Point Cloud Analysis


1
Faculty of Natural Sciences and Engineering, University of Ljubljana, 1000 Ljubljana, Slovenia
2
Premogovnik Velenje d.o.o., 3320 Velenje, Slovenia
*
Author to whom correspondence should be addressed.
Minerals 2020, 10(1), 82; https://doi.org/10.3390/min10010082
Submission received: 19 December 2019
/
Revised: 16 January 2020
/
Accepted: 17 January 2020
/
Published: 20 January 2020
(This article belongs to the Special Issue Selected Papers from the 7th International Symposium on Mining and Environmental Protection)
Abstract
:Impacts of underground mining have been reduced by continuous environmental endeavors, scientific, and engineering research activities, whose main object is the behavior and control of the undermined rock mass and the subsequent surface subsidence. In the presented Velenje case of underground sublevel longwall mining where coal is being exploited both horizontal and vertical, backfilling processes and accompanying fracturing in the coal layer, and rock mass are causing uncontrolled subsidence of the surface above. 3D point clouds of the study were acquired in ten epochs and at excavation heights on the front were measured at the same epochs. By establishing a sectors layout in the observational area, smaller point clouds were obtained, to which planes were fitted and centroids of these planes then calculated. Centroid heights were analyzed with the FNSE model to estimate the time of consolidation and modified according to excavation parameters to determine total subsidence after a certain period. Proposed prognosis approaches for estimating consolidation of active subsidence and long term surface environmental protection measures have been proposed and presented. The C2C analysis of distances between acquired 3D point clouds was used for identification of surface subsidence, reclamation areas and sink holes, and for validation of feasibility and effectiveness of the proposed prognosis.
1. Introduction
Environmental protection is becoming an integrated part of mining policies and technologies. Protecting the surface, its natural, economic, and other values from the effects of mining is an important part of ecological endeavors [1,2]. In addition to general degradation, mining production is increasingly moving to urban areas, where much more important infrastructure is at risk [3,4]. The mining organization is therefore obliged to implement direct protective measures on the surface or underground infrastructure and water regime within the exploitation area [5]. The measured displacements and deformation of the surface are legal proof of the incurred mining damage. Obtaining and analyzing these data is the starting point for evaluating the prognostic theories and their rational application. Mining damage is reflected on the surface in the form of subsidence troughs which are that part of the earth’s surface that has been transformed under the influence of mining [6,7,8]. A change in shape in the vertical direction (subsidence) is observed between the initial and final state of the surface when equilibrium in the undermined rock mass is reached. Intermediated states before equilibrium are defined as dynamic troughs [9]. The undermining process takes place in space and time, from the collapse of equilibrium in the rock mass at the time of excavation, during excavation, and even after the excavation has ended, until the asymptotic cessation of subsidence when equilibrium is restored [6,10,11,12].
Approaches with most practical value for subsidence prediction can be generalized to profile functions [13,14,15,16], influence functions [17,18,19,20], stochastic models [21,22], and numerical models [23,24,25]. In recent years, various modern approaches to the treatment of surface subsidence have been introduced, among which the cellular automata (CA) [26] and smoothing spline [27] theories should be mentioned. By means of profile functions the final shape of the surface subsidence trough is predicted in different profiles through the excavation area [5]. In order to determine the profile, it is necessary to know the values of the maximum subsidence, which is calculated using the technological parameters of the excavation, and some of the parameters specific to the shape of the trough [16]. In general, these methods are used in such a way that the unknown parameters in the equations are adjusted until the calculated function represented the best fitting curve compared to the real profile of subsidence trough observed in nature. A commonly known prognosis method for determining the effect of an elemental or differentially small underground excavation on the formation of a surface subsidence trough are influence functions. The combined impact of these elemental excavations represents the impact of the entire excavation field and enables the calculation of the shape of the final subsidence trough and its intermediate states [17]. The principle of such approaches is the functional relationship between surface subsidence and the height of the excavation or the displacements (convergence) of the rock mass directly above the excavation. Elemental subsidence increases to a total maximum value at the critical size of the excavation field (subsidence does not increase as the excavation continues to increase) [18]. In addition, the effect of full excavation within the impact cone of the critical surface is dependent on the depth of excavation. Intermediate or partial dynamic subsidence troughs transit into a definite static state or final trough [12]. Another approach are stochastic models of discontinuous media used to mimic what is happening during undermining, where the collapsing process of an undermined rock mass is considered a random process [21]. A stochastic medium is an infinite set of elements that move through mutual contacts under the influence of a field of (gravitational) forces. Solving such a system of elements with multiple degrees of freedom is very difficult using classical methods from mechanics, but results can be obtained with other methods. In practical terms, the stochastic model is also limited to the behavior of the undermined rock mass or soil bound to the observation area and in some cases requires verification with physical laboratory models [28,29].
The demand for local and time-varying mechanical properties of the undermined rock and coal mass has guided researchers to develop much more successful numerical models of continuum mechanics. With numerical analysis, using the finite element method in 2D or 3D space, results can achieve very good comparison to actual rock mass deformations around the longwall excavation [23,24] or to actual surface subsidence above it [25]. Though numerical modeling offers great potential of predicting subsidence with very good accuracy, their practicality is restricted by acquisition of necessary rock and coal mass mechanic characteristics. An alternative are rule-based models, such as cellular automata (CA), which advantages are shown in simple formulation and fast computations of complicated subsidence processes, allowing numerous simulations in a short time period. According to Sikora [26], application of cellular automata leads to results that are consistent with influence functions and stochastic models, making CA a practical approach with great expansion probabilities. A less extensive but efficient method was proposed by Orwat and Mielimaka [27], who used smoothing splines. Here, in addition to the measured data, a reliable prognosis is also needed to estimate future subsidence. On the basis of the averaged measured values and the predicted subsidence, an approximation of the surface subsidence and terrain inclination courses can be made.
The focus of our research was the development and demonstration of a nonexponential mathematical model, and practical verification based on field measurements and observations of various technological exploitation conditions. Some fundamental principles were taken into account: (i) Surface subsidence value is asymptotically ceasing to its final and maximum value; (ii) the shape of the predicted subsidence trough can be easily analyzed with profiles throughout the observation area; (iii) the behavior of surface subsidence process can be interpreted by stochastic analysis; (iv) the final subsidence trough form can be obtained by summing individual impacts of the excavation.
In this paper, we present a method for surface subsidence prediction based on statistical analysis of the measured surface subsidence and geometrical modifications within the technological parameters of the excavation. By combining these proven partial solutions, we tried to satisfactorily accurately solve the more complex problems of surface subsidence above longwall underground excavations, where coal is extracted both horizontally and vertically. In the presented case study, the observation area is subjected to the ongoing reclamation of the degraded terrain as the excavation progresses. Through the statistical analysis of such a stochastic process, a prediction of the time of consolidation was made, when further subsidence of the dumped soil (from terrain reclamation) is negligible. These calculations are possible for a single point on the surface observed in different epochs, where the object of study is the vertical coordinate of the point and the time of observation. Photogrammetric measurements with the help of an unmanned aerial vehicle (UAV) were used to acquire data in the form of a 3D point cloud of the surface observation area. To avoid numerous analyses of individual points in the cloud, the observation area was divided into several rectangular sectors of the same dimensions, each defined with its centroid to represent the impacts within the entire sector. By using rectangles instead of squares or triangles, the number of further computational steps along the length of the observed area was also significantly reduced. In the next step, planes were fitted to the data of all epochs within each sector and the plane centroids were calculated. Our proposed method allowed the point cloud to be reduced to a number of observation points (centroids) that can easily be studied. With the consolidation prognosis, an estimated time of active subsidence can be obtained and thus terrain reclamation can, to some extent, be controlled within sectors. The idea is to identify sectors that require additional soil dumping to achieve the estimated consolidation. In order to predict surface subsidence that occur under the influence of underground excavation by vertical extraction, we considered the real excavation height in each centroid above the excavation. Starting from the theoretical assumptions regarding the maximum subsidence over the excavations with vertical coal extraction, determination of total subsidence was made. Both the proposed consolidation and total surface subsidence prognosis can be used in the profile, point cloud or sector comparison, giving a concrete and valuable insight of surface subsidence caused by underground mining. A 3D point cloud comparison was also done to observe the intensity of the subsidence and identify sinking holes or areas of soil dumping.
2. Materials and Methods
2.1. Observation Area and Monitoring Data
The coal or lignite layer in the Šalek valley is located in north-eastern Slovenia, with a maximum thickness of 168 m and an average thickness of 60 m. The deposit is in the form of a lens, 8.3 km long, 2.5 km wide, and 200–500 m deep [30]. These natural conditions lead to the development of an original excavation method called the Velenje mining method (VMM) [23,24]. Excavating with VMM increases the coal extraction beyond the protected space at the excavation site and takes advantage of natural forces of fracturing to crush the coal layer. The excavation front is divided into horizontal extraction or the lower part of the excavation, 3–7 m in height, and vertical extraction above the excavation up to a height of more than 30 m. Vertical extraction height is dependable on the thickness of the upper clay layer. Lower part of the excavation space is protected with a hydraulic supporting system allowing mechanized exploitation in a horizontal direction with simultaneous release of fractured coal from above the supported space onto the chain conveyor (Figure 1). After the completion of the excavation of several excavation fields in one longwall panel, the opening and subsequently the extraction of coal in the next, the lower level excavation field within the lower longwall panel will begin.
The observation area is located within the southern part of the Velenje coal mine (VCM) area of exploitation, between Lake Šoštanj and Lake Velenje (Figure 2). The lakes are at different levels and in order to prevent their spillage and thus ensure the stability of the wider area, an artificial barrier between the lakes or the embankment is regularly maintained. Maintenance of this embankment is a priority, as it is located above a very active part of the exploitation area and is constantly under the direct influence of mining induced subsidence. The level of the embankment is kept at a constant level by simultaneous terrain reclamation in the form of soil and ash mixture that are dumped at critical areas to maintain stability.
Monitoring was conducted using photogrammetry in a combination with an UAV. To acquire as accurate 3D point clouds as possible, in each epoch ground control points (GCPs) were distributed on the surface of the study area and their positions were recorded by using the GNSS (global navigation satellite system) surveying method. Point clouds were calculated with the use of an aerial image processing software 3D survey v 2.3.7. This was done with dense image matching algorithms, that is an automatic process of recognizing the same details in multiple oriented photos. Points of such clouds include the vegetation, so the photogrammetric cloud has no information about the surface below the vegetation. In the case of smaller areas of low vegetation, individual sites were marked and vegetation subsequently removed during the classification process. The surface point of these sites were then interpolated with the flattened function [31]. On flight heights of approximately 120 m a 3D point cloud of 4,837,195 points was obtained for each of nine epochs. Including the measurements carried out in the initial epoch 0, ten 3D point clouds were obtained for the 529 m long and 263 m wide (W) observation area (Figure 3). Accuracy of the generated point cloud data was observed through the average mean error in x, y, and z directions (Table 1).
A longwall panel with the final length of 306.4 m (L), width of 168.5 m (W), and at depth of approximately 370 m depending on the variable elevation of the above terrain, was studied in partially excavated spaces. The length of each partial excavation corresponds the excavation progress from the start (initial epoch) to the time of each further epoch. A total of nine segments were observed where the excavation height, both horizontal (designed) hP and vertical hv, were measured at 17 points across the excavation front at every epoch (Figure 4). Total excavation heights (hv + hp) are presented in Table 2.
At each epoch, areas of intense terrain reclamation were identified based on visual observations. In total, three areas were identified, as shown in Figure 5. The findings were taken into account when analyzing the actual data in the form of point cloud comparisons.
The time-table of surface and excavation measurements (epochs), as well as the measured lengths of the excavated space L at every epoch are given in Table 3.
2.2. Sectors Layout and Plane Fitting
Figure 6 illustrates the layout of the sectors in the observation area. To achieve this, the observation area was evenly divided into 10 partitions in length using lines in NE or SW direction, and five partitions in width using lines A0 to A5. The intersections of the defined lines represent 65 vertices by which we defined 50 sectors and calculated the centroid of each sector. As the centroid point represents an overall impact of the observed sector, being the geometric center of the vertex points, all the centroids could be used as a grid for further subsidence prognosis.
Using the collinear properties of the centroids, profiles were constructed in both the length and width of the excavation allowing the analysis of surface subsidence across 15 profiles (Figure 7). The analysis results and findings of the highlighted profiles (in color red) Cw7 and CL3 are presented in this paper.
To calculate the sector centroids from the actual measurement data, planes were fitted to the 3D point clouds of all epochs within each sector. The best fitted plane was determined by calculating three eigenvectors and their corresponding eigenvalues. Each eigenvector represents a normal to one of three planes whose common point is the point cloud centroid, while the eigenvalues are the sum of squared distances between the points and each plane. The eigenvector corresponding to the minimum eigenvalue defines the best fitting plane [32]. For each fitted plane a centroid was calculated and the height coordinates were used in further subsidence analysis. Values of the centroids on profile lines Cw7 and CL3 are presented in Table 4.
2.3. Overview of the FNSE Theory (Consolidation Prognosis)
The need for a time function model that accommodates subsidence nonlinearity has been a necessity in surface monitoring improvement within the exploration area of the VCM. The four parametric FNSE model has been successfully applied to optimize monitoring in old mining areas, at locations with less intensive subsidence processes and minor terrain reclamation [33]. FNSE is a product of various modifications of an unexponential algebraic sigmoid function, thus the fitting of the FNSE is much easier compared to similar exponential functions. To produce a prognosis of surface subsidence over an underground excavation, until the time of consolidation the FNSE model is given by [34].
where parameters a and b are the upper and lower asymptote values (if a < b), p is the abscise coordinate of the point of influence, s is the abscise scale parameter, and t is the time variable. Fitting of the model to the centroid data was obtained by minimizing the sum of all squared errors SSE = minΣei2 to determine the values of the parameters that define the best fitted model [35].
The concept of estimating the time of consolidation on the basis of the fitted FNSE model is illustrated in Figure 8.
By extrapolating the fitted model after the time of last epoch (a) and taking into account the monitoring conditions δ < ΔH and δ ≥ ΔH, the time of consolidation (b) was estimated with a decision algorithm. By default, in the critical observational area (embankment) the allowed maximum subsidence δ is 0.001 m. Any values beyond 1 mm are considered as active subsidence. In each algorithm iteration the active subsidence conditions are checked until the change in the ordinate value ΔH is smaller or equal to 0.001 m. Then, consolidation occurs and further subsidence is negligible.
2.4. Categorization Method
As the area under observation was undergoing terrain reclamation, the consolidation prediction model, in combination with the sectors layout, also made it possible to categorize the terrain (sectors) based on the predicted maximum value of subsidence. In the VCM embankment and simultaneous terrain reclamation area, a categorization of the terrain, which would in any way serve to control or direct the reclamation, has not yet been established. We therefore proceeded from the categorization of mining damage and adjusted the values of permissible surface deformations to the vertical component (subsidence), which are given in Table 5.
Category approach is applied to determine necessary measures in the form of sector terrain reclamation and thus providing a robust maintenance plan for the embankment. In a category I sector further reclamation is not needed. A category II sector requires a small-scale reclamation, meanwhile the category III sector is under the influence of larger subsidence and requires intense terrain reclamation. The final category IV defines a sector where intense terrain reclamation is needed and a chance for sinkhole occurrence exists.
2.5. Final Subsidence Prognosis
One of most important technological parameters of the excavation, directly influencing the height of the undermined rock mass movements, is the excavation height. In previous studies, it was established that the maximum surface subsidence is equal to the vertical excavation height [16]. Thus, either the designed (horizontal) height or a 1.5 to 2.2 larger value, representing the projected vertical exploitation height, is used to predict the final shape of the subsidence trough. The result of such an approach is a flat bottom of the calculated subsidence trough. In practice, the excavation height is not constant and the resulting surface subsidence trough has an uneven bottom. Where vertical extraction in one cut of the coal layer exceeds the average height, sinking holes may also appear on the surface within the subsidence trough.
For final subsidence prediction we used the real excavation heights measured in each epoch. Taking into account the course of subsidence development, a 75% amount of total subsidence will occur after the first year of mining and another 15% after the second year [6]. Prognosis of final subsidence was performed by using the centroids directly above the excavation and adjusting their height by H0–0.75hv or H0–0.9hv, where H0 is the initial centroid height (in initial epoch) and hv is the measured vertical excavation beneath the same centroid.
2.6. 3D Point Cloud Analysis
Verification of surface subsidence areas and intensity, as well as identification of terrain reclamation and sinkholes, was performed by the 3D point cloud analysis. Using an open source free software CloudCompare v2.9.1, the distance differences (subsidence or terrain elevation) between two-point clouds in two different epochs were computed and visualized. The purpose was to compare the category approach to the actual terrain situation. The analysis was performed with nearest neighbor cloud-to-cloud comparison (C2C), through setting the initial epoch as the reference cloud for each comparison. The calculated centroids for the consolidation and final subsidence prognosis were also compared to the initial epoch via the C2C analysis.
3. Results
3.1. Plane-Fitting Results
Plane-fitting results for each sector are shown in Figure 9 and Figure 10. In Figure 9 all of the fitted planes are presented with a five-times scaled z-axis for better visualization. Each planes layout is defined by a color related to the epochs as follows: Initial epoch 0—grey, epoch 1—red, epoch 2—blue, epoch 3—orange, epoch 4—darker green, epoch 5—magenta, epoch 6—lighter green, epoch 7—brown, epoch 8—pink, and the last epoch 9—darker yellow.
Figure 10 shows the compared fitted planes layout between the initial and last epoch. Distances between centroids of the two planes layout are marked with red line segments.
3.2. Prognosis by Profiles
In the observed area two representative profiles Cw7 and CL3 were selected to present surface subsidence characteristics at different epochs, including the consolidation and total subsidence prognosis (Figure 11, Figure 12, Figure 13 and Figure 14).
Centroid height by Cw7 and CL3 profiles with respect to the FNSE model consolidation prognosis and assumption of 75% and 90% of the final subsidence value, respectively, are given in the Table 6.
The consolidation prognosis for the intersection of profiles Cw7 and CL3, which is centroid C33, is shown in Figure 15. According to the estimated parameters a→301.410, b→281.670, s→131.766, and p→50.019, the active subsidence period will last for 559 days from the last epoch on day 180 (1). The extrapolated height for centroid C33 when consolidation is reached (2), 739 days from the initial epoch (day zero) is 281.805 m. Based on the fitted FNSE model an amount of 0.088 m subsidence will occur during the active subsidence period.
3.3. Terrain Categorization
Consolidation prognosis of all 50 centroids, according to Table 5, enabled the categorization of terrain under observation. The category of each sector can be seen in Figure 16, where category I sector (color green) is defined by ΔH ≤ 1 m, category II (color yellow) by ΔH ≤ 3 m, category III (color orange) by ΔH ≤ 6 m, and category IV (color red) by ΔH > 6 m.
3.4. C2C Analysis of Monitoring Data
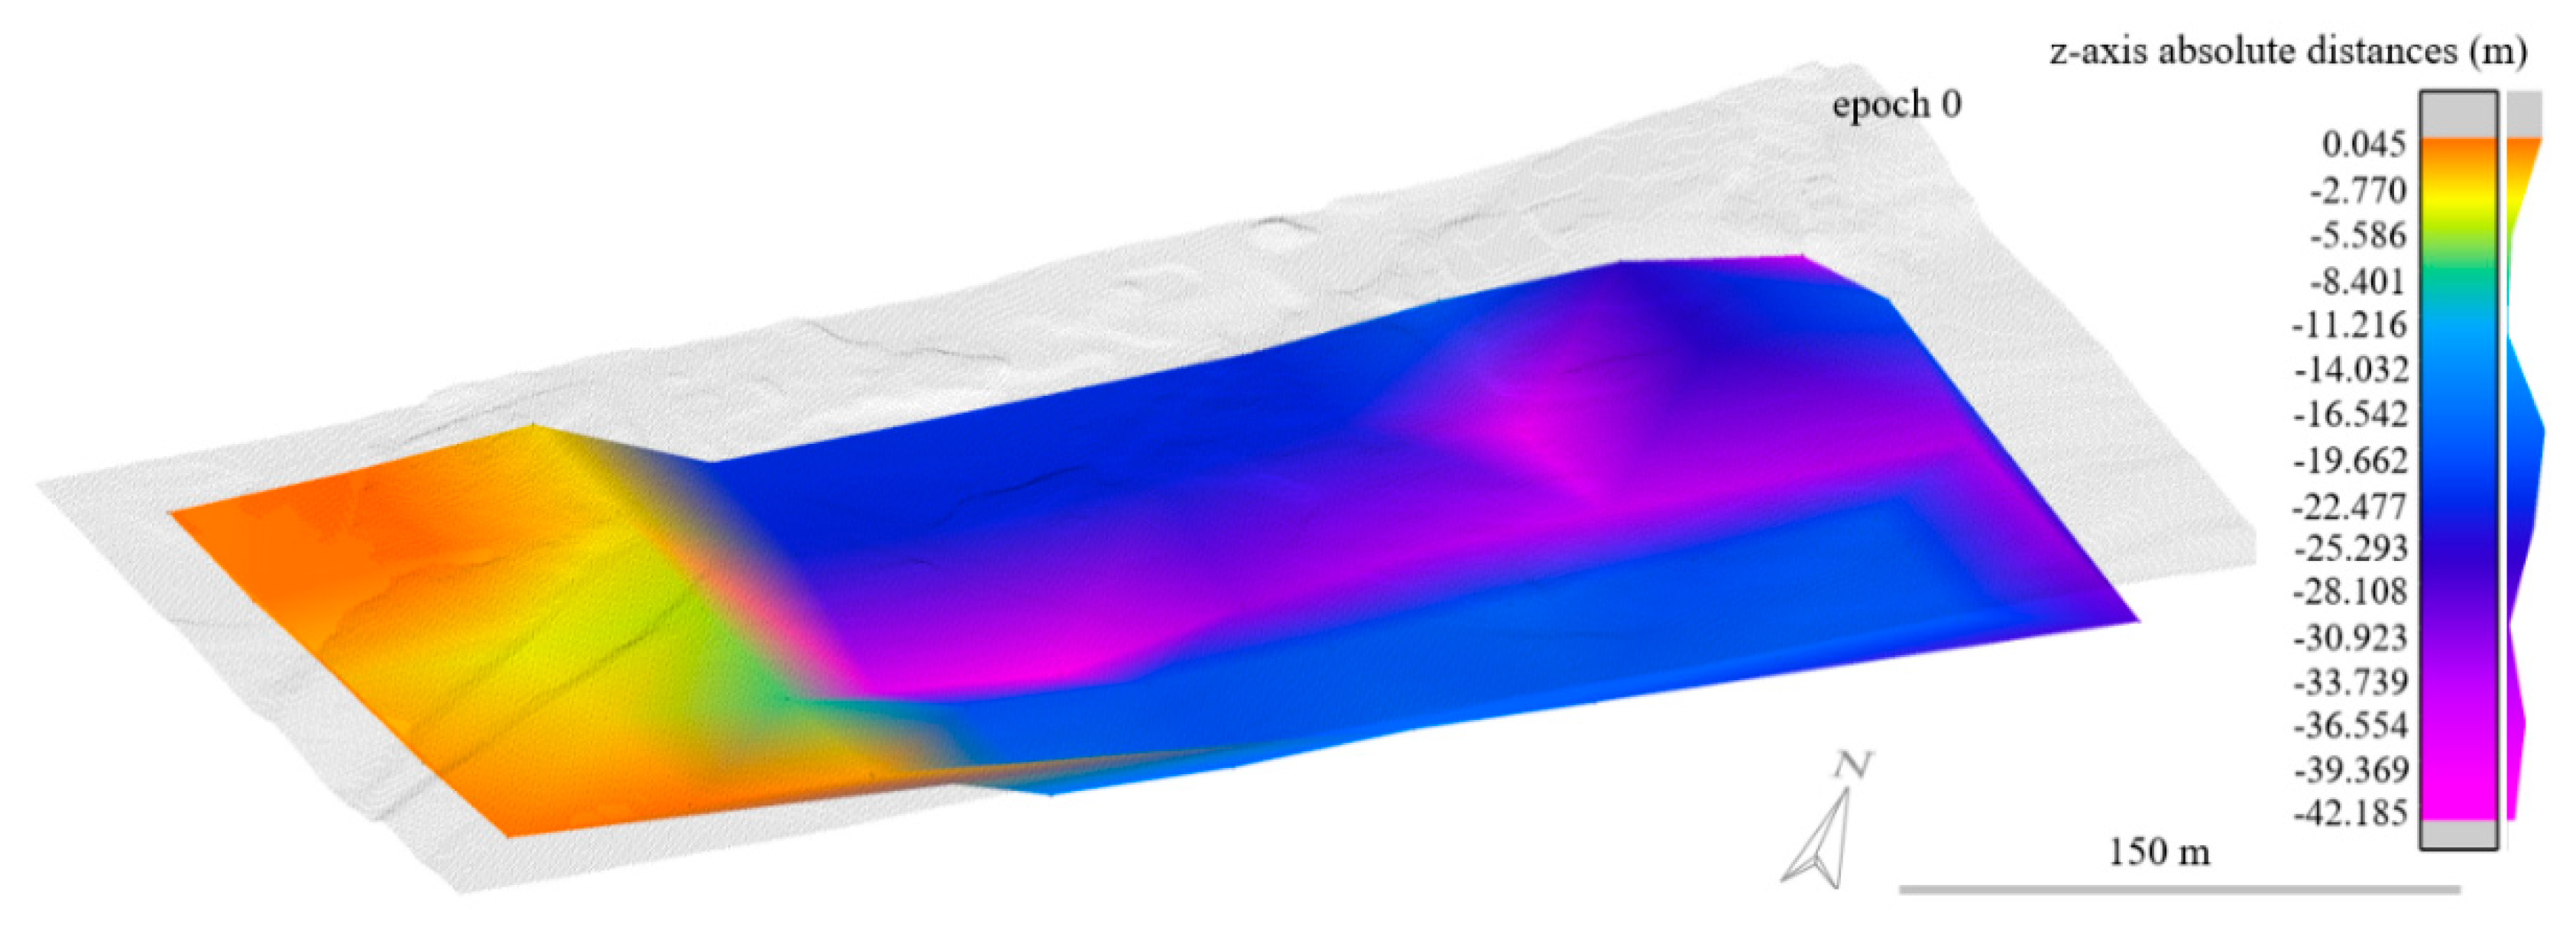
The 3D point cloud acquired in the initial epoch on 2 February 2017 was selected as the reference cloud in each cloud-to-cloud comparison. Nine C2C analysis were performed by comparing point clouds of each epoch (1–9) to the reference cloud. The absolute distances between each pair of point cloud along the z-axis are shown in Figure 17, Figure 18 and Figure 19. In order to confirm visual observations of terrain reclamation, areas of intense reclamations (1, 2, and 3) are marked as well.
4. Discussion
To study surface subsidence caused by mining in VCM, we used ten 3D point clouds acquired with UAV photogrammetric monitoring from 2 February to 1 August 2017 (Table 3). In ten epochs, including the initial, vertical excavation heights were measured in 17 points along the excavation face (Figure 4 and Table 2). During monitoring and simultaneously as excavation progressed, ongoing reclamation of the degraded terrain was visually inspected and identified areas of intensive soil dumping were recorded (Figure 5).
Each obtained point cloud consisted of 4,837,195 points, so the observation area was divided into 50 sectors with dimensions of 52.6 × 52.9 m2 (Figure 6a). By breaking the cloud into smaller parts, we obtained 50 points clouds per epoch, each with 96,944 points. Sector vertex points coordinates were used to calculate the centroid of each sector (Figure 6b). With the centroids, five profiles across the width (Figure 7a) and ten across the length (Figure 7b) of the observation area were defined. Thus, allowing surface subsidence visualization and analysis by profiles. The centroid, being a geometrical center of the belonging sector, describes the occurred subsidence within the entire sector with one value, the height. To obtain centroid heights, planes that best fitted the according 3D point cloud were calculated along with their vertices and centroids. Fitted planes layouts were spatially observed with a five times larger z-axis scale (Figure 9) and the layout of initial epoch was compared to the layout of last epoch (Figure 10). Distances between centroids of both layouts are marked with red line segments to highlight the centroid height difference (subsidence or elevation). Two representative profiles Cw7 and CL3 were selected to show centroid points and their subsidence characteristics at different epochs (Table 4).
The research task included the development of a predictive subsidence model of any observation point on the surface, which is influenced by underground mining and constant terrain reclamation, and the determination of the total impact of exploitation. After a critical review of modeling approaches, where the adaptability of mathematical models to real data was evaluated, we decided on a stochastic analysis using the FNSE model (Equation (1)). By fitting the model to a fixed number of observation points at which the subsidence dynamics is interpolated within the precision limits, the time and amount of active subsidence were extrapolated. Additionally, using the consolidation prognosis (Figure 8) the time of consolidation was estimated. Centroid subsidence value, predicted to occur during active subsidence period, was then used to categorize each sector. An example of a consolidation prognosis of centroid C33 is shown in Figure 15, where it was calculated that, by the time of consolidation, occurred subsidence value from initial epoch will be 6.233 m. From last measurement to predicted time of consolidation, the subsidence of value 0.088 m is expected. Consolidation prognosis does not take into account the technological parameters of the excavation, and since it is known from practice that surface subsidence above the excavation will continue to occur for a longer duration, we used the predicted subsidence dynamics to categorize surface areas according to the degree of reclamation required to maintain terrain levels until consolidation time is reached. For centroid C33 the estimated subsidence exceeds the value of 6 m and so sector 7-3 falls into category IV. Meaning that intensive terrain reclamation in the form of soil dumping and stiffening is required in sector 7-3 to limit further active subsidence within an estimated value of 0.088 m. Categorization of the overall layout of the sectors is shown in Figure 16.
By introducing the technological parameters of the excavation into the prognosis, a prediction of total subsidence in one and two years after the completion of excavation was also carried out. In this approach, we focused only on the centroids above the excavation area. Considering that 75% (one-year prediction) and 90% (two-year prediction) of the total excavation height represent the maximum draft, the initial centroid heights were modified by H0–0.75hv or H0–0.9hv. Assessing the final state, a rough assumption was made on how much subsidence is expected in the coming years and how much material is needed to maintain terrain level during active subsidence period.
Calculated centroid heights based on actual data, estimated heights at time of consolidation, and final subsidence along profiles Cw7 and CL3 are shown in Figure 11, Figure 12, Figure 13 and Figure 14. Calculated values are also presented in Table 6. Comparing the calculated height of the centroids and the estimated consolidation, we can see that the trend is well matched. Due to terrain diversity, ongoing reclamation, and variable excavation heights, the bottom of the developed subsidence trough is not flat or the maximum subsidence is not constant. Figure 12 shows agreeable consolidation prognosis of centroids directly above the excavation (C23, C28, C33, C38, C43, C48) and according to calculated heights in the last epoch. With exceptions of centroids C3, C8, C13, and C18, where some deviations can be noted. The reason for this is the influence of a previously mined longwall panel on a higher level located more to the south of the observed excavation. Which is also reflected in intensive terrain reclamation operations in area (3) shown in Figure 5. The CL3 profile in Figure 12 shows that the terrain level between the C3 and C13 centroids was maintained at a constant level, but due to enhanced subsidence, the terrain is much lower in the last epoch. Therefore, the consolidation prognosis for this area (3) also included the long-term impacts of a previously mined longwall panel. Estimated centroid heights at the time of consolidation can then be accepted as final heights, supposing total subsidence of a previous excavation in this area has been reached. For all remaining centroids located northeast of the Cw3 profile (Figure 7a), the heights were modified to enable determination of 75% and 90% of total subsidence. Total subsidence prognosis along profiles Cw7 and CL3 is shown in Figure 13 and Figure 14. Estimated centroid heights using the consolidation and total subsidence prognosis were analyzed with CloudCompare. This made it possible to compare the results of both approaches to the 3D point cloud of the initial epoch and calculate the volume between consolidated terrain and final terrain (Figure 20, Figure 21 and Figure 22).
Results of the C2C analysis of 3D point cloud from the initial epoch and the estimated consolidated heights of the centroids (meshed) indicate that a sinking hole may occur in the northern part (a) of the observation area (darker blue) and an increase of subsidence in zones (b) and (c) (Figure 21). At the same time, we see that there is a correlation between the color pattern of the C2C analysis and sectors layout categorization (Figure 16).
The results of the analogue C2C analysis for the determined 75% value of the total subsidence, which is to take place in the first year after the end of the excavation, i.e., at a similar time as the consolidation is to be achieved, are shown in Figure 22. It can be observed that, considering the real excavation height, the bottom of the surface subsidence trough cannot be flat if the excavation height is not constant. The largest subsidence will occur in the middle and along the length of the excavation, where the excavation height is maximum (Figure 4). The smallest elevation changes are in the area that is not covered by the total prognosis (red-yellow). The volume between consolidated and final terrain is 733,825 m3, which provides a robust assumption of the material that will be required for ongoing reclamation.
In order to verify the proposed prognosis or categorization approaches, nine different cloud comparisons were generated by using UAV photogrammetric data (Figure 17, Figure 18 and Figure 19). Four sinking holes were identified when comparing point clouds from the initial and last epochs (Figure 19c). Depending on the estimated consolidation, the S1 sinking hole in zone (a) (Figure 21) can be confirmed. Sinking holes S3 and S4 lie in areas of increased subsidence (b), while S2 was not detected. By observing the categorized sectors layout in Figure 16 and the results of the C2C analysis, the correlation between actual subsidence and sector categories can be observed. Where actual subsidence is greater, the categories of sectors are higher and vice versa.
5. Conclusions
The main findings of this work, of theoretical and practical importance, can be summarized in the following conclusions:
- (1)
- Reliable and technically acceptable accurate prognosis of surface subsidence is only possible through concrete monitoring. Due to their special and general importance, prognosis approaches are covered by mining laws and technical regulations, due to broader social or ecological needs, as well as the profession itself.
- (2)
- Inclusion of 3D point clouds in the prediction model means a different and more complete approach to solving the problem of surface subsidence. Dividing bigger 3D point clouds into smaller ones and establishing a sectors layout within the observation area enables plane-fitting to point clouds of each sector. Using centroids, calculated for every plane in all epochs, subsidence prognosis can be applied on any point in the centroid layout. The approach with sectors and centroids enabled control and predictions of the subsidence trough along profiles in the length and width of the excavation.
- (3)
- Use of the FNSE model to predict the time of consolidation and estimate active subsidence value made it possible to produce terrain reclamation categorization based on the layout of sectors in the observational area. This, from the point of view of the practical application, provides the necessary information for the qualitative determination of the intensity and location of the required reclamation of the terrain, which must be maintained to ensure the stability of the observation area (embankment).
- (4)
- Considering that the actual excavation height of a point represents the maximum subsidence of that same point on the surface above excavation, the initial heights of the centroids can be adjusted for this value. Reducing initial heights determined total subsidence that will occur in a longer period, after excavation operations come to a stop.
- (5)
- A spatial representation of the distribution of centroids, when consolidation has been achieved or total subsidence have occurred, gives comprehensive information on the predicted subsidence trough, both in geometric and value terms. Giving an insight into the consolidated and final state of the terrain, the reclamation can be suitably adapted to the expected volume loss. A C2C analysis of the predicted consolidation values and the determined one-year centroid height values, gave an approximation of volume loss of the order of 733.825 m3.
- (6)
- Comparing actual 3D point clouds, obtained from monitoring, provides a method for quantifying occurred subsidence and terrain elevations between two epochs. Verification of terrain height changes by epochs, when initial cloud in the reference of comparison, lead to identification of subsidence, terrain reclamation areas, and sinking holes. The C2C analysis was conducted in CloudCompare 2.9.1 and overlapped with records of intense reclamation areas and excavation progress drawings.
The proposed method provides a basis for further research of surface subsidence above underground excavations where terrain reclamation carries out simulations as excavation progresses. The whole prognosis is based on several steps or approaches and by using only surface monitoring data and excavation technological parameters, undependable of any natural parameters. The application is feasible in other areas with different excavation methods.
Author Contributions
Conceptualization, A.P. and M.V.; Formal analysis, A.P.; Investigation, J.R.; Methodology, M.V.; Writing—review and editing, A.P. All authors have read and agreed to the published version of the manuscript.
Funding
The APC was funded by the Slovenian Research Agency, Young Researcher grant (1000-15-0510).
Acknowledgments
This study was conducted with the support of the research program P2-0268 and the Slovenian Research Agency. The authors are grateful to Premogovnik Velenje for their help during data acquisition. We would also like to thank the reviewers and members of the editorial team for their comments.
Conflicts of Interest
The authors declare no conflict of interest.
References
- Huang, J.; Tian, C.; Xing, L.; Bian, Z.; Miao, X. Green and sustainable mining: Underground coal mine fully mechanized solid dense stowing-mining method. Sustainability 2017, 9, 1418. [Google Scholar] [CrossRef] [Green Version]
- Zhu, X.; Guo, G.; Liu, H.; Yang, X. Surface subsidence prediction method of backfill-strip mining in coal mining. Bull. Eng. Geol. Environ. 2019, 78, 6235–6248. [Google Scholar] [CrossRef]
- Can, E.; Kuşcu, T.; Mekik, C. Determination of underground mining induced displacements using GPS observations in Zonguldak-Kozlu Hard Coal Basin. Int. J. Coal Geol. 2012, 89, 62–69. [Google Scholar] [CrossRef]
- Zhang, Z.; Wang, C.; Tang, Y.; Zhang, H.; Fu, Q. Analysis of ground subsidence at a coal-mining area in Huainan using time-series InSAR. Int. J. Remote Sens. 2015, 36, 5790–5810. [Google Scholar] [CrossRef]
- Kratzsch, H.A. Mining Subsidence Engineering; Springer: Berlin, Germany, 2007. [Google Scholar]
- Whittaker, B.N.; Reddish, D.J. Subsidence: Occurence, Prediction and Control; Elsevier: Amsterdam, The Netherland, 1989. [Google Scholar]
- Ren, F.; Zhang, D.; Cao, J.; Yu, M.; Li, S. Study on the Rock Mass Caving and Surface Subsidence Mechanism Based on an in Situ Geological Investigation and Numerical Analysis. Math. Probl. Eng. 2018. [Google Scholar] [CrossRef]
- Bell, F.G.; Stacey, T.R.; Genske, D.D. Mining subsidence and its effect in the environment: Some differing examples. Environ. Geol. 2000, 40, 135–152. [Google Scholar] [CrossRef]
- Li, L.; Wu, K.; Zhou, D.W. AutoCAD-based prediction of 3D dynamic ground movement for underground coal mining. Int. J. Rock Mech. Min. Sci. 2014, 71, 194–203. [Google Scholar] [CrossRef]
- Luo, Y. Systematic approach to assess and mitigate longwall subsidence influences on surface structures. J. Coal Sci. Eng. 2008, 14, 407–414. [Google Scholar] [CrossRef]
- Yan, W.; Chen, J.; Yan, Y. A new model for predicting surface mining subsidence: The improved lognormal function model. Geosci. J. 2019, 23, 165–174. [Google Scholar] [CrossRef]
- Lian, X.G.; Jarosz, A.; Saavedra-Rosas, J.; Dai, H.-Y. Extending dynamic models of mining subsidence. Trans. Nonferr. Met. Soc. China 2011, 21 (Suppl. 3), s536–s542. [Google Scholar] [CrossRef]
- Kumar, R.; Singh, B. Mine subsidence investigations over a longwall working and the prediction of subsidence parameters for Indian mines. Int. J. Rock Mech. Min. Sci. 1973, 10, 151–172. [Google Scholar] [CrossRef]
- Bahuguna, P.P.; Srivastava, A.M.C.; Saxena, N.C. A critical review of mine subsidence prediction methods. Min. Sci. Technol. 1991, 13, 369–382. [Google Scholar] [CrossRef]
- Asadi, A.; Shahriar, K.; Goshtasbi, K.; Najm, K. Development of a new mathematical model for prediction of surface subsidence due to inclined coal-seam mining. J. S. Afr. Inst. Min. Metall. 2005, 105, 15–20. [Google Scholar]
- Medved, M. Prispevek k Poznavanju Degradacije Okolja Pri Jamskem Pridobivanju Debelih Slojev Premoga. Ph.D. Thesis, Faculty of Natural Sciences and Engineering, Ljubljana, Slovenia, 1994. [Google Scholar]
- Sheorey, P.R.; Loui, J.P.; Singh, K.B.; Singh, S.K. Ground subsidence observations and a modified influence function method for complete subsidence prediction. Int. J. Rock Mech. Min. Sci. 2000, 37, 801–818. [Google Scholar] [CrossRef]
- Luo, Y.; Cheng, J.W. An influence function method based subsidence prediction program for longwall mining operations in inclined coal seams. Min. Sci. Technol. 2009, 19, 592–598. [Google Scholar] [CrossRef]
- Ren, G.; Whittaker, B.N.; Reddish, D.J. Mining subsidence and displacement prediction using influence function methods for steep seams. Min. Sci. Technol. 1989, 8, 235–251. [Google Scholar] [CrossRef]
- Polanin, P. Application of two parameter groups of the Knothe–Budryk theory in subsidence prediction. J. Sustain. Min. 2015, 14, 67–75. [Google Scholar] [CrossRef] [Green Version]
- He, C.; Xu, J.; Wang, F.; Wang, F. Movement boundary shape of overburden strata and its influencing factors. Energies 2018, 11, 742. [Google Scholar] [CrossRef] [Green Version]
- Ghabraie, B.; Ren, G.; Barbato, J.; Smith, J.V. A predictive methodology for multi-seam mining induced subsidence. International J. Rock Mech. Min. Sci. 2017, 93, 280–294. [Google Scholar] [CrossRef]
- Jeromel, G.; Medved, M.; Likar, J. An analysis of the geomechanical processes in coal mining using the velenje mining method. Acta Geotech. Slov. 2010, 7, 31–45. [Google Scholar]
- Likar, J.; Medved, M.; Lenart, M.; Mayer, J.; Malenković, V.; Jeromel, G.; Dervarič, E. Analysis of geomechanical changes in hanging wall caused by longwall multi top caving in coal mining. J. Min. Sci. 2012, 48, 135–145. [Google Scholar] [CrossRef]
- Wesołowski, M. Numerical modeling of exploitation relics and faults influence on rock mass deformations. Arch. Min. Sci. 2016, 61, 893–906. [Google Scholar] [CrossRef] [Green Version]
- Sikora, P. Simulation of rock mass horizontal displacements with usage of cellular automata theory. Arch. Min. Sci. 2016, 61, 749–763. [Google Scholar] [CrossRef] [Green Version]
- Orwat, J.; Mielimąka, R. Average course approximation of measured subsidence and inclinations of mining area by smooth splines. J. Sustain. Min. 2017, 16, 8–13. [Google Scholar] [CrossRef]
- Thongprapha, T.; Fuenkajorn, K.; Daemen, J.J.K. Study of surface subsidence above an underground opening using a trap door apparatus. Tunn. Undergr. Space Technol. 2015, 46, 94–103. [Google Scholar] [CrossRef]
- Ghabraie, B.; Ren, G.; Smith, J.V. Characterising the multi-seam subsidence due to varying mining configuration, insights from physical modelling. Int. J. Rock Mech. Min. Sci. 2017, 93, 269–279. [Google Scholar] [CrossRef]
- Brezigar, A. Premogova plast Rudnika lignita Velenje/Coal seam of the Velenje coal mine. Geologija 1985, 28, 319. [Google Scholar]
- Dsurvey. Available online: https://www.3dsurvey.si/ (accessed on 15 January 2020).
- Vulić, M. Optimalna Ravnina Oblaka Točk; Internal Mine Surveying Lecture Series; University of Ljubljana, Faculty of Natural Sciences and Engineering: Ljubljana, Slovenia, 2017. [Google Scholar]
- Rošer, J.; Potočnik, D.; Vulić, M. Analysis of dynamic surface subsidence at the underground coal mining site in Velenje, Slovenia through modified sigmoidal function. Minerals 2018, 8, 74. [Google Scholar] [CrossRef] [Green Version]
- Vulić, M. Sigmoidna Funckija; Internal Mine Surveying Lecture Series; University of Ljubljana, Faculty of Natural Sciences and Engineering: Ljubljana, Slovenia, 2013. [Google Scholar]
- Hayter, J.A. Probability and Statistics for Engineers and Scientists, 4th ed.; Brooks/Cole: Boston, MA, USA, 2013. [Google Scholar]
Figure 1.
Schematic illustration of the Velenje mining method (VMM). Adapted from Jeromel et al., 2010 [23] and Likar et al., 2012 [24].

Figure 2.
The observation area is located in the Šalek valley in N-E Slovenia, on the surface of Velenje coal mine (VCM) exploitation area between Lake Šoštanj and Lake Velenje.
Figure 2.
The observation area is located in the Šalek valley in N-E Slovenia, on the surface of Velenje coal mine (VCM) exploitation area between Lake Šoštanj and Lake Velenje.
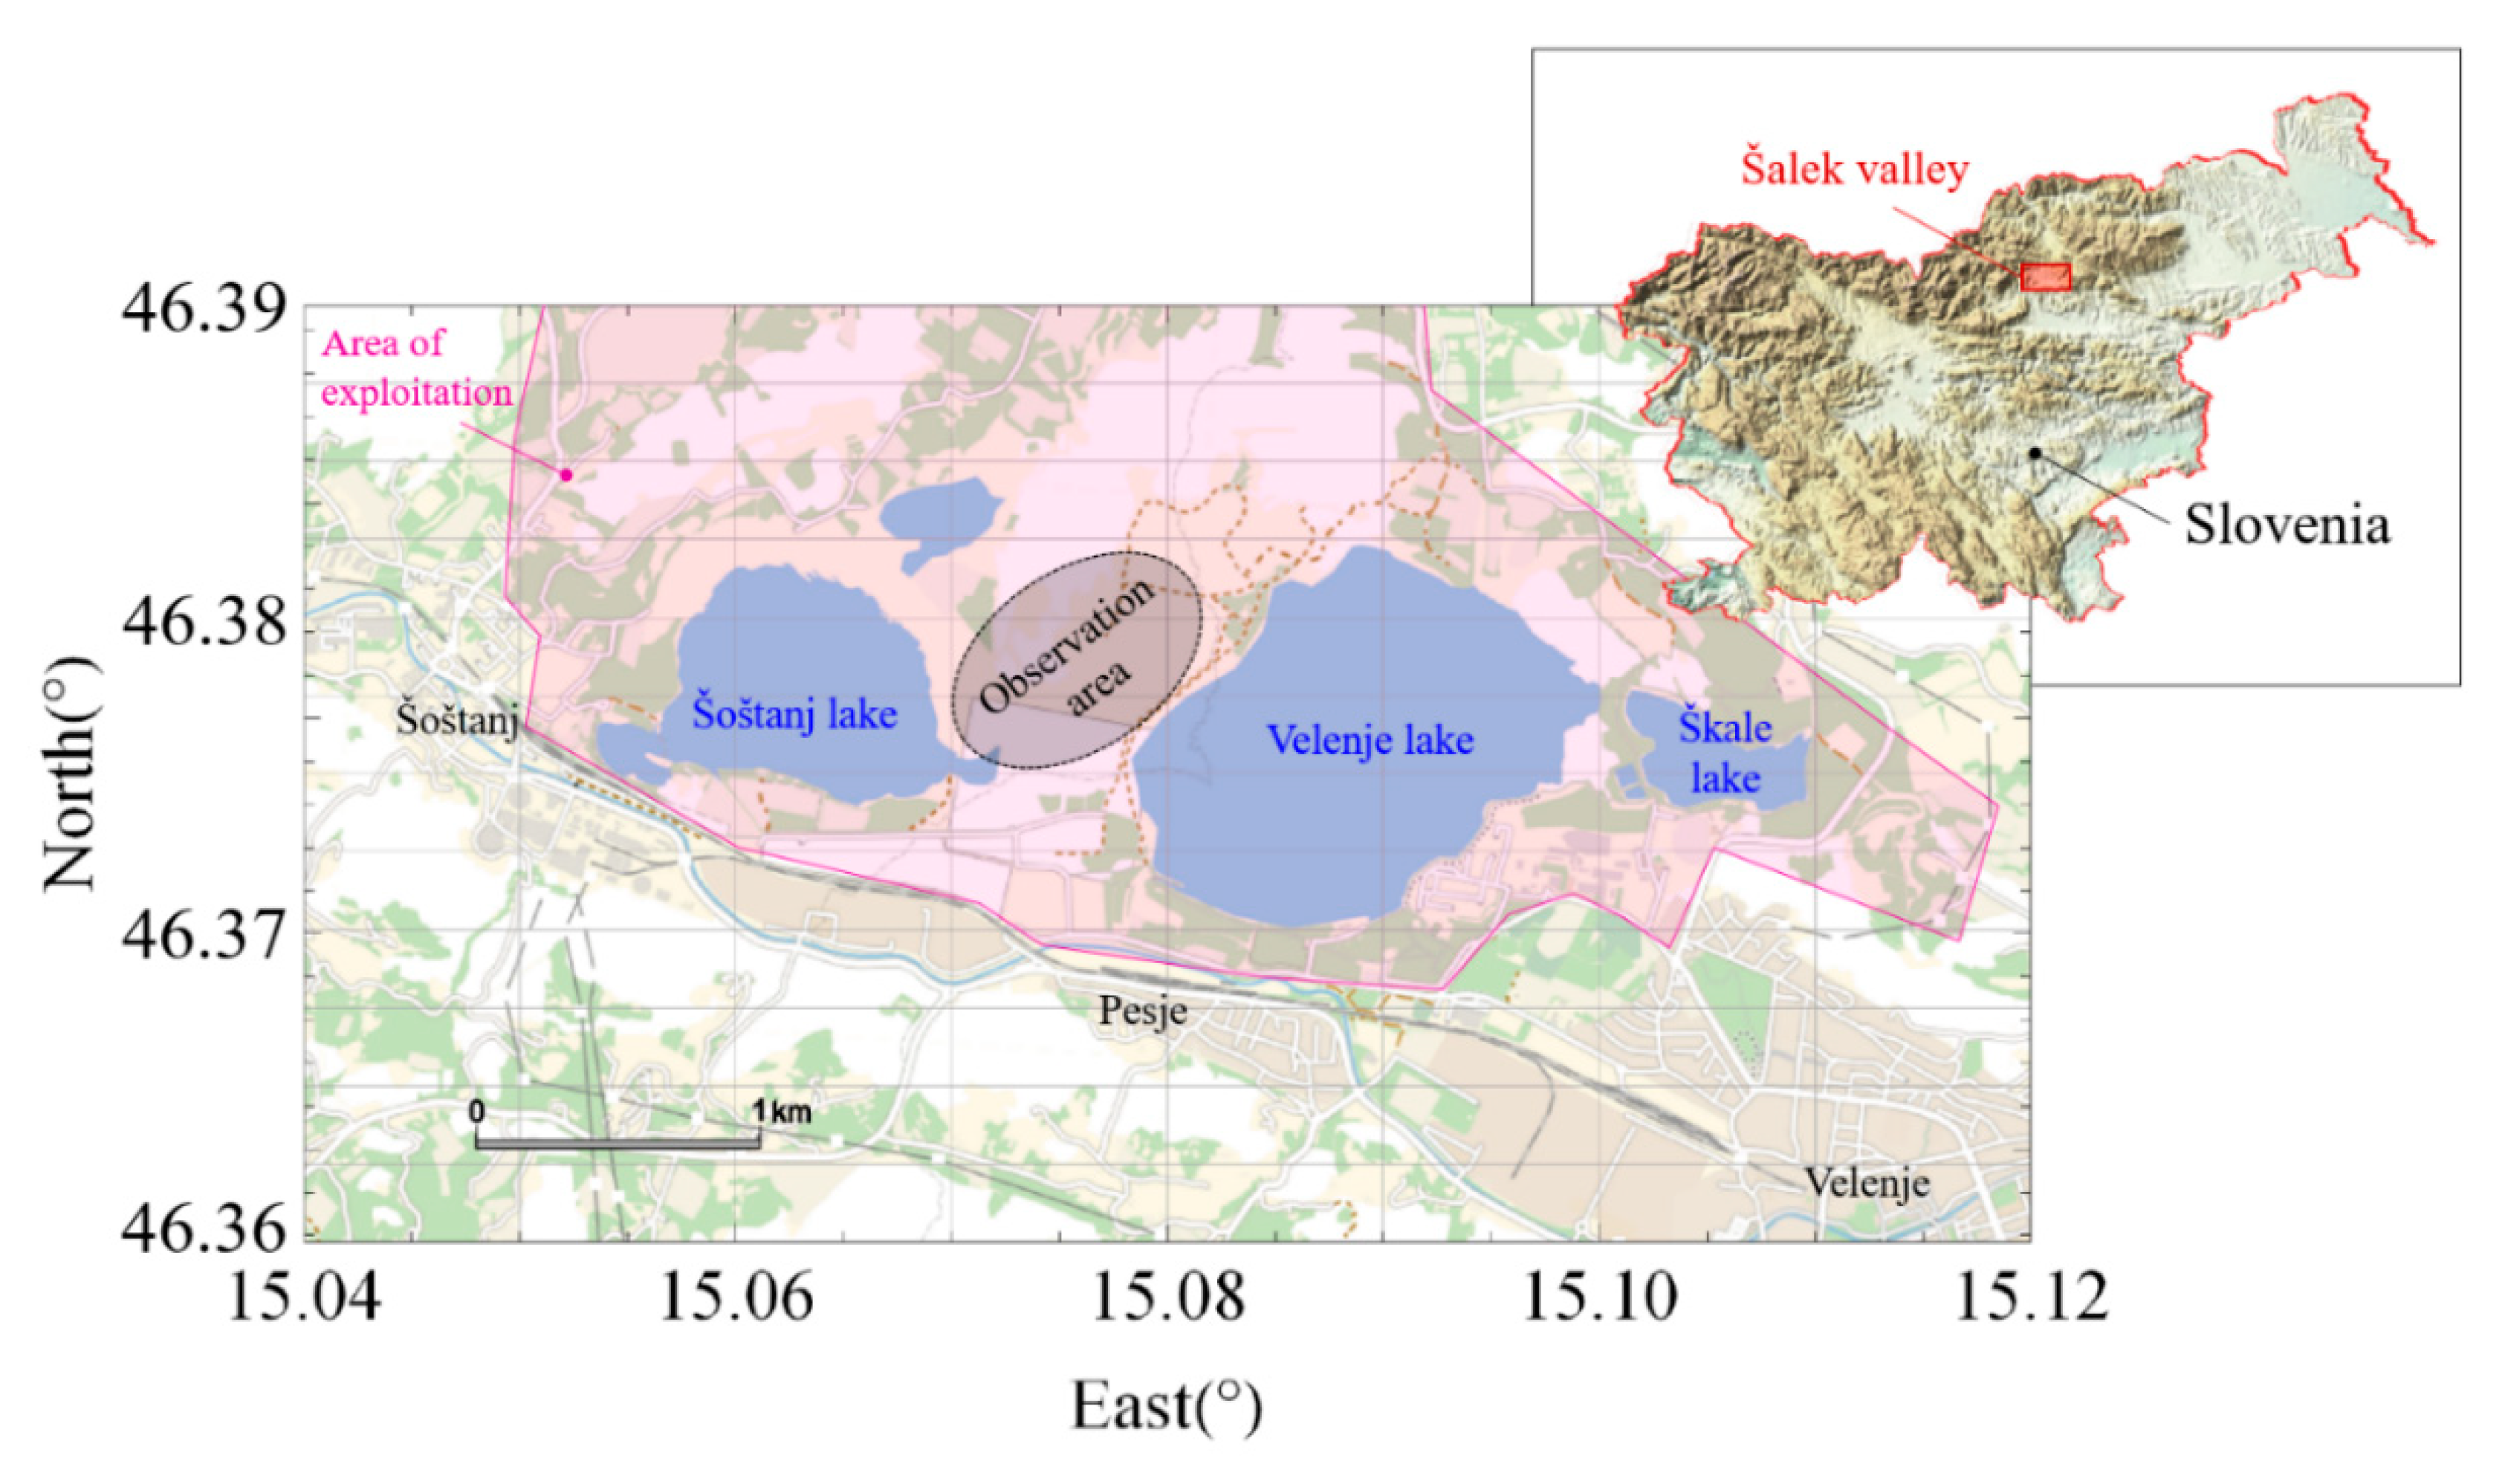
Figure 3.
The discussed longwall panel excavation in the observation area.

Figure 4.
Progress of excavation in nine epochs and the measured excavation height at 17 points for each epoch.
Figure 4.
Progress of excavation in nine epochs and the measured excavation height at 17 points for each epoch.
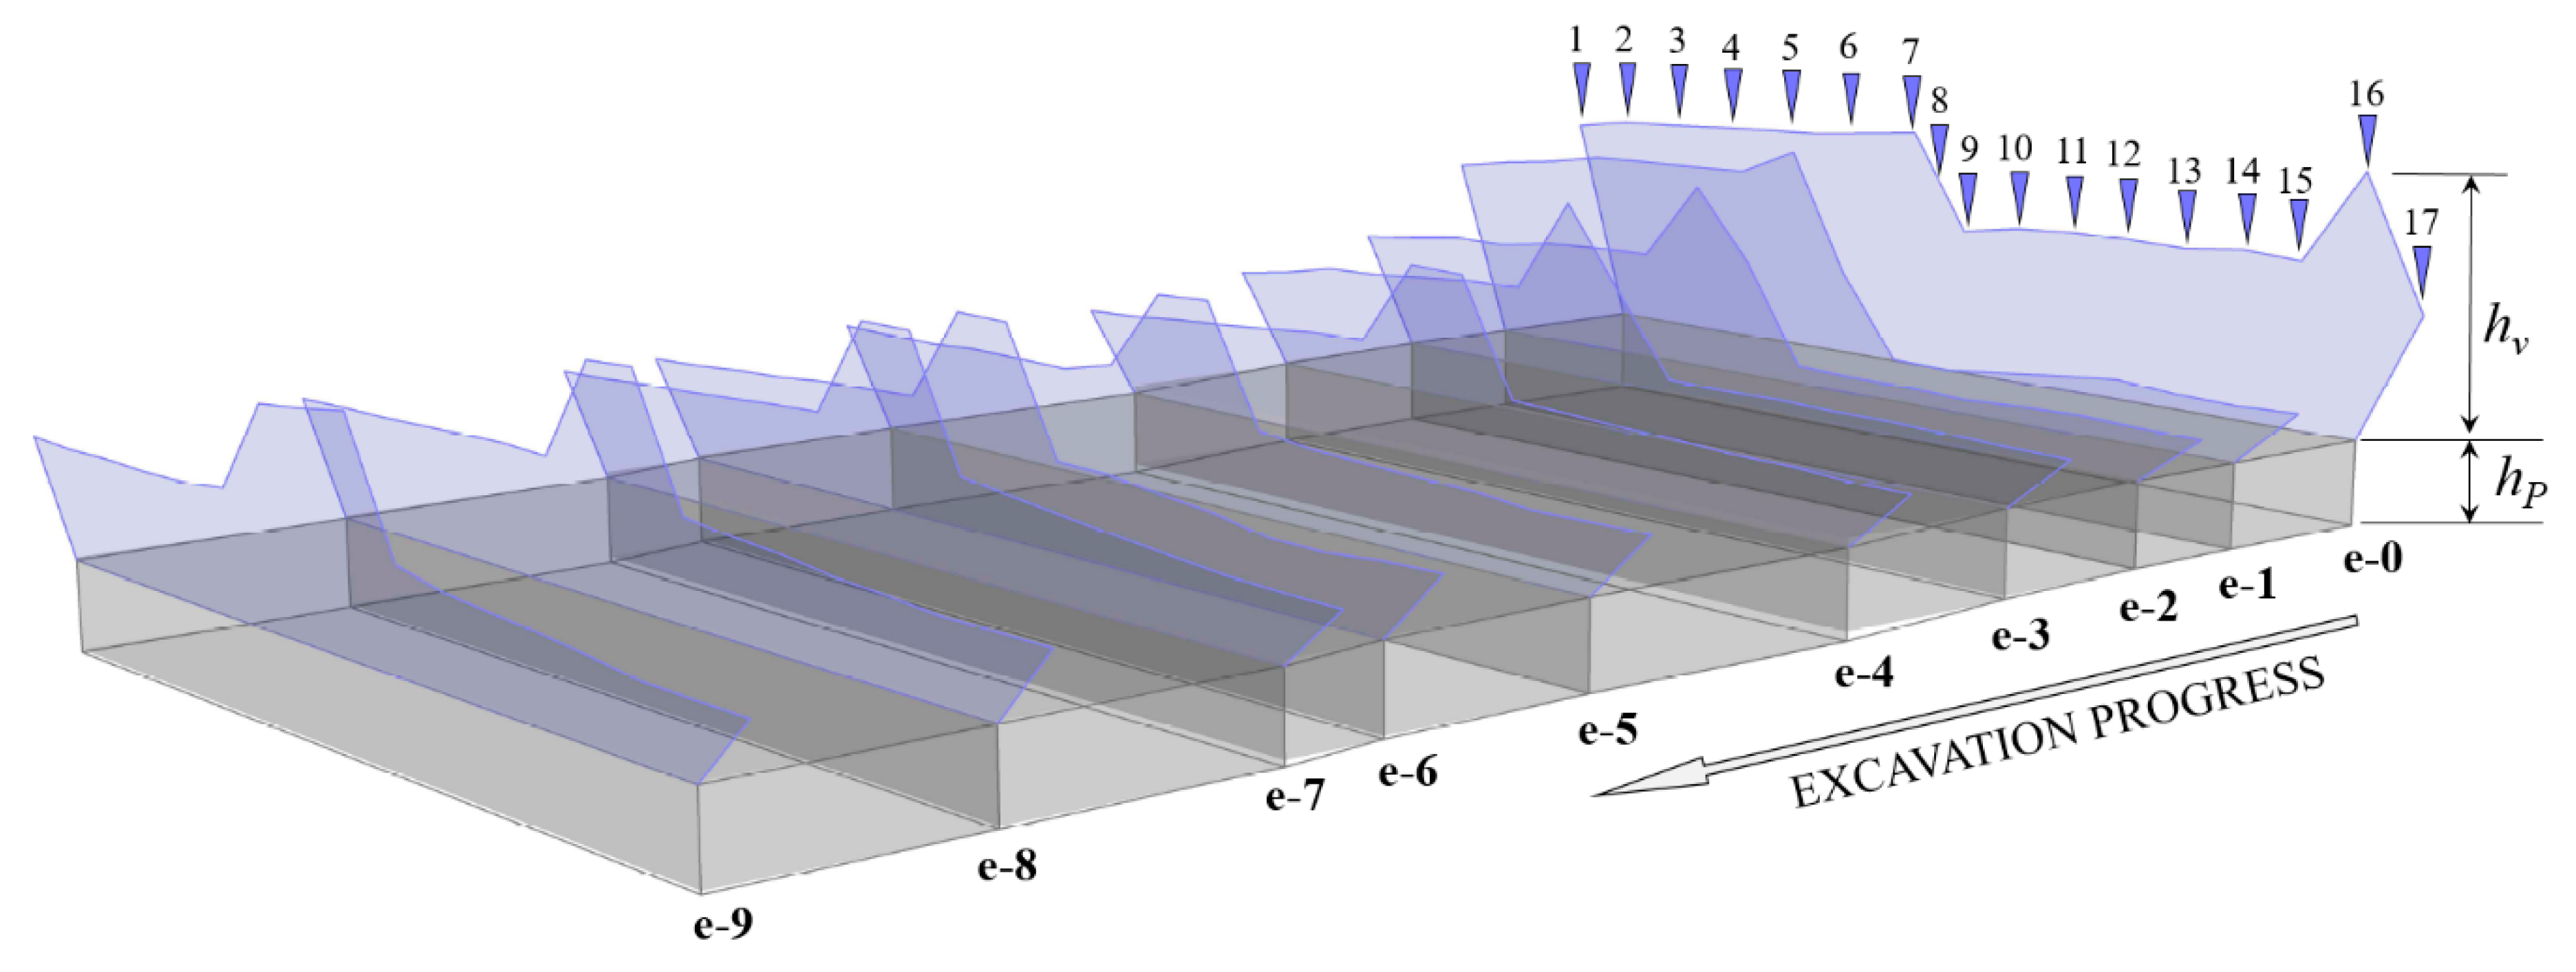
Figure 5.
Areas of intensive terrain reclamation above the observed excavation (1, 2, 3).
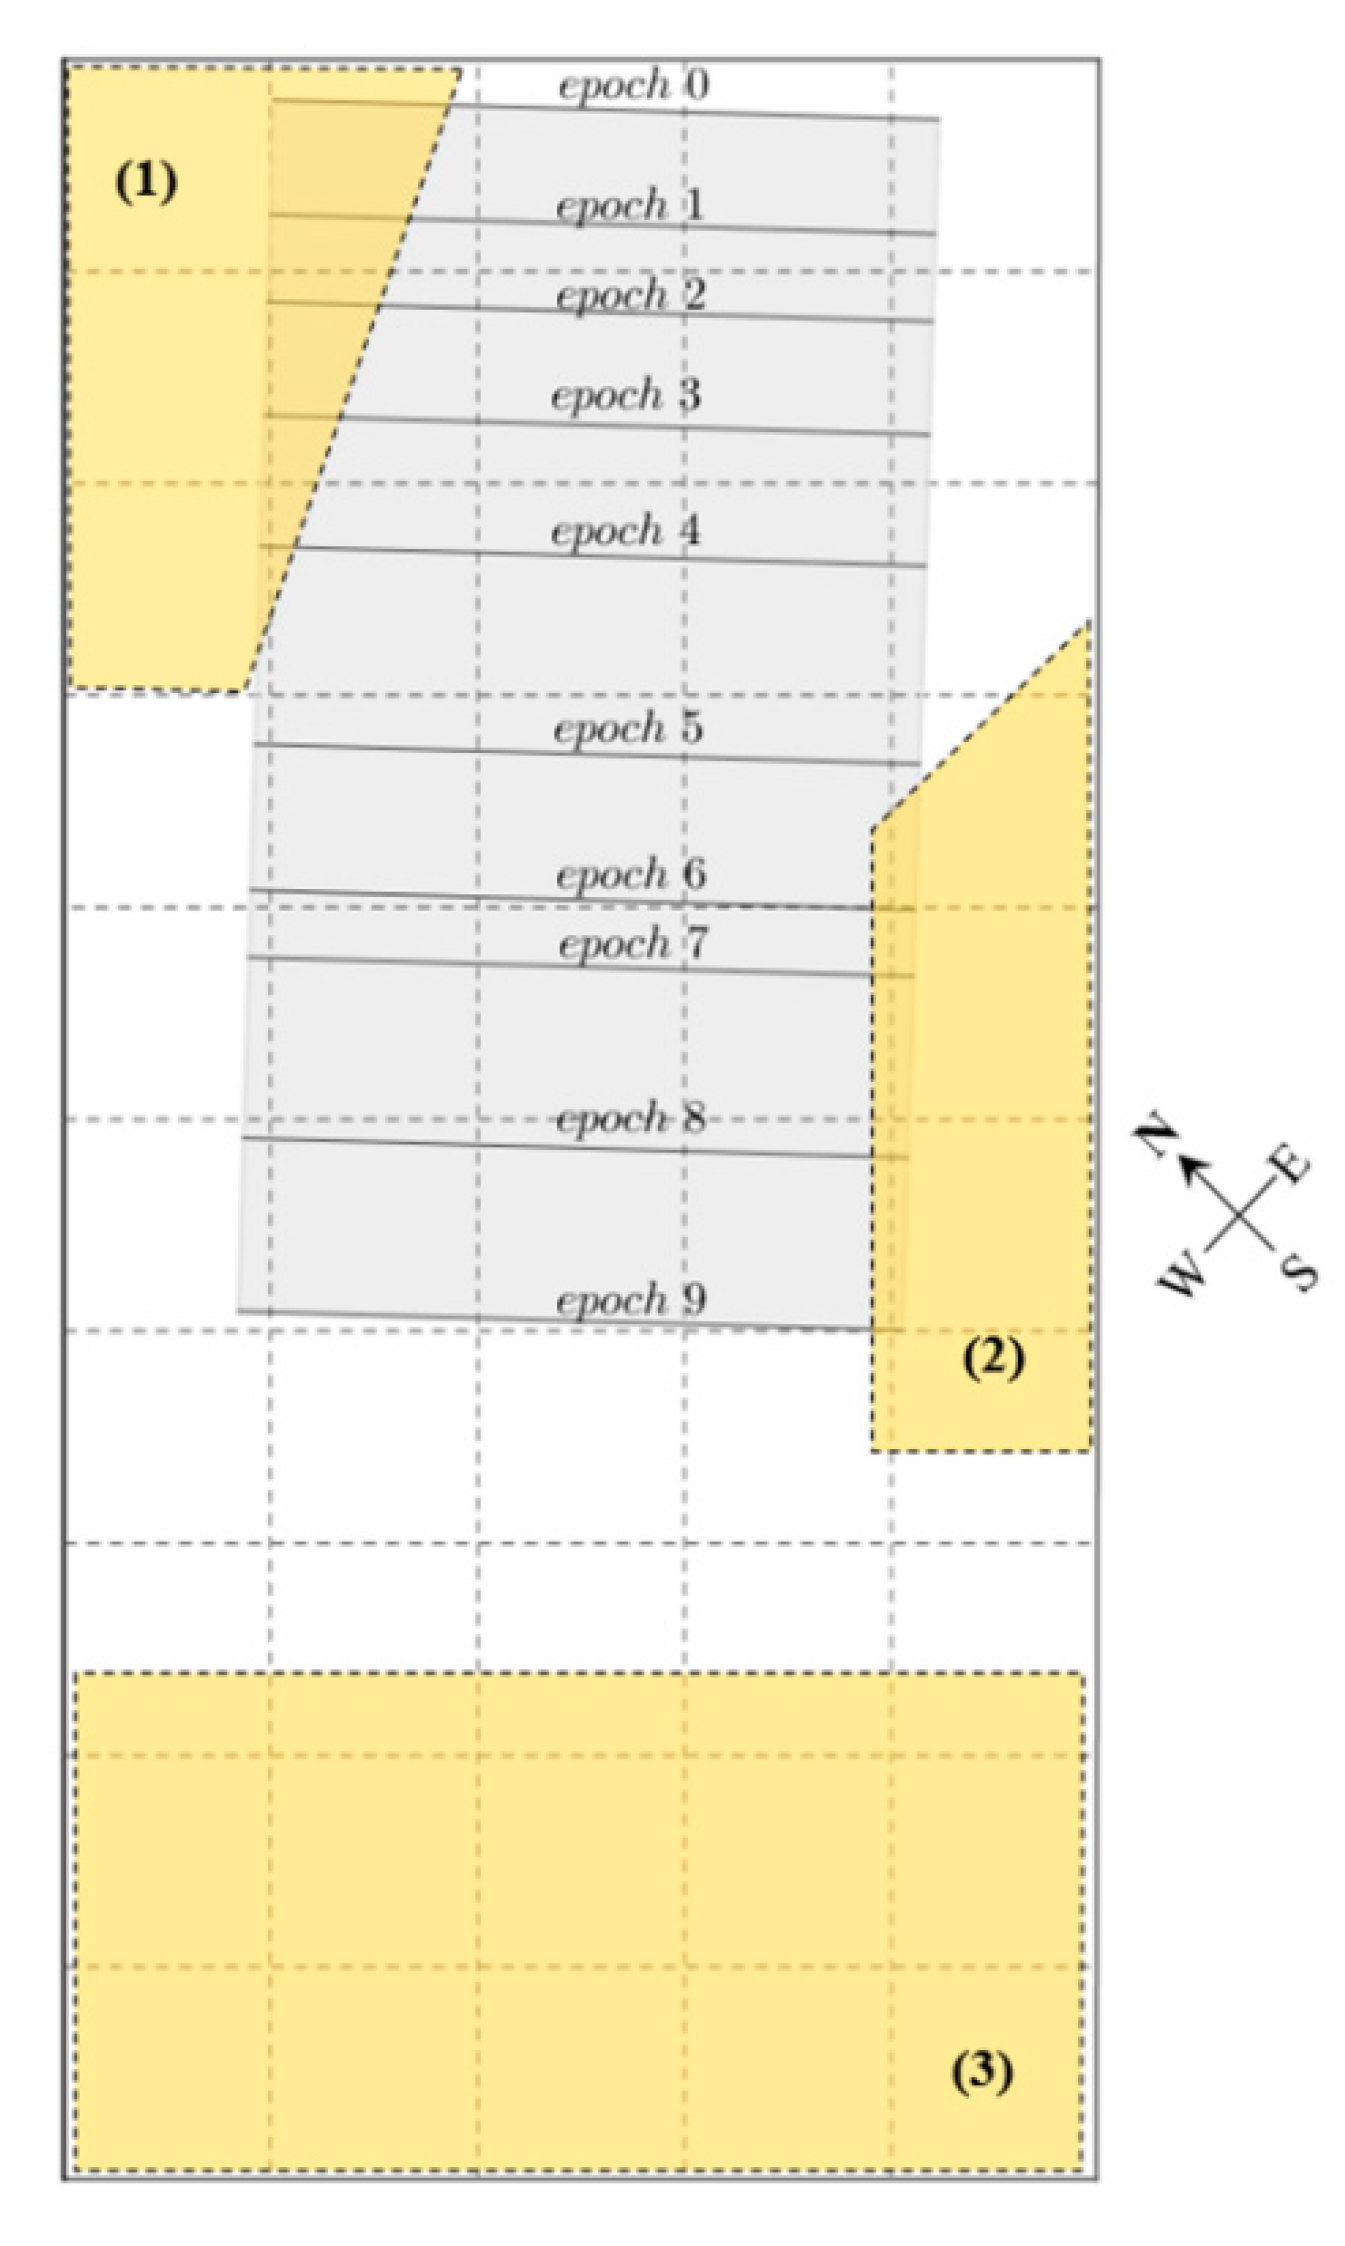
Figure 6.
Layout of the sectors and (a) and centroids (b) in the observation area.
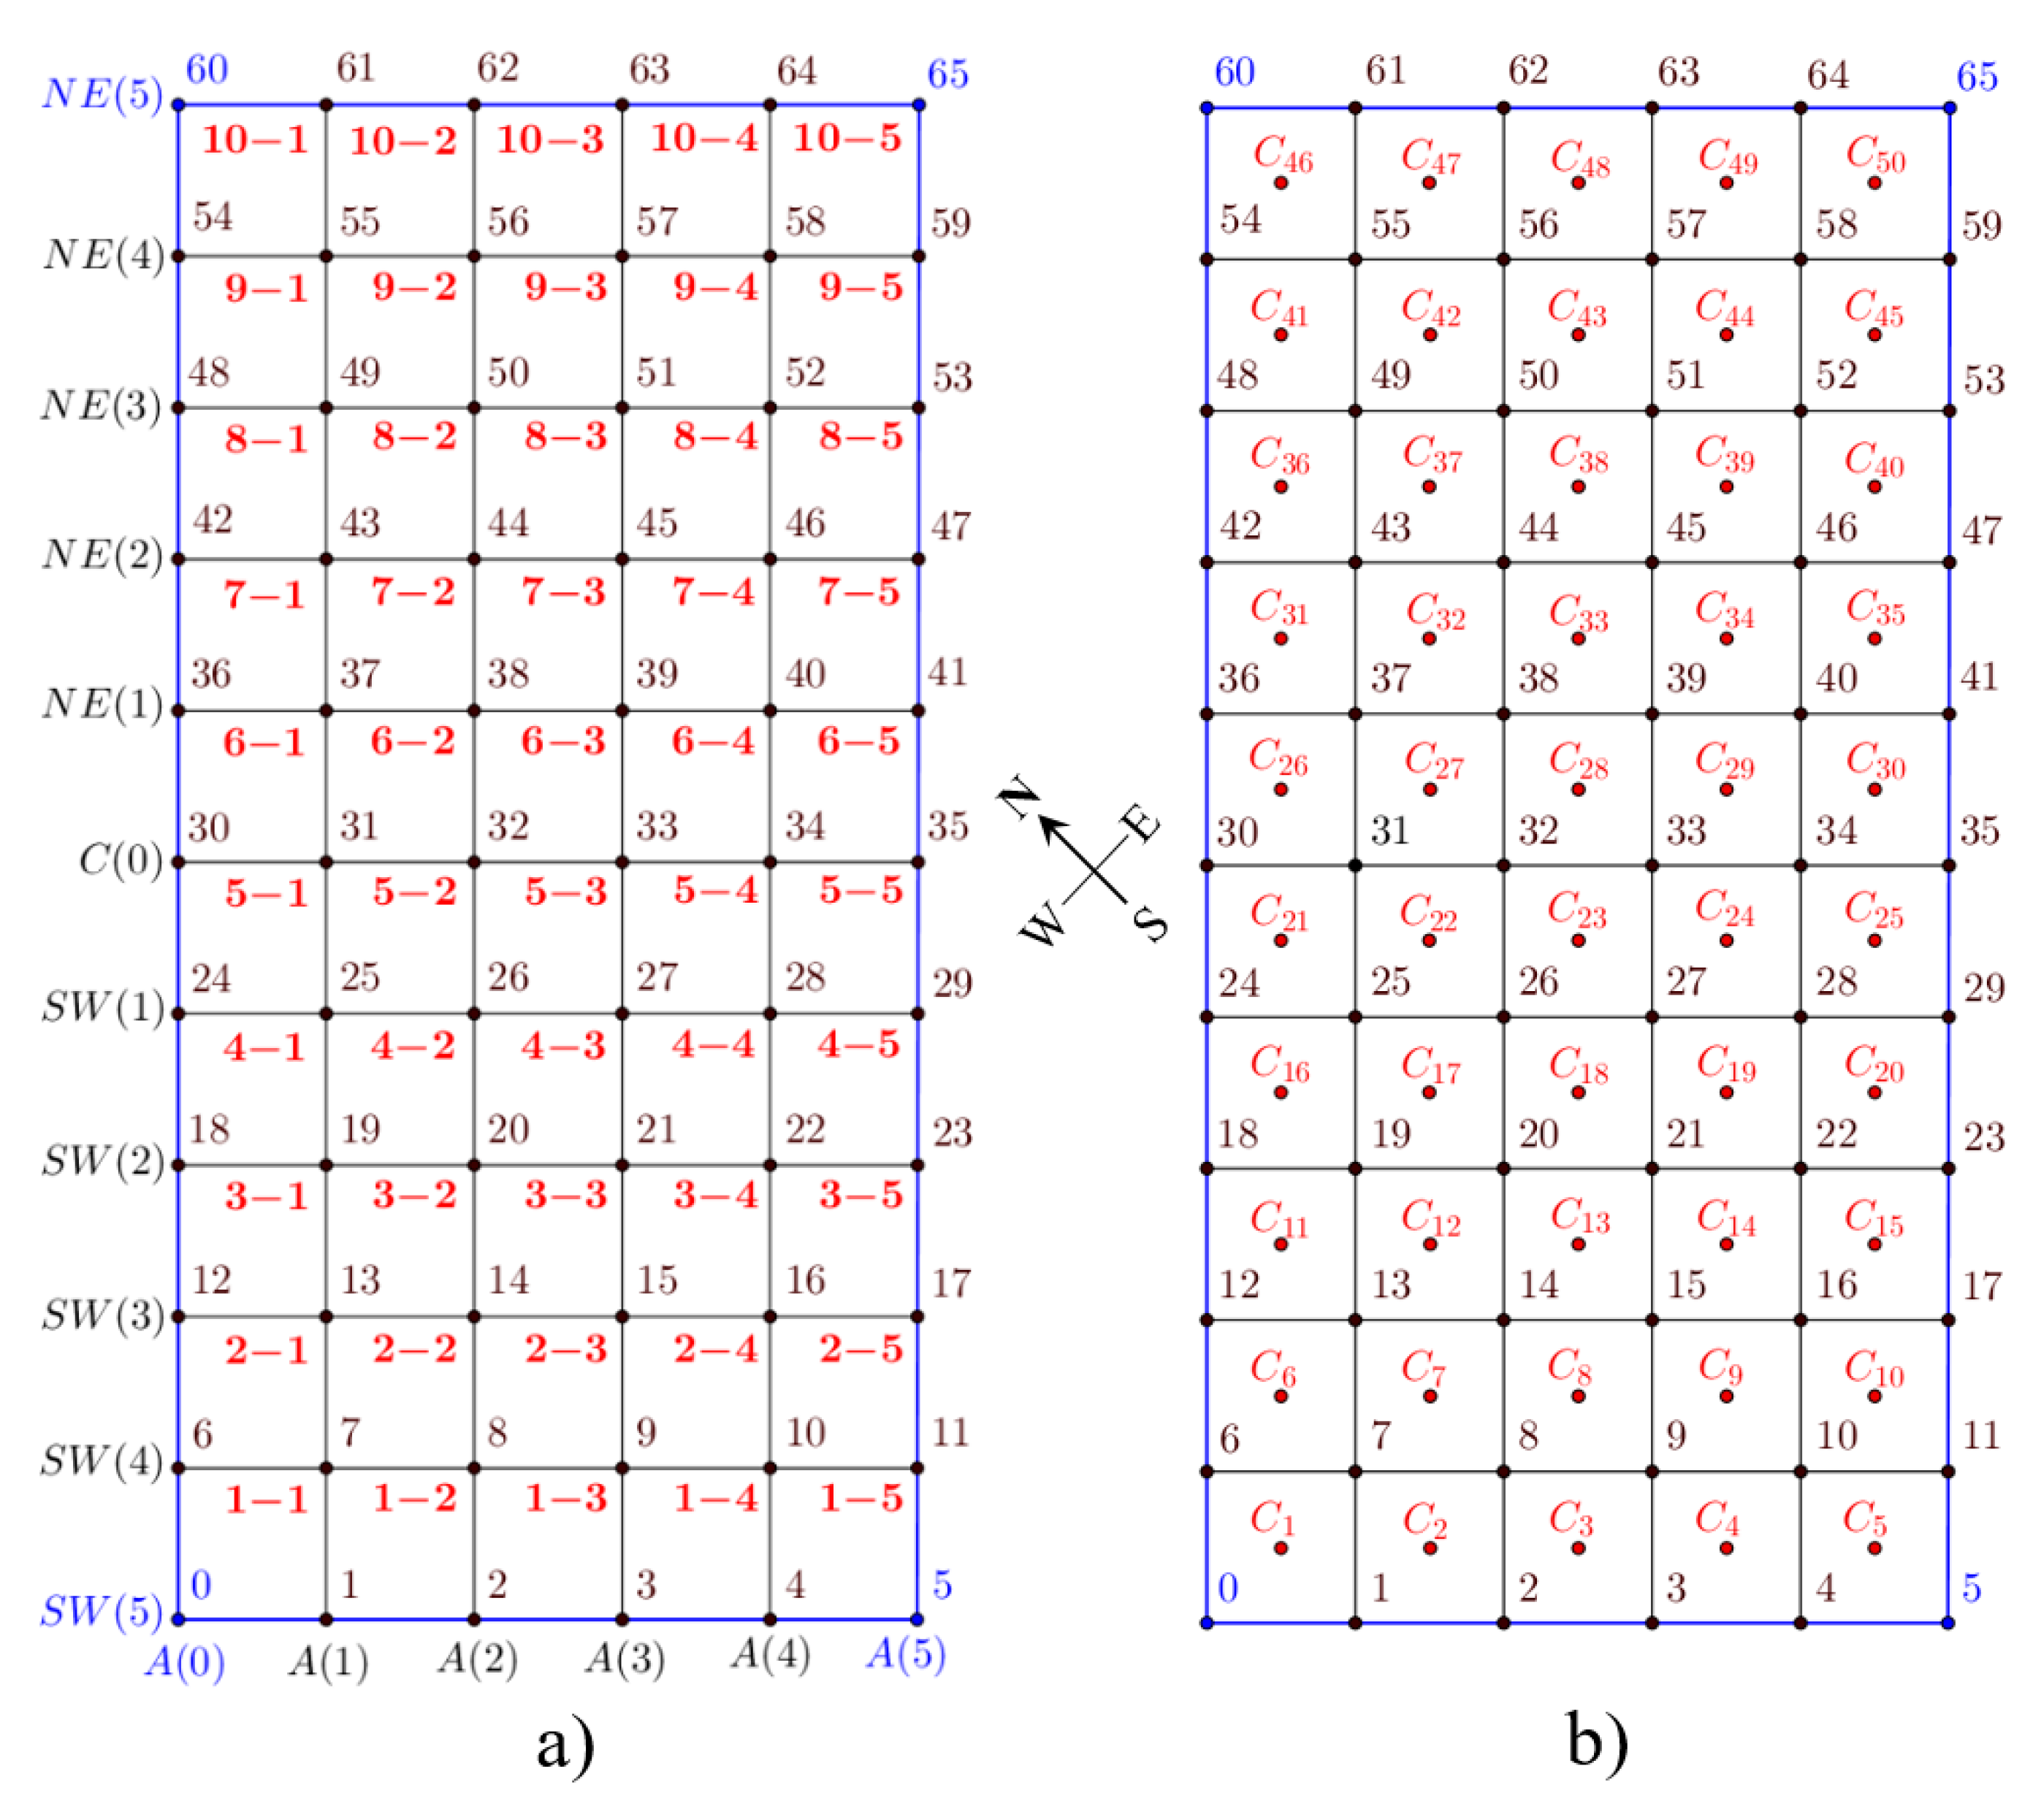
Figure 7.
Layout of the defined profiles across width (a) and length (b) in the observation area.
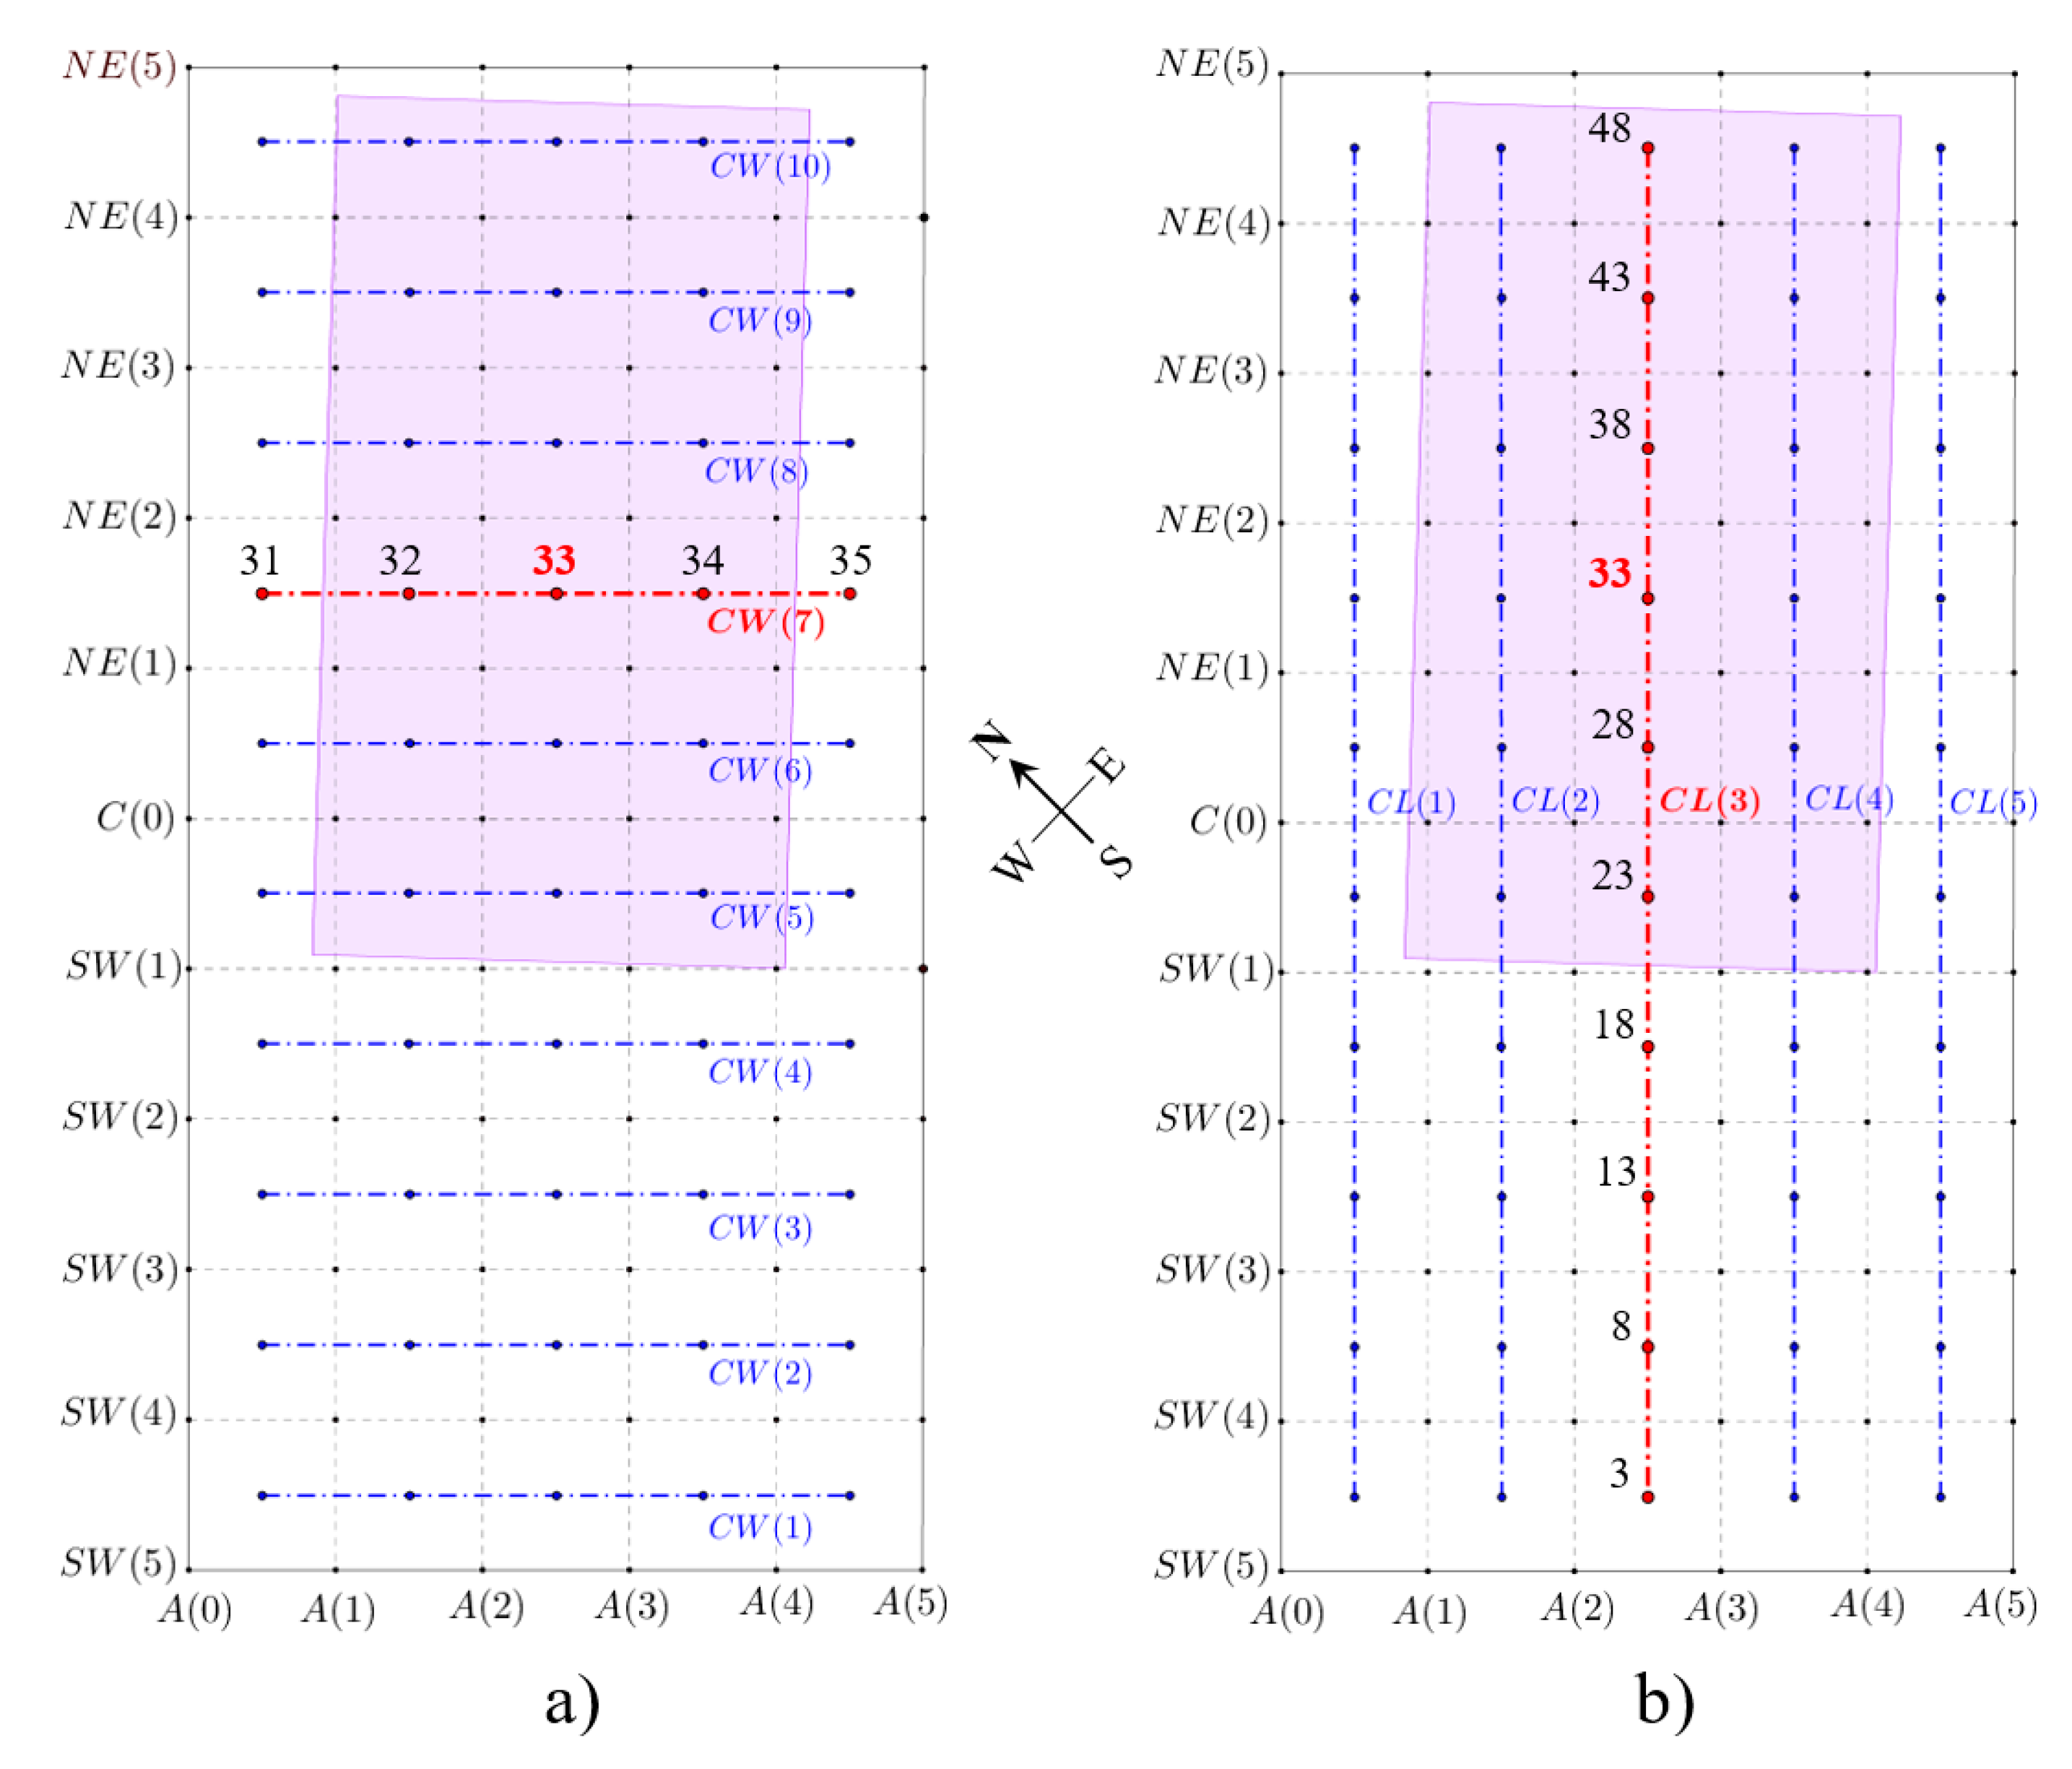
Figure 8.
The FNSE model for consolidation prognosis (modified sigmoid function developed and used by Faculty of Natural Sciences and Engineering [34]).
Figure 8.
The FNSE model for consolidation prognosis (modified sigmoid function developed and used by Faculty of Natural Sciences and Engineering [34]).
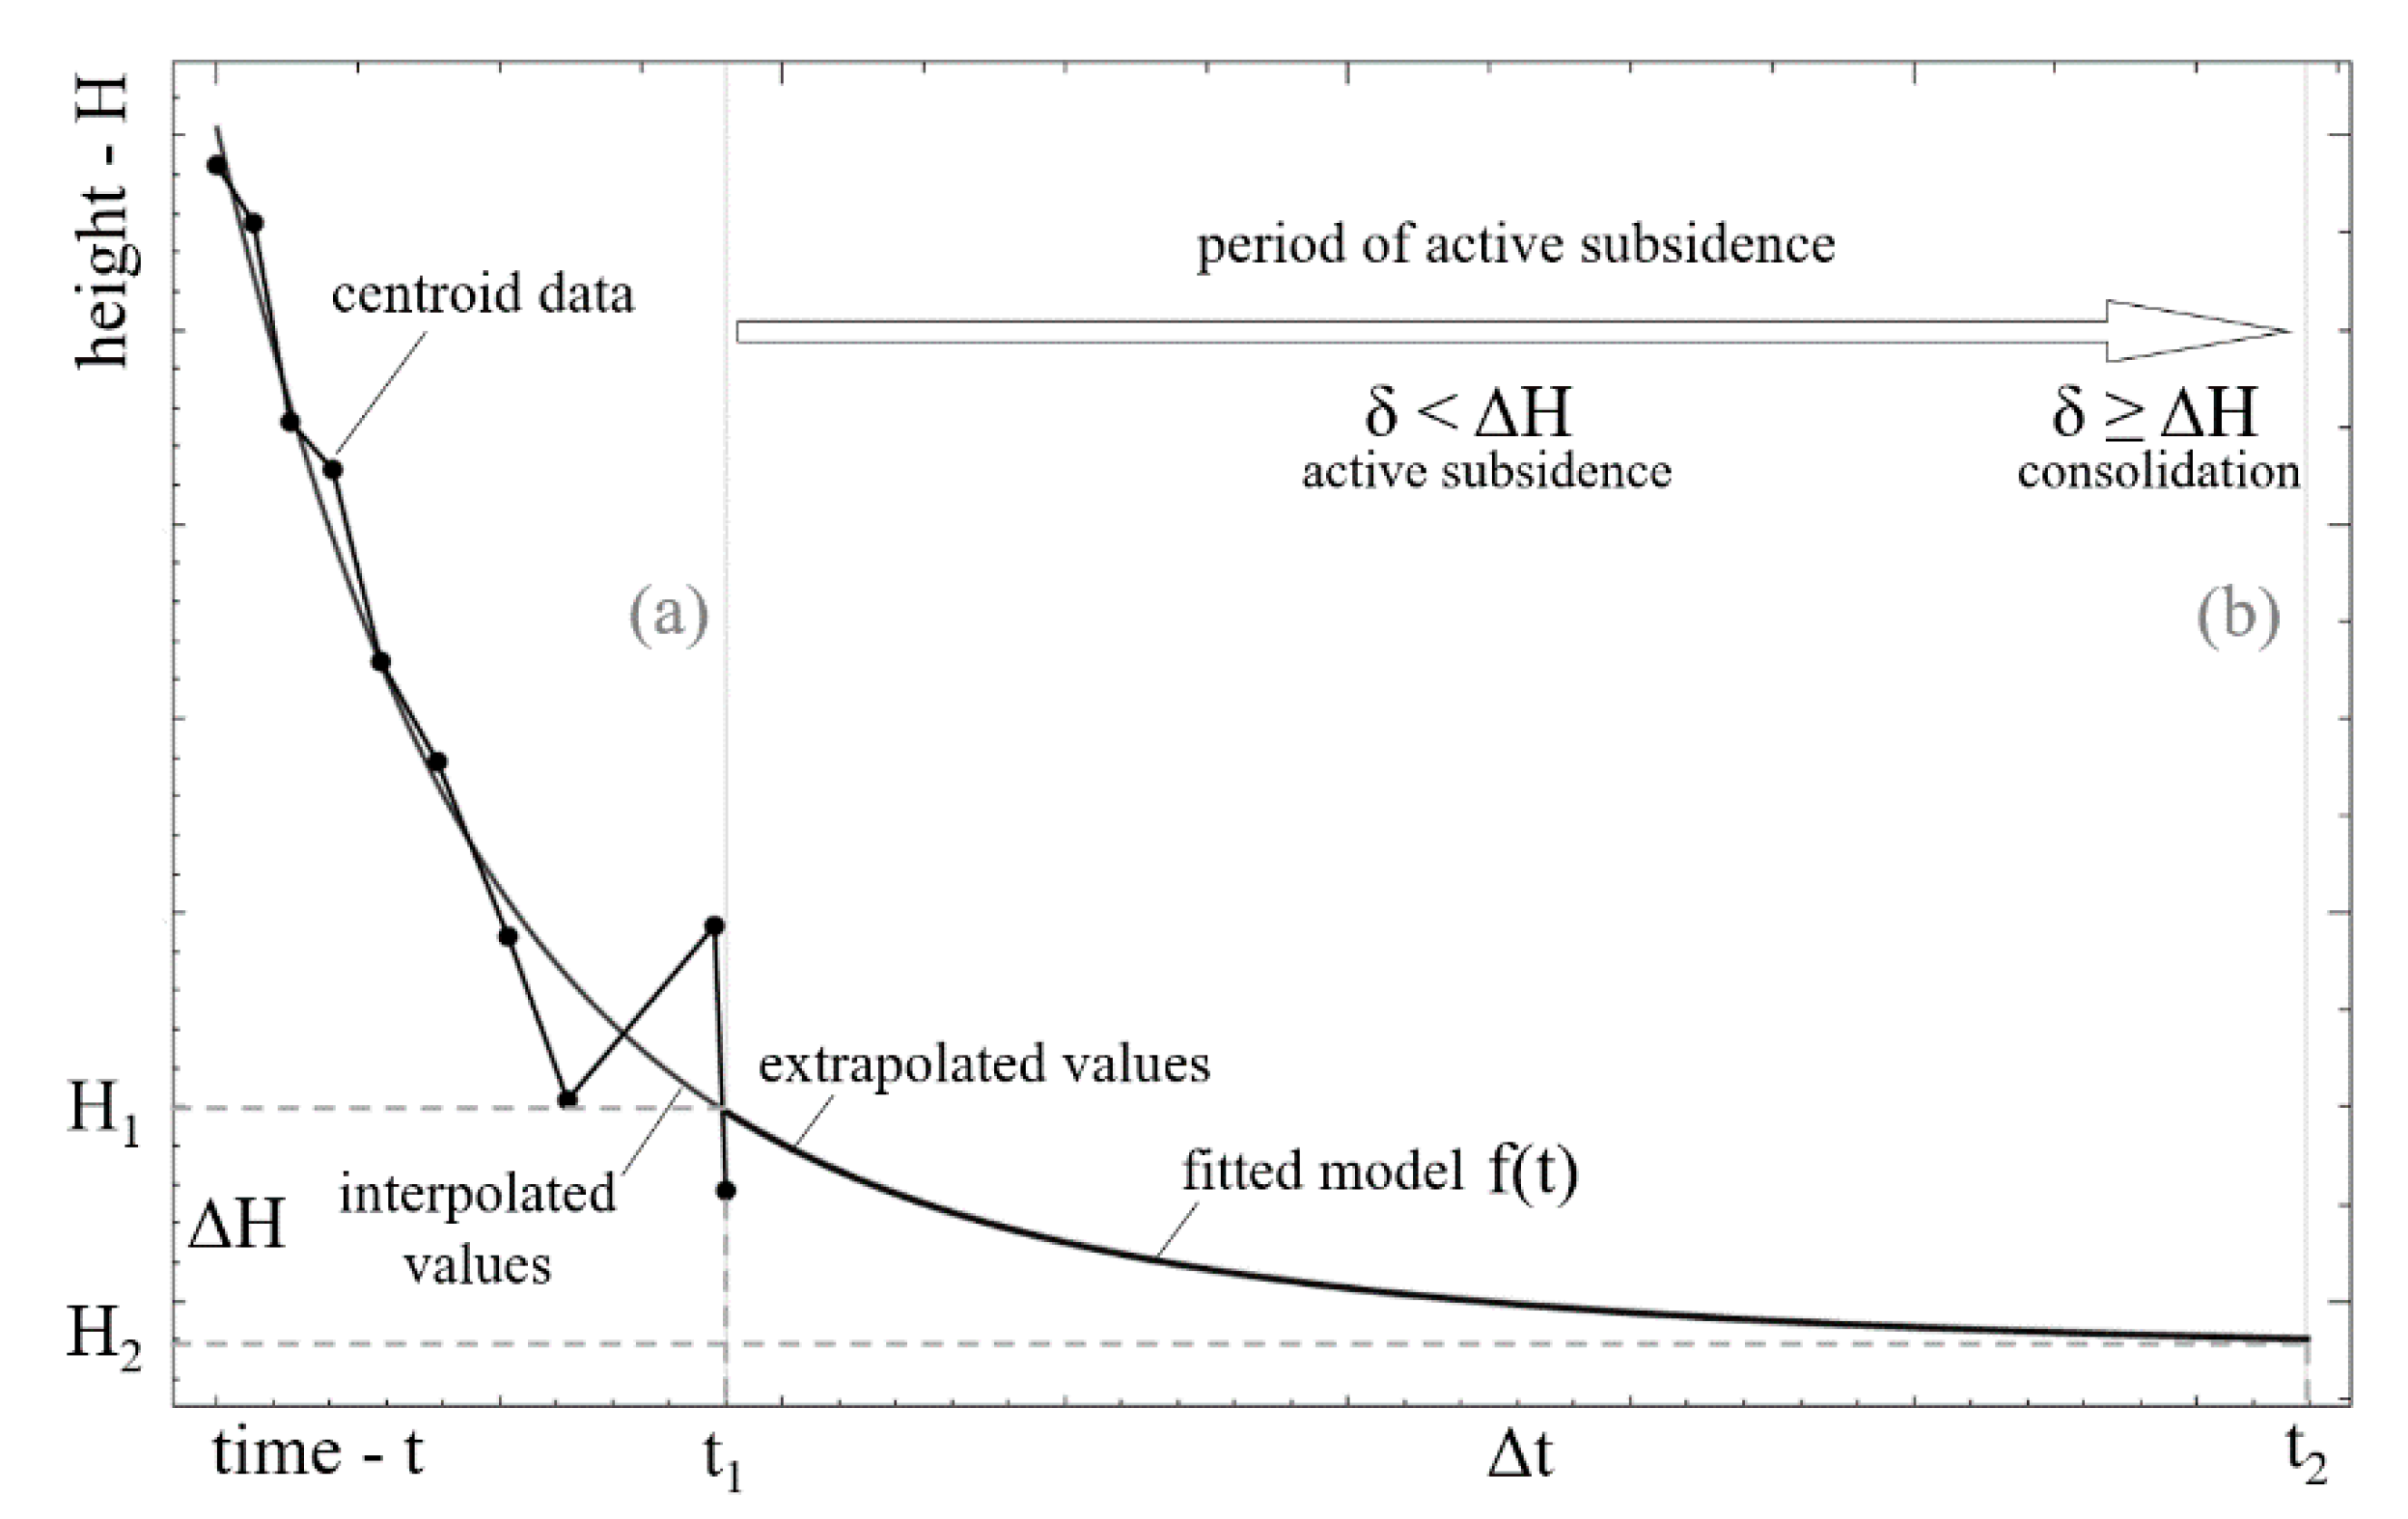
Figure 9.
Fitted planes layout for all sectors in every epoch.
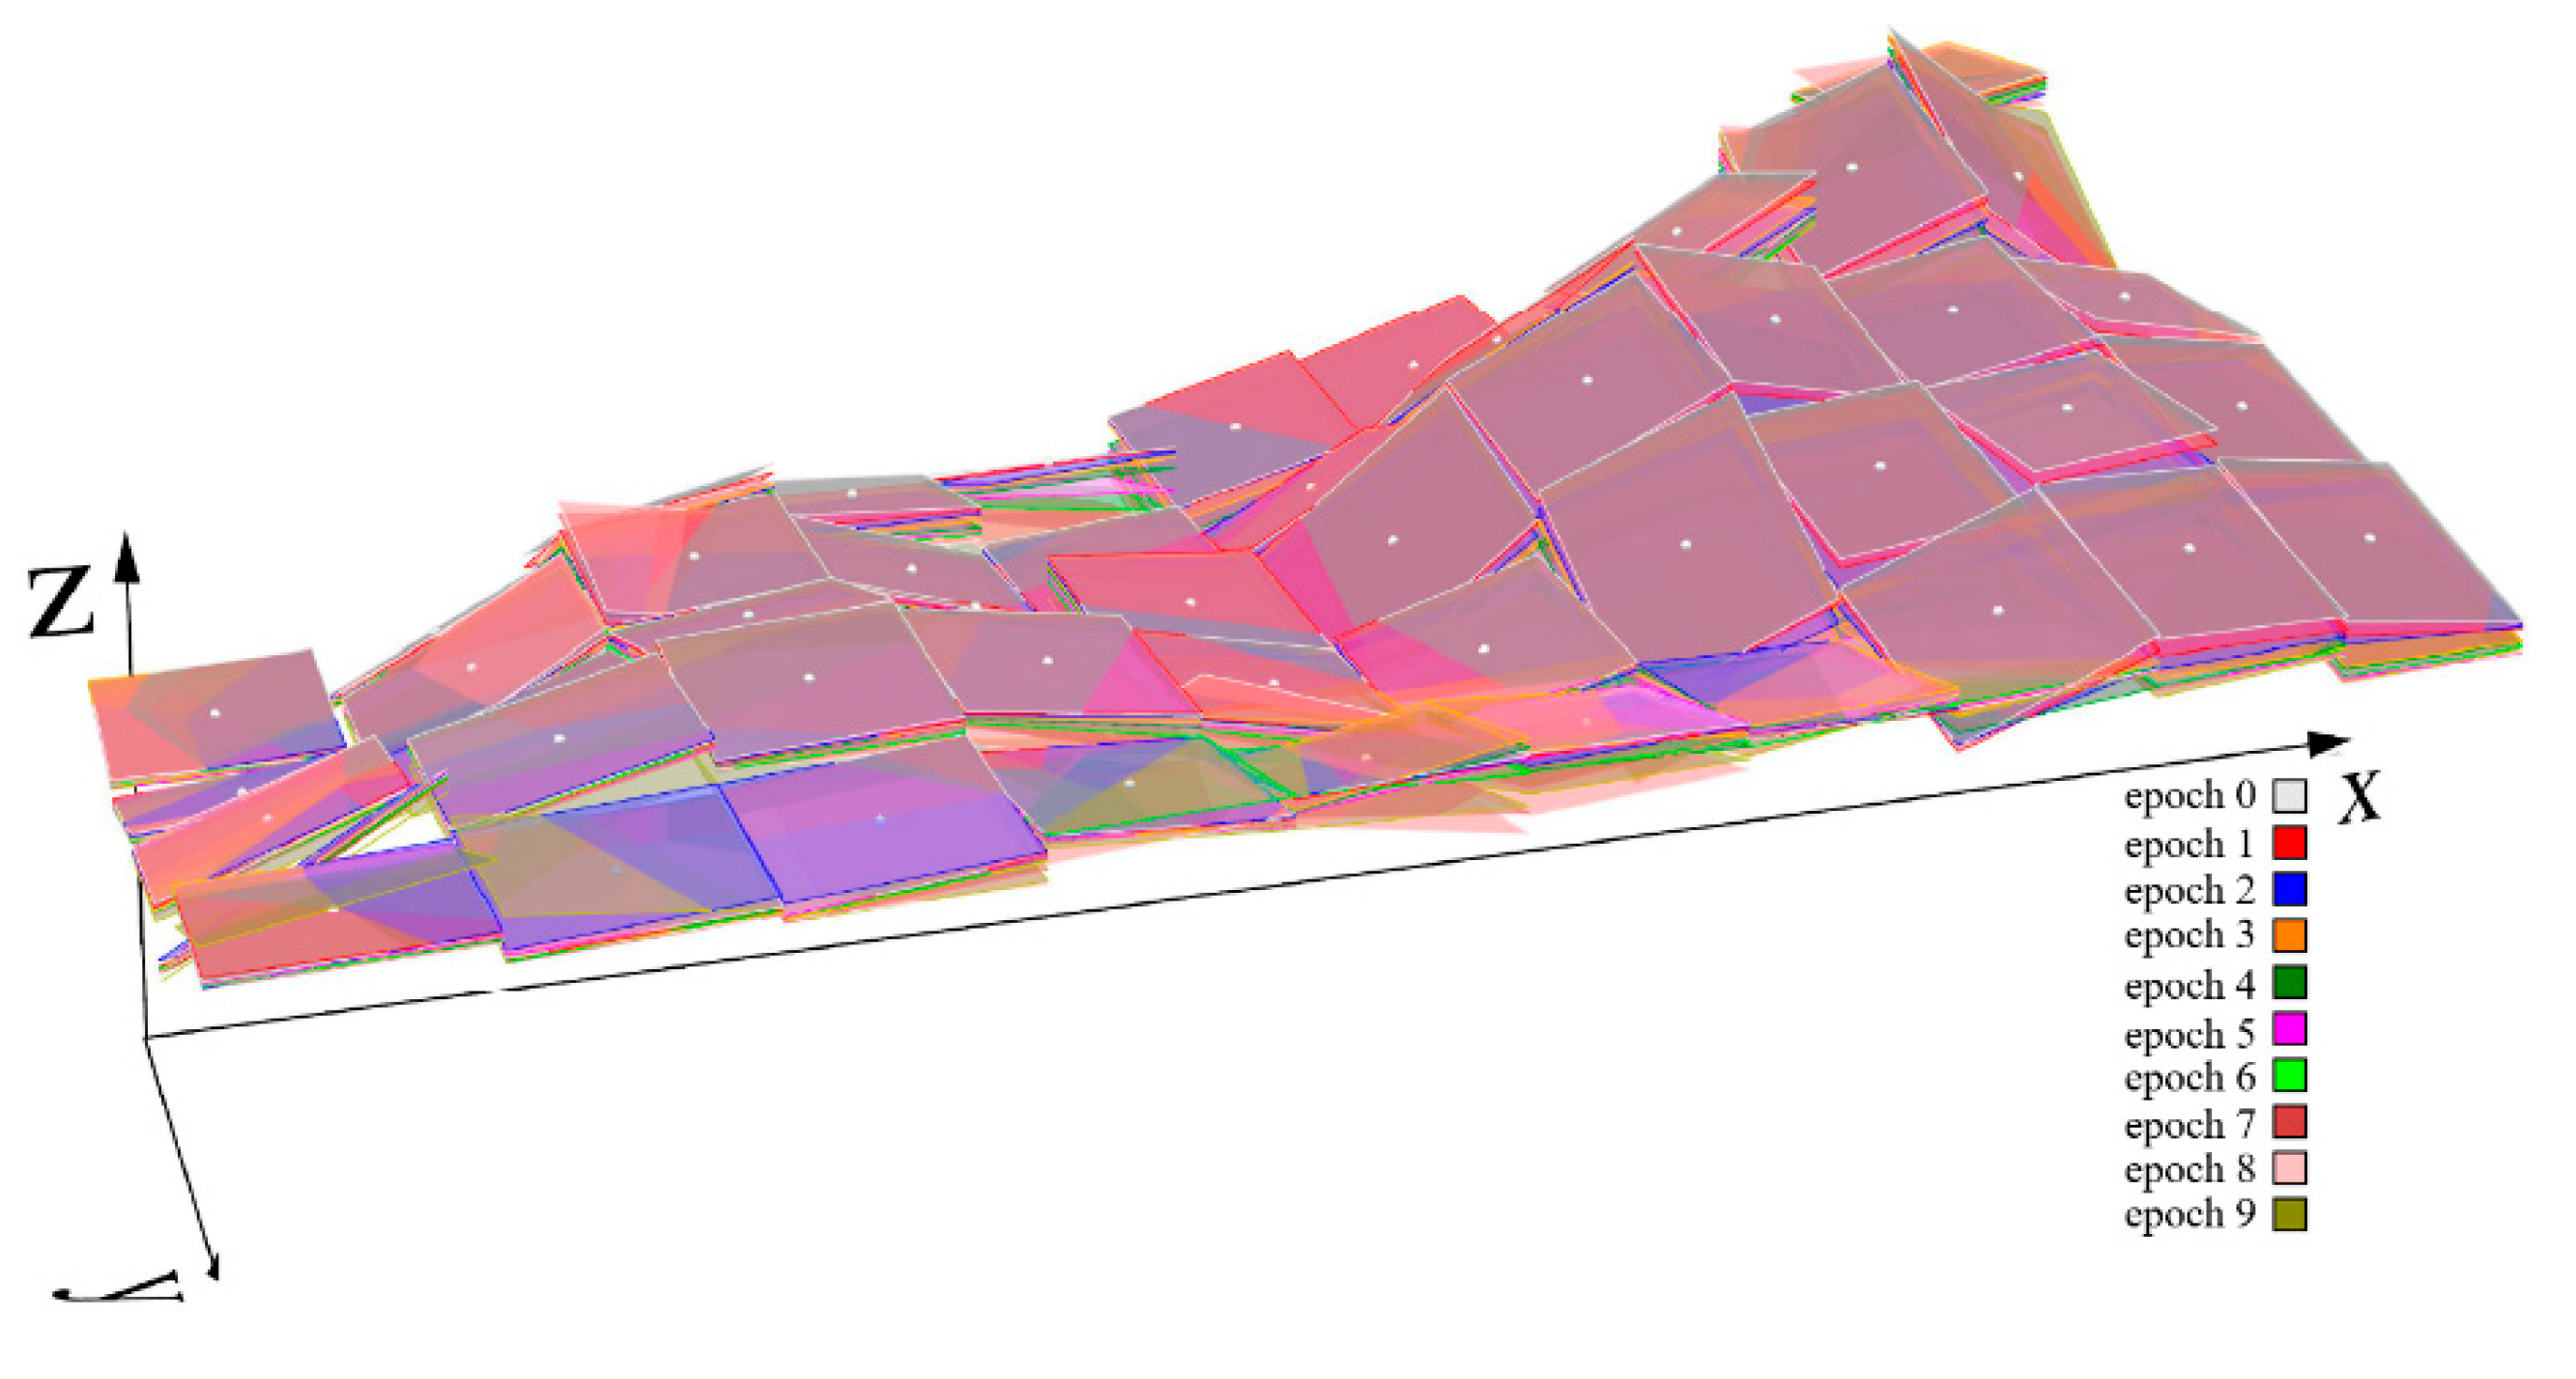
Figure 10.
Fitted planes layout comparison between the initial and last epoch. Distances between centroids are illustrated with red line segments.
Figure 10.
Fitted planes layout comparison between the initial and last epoch. Distances between centroids are illustrated with red line segments.
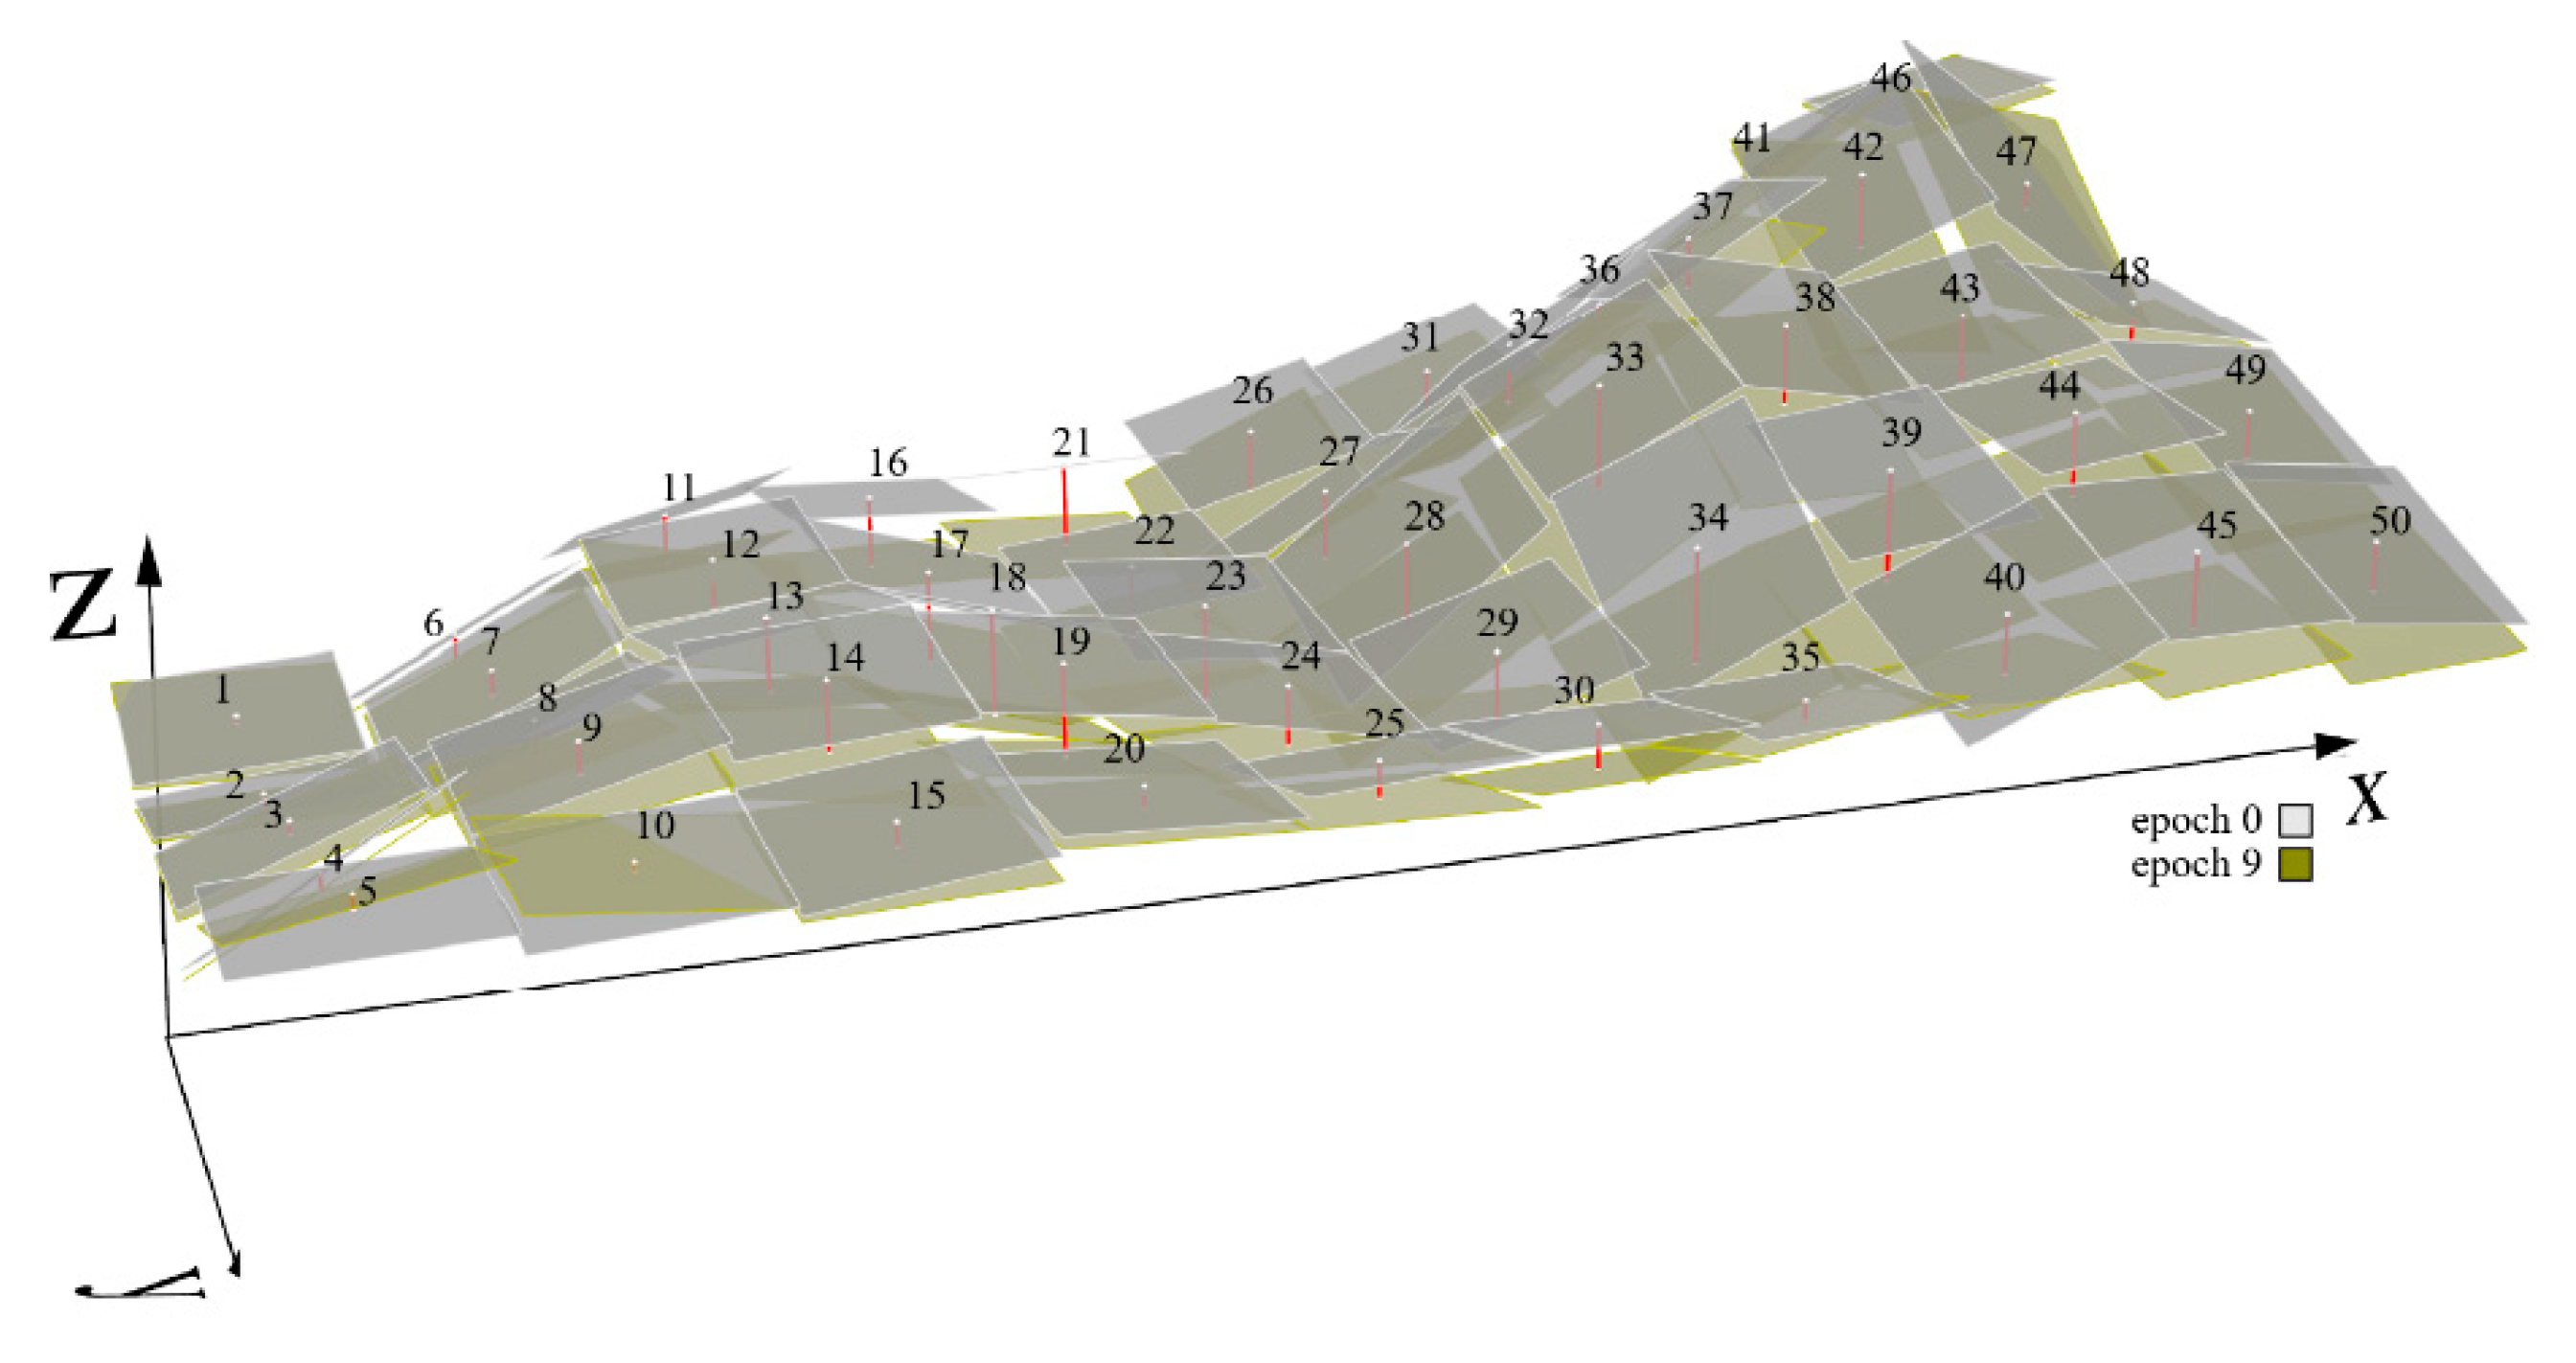
Figure 11.
Calculated centroid height by profile Cw7, including height at predicted consolidation using the FNSE model.
Figure 11.
Calculated centroid height by profile Cw7, including height at predicted consolidation using the FNSE model.
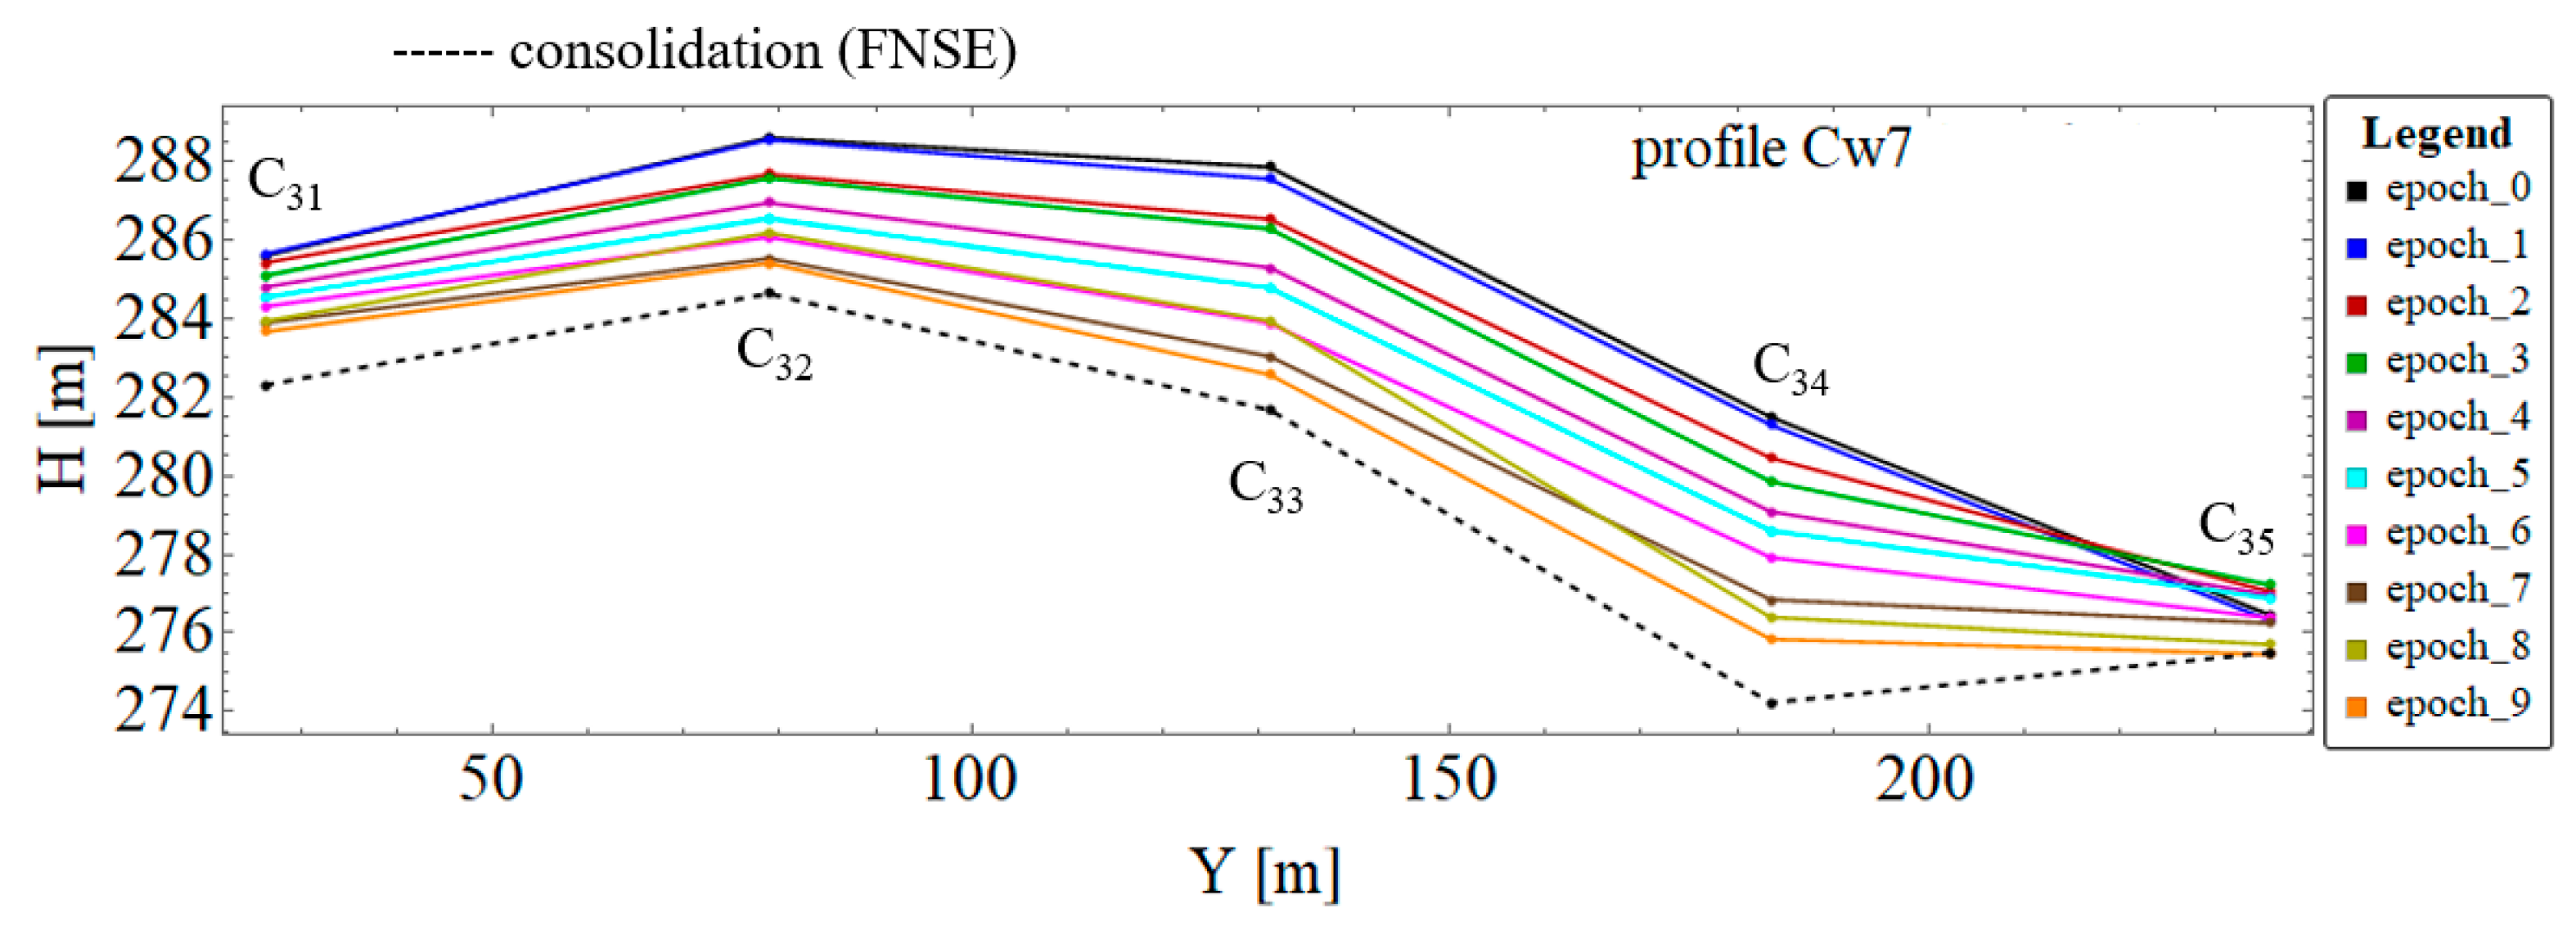
Figure 12.
Calculated centroid height by profile CL3, including height at predicted consolidation using the FNSE model.
Figure 12.
Calculated centroid height by profile CL3, including height at predicted consolidation using the FNSE model.
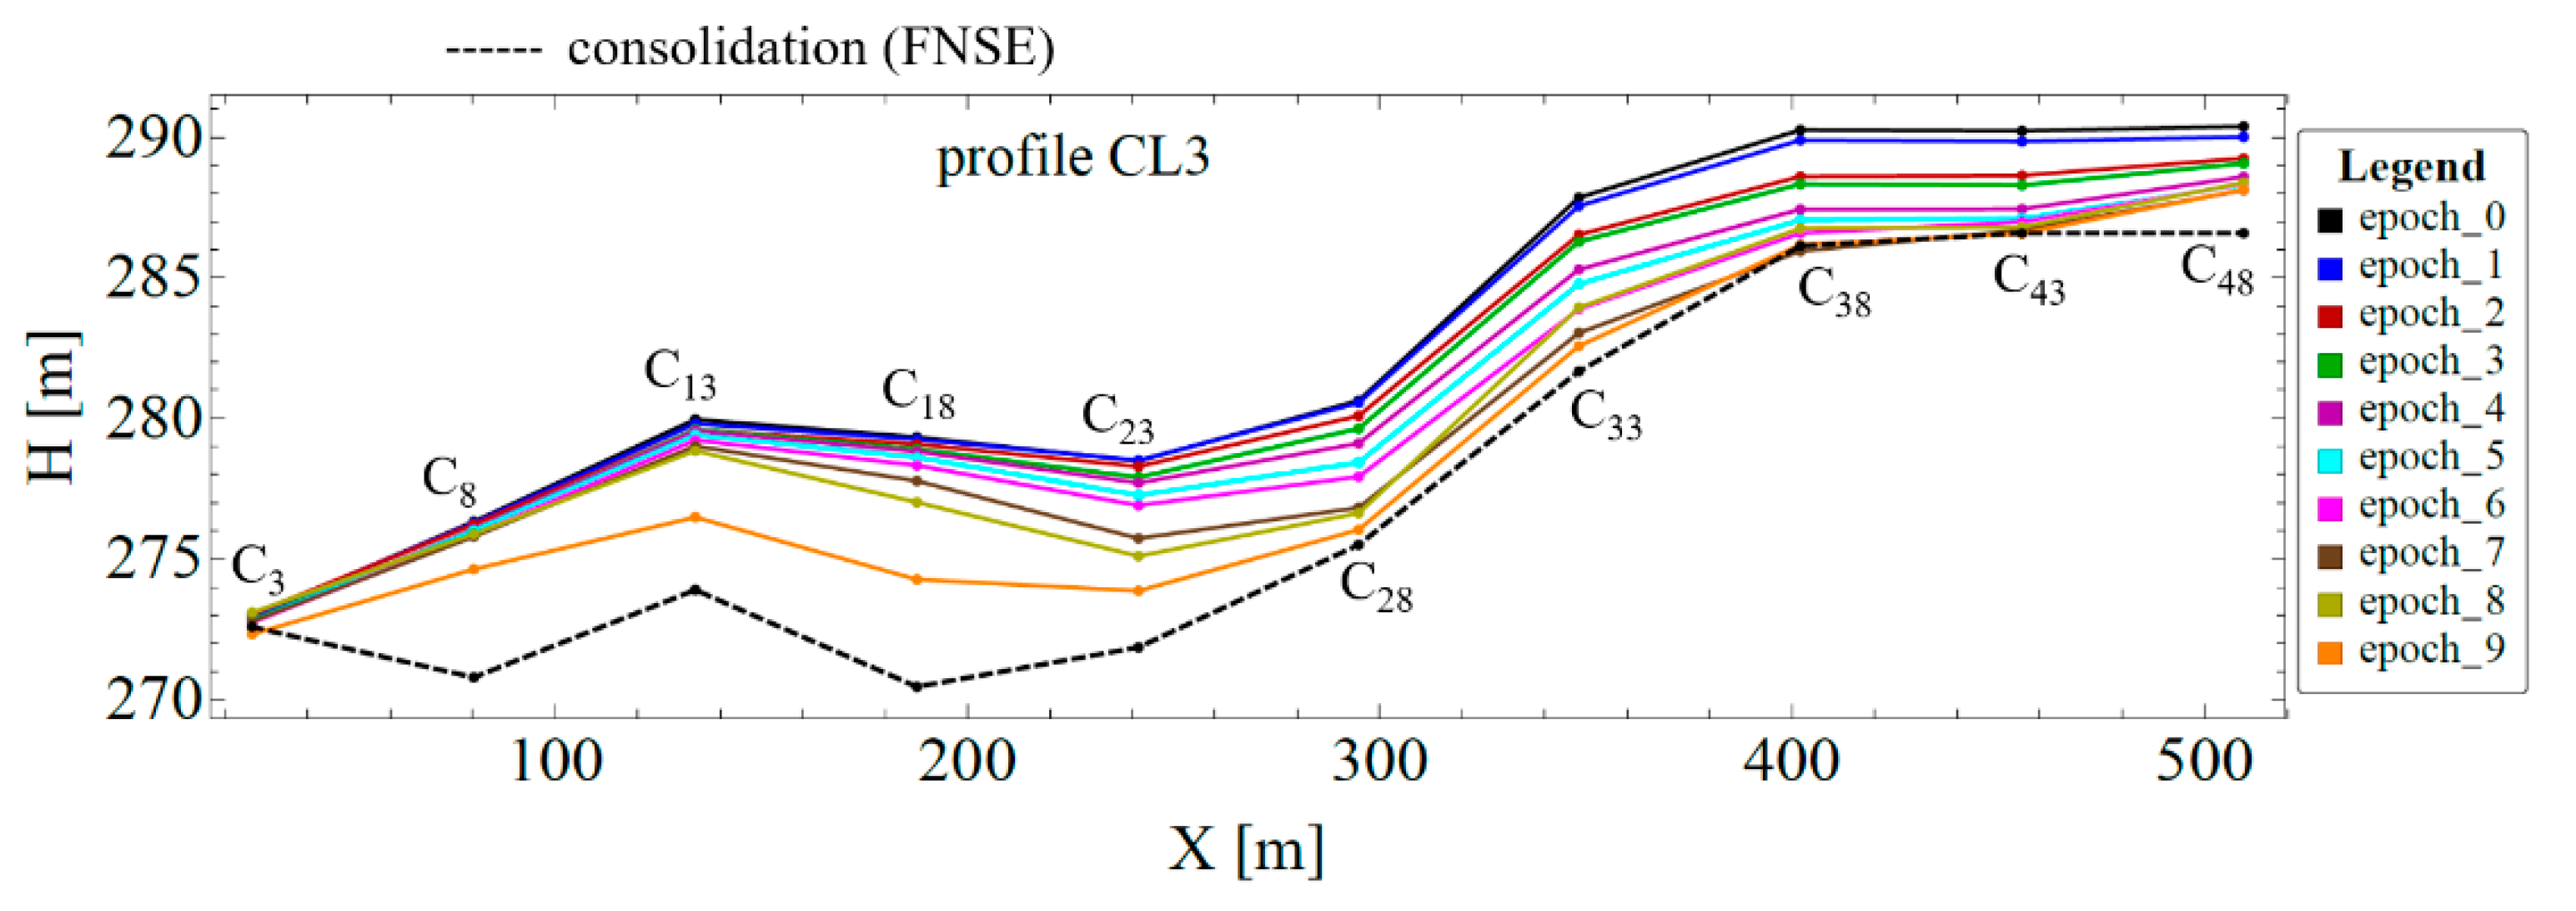
Figure 13.
Calculated centroid height by profile Cw7, including height at predicted consolidation (FNSE) and determined 75% or 90% total subsidence.
Figure 13.
Calculated centroid height by profile Cw7, including height at predicted consolidation (FNSE) and determined 75% or 90% total subsidence.
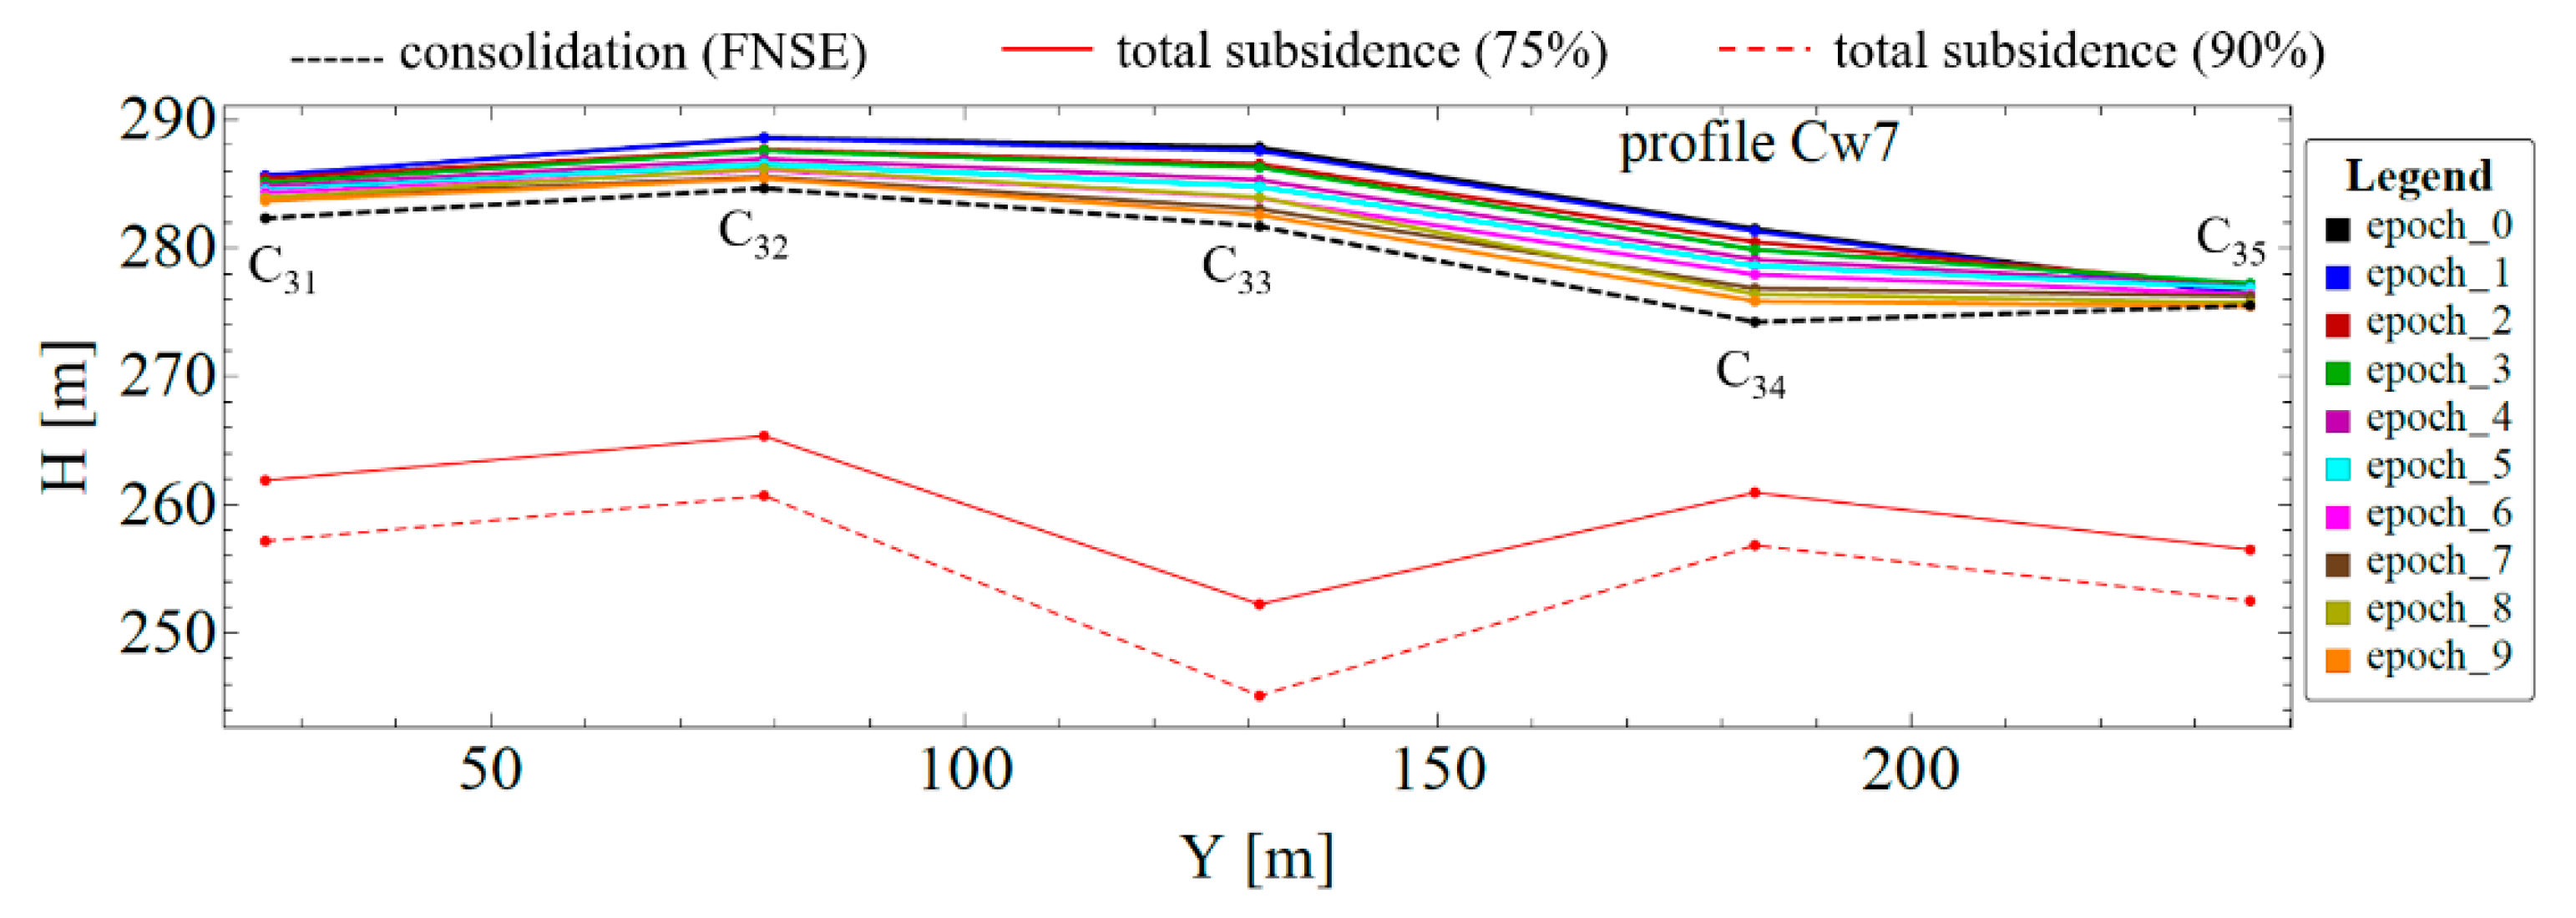
Figure 14.
Calculated centroid height by profile CL3, including height at predicted consolidation (FNSE) and determined 75% or 90% total subsidence.
Figure 14.
Calculated centroid height by profile CL3, including height at predicted consolidation (FNSE) and determined 75% or 90% total subsidence.
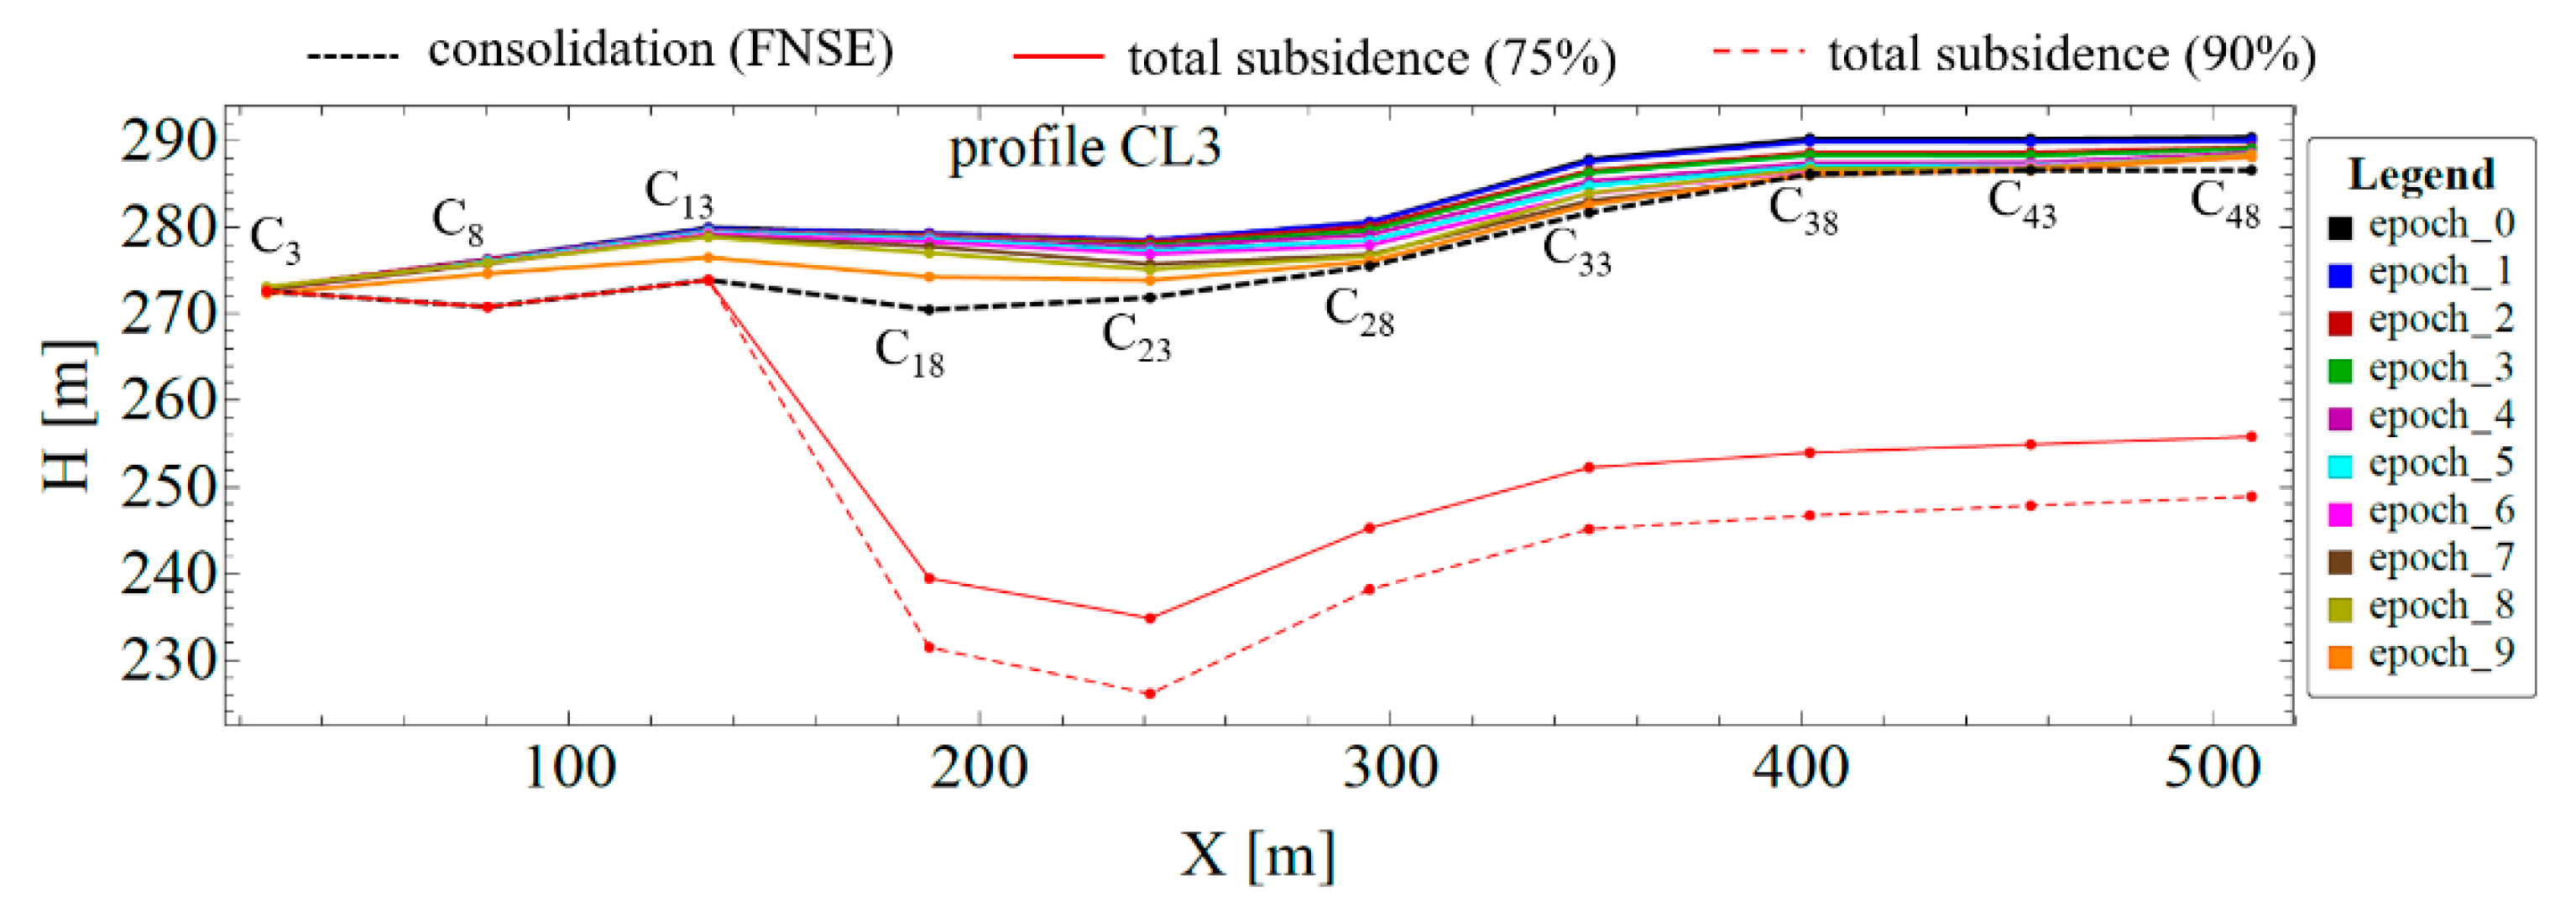
Figure 15.
Centroid C33 height in each epoch (color black), fitted FNSE model to the centroid data (color red), extrapolated values of the fitted model (color blue)—active subsidence.
Figure 15.
Centroid C33 height in each epoch (color black), fitted FNSE model to the centroid data (color red), extrapolated values of the fitted model (color blue)—active subsidence.
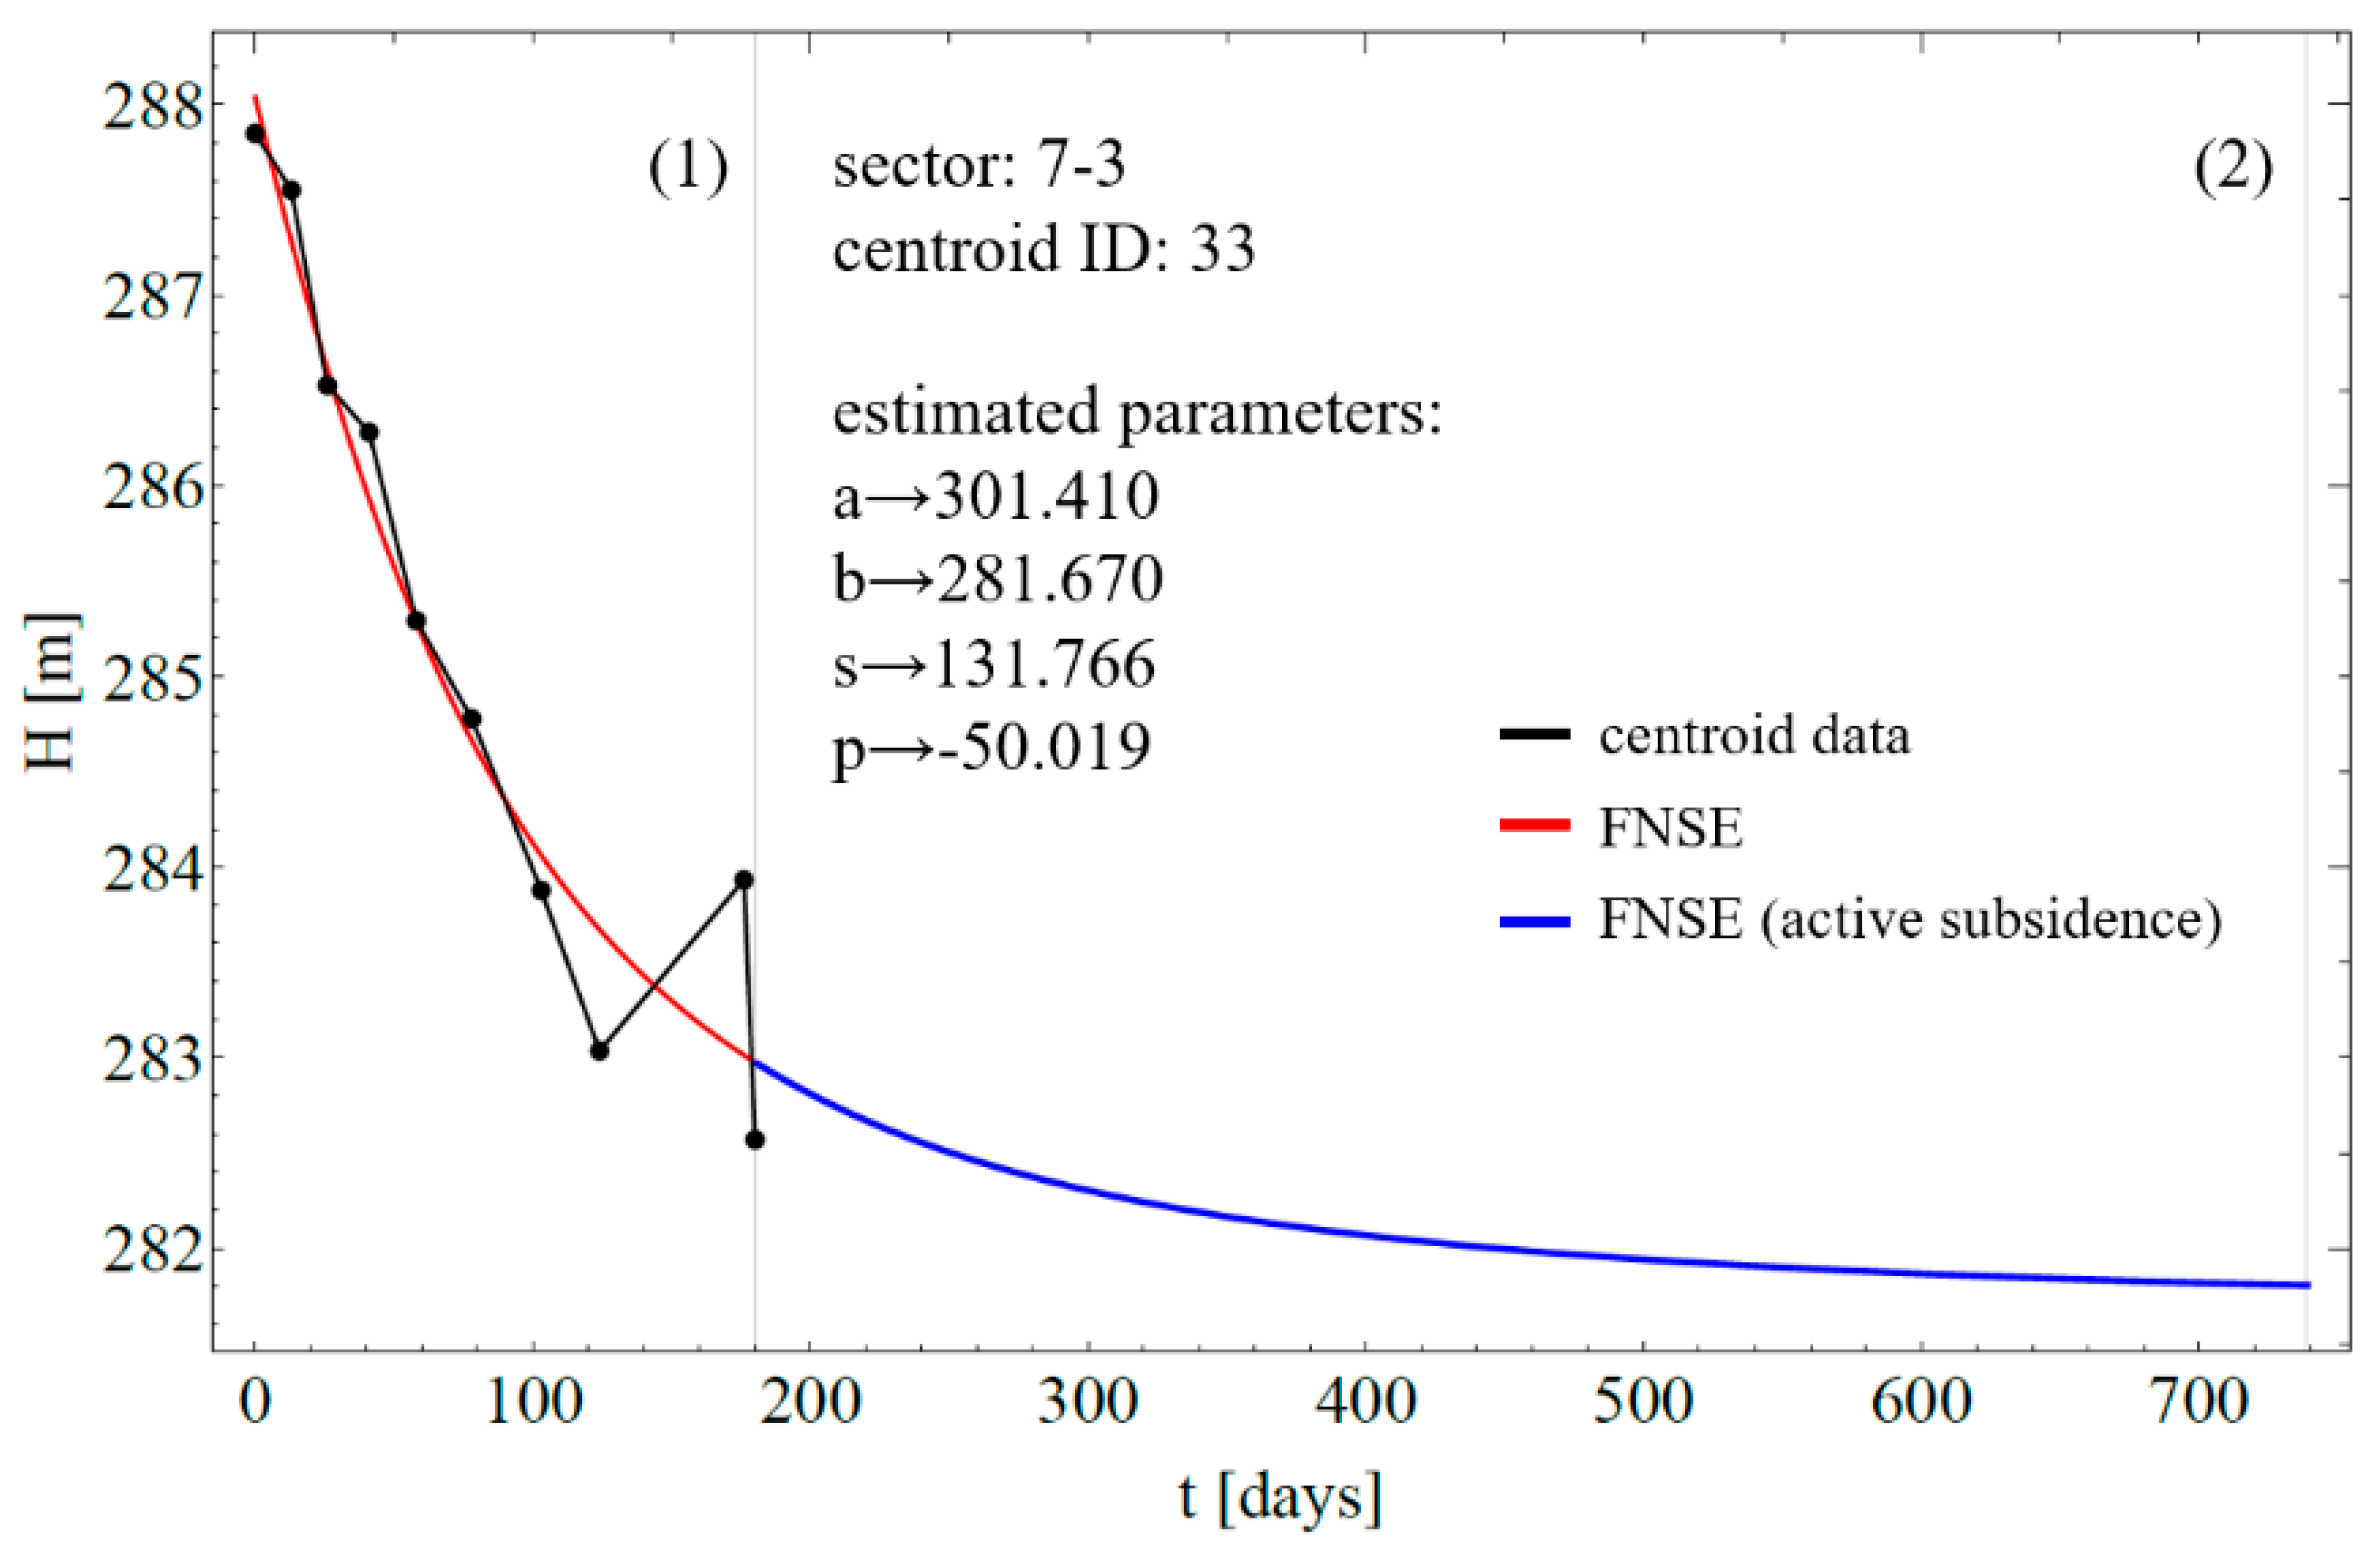
Figure 16.
Visualization of sectors categorization (I: ΔH ≤ 1 m, II: ΔH ≤ 3 m, III: ΔH ≤ 6 m and IV: ΔH > 6 m).
Figure 16.
Visualization of sectors categorization (I: ΔH ≤ 1 m, II: ΔH ≤ 3 m, III: ΔH ≤ 6 m and IV: ΔH > 6 m).
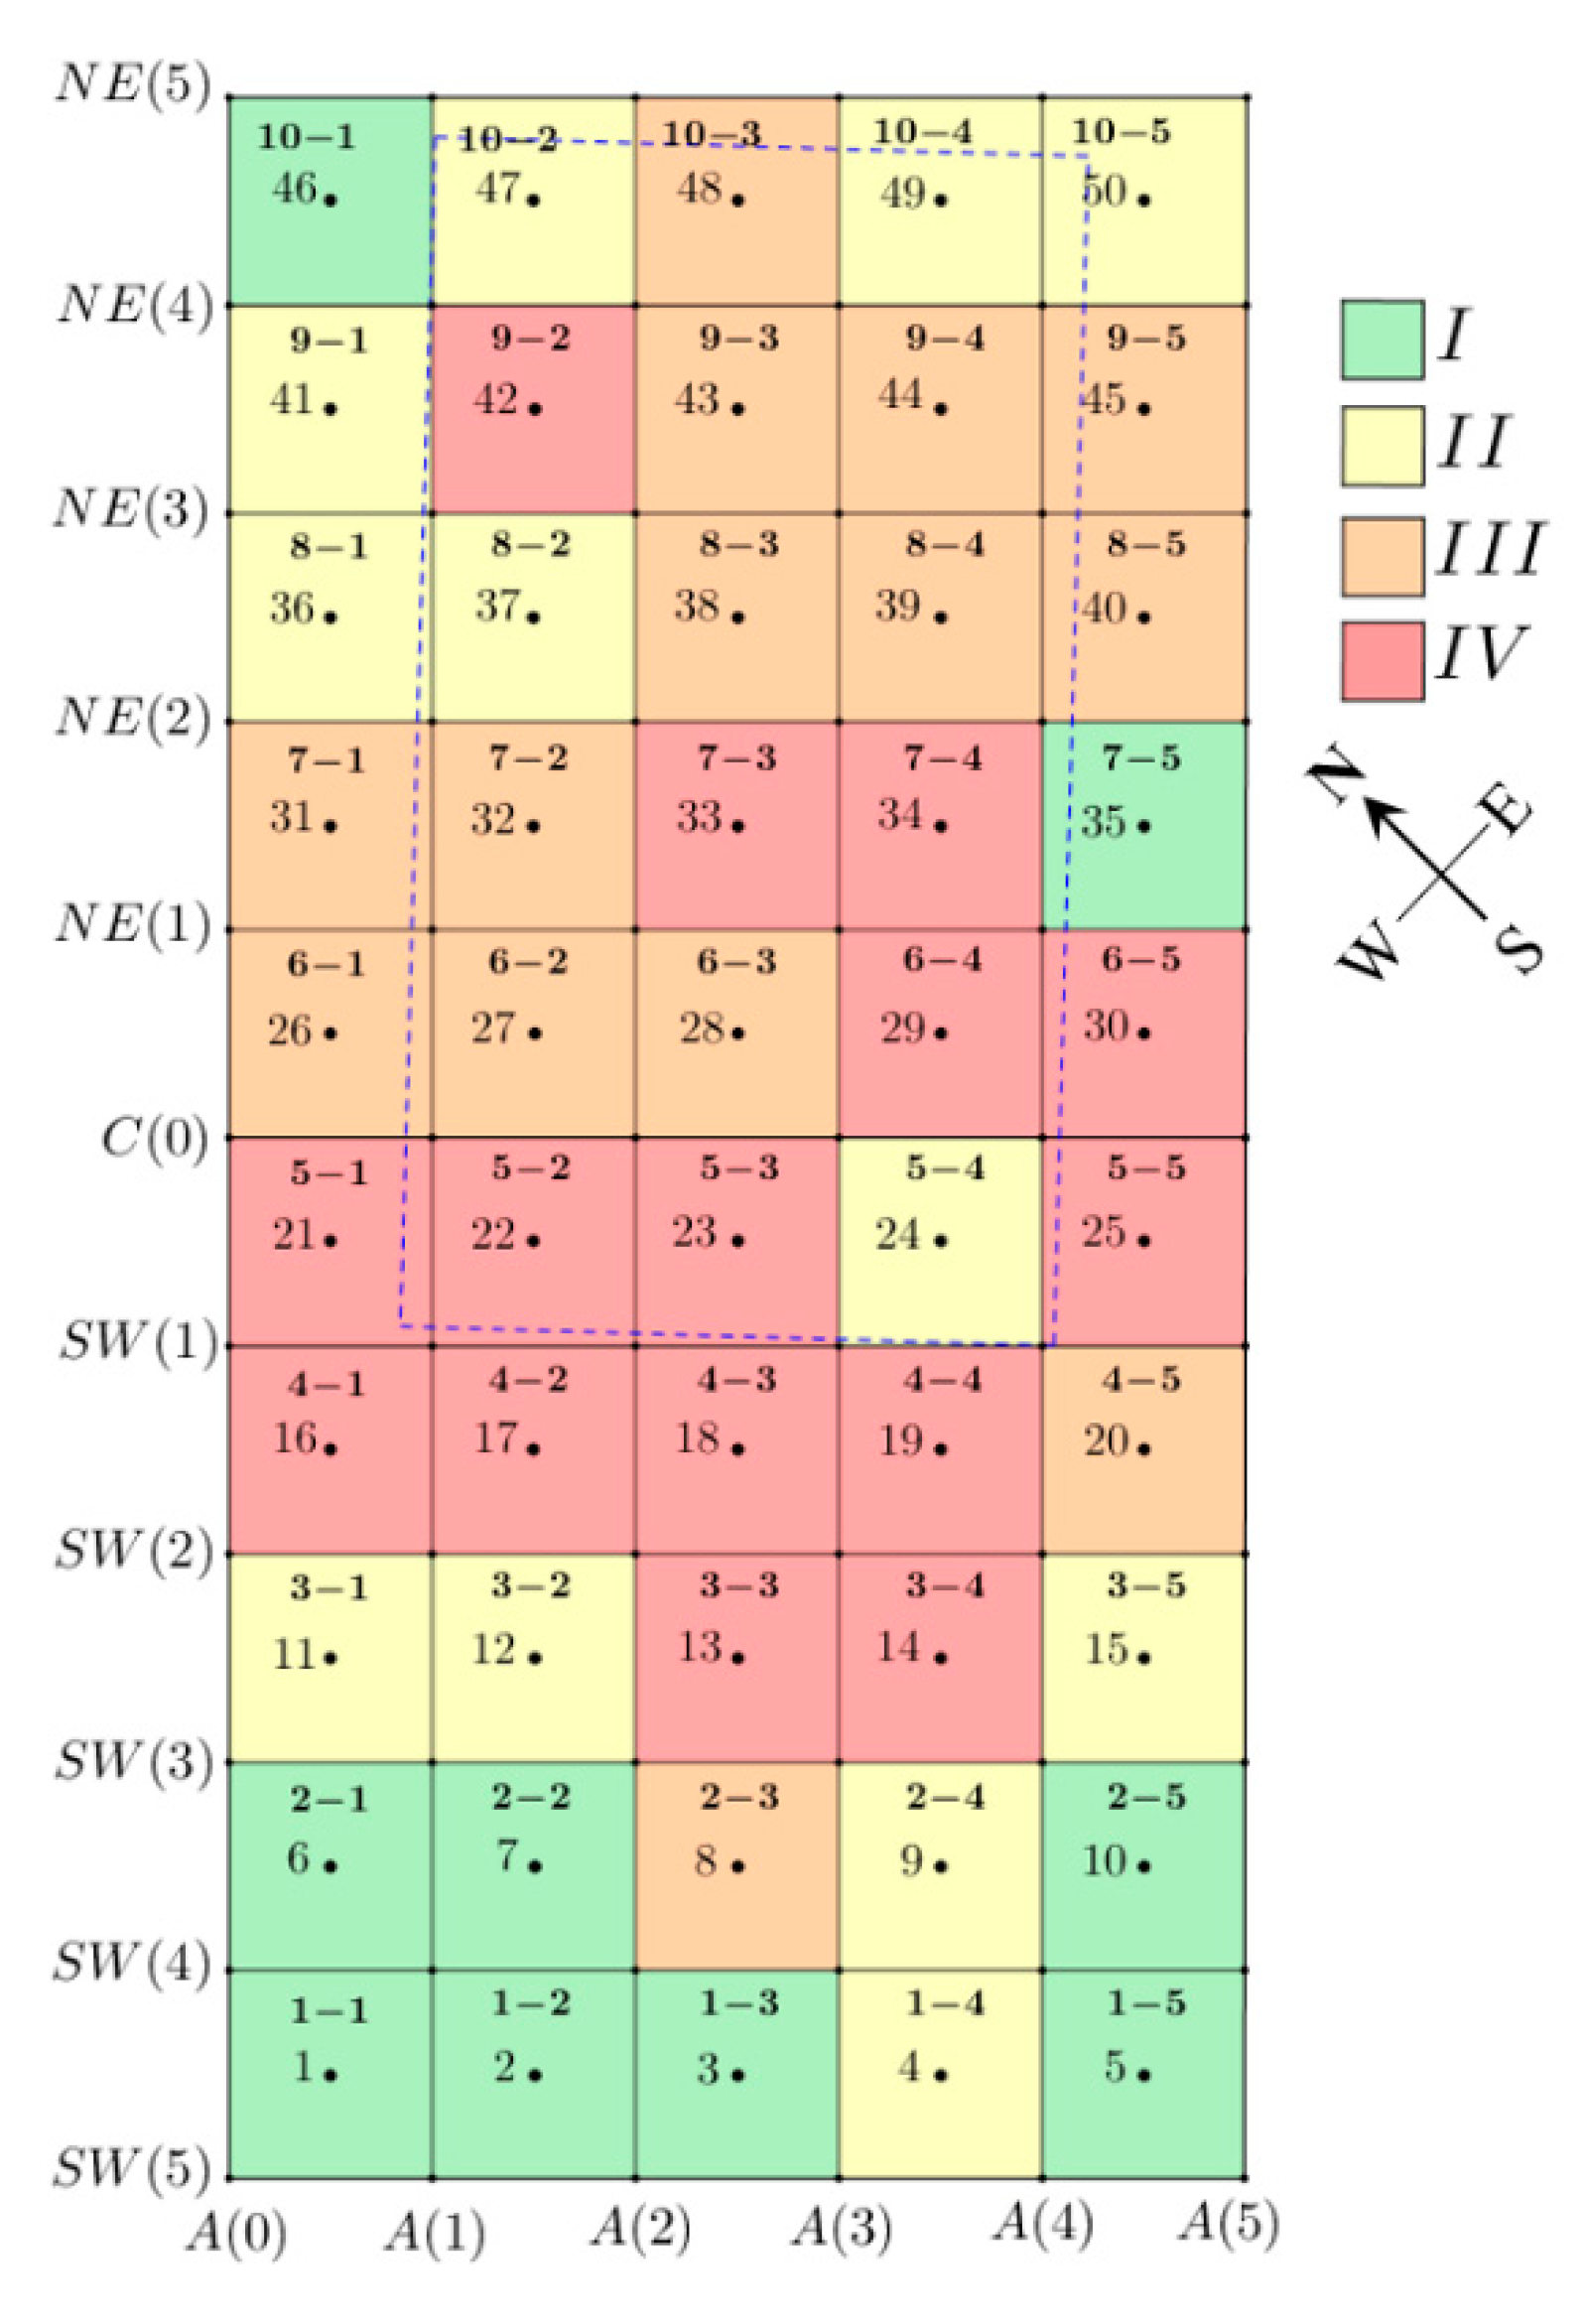
Figure 17.
Monitoring data C2C comparison along z-axis: (a) Epoch 0–1, (b) epoch 0–2, (c) epoch 0–3.
Figure 17.
Monitoring data C2C comparison along z-axis: (a) Epoch 0–1, (b) epoch 0–2, (c) epoch 0–3.
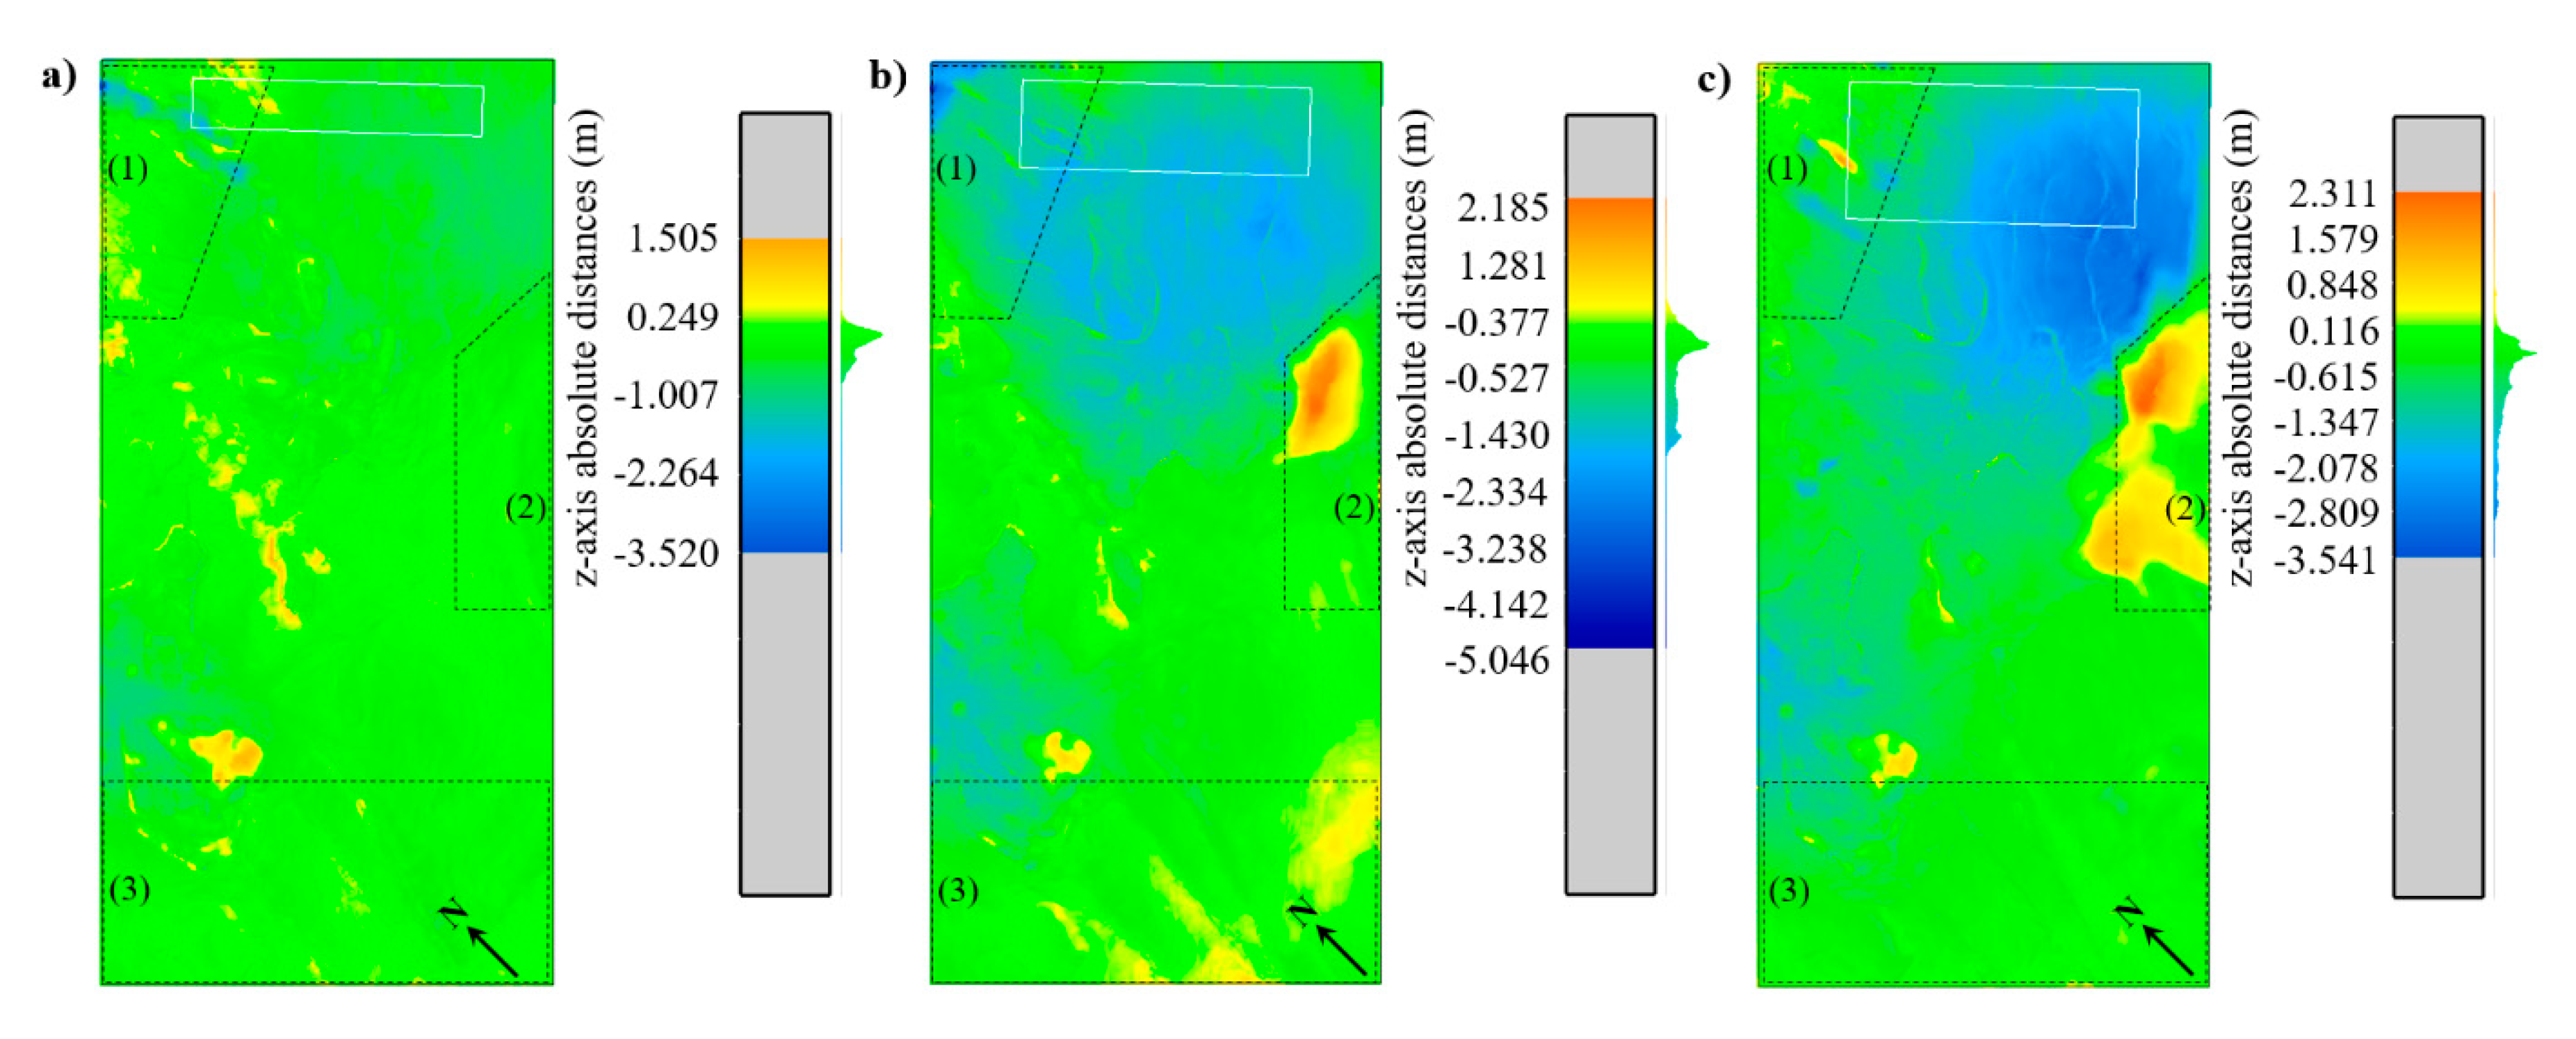
Figure 18.
Monitoring data C2C comparison along z-axis: (a) Epoch 0–4, (b) Epoch 0–5, (c) Epoch 0–6.
Figure 18.
Monitoring data C2C comparison along z-axis: (a) Epoch 0–4, (b) Epoch 0–5, (c) Epoch 0–6.

Figure 19.
Monitoring data C2C comparison along z-axis: (a) Epoch 0–7, (b) Epoch 0–8, (c) Epoch 0–9. The identified possible sinkholes (c) are S1, S2, S3, and S4.
Figure 19.
Monitoring data C2C comparison along z-axis: (a) Epoch 0–7, (b) Epoch 0–8, (c) Epoch 0–9. The identified possible sinkholes (c) are S1, S2, S3, and S4.
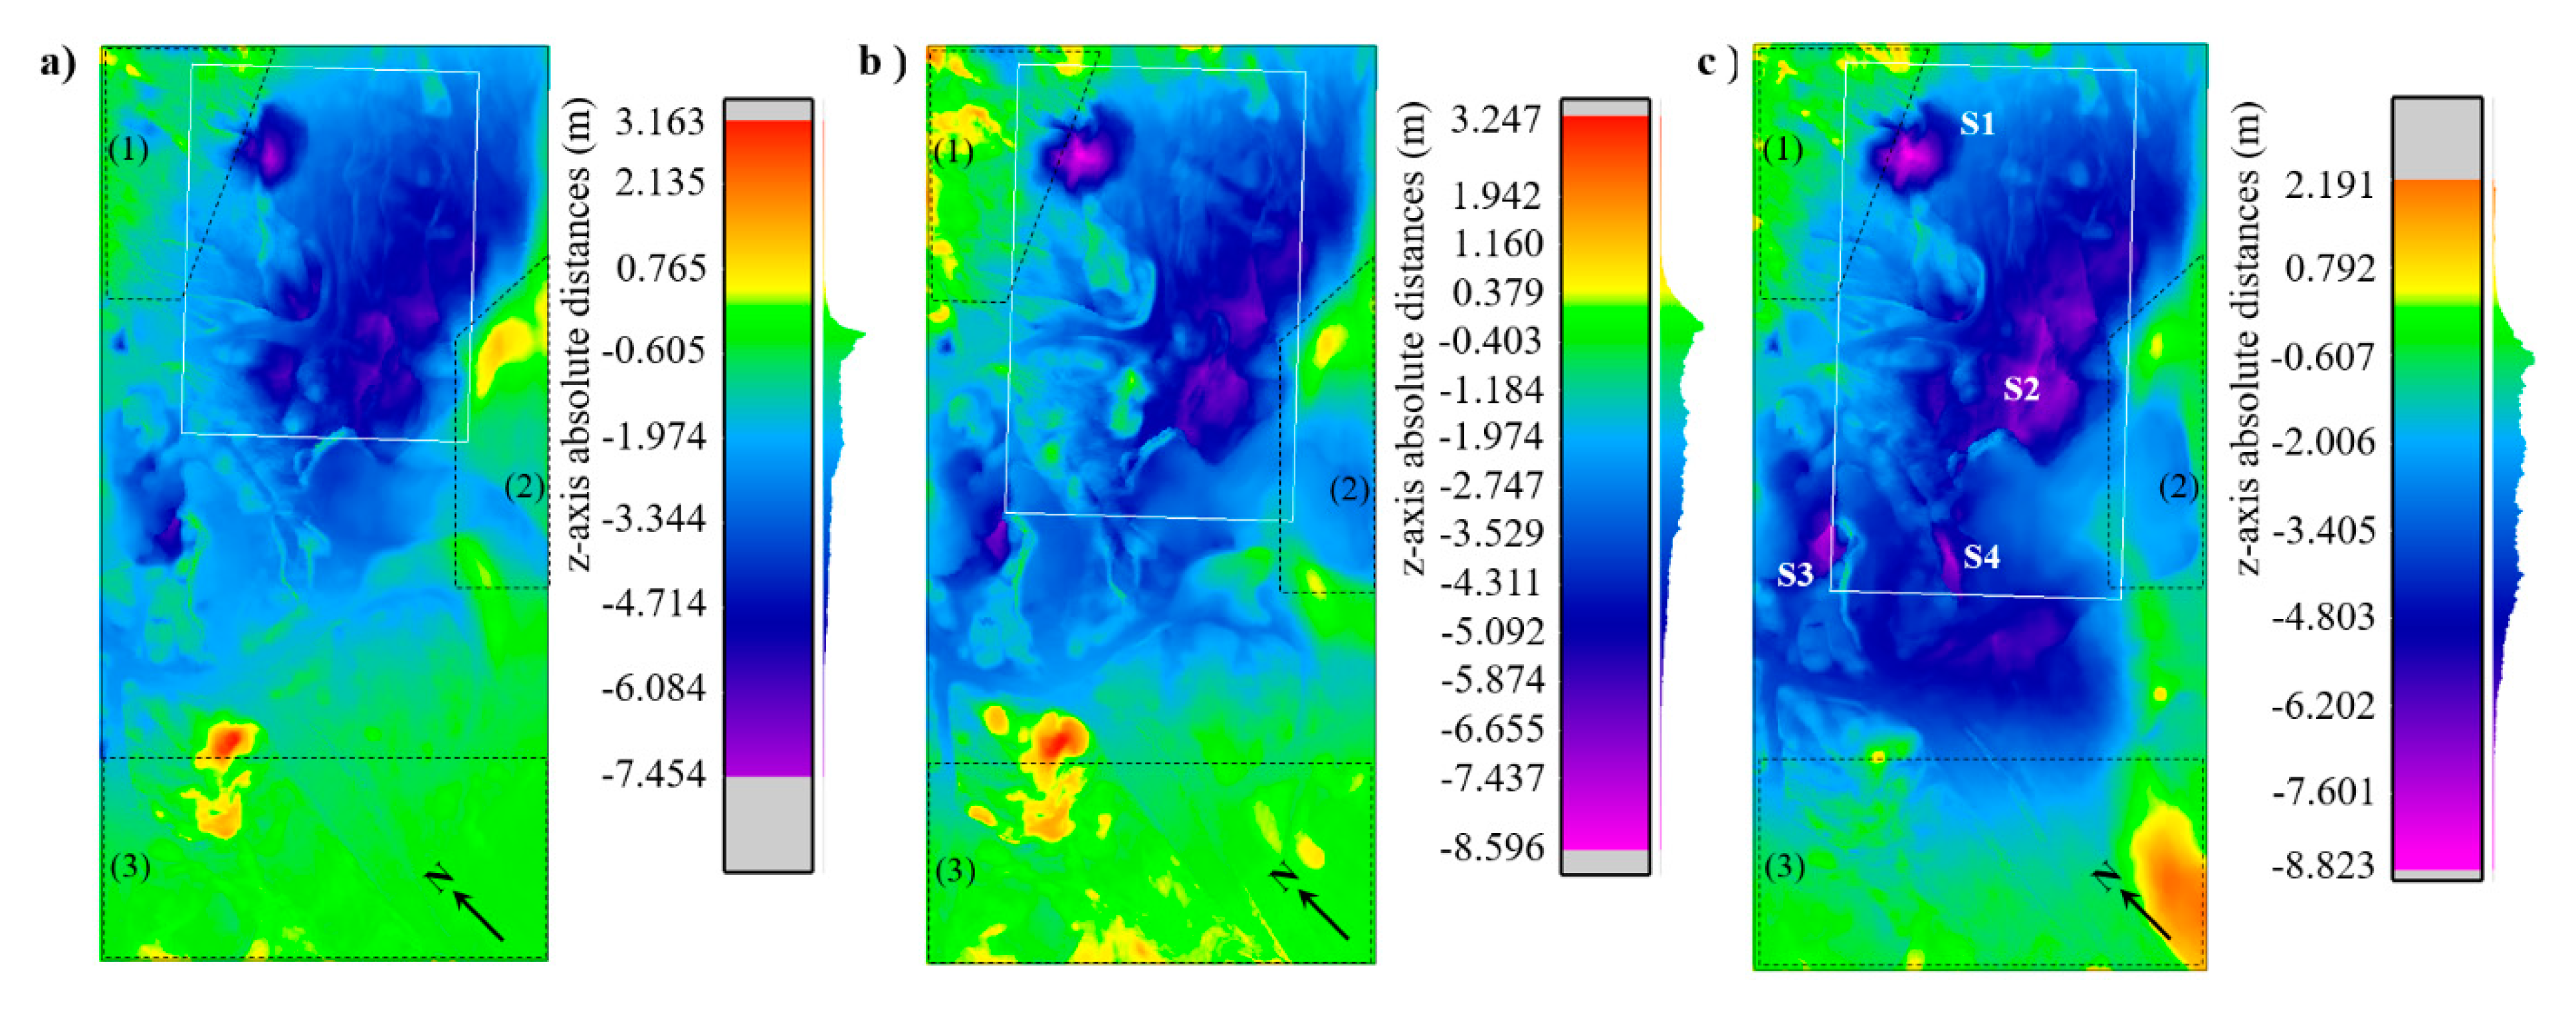
Figure 20.
Centroid data C2C comparison along z-axis: (a) Initial epoch point cloud compared to consolidation prognosis mesh, (b) initial epoch point cloud compared to total subsidence (75%) mesh.
Figure 20.
Centroid data C2C comparison along z-axis: (a) Initial epoch point cloud compared to consolidation prognosis mesh, (b) initial epoch point cloud compared to total subsidence (75%) mesh.
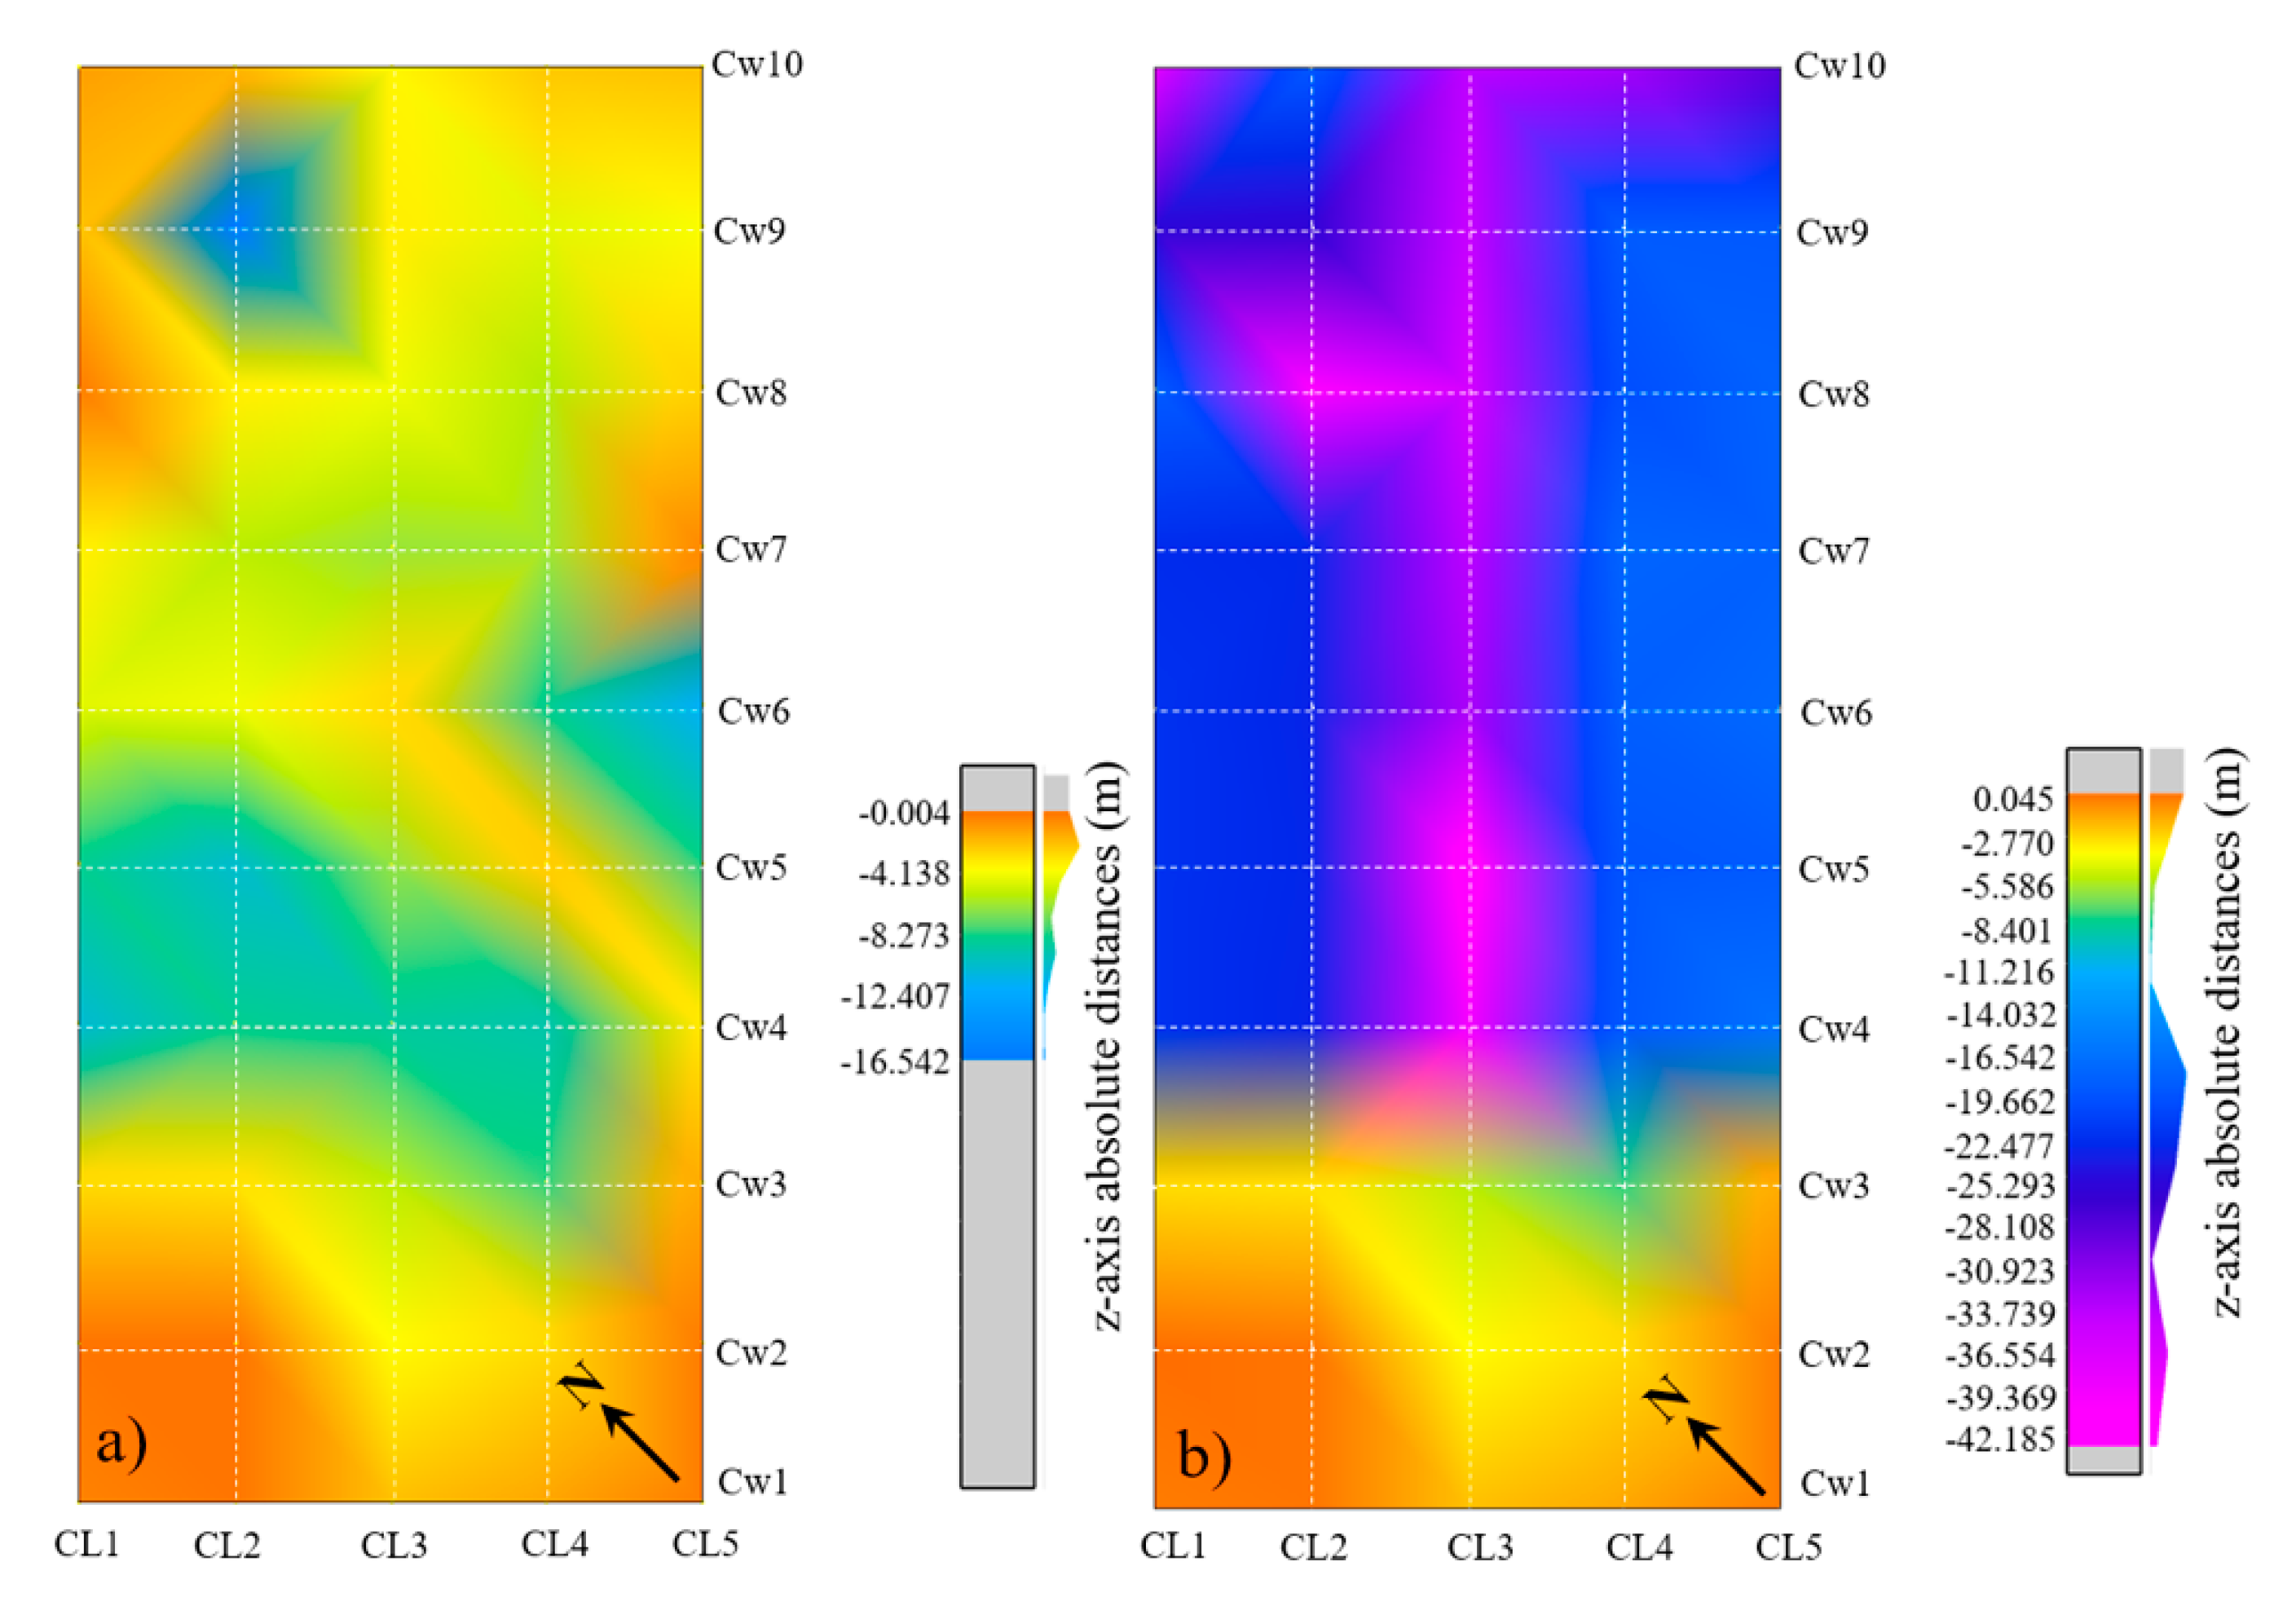
Figure 21.
Initial epoch 3D point cloud compared to the estimated consolidated terrain.

Figure 22.
Initial epoch 3D point cloud compared to the determined 75% of total subsidence.

Table 1.
Average mean errors in x, y, and z directions for each epoch.
| Epoch | 0 | 1 | 2 | 3 | 4 | 5 | 6 | 7 | 8 | 9 |
|---|---|---|---|---|---|---|---|---|---|---|
| x (m) | −0.0035 | 0.0025 | −0.0007 | 0.0023 | −0.0008 | −0.0007 | 0.0011 | −0.0001 | 0.0017 | −0.0013 |
| y (m) | −0.0045 | 0.0011 | −0.0004 | −0.0011 | 0.0002 | −0.0017 | 0.0009 | −0.0019 | −0.0023 | −0.0043 |
| z (m) | −0.0002 | 0.0010 | 0.0044 | −0.0078 | −0.0033 | 0.0000 | −0.0040 | −0.0063 | −0.0280 | −0.0111 |
Table 2.
Total excavation heights for 17 points across excavation front at every epoch.
| Epoch | Point ID | ||||||||||||||||
|---|---|---|---|---|---|---|---|---|---|---|---|---|---|---|---|---|---|
| 1 | 2 | 3 | 4 | 5 | 6 | 7 | 8 | 9 | 10 | 11 | 12 | 13 | 14 | 15 | 16 | 17 | |
| Total Excavation Height (m) | |||||||||||||||||
| 0 | 33.8 | 35.5 | 36.0 | 36.7 | 37.3 | 37.8 | 38.9 | 40.1 | 24.3 | 26.0 | 26.6 | 26.8 | 26.6 | 27.7 | 27.2 | 42.6 | 21.3 |
| 1 | 28.8 | 30.5 | 31.8 | 33.6 | 34.0 | 34.3 | 34.7 | 39.0 | 20.1 | 6.9 | 6.7 | 7.8 | 8.9 | 9.9 | 9.1 | 8.9 | 9.3 |
| 2 | 17.9 | 19.0 | 20.2 | 20.3 | 21.8 | 22.3 | 22.6 | 35.1 | 23.9 | 8.3 | 8.0 | 8.0 | 7.6 | 8.1 | 8.4 | 8.1 | 7.9 |
| 3 | 14.7 | 16.1 | 18.1 | 18.4 | 19.3 | 20.1 | 20.4 | 35.5 | 22.5 | 9.8 | 9.6 | 9.8 | 9.6 | 9.7 | 9.4 | 9.1 | 9.0 |
| 4 | 12.8 | 13.3 | 14.2 | 14.8 | 15.6 | 16.5 | 16.7 | 30.2 | 30.0 | 11.7 | 11.4 | 11.0 | 10.7 | 10.2 | 10.2 | 9.7 | 9.6 |
| 5 | 15.5 | 15.5 | 15.5 | 16.1 | 16.1 | 16.1 | 18.2 | 30.5 | 31.0 | 13.0 | 11.9 | 11.6 | 11.3 | 11.0 | 10.2 | 10.4 | 10.5 |
| 6 | 14.5 | 15.0 | 15.8 | 16.3 | 17.2 | 17.6 | 18.1 | 32.2 | 32.2 | 13.4 | 13.3 | 12.2 | 11.4 | 9.8 | 9.7 | 10.5 | 10.8 |
| 7 | 15.4 | 15.8 | 16.5 | 16.9 | 17.5 | 18.2 | 18.7 | 33.7 | 33.8 | 14.4 | 13.3 | 12.4 | 11.5 | 10.7 | 10.0 | 9.7 | 9.6 |
| 8 | 16.7 | 17.1 | 17.3 | 17.7 | 18.1 | 18.4 | 18.2 | 33.5 | 34.1 | 15.0 | 14.2 | 13.7 | 12.8 | 12.4 | 11.8 | 11.8 | 11.8 |
| 9 | 16.6 | 16.7 | 16.4 | 16.7 | 17 | 17.9 | 31.3 | 32.3 | 33.6 | 15.0 | 13.5 | 12.9 | 12.3 | 11.5 | 10.5 | 10.4 | 10.4 |
Table 3.
Epochs time-table and measured lengths of the excavated space.
| Epoch | 0 | 1 | 2 | 3 | 4 | 5 | 6 | 7 | 8 | 9 |
|---|---|---|---|---|---|---|---|---|---|---|
| Date (2017) | 2 Feb | 15 Feb | 1 Mar | 15 Mar | 1 Apr | 21 Apr | 16 May | 2 Jun | 28 Jun | 1 Aug |
| t (days) | 0 | 13 | 27 | 41 | 58 | 78 | 103 | 120 | 146 | 180 |
| L (m) | 0.0 | 29 | 51.1 | 79.8 | 112.9 | 163 | 199.9 | 216.8 | 262.6 | 306.4 |
Table 4.
Heights of the calculated centroids on profiles Cw7 and CL3.
| Epoch | 0 | 1 | 2 | 3 | 4 | 5 | 6 | 7 | 8 | 9 |
|---|---|---|---|---|---|---|---|---|---|---|
| Centroid ID | Height (m) | |||||||||
| 3 | 272.942 | 272.975 | 273.032 | 272.825 | 272.767 | 272.765 | 272.735 | 272.779 | 273.093 | 272.324 |
| 8 | 276.326 | 276.273 | 276.230 | 276.033 | 276.057 | 276.015 | 275.863 | 275.793 | 275.886 | 274.635 |
| 13 | 279.961 | 279.807 | 279.594 | 279.610 | 279.557 | 279.413 | 279.227 | 279.012 | 278.845 | 276.483 |
| 18 | 279.330 | 279.255 | 279.078 | 278.901 | 278.821 | 278.614 | 278.327 | 277.773 | 277.015 | 274.269 |
| 23 | 278.483 | 278.506 | 278.287 | 277.904 | 277.701 | 277.264 | 276.904 | 275.731 | 275.101 | 273.866 |
| 28 | 280.632 | 280.549 | 280.088 | 279.633 | 279.110 | 278.433 | 277.924 | 276.824 | 276.628 | 276.038 |
| 31 | 285.594 | 285.638 | 285.416 | 285.089 | 284.796 | 284.538 | 284.306 | 283.884 | 283.928 | 283.662 |
| 32 | 288.598 | 288.547 | 287.672 | 287.572 | 286.945 | 286.544 | 286.071 | 285.531 | 286.180 | 285.405 |
| 33 | 287.849 | 287.551 | 286.527 | 286.281 | 285.292 | 284.777 | 283.877 | 283.036 | 283.932 | 282.570 |
| 34 | 281.491 | 281.294 | 280.451 | 279.850 | 279.088 | 278.600 | 277.920 | 276.846 | 276.397 | 275.839 |
| 35 | 276.440 | 276.301 | 277.036 | 277.212 | 276.958 | 276.879 | 276.374 | 276.242 | 275.699 | 275.451 |
| 38 | 290.253 | 289.890 | 288.601 | 288.327 | 287.431 | 287.049 | 286.587 | 285.943 | 286.752 | 286.172 |
| 43 | 290.219 | 289.845 | 288.634 | 288.287 | 287.440 | 287.110 | 286.990 | 286.691 | 286.802 | 286.570 |
| 48 | 290.378 | 290.004 | 289.243 | 289.066 | 288.590 | 288.305 | 288.341 | 288.111 | 288.385 | 288.132 |
Table 5.
Categorization of sectors by the size of occurred subsidence before consolidation is reached and the necessary measures of terrain reclamation.
Table 5.
Categorization of sectors by the size of occurred subsidence before consolidation is reached and the necessary measures of terrain reclamation.
| Category | ΔH (m) | Necessary Measures |
|---|---|---|
| I | ≤1 | none |
| II | ≤3 | terrain reclamation needed |
| III | ≤6 | intense terrain reclamation needed |
| IV | >6 | intense terrain reclamation needed and a chance for sinkhole occurrence |
Table 6.
Heights of the calculated centroids on profiles Cw7 and CL3 in the initial epoch, in consolidation prognosis with the FNSE model, and in the final subsidence prognosis.
Table 6.
Heights of the calculated centroids on profiles Cw7 and CL3 in the initial epoch, in consolidation prognosis with the FNSE model, and in the final subsidence prognosis.
| Centroid ID | Initial Epoch | Consolidation | Final Subsidence (75%) | Final Subsidence (90%) |
|---|---|---|---|---|
| (/) | H (m) | H (m) | H (m) | H (m) |
| 3 | 272.942 | 272.584 | 272.584 | 272.584 |
| 8 | 276.326 | 270.787 | 270.787 | 270.787 |
| 13 | 279.961 | 273.898 | 273.898 | 273.898 |
| 18 | 279.330 | 270.455 | 239.430 | 231.450 |
| 23 | 278.483 | 271.858 | 234.833 | 226.103 |
| 28 | 280.632 | 275.504 | 245.232 | 238.152 |
| 31 | 285.594 | 282.304 | 261.894 | 257.154 |
| 32 | 288.598 | 284.631 | 265.348 | 260.698 |
| 33 | 287.849 | 281.670 | 252.234 | 245.111 |
| 34 | 281.491 | 274.223 | 260.941 | 256.831 |
| 35 | 276.440 | 275.504 | 256.490 | 252.500 |
| 38 | 290.253 | 286.136 | 253.953 | 246.693 |
| 43 | 290.219 | 286.582 | 254.894 | 247.829 |
| 48 | 290.378 | 286.582 | 255.803 | 248.888 |
© 2020 by the authors. Licensee MDPI, Basel, Switzerland. This article is an open access article distributed under the terms and conditions of the Creative Commons Attribution (CC BY) license (http://creativecommons.org/licenses/by/4.0/).
Share and Cite
MDPI and ACS Style
Pal, A.; Rošer, J.; Vulić, M. Surface Subsidence Prognosis above an Underground Longwall Excavation and Based on 3D Point Cloud Analysis. Minerals 2020, 10, 82. https://doi.org/10.3390/min10010082
AMA Style
Pal A, Rošer J, Vulić M. Surface Subsidence Prognosis above an Underground Longwall Excavation and Based on 3D Point Cloud Analysis. Minerals. 2020; 10(1):82. https://doi.org/10.3390/min10010082
Chicago/Turabian StylePal, Andrej, Janez Rošer, and Milivoj Vulić. 2020. "Surface Subsidence Prognosis above an Underground Longwall Excavation and Based on 3D Point Cloud Analysis" Minerals 10, no. 1: 82. https://doi.org/10.3390/min10010082
Note that from the first issue of 2016, this journal uses article numbers instead of page numbers. See further details here.