Experimental Tests on a Small-Scale Model of a Mine Stope to Study the Behavior of Waste Rock Barricades during Backfilling


1
Research Institute of Mines and Environment, Université du Québec en Abitibi-Témiscamingue (UQAT), Rouyn-Noranda, QC J9X 5E4, Canada
2
GeoRessources Laboratory, Université de Lorraine (ENSG), CNRS, CREGU, F-54518 Vandoeuvre-lès-Nancy, France
*
Author to whom correspondence should be addressed.
Minerals 2020, 10(11), 941; https://doi.org/10.3390/min10110941
Submission received: 15 September 2020
/
Revised: 20 October 2020
/
Accepted: 21 October 2020
/
Published: 23 October 2020
(This article belongs to the Special Issue Practical Solutions for Underground Mine Backfilling Systems)
Abstract
:This paper presents a reduced-scale physical model of a mine stope used to reproduce the underground stope backfilling practiced in some Canadian mines. The objective is to study the geomechanical behavior of the waste rock barricades in interaction with the mine backfill. The instrumentations, along with visual observations and preliminary results, are presented. The main results demonstrated that: (i) the stability of the barricade depends on its physical properties (e.g., size, location, particles gradation and compaction) and the frictional behavior at the barricade/drift walls interface, and (ii) for two backfill formulations, cemented and uncemented, prepared with 70% of solid mass concentration, the volumetric strain due to self-weight consolidation of the backfilled room was higher for uncemented backfill (16%) than for the cemented one (4.5%). In addition, the results highlighted the importance of using shotcrete around the downstream face of the barricade, mostly at the top, to close the gaps and bind the barricade particles, which improves its stability.
1. Introduction
The purpose of mining is to extract minerals from the crust of the earth, which in turn creates voids that alter the existing stress field and lead to instability. Large quantities of waste rock and tailings are produced and stored in waste rock dumps and tailings storage facilities during mining operations. Acid mine drainage (AMD) or contaminated neutral drainage (CND) can occur when these wastes are exposed to atmospheric conditions, resulting in potential pollution of the environment. Underground backfilling offers important economic and environmental benefits for mining operations [1,2,3,4]. It also offers a great deal of flexibility and enhances the strategic approach to running. The use of various types of backfills has to do with technical requirements, operating methods, and strategic plans. In general, the geometry of the ore deposit is what determines the method of extraction. The hard rock mining methods that use backfilling as a secondary support system are Open Stope and Cut and Fill [3]. The need for backfilling is rising with deeper mining, as the critical span becomes smaller and smaller. Using backfilling as a support strategy to support stope walls will allow reducing their potential movement. Indeed, backfill enhances the stability of the fractured rock mass in two distinct ways: first, restricts the opening of cracks and discontinuations, and second, reduces the convergence of the openings and improves the regional stability [3]. Backfill systems are designed according to the required materials and functions, and each operation is regulated by the hydromechanical characteristics of the backfill, the mechanical properties of the rock masses, and the extraction strategies. The paste fill or the cemented paste backfill (CPB) is the most successful and popular of the three different types currently in use in mining (rock fill, hydraulic fill, paste fill). This type of backfill is more homogeneous and provides better strength according to the needs in ground control. The transport of the backfill depends on its fluidity, which could affect its final mechanical performance. The cost of the binder represents nearly 80% of the backfill operation costs.
The understanding of mine backfill requires a multidisciplinary approach, ranging from soil mechanics to geomechanics through fluid mechanics, mineral processing, and other relevant topics. Understanding the behavior of the barricades made of waste rock and that must retain the backfill in place in the open stope is essential to ensure their safe use. The main backfill components are full stream tailings (which have a variable source depending on the ore type), mixing water, and binding agent. The tailings contain grains ranging from silt size to clay size and their distribution affects the porosity, wet density, self-weight consolidation, and compressive strength of the resultant CPB. The tailings mineralogy (e.g., presence of clayey particles) can affect the binder dosage, water retention, and chemical/geochemical stability, which can weaken the backfill [5,6]. The binder type and proportion also affect the backfill strength development over the curing time [3,7,8,9,10]. The chemistry of the mixing water can also influence the overall CPB strength, especially when they contain dissolved sulfate salts such as sulfosalt [2,3,4,11]. Acidic water and sulfate salts damage the cement bonds in the backfill, leading to loss of strength, durability, and long-term stability [3,12,13,14]. Underground backfilling of open stopes requires the construction of a barricade placed in the drift (drawpoint) to retain the backfill in the filling chamber (open stope). Serious consequences can occur if barricades fail, such as damage to mining equipment, injuries, or even death of mine personnel. Depending on the type of backfill, the barricade is generally built of permeable brick fibercrete or concrete (hydraulic fill), timber frame (hydraulic and paste fill), shotcrete (hydraulic and paste fill), or waste rock (paste fill) [11]. Waste rock barricades are efficient and commonly used in several underground mines since they are available through mining production [11]. These barricades are still poorly documented [15,16] and must be properly designed to avoid any failure that could slow down mining production. The study of the barricade stability requires a correct estimation of pore water and total pressures in backfilled stopes and on barricades during and shortly after the backfilling [11,17]. After backfilling, the total pressures on backfilled stopes and barricades decrease significantly due to several phenomena such as the development of the arching phenomenon, dissipation of pore water pressure (PWP), and cemented backfill hardening [3,4,18,19,20]. Numerous analytical approaches, predictive models, and in situ measurements have been suggested through the literature, in which each investigation has its benefits and limitations, but further investigations are required to determine the critical backfill pressure on the barricade and its design procedure. Several mine stopes were implemented with in situ instrumentation [21,22,23,24,25,26] to evaluate the PWP and total/effective stresses in stopes. Also, several reduced-scale physical models of mine stopes have been used to study the distribution of vertical stresses [27,28,29,30] or to study the self-weight consolidation settlement of the paste backfill in different drainage conditions (see Reference [18]). Numerical modeling is another approach commonly used to evaluate the stress state in backfilled stopes and to study the influence of different parameters, such as backfill properties, characteristics of the fill/wall interface, the rate of the filling, and pores’ water pressures [31,32,33,34,35,36,37,38,39,40,41,42,43,44,45,46,47,48,49,50,51,52]. Designing waste rock barricade, however, represents a significant problem, and more research is needed to determine the critical backfill pressure on the barricade.
Two approaches to studying problems in geotechnical engineering are the instrumentation of the actual site/structure and the use of small-scale models. The instrumentation of a full-scale structure makes it possible to validate the results and design methods as well as the calibration of numerical models. In real mining stopes, it is difficult to monitor the barricade–backfill interaction as well as to study the mechanism of collapse of the waste rock barricades and their ultimate strength. Therefore, small-scale physical models seem to be the plausible way to study such a case. Laboratory testing using these models facilitates the control or modification of material properties and increases stress to failure. Scale model experiments have been conducted for a very long time and under specified conditions. The model must fulfill such requirements to be able to transpose its mechanical behavior to that of the full structure. The establishment of similarity laws is based on a dimensional analysis, taking into account the invariance of the general equations of mechanics to the unit change [53]. These equations are the general equations of dynamics, the mass conservation equation, and the constitutive laws of various materials. Often, it is challenging to meet all these conditions at the same time, forcing experimenters to settle for a wider similarity [54,55,56]. Physical modeling can be classified, with regard to similarity conditions, into three main categories: (i) total similarity, if the model simulates all the characteristics of the prototype (full scale), (ii) partial similarity, if the model does not meet certain similarity conditions, in order to improve the prediction of certain aspects of the behavior of the prototype, and (iii) qualitative similarity, if there is no similarity between the model and the prototype, but with some analogy, the model can accurately predict the behavior of the prototype. Our research project is classified in the third category, which deals with the qualitative study of a complex phenomenon. In this study, a small-scale model is used to conduct qualitative experiments (at 1/50th of scale length factor) on the stability and failure mechanisms of waste rock barricades during paste backfill placement. This small-scale model, that is made from transparent plexiglass for simulating underground backfilling, allows to visually observe the interaction between the barricade and the backfill. The transparent model also allows the barricade to be monitored during saturation, drainage, and at failure when additional external pressure is applied. This study addressed different issues such as the effect of total pressure induced by the backfill on the barricade, the effect of waste rock particles gradation on the barricade–backfill interaction, and the stability/failure of waste rock barricades.
2. Small-Scale Model and Equipment Description
Figure 1 shows the small-scale model used with the associated measurement tools. This reduced physical model is designed to simulate underground backfilling operations. A waste rock barricade retains the paste backfill injected in the physical model (longitudinal-type stope) during the filling. This model, with a length scale factor L* of 1/50 (), will mimic a typical mine longitudinal stope in the Abitibi region in Quebec (Canada).
The small-scale model was built from acrylic glass or plexiglass ((Poly (Methyl Methacrylate) (PMMA)). The PMMA plates of the model have smooth surfaces and may not well reflect the rock wall–backfill interface. Therefore, this research does not address the arching effect phenomenon that can affect the stress state in the backfill. The main feature of this type of PMM is its transparency, which allows monitoring the barricade and its interaction with the backfill during and after placement. The filling chamber (stope) has a horizontal section of 9 × 20 cm and a height of 38 cm (can be increased by another 38 cm to a full height of 76 cm during placement of the second layer). The stope is connected to a drift (called drawpoint), which has a vertical section of 9 × 9 cm and a length of 63 cm. The pressure induced by the backfill on the barricade is measured using mini-pressure sensors positioned at different locations inside the model. The small-scale model is also equipped with a manual external loading system (a piston) to increase the pressure on the barricade until the failure. The small-scale model does not satisfy the first-order similarity due to cost constraints and the inability to achieve some similarity conditions. A high-resolution camera was used to help analyze the barricade displacement and its failure mechanism. A second camera was also used to capture the manipulations during backfill placement (Figure 1). The barricade monitoring is recorded in 2D only through the transparent walls of the drift, assuming that the particles at the core of the barricade will have the same behavior. The pressure at different points in the reduced-scale model is measured using two types of pressure sensors (strain gauge transducers) with a capacity of 100 kPa. Assuming that the total stresses are equivalent to the pressures measured by the total earth pressure sensors (TEP), the pore water pressures sensors (PWP) are equal to those measured by the mini-piezometers, and the effective stresses are the difference between their values (TEP – PWP). Two different type of sensors, according to their size and properties, are used to measure the total earth pressure (model PS-D and model DMTY). The PWP is measured using miniature pore water pressure gauge (model DMKY) attached to a data acquisition system that has the same brand (Dan street Nanjing Electronic Technology Co., Nanjing, China; https://www.instrumentstrade.com/dmky-miniature-pore-water-pressure-gauge_p11337.html). The earth pressure sensors are ideal for measuring the stress of the soil, mud, and sand. The strained full-bridge circuit can eliminate the influence of temperature changes on the sensor. A high-precision full-bridge strain gauge is pasted inside the sensor’s sensing membrane. When external pressure acts on the surface of the sensing membrane, the membrane deforms, causing strain in the strain gauge. The DMKY sensors are suitable for measuring the pore water pressure (osmotic pressure) inside or around the soil, mud, sand, and model piles in the model test. Table 1 shows the characteristics of the sensors used in the experimental tests conducted on the physical model.
Before using pressure sensors in any application, they must be calibrated under the same conditions as their intended use, and it is important that the sensors are recalibrated periodically to check their response under external loading. Usually, earth pressure cells are calibrated under a uniform loading condition, called fluid calibration, where a special type of arrangement is used to apply oil pressure only over a cell’s sensing area, and this type of calibration is done by the manufacturers [57]. Pressure applied to calibrate the sensor is ideally conducted in two cycles of amplitude (loading/unloading). It requires good linearity and a small difference in sensor response between charge and discharge (hysteresis).
In this work, a graduated column of water was used to calibrate the sensors used in the experimental tests. The water pressure on the sensors is calculated by multiplying the unit weight of the water by the height of the column. To calibrate the sensors used, they were fixed to a horizontal plate holding a vertical ruler within a deep-water tank to measure the water column (Figure 2).
The pressure recorded by the sensors was compared to the pressure of the water column inside the bucket. A calibration factor was calculated for each sensor to correct the pressure measurement. A valve was installed at the base of the tank to empty the water. This procedure allows the pressure on the sensors to increase and decrease during calibration. Appendix A shows the calibration of the sensors by pouring water until 71 cm height, and the results were satisfactory (pwater = γw × hw = 9.81 kN/m3 × 0.71 m = 6.96 ≈ 7.0 kPa).
The sensors were positioned at various locations to measure the maximum backfill pressure (vertically and laterally) at the base of the stope and above the drift level. The barricade was also instrumented to determine the backfill pressure (especially on the upper part), and to study the change in stress state during drainage. Several pressure sensors were placed at the base of the model, four sensors at the base of the stope, and two in front of the barricade. Four total earth pressure sensors, E1 to E4 (model DMTY), were used to measure the total backfill pressure (horizontal and vertical) and two pore water pressure sensors, W1 and W2 (model DMKY), were used to measure the water pressure. On the second level (20 cm above the base of stope), four total earth pressure sensors (E5 to E8) and one pore water pressure sensor (W3) were installed. Other types of total pressure sensors, E9 to E14 (model PS-D from KYOWA), have been attached to the face of the barricade to measure the backfill pressure on the barricade (Figure 2e).
3. Material Characteristics
3.1. Mine Tailings
Figure 3a presents the grain size distribution (GSD) curve of the tailings used (LaRonde mine tailings) for the preparation of the backfill. The GSD curve was determined on a homogenized tailing sample using a Malvern Mastersizer S 2000® (Malvern Panalytical, Malvern, UK) laser particle analyzer. The GSD analysis showed that about 46% of the tailings sample are finer than 20 µm (i.e., ultrafine particles content or P20µm). The specific gravity of the tailings (Gs) was determined to be 3.32 using a helium pycnometer (AccuPyc 1330, MicroMeritics, Norcross, GA, USA).
In addition, other analyses (mineralogical analysis, total sulfur, and carbon content) were conducted. All characteristics of the mine tailings are presented in Table 2.
3.2. Waste Rock Barricade
It is not easy to obtain accurate gradations of waste rock. Different methods, such as sampling and laboratory measurements, in situ determination, and image analysis of photographs (e.g., WipFragTM), can be used to estimate the particle size distribution [58]. Typical waste rock shows a wide gradation curve (from silt to boulders size) with a coefficient of uniformity (CU = D60/D10) of 20 or more [59,60]. The typical angle of repose of waste rock is near to 37° (±3°), which may differ with the physical characteristics of the waste rock [61]. The size of the waste rock particles can range from 75 μm to about 10 cm and above [62]. Throughout construction phases, the design of rock waste barricades to maintain fresh paste backfill columns must be carried out carefully (building and forming a pile of waste rocks, compaction using a scoop equipped with a push-plate, and placement of a shotcrete layer) [11,63]. The barricade capacity (resistance) depends on the material used, shape, sizes, and construction quality. The materials used for the construction of the waste rock barricades are the development of waste rocks that are also used for rockfill preparation underground. An experienced operator needs fewer attempts to raise the material and plug the gaps between the barricade and the gallery roof [63]. It is difficult to evaluate the strength of the waste rock barricade in the drawpoint after the construction. In addition, little information is available on the characteristics of the waste rock barricades (e.g., grain size distribution, shear strength, friction angle, etc.) for an appropriate design purpose. In practice, a layer of shotcrete is used to close the top gap after the barricade construction to avoid any risk of the backfill spill [11,63].
For this study, seven grain size distribution (GSD) curves were established, but only three gradations (#1, #2, and #5) were presented in this paper (Figure 3b). These different proposed GSD were based on visual and experimental observations in the laboratory in order to study the behavior, strength, and failure mechanisms of the barricade. The barricade particle diameter varies from 0 to 8 mm in the reduced-scale model, assuming that this particle diameter varies between 0 and 400 mm in the actual-size barricade. The GSD #1 curve represents a barricade made of fine materials (50% smaller than 1 mm), while the GSD #5 curve represents a barricade without fine particles (minimum diameter of 3.35 mm) and other GSDs are in between.
The volume of the trapezoidal barricade used is 1304 cm3 (25 cm base length, 7.2 cm top length, height = width = 9 cm). The waste rock apparent dry density ranges from 1.5 to 1.9 g/cm3 (increases with the increase in fine materials, Figure 3c).
4. Experimental Setup and Program
Five steps are required to perform the small-scale model testing: (i) setting up the reduced-model, the instruments, and the materials, (ii) calibrating the pressure sensors and verifying the measurements, (iii) starting the test according to the scenario, the material properties, and backfill sequences, (iv) measuring the induced pressures and displacements of the barricade during backfilling, and (v) analyzing the results and varying the particles gradation of the waste rock barricade or the backfill properties for the next test.
4.1. Setting Up the Waste Rock Barricade
Three steps were used for shaping the barricade in the drawpoint: (i) manufacturing various sizes of trapezoidal molds for use in building barricades made of crushed waste rock, (ii) placing the mold in the access drift (drawpoint) and then filling it with crushed waste rock (in two compacted layers, each layer is tamped 25 times with a 600 mm-long bullet-nosed metal rod measuring 16 mm in diameter) in accordance with a particle diameter scale factor of 1/50 (), and (iii) lifting the trapezoidal mold after shaping the waste rock barricade. For some test scenarios, several thin, transparent silicone lines are attached to the base of the drift to increase the frictional resistance of the barricade, and to prevent the barricade from sliding. A three-dimensional (3D)-printed plastic frame (Figure 2b) was used for attaching the pressure sensors facing the barricade. This frame contains six sensors placed on three levels (at 2.7, 4.5, and 6.3 cm from the base of the model).
4.2. CPB Mix Design and Preparation
The required quantities of water and binder to be added to the wet tailings should be calculated before preparing the backfill. The cemented paste backfill ingredients (water, binder, and tailings) can be calculated after knowing the expected backfill volume () for filling the reduced scale model, the required binder ratio (), and the targeted final solid mass concentration of the CPB (). The first step is to determine the specific density () of the tailings and their water content () on arrival at the lab. Next, the backfill mix design and proportioning can be done using several equations (see Appendix B).
Backfill ingredients are mixed using the Hobart mixer (Figure 4a) at a low speed for about 15 min. At the end of mixing, the backfill consistency is determined through the slump test by using the standard Abrams’ cone. The backfill was prepared with a 70% solids percentage (except for the final test, ) and 5% binder (general use Portland cement, or type GU) to allow proper control and easy filling by hand. The fresh backfill is a heavy fluid-like material after mixing, and the measured slump was about 275 mm (10.8 inches).
After backfill preparation and shaping the barricade in the drawpoint (Figure 4b), the model is filled with the backfill mixture (8136 cm3 volume) over a short period (approximately 5 min maximum). The stress state of the backfill is recorded during the self-weight consolidation (Figure 4c). For the tests conducted to study the failure mechanism of the barricade, the external loading system (piston) is installed once the model is filled. The backfill pressure on the barricade is increased until its collapse (failure or sliding). During this stage, the behavior of the barricade is monitored using the high-resolution cameras.
4.3. Experimental Program
Two series of tests were performed to study the geomechanical behavior of the waste rock barricades made up of two different particle size distributions (#1 and #5). The GSD #1 and #5 barricades were examined, and three tests on each gradation were carried out for different purposes. The objective of the first two tests is to study the stress state during a sequential backfill placement in two layers (Cw = 70%). The first backfill was an uncemented backfill (tailings slurry only), while the second backfill contains 5% of Portland cement (GU). The third test was performed to study the strength and failure mechanism of the waste rock barricade by increasing the pressure externally and manually at the top of the stope using the hand piston. Also, only one test was conducted on the GSD #2 to study its mechanism failure and compare it with the GSD #1 and #5. The amount of drainage water collected was determined and the corresponding vertical or volumetric strain of the backfill due to self-weight consolidation (settlement) were calculated.
5. Results
5.1. Stress State after the CPB Placement in the Small-Scale Model
5.1.1. Uncemented Backfill
The first test is aimed at studying the influence of the barricades’ particles gradation (GSD #1 and #5) on the stress state of an uncemented backfill (Cw = 70%) sequentially placed in two layers (one layer every two days). The two types of sensors (TEPs and PWPs) give a pressure equivalent to that of the overburden after the backfill placement, and then the pressures change due to the dissipation of the pore water pressure. The backfill behaves like a heavy fluid during this short phase, and the stress increases linearly with depth (no arching effect). The barricade is usually placed in a dry state in the drawpoint. The barricade containing fine material (GSD #1) started drainage after it was fully saturated, whereas, with the GSD #5 barricade (no fine material), drainage began before full saturation.
The backfill pressures varied in the different locations in the model. It was observed that for both barricade configurations (GSDs #1 and #5), the pore water pressure dissipates rapidly in the middle of the stope and near the barricade (PWPs 2 and 3), compared to the pressure at the base of the stope (PWP 1). For the GSD #1 barricade, the values of water pressures converged after the second layer placement, while pressures for the GSD #5 barricade remained at the same interval (Figure 5).
During the sequential placement of the backfill layers, the placement of each last layer induces an excess of PWP in this newly added layer. After the PWPs are dissipated, the stresses become significantly lower than those calculated from the overburden, particularly near the base of the stope. When enough time is allotted before a new layer is added, drainage leads to more pronounced dissipation of PWP, which can then become negative (i.e., suction).
The self-weight consolidation process of a sequential filling in each newly added layer follows a similar trend as the one observed for the instantaneous filling. The volumetric strain ( = ) of backfills of the uncemented backfill (Cw = 70%) was about 16.3% for each layer. The mixing water bleeds to the top of the filling chamber after each backfilling installation: this step is accompanied by consolidation and backfill settlement (Figure 6). The barricade gradually saturates, and the water level at the stope top drops through drainage. Although pore water pressure sensors indicate a slight pressure and drainage stoppage after four days, the backfill near the barricade remains saturated and can flow if additional pressure is applied. This result highlights the importance of using the binder in the backfill, especially for the first layer.
The pressure measured by the sensors attached to the base of the model decreases with water dissipation, while the lateral sensors indicated a slight reduction in pressure after backfilling and remained constant even with water dissipation during drainage (Figure 7). Drainage tends to reduce these pressures and increase the frictional resistance along the walls. As drainage occurs, the phreatic surface level (where u = 0) drops within the stope, creating an unsaturated zone in the upper part.
The pressure sensors are affected by atmospheric pressure and air entering during drainage, which can result in negative pressures. The negative pressure value means that the atmospheric pressure around the sensors has been reduced, maybe due to the suction development within the unsaturated zone, compared to the pressure before the test (zero offset point). The lateral sensors used to measure the backfill pressures in the middle of the stope also indicated a slight decrease in pressure relative to the pore water pressure (Figure 8). This result can be attributed to the progressive increase in the density of the fill during the self-weight consolidation process. The lateral pressure does not remain stable for a long time during the consolidation process, where it decreases with the dissipation of pore water pressure.
The pressure applied to the barricade after the placement of the first layer was equivalent to the overburden pressure, then gradually dropped due to barricade saturation (Figure 9). The slope of the decreasing pressure after the second placement of the backfill is different because the barricade has become saturated. The barricade made of fine materials (GSD #1) slowly desaturates from top to bottom so that after the pore water has dissipated, the pressure becomes negative. Whereas the barricade made up of coarse materials (GSD #5) allowed air to enter once the drainage ceased. This observation showed that the characteristics of the barricade would influence the stress state of the backfill after placement.
The drainage water collected and the sensors located in front of the barricade have shown that the barricade that does not contain fine materials (i.e., GSD #5) accelerates the drainage of the backfill water, which rapidly reduces backfill pressure after placement (Figure 10). Two days after backfill placement, the pore water pressure at the base of the filling chamber was reduced by 75% and was null on the barricade.
5.1.2. Cemented Backfill
This section shows the influence of the grain size distribution of the barricades (GSD #1 and #5) on the stress state of a cemented paste backfill containing 5% of the GU binder (Cw = 70%). The first case for a CPB placed in a single sequence (height of the filling chamber = 76.6 cm and barricade GSD #1), but the measurement was stopped after 5 h due to a power failure. The test presents the backfill stress measurement only in the first few hours after placement. It seems that the pressures of the cemented fill on the barricade have the same value after backfilling and then differ during drainage (Figure 11).
The sensors (PWPs and TEPs) indicated a pressure equal to that of the overburden after backfill placement (Figure 12), except for PWPS3 (above the drift), which was slightly larger.
A pore water sensor was placed inside the barricade (PWPS 4) to measure the water pressure inside the barricade during drainage. The pressure measured inside the barricade increased during its saturation to only about 6% of the pore water pressure at the base of the stope (after 5 h; Figure 13). At the end of the CPB self-weight consolidation in the filling chamber (stope), the calculated total volumetric strain was approximately 4.6%. This value is similar to that already observed in situ and during column (physical model) tests [18].
The second case is a backfill placed in two sequences (one layer every two days, GSD #5 barricade). The TEP sensors attached to the walls and on the barricade recorded an increase in pressure after half of the day, while the PWP sensors indicated a decrease in pore water pressure (negative values, with the suction development, near the barricade and in the stope middle (PWPS 2 and 3)). When the second layer of backfill was placed, the PWP sensors indicated a jump in pressure values (from negative to positive), while the TEP sensors showed a slight jump and continuing pressure increase as the first layer. The TEP at the base of the stope did not record this pressure increase, and the pore water pressure sensor at this location (PWPS 1) remained positive compared to those placed near the barricade and the stope mid-height (Figure 14). These results may require further investigations, but they can be interpreted tentatively by the cement hardening and suction development. It appears that the drainage and the cement hydration consume the water from the backfill, which explains the negative PWP values and the increase in pressure in the TEP sensors after several hours of the backfill placement. These measurements can be useful only in the first few hours after backfilling because the sensors used may be affected by several factors, such as cement hydration, suction, and chemical attack on the sensor surfaces.
5.2. Stability and Failure Mechanism of the Waste Rock Barricades
In order to study the strength and failure mechanism of the waste rock barricades during backfilling, an uncemented backfill (water and tailings mixture with Cw = 70%) was used, assuming that cement hydration does not play any role immediately after backfilling. Barricades with the grain size distributions #1 and #5 were tested. The model was immediately filled up to the top of the stope, and a manual piston was then used to apply vertical pressure until the barricade collapsed. The barricade–backfill interaction was recorded while increasing the pressure on the barricade. The pressure measured by all sensors (earth and pore water pressure sensors) were varied in different locations inside the model. The test conducted on a barricade made of grain size distribution #1 showed that the fine particles prevent the backfill from penetrating into the barricade pores but seem to give a low shear resistance (internal friction) (Supplementary, Video S1). For this type of fine-grain configuration (d < 1 mm), a shear failure was observed when the recorded pressure, using the sensors placed in front of the barricade, reached 120 kPa (Figure 15). Several factors can change the shear strength of the barricade during the test, such as the degree of saturation of the barricade before the pressure increase using the piston, the rate of pressure increase, etc. The use of the piston to apply extra pressure strongly pushes the backfill water into the barricade pores (like an injection under pressure).
For the second test (barricade made of GSD #5), the barricade did not contain any fine materials (there are no particles of d < 1 mm), which allowed the backfill to penetrate into the pores of the barricade (see Figure 16). When the backfill water reached the downstream part of the barricade, the particles began to drift and fall (Supplementary, Video S2). It appears that the frictional resistance of the barricade was sufficient to withstand the pressure, but the drifting of the particles gradually reduces the resistance of the barricade to a value where the pressure can cause the collapse. The pressure at the middle of the stope was lower than that measured in front of the barricade at failure. By comparing this result with the previous test, it can be observed that the barricade made of the fine materials drains slowly, which in turn accumulated the pressure in the stope middle when the piston was used.
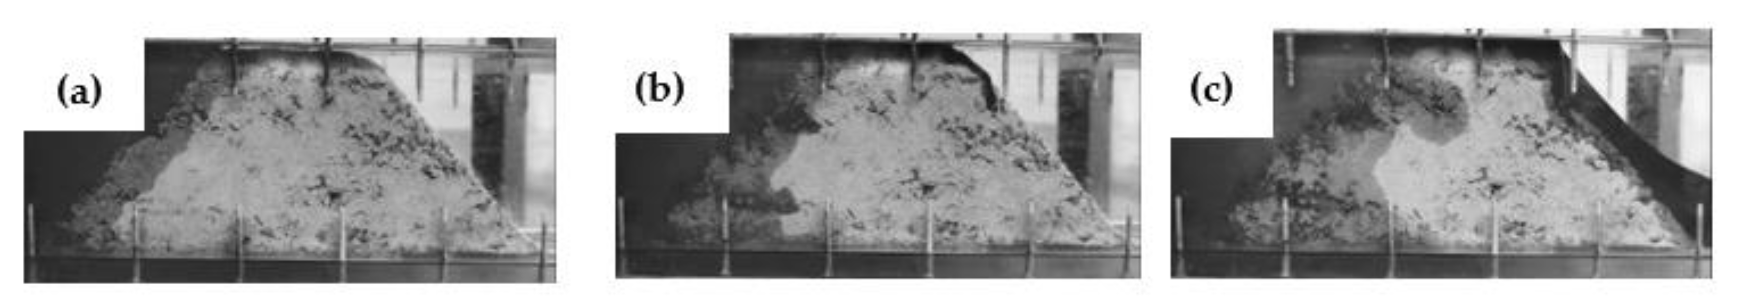
An intermediate case, between the last two configurations, was tested (GSD #2, 30% of particles of d < 1 mm). The barricade has shown good resistance to pressure and backfill penetration (Figure 17). This barricade (GSD #2) has been able to withstand the same pressure as the last test (GSD #5). The barricade did not collapse, but the backfill has been able to flow over the barricade, confirming the need for the application of a shotcrete layer to support the downstream side of the barricade (Supplementary, Video S3), or increasing the top length of the barricade. It should be emphasized that, in these tests, the barricades were placed on a number of thin, transparent silicone bars that were fixed at the base of the drift only to increase the frictional resistance between the barricade and the drift. Future tests are needed to confirm the results by using rough and homogeneous interior surfaces to study the behavior of the barricade.
6. Concluding Remarks
The results obtained on the small-scale model demonstrated that: (i) the stability of a waste rock barricade depends upon numerous factors, such as the waste rock particles gradation and degree of compaction, as well as the frictional resistance between the barricade and the drawpoint sidewalls, and (ii) for two different types of backfill, cemented and uncemented with 70% of solid, the volumetric strain due to self-weight consolidation of the backfill was 4.5% and 16%, respectively. The consequence of these observations is that a progressive backfilling of the stopes is preferable to dissipate the pore water pressure and to ensure the stability of the barricade.
The use of cameras, as well as other remote monitoring devices, should be considered to supervise the quality of barricades, breather pipes, and paste backfill inlet pipes. The use of binder in the backfilling of the first layer (in the plug), the sprayed concrete layer (behind and around the barricade), and the barricade compaction are essential issues in backfilling operations.
The results presented here have helped to better understand the behavior of waste rock barricades and backfills’ (cemented or uncemented) interaction in a stope. Although these analyses are based on several simplified assumptions, it is desirable to improve future work by using a more realistic filling rate, other types of barricades, and rough inner plexiglass surfaces for the small-scale model. The interior walls of the model will be provided with the appropriate roughness to represent the interface friction of the rock walls. This study will be pursued in different directions: (i) experimental tests on the same reduced model but using high-quality soil pressure transducers (BEC-A 200 kPa, KYOWA), and on an intermediate scale model to study the scale effects and validate the results, (ii) numerical modeling using SIGMA/W code in GeoStudio 2021 suite (version 11.0.1.21429, GEOSLOPE International Ltd., Calgary, AB, Canada), and (iii) a review of previous in situ studies to be compared to the experimental and numerical parts.
Supplementary Materials
The following are available online at https://www.mdpi.com/2075-163X/10/11/941/s1, Video S1: Failure mechanism of a barricade made of GSD #1 (https://imgur.com/73WRQr4), Video S2: Failure mechanism of a barricade made of GSD #5 (https://imgur.com/SWqWoAo), Video S3: Failure mechanism of a barricade made of GSD #2 (https://imgur.com/m1niWSm).
Author Contributions
Conceptualization, T.B. and M.N.; methodology, M.N. and T.B.; validation, M.N., T.B. and A.G.; formal analysis, M.N., T.B. and A.G.; investigation, T.B. and A.G; resources, M.N., T.B. and A.G.; data curation, T.B.; writing—original draft preparation, T.B. and M.N.; writing—review and editing, M.N., T.B. and A.G.; visualization, M.N.; supervision, T.B.; project administration, T.B.; funding acquisition, T.B. All authors have read and agreed to the published version of the manuscript.
Funding
This research was funded by FRQNT partnership program on Sustainable Development in the Mining Sector, grant number 2017-MI-202211, and the NSERC Discovery Grant, with the number RGPIN-2019-04946, including the payment of the APC.
Acknowledgments
The authors would like to thank the governments of Quebec and Canada for their financial support through the Fonds de recherche du Québec, Nature et technologies (FRQNT), and NSERC grant programs. This work continues as part of the activities of the Research Institute on Mines and the Environment (RIME UQAT–Polytechnique).
Conflicts of Interest
The funders had no role in the design of the study; in the collection, analyses, or interpretation of data; in the writing of the manuscript, or in the decision to publish the results.
Appendix A. Pressure Sensors’ Calibration Using Water
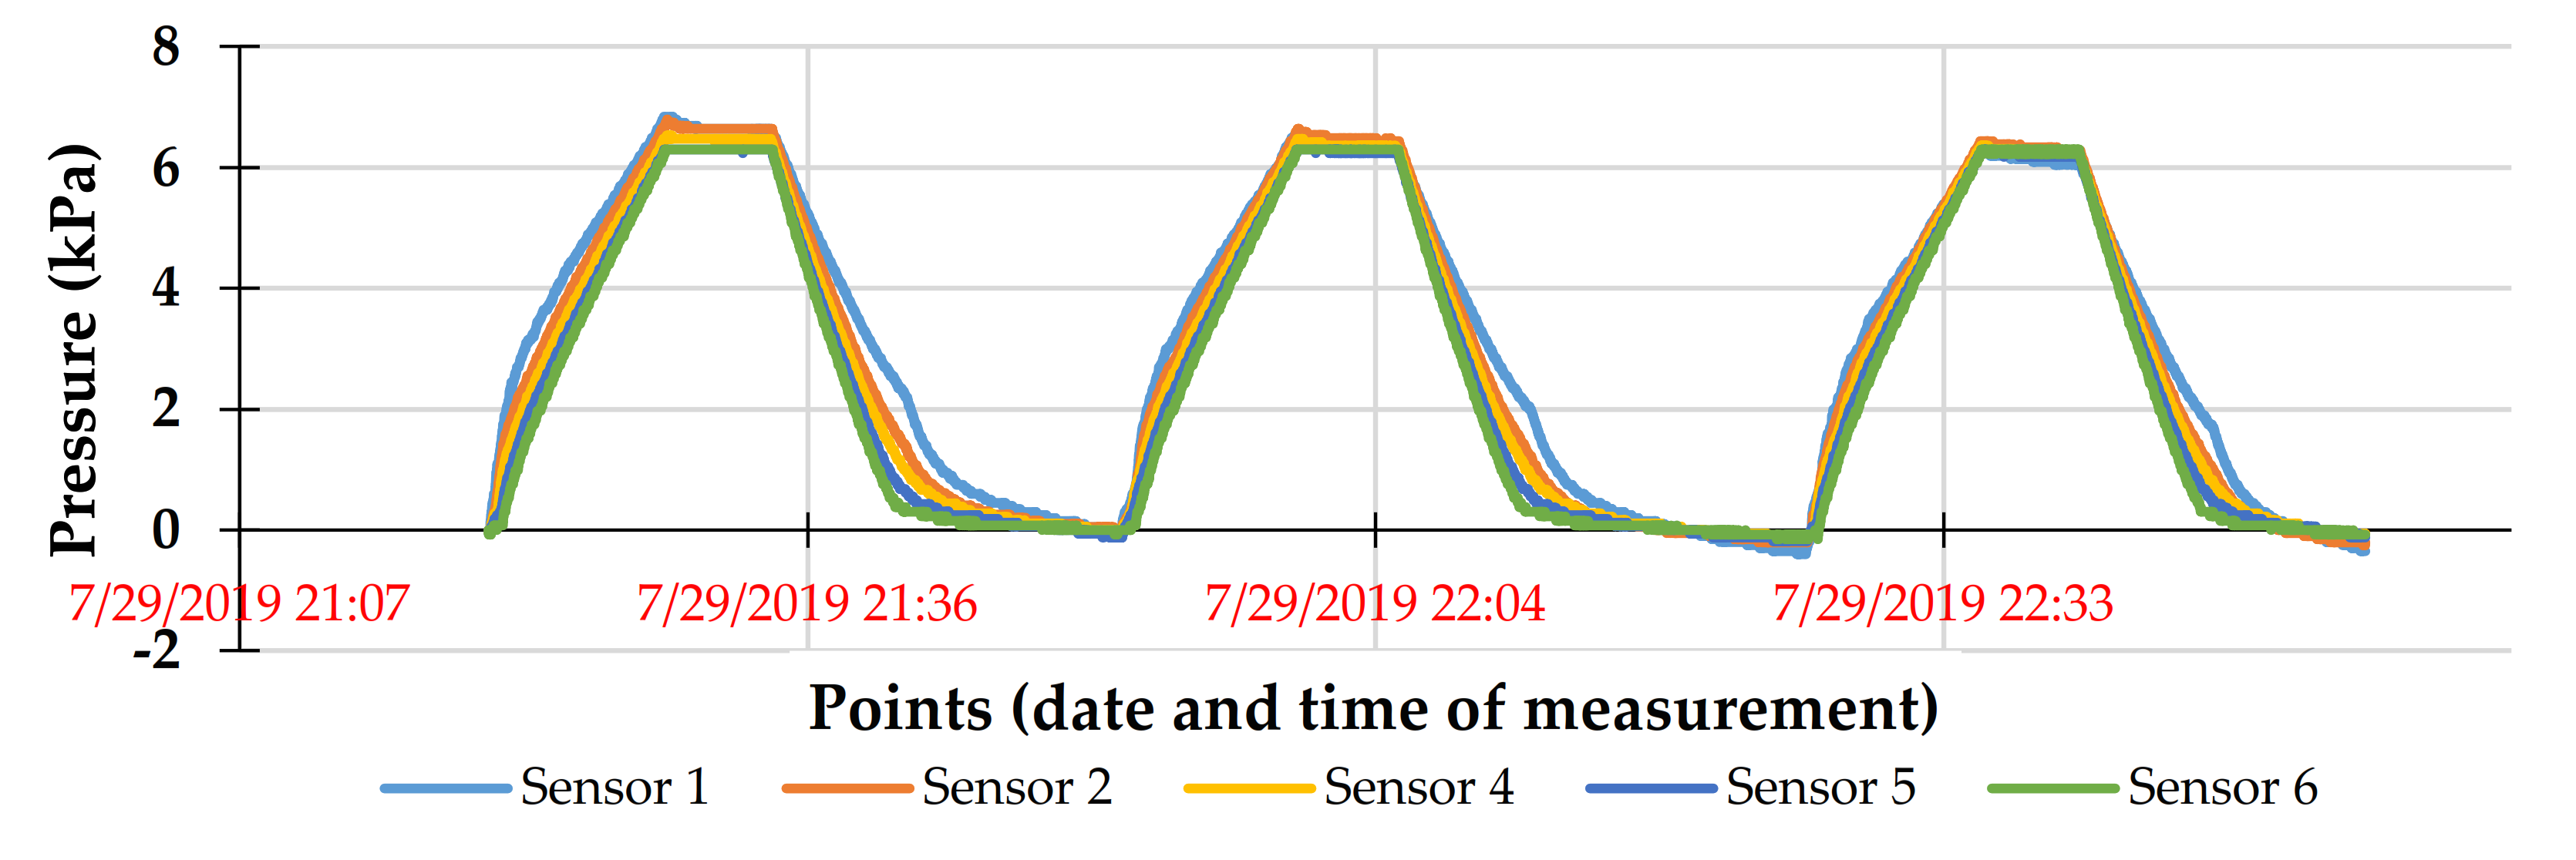
The figures below present the calibration of the sensors of pressure used in the experimental tests. These sensors were calibrated before each test (in loading/discharging) to check the hysteresis of the sensor and correct the calibration factor.
Figure A1.
Calibration of the pore water pressure sensors (DMKY).
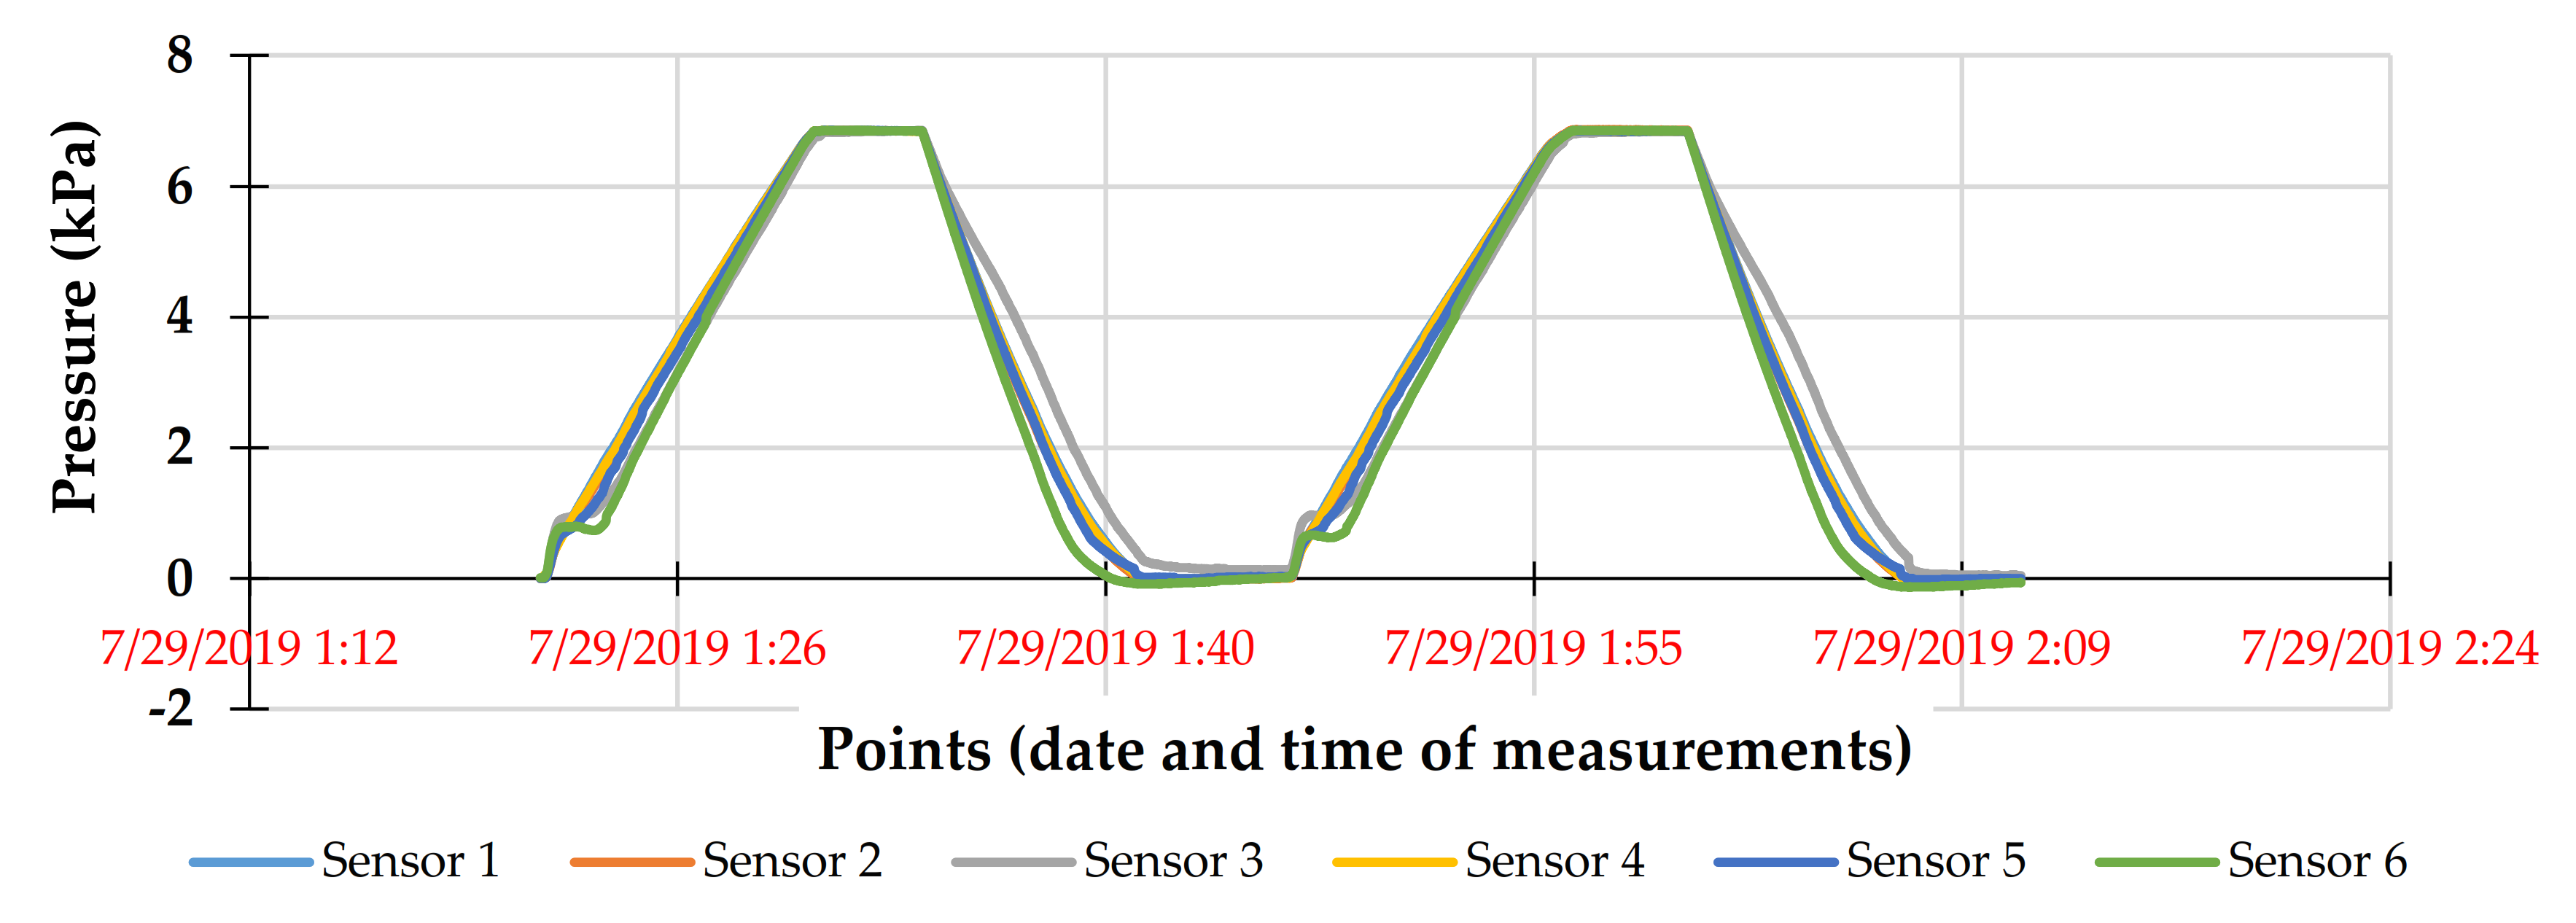
Figure A2.
Calibration of the sensors of the total earth pressure (DMTY).

Figure A3.
Calibration of the sensors of the total earth pressure at the face of the barricade (PS-D).
Figure A3.
Calibration of the sensors of the total earth pressure at the face of the barricade (PS-D).
Appendix B. Cemented Paste Backfill Preparation
The required total mass of dry tailings () in the backfill mixture is given by:
where the fill mass (g or kg), the fill water content (decimal; wf = [1/Cw-f − 1]), and = (Mbinder/Mtailings = Mb/Mt) = the binder rate used (in decimal).
The final solid mass concentration, Cw-f, of backfill is given as follows:
The fill mass to be placed in the model is given as follows:
where ulk or wet density of the fill that is given by the following relationship:
where is in decimal, density of water (1 g/cm3), and the specific density of the backfill which is given as follows:
where is the specific density of the tailings solid grains (in g/cm3 or kg/m3) and is the specific density of the binder solid grains.
In mine backfill practice, several types of binding agents are used, but the most common is general use Portland cement (GU), which is usually fractionally replaced by mineral additives with pozzolanic effects, such as fly ash (FA) and smelter ground granulated blast furnace slags (GGBFS) [4]. In this case, the binder solid grains density () is given as follows:
where the proportion of each binder component (1, 2, 3, …).
The mass of binder () is given as follows:
To achieve a final target value of Cw-f, the total amount of water in the backfill mixture () is given as follows:
Taking into account the amount of water already present in the tailings before the backfill preparation, the amount of water that should be added to the mixture () is given in the following relationship:
At the beginning of the backfill preparation, the water and the binder are first mixed to obtain a slurry before progressively adding the wet tailings (Mt-wet = Mt (1 + wt)).
References
- Thomas, E.G. Fill Technology in Underground Metalliferous Mines; University of British Columbia, Department of Mineral Engineering: Vancouver, BC, Canada, 1979. [Google Scholar]
- Hassani, F.; Archibald, J. Mine Backfill [CD-ROM]; Canadian Institute of Mining, Metallurgy, and Petroleum: Montreal, QC, Canada, 1998. [Google Scholar]
- Potvin, Y.; Thomas, E.; Fourie, A. Handbook on Mine Fill; Australian Centre for Geomechanics: Crawley, Australia, 2005. [Google Scholar]
- Belem, T.; Benzaazoua, M. Design and application of underground mine paste backfill technology. Geotech. Geol. Eng. 2008, 26, 147–174. [Google Scholar] [CrossRef]
- Benzaazoua, M.; Fall, M.; Belem, T. A contribution to understanding the hardening process of cemented pastefill. Miner. Eng. 2004, 17, 141–152. [Google Scholar] [CrossRef]
- Henderson, A.; Revell, M. Basic mine fill materials. In Handbook of Mine Fill; Potvin, Y., Thomas, E.D., Fourie, A., Eds.; Australian Centre for Geomechanics: Perth, Australia, 2005; pp. 13–20. [Google Scholar]
- Belem, T.; Benzaazoua, M.; Bussière, B. Mechanical behaviour of cemented paste backfill. In Proceedings of the 53rd Annual Conference of the Canadian Geotechnical Society, Montréal, QC, Canada, 15–18 October 2000. [Google Scholar]
- Walske, M.L.; McWilliam, H.; Doherty, J.; Fourie, A. Influence of curing temperature and stress conditions on mechanical properties of cementing paste backfill. Can. Geotech. J. 2015, 53, 148–161. [Google Scholar] [CrossRef]
- Sivakugan, N.; Veenstra, R.; Naguleswaran, N. Underground mine backfilling in Australia using paste fills and hydraulic fills. Int. J. Geosynth. Ground Eng. 2015, 1, 18. [Google Scholar] [CrossRef] [Green Version]
- Xu, W.; Cao, P.; Tian, M. Strength development and microstructure evolution of cemented tailings backfill containing different binder types and contents. Minerals 2018, 8, 167. [Google Scholar] [CrossRef] [Green Version]
- Belem, T.; Mbonimpa, M.; Li, L. Lecture notes GNM1002 Mine Backfill; Université du Québec à en Abitibi-Témiscamingue: Rouyn-Noranda, QC, Canada, 2018. [Google Scholar]
- Yilmaz, E. Investigating the Hydrogeotechnical and Microstructural Properties of Cemented Paste Backfill Using the Cuaps Apparatus. Ph.D. Thesis, Université du Québec à en Abitibi-Témiscamingue, Rouyn-Noranda, QC, Canada, 2010. [Google Scholar]
- Benzaazoua, M.; Belem, T.; Bussière, B. Chemical aspect of sulfurous paste backfill mixtures. Cem. Concr. 2002, 32, 1133–1144. [Google Scholar] [CrossRef]
- Mitchell, R.J.; Olsen, R.S.; Smith, J.D. Model studies on cemented tailings used in mine backfill. Can. Geotech. J. 1982, 19, 14–28. [Google Scholar] [CrossRef]
- Li, L.; Aubertin, M. Limit equilibrium analysis for the design of backfilled stope barricades made of waste rock. Can. Geotech. J. 2011, 48, 1713–1728. [Google Scholar] [CrossRef]
- Yang, P.; Li, L.; Aubertin, M.; Brochu-Baekelmans, M.; Ouellet, S. Stability analyses of waste rock barricades designed to retain paste backfill. Int. J. Geomech. 2016, 17, 04016079. [Google Scholar] [CrossRef]
- Zheng, J.; Li, L. Experimental study of the “short-term” pressures of uncemented paste backfill with different solid contents for barricade design. J. Clean. Prod. 2020, 275, 123068. [Google Scholar] [CrossRef]
- Belem, T.; El Aatar, O.; Bussière, B.; Benzaazoua, M. Gravity-driven 1-D consolidation of cemented paste backfill in 3-m-high columns. Innov. Infrastruct. Solut. 2016, 1, 37. [Google Scholar] [CrossRef] [Green Version]
- Belem, T.; Harvey, A.; Simon, R.; Aubertin, M. Measurement and prediction of internal stresses in an underground opening during its filling with cemented fill. In Proceedings of the Fifth International Symposium on Ground Support in Mining and Underground Construction, Perth, Australia, 28–30 September 2004; Tayler & Francis Group: London, UK, 2009; pp. 619–630. [Google Scholar]
- Li, L. Vers une Conception de Barricades plus Sécuritaire dans les Mines: Étude de L’interaction Entre le Remblai et les Structures Encaissantes; Institut de Recherche Robert-Sauvé en Santé et en Sécurité du Travail: Montreal, QC, Canada, 2019. [Google Scholar]
- Belem, T.; Benzaazoua, M. An overview on the use of paste backfill technology as a ground support method in cut-and-fill mines. In Ground Support in Mining and Underground Construction: Proceedings of the Fifth International Symposium on Ground Support, Perth, Australia, 28–30 September 2004; Villaescusa, E., Potvin, Y., Eds.; CRC Press: Leiden, The Netherlands, 2004; pp. 637–650. [Google Scholar]
- le Roux, K.; Bawden, W.F.; Grabinsky, M.F. Field properties of cemented paste backfill at the Golden Giant mine. Min. Technol. 2005, 114, 65–80. [Google Scholar] [CrossRef]
- Thompson, B.D.; Grabinsky, M.; Bawden, W.; Counter, D. In-situ measurements of cemented paste backfill in long-hole stopes. In Proceedings of the ROCKENG09: Proceedings of the 3rd CANUS Rock Mechanics Symposium, Toronto, ON, Canada, 9–15 May 2009; p. 199. [Google Scholar]
- Helinski, M.; Fahey, M.; Fourie, A. Behavior of cemented paste backfill in two mine stopes: Measurements and modeling. J. Geotech. Geoenviron. Eng. 2010, 137, 171–182. [Google Scholar] [CrossRef]
- Thompson, B.; Bawden, W.; Grabinsky, M. In situ measurements of cemented paste backfill at the Cayeli Mine. Can. Geotech. J. 2012, 49, 755–772. [Google Scholar] [CrossRef]
- Hasan, A.; Suazo, G.; Doherty, J.; Fourie, A. In situ measurements of cemented paste backfilling in an operating stope at Lanfranchi Mine. In Proceedings of the 11th International Symposium on Mining Backfill, Perth, Australia, 20–22 May 2014; pp. 327–336. [Google Scholar]
- Sivakugan, N.; Widisinghe, S. Stresses within granular materials contained between vertical walls. Indian Geotech. J. 2013, 43, 30–38. [Google Scholar] [CrossRef]
- Widisinghe, S.; Sivakugan, N.; Wang, V.Z. Laboratory investigations of arching in backfilled mine stopes. In Proceedings of the 18th Southeast Asian Geotechnical Conference (18SEAGC) & Inaugural AGSSEA Conference (1AGSSEA), Singapore, 29—31 May 2013. [Google Scholar]
- Widisinghe, S.; Sivakugan, N.; Wang, V. Loads on barricades in hydraulically backfilled underground mine stopes. In Proceedings of the Eleventh International Symposium on Mining with Backfill, Perth, Australia, 20–22 May 2014. [Google Scholar]
- Widisinghe, S.D. Stress Developments within a Backfilled Mine Stope and the Lateral Loading on the Barricade. Ph.D. Thesis, James Cook University, Townsville, Australia, 2014. [Google Scholar]
- Li, L.; Aubertin, M.; Simon, R.; Bussière, B.; Belem, T. Modeling arching effects in narrow backfilled stopes with FLAC. In Proceedings of the 3rd International Symposium on FLAC & FLAC 3D Numerical Modelling in Geomechanics, Sudbury, ON, Canada, 21–24 October 2003; pp. 211–219. [Google Scholar]
- Li, L.; Aubertin, M.; Shirazi, A.; Belem, T.; Simon, R. Stress distribution in inclined backfilled stopes. In Proceedings of the 9th International Symposium in Mining with Backfill, Montreal, QC, Canada, 29 April–2 May 2007. [Google Scholar]
- Pirapakaran, K.; Sivakugan, N. Arching within hydraulic fill stopes. Geotech. Geol. Eng. 2007, 25, 25–35. [Google Scholar] [CrossRef]
- Hassani, F.; Mortazavi, A.; Shabani, M. An investigation of mechanisms involved in backfill-rock mass behaviour in narrow vein mining. J. South. Afr. Inst. Min. Metall. 2008, 108, 463–472. [Google Scholar]
- Li, L.; Aubertin, M. An improved analytical solution to estimate the stress state in subvertical backfilled stopes. Can. Geotech. J. 2008, 45, 1487–1496. [Google Scholar] [CrossRef]
- Fahey, M.; Helinski, M.; Fourie, A. Some aspects of the mechanics of arching in backfilled stopes. Can. Geotech. J. 2009, 46, 1322–1336. [Google Scholar] [CrossRef]
- Li, L.; Aubertin, M. Numerical investigation of the stress state in inclined backfilled stopes. Int. J. Geomech. 2009, 9, 52–62. [Google Scholar] [CrossRef]
- Li, L.; Aubertin, M. Horizontal pressure on barricades for backfilled stopes. Part I: Fully drained conditions. Can. Geotech. J. 2009, 46, 37–46. [Google Scholar] [CrossRef]
- Li, L.; Aubertin, M. Influence of water pressure on the stress state in stopes with cohesionless backfill. Geotech. Geol. Eng. 2009, 27, 1. [Google Scholar] [CrossRef]
- Li, L.; Aubertin, M. Horizontal pressure on barricades for backfilled stopes. Part II: Submerged conditions. Can. Geotech. J. 2009, 46, 47–56. [Google Scholar] [CrossRef]
- Li, L.; Aubertin, M. A three-dimensional analysis of the total and effective stresses in submerged backfilled stopes. Geotech. Geol. Eng. 2009, 27, 559–569. [Google Scholar] [CrossRef]
- Li, L.; Aubertin, M. An analytical solution for the nonlinear distribution of effective and total stresses in vertical backfilled stopes. Geomech. Geoengin. 2010, 5, 237–245. [Google Scholar] [CrossRef]
- El Mkadmi, N. Simulations du Comportement Géotechnique des Remblais dans les Chantiers Miniers: Effets du Drainage et de la Consolidation. Master’s Thesis, Ecole Polytechnique, Montreal, QC, Canada, 2012. [Google Scholar]
- Veenstra, R.L. A design procedure for determining the in situ stresses of early age cemented paste backfill. Ph.D. Thesis, University of Toronto, Toronto, ON, Canada, 2013. [Google Scholar]
- Emad, M.Z.; Mitri, H.; Kelly, C. Effect of blast-induced vibrations on fill failure in vertical block mining with delayed backfill. Can. Geotech. J. 2014, 51, 975–983. [Google Scholar] [CrossRef]
- Falaknaz, N. Analysis of the Geomechanical Behavior of Two Adjacent Backfilled Stopes Based on Two and Three Dimensional Numerical Simulations. Ph.D. Thesis, École Polytechnique de Montréal, Montreal, QC, Canada, 2014. [Google Scholar]
- Yang, P. Investigation of the Geomechanical Behavior of Mine Backfill and Its Interaction with Rock Walls and Barricades. Ph.D. Thesis, École Polytechnique de Montréal, Montreal, QC, Canada, 2016. [Google Scholar]
- Lu, H.; Qi, C.; Li, C.; Gan, D.; Du, Y.; Li, S. A light barricade for tailings recycling as cemented paste backfill. J. Clean. Prod. 2020, 247, 119388. [Google Scholar] [CrossRef]
- Suazo, G.; Villavicencio, G. Numerical simulation of the blast response of cemented paste backfilled stopes. Comput. Geotech. 2018, 100, 1–14. [Google Scholar] [CrossRef]
- Cui, L.; Fall, M. Modeling of pressure on retaining structures for underground fill mass. Tunn. Undergr. Space Technol. 2017, 69, 94–107. [Google Scholar] [CrossRef]
- Doherty, J.P. A numerical study into factors affecting stress and pore pressure in free draining mine stopes. Comput. Geotech. 2015, 63, 331–341. [Google Scholar] [CrossRef]
- Pengyu, Y.; Li, L. Investigation of the short-term stress distribution in stopes and drifts backfilled with cemented paste backfill. Int. J. Min. Sci. Technol. 2015, 25, 721–728. [Google Scholar] [CrossRef]
- Corté, J. Model testing-Geotechnical model test. General Report. In Proceedings of the 12th International Conference on Soil Mechanics and Foundation Engineering, Rio De Janeiro, Brazil, 13–18 August 1989; pp. 2553–2571. [Google Scholar]
- Niemann, H. L’analyse dimensionnelle et son application aux lois de similitude. Modèles Réduits Génie 1995, 155, 3–20. [Google Scholar]
- Garnier, J. Validation des modèles physiques et numériques: Problème des effets d’échelle. In Proceedings of the Compte-Rendus du 14eme Conférence International de Mécanique des Sols et des Travaux de Fondations, Hambourg, Germany, 6–12 September 1997; pp. 659–662. [Google Scholar]
- Garnier, J. Modèles physiques en géotechnique: Etat des connaissance et évolutions récentes. In Proceedings of the 1ère Biennale Coulomb, Paris, France, 3–5 October 2001; p. 67. [Google Scholar]
- Gade, V.K.; Dasaka, S. Calibration of earth pressure sensors. Indian Geotech. J. 2018, 48, 142–152. [Google Scholar] [CrossRef]
- McLemore, V.T.; Fakhimi, A.; van Zyl, D.; Ayakwah, G.F.; Anim, K.; Boakye, K.; Ennin, F.; Felli, P.; Fredlund, D.; Gutierrez, L.A. Literature review of other rock piles: Characterization, weathering, and stability. Questa Rock Pile Weather. Stab. Proj. New Mex. Bur. Geol. Miner. Resour. Rep. 2009, 517, 101. [Google Scholar]
- Barbour, S.; Hendry, M.; Smith, J.; Beckie, R.; Wilson, G. A Research Partnership Program in the Mining Industry for Waste Rock Hydrology; University of Saskatchewan: Saskatoon, SK, Canada, 2001. [Google Scholar]
- Aubertin, M.; Bussière, B.; Bernier, L.; Chapuis, R.; Julien, M.; Belem, T.; Simon, R.; Mbonimpa, M.; Benzaazoua, M.; Li, L. La gestion des rejets miniers dans un contexte de développement durable et de protection de l’environnement. In Proceedings of the Congrès annuel de la société canadienne de génie civil, Montréal, QC, Canada, 5–8 June 2002. [Google Scholar]
- Aubertin, M. Waste rock disposal to improve the geotechnical and geochemical stability of piles. In 23rd World Mining Congress; X-CD Technologies Inc.: Montreal, QC, Canada, 2013. [Google Scholar]
- Maknoon, M. Slope Stability Analyses of Waste Rock Piles Under Unsaturated Conditions Following Large Precipitations. Ph.D. Thesis, École Polytechnique de Montréal, Montreal, QC, Canada, 2016. [Google Scholar]
- Gélinas, L.-P. Caractérisation des propriétés géomécaniques des barricades rocheuses et des chantiers miniers remblayés en vue de leur analyse de stabilité. Master’s Thesis, Université du Québec en Abitibi-Témiscamingue, Rouyn-Noranda, QC, Canada, 2017. [Google Scholar]
Figure 1.
A small-scale model of a mine stope made of transparent plexiglass, including the measurement tools.
Figure 1.
A small-scale model of a mine stope made of transparent plexiglass, including the measurement tools.

Figure 2.
Experimental protocol and arrangement: (a) strain gauge data acquisition system (20 channels), (b) all pressure sensors used are installed on a plate before calibration, (c) pressure sensors attached to a plate at the base of a bucket for the calibration, (d) calibration procedure of the pressure sensors using water, and (e) dimensions of the model and the different locations of the pressure sensors.
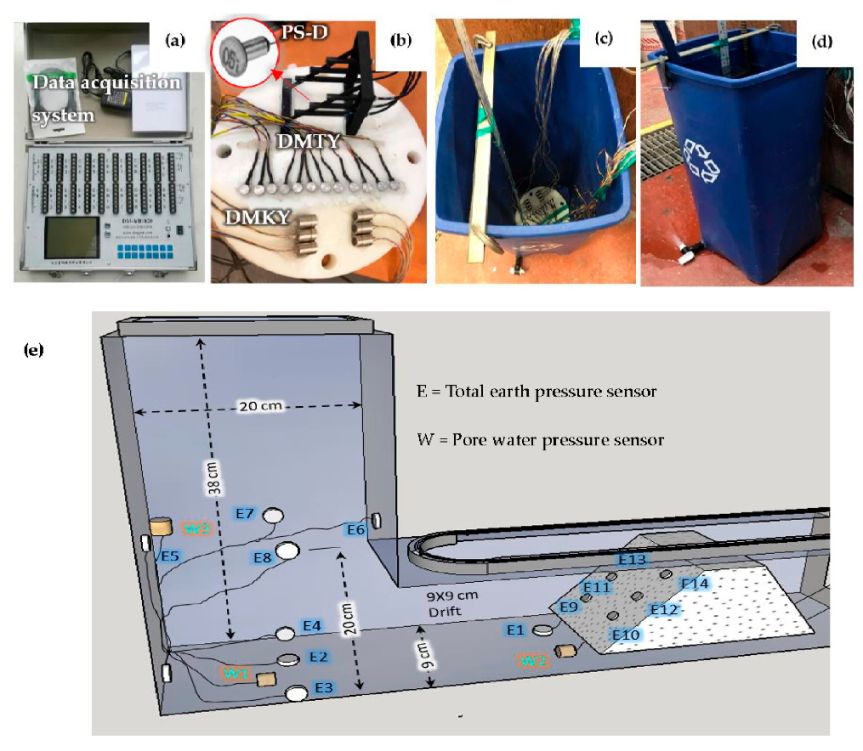
Figure 3.
Material characteristics: (a) grain size distribution (GSD) curve of the mine tailings sample, (b) particles’ size distribution curves of the waste rock barricade, and (c) barricade total or bulk density as a function of the particle size distribution curve number (from #1 to #7).
Figure 3.
Material characteristics: (a) grain size distribution (GSD) curve of the mine tailings sample, (b) particles’ size distribution curves of the waste rock barricade, and (c) barricade total or bulk density as a function of the particle size distribution curve number (from #1 to #7).
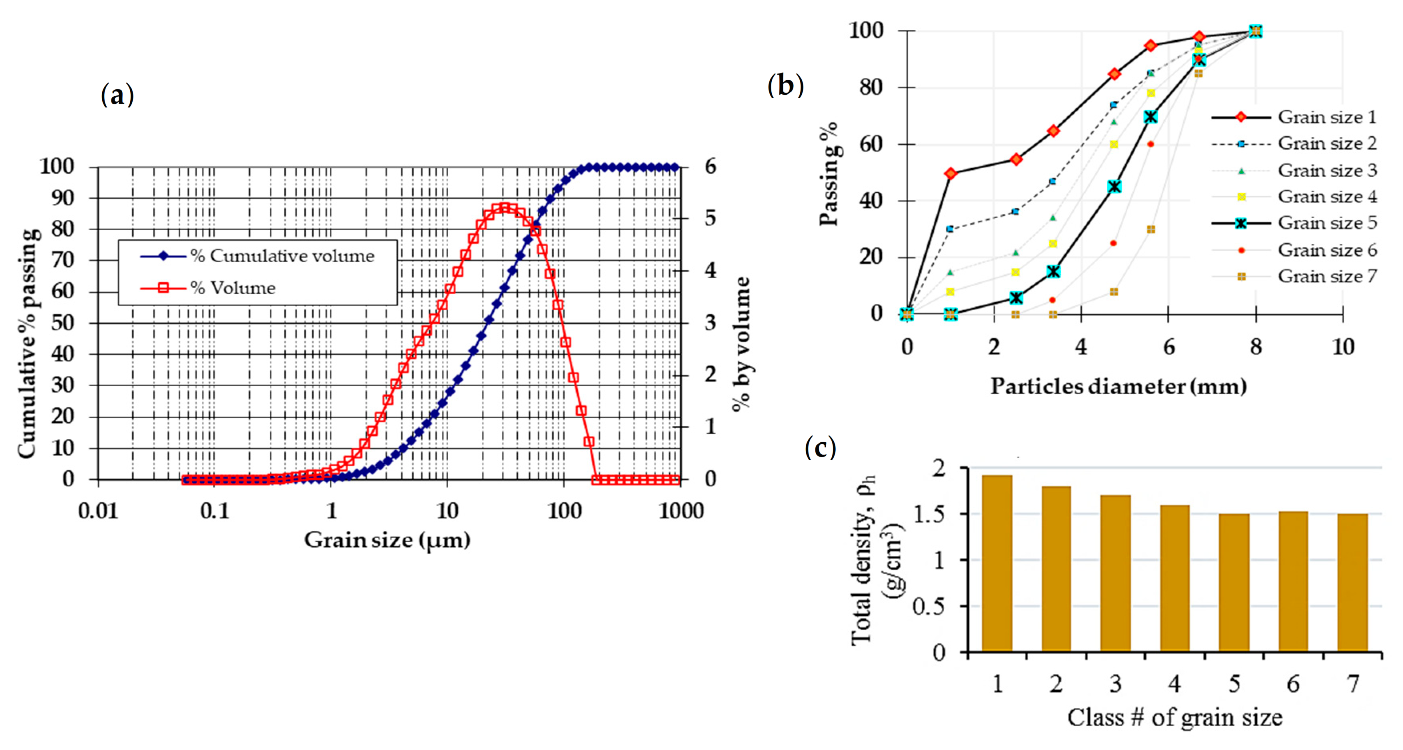
Figure 4.
Experimental protocol: (a) paste backfill mixture preparation using a Hobart mixer and backfill ingredients (water, tailings, and binder), (b) setting up the barricade in the drawpoint, and (c) the first layer of the backfill after pouring and self-weight consolidation took place.
Figure 4.
Experimental protocol: (a) paste backfill mixture preparation using a Hobart mixer and backfill ingredients (water, tailings, and binder), (b) setting up the barricade in the drawpoint, and (c) the first layer of the backfill after pouring and self-weight consolidation took place.
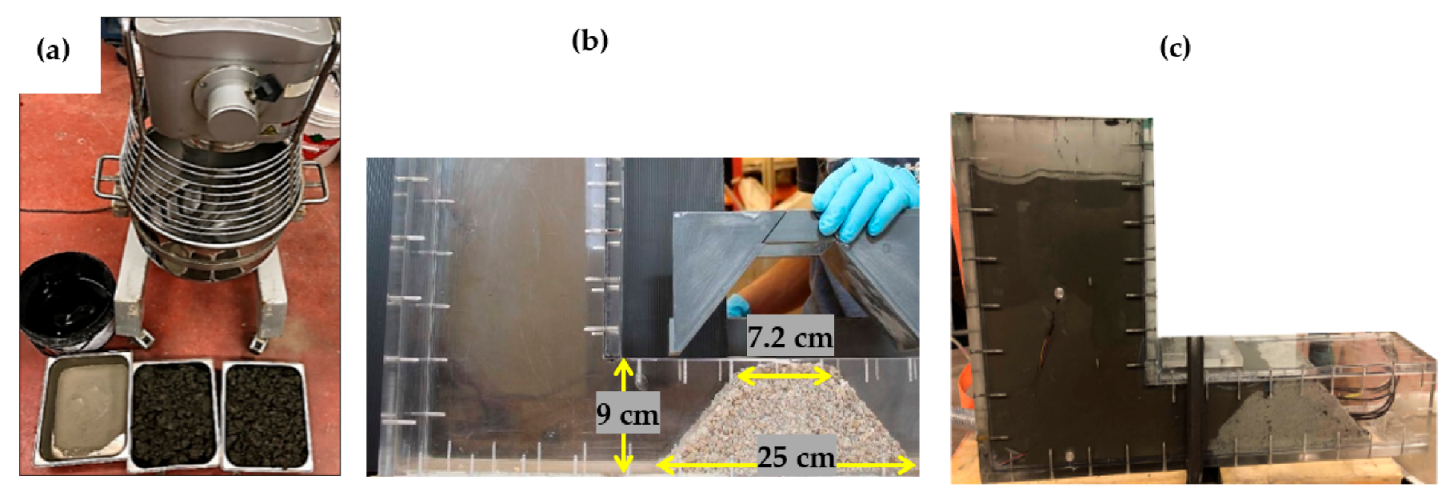
Figure 5.
Measurement of pore water pressure of uncemented fill at three locations in the model: (a) for the GSD #1 barricade, and (b) for the GSD #5 barricade.
Figure 5.
Measurement of pore water pressure of uncemented fill at three locations in the model: (a) for the GSD #1 barricade, and (b) for the GSD #5 barricade.
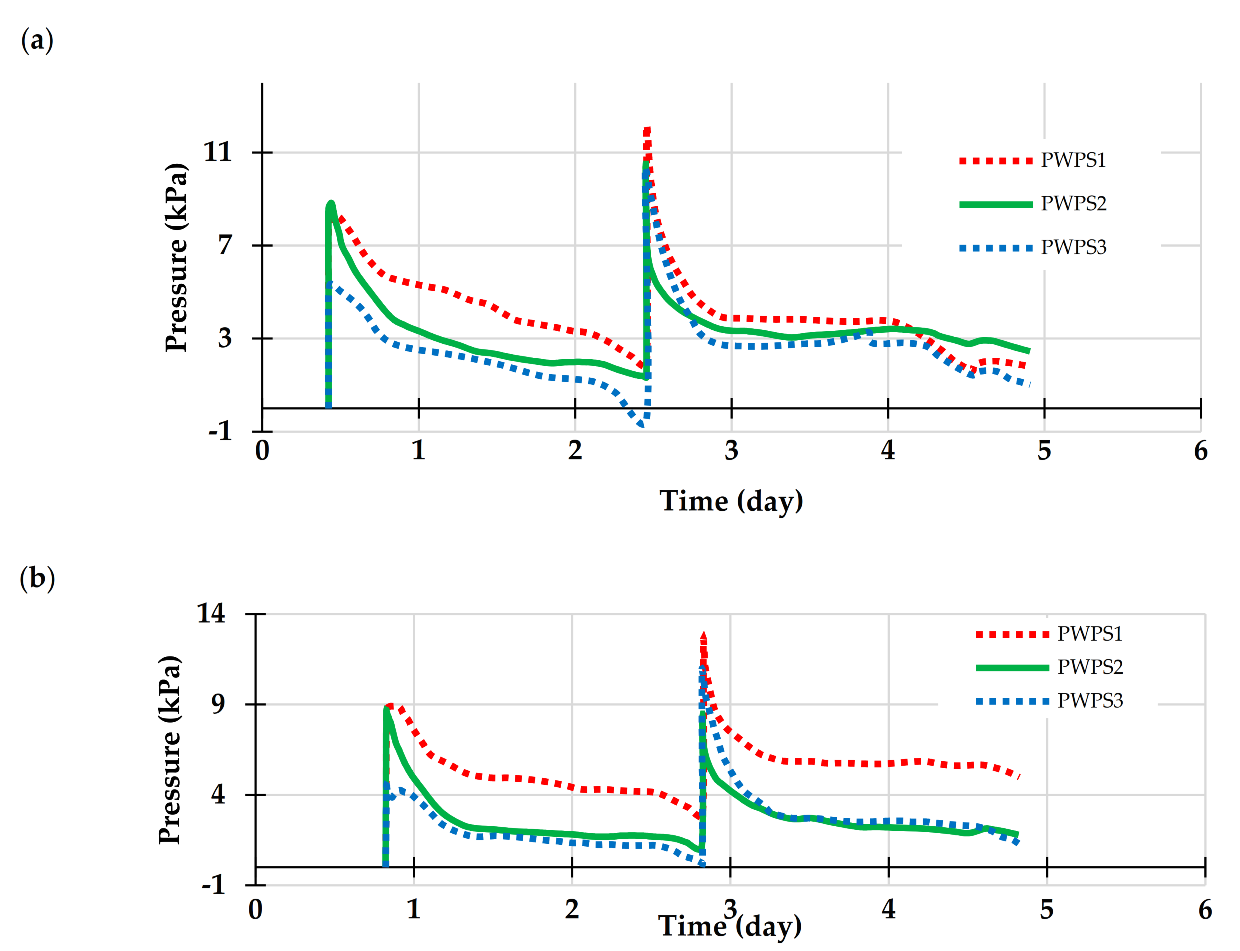
Figure 6.
Uncemented backfill tests: (a) pouring of the second layer of backfill, (b) the model after self-weight consolidation of the second layer, (c) backfill bleeding water at the top of the filling chamber after each placement of the backfill, and (d) the state of the backfill near the barricade after four days (two layers were continuously poured, once every two days).
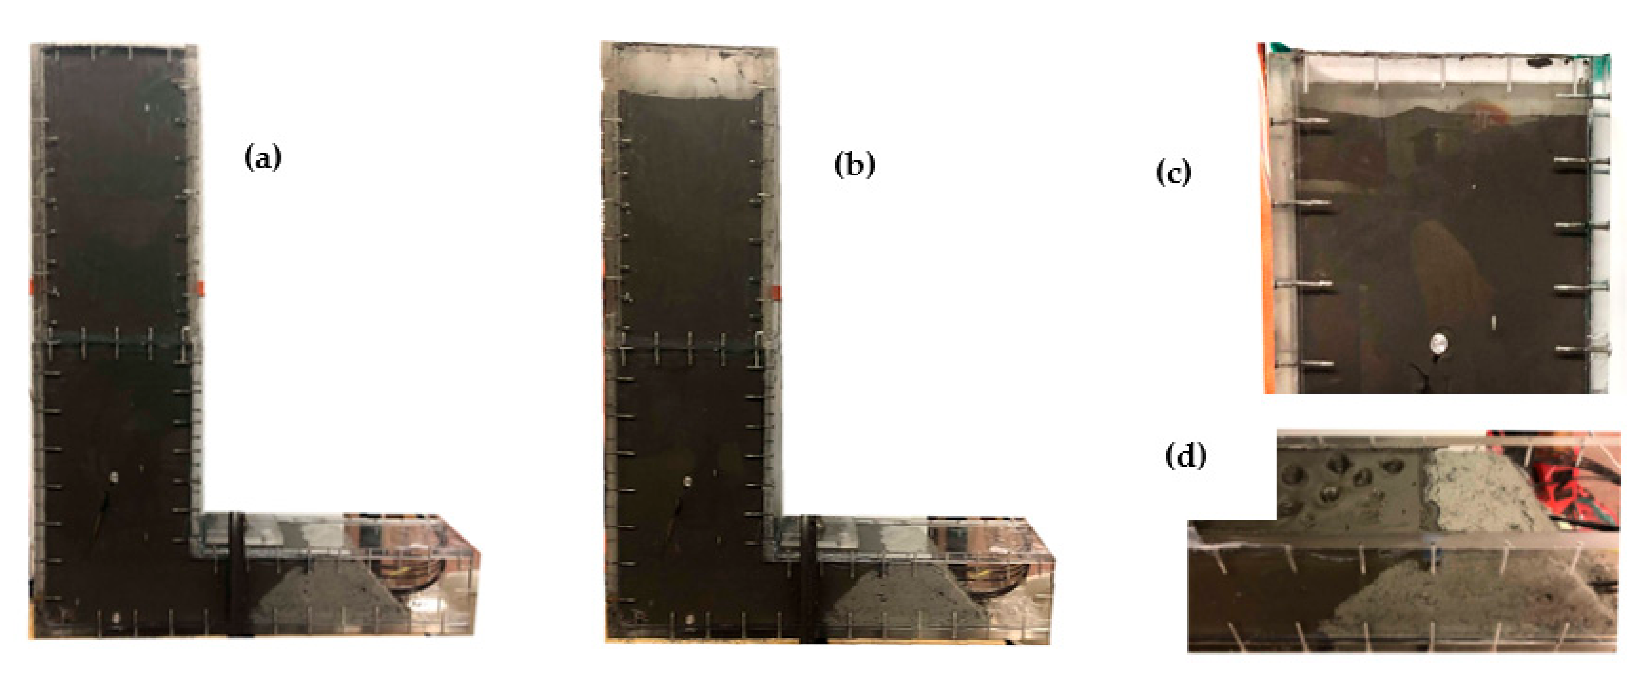
Figure 7.
The measurement of the backfill pressure at the base of the stope: (a) for the GSD #1 barricade, and (b) for the GSD #5 barricade.
Figure 7.
The measurement of the backfill pressure at the base of the stope: (a) for the GSD #1 barricade, and (b) for the GSD #5 barricade.
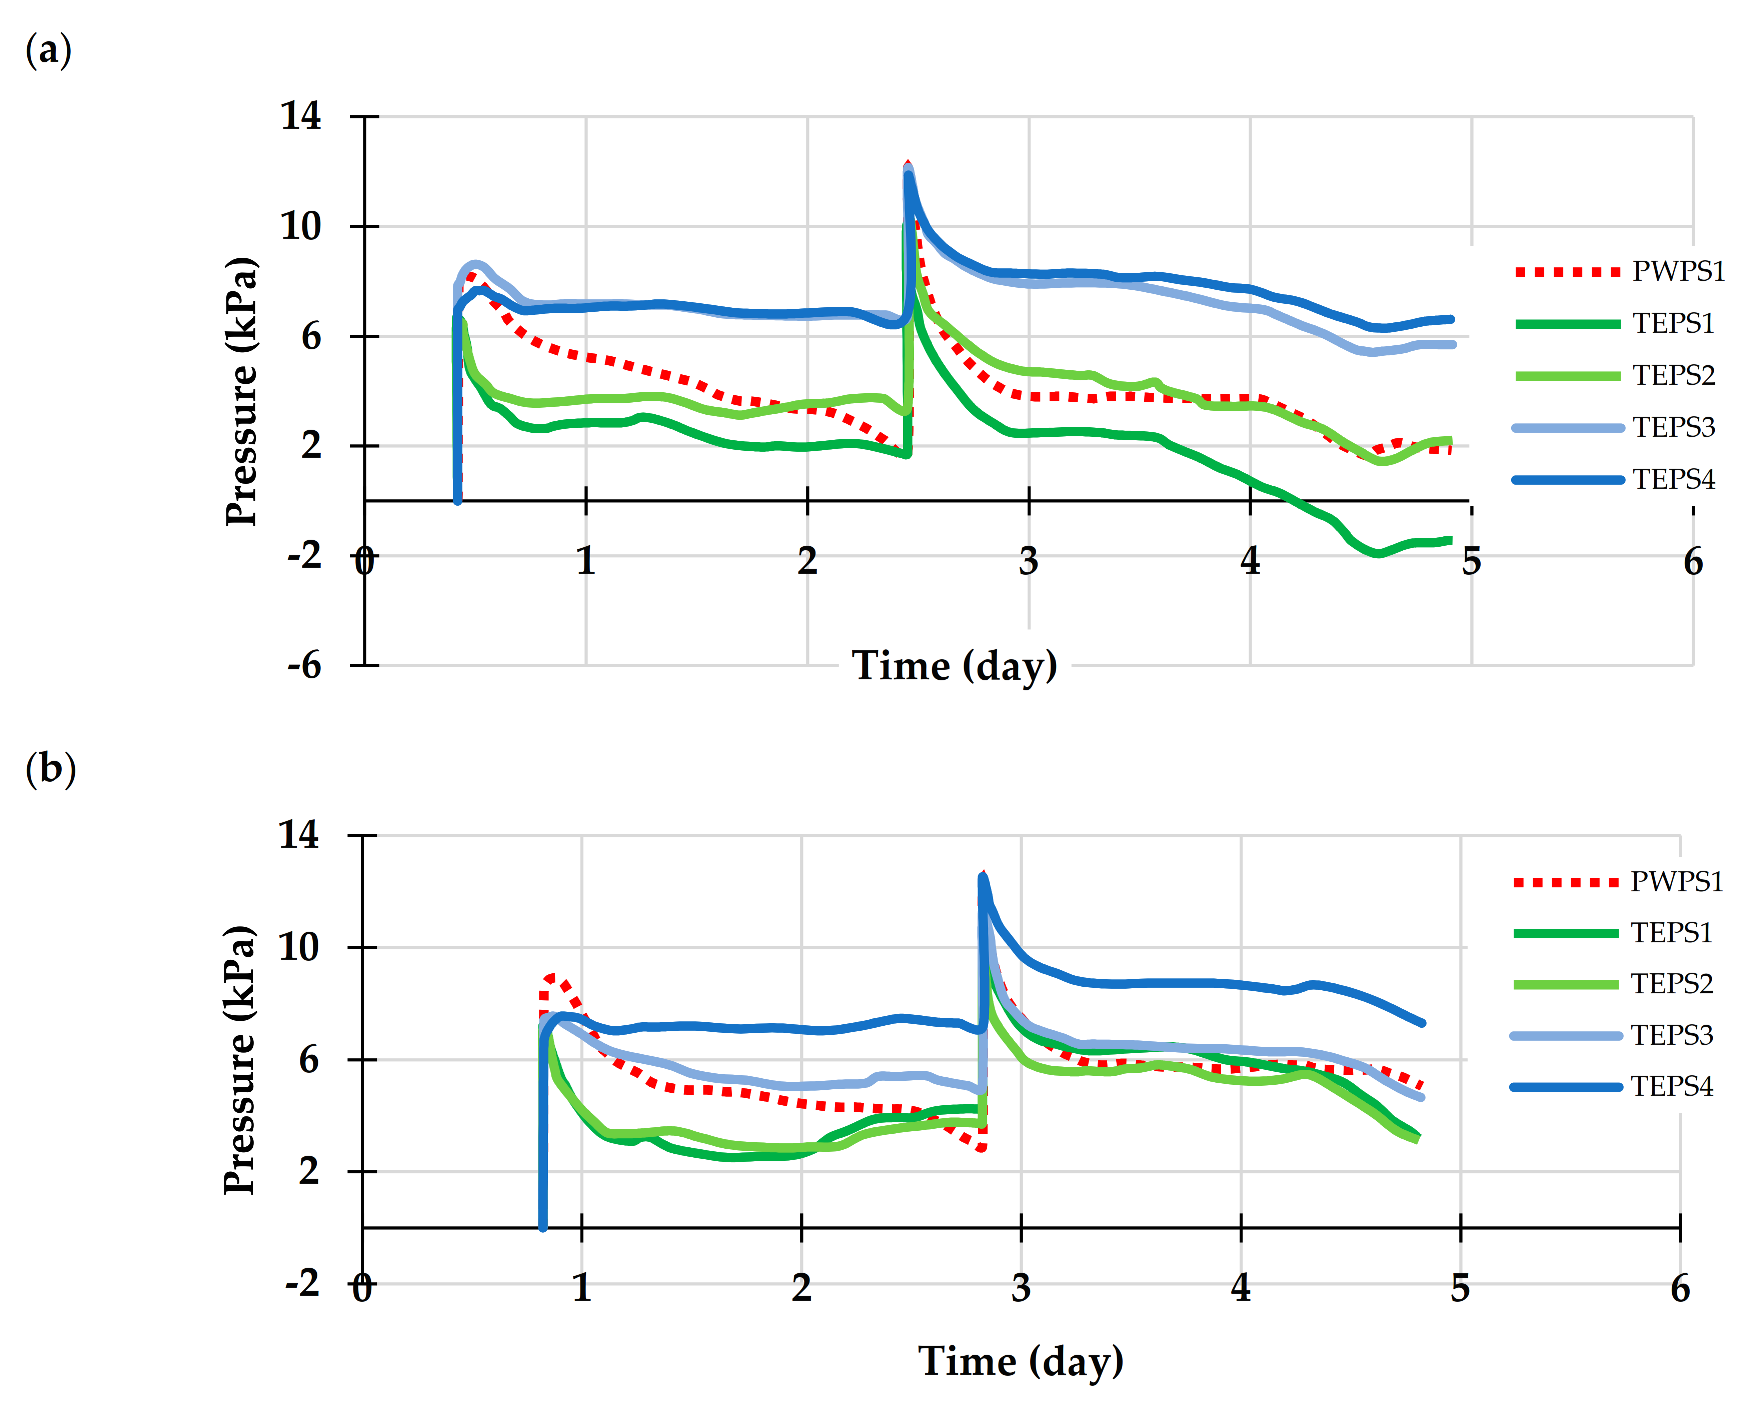
Figure 8.
The backfill pressure at 20 cm above the base stope: (a) for the GSD #1 barricade, and (b) for the GSD #5 barricade.
Figure 8.
The backfill pressure at 20 cm above the base stope: (a) for the GSD #1 barricade, and (b) for the GSD #5 barricade.
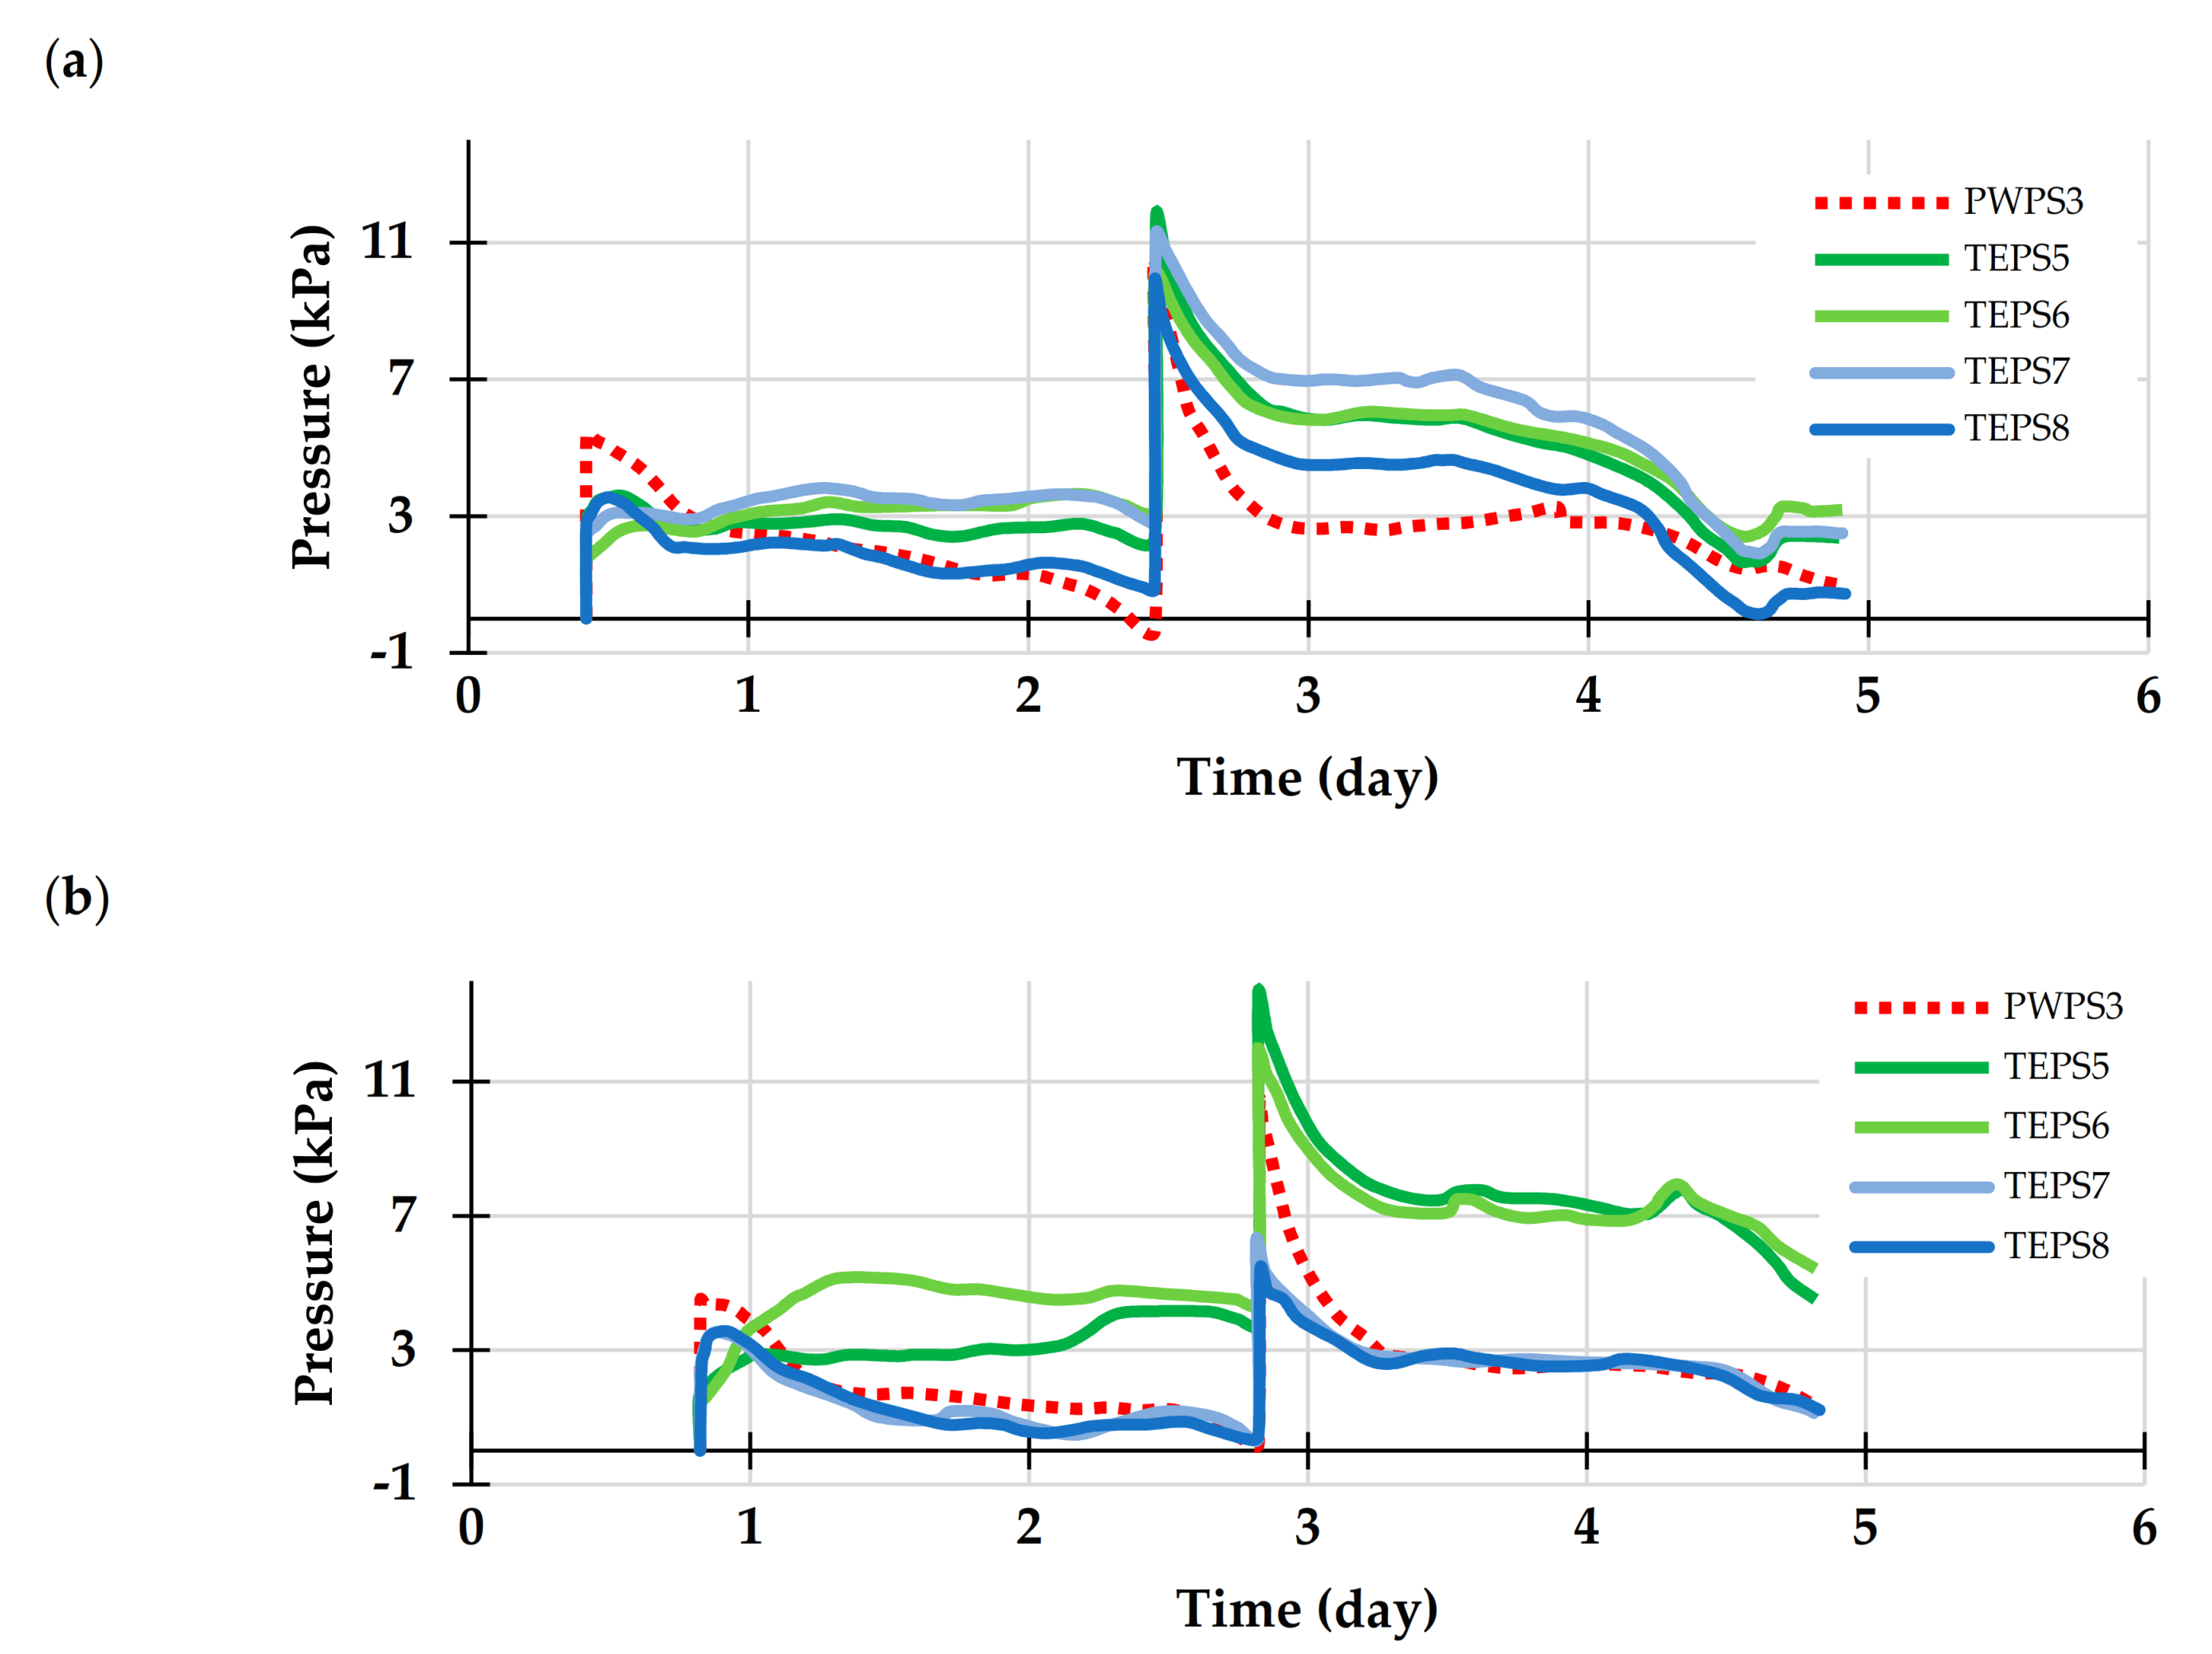
Figure 9.
The pressure of the backfill on the barricade: (a) for the GSD #1 barricade, and (b) for the GSD #5 barricade.
Figure 9.
The pressure of the backfill on the barricade: (a) for the GSD #1 barricade, and (b) for the GSD #5 barricade.

Figure 10.
The drainage water collected during the tests.
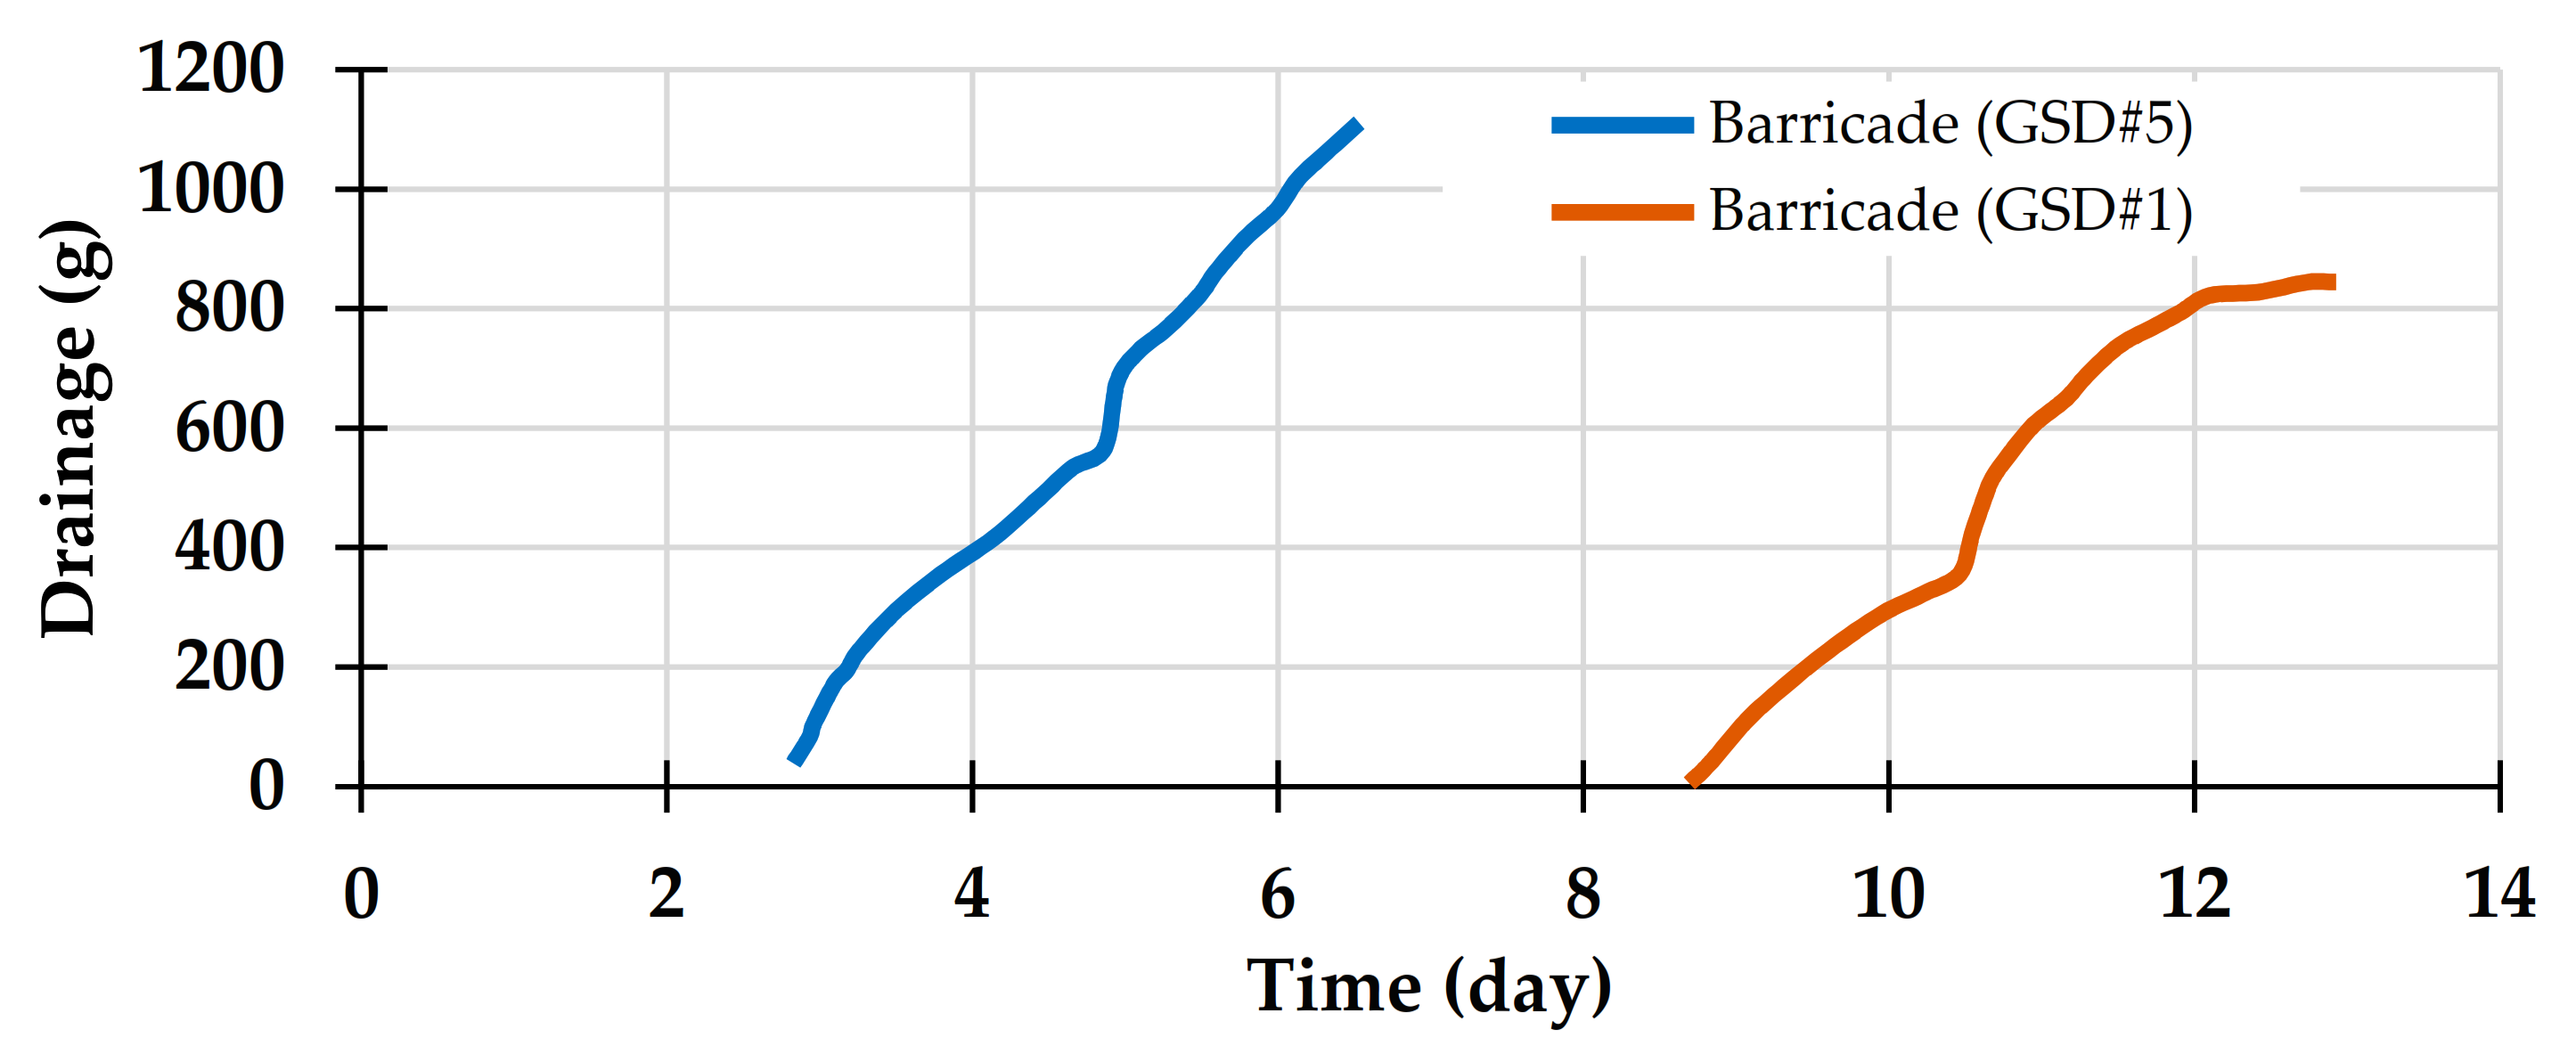
Figure 11.
The backfill pressure measurement on the upstream side of the barricade.
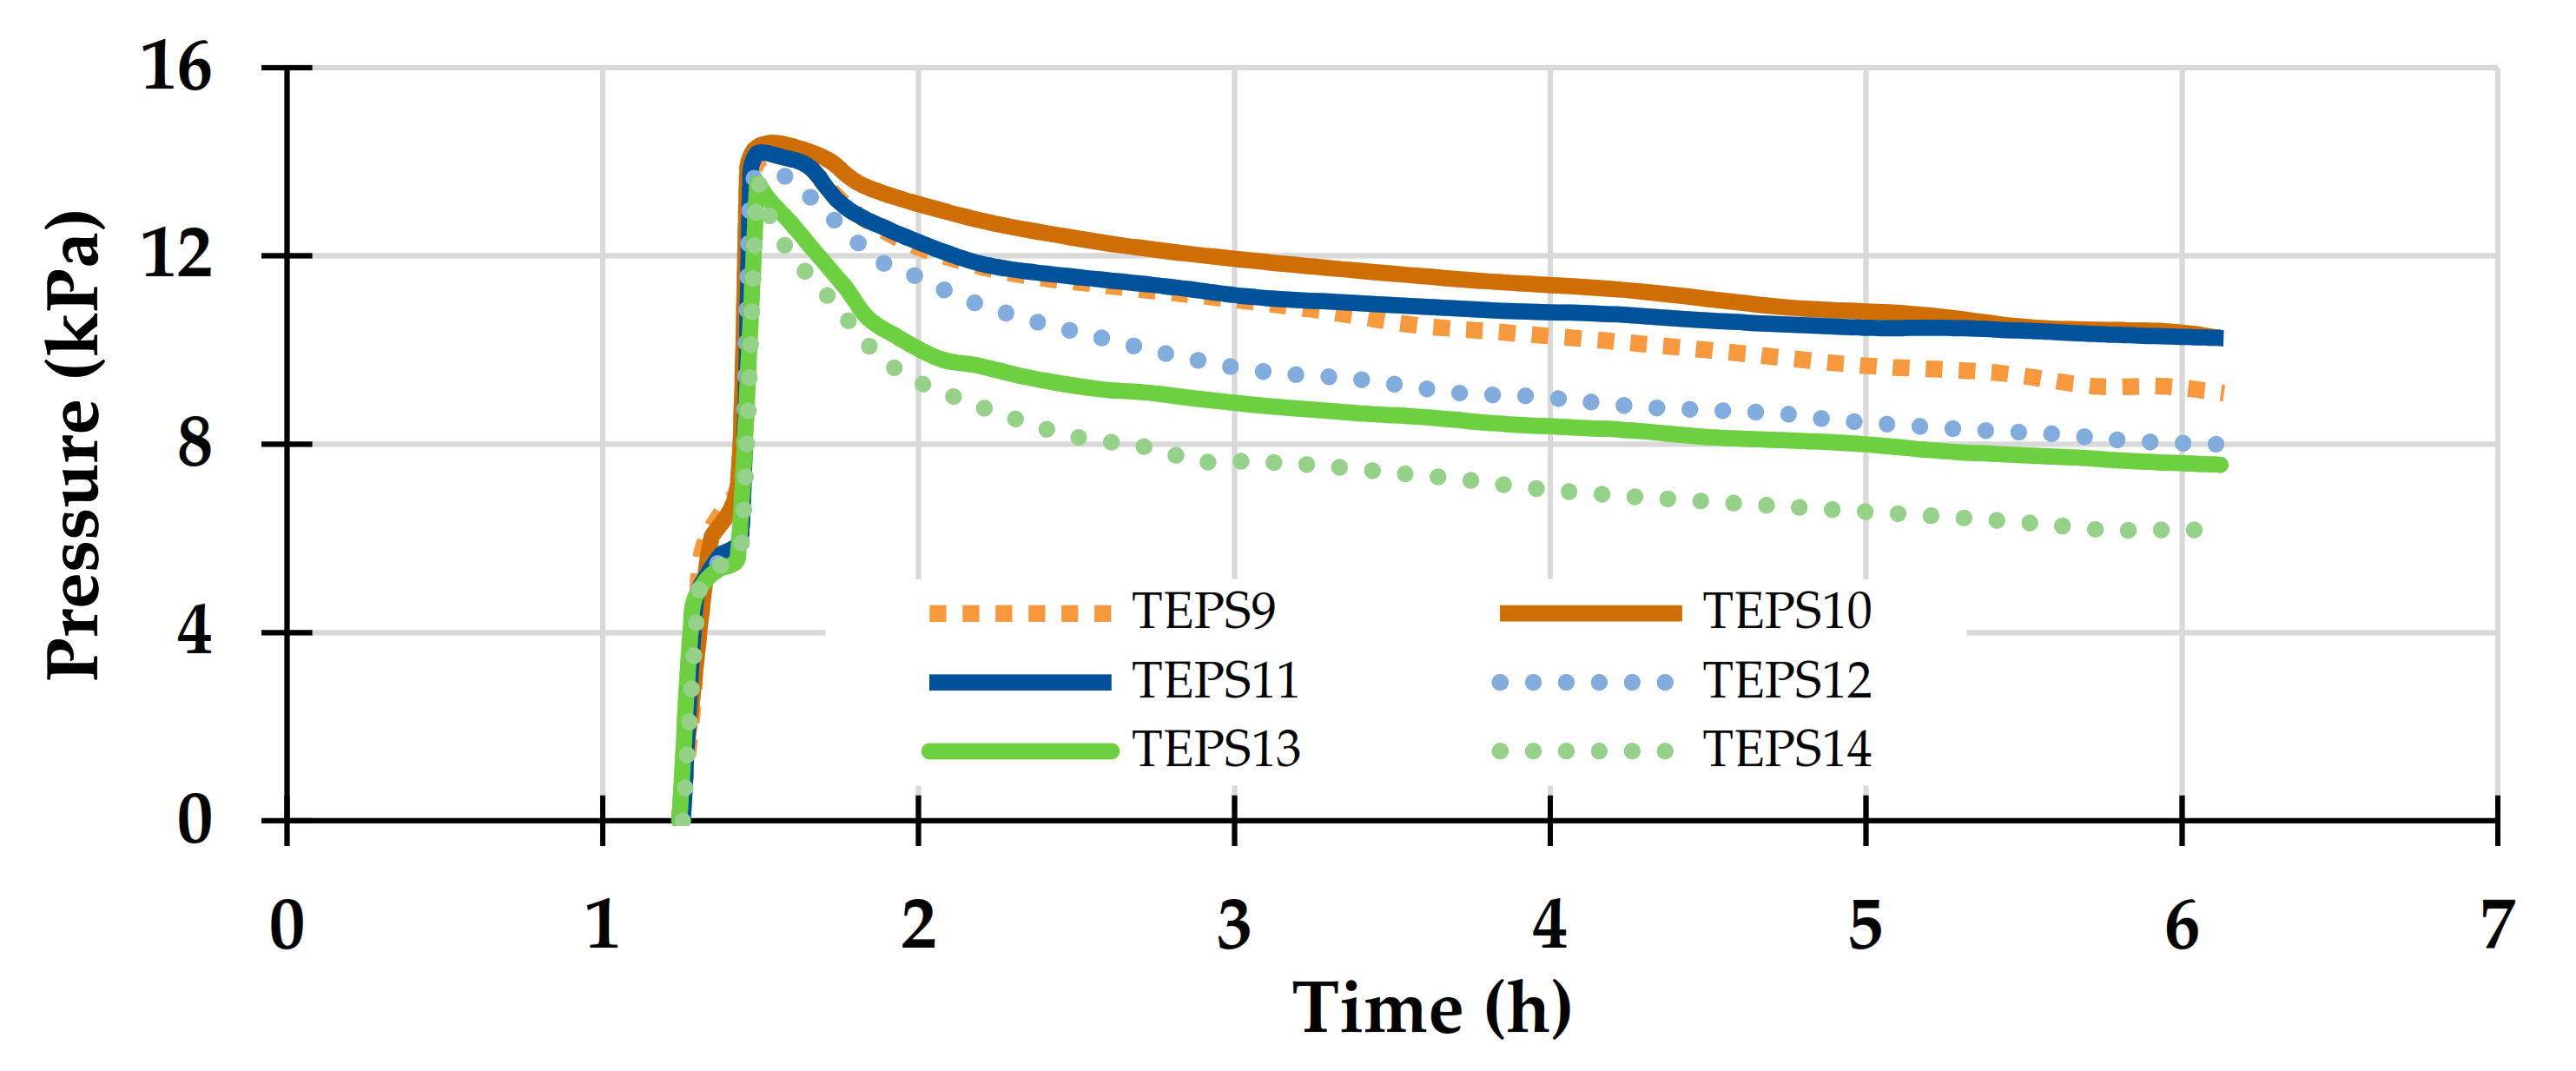
Figure 12.
Backfill pressure measurement: (a) at the base of the stope, and (b) at 20 cm above the base of the stope.
Figure 12.
Backfill pressure measurement: (a) at the base of the stope, and (b) at 20 cm above the base of the stope.

Figure 13.
The pore water pressure at the base of stope (PWPS1), at 20 cm above the stope (PWPS3), and under the barricade (PWPS4).
Figure 13.
The pore water pressure at the base of stope (PWPS1), at 20 cm above the stope (PWPS3), and under the barricade (PWPS4).

Figure 14.
Total pressure measurements: (a) The pore water pressure at the base of stope (PWPS 1), in front of the barricade (PWPS 2), and at 20 cm above the stope (PWPS 3). (b) The total pressure at the base of the stope. (c) The backfill pressure measurement on the upstream side of the barricade.
Figure 14.
Total pressure measurements: (a) The pore water pressure at the base of stope (PWPS 1), in front of the barricade (PWPS 2), and at 20 cm above the stope (PWPS 3). (b) The total pressure at the base of the stope. (c) The backfill pressure measurement on the upstream side of the barricade.
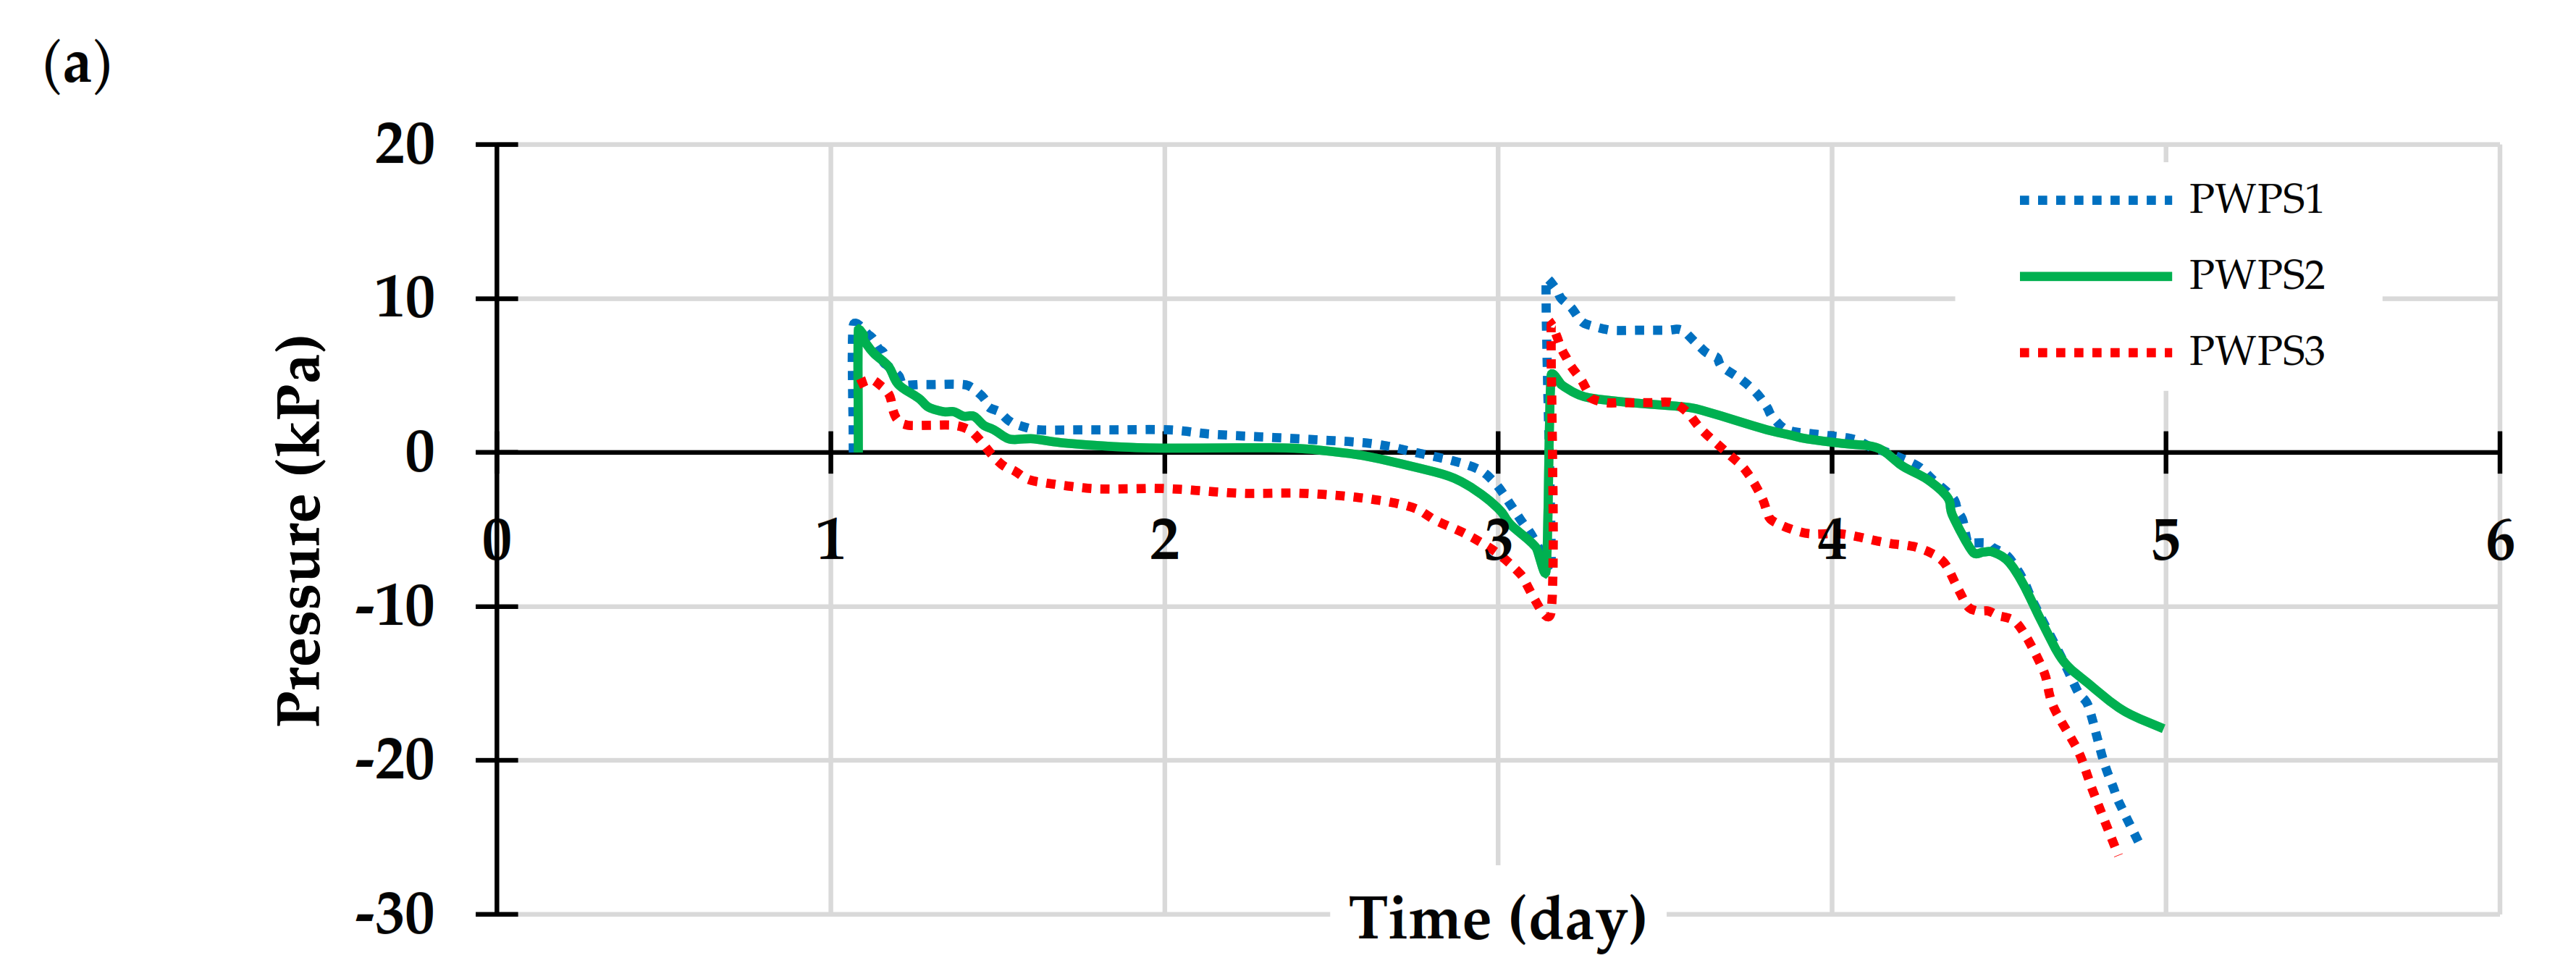
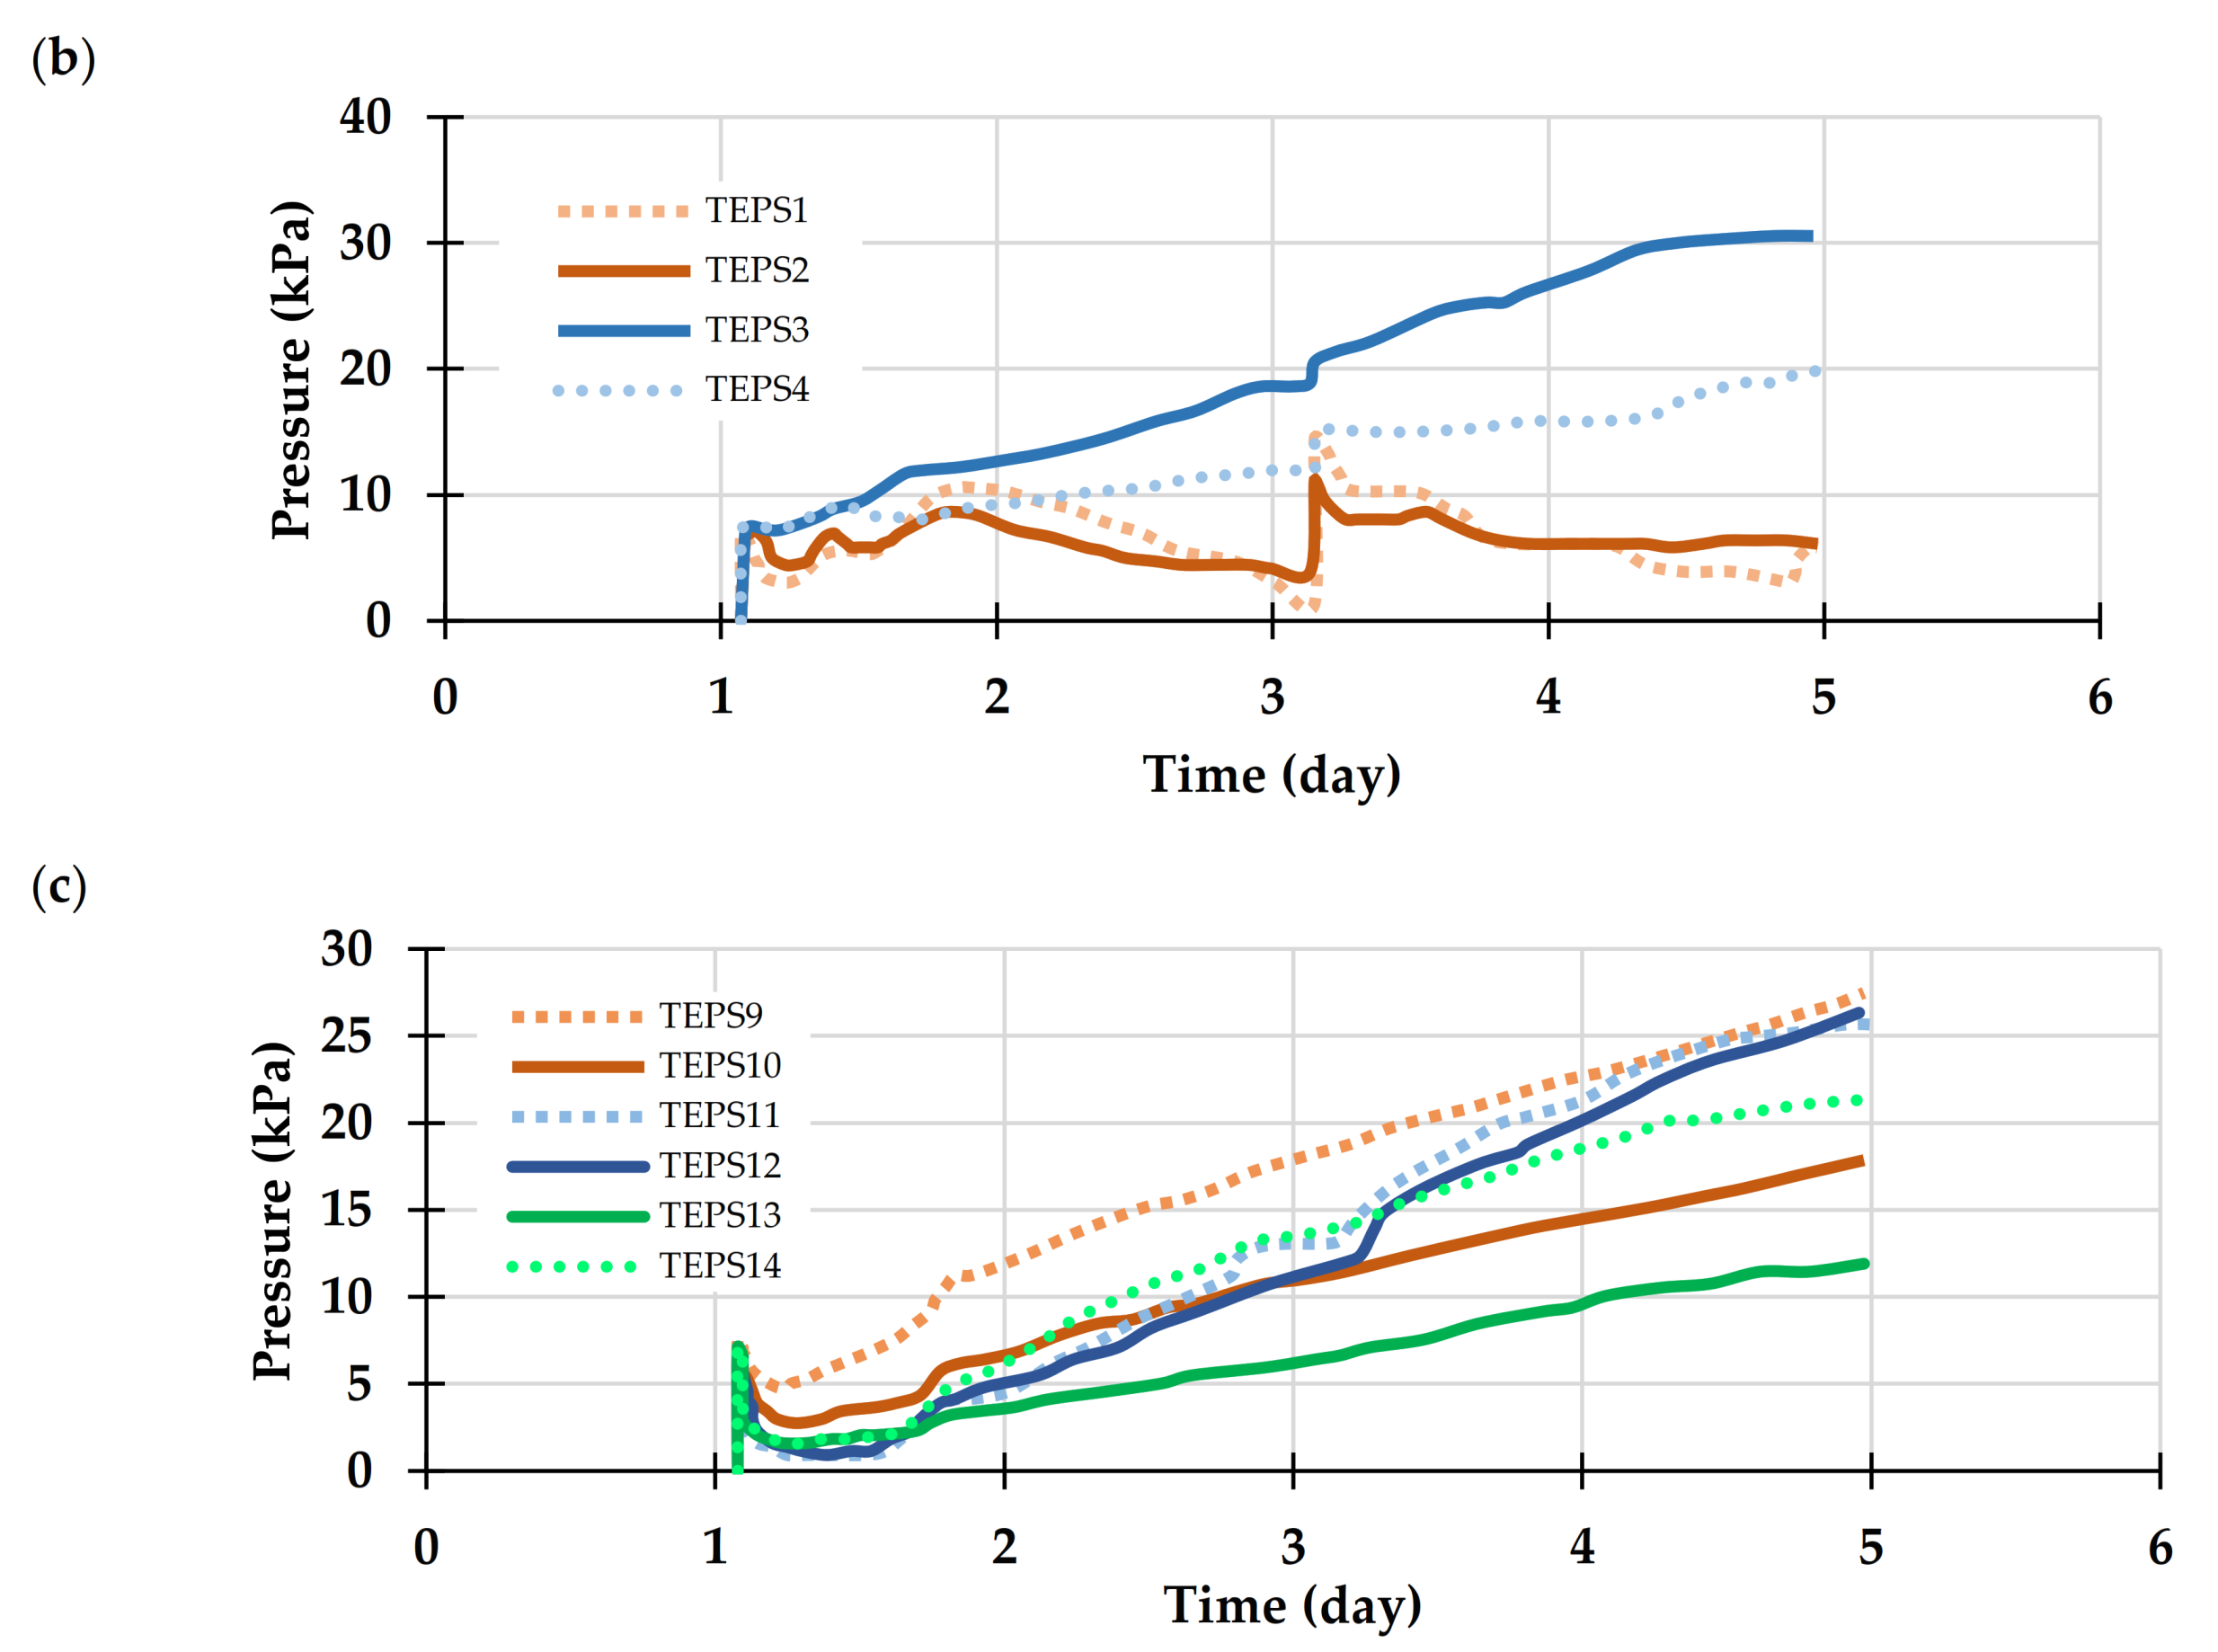
Figure 15.
The failure mechanism of a waste rock barricade made of GSD #1: (a) the different pressure values in the model at failure, (b) the barricade before the failure (the top largely moved), and (c) the barricade after the collapse.
Figure 15.
The failure mechanism of a waste rock barricade made of GSD #1: (a) the different pressure values in the model at failure, (b) the barricade before the failure (the top largely moved), and (c) the barricade after the collapse.
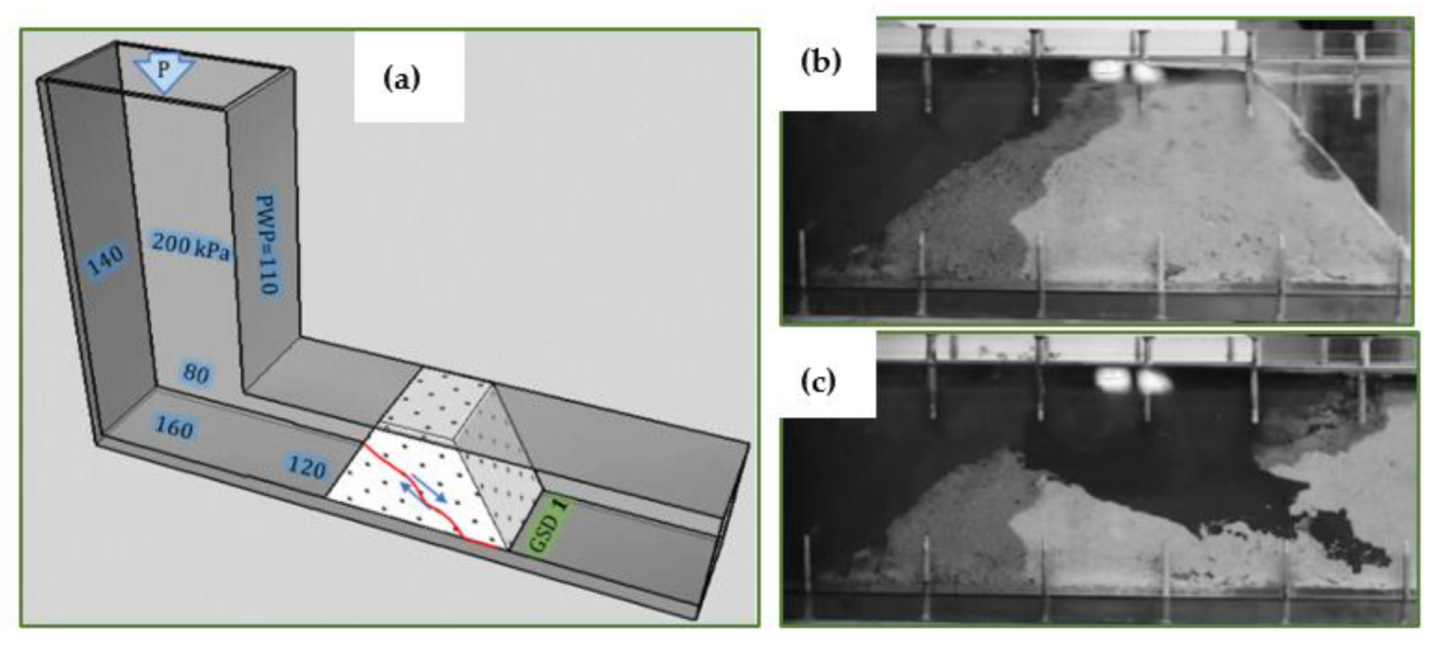
Figure 16.
The failure mechanism of a barricade made of GSD #5: (a) the different pressure values in the model at failure, (b) the barricade before the failure, (c) the hand piston pushes water from the backfill into the pores of the barricade, and (d) the barricade after using the hand piston.
Figure 16.
The failure mechanism of a barricade made of GSD #5: (a) the different pressure values in the model at failure, (b) the barricade before the failure, (c) the hand piston pushes water from the backfill into the pores of the barricade, and (d) the barricade after using the hand piston.
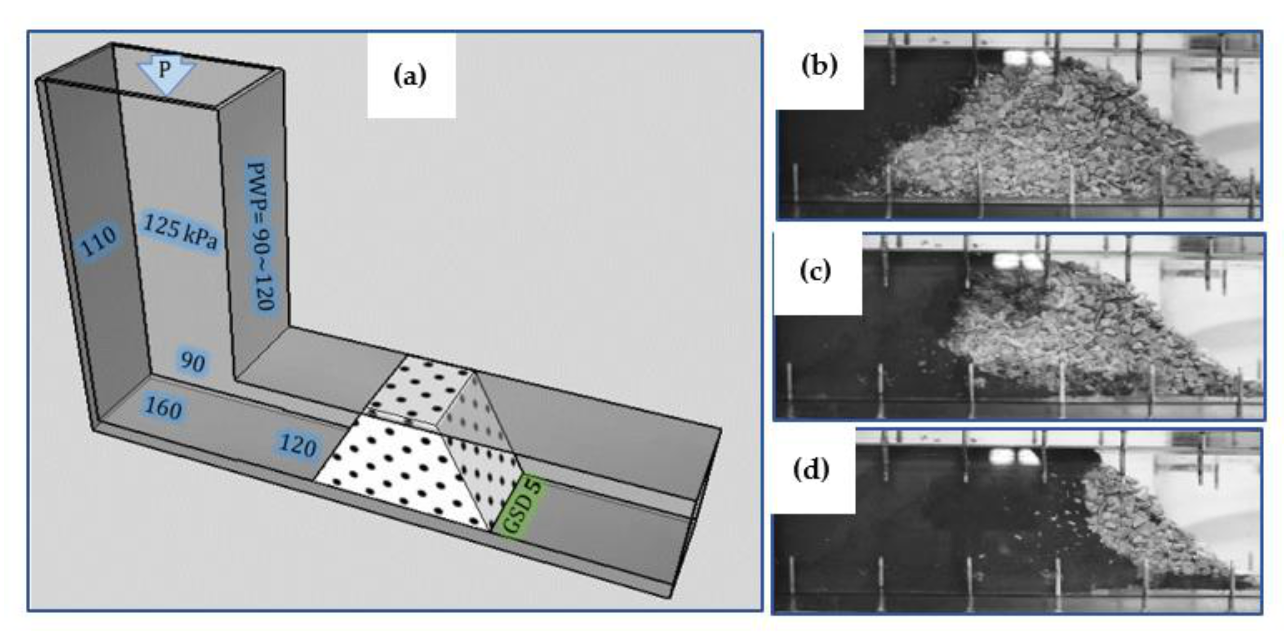
Figure 17.
Failure mechanism of a barricade made of the GSD #2: (a) after the filling, (b) during the increase of the pressure using the hand piston, and (c) at failure (at the end of the test).
Figure 17.
Failure mechanism of a barricade made of the GSD #2: (a) after the filling, (b) during the increase of the pressure using the hand piston, and (c) at failure (at the end of the test).

Table 1.
Geometric characteristics of the three types of stress sensors used on the reduced model.
| Sensor | Total Earth Pressure (TEP) Sensors | Pore Water Pressure (PWP) Sensor | |
|---|---|---|---|
| Manufacture (brand) | KYOWA | Dan street Nanjing Electronic Technology Co., | |
| Model Type | PS-D | DMTY | DMKY |
| Capacity | 50 kPa | 100 kPa | 100 kPa |
| Size | 6 × 0.6 | 12 × 4.2 mm | 15.8 × 21 mm |
| Rated Output | 500 × 10−6 strain | 400 × 10−6 strain | 400 × 10−6 strain |
| Overload | 150% | 120% | 120% |
| Input/output resistance | 350 Ω | 350 Ω | 10,000 Ω |
| Exciting voltage | 2 V | 2 V | 2 V |
Table 2.
Characteristics of the mine tailings used in the experimental tests (LaRonde mine tailings).
Table 2.
Characteristics of the mine tailings used in the experimental tests (LaRonde mine tailings).
| Physical Characteristics | Mineralogical Analysis Semi-Quantitative Mineralogical Analysis by X-ray Diffraction | ||
|---|---|---|---|
| Parameter (Units) | Values | Mineral | Values |
| Specific gravity, Gs Ultrafine content P20µm (%) D10, effective particle size (µm) D30, size of 30 % passing (µm) D50, average particle size (µm) D60, size of 60 % passing (µm) D90, size of 90 % passing (µm) CU = D60/D10, coefficient of uniformity CC = D302/(D60 × D10), coefficient of curvature Unified Soil Classification System (USCS) | 3.32 46% 4.16 11.25 21.75 29.18 76.35 7.02 1.04 ML (low plastic silt) | Quartz Pyrite Chamosite 1M Paragonite 1M Albite Muscovite 2M 1 Orthoclase Labradorite An65 Microcline Chalcopyrite Sphalerite Gypsum | 44.84% 25.73% 4.38% 2.98% 2.10% 9.61% 1.56% 3.09% 3.66% 0.45% 0.16% 1.45% |
| Total sulfur analysis and carbon by induction furnace | |||
| Ctotal % p/p (method detection limit, MDL = 0.05) | 0.256 | Stotal % p/p (MDL = 0.009) | 15.9 |
Publisher’s Note: MDPI stays neutral with regard to jurisdictional claims in published maps and institutional affiliations. |
© 2020 by the authors. Licensee MDPI, Basel, Switzerland. This article is an open access article distributed under the terms and conditions of the Creative Commons Attribution (CC BY) license (http://creativecommons.org/licenses/by/4.0/).
Share and Cite
MDPI and ACS Style
Nujaim, M.; Belem, T.; Giraud, A. Experimental Tests on a Small-Scale Model of a Mine Stope to Study the Behavior of Waste Rock Barricades during Backfilling. Minerals 2020, 10, 941. https://doi.org/10.3390/min10110941
AMA Style
Nujaim M, Belem T, Giraud A. Experimental Tests on a Small-Scale Model of a Mine Stope to Study the Behavior of Waste Rock Barricades during Backfilling. Minerals. 2020; 10(11):941. https://doi.org/10.3390/min10110941
Chicago/Turabian StyleNujaim, Mutaz, Tikou Belem, and Albert Giraud. 2020. "Experimental Tests on a Small-Scale Model of a Mine Stope to Study the Behavior of Waste Rock Barricades during Backfilling" Minerals 10, no. 11: 941. https://doi.org/10.3390/min10110941
Note that from the first issue of 2016, this journal uses article numbers instead of page numbers. See further details here.