Geochronological and Geochemical Constraints on the Origin of the Hutouya Polymetallic Skarn Deposit in the East Kunlun Orogenic Belt, NW China

Abstract
:1. Introduction
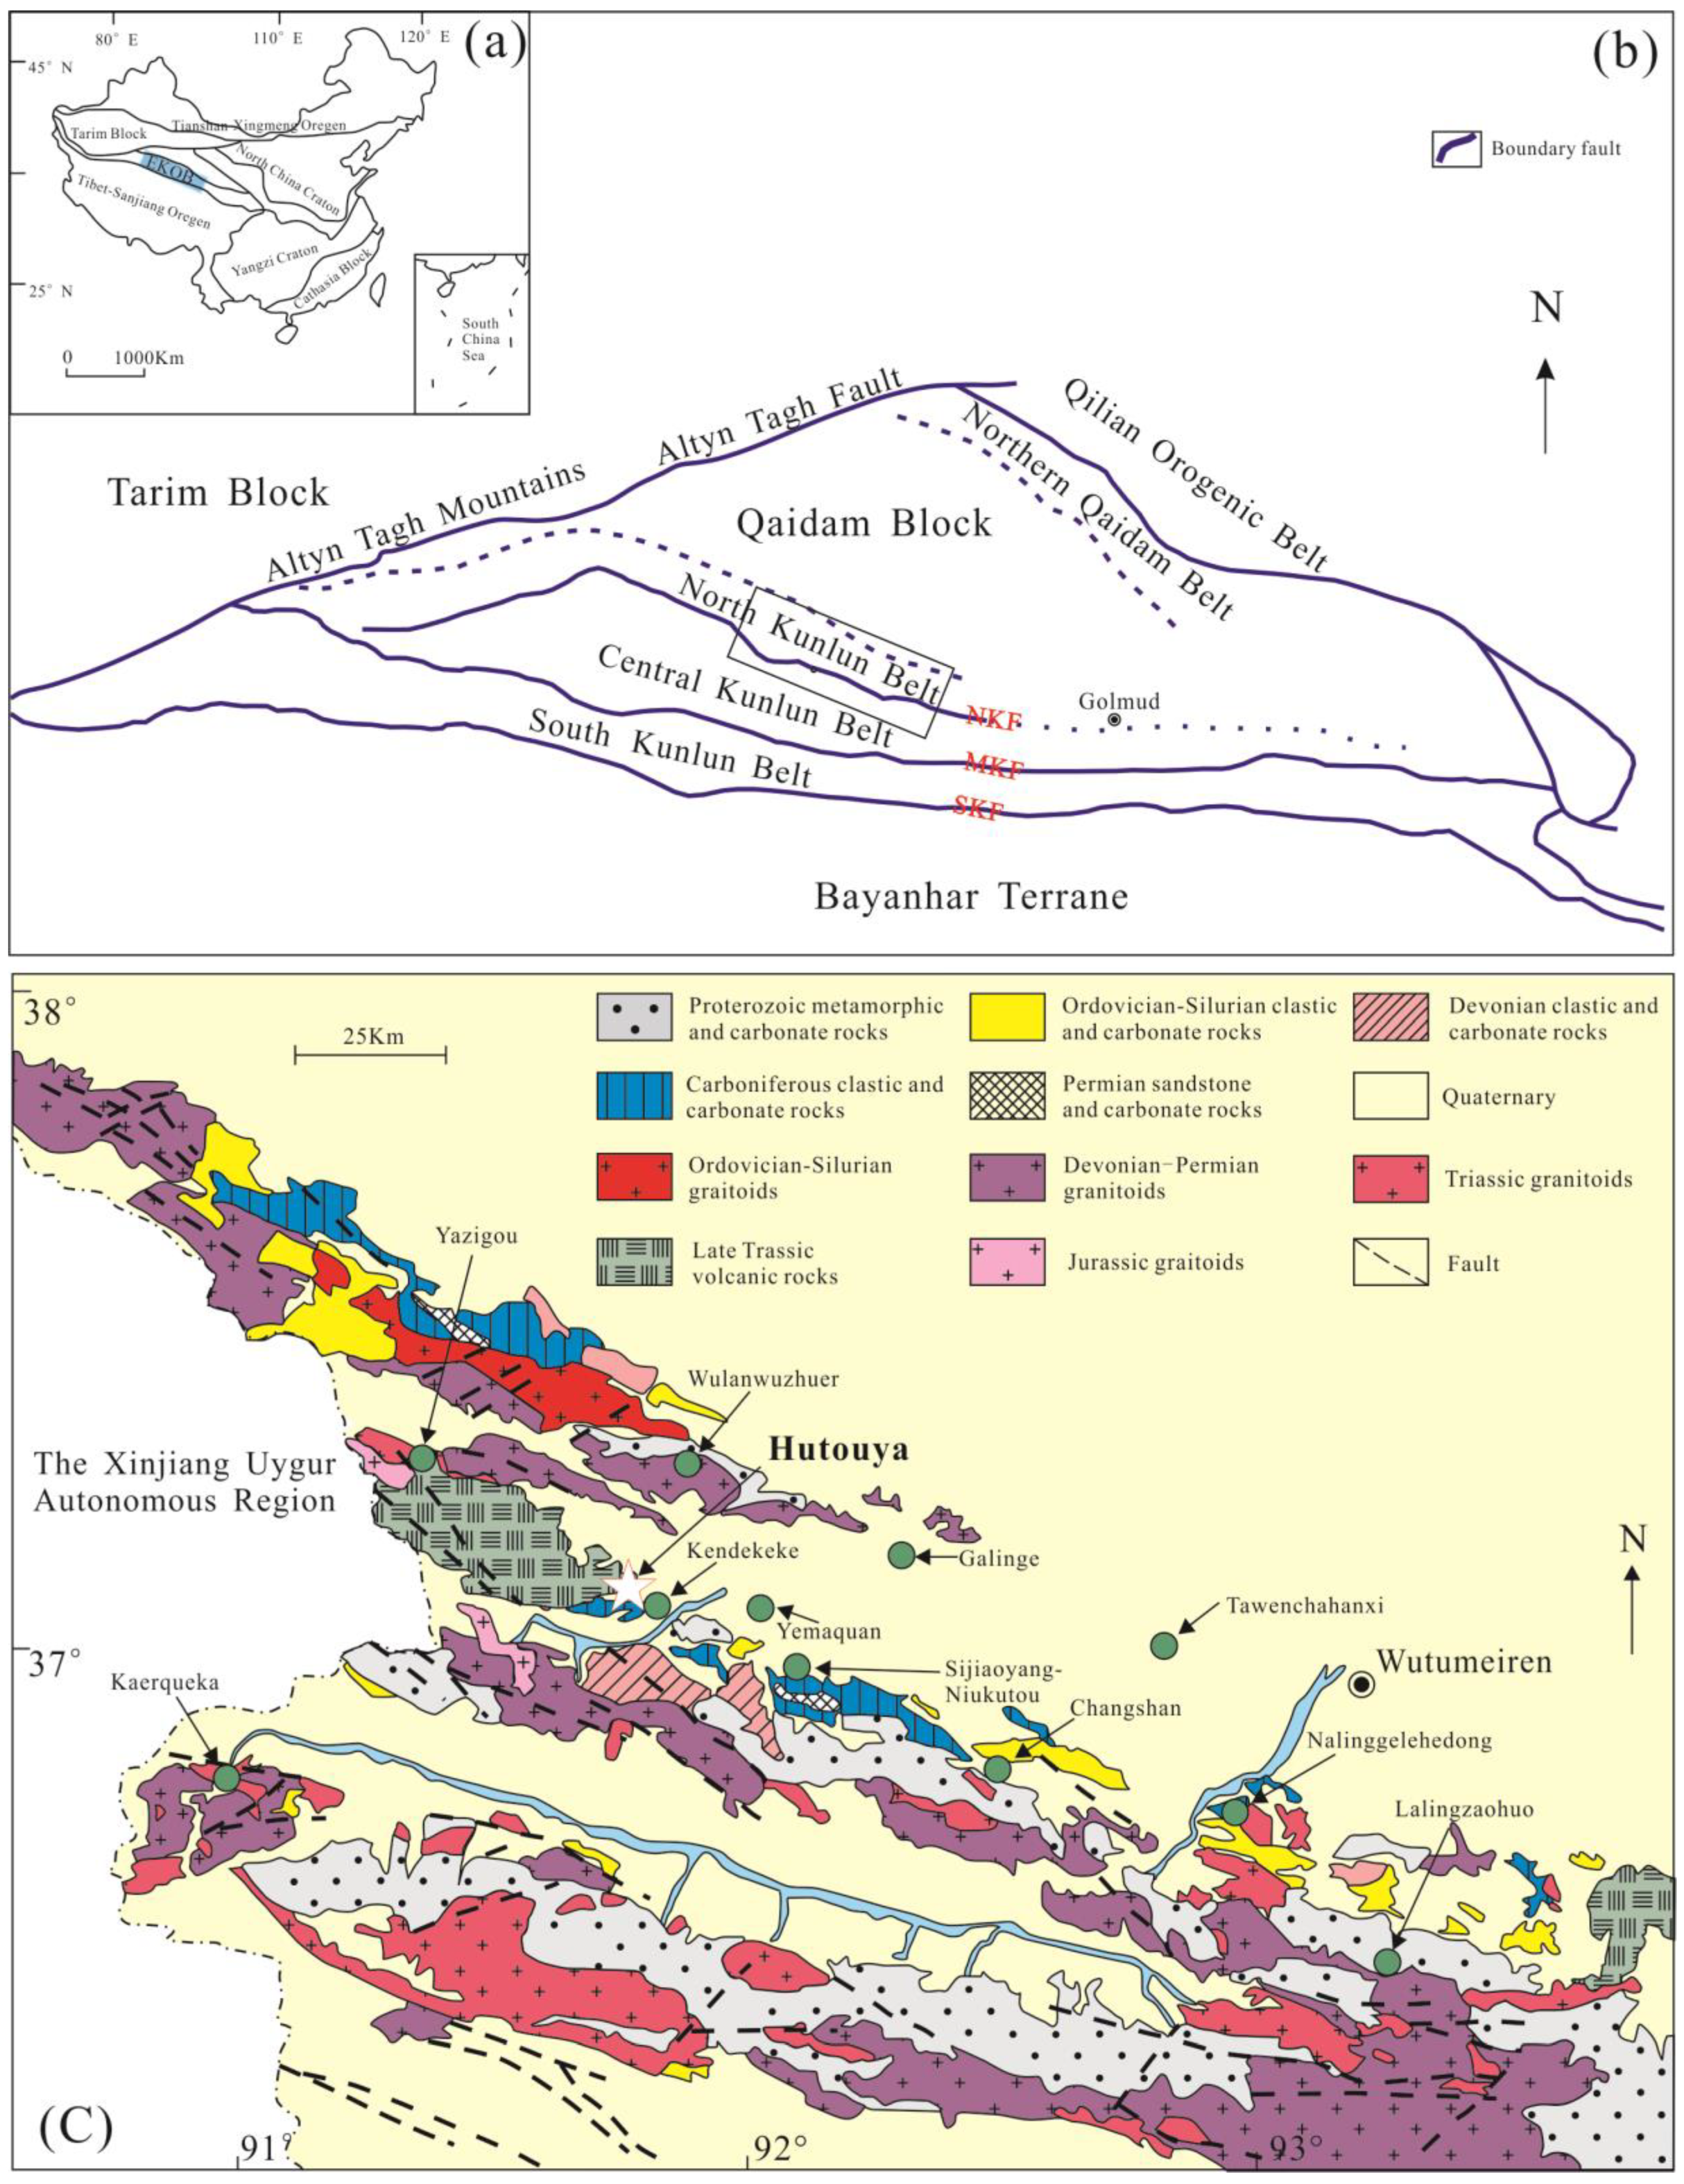
2. Regional Geology
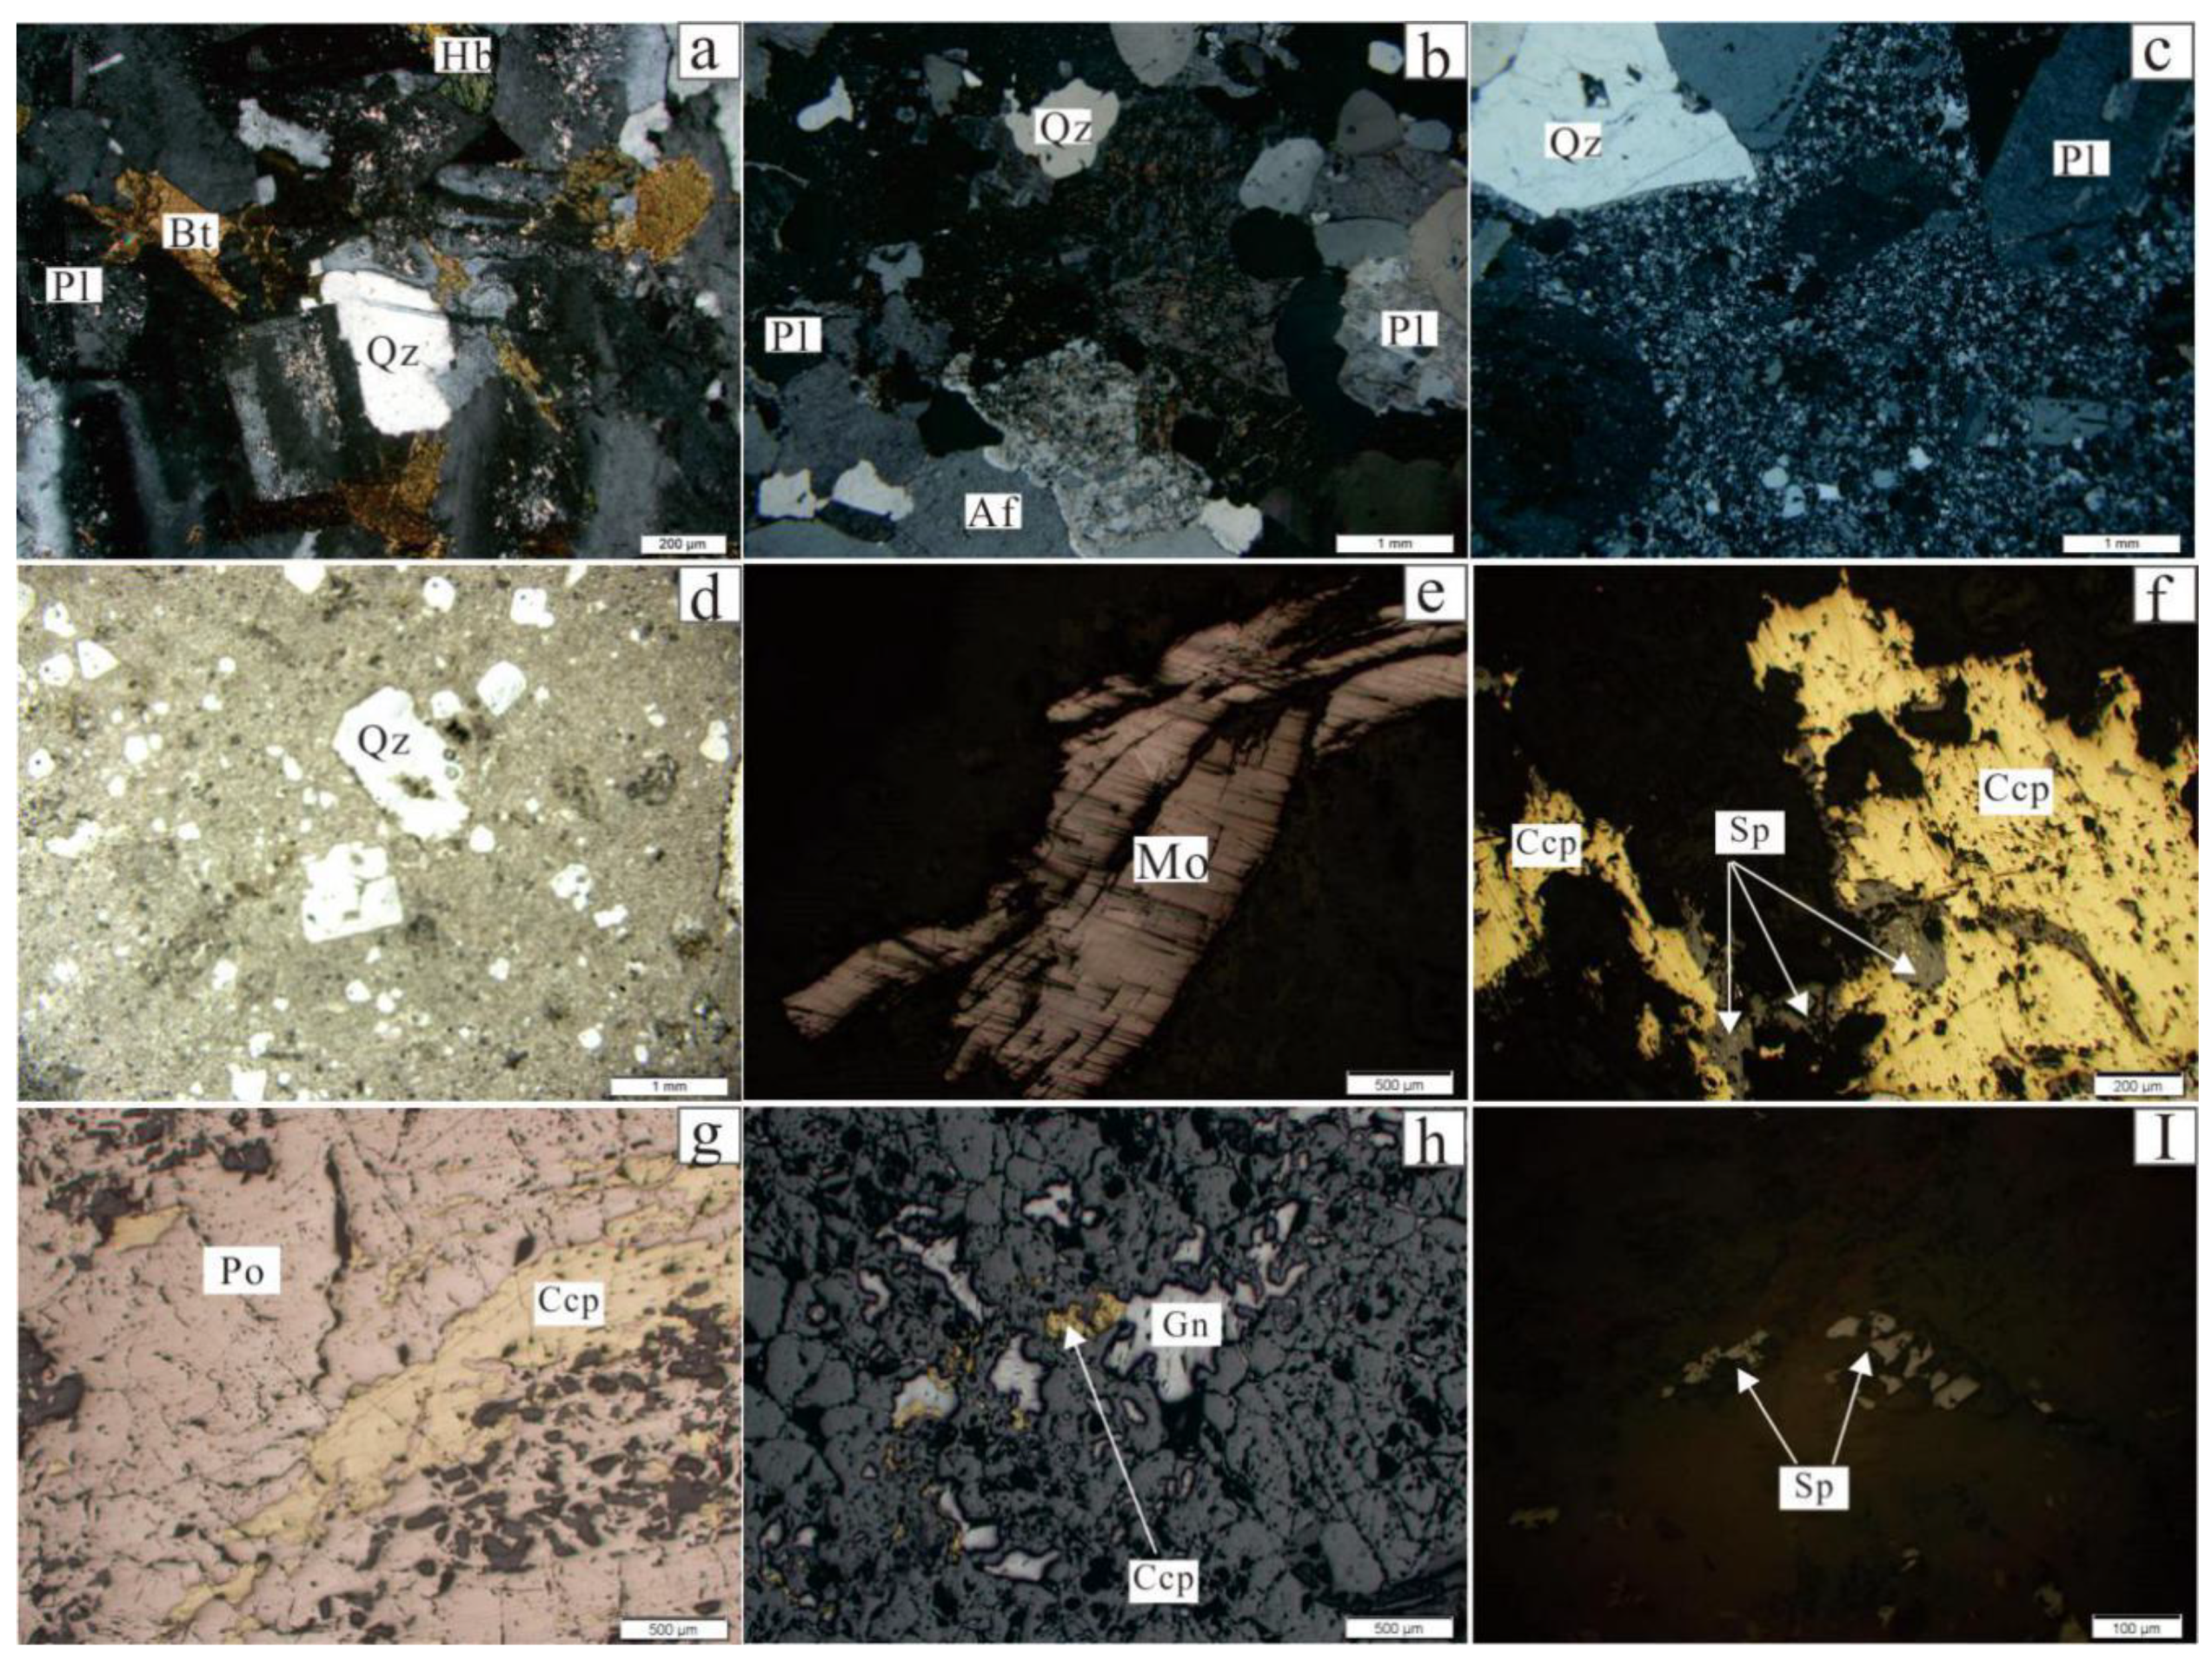
3. Deposit Geology and Sample Descriptions
- (1)
- Ore belt No. I: the ore bodies occur within the granodiorite contact belt with the marble of the Lower Carboniferous Dagan’gou Formation. The No. I ore belt is 2 km in length and includes four ore bodies. The main ore body is ca. 560 m in length and ca. 6.6 m in thickness. The ore bodies generally dip south, and the dip angle is about 20–70°. The magnetite is the dominant opaque mineral in these ores;
- (2)
- Ore belt No. II: the ore bodies occur within the contact zone between the Upper Carboniferous Di’aosu Formation and the monzogranite. Ore belt No. II is 1.5 km in length and includes 25 ore bodies. The two main ore bodies are 500–600 m in length and 5–6m in thickness. The ore bodies generally dip south, and the dip angle is about 40~75°. The chalcopyrite is the dominant opaque mineral in these ores, with minor Fe-Sn-Zn mineralization;
- (3)
- Ore belt No. III: the mineralization produced in the contact zone between the granodiorite and the Upper Carboniferous Di’aoiosu Formation. Two iron ore bodies have been explored. The ore belt stretches 1.3 km. The alteration types are diopsidization, epidotiation, and choritization;
- (4)
- Ore belt No. VI: the mineralization occurs in the contact zone between the granites (including monzogranite and small granite porphyry veins) and the Upper Carboniferous Di’aosu Formation. The ore belt is 3 km in length and 10–50 m in width. Two main mineral bodies (Pb, Zn, and Cu) have been explored. The length of the two main ore bodies is ca. 830 m, and the thickness of the ore body is about 5~6 m;
- (5)
- Ore belt No. VI: the ore bodies occurs in the structure fracture of the Upper Carboniferous Di’aosu Formation. The main ore body is 490 m long, with an average thickness of 3.5 m and an average zinc grade of 2.52% and lead grade of 2.30%;
- (6)
- Ore belt No. VII: the ore bodies are located in the E–W trending tectono-fracturing belts in the mid-Proterozoic Langyashan Formation limestone. The No. VII mineralized zone contains four main ore bodies with strata-bound features.
4. Analytical Methods
5. Results
5.1. Geochronology
5.1.1. Zircon U-Pb Dating
5.1.2. Molybdenite Re-Os Dating
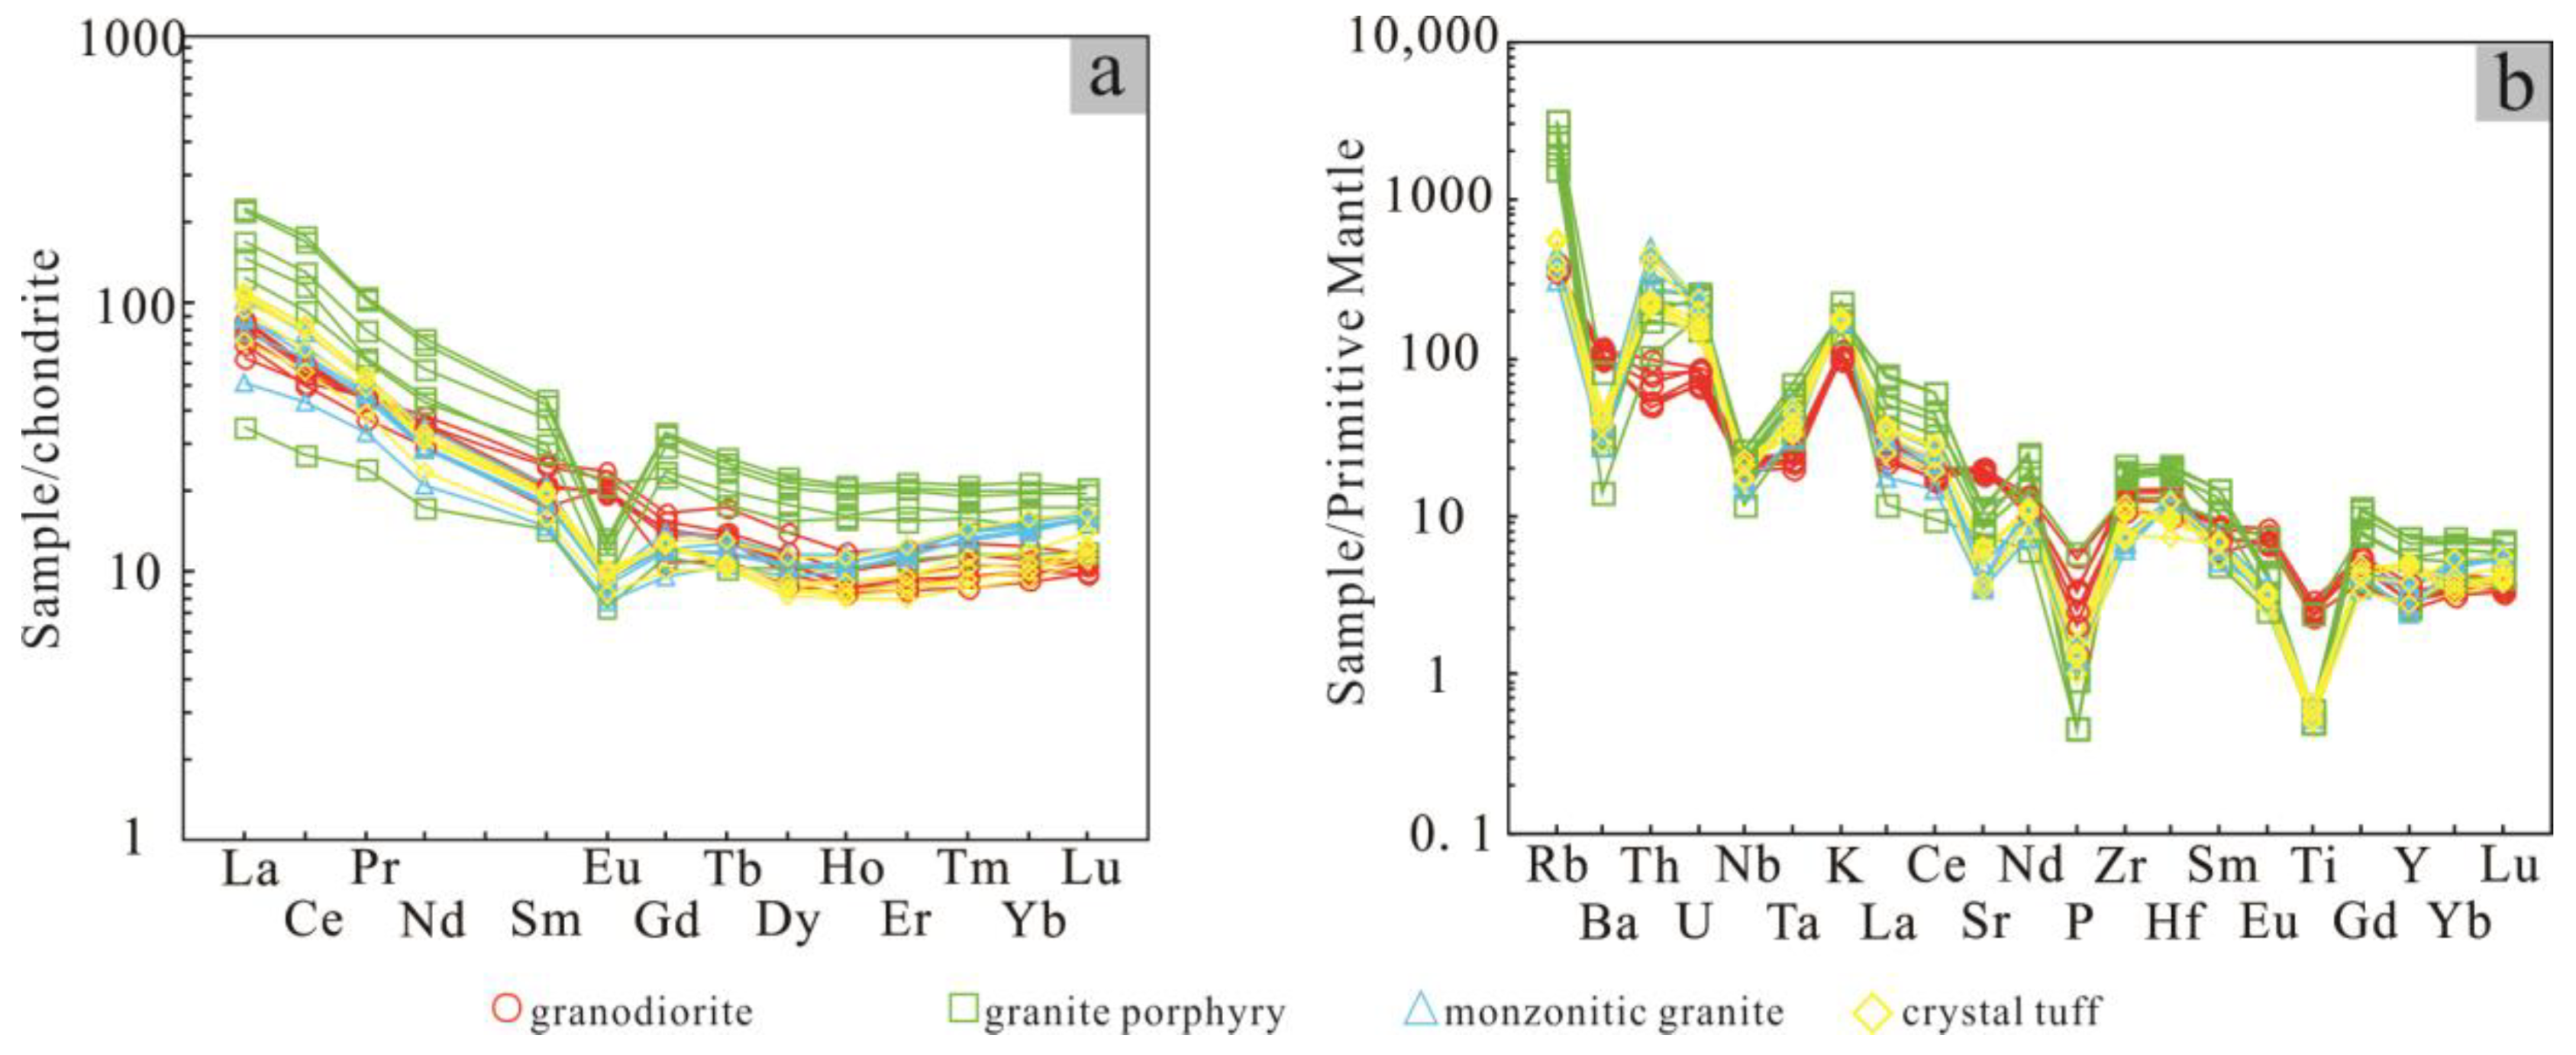
5.2. Whole-Rock Major and Trace-Element Compositions
5.2.1. Ore-Forming Granodiorite and Monzogranite
5.2.2. Non-Ore-Related Granite Porphyry and Crystal Tuff
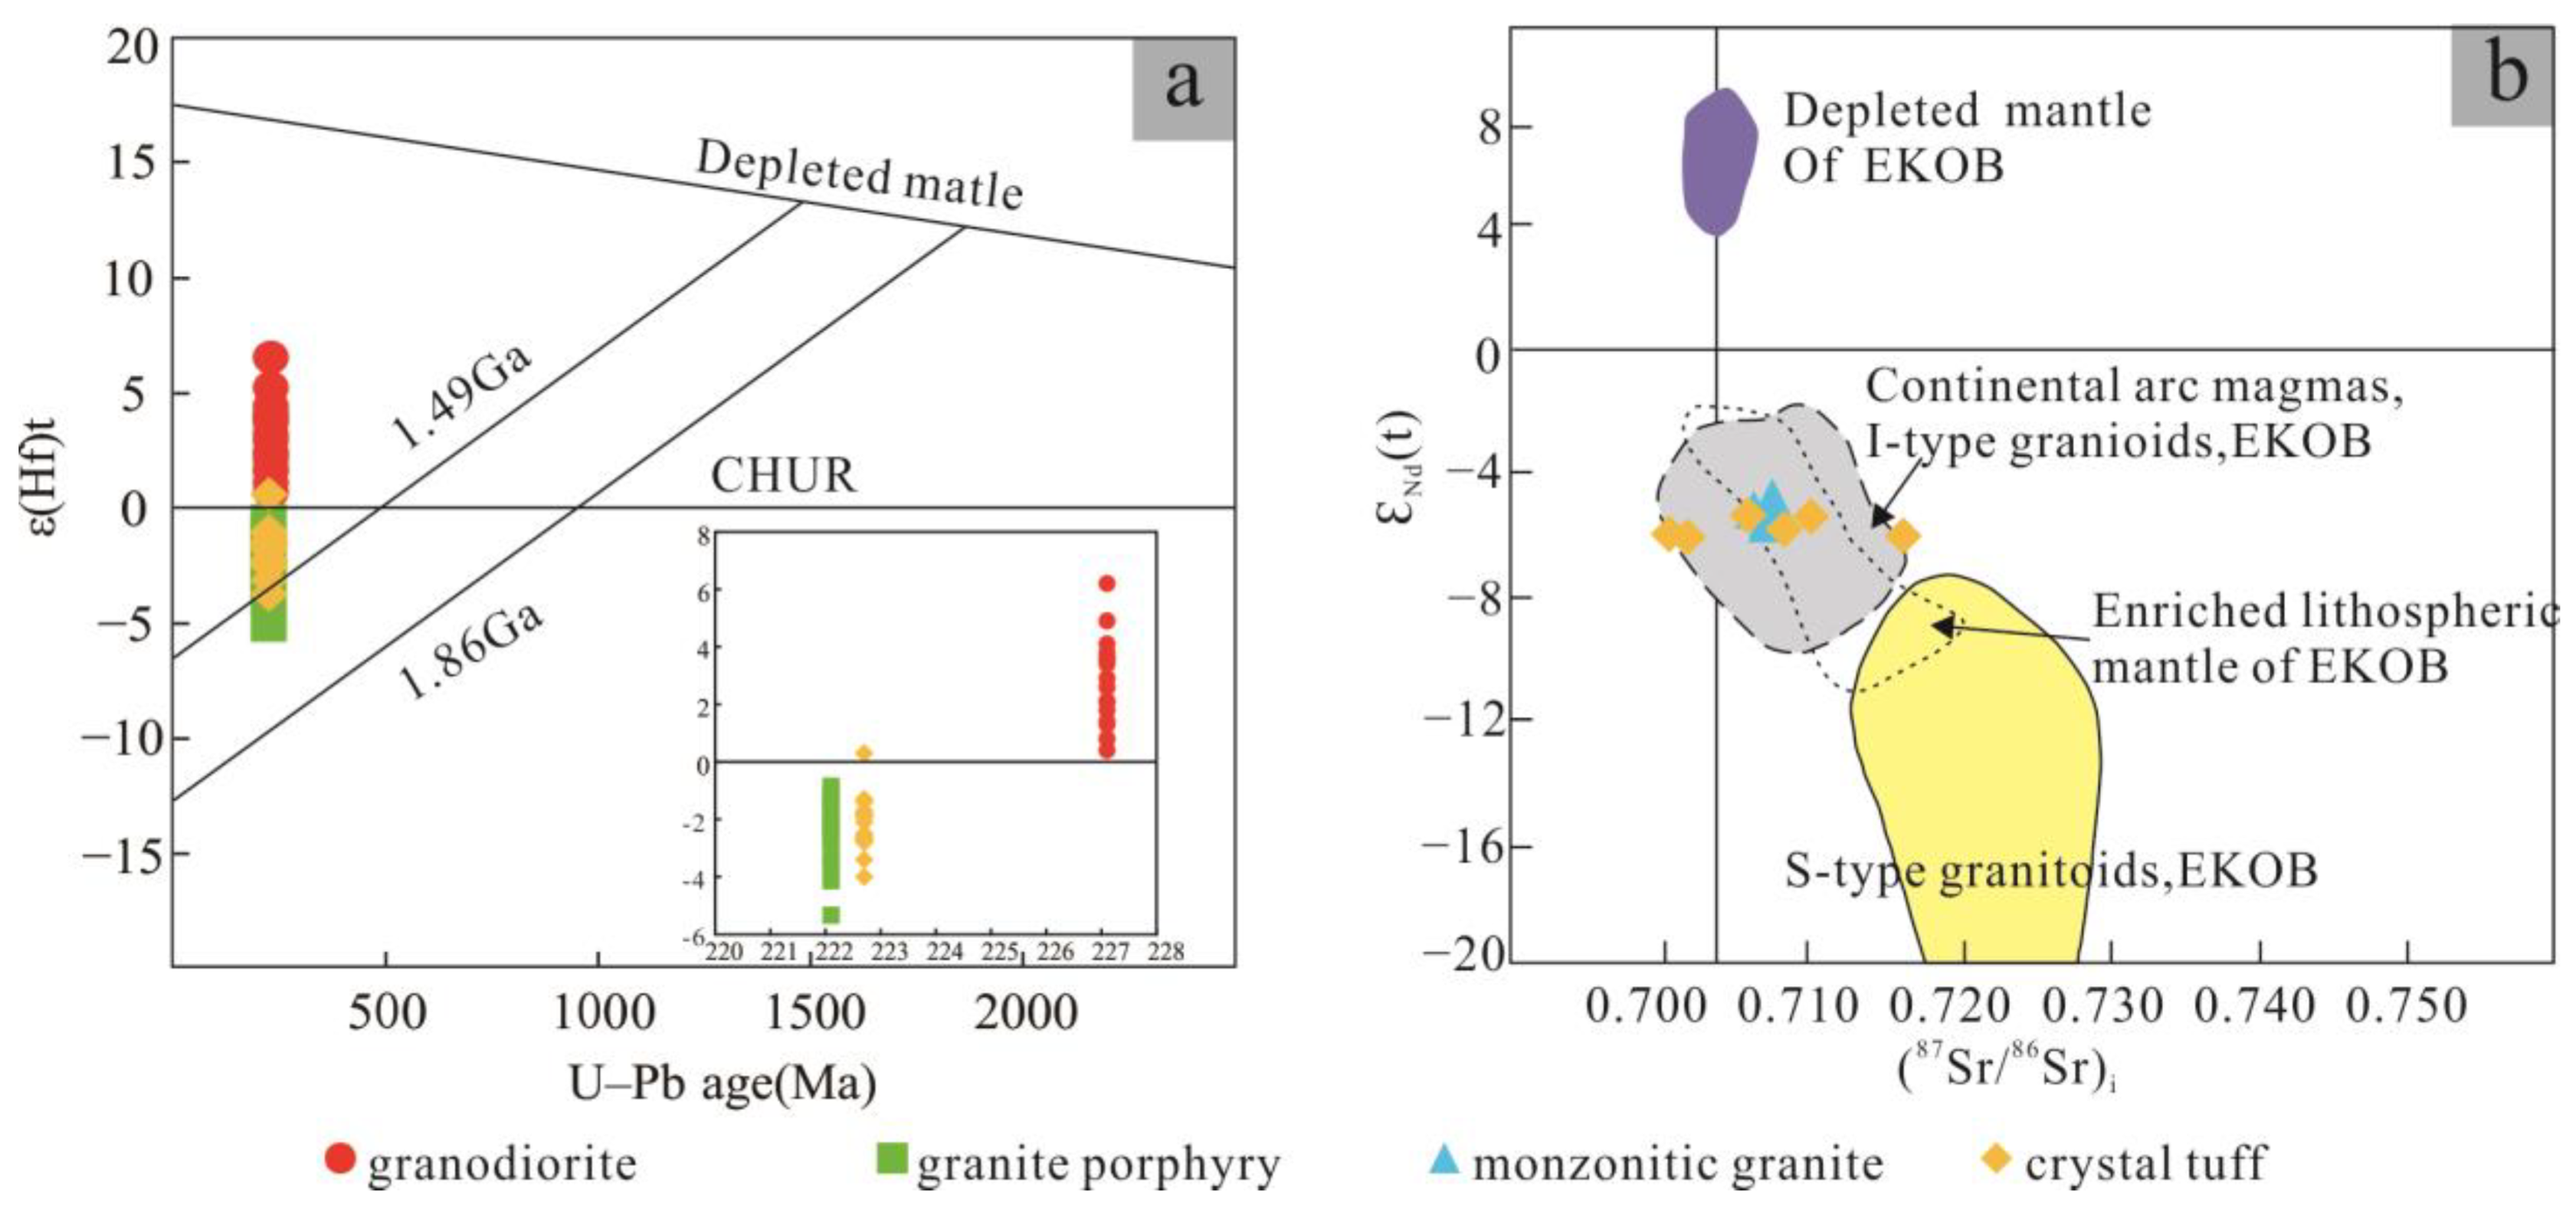
5.3. Sr-Nd Isotopic Compositions
5.4. Zircon Hf Isotopic Compositions
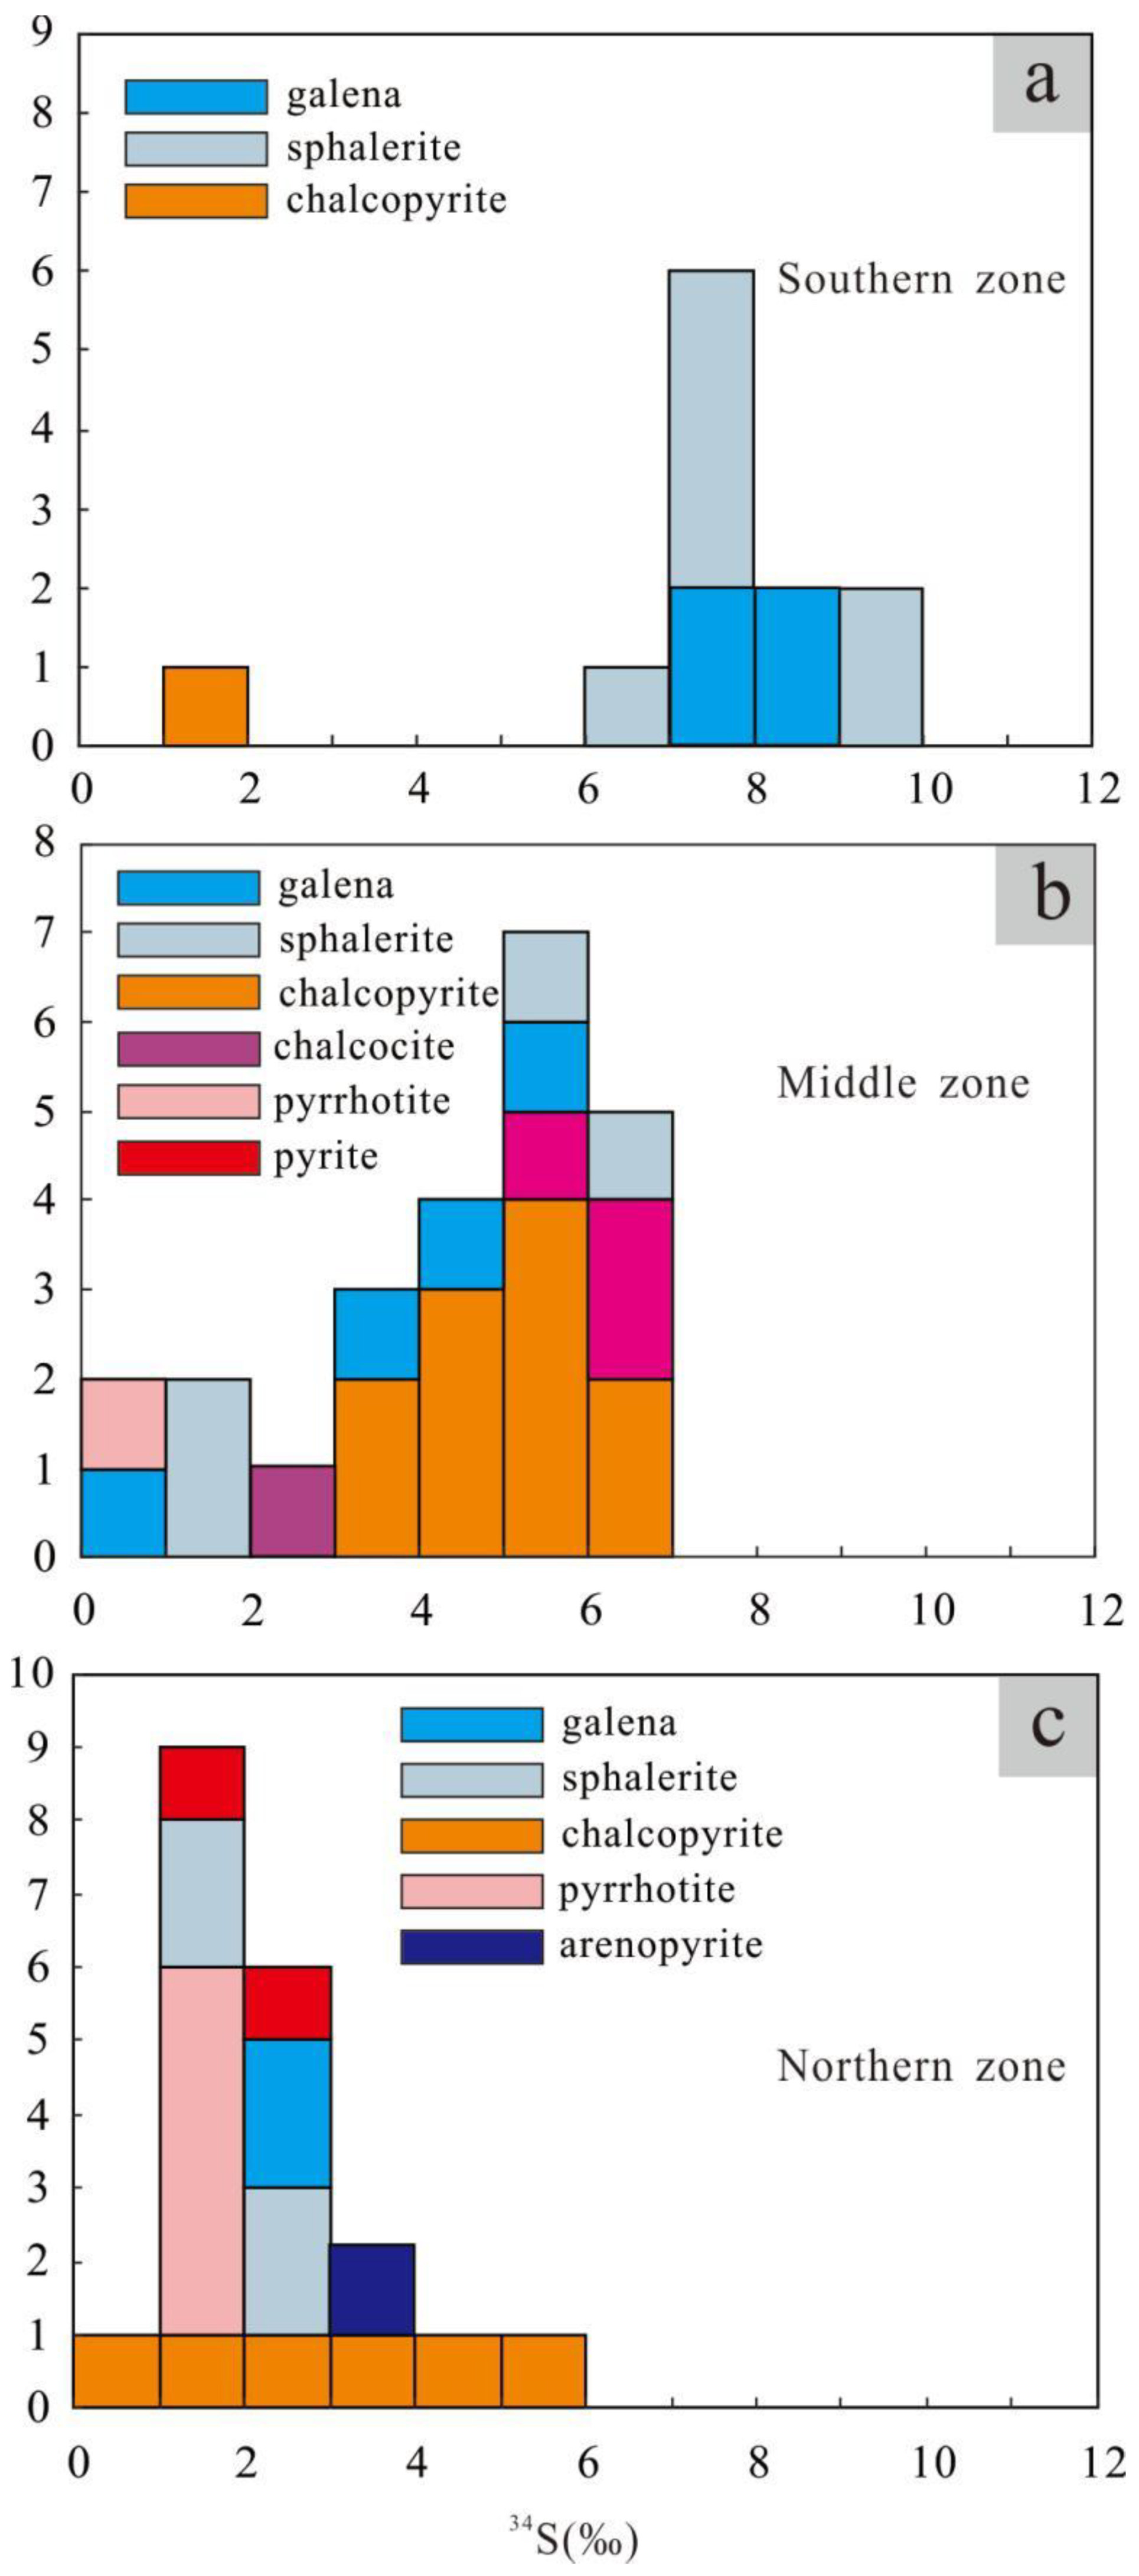
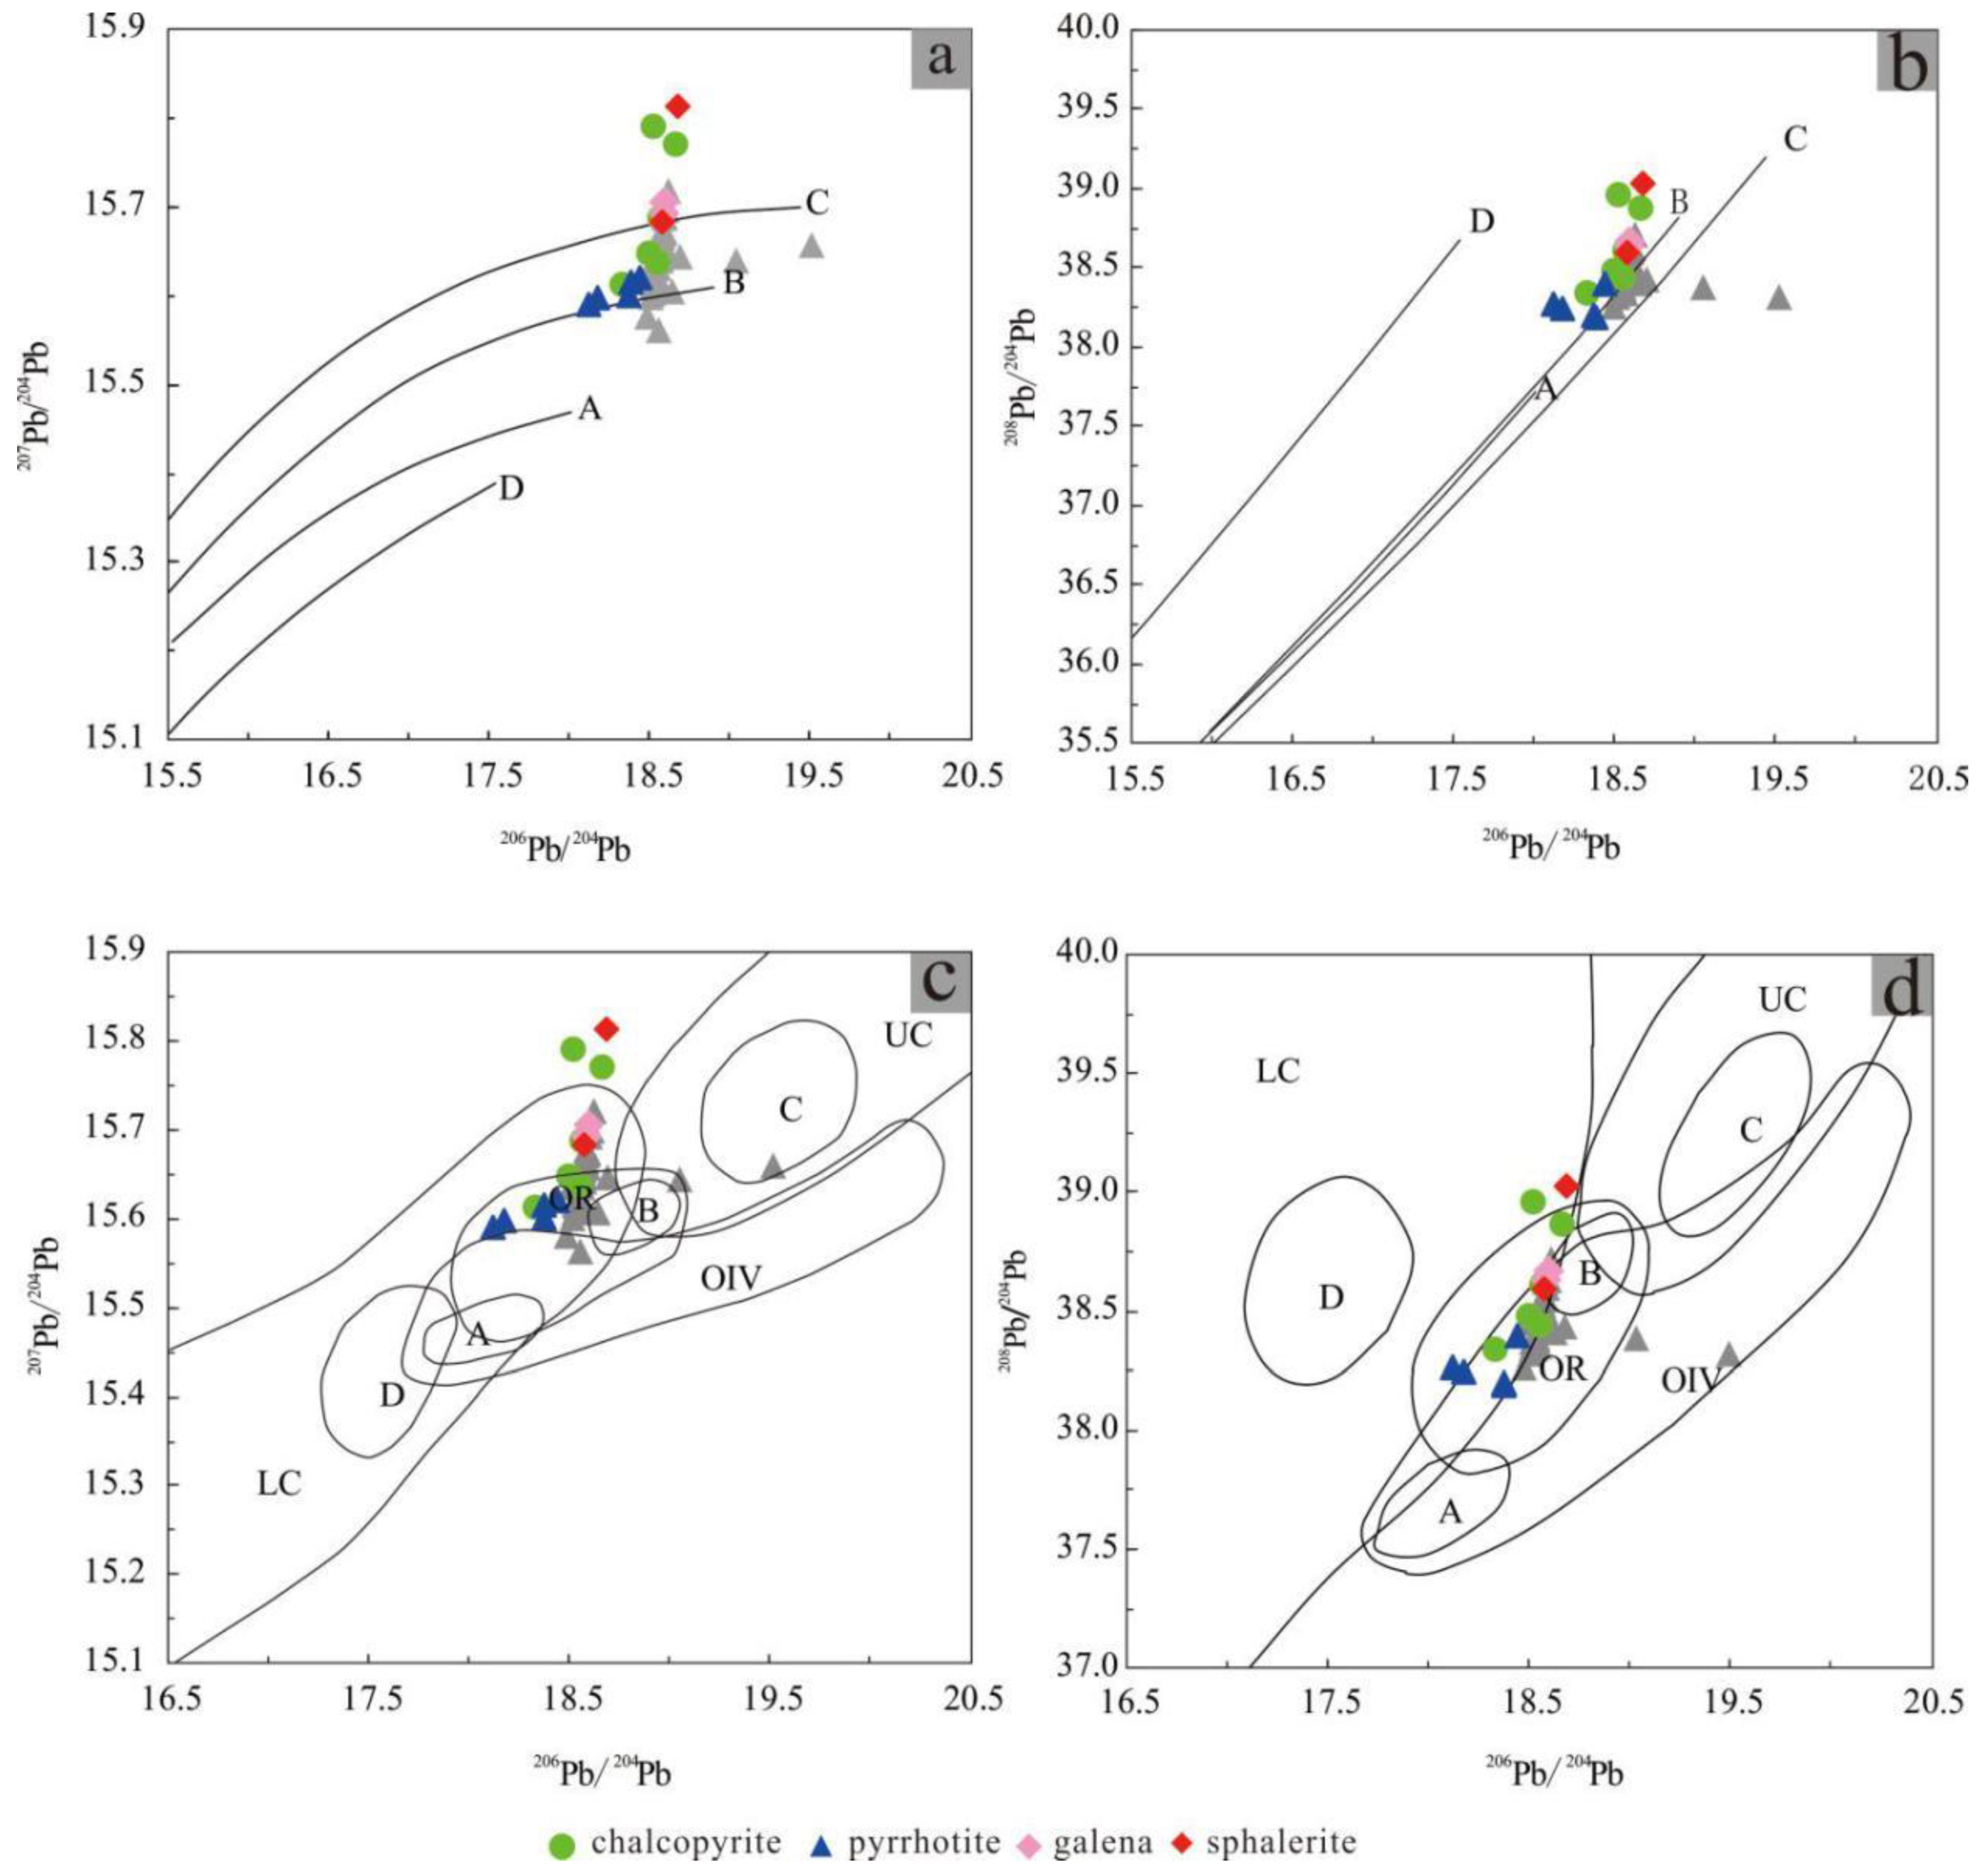
5.5. Ore-Mineral S-Pb Isotopic Compositions
6. Discussion
6.1. Age of Mineralization
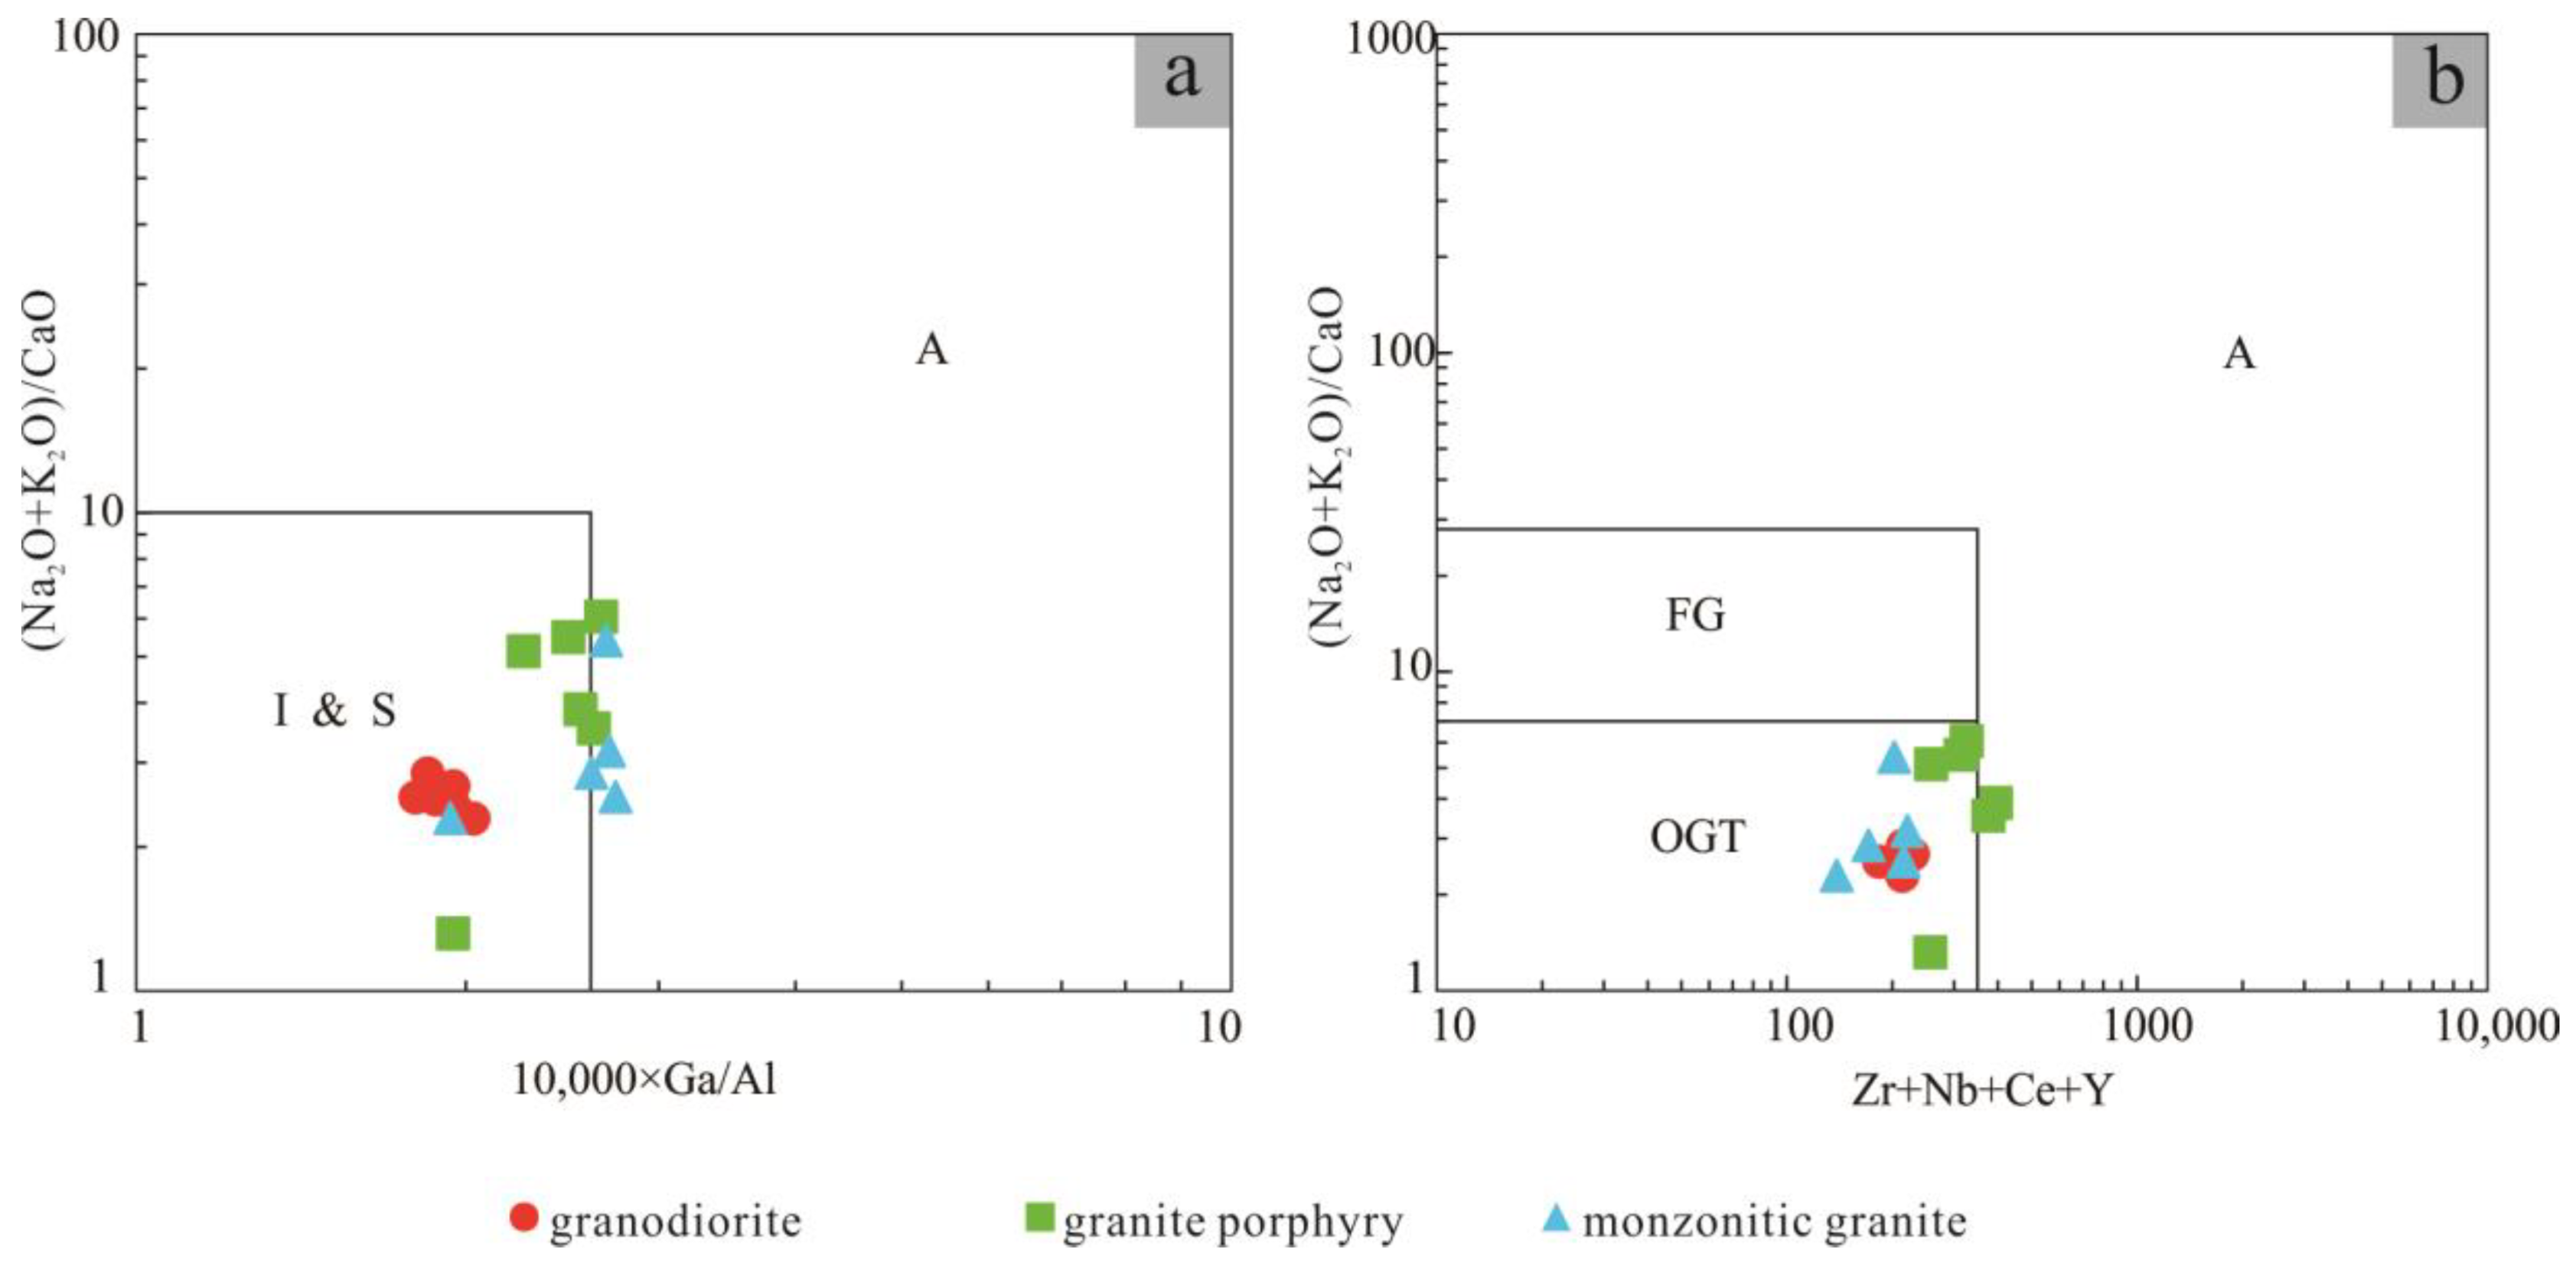
6.2. Genetic Types of the Igneous Rocks
6.3. Magma Sources and Petrogenesis
6.3.1. Ore-Forming Granodiorite and Monzogranite
6.3.2. Non-Ore-Related Granite Porphyry and Crystal Tuff
6.4. Sources of Ore-Forming Materials
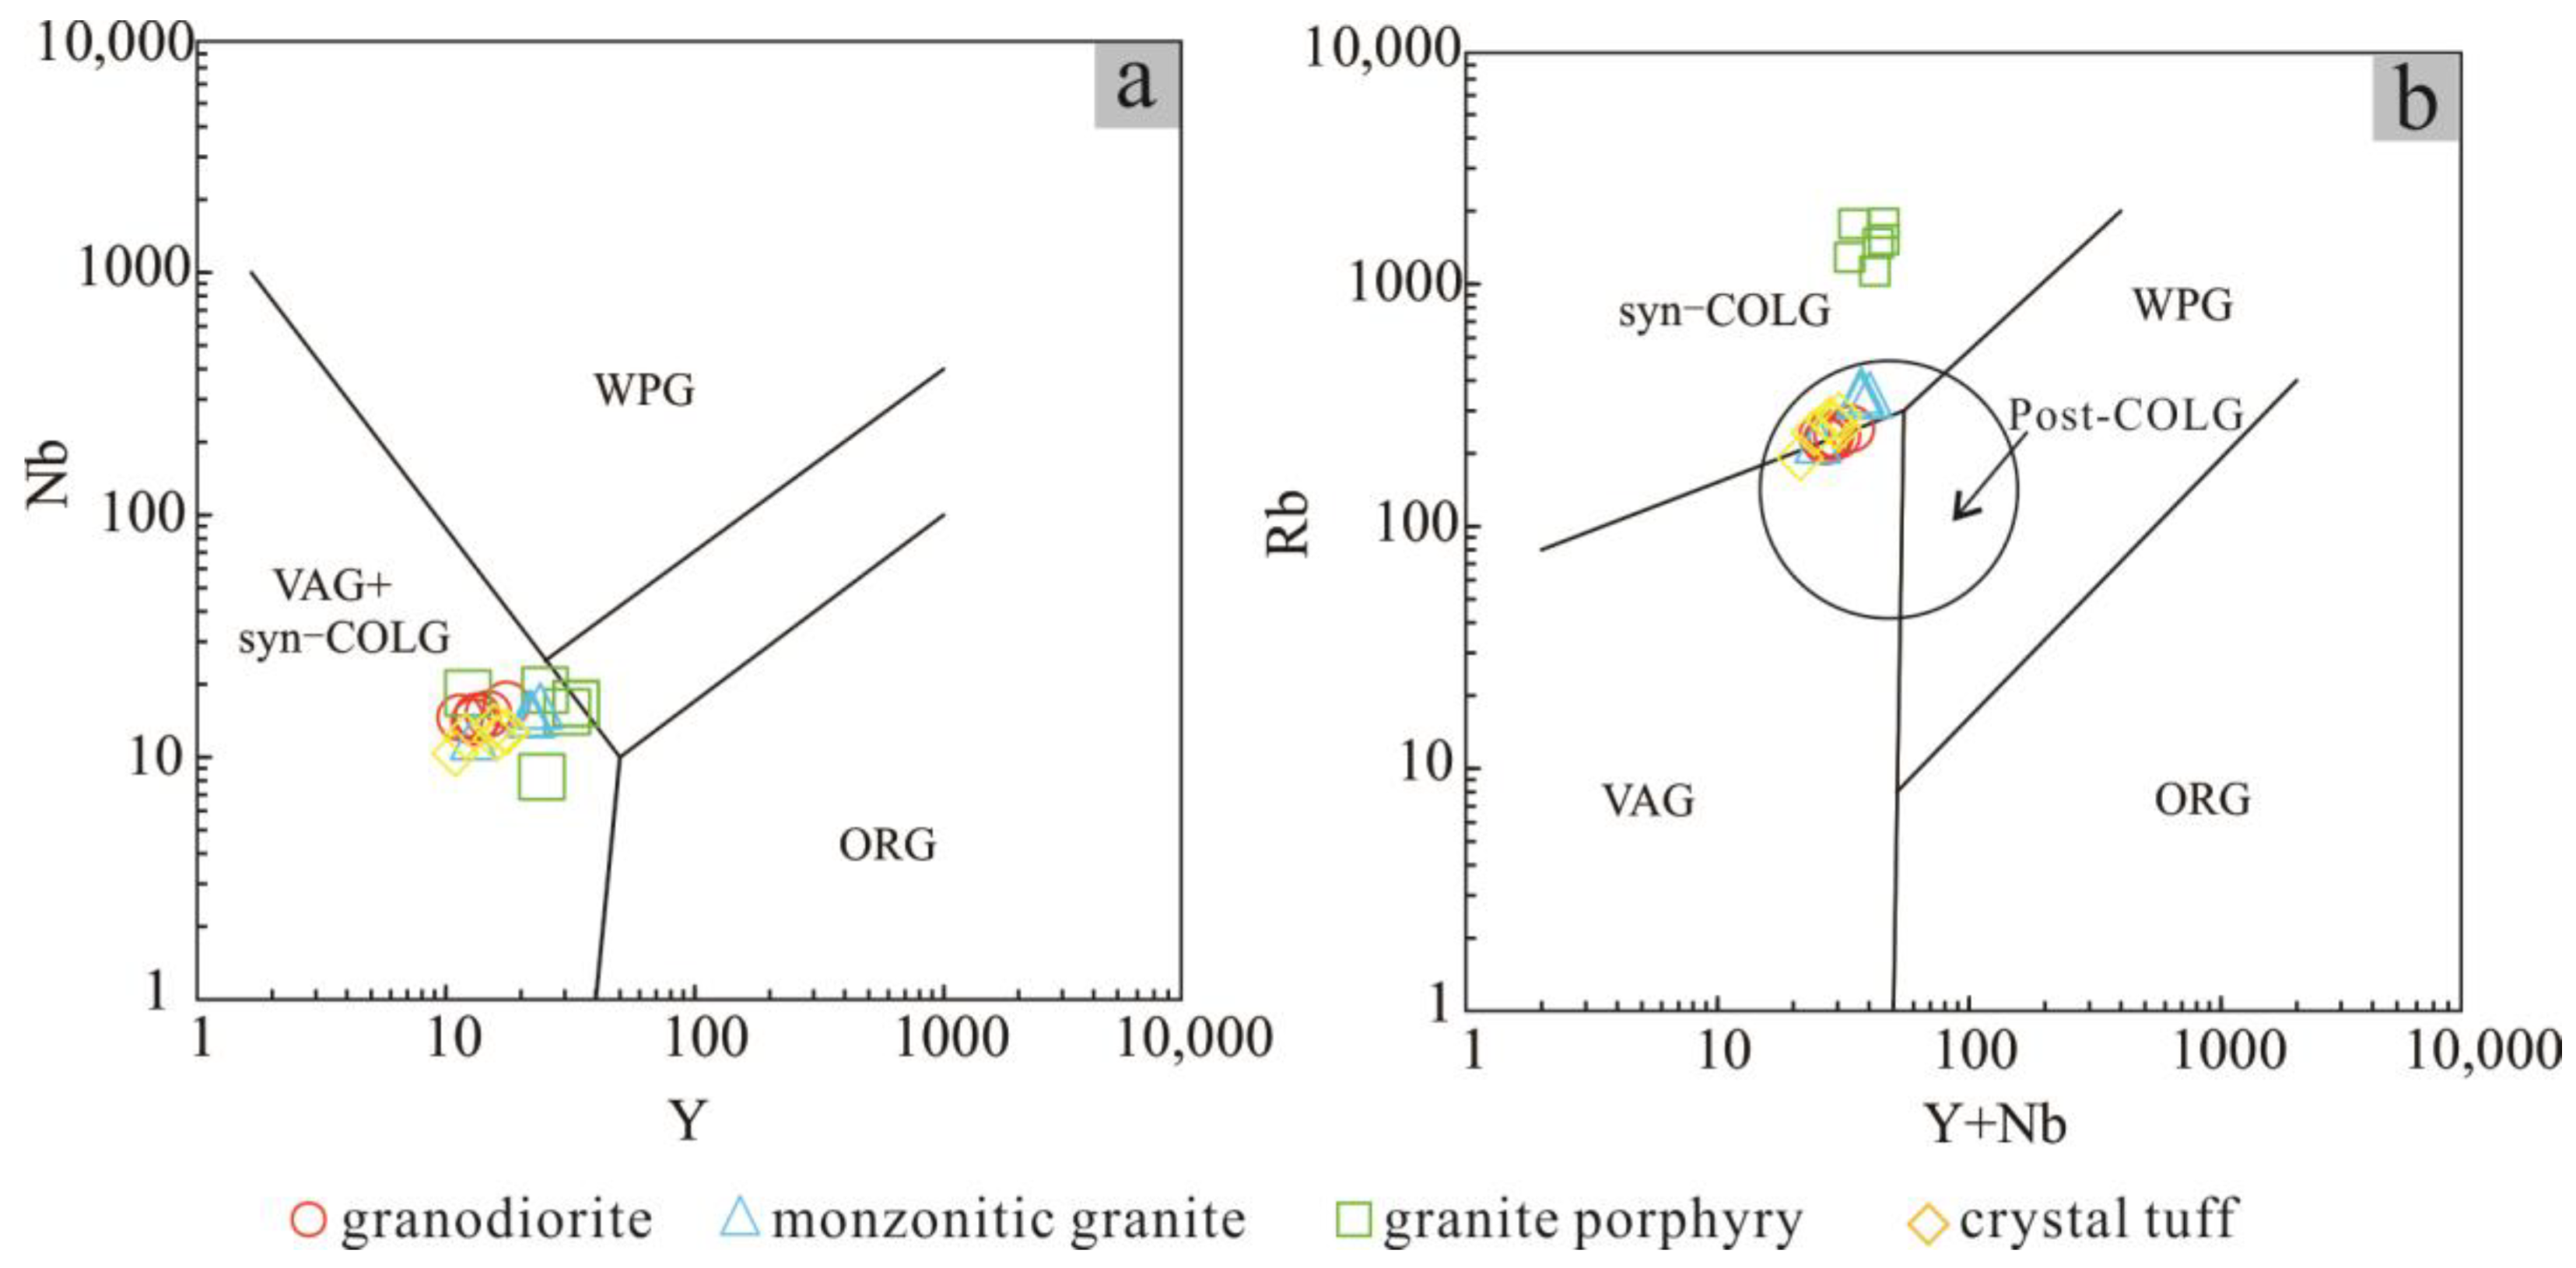
6.5. Geodynamic Background
7. Conclusions
- (1)
- Zircon LA–ICP–MS U-Pb and molybdenite Re-Os dating reveals that the emplacement of granitoids and mineralization of the Hutouya deposit occurred at ca. 227 Ma;
- (2)
- The ore-forming granitoids were generated by the mixing of crust-derived (either juvenile or ancient mature lower crust) and mantle-derived magma. The non-ore-related granite porphyry was generated by the partial melting of a single ancient mature lower crust. The granitic magmas underwent extensive fractional crystallization during the process of rising and emplacement;
- (3)
- The crystal tuff was derived from a mixed magma source of lower crust material and mantle-derived components, and the Elashan Formation probably has great prospecting potential in the western EKOB;
- (4)
- Sulfur in the northern and middle zone of the Hutouya deposit was derived from deep magmatic sulfur, while the S of the southern zone of Hutouya deposit was derived from both deep magmatic sulfur and strata sulfur. All the ore mineral samples show that the Pb was consistently derived from a mixed source of upper crust and mantle in the Hutouya deposit;
- (5)
- The new data for granitoids and crystal tuff in the the Hutouya area suggest that they were formed at 227–222 Ma in a post-collision extensional geodynamic setting, with the Paleo-Tethys Bayankala Ocean having closed before the Late Triassic.
Supplementary Materials
Author Contributions
Funding
Acknowledgments
Conflicts of Interest
Appendix A
Appendix A.1. Zircon U-Pb Dating
Appendix A.2. Molybdenite Re-Os Dating
Appendix A.3. Whole-Rock Major and Trace-Element Analyses
Appendix A.4. In Situ Zircon Hf Isotopic Analyses
Appendix A.5. Whole-Rock Sr-Nd Isotopic Analyses
Appendix A.6. S-Pb Isotopic Analyses
References
- Xia, R.; Wang, C.; Qing, M.; Deng, J.; Carranza, E.J.M.; Li, W.; Guo, X.; Ge, L.; Yu, W. Molybdenite Re-Os, zircon U-Pb dating and Hf isotopic analysis of the Shuangqing Fe-Pb-Zn-Cu skarn deposit, East Kunlun Mountains, Qinghai Province, China. Ore Geol. Rev. 2015, 66, 114–131. [Google Scholar] [CrossRef]
- Gao, Y.B.; Li, W.Y.; Ma, X.G.; Zhang, Z.W.; Tang, Q.Y. Genesis, geochronology and Hf isotopic compositions of the magmatic rocks in Galinge iron deposit, eastern Kunlun. J. Lanzhou Univ. Nat. Sci. 2012, 48, 36–47, (In Chinese with English abstract). [Google Scholar] [CrossRef]
- Tian, C.S.; Feng, C.Y.; Li, J.H.; Cao, D.Z. 40Ar-39Ar geochronology of Tawenchahan Fe polymetallic deposit in Qimantag Mountain of Qinghai province and its geological implications. Miner. Depos. 2013, 32, 169–176, (In Chinese with English abstract). [Google Scholar]
- Gao, Y.B.; Li, W.Y.; Qian, B.; Li, K.; Li, D.S.; He, S.Y.; Zhang, Z.W.; Zhang, J.W. Geochronology, geochemistry and Hf isotopic compositions of the granitic rocks related with iron mineralization in Yemaquan deposit, East Kunlun, NW China. Acta Petrol. Sin. 2014, 30, 1647–1665, (In Chinese with English abstract). [Google Scholar]
- Yin, S.; Ma, C.; Xu, J. Geochronology, geochemical and Sr-Nd-Hf-Pb isotopic compositions of the granitoids in the Yemaquan orefield, East Kunlun orogenic belt, northern Qinghai-Tibet Plateau: Implications for magmatic fractional crystallization and sub-solidus hydrothermal alteration. Lithos 2017, 294, 339–355. [Google Scholar] [CrossRef] [Green Version]
- Feng, C.Y.; Wang, X.P.; Shu, X.F.; Zhang, A.K.; Xiao, Y.; Liu, J.J.; Ma, S.C.; Li, G.C.; Li, D.X. Isotopic chronology of the Hutouya skarn lead-zinc polymetallic ore district in Qimantage area of Qinghai province and its geological significance. J. Jilin Univ. Earth Sci. Ed. 2011, 41, 1806–1817, (In Chinese with English abstract). [Google Scholar]
- He, S.Y.; Li, D.S.; Li, L.L.; Qi, L.Y.; He, S.F. Re-Os age of molybdenite from the Yazigou copper (molybdenum) mineralized area in eastern Kunlun of Qinghai Province, and its geological significance. Geotecton. Metallog. 2009, 33, 236–242, (In Chinese with English abstract). [Google Scholar] [CrossRef]
- Li, S.J.; Sun, F.Y.; Feng, C.Y.; Liu, Z.H.; Zhao, J.W.; Li, Y.C.; Wang, S. Geochronological study on Yazigou polymetallic deposit in eastern Kunlun, Qinhai Province. Acta Geol. Sin. 2008, 82, 949–955, (In Chinese with English abstract). [Google Scholar] [CrossRef]
- Dong, Y.P.; He, D.F.; Sun, S.S.; Liu, X.M.; Zhou, X.; Zhang, F.F.; Yang, Z.; Cheng, B.; Zhao, G.C.; Li, J.H. Subduction and accretionary tectonics of the East Kunlun orogen, western segment of the Central China Orogenic System. Earth Sci. Rev. 2018, 186, 231–261. [Google Scholar] [CrossRef]
- Yao, L.; Lü, Z.; Zhao, C.; Pang, Z.; Yu, X.; Yang, T.; Li, Y.; Liu, P.; Zhang, M. Zircon U-Pb geochronological, trace element, and Hf isotopic constraints on the genesis of the Fe and Cu skarn deposits in the Qiman Tagh area, Qinghai Province, Eastern Kunlun Orogen, China. Ore Geol. Rev. 2017, 91, 387–403. [Google Scholar] [CrossRef]
- Xi, R.G.; Xiao, P.X.; Wu, Y.Z.; Dong, Z.C.; Guo, L.; Gao, X.F. The geological significances, composition and age of the monzonitic granite in Kendekeke iron mine. Northwestern Geol. 2010, 43, 195–202, (In Chinese with English abstract). [Google Scholar]
- Xiao, Y.; Feng, C.Y.; Liu, J.N.; Yu, M.; Zhou, J.H.; Li, D.X.; Zhao, Y.M. LA-MC-ICP-MS zircon U-Pb dating and sulfur isotope characteristics of Kendekeke Fe-polymetallic deposit, Qinghai Province. Miner. Depos. 2013, 32, 177–186, (In Chinese with English abstract). [Google Scholar] [CrossRef]
- She, H.Q.; Zhang, D.Q.; Jiang, X.Y.; Guan, J.; Zhu, H.P.; Feng, C.Y.; Li, D.X. Geological characteristics and genesis of the Ulan Uzhur porphyry copper deposit in Qinghai. Geol. China 2007, 34, 306–314, (In Chinese with English abstract). [Google Scholar] [CrossRef]
- Feng, C.Y.; Li, D.S.; Qu, W.J.; Du, A.D.; Wang, S.; Su, S.S.; Jiang, J.H. Re-Os isotopic dating of molybdenite from the Suolajier skarn-type copper-molybdenum deposit of Qimantagh Mountain in Qinghai Province and its geological significance. Rock Miner. Anal. 2009, 28, 223–227, (In Chinese with English abstract). [Google Scholar] [CrossRef]
- Wang, S.; Feng, C.Y.; Li, S.J.; Jiang, J.H.; Li, D.S.; Su, S.S. Zircon SHRIMP U-Pb dating of granodiorite in the Kaerqueka polymetallic ore deposit, Qimantagh Mountain, Qinghai Province, and its geological implications. Geol. China 2009, 36, 74–84, (In Chinese with English abstract). [Google Scholar] [CrossRef]
- Song, Z.B.; Zhang, Y.L.; Chen, X.Y.; Jiang, L.; Li, D.S.; Shu, X.F.; Li, Y.Z.; Li, J.C.; Kong, H.L. Geochemical characteristics of Harizha granite diorite-porphyry in East Kunlun andtheir geological implications. Miner. Depos. 2013, 32, 157–168, (In Chinese with English abstract). [Google Scholar]
- Chen, X.Y.; Zhang, Y.L.; Song, Z.B.; Shu, X.F.; Li, Y.Z. Geological and geochemical characteristics of Qingshuihe Donggou porphyry Cu-Mo deposit in East Kunlun. J. Chin. Univ. Geol. 2013, 19, 357–358, (Suppl. in Chinese). [Google Scholar]
- Liu, J.N.; Feng, C.Y.; Qi, F.; Li, G.C.; Ma, S.C.; Xiao, Y. SIMS zircon U-Pb dating and fluid inclusion studies of Xiadeboli Cu-Mo ore district in Dulan County, Qinghai Province, China. Acta Petrol. Sin. 2012, 28, 679–690. [Google Scholar]
- Li, B.L.; Zhi, Y.B.; Zhang, L.; Ding, Q.F.; Xu, Q.L.; Zhang, Y.J.; Qian, Y.; Wang, G.; Peng, B.; Ao, C. U-Pb dating, geochemistry, and Sr-Nd isotopic composition of a granodiorite porphyry from the Jiadanggen Cu-(Mo) deposit in the Eastern Kunlun Metallogenic Belt, Qinghai Province, China. Ore Geol. Rev. 2014, 67, 1–10. [Google Scholar] [CrossRef]
- Wang, H.; Feng, C.Y.; Li, D.X.; Li, C.; Ding, T.Z.; Liao, F.Z. Geology, geochronology and geochemistry of the Saishitang Cu deposit, East Kunlun Mountains, NW China: Constraints on ore genesis and tectonic setting. Ore Geol. Rev. 2016, 72, 43–59. [Google Scholar] [CrossRef]
- Liu, J.P.; Lai, J.Q.; Gu, X.P.; Wang, X.J.; Mao, Y.; Song, W.B. Geochemistry and zircon LA-ICPMS U-Pb geochronology of intrusive body in Saishitang copper deposit, Qinghai Province, China. Chin. J. Nonferr. Met. 2012, 22, 622–632, (In Chinese with English abstract). [Google Scholar]
- Yan, Y.F.; Yang, X.S.; Chen, F.B.; Zhang, J.M.; Xu, H.Q.; Zhang, L. Molybdenum containing granites in Lalingzaohuo of the East Kunlun. China Sci. Technol. Inf. 2012, 37–39, (In Chinese with English abstract). [Google Scholar] [CrossRef]
- Feng, C.Y.; Li, D.S.; Wu, Z.S.; Li, H.J.; Zhang, Z.Y.; Zhang, A.K.; Shu, X.F.; Su, S.S. Major types, time-space distribution and metallogeneses of polymetallic deposits in the Qimantage metallogenic belt, eastern Kunlun area. Northwestern Geol. 2010, 43, 10–17, (In Chinese with English abstract). [Google Scholar] [CrossRef]
- Zhang, A.K.; Liu, G.L.; Feng, C.Y.; Mo, X.X.; Yang, L.C.; Liu, Y.L.; He, S.Y.; Ma, Y.S. Geochemical characteristics and ore-controlling factors of Hutouya polymetallic deposit, Qinghai Province. Miner. Depos. 2013, 32, 94–108, (In Chinese with English abstract). [Google Scholar] [CrossRef]
- Lei, Y.B.; Lai, J.Q.; Wang, X.J.; Su, S.S.; Wang, S.L.; Tao, S.L. Origin and evolution of ore-forming material of Hutouya polymetallic deposit. Chin. J. Nonferr. Met. 2014, 24, 2117–2128. [Google Scholar]
- Yao, L.; Lü, Z.; Yu, X.; Pang, Z.; Cai, Y.; Liu, P.; Wang, F. Petrogenesis, geochemistry and zircon U-Pb age of the granite from No. VI section of Hutouya deposit, Qimantag area, Qinghai province, and its geological significance. J. Jilin Univ. Earth Sci. Ed. 2015, 45, 743–758, (In Chinese with English abstract). [Google Scholar] [CrossRef]
- Zhang, X.F.; Li, Z.M.; Jia, Q.Z.; Song, Z.B.; Chen, X.Y.; Zhang, Y.L.; Li, D.S.; Shu, X.F. Geochronology, geochemistry and geological significance of granite porphyry in Hutouya polymetallic deposit, Qimantage area, Qinghai province. J. Jilin Univ. Earth Sci. Ed. 2016, 46, 749–765, (In Chinese with English abstract). [Google Scholar] [CrossRef]
- Ma, Z.Y.; Ma, C.X.; Ye, Z.F.; Hao, Y.; Ma, F.S.; Tong, M.H.; Zhou, L.Q. Rock and geochemical characteristics of late Triassic continental volcanic rock of Elashan group in the East Kunlun. J. Qinghai Univ. 2016, 34, 31–37. [Google Scholar]
- Chen, N.; Sun, M.; Wang, Q.; Zhao, G.; Chen, Q.; Shu, G. EMP chemical ages of monazites from Central Zone of the eastern Kunlun Orogen: Records of multi-tectonometamorphic events. Chin. Sci. Bull. 2007, 52, 2252–2263. [Google Scholar] [CrossRef]
- Ding, Q.F.; Jiang, S.Y.; Sun, F.Y. Zircon U-Pb geochronology, geochemical and Sr-Nd-Hf isotopic compositions of the Triassic granite and diorite dikes from the Wulonggou mining area in the Eastern Kunlun Orogen, NW China: Petrogenesis and tectonic implications. Lithos 2014, 205, 266–283. [Google Scholar] [CrossRef]
- Jiang, C.F.; Yang, J.S.; Feng, B.G.; Zhu, Z.Z.; Zhao, M.; Chai, Y.C.; Shi, X.D.; Wang, H.D.; Hu, J.Q. Opening-Closing Tectonics of Kunlun Mountains; Geological Publishing House: Beijing, China, 1992; pp. 1–217. [Google Scholar]
- Sun, F.Y.; Li, B.L.; Ding, Q.F.; Zhao, J.W.; Pan, T.; Yu, X.F.; Wang, L.; Chen, G.J.; Ding, Z.J. Research on the key problems of ore prospecting in the Eastern Kunlun metallogenic belt. Geological survey Institute of Jilin University, Changchun. Tectonophysics 2009, 43, 7–22. (In Chinese) [Google Scholar]
- Zhang, J.X.; Meng, F.C.; Wan, Y.S.; Yang, J.S.; Dong, G.A. Early Paleozoic tecto-thermal event of Jinshuikou Group on the sourthern margin of Qaidam: Zircon U-Pb SHRIMP age evidence. Geol. Bull. China 2003, 22, 397–404. [Google Scholar]
- Bian, Q.T.; Li, D.H.; Pospelov, I.; Yin, L.M.; Li, H.S.; Zhao, D.S.; Chang, C.F.; Luo, X.Q.; Gao, S.L.; Astrakhantsev, O. Age, geochemistry and tectonic setting of Buqingshan ophiolites, north Qinghai-Tibet Plateau, China. J. Asian Earth Sci. 2004, 23, 577–596. [Google Scholar] [CrossRef]
- Chen, X.; Gehrels, G.; Yin, A.; Zhou, Q.; Huang, P. Geochemical and Nd-Sr-Pb-O isotopic constrains on Permo-Triassic magmatism in eastern Qaidam Basin, northern Qinghai-Tibetan plateau: Implications for the evolution of the Paleo-Tethys. J. Asian Earth Sci. 2015, 114, 674–692. [Google Scholar] [CrossRef]
- Roger, F.; Arnaud, N.; Gilder, S.; Tapponnier, P.; Jolivet, M.; Brunel, M.; Malavieille, J.; Xu, Z.; Yang, J. Geochronological and geochemical constraints on Mesozoic suturing in east central Tibet. Tectonics 2003, 22, 1037. [Google Scholar] [CrossRef]
- Yang, J.S.; Robinson, P.; Jiang, C.F.; Xu, Z.Q. Ophiolites of the Kunlun Mountains, China and their tectonic implications. Tectonophysics 1996, 258, 215–231. [Google Scholar] [CrossRef]
- Liu, Z.Q.; Pei, X.Z.; Li, R.B.; Li, Z.C.; Zhang, X.F.; Liu, Z.G.; Chen, G.H.; Chen, Y.X.; Ding, S.P.; Guo, J.F. LA-ICP-MS zircon U-Pb geochronology of the two suites of ophiolites at the Buqingshan area of the A’nyemaqen orogenic belt in the southern margin of east Kunlun and its tectonic implication. Acta Geol. Sin. 2011, 85, 185–194, (In Chinese with English abstract). [Google Scholar]
- Yang, J.S.; Shi, R.D.; Wu, C.L.; Wang, X.B.; Robinson, P. Dur’ngoi ophiolite in East Kunlun, Northeast Tibetan plateau: Evidence for paleo-Tethyan suture in Northwest China. J. Earth Sci. 2009, 20, 303–331. [Google Scholar] [CrossRef]
- Yang, J.S.; Wang, X.B.; Shi, R.D.; Xu, Z.Q.; Wu, C.L. The Dur’ngoi ophiolite in East Kunlun, northern Qinghai-Tibet Plateau: A fragment of Paleo-Tethyan oceanic crust. Geol. China 2004, 31, 225–239, (In Chinese with English abstract). [Google Scholar]
- Xia, R.; Wang, C.; Qing, M.; Li, W.; Carranza, E.J.M.; Guo, X.; Ge, L.; Zeng, G. Zircon U-Pb dating, geochemistry and Sr-Nd-Pb-Hf-O isotopes for the Nan’getan granodiorites and mafic microgranular enclaves in the East Kunlun Orogen: Record of closure of the Paleo-Tethys. Lithos 2015, 234, 47–60. [Google Scholar] [CrossRef]
- Zhang, J.Y.; Ma, C.Q.; Xiong, F.H.; Liu, B. Petrogenesis and tectonic significance of the Late Permian-Middle Triassic calc-alkaline granites in the Balong region, eastern Kunlun Orogen, China. Geol. Mag. 2012, 149, 892–908. [Google Scholar] [CrossRef]
- Li, R.B.; Pei, X.Z.; Li, Z.C.; Liu, Z.Q.; Chen, G.C.; Chen, Y.X.; Wei, F.H.; Gao, J.M.; Liu, C.J.; Pei, L. Geological characteristics of late Palaeozoic-Mesozoic unconformities and their response to some significant tectonic events in eastern part of Eastern Kunlun. Earth Sci. Front. 2012, 19, 244–254, (In Chinese with English abstract). [Google Scholar] [CrossRef]
- Li, R.B.; Pei, X.Z.; Li, Z.C.; Pei, L.; Chen, Y.X.; Liu, C.J.; Chen, G.C.; Liu, T.J. The depositional sequence and prototype basin for Lower Triassic Hongshuichuan Formation in the eastern segment of East Kunlun Mountains. Geol. Bull. China 2015, 34, 2302–2314, (In Chinese with English abstract). [Google Scholar]
- Wang, G. Metallogenesis of Nickel Deposite in East Kunlun Orogenic Belt, Qinghai Province. Ph.D. Dissertation, Jilin University, Changchun, China, 2014. [Google Scholar]
- Feng, C.Y.; Wang, S.; Li, G.C.; Ma, S.C.; Li, D.S. Middle to Late Triassic granitoids in the Qimantage area, Qinghai Province, China: Chronology, geochemistry and metallogenic significances. Acta Petrol. Sin. 2012, 28, 665–678, (In Chinese with English abstract). [Google Scholar]
- Corfu, F.; Hanchar, J.M.; Hoskin, P.W.O.; Kinny, P.D. Atlas of zircon textures. Rev. Mineral. Geochem. 2003, 53, 469–500. [Google Scholar] [CrossRef]
- Selby, D.; Creaser, R.A. Macroscale NTIMS and microscale LA-MC-ICP-MS Re-Os isotopic analysis of molybdenite: Testing spatial restrictions for reliable Re-Os age determinations, and implications for the decoupling of Re and Os within molybdenite. Geochim. Cosmochim. Acta 2004, 68, 3897–3908. [Google Scholar] [CrossRef]
- Stein, H.J.; Markey, R.J.; Morgan, J.W.; Du, A.; Sun, Y. Highly precise and accurate Re-Os ages for molybdenite from the East Qinling molybdenite belt, Shanxi Province, China. Econ. Geol. 1997, 92, 827–835. [Google Scholar] [CrossRef]
- Stein, H.J.; Markey, R.J.; Morgan, J.W.; Hannah, J.L.; Schersten, A. The remarkable Re-Os chronometer in molybdenite: How and why it works. Terra Nova 2001, 13, 479–486. [Google Scholar] [CrossRef]
- Peccerillo, A.; Taylor, S.R. Geochemistry of eocene calc-alkaline volcanic rocks from the Kastamonu area, Northern Turkey. Contrib. Mineral. Petrol. 1976, 63–81. [Google Scholar] [CrossRef]
- Maniar, P.D.; Piccoli, P.M. Tectonic discrimination of granitoids. Geol. Soc. Am. Bull. 1989, 101, 635–643. [Google Scholar] [CrossRef]
- Boynton, W.V. Chapter 3-cosmochemistry of the rare earth elements: Meteorite studies. Dev. Geochem. 1984, 2, 63–114. [Google Scholar]
- Sun, S.S.; McDonough, W.F. Chemical and isotopic systematics od oceanic basalts: Implications for mantle composition and processes. Geol. Soc. Lond. Spec. Publ. 1989, 42, 313–345. [Google Scholar] [CrossRef]
- Li, R.B.; Pei, X.Z.; Pei, L.; Pei, L.; Li, Z.C.; Chen, G.C.; Chen, Y.X.; Liu, C.J.; Wang, M. The Early Triassic Andean-type Halagatu granitoids pluton in the East Kunlun orogen, northern Tibet Plateau: Response to the northward subduction of the Paleo-Tethys Ocean. Gondwana Res. 2018, 62, 212–226, (In Chinese with English abstract). [Google Scholar] [CrossRef]
- Harris, N. Radiogenic isotopes and the interpretation of granitic rocks. Episodes 1996, 19, 103–107. [Google Scholar] [CrossRef]
- Selby, D.; Greaser, R.A. Re-Os geochronology and systematics in molybdenite from the Endako porphyry molybdenum deposit, British Columbia, Canada. Econ. Geol. 2001, 96, 197–204. [Google Scholar] [CrossRef]
- Pearce, J.A.; Harris, N.B.; Tindle, A.G. Trace element discrimination diagrams for the tectonic interpretation of granitic rocks. J. Petrol. 1984, 25, 956–983. [Google Scholar] [CrossRef] [Green Version]
- Chappell, B.W.; White, A.J.R. Two contrasting granite types: 25 years later. Aust. J. Earth Sci. 2001, 48, 489–499. [Google Scholar] [CrossRef]
- Whalen, J.B.; Currie, K.L.; Chappell, B.W. A-type granites: Geochemical characteristics, discrimination and petrogenesis. Contrib. Mineral. Petrol. 1987, 95, 407–419. [Google Scholar] [CrossRef]
- Chappel, B.W.; White, A.J.R. Two contrasting granite types. Pac. Geol. 1974, 8, 173–174. [Google Scholar]
- Chappell, B.W. Aluminium saturation in I- and S-type granites and the characterization of fractionated haplogranites. Lithos 1999, 46, 535–551. [Google Scholar] [CrossRef]
- Pichavant, M.; Montel, J.M.; Richard, L.R. Apatite solubility in peraluminous liquids: Experimental data and an extension of the Harrison-Watson model. Geochim. Cosmochim. Acta 1992, 56, 3855–3861. [Google Scholar] [CrossRef]
- Wu, F.Y.; Jahn, B.M.; Wilde, S.A.; Lo, C.H.; Yui, T.F.; Lin, Q.; Ge, W.C.; Sun, D.Y. Highly fractionated I-type granites in NE China (I): Geochronology and petrogenesis. Lithos 2003, 66, 241–273. [Google Scholar] [CrossRef]
- Ghani, A.A.; Searle, M.P.; Robb, L.; Chung, S.L. Transitional I S type characteristic in the Main Range Granite, Peninsular Malaysia. J. Asian Earth Sci. 2013, 76, 225–240. [Google Scholar] [CrossRef]
- Singh, J.; Johannes, W. Dehydration melting of tonalites. Part I. Beginning of melting. Contrib. Mineral. Petrol. 1996, 125, 16–25. [Google Scholar] [CrossRef]
- White, A.J.R.; Chappell, B.W. Ultrametamorphism and granitoid genesis. Tectonophysics 1977, 43, 7–22. [Google Scholar] [CrossRef]
- Karsli, O.; Dokuz, A.; Uysal, I.; Aydin, F.; Chen, B.; Kandemir, R.; Wijbrans, J. Relative contributions of crust and mantle to generation of Campanian high-K calc-alkaline I-type granitoids in a subduction setting, with special reference to the Harsit Pluton, Eastern Turkey. Contrib. Mineral. Petrol. 2010, 160, 467–487. [Google Scholar] [CrossRef] [Green Version]
- Barbarin, B. A review of the relationships between granitoid types, their origins and their geodynamic environments. Lithos 1999, 46, 605–626. [Google Scholar] [CrossRef]
- Nabelek, P.I.; Liu, M.; Sirbescu, M.L. Thermo-rheological, shear heating model for leucogranite generation, metamorphism, and deformation during the Proterozoic Trans-Hudson orogeny, Black Hills, South Dakota. Tectonophysics 2001, 342, 371–388. [Google Scholar] [CrossRef]
- Rapp, R.P.; Watson, E.B. Dehydration melting of metabasalt at 8-32 kbar: Implications for continental growth and crust-mantle recycling. J. Petrol. 1995, 36, 891–931. [Google Scholar] [CrossRef]
- Smithies, R.H.; Champion, D.C. The Archaean high-Mg diorite suite: Links to Tonalite-trondhjemite-granodiorite magmatism and implications for Early Archaean crustal growth. J. Petrol. 2000, 41, 1653–1671. [Google Scholar] [CrossRef] [Green Version]
- Rudnick, R.L.; Gao, S. Composition of the continental crust. In Treatise on Geochemistry; Heinrich, D.H., Karl, K.T., Eds.; Pergamon: Oxford, UK, 2003; pp. 1–64. [Google Scholar]
- Kemp, A.I.S.; Hawkesworth, C.J.; Foster, G.L.; Paterson, B.; Woodhead, J.D.; Hergt, J.M.; Gray, C.M.; Whitehouse, M.J. Magmatic and crustal differentiation history of granitic rocks from Hf-O isotopes in zircon. Science 2007, 315, 980–983. [Google Scholar] [CrossRef] [PubMed]
- Santosh, M.; Yang, Q.Y.; Shaji, E.; Tsunogae, T.; RamMohan, M.; Satyanarayanan, M. An exotic Mesoarchean microcontinent: The Coorg Block, southern India. Gondwana Res. 2015, 27, 165–195. [Google Scholar] [CrossRef]
- Wu, F.Y.; Li, X.H.; Zheng, Y.F.; Gao, S. Lu-Hf isotopic systematics and their applications in petrology. Acta Petrol. Sin. 2007, 23, 185–220, (In Chinese with English abstract). [Google Scholar] [CrossRef]
- Chappell, B.W.; White, A.J.R. I- and S-type granites in the Lachlan Fold Belt. Earth Environ. Sci. Trans. R. Soc. Edinb. 1992, 83, 1–26. [Google Scholar] [CrossRef]
- Xie, Y.C.; Lu, J.J.; Ma, D.S.; Zhang, R.Q.; Gao, J.F.; Yao, Y. Origin of granodiorite porphyry and mafic microgranular enclave in the Baoshan Pb-Zn polymetallic deposit, southern Hunan Province: Zircon U-Pb chronological, geochemical and Sr-Nd-Hf isotopic constraints. Acta Petrol. Sin. 2013, 29, 4186–4214, (In Chinese with English abstract). [Google Scholar]
- Ohmoto, H. Stable isotope geochemistry of ore deposits. Rev. Miner. Geochem. 1986, 16, 491–559. [Google Scholar]
- Rye, R.O.; Ohmoto, H. Sulfur and carbon isotopes and ore genesis: A review. Econ. Geol. 1974, 69, 826–842. [Google Scholar] [CrossRef]
- Ohmoto, H. Isotopes of sulfur and carbon. In Geochemistry of Hydrothermal Ore Deposits; Barnes, H.L., Ed.; Wiley: New York, NY, USA, 1979; pp. 509–567. [Google Scholar]
- Kelly, W.C.; Rye, R.O. Geologic, fluid inclusion, and stable isotope studies of the tin-tungsten deposits of Panasqueira, Portugal. Econ. Geol. 1979, 74, 1721–1822. [Google Scholar] [CrossRef]
- Ohmoto, H. Systematics of sulfur and carbon isotopes in hydrothermal ore deposits. Econ. Geol. 1972, 67, 551–578. [Google Scholar] [CrossRef]
- Chaussidon, M.; Albarède, F.; Sheppard, S.M.F. Sulphur isotope variations in the mantle from ion microprobe analyses of micro-sulphide inclusions. Earth Planet. Sci. Lett. 1989, 92, 144–156. [Google Scholar] [CrossRef]
- Chaussidon, M.; Lorand, J.P. Sulphur isotope composition of orogenic spinel lherzolite massifs from Ariege (North-Eastern Pyrenees, France): An ion microprobe study. Geochim. Cosmochim. Acta 1990, 54, 2835–2846. [Google Scholar] [CrossRef]
- Rollinson, H.R. Using Geochemical Data: Evaluation, Presentation, Interpretation; Longman Scientific and Technical Press: London, UK, 1993; pp. 306–308. [Google Scholar]
- Claypool, G.E.; Holser, W.T.; Kaplan, I.R.; Sakai, H.; Zak, I. The age curves of sulfur and oxygen isotopes in marine sulfate and their mutual interpretation. Chem. Geol. 1980, 28, 199–260. [Google Scholar] [CrossRef]
- Chiaraida, M.; Fontbote, L.; Paladines, A. Metal sources in mineral deposits and crustal rocks of Ecuador: A lead isotope synthesis. Econ. Geol. 2004, 99, 1085–1106. [Google Scholar] [CrossRef]
- Zartman, R.E.; Doe, B.R. Plumbotectonics: The model. Tectonophysics 1981, 175, 135–162. [Google Scholar] [CrossRef]
- Doe, B.R.; Zartman, R.E. Plumbotectonics: The phanerozoic. In Geochemistry of Hydrothermal Ore Deposits, 2nd ed.; Barnes, H.L., Ed.; John Wiley and Sons: New York, NY, USA, 1979; pp. 22–70. [Google Scholar]
- Li, L.; Zheng, Y.F.; Zhou, J.B. Dynamic model for pb isotope evolution in the continental crust of china. Acta Petrol. Sin. 2001, 17, 61–68, (In Chinese with English abstract). [Google Scholar] [CrossRef]
- He, P.; Guo, S.; Zhang, K.; Zhang, T.F.; Su, H.; Ma, Y.X. The sources of ore-forming materials and genesis of the Changtuxili Ag-Pb-Zn-Mn polymetallic deposit in the middle-southern segment of Da Hinggan Mountains: Contrains from S-Pb-C-O isotope geochemistry. Acta Geol. Sin. 2019, 93, 2037–2054, (In Chinese with English abstract). [Google Scholar]
- Li, Z.D.; Xue, C.J.; Dong, X.F.; Liu, Z.R.; Zhong, T.Z.; Qi, S.J. Ore geology, S- and Pb- isotopic compositions of the Wulagen Zn-Pb deposit, Wuqia country, Xinjiang. Earth Sci. Front. 2013, 20, 40–54, (In Chinese with English abstract). [Google Scholar]
- Zhu, B.Q.; Li, X.H.; Dai, T.M.; Chen, Y.W.; Fan, S.K.; Gui, X.T.; Wang, H.F. The Theory and Application of Isotopic System in Earth Science, 1st ed.; Science Press: Beijing, China, 1998; pp. 1–330, (In Chinese with English abstract). [Google Scholar]
- Li, J.X.; Qin, K.Z.; Li, G.M.; Xiao, B.; Chen, L.; Zhao, J.X. Post-collisional ore-bearing adakitic porphyries from Gangdese porphyry copper belt, southern Tibet: Melting of thickened juvenile arc lower crust. Lithos 2011, 126, 265–277. [Google Scholar] [CrossRef]
- Li, Z.Z.; Qin, K.Z.; Li, G.M.; Ishihara, S.; Jin, L.Y.; Song, G.X.; Meng, Z.J. Formation of the giant Chalukou porphyry Mo deposit in northern Great Xing’an Range, NE China: Partial melting of the juvenile lower crust in intra-plate extensional environment. Lithos 2014, 202, 138–156. [Google Scholar] [CrossRef]
- Wu, Y.S.; Chen, Y.J.; Zhou, K.F. Mo deposits in Northwest China: Geology, geochemistry, geochronology and tectonic setting. Ore Geol. Rev. 2017, 81, 641–671. [Google Scholar] [CrossRef]
- Zhou, L.L.; Zeng, Q.D.; Liu, J.M.; Zhang, Z.L.; Duan, X.X. What triggers fertile porphyritic Mo magmas in subduction setting: A case study from the giant Daheishan Mo deposit, NE China. Lithos 2018, 31, 212–231. [Google Scholar] [CrossRef]
- Wang, G.C.; Wei, Q.R.; Jia, C.X.; Zhang, K.X.; Li, D.W.; Zhu, Y.H.; Xiang, S.Y. Some ideas of Precambrian geology in the East Kunlun, China. Geol. Bull. China 2007, 26, 929–937, (In Chinese with English abstract). [Google Scholar]
- Xu, Z.Q.; Yang, J.S.; Li, H.Q.; Wang, R.R.; Cai, Z.H. Indosinian collision-orogenicsystem of Chinese continent and its orogenic mechanism. Acta Petrol. Sin. 2012, 28, 1697–1709, (In Chinese with English abstract). [Google Scholar] [CrossRef]
- Zhang, M.Y.; Feng, C.Y.; Wang, H.; LI, D.X.; Qu, H.Y.; Liu, J.N.; Zhou, J.H. Petrogenesis and tectonic implications of the Late Triassic syenogranite in Qimantag area, East Kunlun Moutains. Acta Petrol. Sin. Mineral. 2018, 37, 197–210, (In Chinese with English abstract). [Google Scholar]
- Chen, G.H.; Pei, X.Z.; Li, R.B.; Li, Z.C.; Liu, C.J. Late Triassic magma mixing in the East Kunlun orogenic belt: A case study of Helegang Xilikete granodiorites. Geol. China 2013, 40, 1044–1065, (In Chinese with English abstract). [Google Scholar]
- Hu, Y.; Niu, Y.L.; Li, J.Y.; Ye, L.; Kong, J.J.; Chen, S.; Zhang, Y.; Zhang, G.R. Petrogenesis and tectonic significance of the late Triassic mafic dikes and felsic volcanic rocks in the East Kunlun Orogenic Belt, Northern Tibet Plateau. Lithos 2016, 254, 205–222. [Google Scholar] [CrossRef] [Green Version]
- Xia, R.; Wang, C.; Deng, J.; Carranza, E.J.M.; Li, W.; Qing, M. Crustal t hickening prior to 220Ma in the East Kunlun Orogenic Belt: Insights from the Late Triassic granitoids in the Xiao-Nuomuhong pluton. J. Asian Earth Sci. 2014, 93, 193–210. [Google Scholar] [CrossRef]
- Xiong, F.H.; Ma, C.Q.; Zhang, J.Y.; Liu, B.; Jiang, H.A. Reworking of old continental lithosphere: An important crustal evolution mechanism in orogenic belts, as evidenced by Triassic I-type granitoids in the East Kunlun orogen, Northern Tibetan Plateau. J. Geol. Soc. 2014, 171, 847–863. [Google Scholar] [CrossRef]
- Ma, C.Q.; Xiong, F.H.; Yin, S.; Wang, L.X.; Gao, K. Intensity and cyclicity of orogenic magmatism: An example from a Paleo-Tethyan granitoid batholith, Eastern Kunlun, northern Qinghai-Tibetan Plateau. Acta Petrol. Sin. 2015, 31, 3555–3568. [Google Scholar]
- Ao, C.; Sun, F.Y.; Li, B.L.; Wang, G.; Li, L.; Li, S.J.; Zhao, J.W. U-Pb dating, geochemistry and tectonic implications of Xiaojianshan gabbro in Qimantage Mountain, Eastern Kunlun orogenic belt. Geotecton. Metallog. 2015, 39, 1176–1184, (In Chinese with English abstract). [Google Scholar] [CrossRef]
- Luo, Z.H.; Ke, S.; Cao, Y.Q.; Deng, J.F.; Chen, H.W. Late Indosinian mantle-derived magmatism in the East Kunlun. Geol. Bull. China 2002, 292–297, (In Chinese with English abstract). [Google Scholar] [CrossRef]
- Zhao, C.S. Gold, Silver Metallogeny in Eastern Kunlun Orogenic Belt, Qinghai Province. Ph.D. Dissertation, Jilin University, Changchun, China, 2004. [Google Scholar]
- Yuan, H.L.; Gao, S.; Liu, X.M.; Li, H.; Günther, D.; Wu, F.Y. Accurate U-Pb age and trace element determinations of zircon by laser ablation-inductively coupled plasma-mass spectrometry. Geostand. Geoanal. Res. 2004, 28, 353–370. [Google Scholar] [CrossRef]
- Ludwig, K. User’s Manual for Isoplot 3.00: A Geochronology Toolkit for Microsoft Excel; Berkeley Geochronological Center Special Publication: Berkeley, CA, USA, 2003; Volume 70. [Google Scholar]
- Andersen, T. Correction of common lead in U-Pb analyses that do not report 204Pb. Chem. Geol. 2002, 192, 59–79. [Google Scholar] [CrossRef]
- Xie, L.W.; Zhang, Y.B.; Zhang, H.H.; Sun, J.F.; Wu, F.Y. In situ simultaneous determination of trace elements, U-Pb and Lu-Hf isotopes in zircon and baddeleyite. Chin. Sci. Bull. 2008, 53, 1565–1573. [Google Scholar] [CrossRef] [Green Version]
- Hu, Z.C.; Gao, S.; Liu, Y.S.; Hu, S.H.; Chen, H.H.; Yuan, H.L. Signal enhancement in laser ablation ICP-MS by addition of nitrogen in the central channel gas. J. Anal. At. Spectrom. 2008, 23, 1093–1101. [Google Scholar] [CrossRef]
- Liu, Y.S.; Gao, S.; Hu, Z.C.; Gao, C.G.; Zong, K.Q.; Wang, D.B. Continental and oceanic crust recycling-induced melt-peridotite interactions in the Trans-North China Orogen: U-Pb dating, Hf isotopes and trace elements in zircons from mantle xenoliths. J. Petrol. 2010, 51, 537–571. [Google Scholar] [CrossRef]
- Liu, Y.S.; Hu, Z.C.; Gao, S.; Günther, D.; Xu, J.; Gao, C.G.; Chen, H.H. In situ analysis of major and trace elements of anhydrous minerals by LA-ICP-MS without applying an internal standard. Chem. Geol. 2008, 257, 34–43. [Google Scholar] [CrossRef]
- Du, A.D.; He, H.L.; Yin, W.N.; Zhou, X.Q.; Sun, Y.L.; Sun, D.Z.; Chen, S.Z.; Qu, W.J. The study on the analytical methods of Re-Os age for molybdenites. Acta Geol. Sin. 1994, 68, 339–347. [Google Scholar]
- Du, A.D.; Wu, S.Q.; Sun, D.Z.; Wang, S.X.; Qu, W.J.; Markey, R.; Stain, H.; Morgan, J.; Malinovskiy, D. Preparation and certification of Re-Os dating reference materials: Molybdenites HLP and JDC. Geostand. Geoanal. Res. 2004, 28, 41–52. [Google Scholar] [CrossRef]
- Qu, W.J.; Du, A.D. Highly precise Re-Os dating of molybdenite by ICP-MS with Carius tube sample digestion. Rock Miner. Anal. 2003, 22, 254–257, (In Chinese with English abstract). [Google Scholar]
- Gao, S.; Liu, X.M.; Yuan, H.L.; Hattendorf, B.; Günther, D.; Chen, L.; Hu, S.H. Determination of forty two major and trace elements in USGS and NIST SRM glasses by laser ablation-inductively coupled Plasma-Mass spectrometry. Geostand. Newsl. 2002, 26, 181–196. [Google Scholar] [CrossRef]
- Hu, Z.C.; Liu, Y.S.; Gao, S.; Xiao, S.Q.; Zhao, L.S.; Günther, D.; Li, M.; Zhang, W.; Zong, K.Q. A “wire” signal smoothing device for laser ablation inductively coupled plasma mass spectrometry analysis. Spectrochim. Acta B 2012, 78, 50–57. [Google Scholar] [CrossRef]
- Hu, Z.C.; Liu, Y.S.; Gao, S.; Hu, S.G.; Dietiker, D.; Günther, D. A local aerosol extraction strategy for the determination of the aerosol composition in laser ablation inductively coupled plasma mass spectrometry. J. Anal. At. Spectrom. 2008, 23, 1192–1203. [Google Scholar] [CrossRef]
- Hu, Z.C.; Liu, Y.S.; Gao, S.; Liu, W.G.; Zhang, W.; Tong, X.R.; Lin, L.; Zong, K.Q.; Li, M.; Chen, H.H.; et al. Improved in situ Hf isotope ratio analysis of zircon using newly designed X skimmer cone and jet sample cone in combination with the addition of nitrogen by laser ablation multiple collector ICP-MS. J. Anal. At. Spectrom. 2012, 27, 1391–1399. [Google Scholar] [CrossRef]
- Woodhead, J.; Hergt, J.; Shelley, M.; Eggins, S.; Kemp, R. Zircon Hf-isotope analysis with an excimer laser, depth profiling, ablation of complex geometries, and concomitant age estimation. Chem. Geol. 2004, 209, 121–135. [Google Scholar] [CrossRef]
- Fisher, C.M.; Vervoort, J.D.; Hanchar, J.M. Guidelines for reporting zircon Hf isotopic data by LA-MC-ICPMS and potential pitfalls in the interpretation of these data. Chem. Geol. 2014, 363, 125–133. [Google Scholar] [CrossRef]
- Blichert-Toft, J.; Chauvel, C.; Albarède, F. Separation of Hf and Lu for high-precision isotope analysis of rock samples by magnetic sector-multiple collector ICP-MS. Contrib. Mineral. Petrol. 1997, 127, 248–260. [Google Scholar] [CrossRef]
- Harrison, T.M.; Blichert-Toft, J.; Müller, W.; Albarede, F.; Holden, P.; Mojzsis, S.J. Heterogeneous Hadean hafnium: Evidence of continental crust at 4.4 to 4.5 Ga. Science 2005, 310, 1947–1950. [Google Scholar] [CrossRef] [Green Version]
- Morel, M.L.A.; Nebel, O.; Nebel-Jacobsen, Y.J.; Miller, J.S.; Vroon, P.Z. Hafnium isotope characterization of the GJ-1 zircon reference material by solution and laser ablation MC-ICPMS. Chem. Geol. 2008, 255, 231–235. [Google Scholar] [CrossRef]
- Wu, F.Y.; Yang, Y.H.; Xie, L.W.; Yang, J.H.; Xu, P. Hf isotopic compositions of the standard zircons and baddeleyites used in U-Pb geochronology. Chem. Geol. 2006, 234, 105–126. [Google Scholar] [CrossRef]
- Sláma, J.; Košler, J.; Condon, D.J.; Crowley, J.L.; Gerdes, A.; Hanchar, J.M.; Horstwood, M.S.; Morris, G.A.; Nasdala, L.; Norberg, N.; et al. Plešovice zircon—A new natural reference material for U-Pb and Hf isotopic microanalysis. Chem. Geol. 2008, 249, 1–35. [Google Scholar] [CrossRef]


| Deposit | Type | Analytical Methods | Age (Ma) | Reference |
|---|---|---|---|---|
| Yemaquan | Skarn (Fe, Cu, Pb, Zn) | Zircon LA–ICP–MS U–Pb | 228 ± 3 | [5] |
| Zircon LA–ICP–MS U–Pb | 225 ± 2 | |||
| Zircon LA–ICP–MS U–Pb | 221 ± 2 | |||
| hydrothermal phlogopite 40Ar/39Ar step-heating dating | 223 ± 3.3 | |||
| Shuangqing | Skarn (Fe, Cu, Pb, Zn) | Zircon LA–ICP–MS U–Pb | 225.8 ± 1.6 | [1] |
| molybdenite Re–Os | 224.3 ± 1.6 | |||
| Kendekeke | Skarn (Fe) | Zircon LA–ICP–MS U–Pb | 230.5 ± 4.2 | [11] |
| Zircon LA–ICP–MS U–Pb | 229.5 ± 0.5 | [12] | ||
| Yazigou | Porphyry (Cu, Mo) | molybdenite Re–Os | 224.7 ± 3.4 | [7] |
| Zircon SHRIMP U–Pb | 224.0 ± 1.6 | [8] | ||
| Wulanwuzhuer | Porphyry (Cu, Mo) | Zircon SHRIMP U–Pb | 215.1 ± 4.5 | [13] |
| Kaerqueka | Skarn (Cu, Pb, Zn) | molybdenite Re–Os | 238.8 ± 1.3 | [14] |
| Zircon SHRIMP U–Pb | 237 ± 2 | [15] | ||
| Harrizha | Porphyry (Cu, Mo) | Zircon LA–ICP–MS U–Pb | 234.5 ± 4.8 | [16] |
| Qingshuihedong | Porphyry (Cu, Mo) | Zircon LA–ICP–MS U–Pb | 224 | [17] |
| Xiadeboli | Porphyry (Cu, Mo) | Zircon LA–ICP–MS U–Pb | 244.2 ± 2.1 | [18] |
| Jiadanggen | Porphyry (Cu, Mo) | Zircon LA–ICP–MS U–Pb | 227.2 ± 1.9 | [19] |
| Saishitang | Skarn (Cu) | molybdenite Re–Os | 224.5 ± 1.8 | [20] |
| Zircon LA–ICP–MS U–Pb | 222.7 ± 2.3 | [21] | ||
| Zircon LA–ICP–MS U–Pb | 222.6 ± 2.4 | |||
| Zircon LA–ICP–MS U–Pb | 223.3 ± 2.2 | |||
| Zircon LA–ICP–MS U–Pb | 229.9 ± 2.6 | |||
| Galinge | Skarn (Fe) | Zircon LA–ICP–MS U–Pb | 228.3 ± 0.5 | [2] |
| Lalingzaohuo | Skarn (Mo–Fe) | Zircon LA–ICP–MS U–Pb | 228.49 ± 0.84 | [22] |
| Changshan | Porphyry (Mo) | Zircon SHRIMP U–Pb | 220 ± 1 | [23] |
| Tawenchahan | Skarn (Fe-Cu-Zn) | Muscovite 39Ar–40Ar | 230.7 ± 2.0 | [3] |
| 229.9 ± 3.5 |
Publisher’s Note: MDPI stays neutral with regard to jurisdictional claims in published maps and institutional affiliations. |
© 2020 by the authors. Licensee MDPI, Basel, Switzerland. This article is an open access article distributed under the terms and conditions of the Creative Commons Attribution (CC BY) license (http://creativecommons.org/licenses/by/4.0/).
Share and Cite
Gao, H.; Sun, F.; Li, B.; Qian, Y.; Wang, L.; Zhang, Y. Geochronological and Geochemical Constraints on the Origin of the Hutouya Polymetallic Skarn Deposit in the East Kunlun Orogenic Belt, NW China. Minerals 2020, 10, 1136. https://doi.org/10.3390/min10121136
Gao H, Sun F, Li B, Qian Y, Wang L, Zhang Y. Geochronological and Geochemical Constraints on the Origin of the Hutouya Polymetallic Skarn Deposit in the East Kunlun Orogenic Belt, NW China. Minerals. 2020; 10(12):1136. https://doi.org/10.3390/min10121136
Chicago/Turabian StyleGao, Hongchang, Fengyue Sun, Bile Li, Ye Qian, Li Wang, and Yajing Zhang. 2020. "Geochronological and Geochemical Constraints on the Origin of the Hutouya Polymetallic Skarn Deposit in the East Kunlun Orogenic Belt, NW China" Minerals 10, no. 12: 1136. https://doi.org/10.3390/min10121136