The Mechanical and Microstructural Properties of Composite Structures Made of a Cement-Tailing Backfill and Rock Core
by
Yu-ye Tan
1,2,*, 
Kai Zhang
1,2,*,
Xin Yu
1,2,
Wei-dong Song
1,2,
Jie Wang
1,2 and
Cheng-long Hai
1,2 1
Key Laboratory of High-Efficient Mining and Safety of Metal Mines, University of Science and Technology Beijing, Ministry of Education of China, Beijing 100083, China
2
School of Civil and Resources Engineering, University of Science and Technology Beijing, Beijing 100083, China
*
Authors to whom correspondence should be addressed.
Minerals 2020, 10(2), 159; https://doi.org/10.3390/min10020159
Submission received: 31 December 2019
/
Revised: 6 February 2020
/
Accepted: 10 February 2020
/
Published: 12 February 2020
(This article belongs to the Special Issue Practical Solutions for Underground Mine Backfilling Systems)
Abstract
:In underground metal mines that use sublevel or stage open-stope and backfilling mining methods (SSOBMMs), there is a special structure around which both sides of the rock pillar are wrapped by backfill. As a permanent part of an underground mine, how much can backfill improve the rock pillar’s compressive strength? What is the difference in the mechanical properties between the special structure and the signal rock? To explore these questions, a composite structure made of a cement-tailing backfill (CTB) and rock core (RC) was designed. Uniaxial and triaxial compressive strength tests and scanning electron microscope (SEM) were used to research the mechanical properties, failure process, failure characteristics, and microstructure characteristics of the cement-tailing backfill and rock core (CTB-RC) specimens. It was found that the full stress–strain curve of the CTB-RC specimen under triaxial compressive strength (TCS) test had two times the stress increases reaching a lower peak deviator stress two times after the RC was destroyed. The CTB can reduce the destruction and slow down the deformation speed of the inner rock cor (IRC). It can also prevent rigid slip of the IRC after it is damaged and maintain the stability and integrity of the overall structure. The findings of this study can provide some basic knowledge on the mechanical properties of the CTB-RB and provide theoretical guidance for the optimization direction of the width of the rock pillar and the room in mines using SSOBMMs.
1. Introduction
With the depletion of near-surface metal mineral resources, underground mining has become the main way to develop metal deposits. Increasingly more mining workers have begun to pay attention to whether mining methods can control underground stope pressure and maintain permanent stability of the stope [1,2].
The filling mining method has significant advantages in controlling ground pressure activities, maintaining structural stability of the underground stope, and reducing solid waste discharges [3]. As the mining depth continues to increase and governments vigorously promote green mining methods, the filling mining method has become increasingly more widely used for underground metal deposits in China [4,5]. Meanwhile, many scientific research developments have been achieved in backfill mining technology, backfill materials, and the mechanical properties of backfills [6,7,8,9,10,11]. For example, Mirzababaei et al. [12,13,14] studied the behavior of soft clay reinforced with short fibers, and found that Poly vinyl alcohol- Butane Tetra Carboxylic Acid (PVA-BTCA) stabilization was superior to fiber reinforcement in clays with a relatively higher initial void ratio. Tan et al. focused on the blasting influence on cemented tailing backfills and found that the dynamic peak stress had a quadratic relationship with the average stress rate [15,16,17].
Sublevel or stage open-stope and backfilling mining methods (SSOBMM) have become the best choice for underground metal mines because of their safety and high efficiency. In a stope, using these mining methods, there is special structure on both sides of the rock pillar that are wrapped by the cement-tailing backfill (CTB) as shown in Figure 1. These kinds of special structures are key permanent components in the underground stope [18,19]. How much backfill can help rock pillars support the roof and surrounding rock has become a research hotspot in recent years [20].
Yu et al. found that the backfill can absorb and transfer stress, contact support, and isolate stress [21,22]. Tesarik and Li et al. developed a physical monorail compression experiment model and analyzed the supporting effect of the backfill on the surrounding rock, finding that the backfill improves long-term underground safety by supporting the mine’s roof and by maintaining the strength of the support pillars [23,24]. You et al. established a formula for calculating the compressive strength of backfill [25]. Wang et al. studied the deformation and infrared radiation variation characteristics of a composite model of backfill and rock and found that by decreasing the cement sand ratio of the backfill body, the changing range of the average infrared radiation temperature (AIRT) of the backfill body became increasingly smaller [26,27,28]. Cai et al. found that the strength of pillars or rock masses surrounded by backfill material can increase [29,30]. Sun and Wang et al. monitored the acoustic emission characteristics of a cubic specimen during the rupture of rock-filled backfill and determined the distribution of the acoustic emission characteristics’ parameter values of the backfill during the fracture process [31,32]. Fang et al. studied the effect of curing temperature on the shear behavior of a rock-filled composite model interface and found that a higher curing temperatures can cause peak shear stress at the interface between early age cemented paste backfill (CPB) and rock [33]. Song et al. explored the common pressure-bearing mechanism of rock-filled assemblies and found that the residual strength of the rock-backfill pillar specimen is larger than that of the rock specimen [34,35]. Liu and Qiu et al. determined the formula for the strength ratio of the backfill and surrounding rock [36,37,38,39,40]. Zhao and Regassa et al. determined that the support effect of the backfill on the surrounding rock of the stope was the main reason to reduce the deformation and displacement of the surrounding rock [41,42,43].
In summary, previous research achievements have shown that the supporting methods of the backfill on surrounding and roof rock include surface, partial, and overall support [44,45], as shown in Figure 2. As a key component of an underground mine, the backfill can control the surrounding rock deformation, prevent rigid slips, and halt the progressive failure of the surrounding rock. It can also maintain the stability of the underground stope structure by reducing the energy consumption and deformation of the surrounding rock.
However, since the special structures on both sides of the rock pillar are wrapped by CTB in an underground stope using SSOBMM, how much can the CTB improve the rock pillar’s compressive strength, and what is the difference in the mechanical properties between the structure and signal rock? Research is still needed in the area.
In this study, using macroscopic mechanical tests and electron microscopy scanning technology, the mechanical properties and microstructure characteristics of a composite structure made by cement-tailing backfill and a rock core (CTB-RB) are explored. The findings of this study provide some basic knowledge of the mechanical properties of CTB-RB and can also provide theoretical guidance for the optimization direction of the width of rock pillars and rooms in mines using SSOBMM.
2. Materials and Methods
2.1. Materials of Cement-Tailing Backfill
CTB usually consists of mixing tailings with a hydraulic binder (usually 3–7 wt. %) and a relatively high proportion of water (typically 25–30% by weight) [46].
2.1.1. Tailings
Tailings were collected from the thickener underflow of the mill from a gold mine in the Shandong province of Northeast China. In order to obtain a representative particle size range, samples were collected four times every day at regular time intervals, and the sampling lasted for 5 days. The damp tailings were dried in the open-air first and subsequently oven-dried at a temperature of 60 °C for 12 h.
The particle size distribution was determined using an LS-C (II A) laser size analyzer (OMEC, Zhuhai, China) under dry conditions in accordance with ASTM-D421 standard procedures [47]. Figure 3a shows the particle size volume distribution curves of the tested tailing samples, in which “volume distribution” represents the volume fraction of the particles with different particle sizes. Approximately 10 vol. % of the fine particles were smaller than 12.13 μm, and the average particle size was 144.26 μm. The microstructures of the tested tailings were obtained by a scanning electron microscope (Zeiss Evo®18 SEM, Carl Zeiss, Jena, Germany), as shown in Figure 3b. The tailing particles were uniform overall, with some larger coarse particles included.
The chemical composition of the tailings was obtained using X-ray diffraction (XRF, D8 Advance diffractometer, Bruker, Karlsruhe, Germany). As shown in Table 1, the SiO2 content was 62.90 wt. %, while the Al2O3 content was 15.20 wt. %. Figure 4a shows the general element distribution of the fully tested tailings, in which different colors represent different elements, while black represents the intergranular porosity of the tailings. Figure 4b shows the element composition of a tested point in Figure 4a, which can only reflect the element composition of the test point, rather than the whole sample.
Generally, the tailing is a kind of inert material, without chemical active ingredients. As it is non-toxic and harmless, it can be used as back-filling material.
2.1.2. Binder and Water
Portland cement (PC) 32.5R was used as the binding agent (Table 2). PC 32.5R is produced in China and is widely used in the mining industry as the basic binding agent for CTB [48]. This type of cement contains abundant SiO2 (21.56 wt. %) and CaO (62.19 wt. %), which can provide sufficient strength and stability [49]. Un-distilled water was used to mix the tailings and binder to produce a slurry. It is important to note that water strongly impacts the mechanical strength properties of the CTB specimens in terms of the water-to-binder ratio and water content [3].
2.2. Materials of Inner Rock Core
The inner rock core (IRC) of this experiment was derived from the surrounding rock core of an underground gold mine. The IRC is granulite, which is white and partially grayish (Figure 5a). The mineral composition of the five natural rock samples was determined using the X-ray diffraction technique, and the results are shown in Table 3. The minerals contained in the rock samples are mainly montmorillonite, illite, kaolin, chlorite, plagioclase, and calcite.
The microscopic structure under the natural state of the rock sample was researched by means of a scanning electron microscope (SEM). As shown in Figure 5b–d, the rock sample tested showed an overall dense stratified and layered structure, with a variety of fine cracks and large fissures, large holes, and 8–15 μm pores. These microscopic features will weaken the mechanical properties of rock and affect its failure process and form [50].
2.3. Preparation of the CTB-RC Specimens
As shown in Figure 1, in the underground mines using SSOBMM, the widths of the CTB and RC are usually the same. In order to research the real situation in situ, the width ratio of the backfill to rock core of the CTB-RC specimens was designed to be 1:1. Furthermore, The International Society of Rock Mechanics and other studies recommend that a cylindrical specimen with a diameter of at least 50 mm should be used for CTB testing [51]. Since the size of a standard rock sample is 50 mm in diameter with a height of 100 mm, the CTB-RC Specimens were designed to be 50 mm in diameter and 100 mm in height; the IRC was put it in the center and wrapped by backfill, as shown in Figure 6. In mines using SSOBMM in China, the cement-to-tailing mass ratios (CTRs) are usually 1:4, 1:6, or 1:8, and the solid content (SC) varies from 65–75%. Thus, it was decided to use CTRs of 1:4, 1:6, and 1:8 and SCs of 65 wt. %, 70 wt. %, and 75 wt. % in the experiment. The preparation process of the CTB-RC specimens was as follows:
- The rock cores were processed into small RC specimens with a diameter of 25 mm and a height of 100 mm (Figure 6a).
- The poly vinyl chloride (PVC) pipes were cut into sections with an inner diameter of 50 mm and a height of 100 mm and were cut along the side wall for subsequent demolding (Figure 6b).
- The stirred slurry was injected into the PVC mold with an RC specimen inside, as shown in Figure 6c.
- The molds were kept stationary for six hours until the slurry sank and shrunk, and the liquid level dropped. Then, the slurry was injected again until the liquid level was consistent with the IRC height. This process was repeated until the height of the whole sample was similar to the height of the IRC.
- We then cured the CTB-RC specimens for 28 days using a standard curing box (Curing temperature: 20 ± 5 °C, relative humidity: 95 ± 5%).
Through the above steps, 13 CTB-RC specimens of different CTR and SC values were obtained, as shown in Table 4.
2.4. Experimental Installations and Tests
To study the mechanical properties, uniaxial and triaxial compressive tests were conducted on the CTB-RC specimens. Moreover, a scanning electron microscopy analysis was done in the laboratory to study the microstructural characteristics of the specimens. The testing procedures and set-ups used were given as follows.
2.4.1. Uniaxial Compressive Strength Test
The uniaxial compressive strength (UCS) test of the CTB-RC specimens was performed using a press machine (Figure 7). The experiment was processed as follows:
- The CTB-RC specimen was placed at the center of the bearing plate of the press machine, and the spherical seat was adjusted to place the two ends of the specimen in uneven contact. In addition, a flatness check was performed to make sure the plate was level before loading.
- According to some previous studies and experimental practice and experience [37], the load was applied at a constant speed at 100 N∙s−1 until the CTB-RC specimen was damaged. The loading speed was slowed down to 0 N∙s−1 after the specimen was completely damaged.
- The crack propagation process and failure mode and related data during the loading process were observed, photographed, and recorded.
Overall, nine CTB-RC specimens with different CTRs (1:4, 1:6, and 1:8) and SCs (65%, 70%, and 75%) were tested.
2.4.2. Triaxial Compressive Strength Test
The triaxial compressive strength (TCS) test was processed by a microcomputer controlled electro-hydraulic servo rock triaxial testing machine (TAW-2000, Jinli Test Technology Co., Ltd., Changchun, China), as shown in Figure 8. The extensometer was used to improve the accuracy of the experiment, which was processed as follows:
- The CTB-RC specimen was fixed in the extensometer and connected with the testing machine. To prevent the penetration of external lubricating oil and its negative effects on the test results, the CTB-RC specimen was wrapped with a rubber sleeve.
- The confining pressure was set as 300 KPa.
- A loading speed of 1 mm∙min−1 was used at first until the axial load reached 2 KN, which is about 60–70% of the peak axial stress of the specimen.
- Then, a loading speed of 0.02 mm∙min−1 was used, and a deformation control loading was applied to prevent a rock burst. This can also help us observe the change of the stress–strain curve after reaching peak deviator stress.
- We stopped loading until the CTB-RC specimen could remain substantially unchanged as the strain increased, which means it had already entered the residual strength phase.
- We recorded and observed the damage process and date during loading.
The confining pressure, loading speed, and axial load used in the experiment were performed according to some previous research and practical experience [37]. Overall, three CTB-RC specimens with CTR 1:4 and SC 75% were tested independently.
2.4.3. Scanning Electron Microscopy Analysis
A scanning electron microscope (SEM) was used to provide information about the surface tomography and composition of the sample by scanning the surface with a beam of electrons. The morphology and structural properties of the CTB-RC specimens were observed by Zeiss Evo®18 SEM (Carl Zeiss, Jena, Germany) with a resolution of 3 nm and a maximum accelerating voltage of 30 kV. The SEM image size was 1024 × 768.
Before scanning by SEM, a CTB-RC specimen was fractured by tools to separate the external cement-tailing backfill (ECTB) and IRC to make fragment samples. Very little hydration might have remained between the tailings and PC 32.5R, even though it was cured for 28 days and had to be terminated by anhydrous ethanol. Then, the fragment samples were collected and dried for surface carbonation treatment before electron microscope scanning.
One CTB-RC specimen with CTR 1:4 and SC 75% was scanned after it was cured for 28 days, and another one was scanned by SEM after the completion of the TCS test.
3. Results and Discussion
3.1. Effect of CTR and SC on the UCS Performance of the CTB-RC Specimens
3.1.1. Analysis on the Failure Characteristics
The failure characteristics were observed and recorded during the test as follows:
- At the beginning of loading, the ECTB of the CTB-RC specimens was the first to show a crack, as shown in Figure 9.
- As the experiment progressed, more cracks appeared in the ECTB, and the cracks expanded further. Then, the IRCs were destroyed. As shown in Figure 10, the failure modes of both the ECTB and the IRC involved basically the same shear failure.
- This indicates that the high CTR of the ECTB exerted some beneficial effects on the failure results. With a CTR of 1:4, the CTB-RC specimen could maintain its integrity, and the ECTB could be completely peeled off from the IRC after being damaged (Figure 10a–c). With a CTR of 1:6, the ECTB could not completely peel off because of its serious damage (Figure 10d). With a CTR of 1:8, the specimen was broken into pieces and could not be kept intact.
3.1.2. Analysis of the UCS Values
The maximum load at the time of failure was recorded to obtain the UCS values of the CTB-RC specimens, as shown in Table 5. The UCS values of the CTB specimens and the different sizes of the granulite RC specimens taken from a previous study [15] are also shown in Table 5. The analysis indicates the following:
- The UCS values of CTB-RC specimens is 13–17 times stronger than that of the CTB specimens, which means that the compressive strength of the CTB-RC specimen is considerably greater than that of the same-sized CTB specimen.
- The UCS values of CTB-RC specimens is only 32–38% that of RC specimen A, which is considerably lower than the original rock strength of the same size.
- The UCS values of the CTB-RC specimens is 13–26% higher than that of RC specimen B. Thus, the backfill could effectively protect the IRC, even if no constraint and no lateral pressure were present.
- The UCS values of the CTB-RC specimens increases with the CTR and the SC of the slurry. This means that the protection degree of the IRC from the ECTB increased with the CTR and the SC of the slurry.
- The relationship between the UCS values of the CTB-RC specimens and the CTR and the relationship between the UCS and SC were analyzed by a regression analysis. According to the correlation coefficient R2, a linear relation fits best. The relationship curves and equations are shown in Figure 11.
3.2. The Stress–Strain and Failure Characteristic of the CTB-RC Specimen under a Triaxial Compression Strength Test
3.2.1. Analysis of the Stress–Strain Curves
The full stress–strain curves and failure process of the CTB-RC specimen under the TCS test are shown in Figure 12. Furthermore, the full stress–strain curves and failure process of the rock specimen (griotte) under the TCS test with a confining pressure 20 MPa are shown in Figure 13, according to other researchers’ tests of rock mechanics [52]. The comparison and analysis were performed as follows:
- Micro-crack closure stage (AB): The curves of both the rock and CTB-RC specimens have a concave shape, which indicates that the internal crack gradually closed under compressive pressure, and the specimen generated nonlinear deformation. The ECTB of the CTB-RC specimen was under pressure with the IRC together, but the IRC was the main carrier. However, in the experiments, this part of the curve is very short and difficult to observe.
- Elastic deformation stage (BC): Both the rock specimen and the CTB-RC specimen entered an elastic deformation stage. The curve is approximately straight, which is proportional and conforms to Hooke’s law. Stress concentration occurred around the inner primordial pores but did not reach a magnitude that caused the internal microcracks to expand and rupture. The slope of the line is regarded as the elastic modulus of the CTB specimens.
- Inelastic deformation stage (CD): The curves of both the rock and CTB-RC specimens became convex, thereby suggesting that they started to undergo inelastic deformation. Microcracks began to spread steadily individually, and the volume deformation began to accelerate during this stage. the stress on the inner microscopic defect reached and exceeded the limit value and reached the first stress peak at point D. The long-term strength of the rock specimen (the strength corresponding to the point at which the rock retains the same volume) was approximately 80% of the peak deviator stress, while the long-term strength of the CTB-RC specimen was more than 90% of the peak deviator stress.
- Formation of the fault Stage (DE): The rock specimen gradually formed severe fracture damage and a rupture fault. The IRC of the CTB-RC specimen formed a fault plane, too, and its internal RC structure was destroyed after the first peak of the deviator stress. However, under the combined support of the ECTB and the IRC, the stress field value of the internal micro-defect still did not reach the limit stress value of the ECTB. The microcracks began to expand, bifurcate, detour and communicate, and rupture; the original damage occurred, and the CTB-RC specimen entered a weakening stage after the first stress peak.
- Residual deformation stage (EF) for the rock specimen: The rock specimen broke down at point E and then entered the residual deformation stage.
- Compressive strength rebound stage (EF) for the CTB-RC specimen: Due to the constraint of the ECTB, the compressive strength rebounded. The curve appears abrupt, showing the second peak deviator stress at point F. The ECTB then continued to be inelastically deformed, and the original microdamage inside began to intensify.
- Compressive strength weakening stage (FG): The cracks in the IRC developed rapidly, and the compressive strength was rapidly weakened. The ECTB and the IRC worked together. Then, the IRC experienced secondary damage at point G.
- ECTB completely destroyed stage (GH): With the complete failure of the IRC, the ECTB became the main carrier, and its internal microdefects were squeezed continuously. Moreover, the damage gradually increased until the ECTB was completely destroyed. The curve reached the third peak deviator stress at point H.
- Residual deformation stage after point H: Both the ECTB and the IRC were destroyed. The cracks in the ECTB show expansion, communication, bifurcation, and detour. The compressive strength decreased rapidly with an increase in axial strain. Then, it entered the stage of residual deformation.
In summary, compared with the full stress–strain curve of the rock specimen under the TCS test, that of the CTB-RC specimen presented two stress recoveries (EF and GH) after the first peak deviator stress. In stage EF, the IRC was the main carrier and still had good a bearing ability due to the constraint of the ECTB. In Stage GH, the ECTB was the main carrier. At this stage, although the IRC was completely destroyed, the failure and deformation speed of the CTB-RC specimen was slowed by the ECTB. Furthermore, it is good to ensure that the specimens be unbroken by progressive failure under lower stress.
3.2.2. Analysis of the Failure Characteristics
During the TCS test, the real-time internal destruction process of the specimens could not be observed and recorded without a real-time scanned SEM. The final failure mode of both the ECTB and the IRC are basically the same type of shear failure, as shown in Figure 14. In comparison with the failure under the UCS test, as shown in Figure 9, there are more cracks and fissures around the main shear failure surface under the TSC test, while the ECTB is more intact. This indicates that the ECTB is beneficial to the integrity of the whole CTB-RC specimen under the confining pressure and lateral limit.
3.3. Microstructure Characteristics of the Fracture Surface
To investigate the microstructure characteristics of the CTB-RC specimens before and after failure, SEM was used to observe the fracture surface of the IRC and ECTB before and after the TCS test. As it is impossible to scan the whole specimen by SEM, only the contact surface between the ECTB and IRC and the fracture surface of the failure specimen were observed, as shown in Figure 15.
As shown in Figure 16a, before the test, the granulite was mainly composed of a dense block and a layered structure, with a small amount of flaky minerals and a discrete arrangement direction, as well as some pores with a diameter of 15–30 μm. As shown in Figure 16b, after the test, the fracture mainly exhibited friction, double-slip, and layered-slip morphology, which indicates that shear failure occurred in the scanning area through the foliation plane. The fracture surface pores are compacted, and some areas shows vertical scanning surface cracks, indicating that a tensile failure mode also existed.
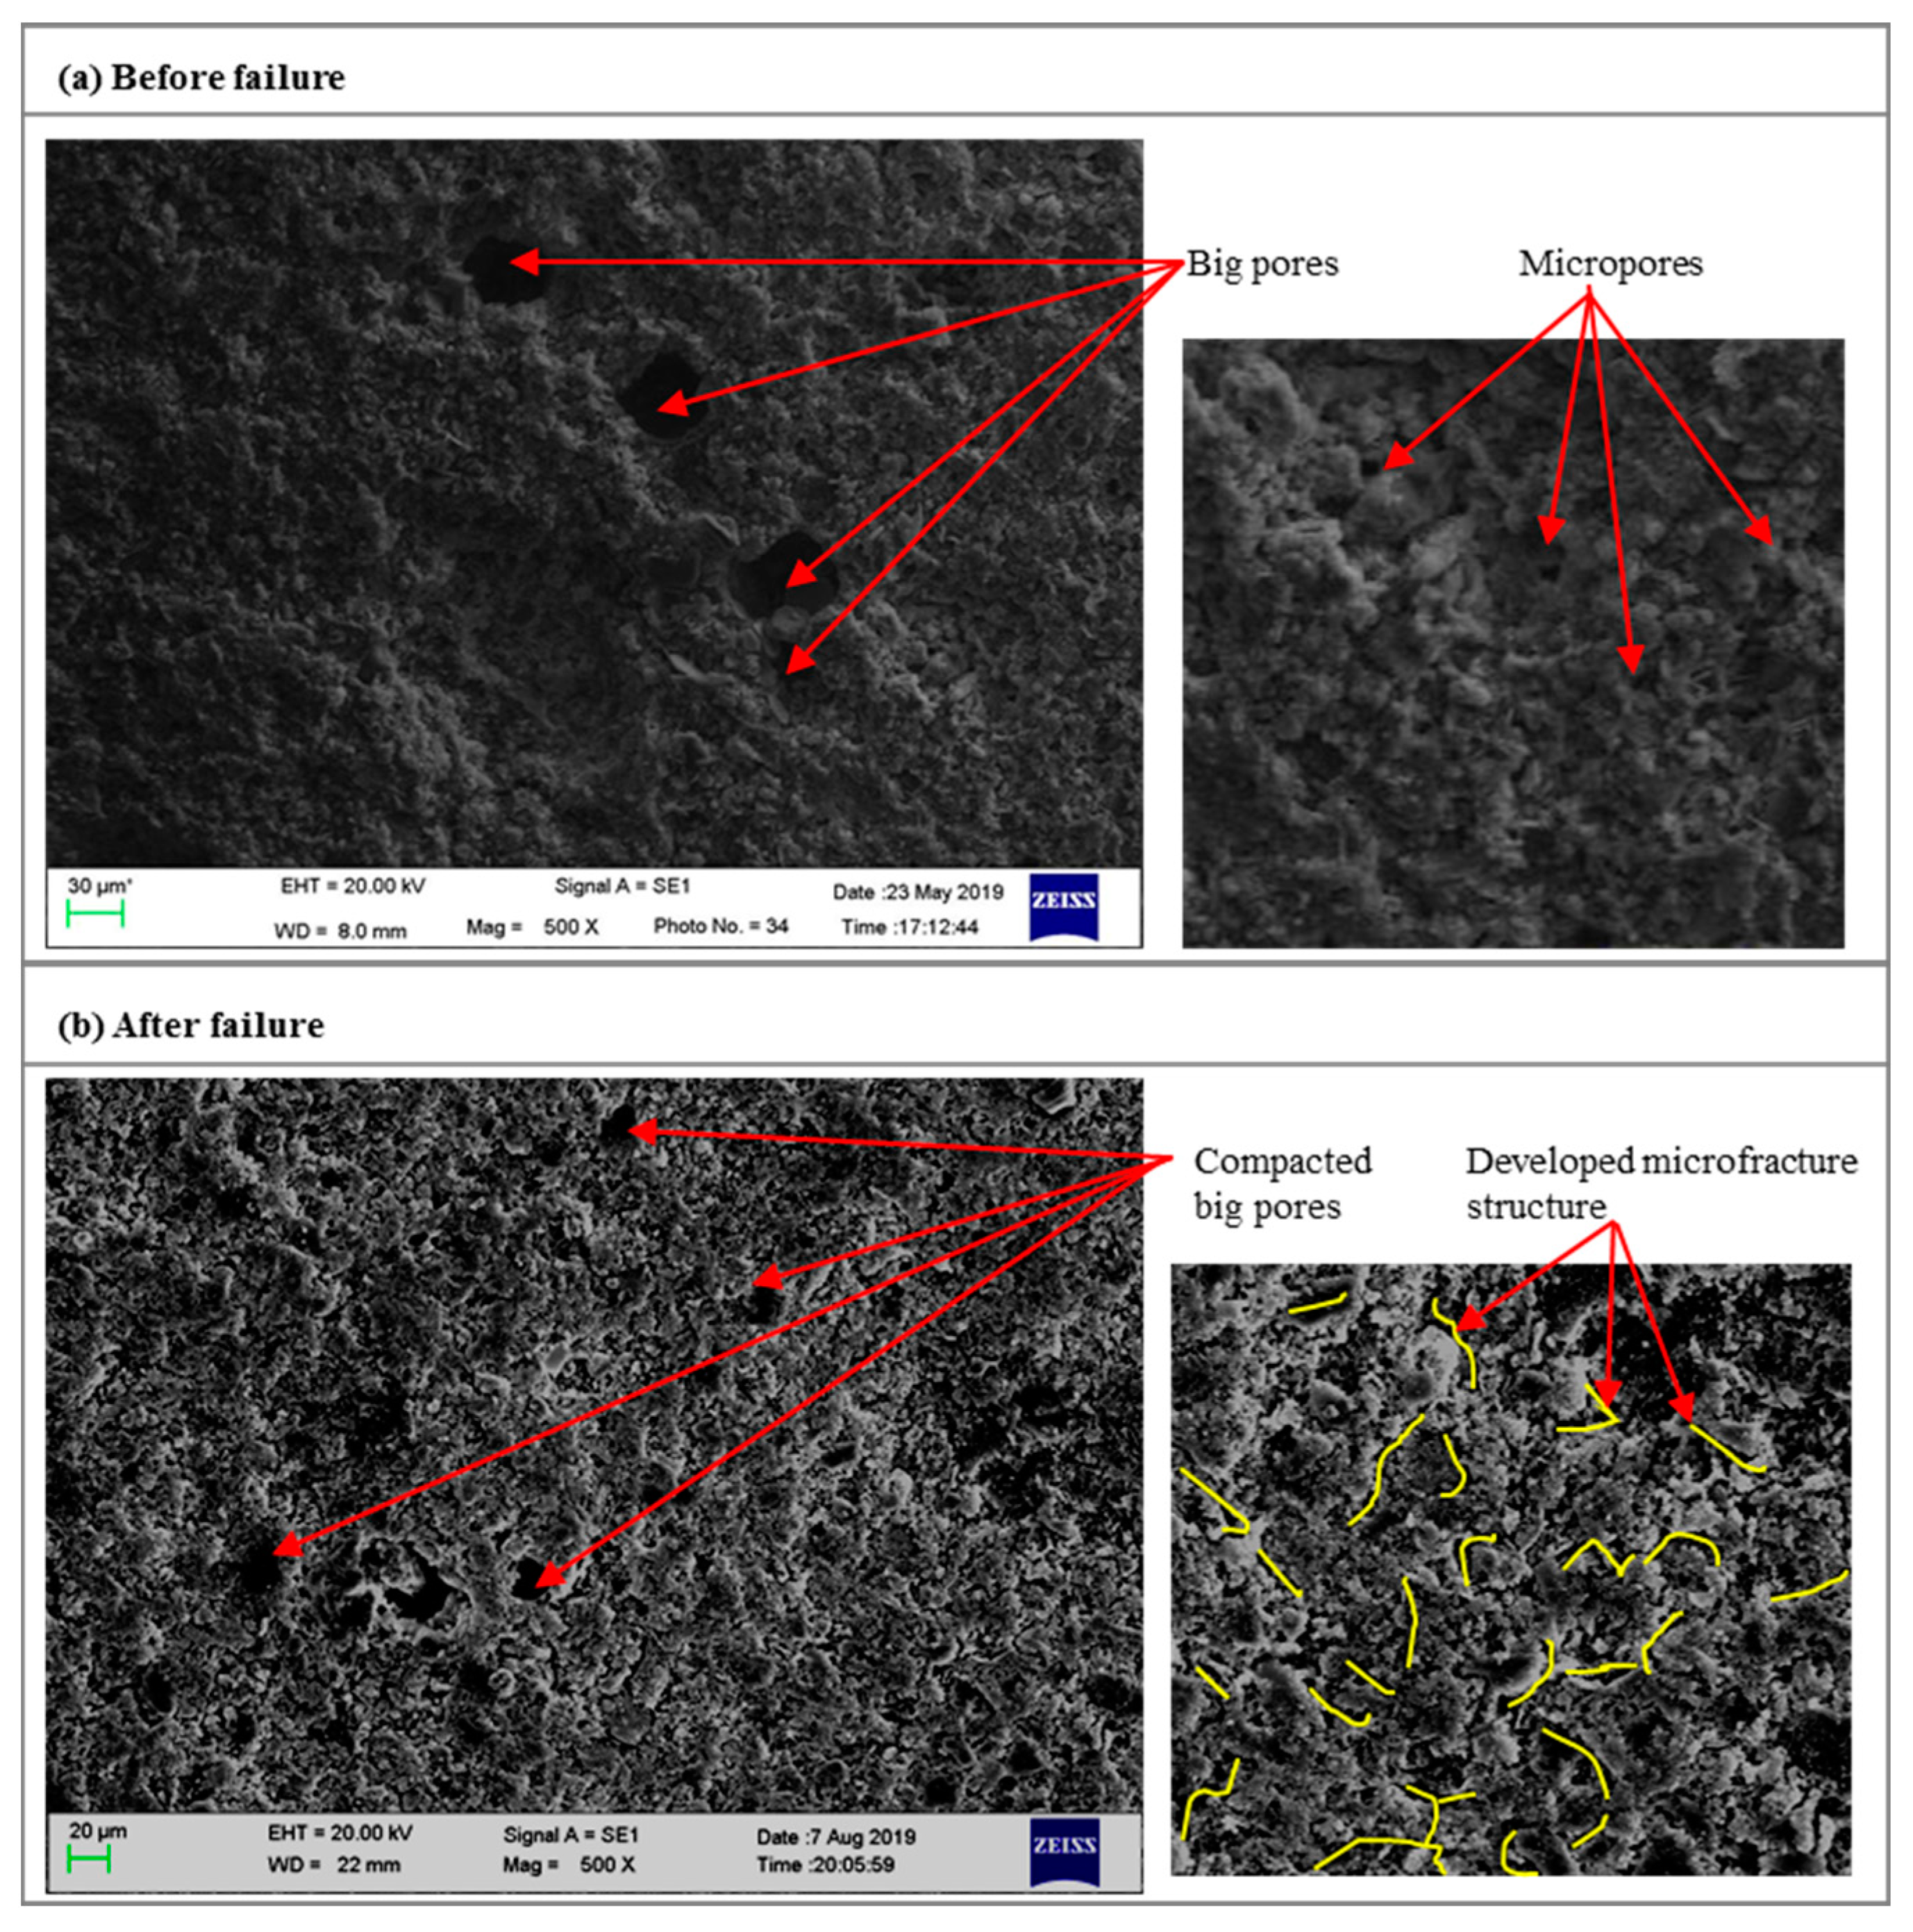
As shown in Figure 17a, before the test, the microporous structure of the ECTB was developed and had many large pores with diameters greater than 30 μm but with fewer internal microfractures and good integrity. As shown in Figure 17b, after the test, fractures were strongly developed, exhibiting irregular crossing branches, and the combination of fractures was complicated. Most of the larger pores were compressed or compacted. The micropore structure was completely developed, scattered, and irregularly distributed, but the observed area still maintained good integrity without large penetrating flaws or cracks due to the support of the IRC.
4. Conclusions
In this study, the mechanical properties, failure process, failure characteristics, and microstructure characteristics of CTB-RC specimens were studied by macroscopic mechanical experiments and microscopic electron microscopy. The main conclusions are as follows.
(1) Under the UCS and TCS tests, CTB-RC specimens presented a shear failure mode, and the ECTB and the IRC presented nearly the same failure form.
(2) The UCS values of the CTB-RC specimens was 13–26% higher than that of RC specimen B. Thus, backfill can play an effective role in supporting and protecting the IRC without any constraint or surrounding lateral pressure. Moreover, the degree of protection increases with an increase in the CTR and the SC of the slurry, and the relationship between the UCS values and CTR is linear.
(3) The full stress–strain curve of the CTB-RC specimen under TCS experienced stress increases two times and reached a lower peak stress two times after the IRC was destroyed. In stages of stress increases, the IRC and the ECTB act together. However, the ECTB gradually became the main bearing carrier until it was damaged. Thus, the existence of the ECTB could reduce the destruction and slow down the deformation speed of the IRC. Moreover, the ECTB sections can prevent the rigid slip of the IRC after it is damaged and thus maintain the stability and integrity of the overall structure.
(4) The SEM observation shows that the pores in the fracture surface of the IRC were compacted after being damaged. The fracture resulted from friction, a double-slip, and a layered-slip, which indicates that shear failure occurred through the foliation plane, and tensile failure also occurred along the vertical scanning plane cracks. Most of the larger pores of the ECTB were compressed or compacted after been damaged. An abundance of micropore structures was observed. These pores were scattered and irregularly distributed but still maintained good integrity without large penetrating flaws or cracks due to the support of the IRC.
Author Contributions
Conceptualization, Y.-y.T. and W.-d.S.; methodology, Y.-y.T. and X.Y.; validation, Y.-y.T., W.-d.S., and X.Y.; formal analysis, K.Z.; investigation, K.Z.; resources, Y.-y.T.; data curation, J.W., and C.-l.H.; writing—original draft preparation, Y.-y.T.; writing—review and editing, Y.-y.T., and K.Z.; visualization, J.W.; supervision, W.-d.S.; project administration, W.-d.S.; funding acquisition, W.-d.S. All authors have read and agreed to the published version of the manuscript.
Funding
This research was funded by the National Natural Science Foundation of China (51974012), the Fundamental Research Funds for the Central Universities (FRF-BD-19-005A), and the Open Fund of Key Laboratory of High-Efficient Mining and Safety of Metal Mines (Ministry of Education of China, No. ustbmslab201803).
Conflicts of Interest
The authors declare no conflict of interest.
References
- He, M.C.; Xie, H.P.; Peng, S.P.; Jiang, Y.D. Study on rock mechanics in deep mining engineering. Chin. J. Rock Mech. Eng. 2005, 16, 2803–2813. [Google Scholar]
- Wang, Q.; Ren, F.Y. Mining Science, 2nd ed.; Metallurgical Industry Press: Beijing, China, 2011; pp. 327–332. ISBN 978-7-5024-5490-6. [Google Scholar]
- Liu, C.; Han, B.; Sun, W.; Wu, J.X.; Yao, S.; Hu, H.Y. Experimental study of strength of backfillings of cemented rock debris and its application under low temperature condition. Chin. J. Rock Mech. Eng. 2015, 34, 139–147. [Google Scholar]
- Han, B.; Wang, X.L.; Xiao, W.G. Estimation and evaluation of backfill strength in underground stope based on multivariate nonlinear regression analysis. J. Min. Saf. Eng. 2012, 5, 714–718. [Google Scholar]
- Song, Z.Q.; Cui, Z.D.; Xia, H.C.; Tang, J.Q.; Wen, Z.J. The fundamental theoretical and engineering research on the green safe on coal pillar mining model by mainly using coal gangue backfill. Chin. J. Coal Soc. 2010, 5, 705–710. [Google Scholar]
- He, G.C.; Liu, Y.; Ding, D.X.; Zhang, Z.J. Strength characteristic of cemented waste rock backfills and its application. J. Min. Saf. Eng. 2013, 30, 74–79. [Google Scholar]
- Xue, G.L.; Yilamz, E.; Song, W.D.; Cao, S. Mechanical, flexural and microstructural properties of cement-tailings matrix composites: Effects of fiber type and dosage. Compos. Part B 2019, 172, 131–142. [Google Scholar] [CrossRef]
- Xue, G.L.; Yilmaz, E.; Song, W.D.; Cao, S. Compressive strength characteristics of cemented tailings backfill with alkali-activated slag. Appl. Sci. 2018, 8, 1537. [Google Scholar] [CrossRef] [Green Version]
- Junior, A.N.; Ferreira, S.R.; Filho, R.D.T.; Fairbairn, E.M.R. Effect of early age curing carbonation on the mechanical properties and durability of high initial strength Portland cement and lime-pozolan composites reinforced with long sisal fibres. Compos. B Eng. 2019, 163, 351–362. [Google Scholar] [CrossRef]
- Chen, X.; Shi, X.Z.; Zhou, J.; Chen, Q.S.; Li, E.; Dy, X.G. Compressive behavior and microstructural properties of tailings polypropylene fibre-reinforced cemented paste backfill. Constr. Build. Mater. 2018, 190, 211–221. [Google Scholar] [CrossRef]
- Yang, L.; Yilmaz, E.; Li, J.; Liu, H.; Jiang, H. Effect of superplasticizer type and dosage on fluidity and strength behavior of cemented tailings backfill with different solid contents. Constr. Build. Mater. 2018, 187, 290–298. [Google Scholar] [CrossRef]
- Mirzababaei, M.; Arulrajah, A.; Horpibulsuk, S.; Soltani, A.; Khayat, N. Stabilization of soft clay using short fibers and polyvinyl alcoholy. Geotext. Geomembr. 2018, 46, 646–655. [Google Scholar] [CrossRef]
- Mirzababaei, M.; Arulrajah, A.; Horpibulsuk, S.; Aldava, M. The shear stress ratio of the fibre-reinforced clay soils at large shear displacement was found to be relatively independent of the stress history of the soil. Geotext. Geomembr. 2017, 45, 422–429. [Google Scholar] [CrossRef]
- Mirzababaei, M.; Arulrajah, A.; Haque, A.; Nimbalkar, S.; Mohajerani, A. Effect of fiber reinforcement on shear strength and void ratio of soft clay. Geosynth. Int. 2018, 25, 471–480. [Google Scholar] [CrossRef]
- Tan, Y.Y.; Wang, J.; Song, W.D.; Xu, L.H.; Cao, S. Experimental study on mechanical properties of cemented tailings backfill under cycle dynamic loading test. J. Min. Saf. Eng. 2019, 1, 184–197. [Google Scholar]
- Zhu, P.R.; Song, W.D.; Cao, S.; Wan, F.; Zheng, D. Tensile mechanical response mechanism of cemented backfills under blasting load. J. Min. Saf. Eng. 2018, 35, 605–611. [Google Scholar]
- Tan, Y.Y.; YU, X.; Davide, E.; Xu, L.H.; Song, W.D. Experimental study on dynamic mechanical property of cemented tailings backfill under SHPB impact loading. Int. J. Min. Metall. Mater. 2019, 4, 404–416. [Google Scholar] [CrossRef]
- Razak, K.; Ganda, M.S.; Budi, S. Stability analysis of paste fill as stope wall using analytical method and numerical modeling in the kencana underground gold mining with long hole stope method. Procedia Earth Planet. Sci. 2013, 6, 474–484. [Google Scholar]
- Xu, W.B.; Song, W.D.; Wang, D.X.; Yang, B.G.; Pan, W.D. Energy dissipation properties of cement backfill body under triaxial compression conditions. J. China Univ. Min. Technol. 2014, 5, 808–814. [Google Scholar]
- Kimle, R.; William, F.; Bawden, G. Field properties of cemented paste backfill at the Golden Giant Mine. Min. Technol. Trans. Inst. Min. Metall. A 2005, 7, 65–80. [Google Scholar]
- Yu, X.F. Rock Mechanics and Mining Calculation in Information Age; Science Press: Beijing, China, 1991; pp. 121–159. ISBN 7030021401. [Google Scholar]
- Yu, S.B.; Yang, X.C.; Dong, K.C.; Jie, L.K.; Sun, X.M. Space-time rule of the control action of filling body for the movement of surrounding rock in method of the delayed filling open stoping. J. Min. Saf. Eng. 2015, 3, 74–79. [Google Scholar]
- Tesarik, D.R.; Seymour, J.B.; Yanske, T.R. Longterm stability of a backfilled room-and-pillar test section at the buick mine missouri. Int. J. Rock Mech. Min. Sci. 2009, 46, 1182–1196. [Google Scholar] [CrossRef]
- Li, P.; Ren, F.H.; Cai, M.F.; Guo, Q.F.; Wang, H.F.; Liu, K. Investigating the mechanical and acoustic emission characteristics of brittle failure around a circular opening under uniaxial loading. Int. J. Min. Met. Mater. 2019, 10, 1217–1234. [Google Scholar] [CrossRef]
- You, X.; Ren, F.Y.; He, R.X.; Ding, H.X. Research on compressive strength of cemented filling body in subsequent filling at the stage of open stope. J. Min. Saf. Eng. 2017, 34, 163–169. [Google Scholar]
- Wang, Z.G.; Wang, M.; Zhang, G.Q.; Li, Y.L. Research of infrared radiation characteristics of the combined model of filling body and surrounding rock during shear rupturing. Conserv. Util. Min. Resour. 2016, 5, 64–69. [Google Scholar]
- Wang, Z.G.; Li, Z.Y.; Gu, N.M. Study on the acoustic emission fracture characteristics of the backfilling and surrounding rock combined model under cyclic loading and unloading. Met. Mine 2018, 8, 51–57. [Google Scholar]
- Wang, Z.G.; Li, Z.Y.; Li, Y.L. Study on fracture mechanism of loading and unloading of filling and surrounding rock based on field strain. J. Yangtze River Sci. Res. Inst. 2017, 34, 1–6. [Google Scholar]
- Cai, S.J. Foundation of Mine Filling Mechanics, 2nd ed.; Metallurgical Industry Press: Beijing, China, 2009; ISBN 9787502449902. [Google Scholar]
- Wu, D.; Cai, S.J. Coupled effect of cement hydration and temperature on hydraulic behavior of cemented tailings backfill. J. Cent. South. Univ. 2015, 22, 1956–1964. [Google Scholar] [CrossRef]
- Sun, G.H.; Ye, H.T.; Liu, Z.Y. Study on the mechanism and acoustic emission characteristics of the filling body and rock pillar system. Min. Res. Dev. 2018, 3, 49–52. [Google Scholar]
- Wang, M.X.; Xu, M.G.; Hu, X.L.; Liu, Y.T. Acoustic emission monitoring test for the effect of top filling on filling body-surrounding rock. Nonferr. Met. Eng. 2018, 5, 72–76. [Google Scholar]
- Fang, K.; Fall, M. Effects of curing temperature on shear behavior of cemented paste backfill-rock interface. Int. J. Rock Mech. Min. Sci. 2018, 112, 184–192. [Google Scholar] [CrossRef]
- Song, W.D.; Zhu, P.R.; Qi, W.; Tang, Y.N. Coupling mechanism of rock-backfill system under triaxial compression. J. Min. Saf. Eng. 2017, 3, 573–579. [Google Scholar]
- Tan, Y.Y.; YU, X.; Song, W.D.; Wang, H.P.; Cao, S. Experimental study on combined pressure-bearing. mechanism of filling body and surrounding rock. J. Min. Saf. Eng. 2018, 8, 1071–1076. [Google Scholar]
- Liu, Z.X.; Li, X.B.; Zhao, G.Y.; Li, Q.Y.; Wang, W.H. Three-dimensional energy dissipation laws and reasonable matches between backfill and rock mass. Int. J. Rock Mech. Min. Sci. 2010, 2, 344–348. [Google Scholar]
- Liu, Z.X.; Li, X.B.; Dai, T.G.; Cao, P. On damage model of cemented tailings backfill and its match with rock mass. Rock Soil Mech. 2006, 9, 442–446. [Google Scholar]
- Zhou, X.M.; Wang, Y.; Tang, S.H. Constitutive relation of stress field between surrounding rock and filling body in jin chuan no.2 mining area. Q. CIMR 1991, 4, 1–6. [Google Scholar]
- Qiu, J.P.; Yang, L.; Xing, J.; Sun, X.G. Analytical solution for determining the required strength of mine backfill based on its damage constitutive model. Soil Mech. Found. Eng. 2018, 6, 371–376. [Google Scholar] [CrossRef]
- Liu, Z.X.; Lan, M.; Xiao, S.Y.; Guo, H.Q. Damage failure of cemented backfill and its reasonable match with rock mass. Trans. Nonferr. Met. Soc. 2005, 3, 954–959. [Google Scholar] [CrossRef]
- Zhao, H.J.; Ma, F.S.; Li, G.Q.; Ding, D.M.; Gao, J.K. Analysis and mechanism of ground movement, deformation and fracture induced by underground backfill mining. Chin. J. Geotech. Eng. 2008, 5, 23–28. [Google Scholar]
- Regassa, B.; Xu, N.X.; Mei, G. An equivalent discontinuous modeling method of jointed rock masses for DEM simulation of mining-induced rock movements. Int. J. Rock Mech. Min. Sci. 2018, 180, 1–14. [Google Scholar] [CrossRef]
- Peng, S.S.; Cheng, J.Y.; Du, F.; Xue, Y.T. Underground ground control monitoring and interpretation, and numerical modeling and shield capacity design. Int. J. Min. Sci. Technol. 2018, 10, 233–248. [Google Scholar] [CrossRef]
- Wang, X.M.; Gu, D.S.; Zhang, Q.L. Theory of Backfilling Activity and Pipeline Transportation Technology of Backfilling Deep Mines; Central South University Press: Changsha, China, 2010; pp. 55–56. ISBN 9787548701521. [Google Scholar]
- Deng, D.Q.; Gao, Y.T.; Wu, S.C.; Yu, W.J. Experimental study of destructive energy dissipation properties of backfill under complicated stress condition. Rock Soil Mech. 2010, 3, 737–742. [Google Scholar]
- Gonzalo, S.; Fourie, A.; James, D. Cyclic Shear Response of Cemented Paste Backfill. Geotech. Geoenviron. Eng. 2017, 143, 4016082. [Google Scholar]
- ASTM Standard D421-85. Standard Practice for Dry Preparation of Soil Samples for Particle Size Analysis and Determination of Soil Constants; Annual Book of ASTM Standards, 04.08; American Society of Testing Material International: West Conshohocken, PA, USA, 2007; pp. 8–9. Available online: www.astm.org (accessed on 11 February 2020).
- Benzaazoua, M.; Bussière, B.; Demers, I.; Aubertin, M.; Fried, E.; Blier, A. Integrated mine tailings management by combining environmental desulphurization and cemented paste backfill, Application to mine Doyon. Min. Eng. 2009, 24, 330–340. [Google Scholar] [CrossRef]
- Li, Y.F.; Zhang, J.M.; Deng, F.; Bai, S.W. Experimental study on strength characteristics of tailings cement backfilling at deep-seated mined-out area. Rock Soil Mech. 2005, 6, 865–868. [Google Scholar]
- Tan, Y.Y.; Cao, S.; Song, W.D.; Fu, J.X. Hydrophilic characteristics experiment and action mechanism of ore mass in Chengchao iron mine. J. Northeast. Univ. 2015, 5, 163–168. [Google Scholar]
- Fairhurst, C.E.; Hudson, J.A. Draft ISRM suggested method for the complete stress-strain curve for intact rock in uniaxial compression. Int. J. Rock Mech. Min. Sci. 1999, 36, 279–292. [Google Scholar]
- Zhang, L.; Wang, B.X.; Yang, T. Research of rock triaxial compression test with multilevel confining pressure. Site Investig. Sci. Technol. 2007, 3, 6–8. [Google Scholar]
Figure 1.
The structures of both sides of the rock pillar are wrapped by CTB in the underground metal mines using SSOBMM.
Figure 1.
The structures of both sides of the rock pillar are wrapped by CTB in the underground metal mines using SSOBMM.
Figure 2.
Action models of backfill supports in mines. (a) Surface supporting: backfill can prevent the progressive failure of surrounding rock mass under low stress condition, (b) Partial supporting: backfill produces local support force to the fracture zone and jointed rock mass, and (c) Overall supporting: as the backfill being compressed, the overall support force is generated, which plays the role of the overall support member in the underground mine structure.
Figure 3.
(a) Particle size distribution and (b) microstructure of the tailings.
Figure 4.
(a) General element distribution of the fully tested tailings and (b) the element composition of the tested point.
Figure 4.
(a) General element distribution of the fully tested tailings and (b) the element composition of the tested point.
Figure 5.
Surrounding rock cores and its micro-structures in an underground gold mine. (a) Surrounding rock cores: granulite cores obtained in site from underground stope surrounding rock mass, (b) The dense layered structure: dense layered structure observed by SEM which may cause layered motion failure, (c) Fine and large cracks: A lot of fine cracks and large fissures were observed by SEM which may cause fracture and expand to form slip surface, (d) Nature holes and pores: existing naturally in rock mass, and the volume of them will shrink during compression test, resulting in elastic deformation.

Figure 6.
Materials (a) RC specimens and (b) PVC moulds and preparation process (c) Filled with slurry of the (d) CTB-RC specimens.
Figure 6.
Materials (a) RC specimens and (b) PVC moulds and preparation process (c) Filled with slurry of the (d) CTB-RC specimens.
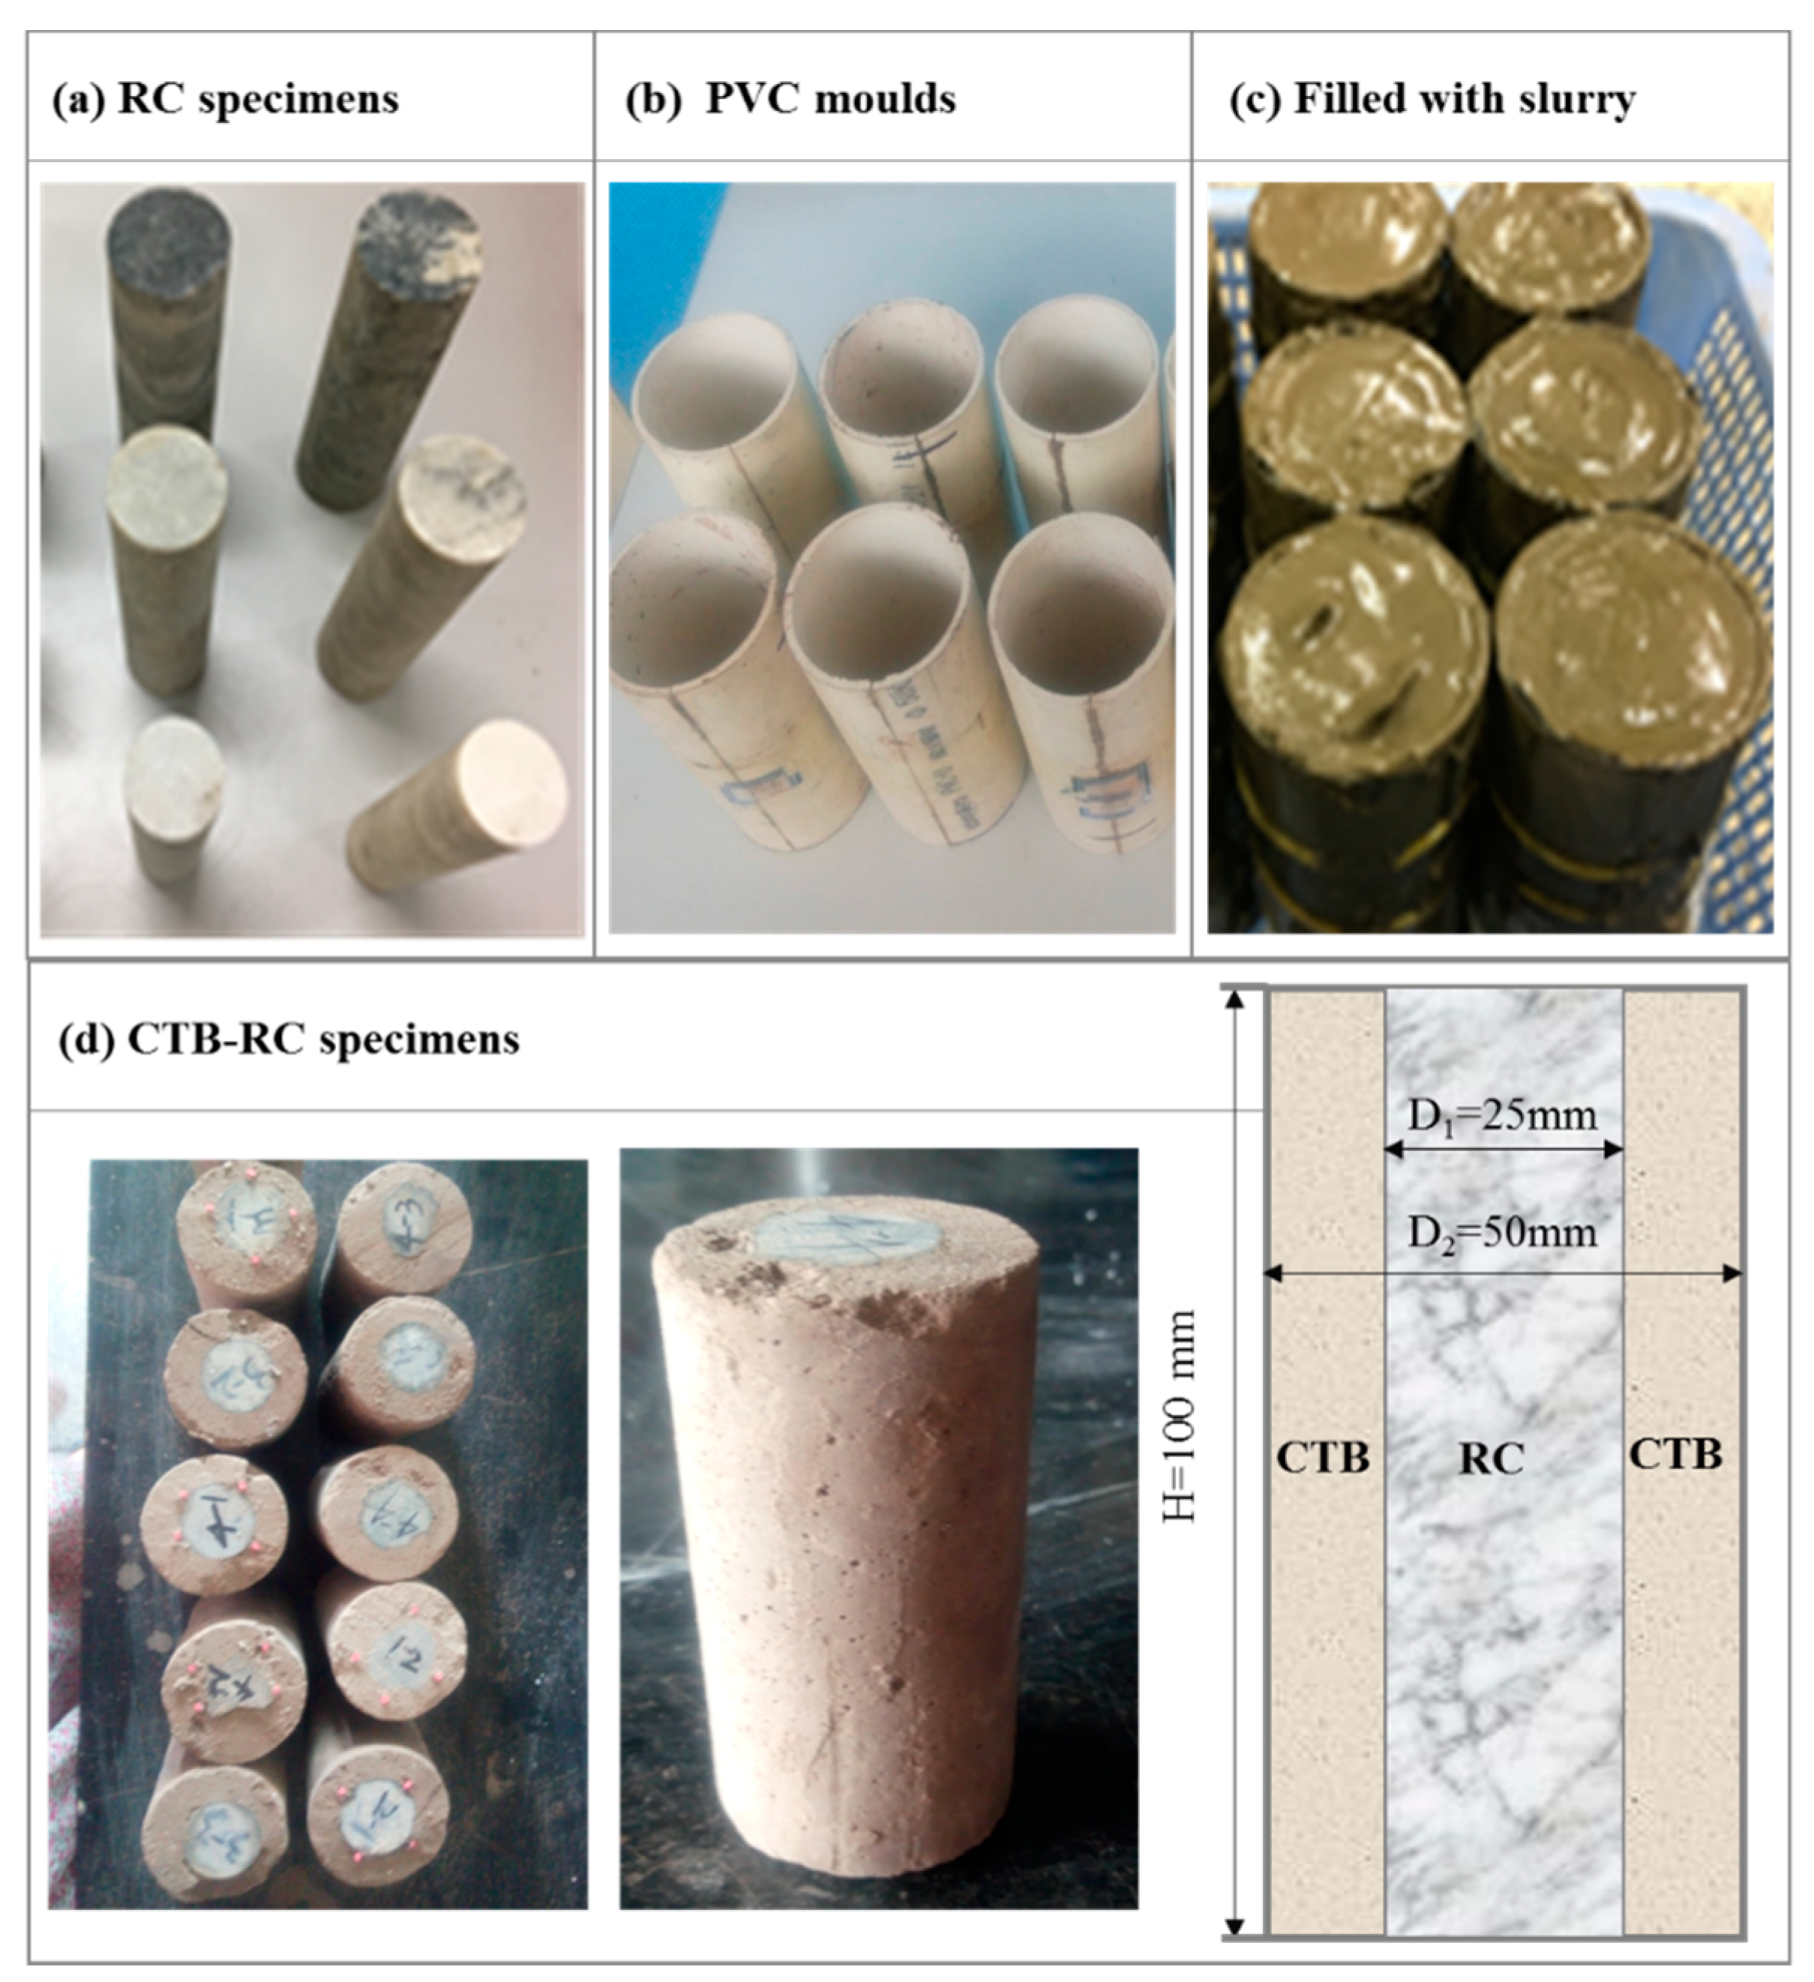
Figure 7.
(a) The UCS tester and (b) the CTB-RC specimen fractured under the UCS test.
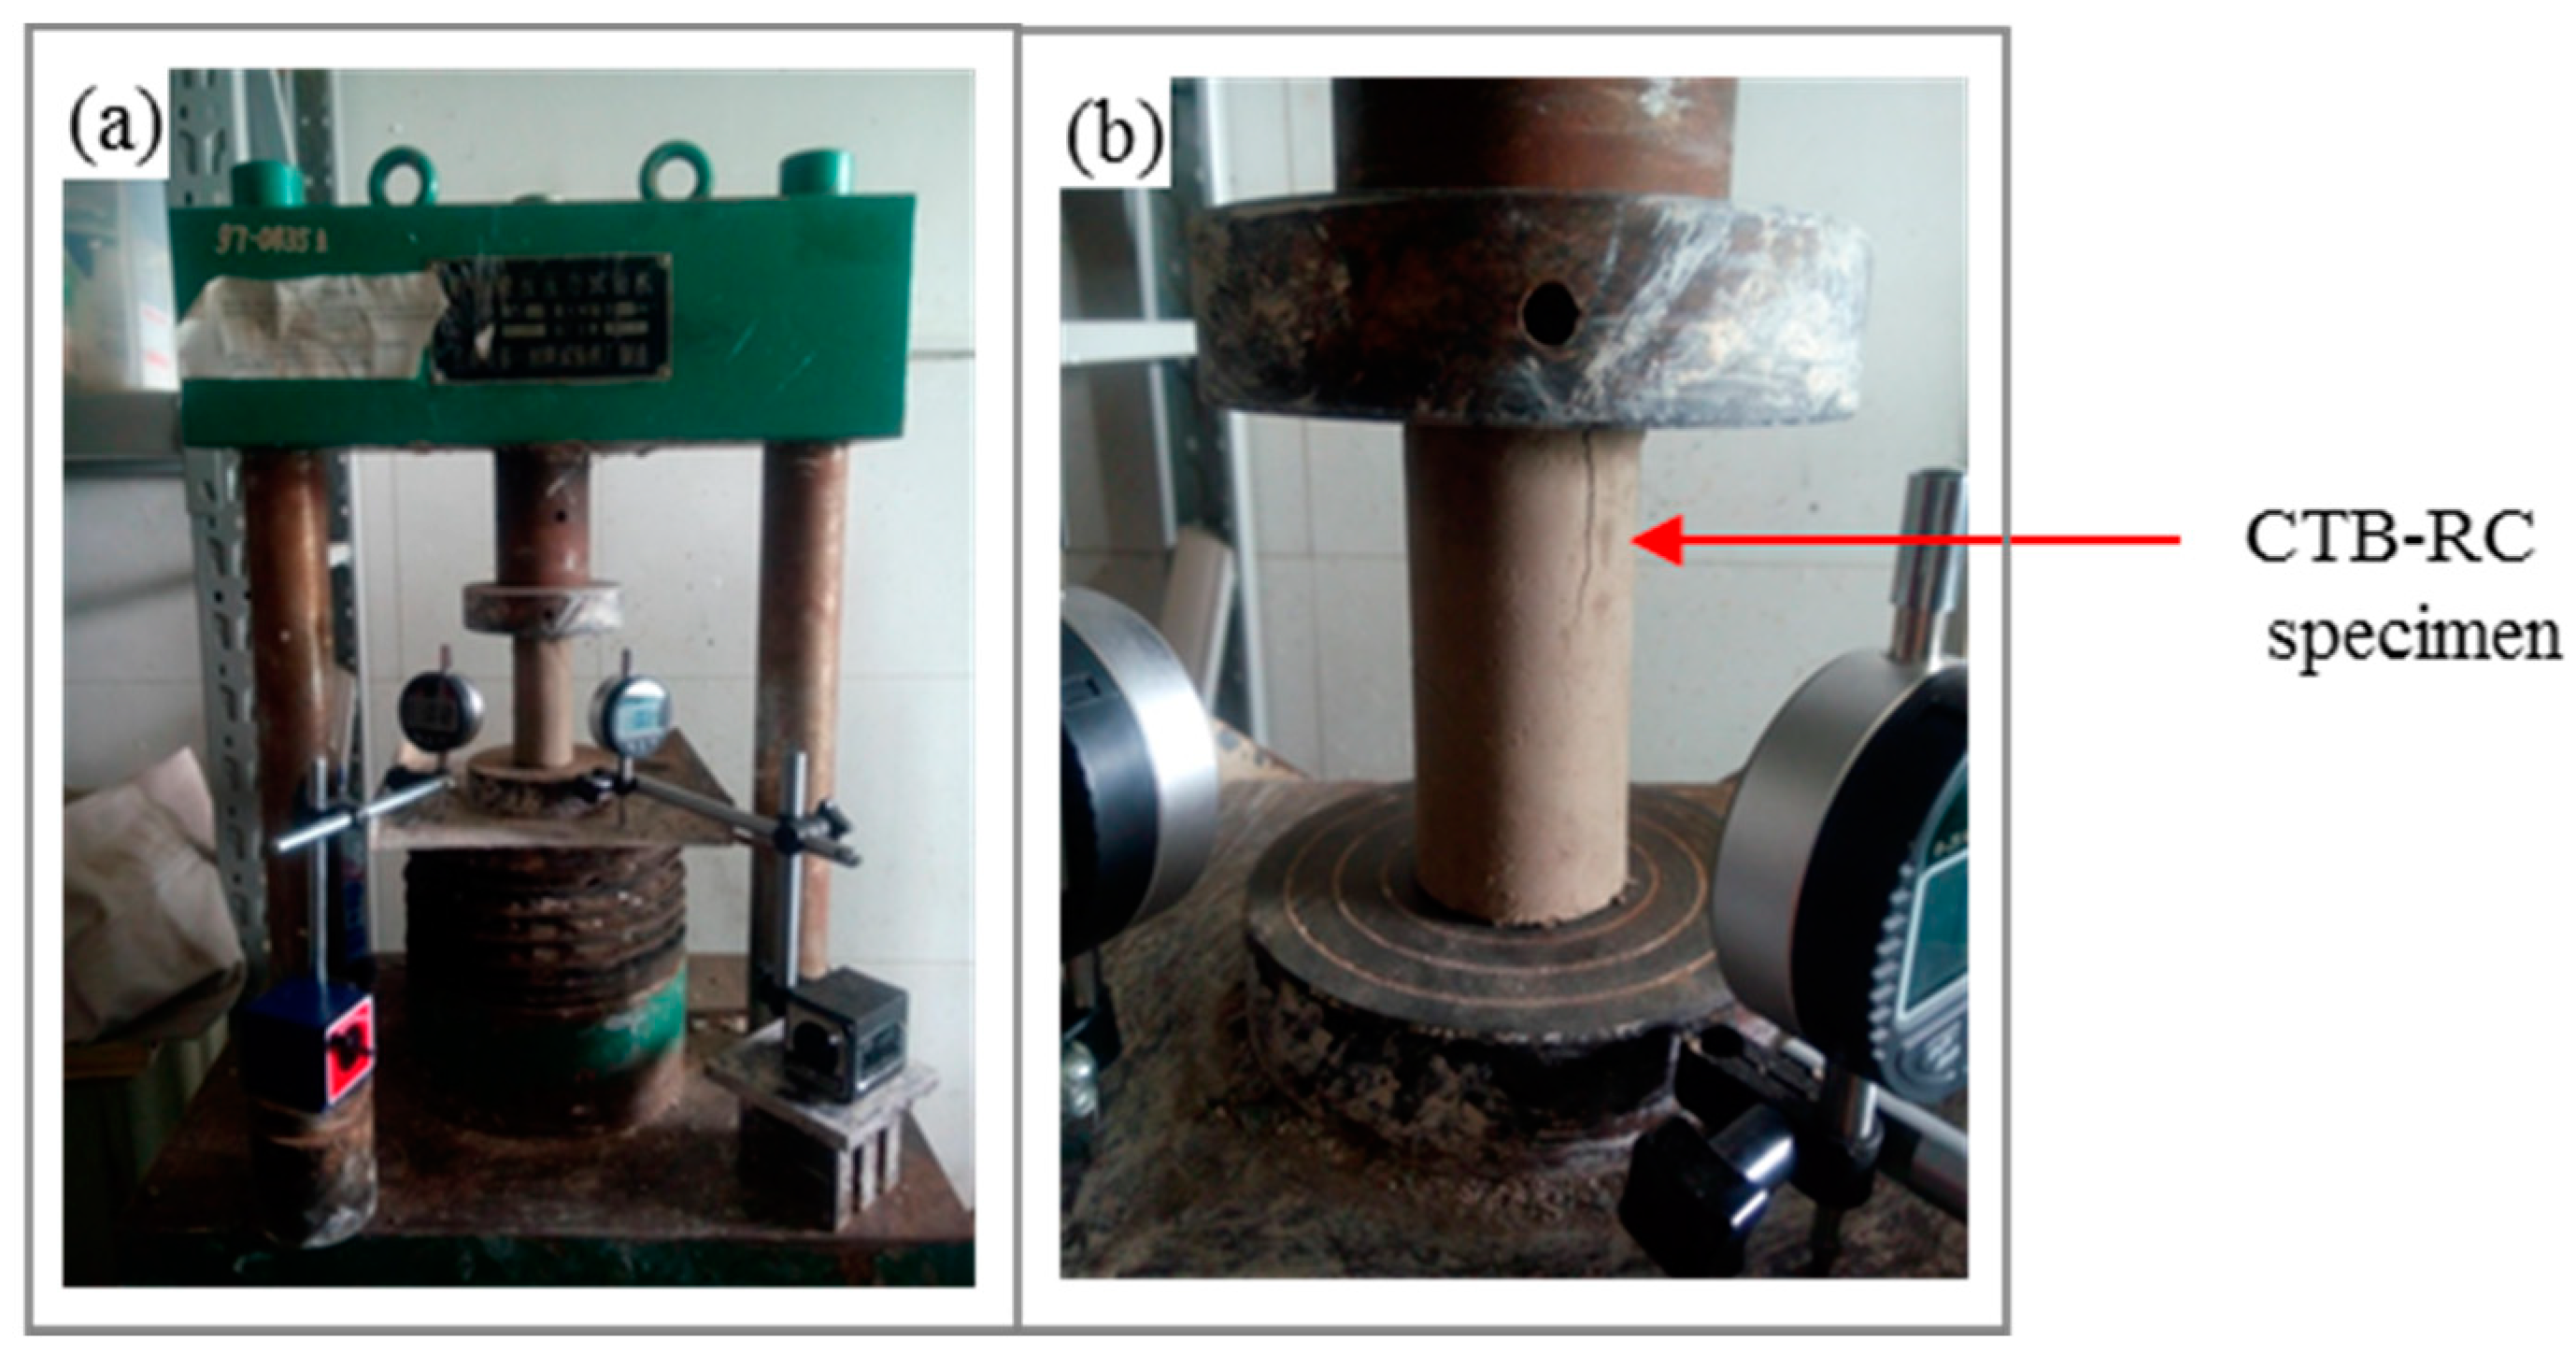
Figure 8.
The TCS tester (a) and the extensometer (b).
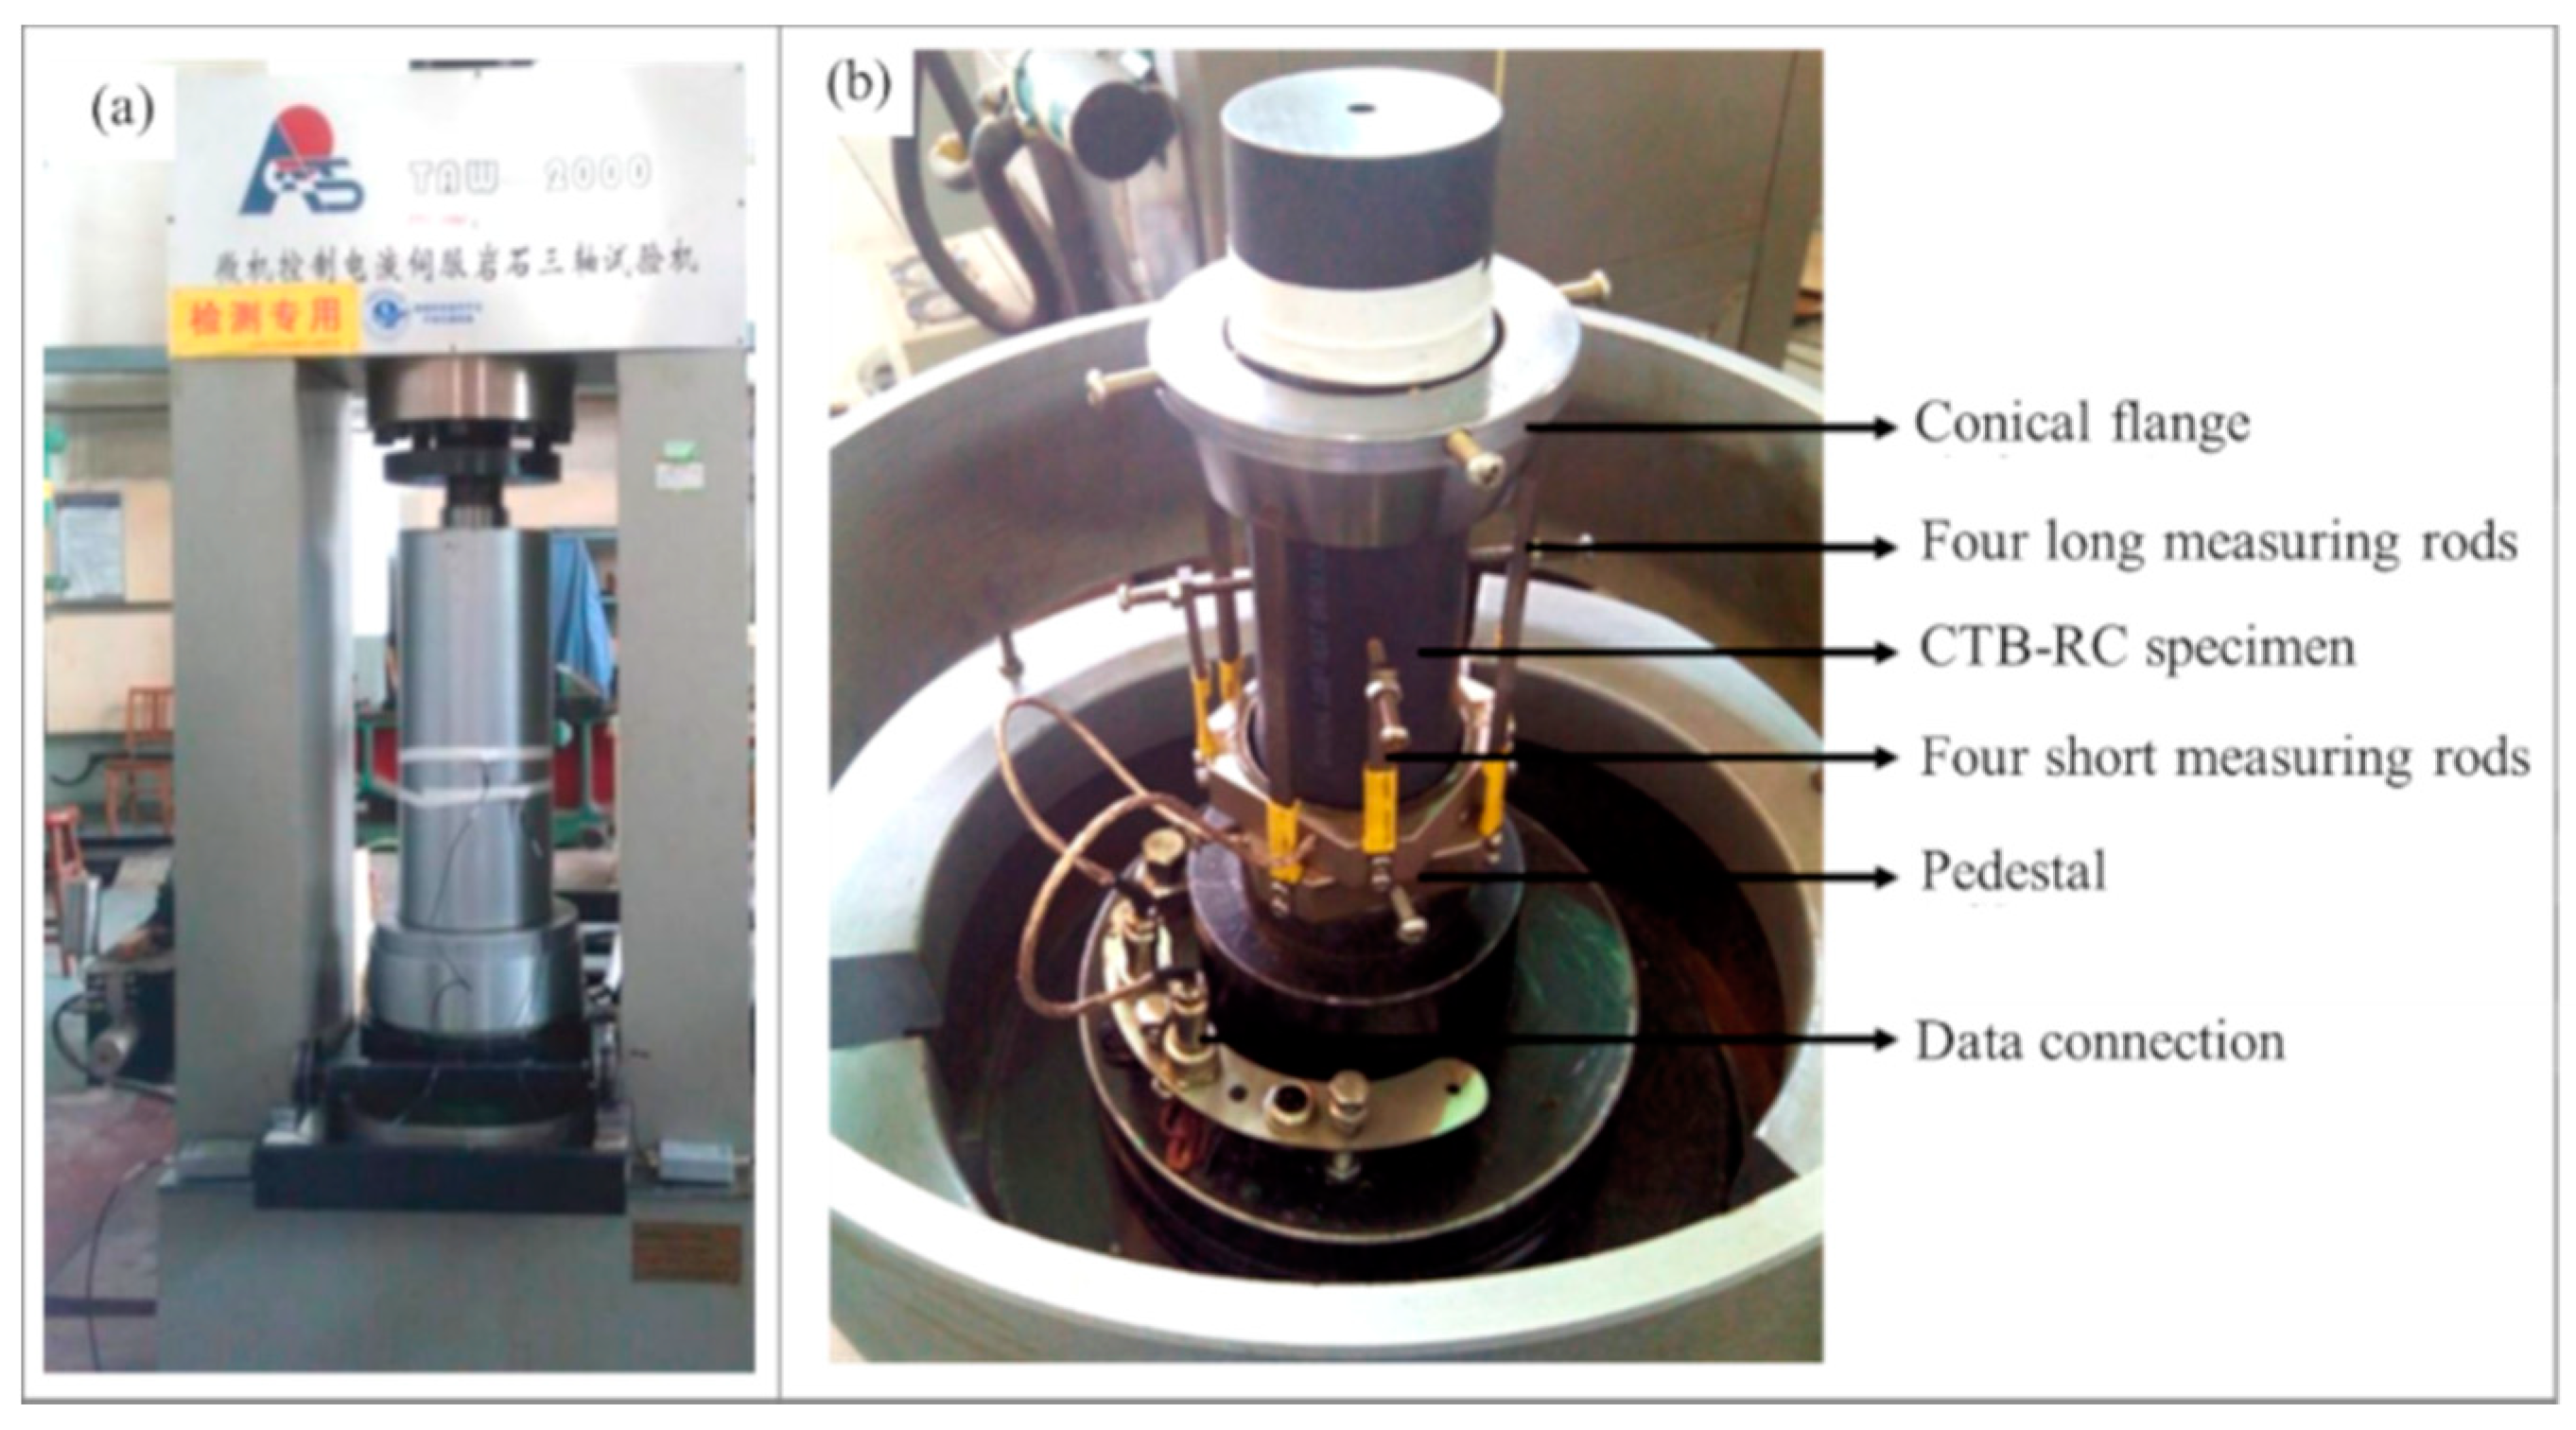
Figure 9.
Cracks appeared in the external backfill surface of the CTB-RC specimens with CTR 1:4 and different SC (a) 65%, (b) 70% and (c) 75% during the initial test stage.
Figure 9.
Cracks appeared in the external backfill surface of the CTB-RC specimens with CTR 1:4 and different SC (a) 65%, (b) 70% and (c) 75% during the initial test stage.
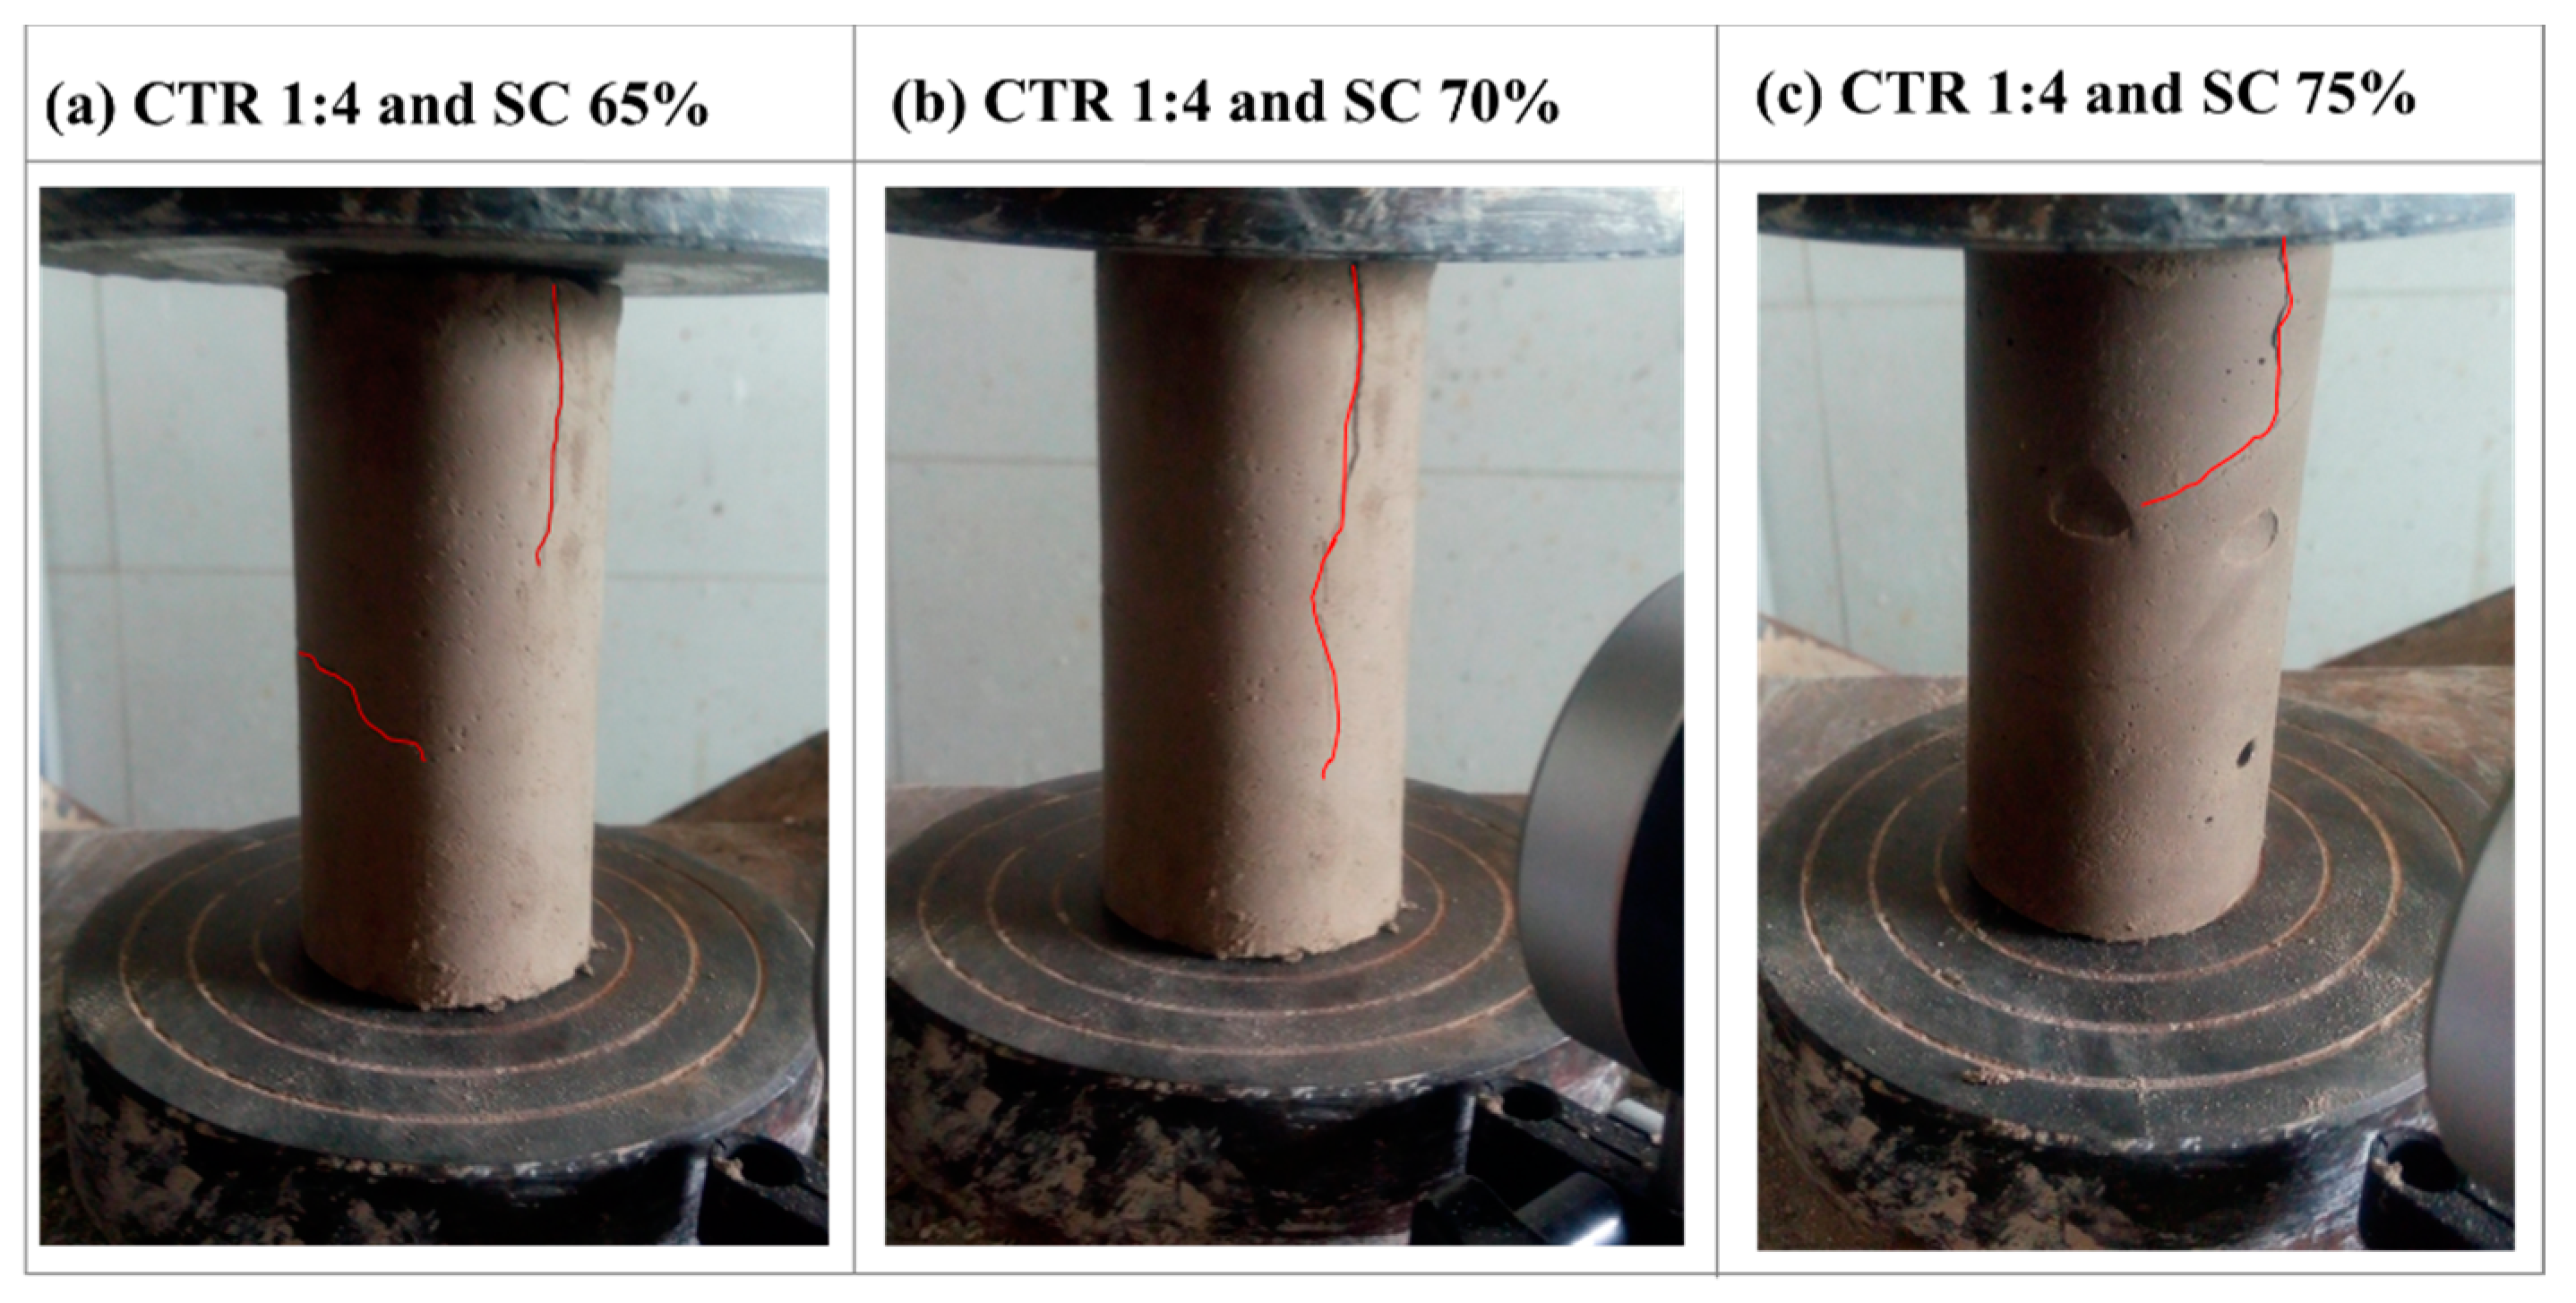
Figure 10.
Failure mode of the CTB-RC specimens with CTR 1:4 and SC 75%. The sketches in (a), (b), and (c) were drawn manually in Auto CAD according to the real cracks. Specimens in (d) with the CTR 1:6 and different SCs were completely peel off because of its serious damage.
Figure 10.
Failure mode of the CTB-RC specimens with CTR 1:4 and SC 75%. The sketches in (a), (b), and (c) were drawn manually in Auto CAD according to the real cracks. Specimens in (d) with the CTR 1:6 and different SCs were completely peel off because of its serious damage.
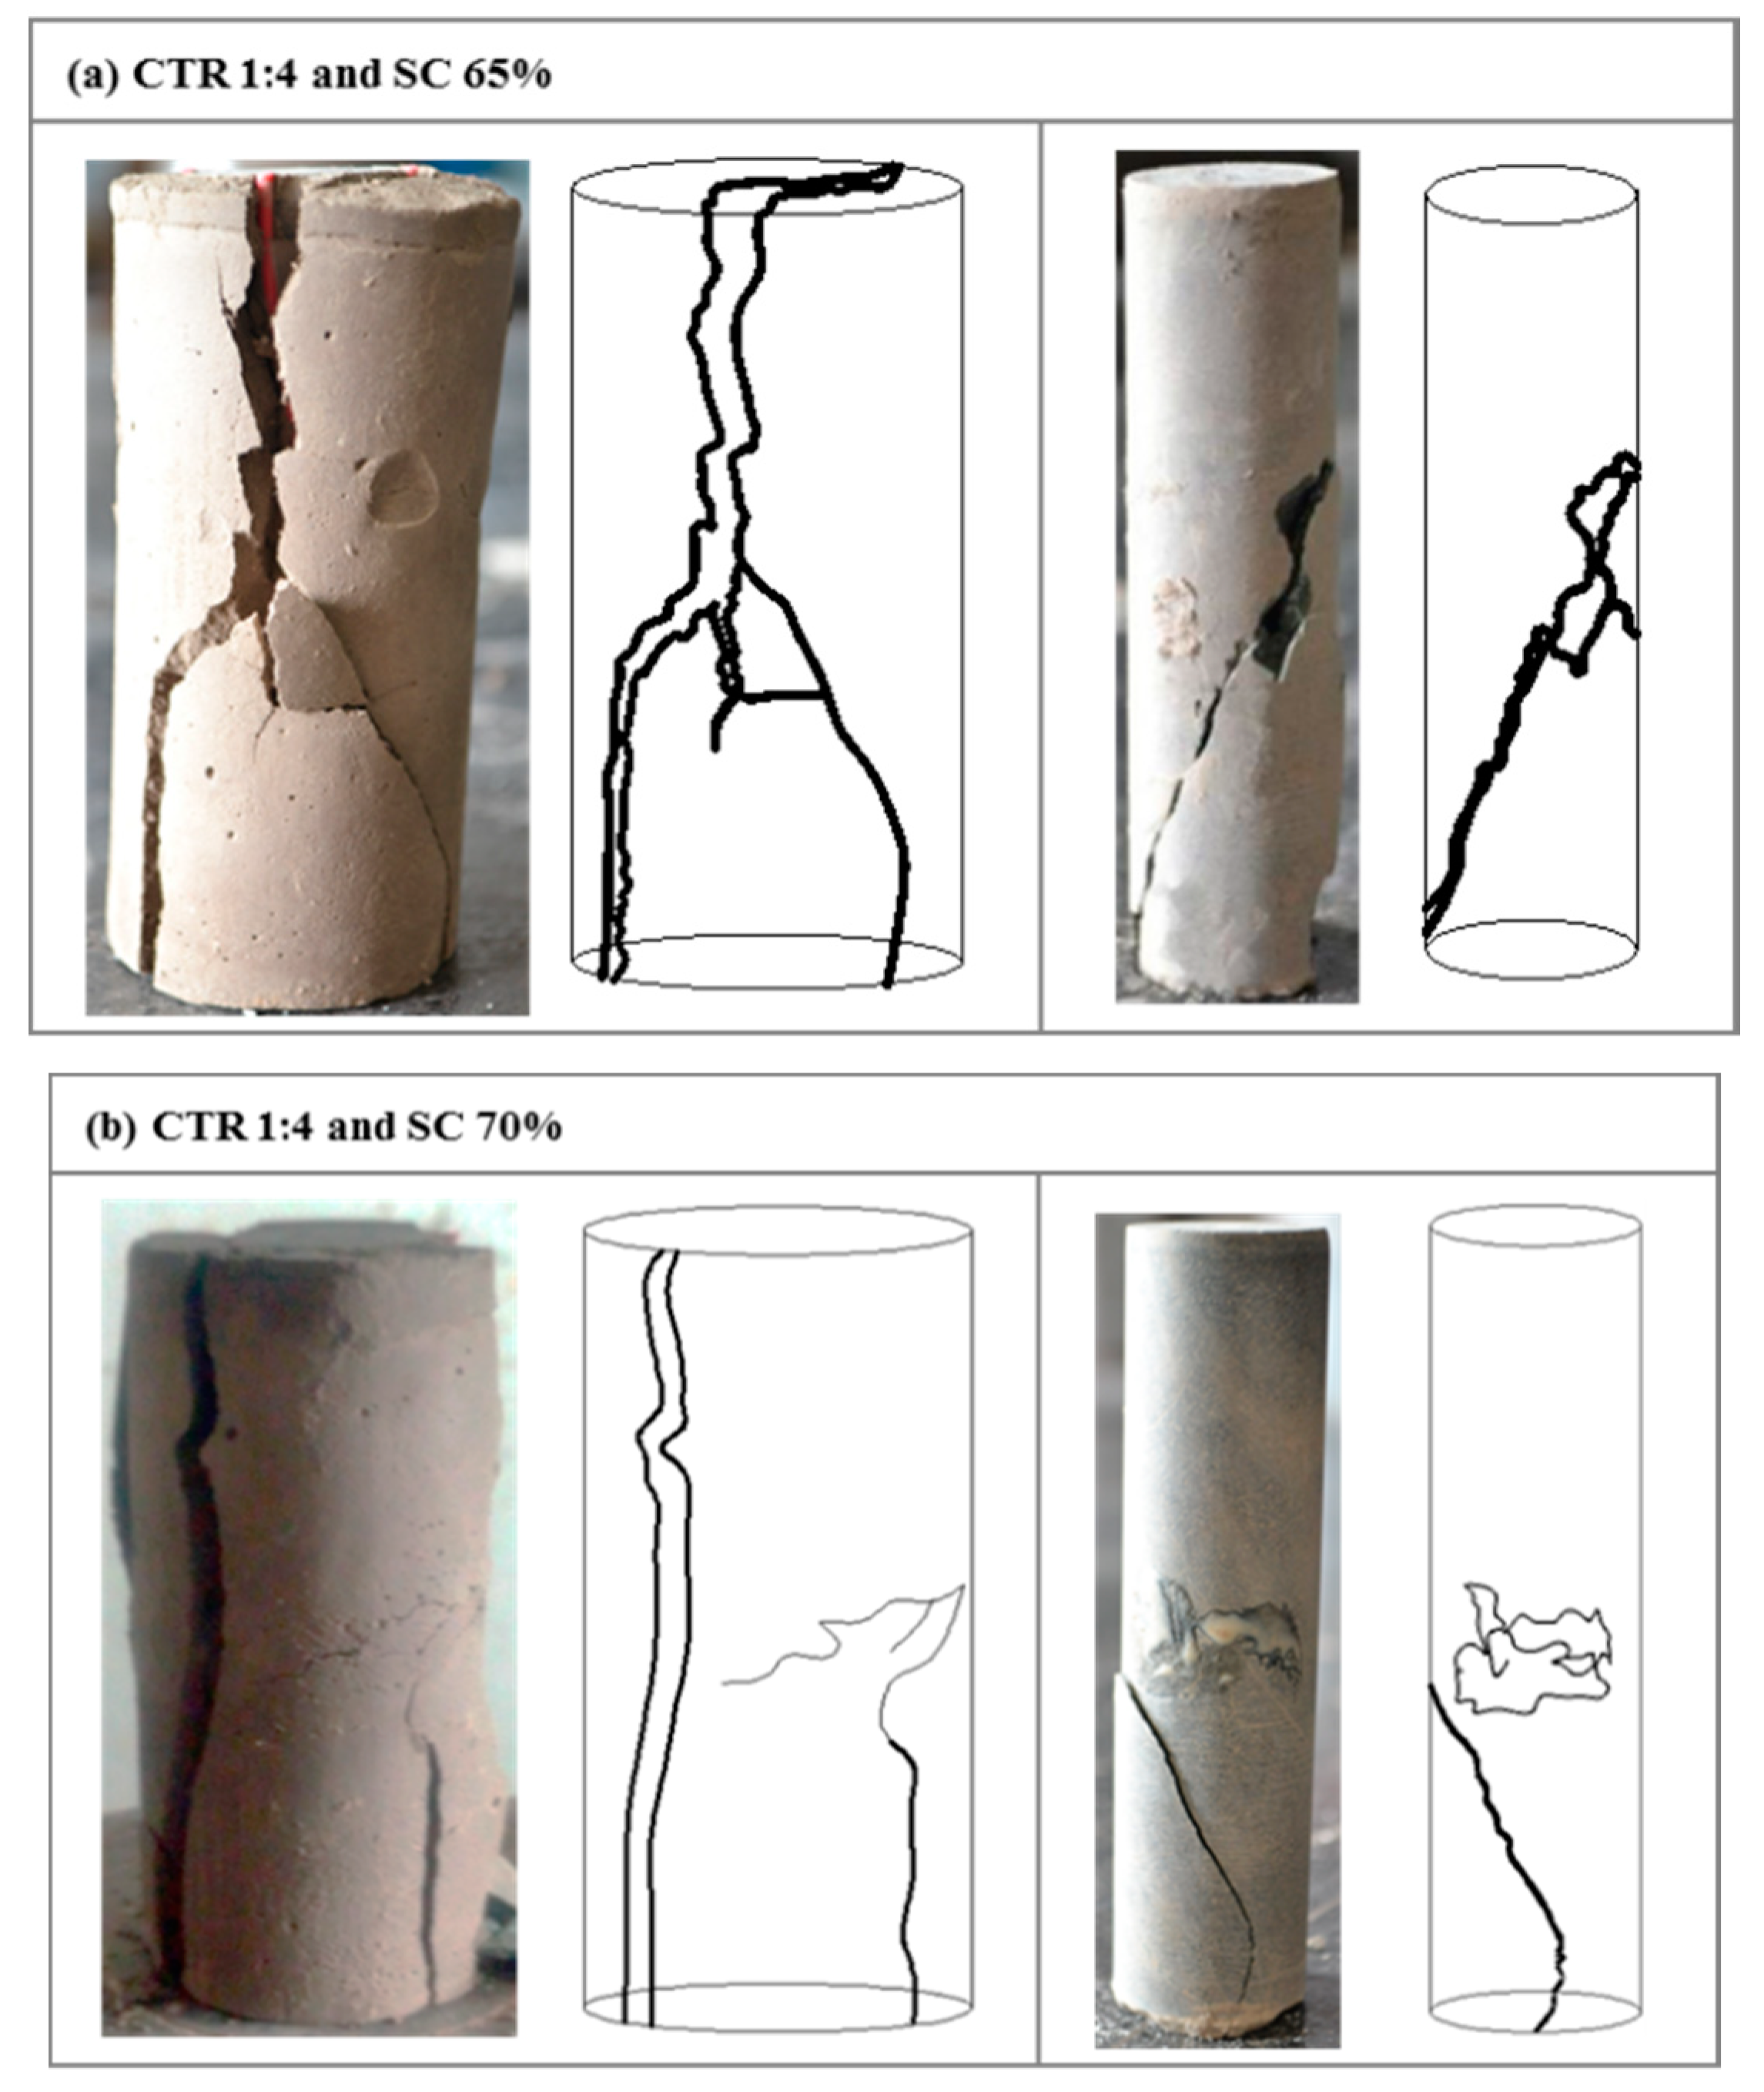
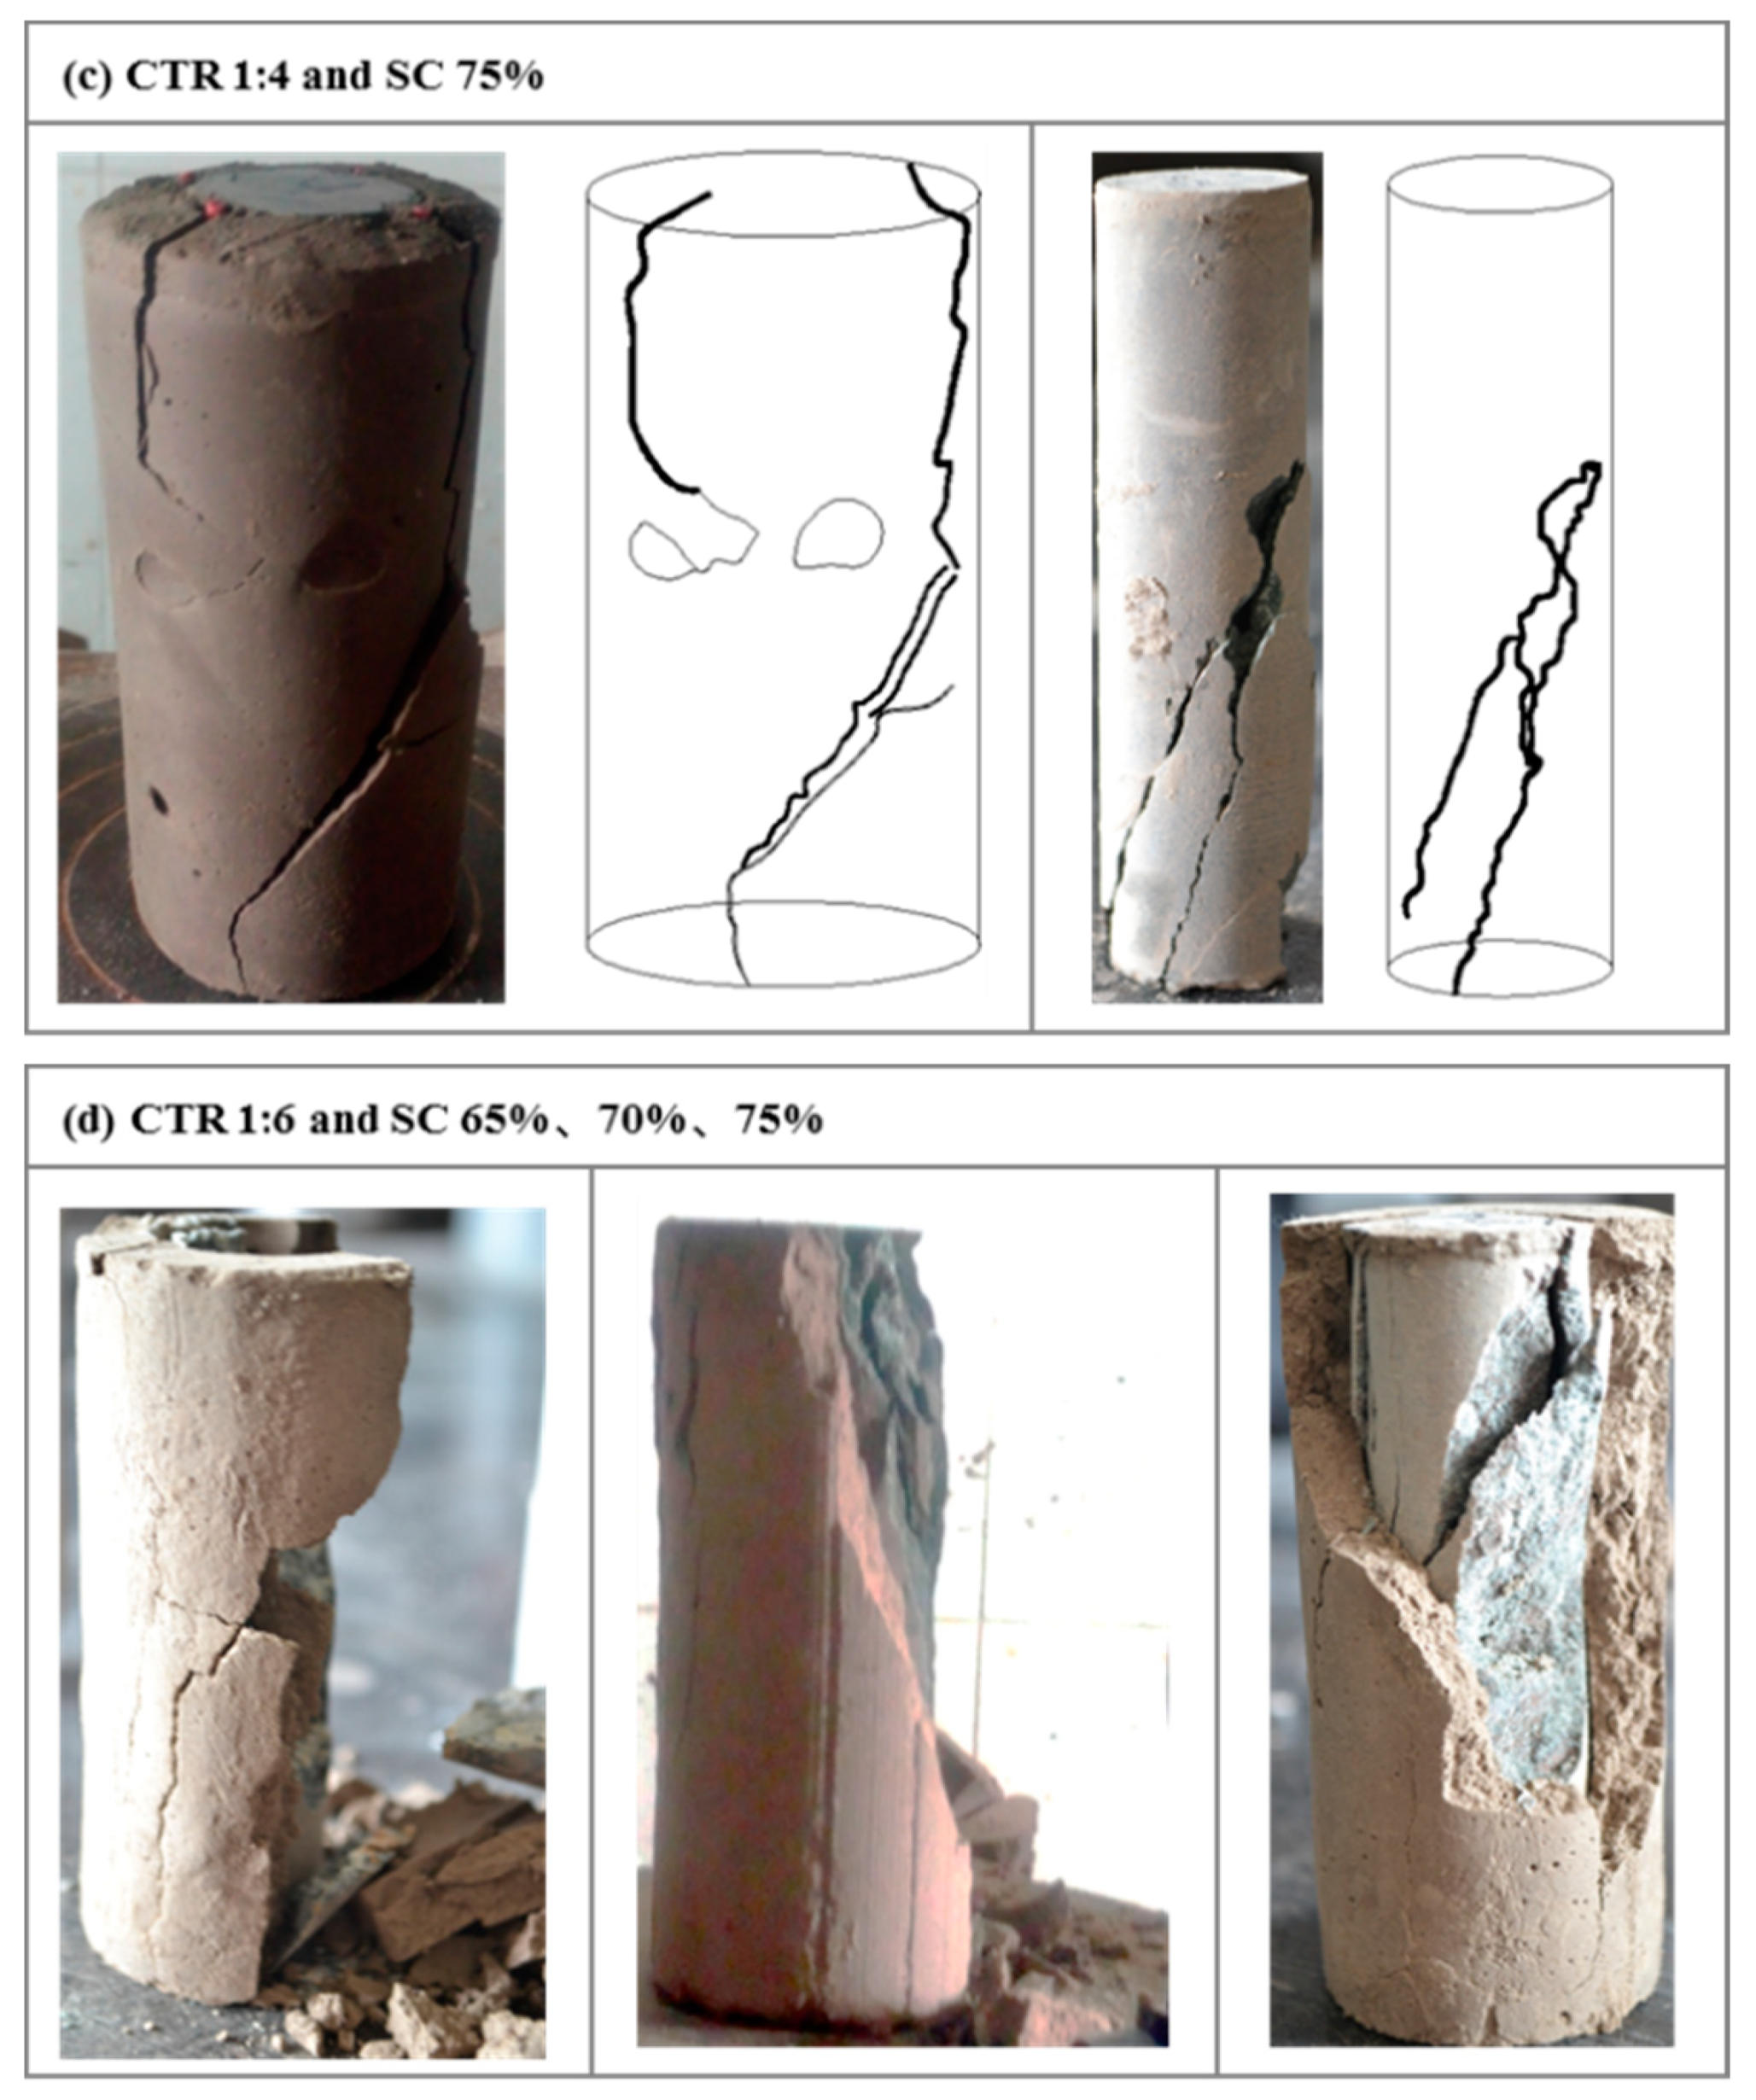
Figure 11.
Relationship of the CTR and SC on the UCS values of the CTB-RC specimens: (a) Relationship curve between the UCS values and CTR. (b) Relationship curve between the UCS values and SC.
Figure 11.
Relationship of the CTR and SC on the UCS values of the CTB-RC specimens: (a) Relationship curve between the UCS values and CTR. (b) Relationship curve between the UCS values and SC.

Figure 12.
Complete stress–strain curve of the CTB-RC specimen under the TSC test.
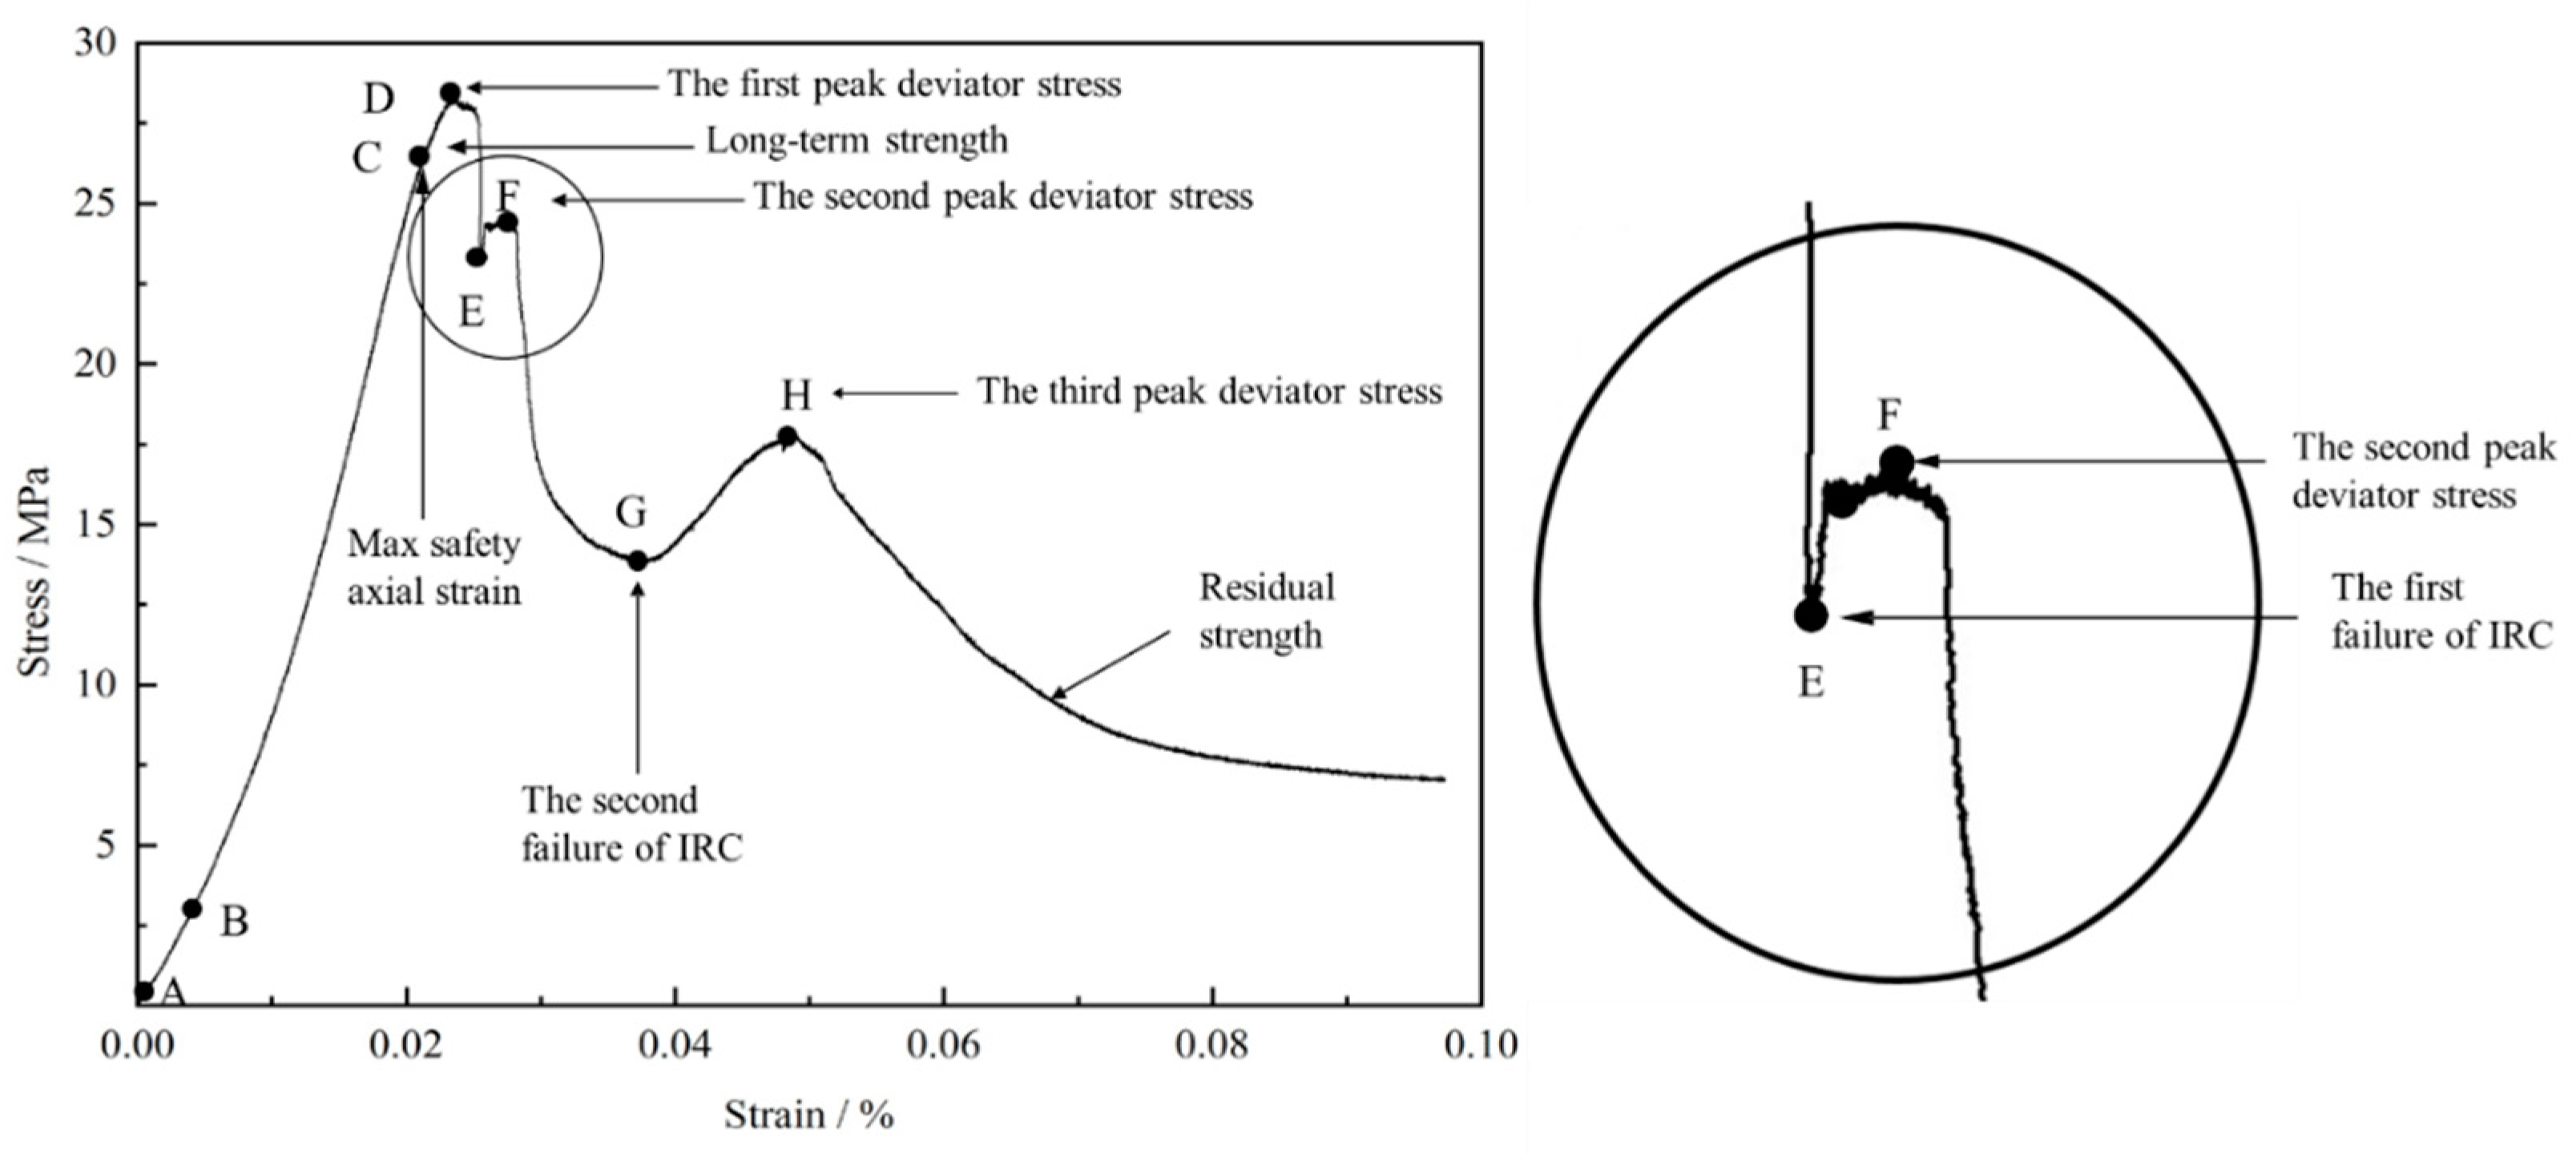
Figure 13.
Complete stress–strain curve of the rock samples under the TCS test. There is big difference in the peak deviator stress between the CTB-RC sample and the rock sample, which is caused by the origin source and type of the rock mass.
Figure 13.
Complete stress–strain curve of the rock samples under the TCS test. There is big difference in the peak deviator stress between the CTB-RC sample and the rock sample, which is caused by the origin source and type of the rock mass.
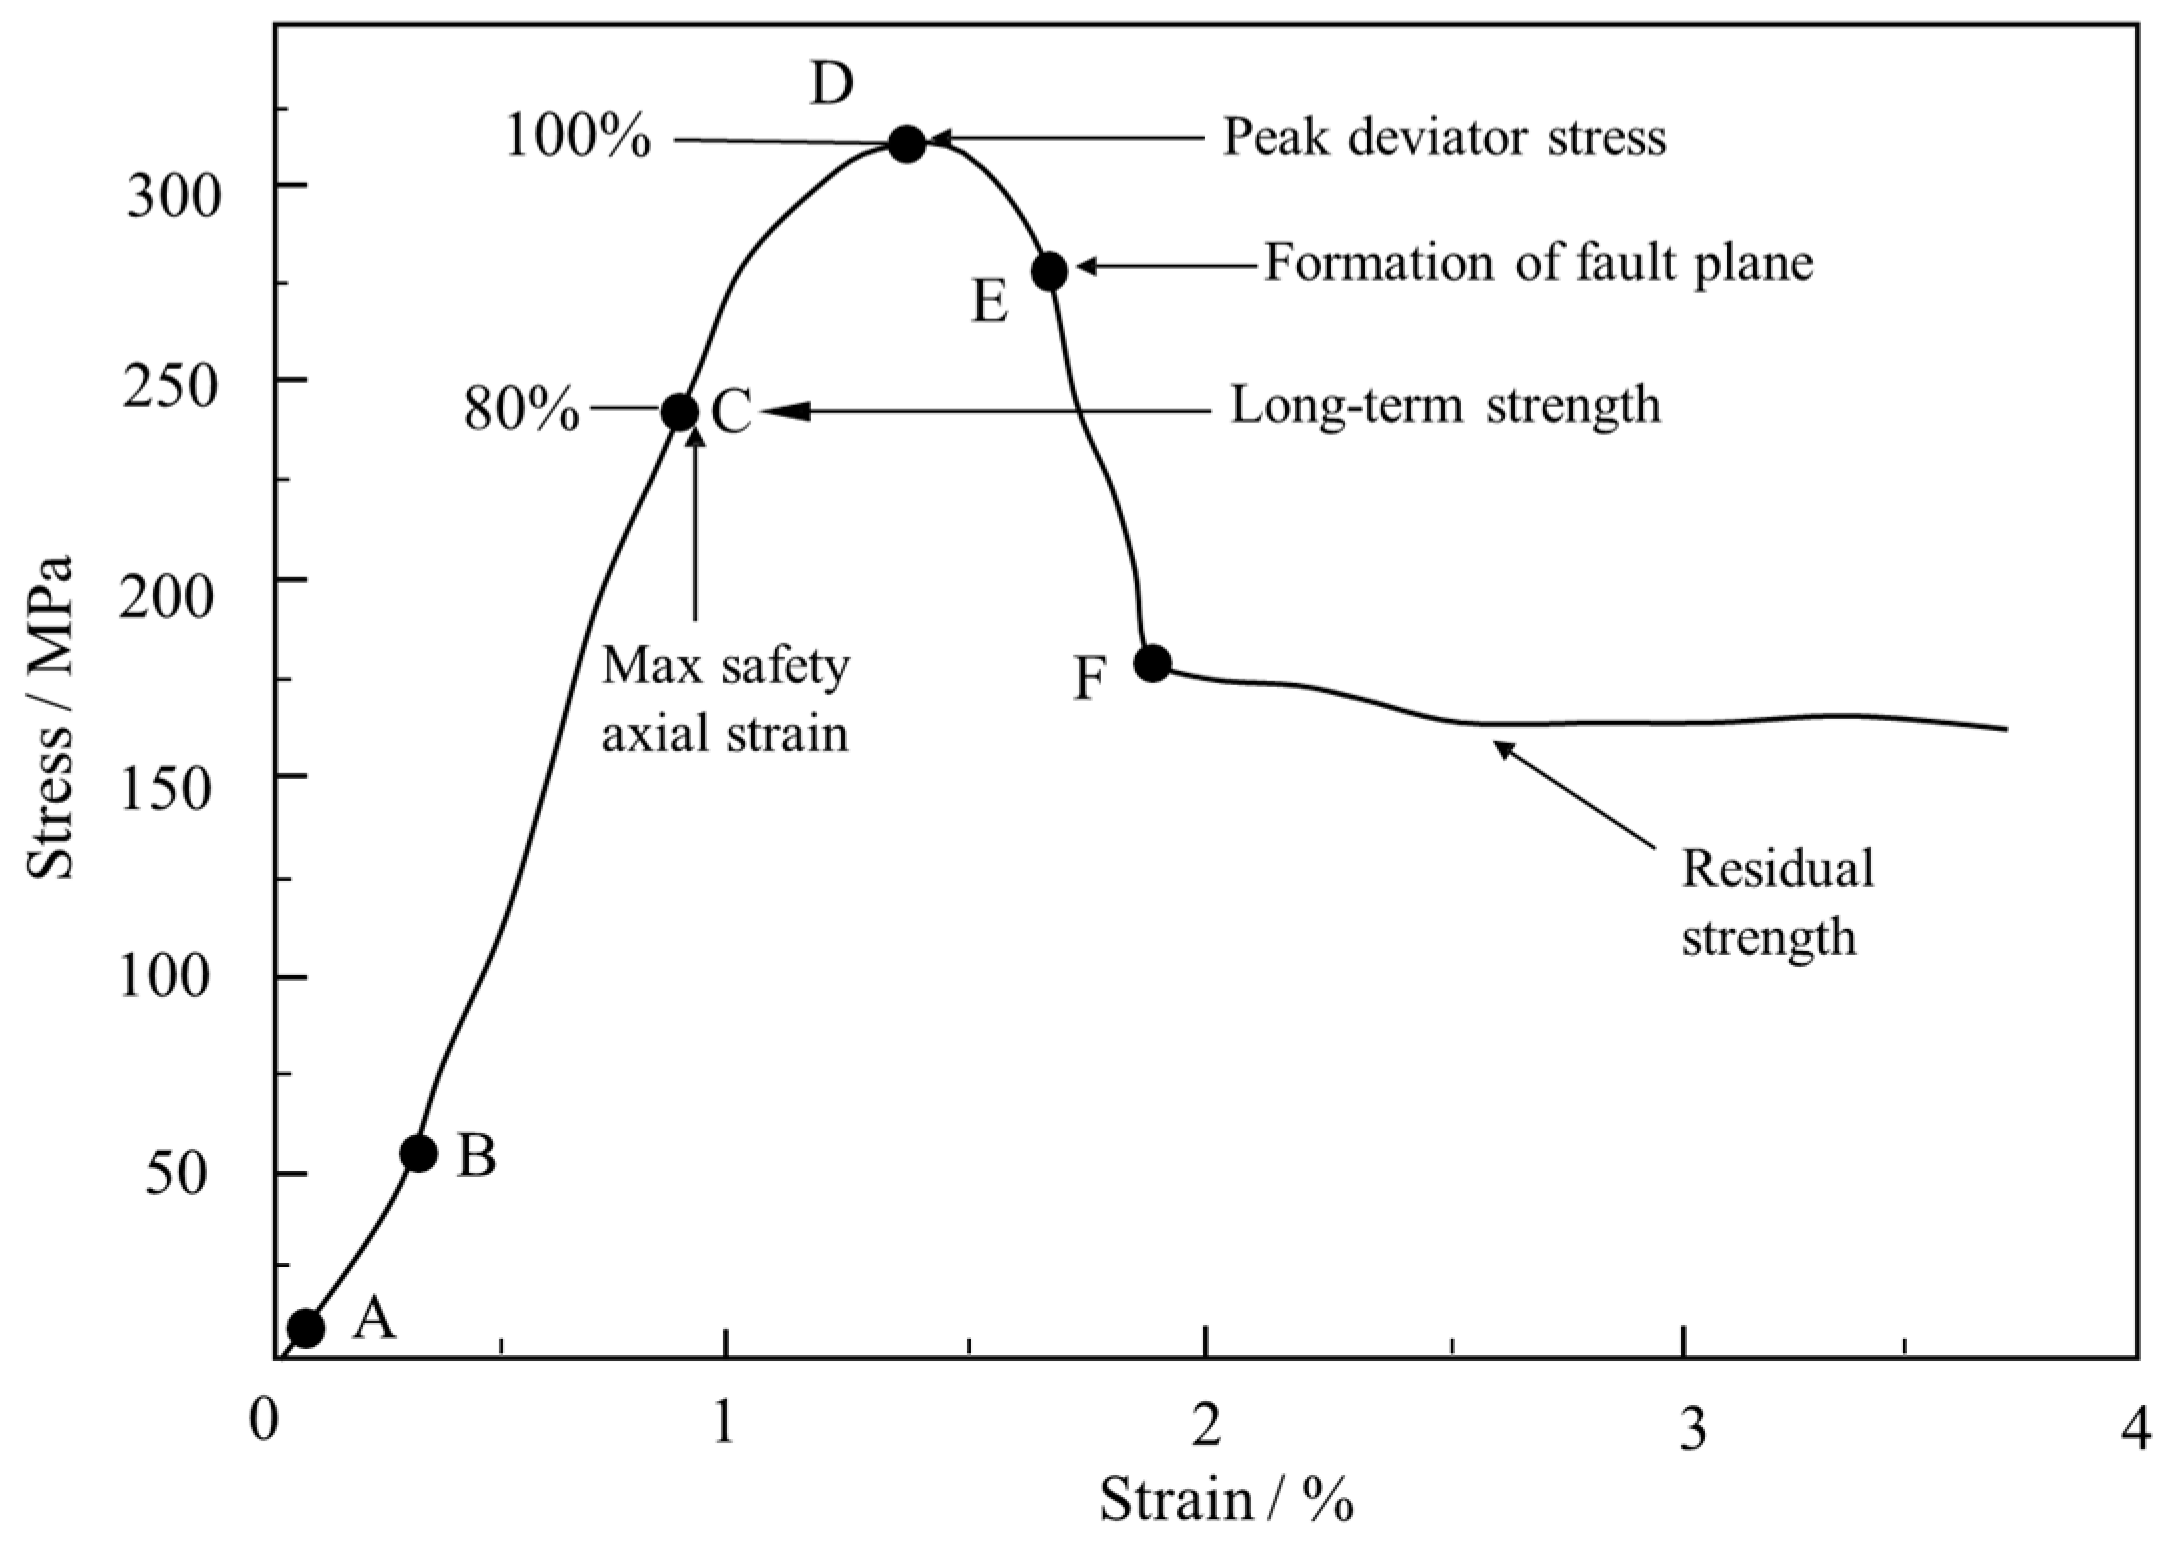
Figure 14.
Failure mode of the (a) external cement-tailing backfill (ECTB) and the (b) inner rock core (IRC) under the TCS test. Sketches were drawn manually according to the real cracks.
Figure 14.
Failure mode of the (a) external cement-tailing backfill (ECTB) and the (b) inner rock core (IRC) under the TCS test. Sketches were drawn manually according to the real cracks.
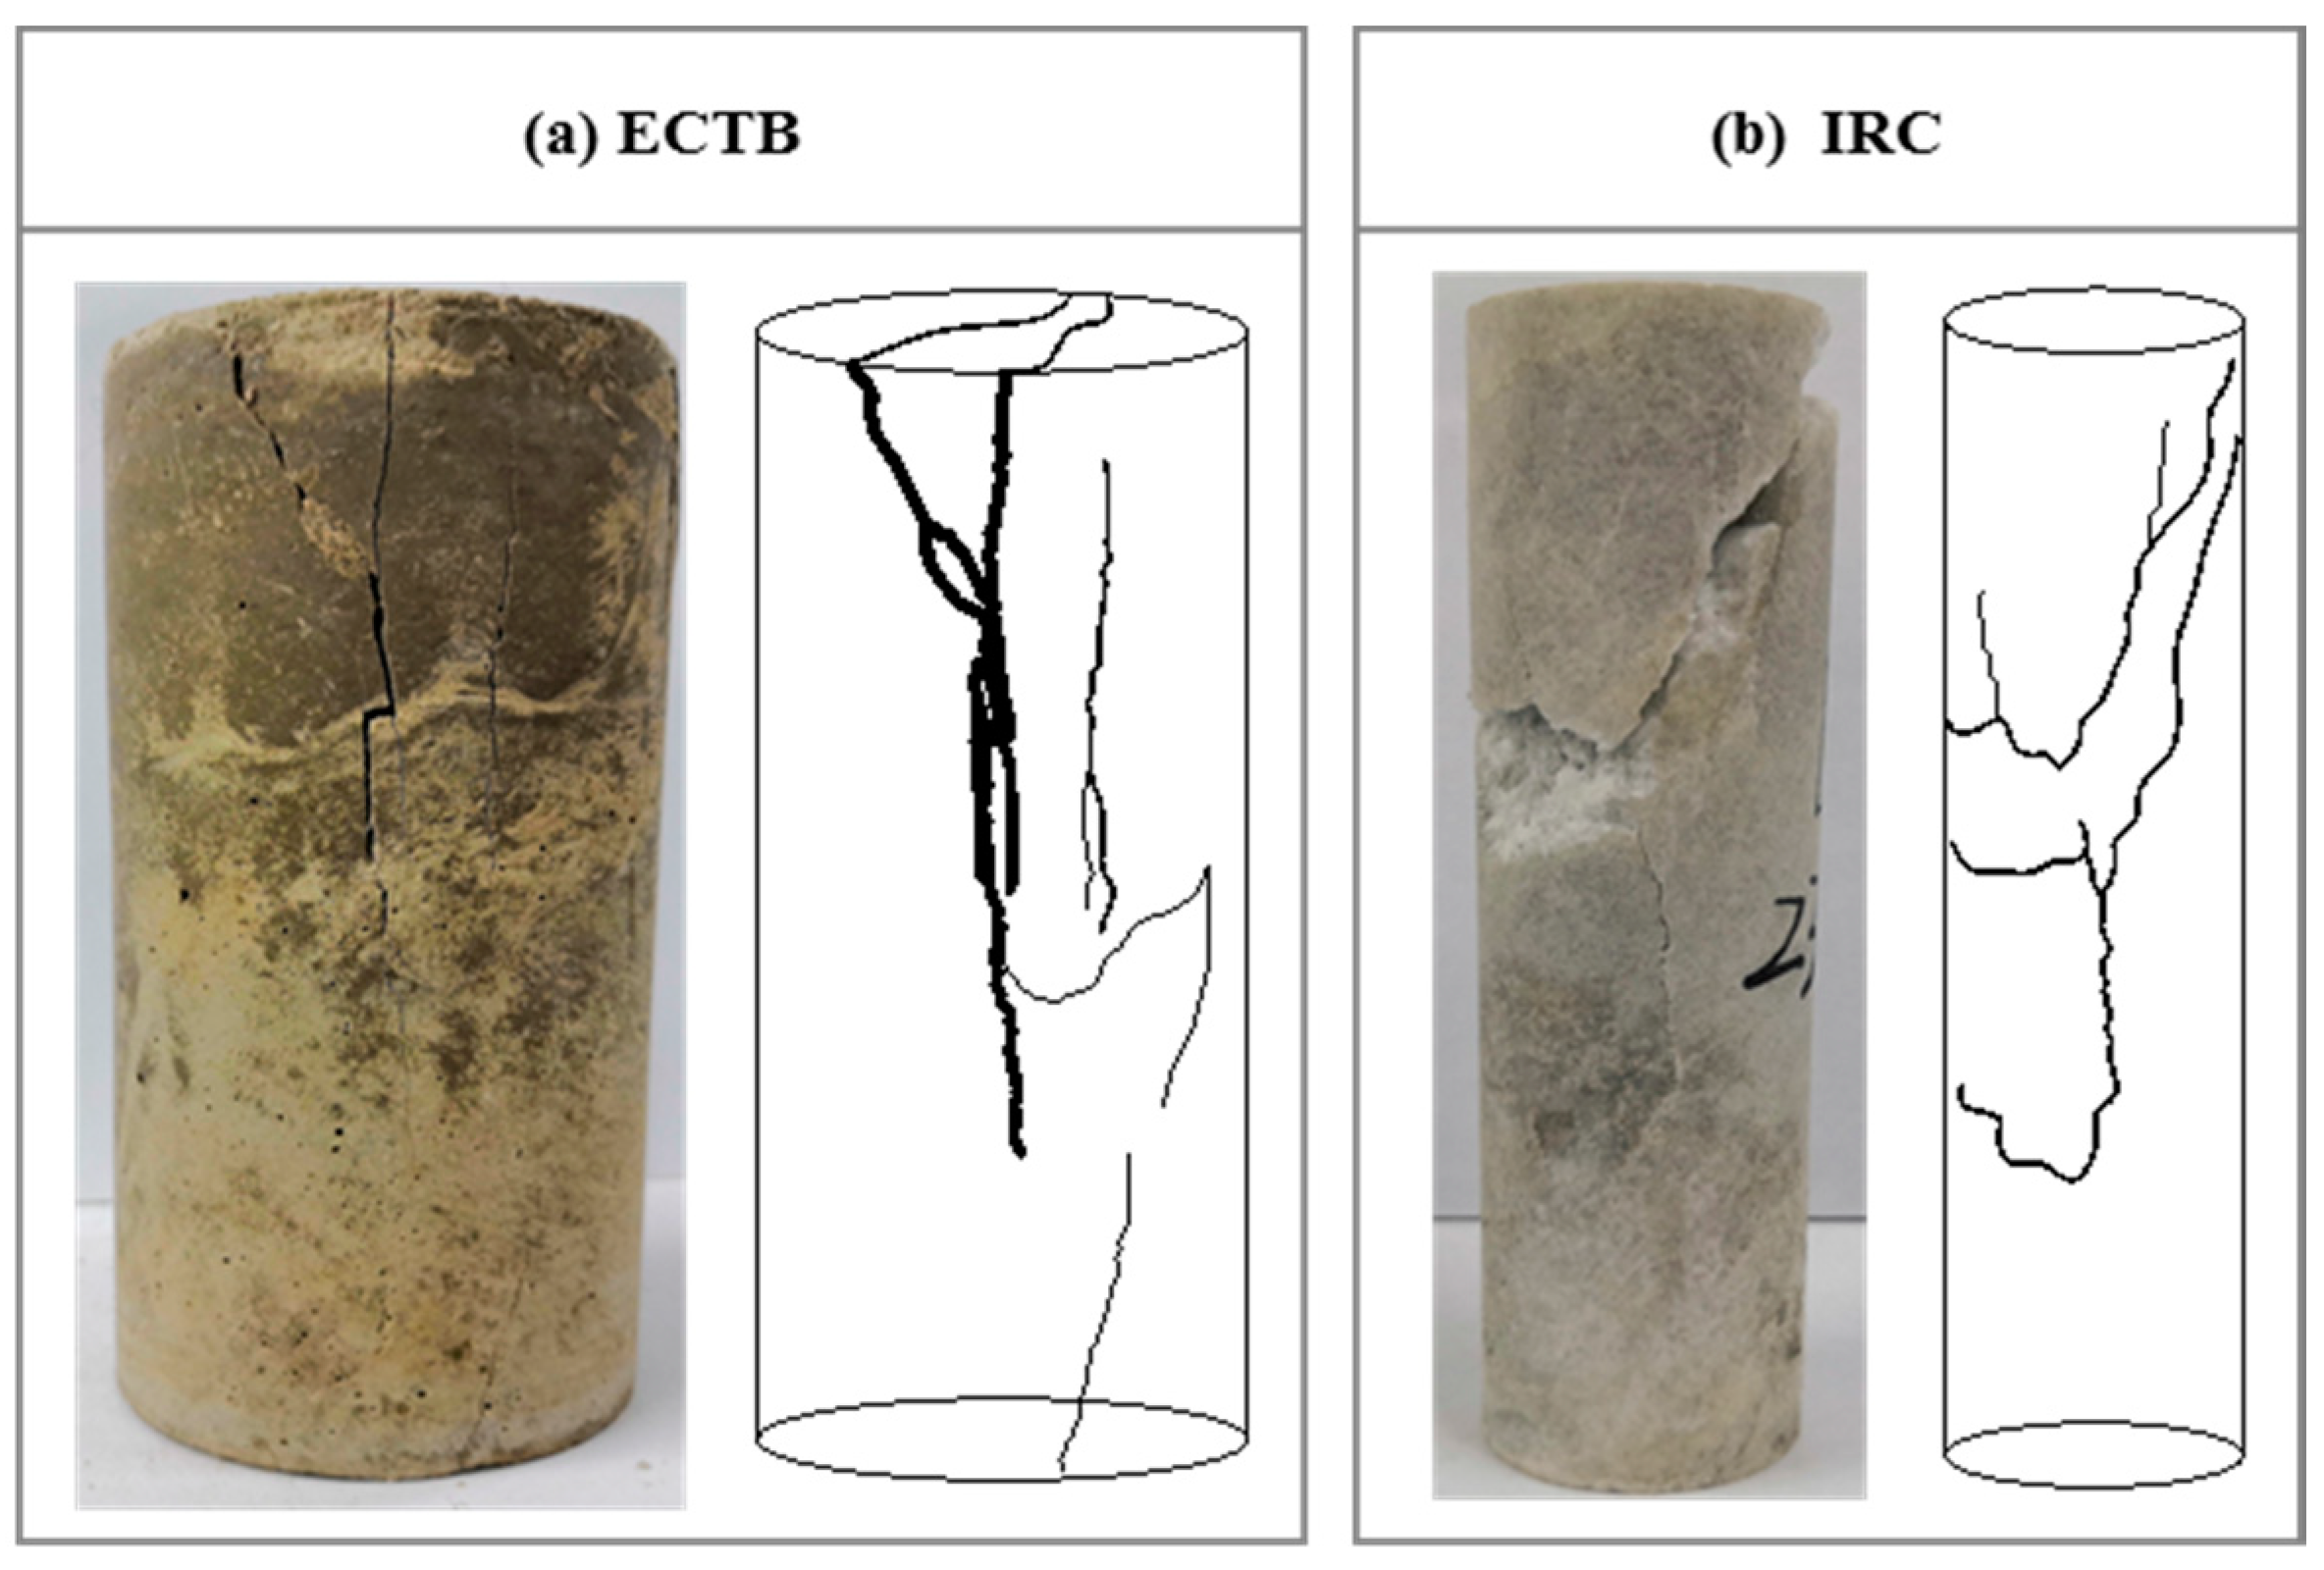
Figure 15.
The observation point of the ECTB and IRC before and after failure by the TSC test.
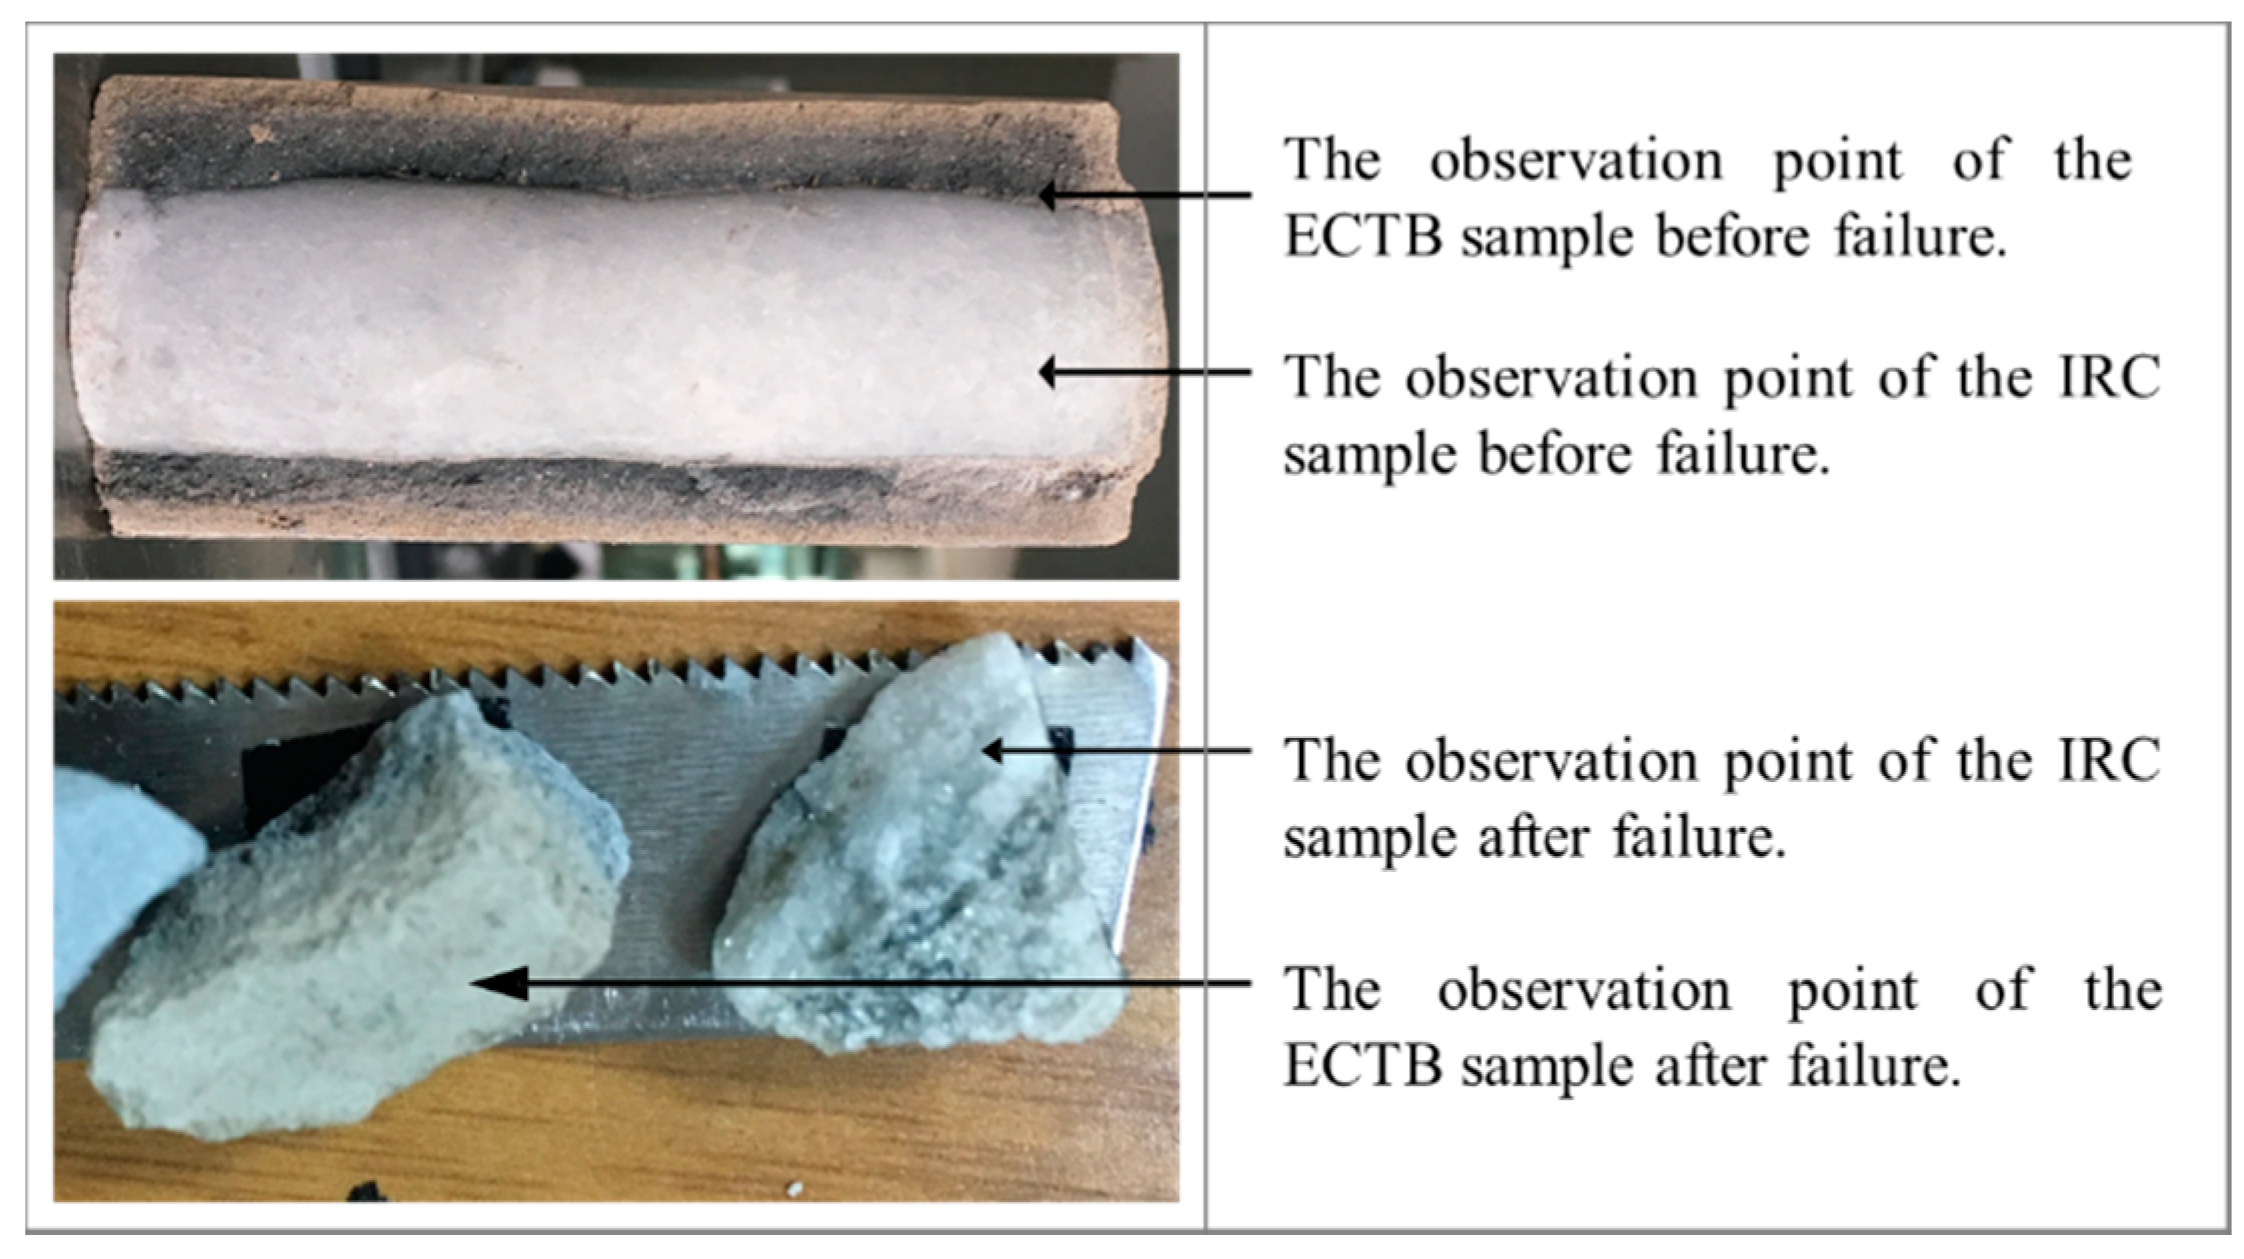
Figure 16.
Observation on the fracture surface of the IRC sample before and after failure by SEM. (a) Before failure: the granulite was mainly composed of a dense block and a layered structure, as well as some pores, (b) After failure: the fracture mainly exhibited friction, double-slip, and layered-slip morphology, pores are compacted.
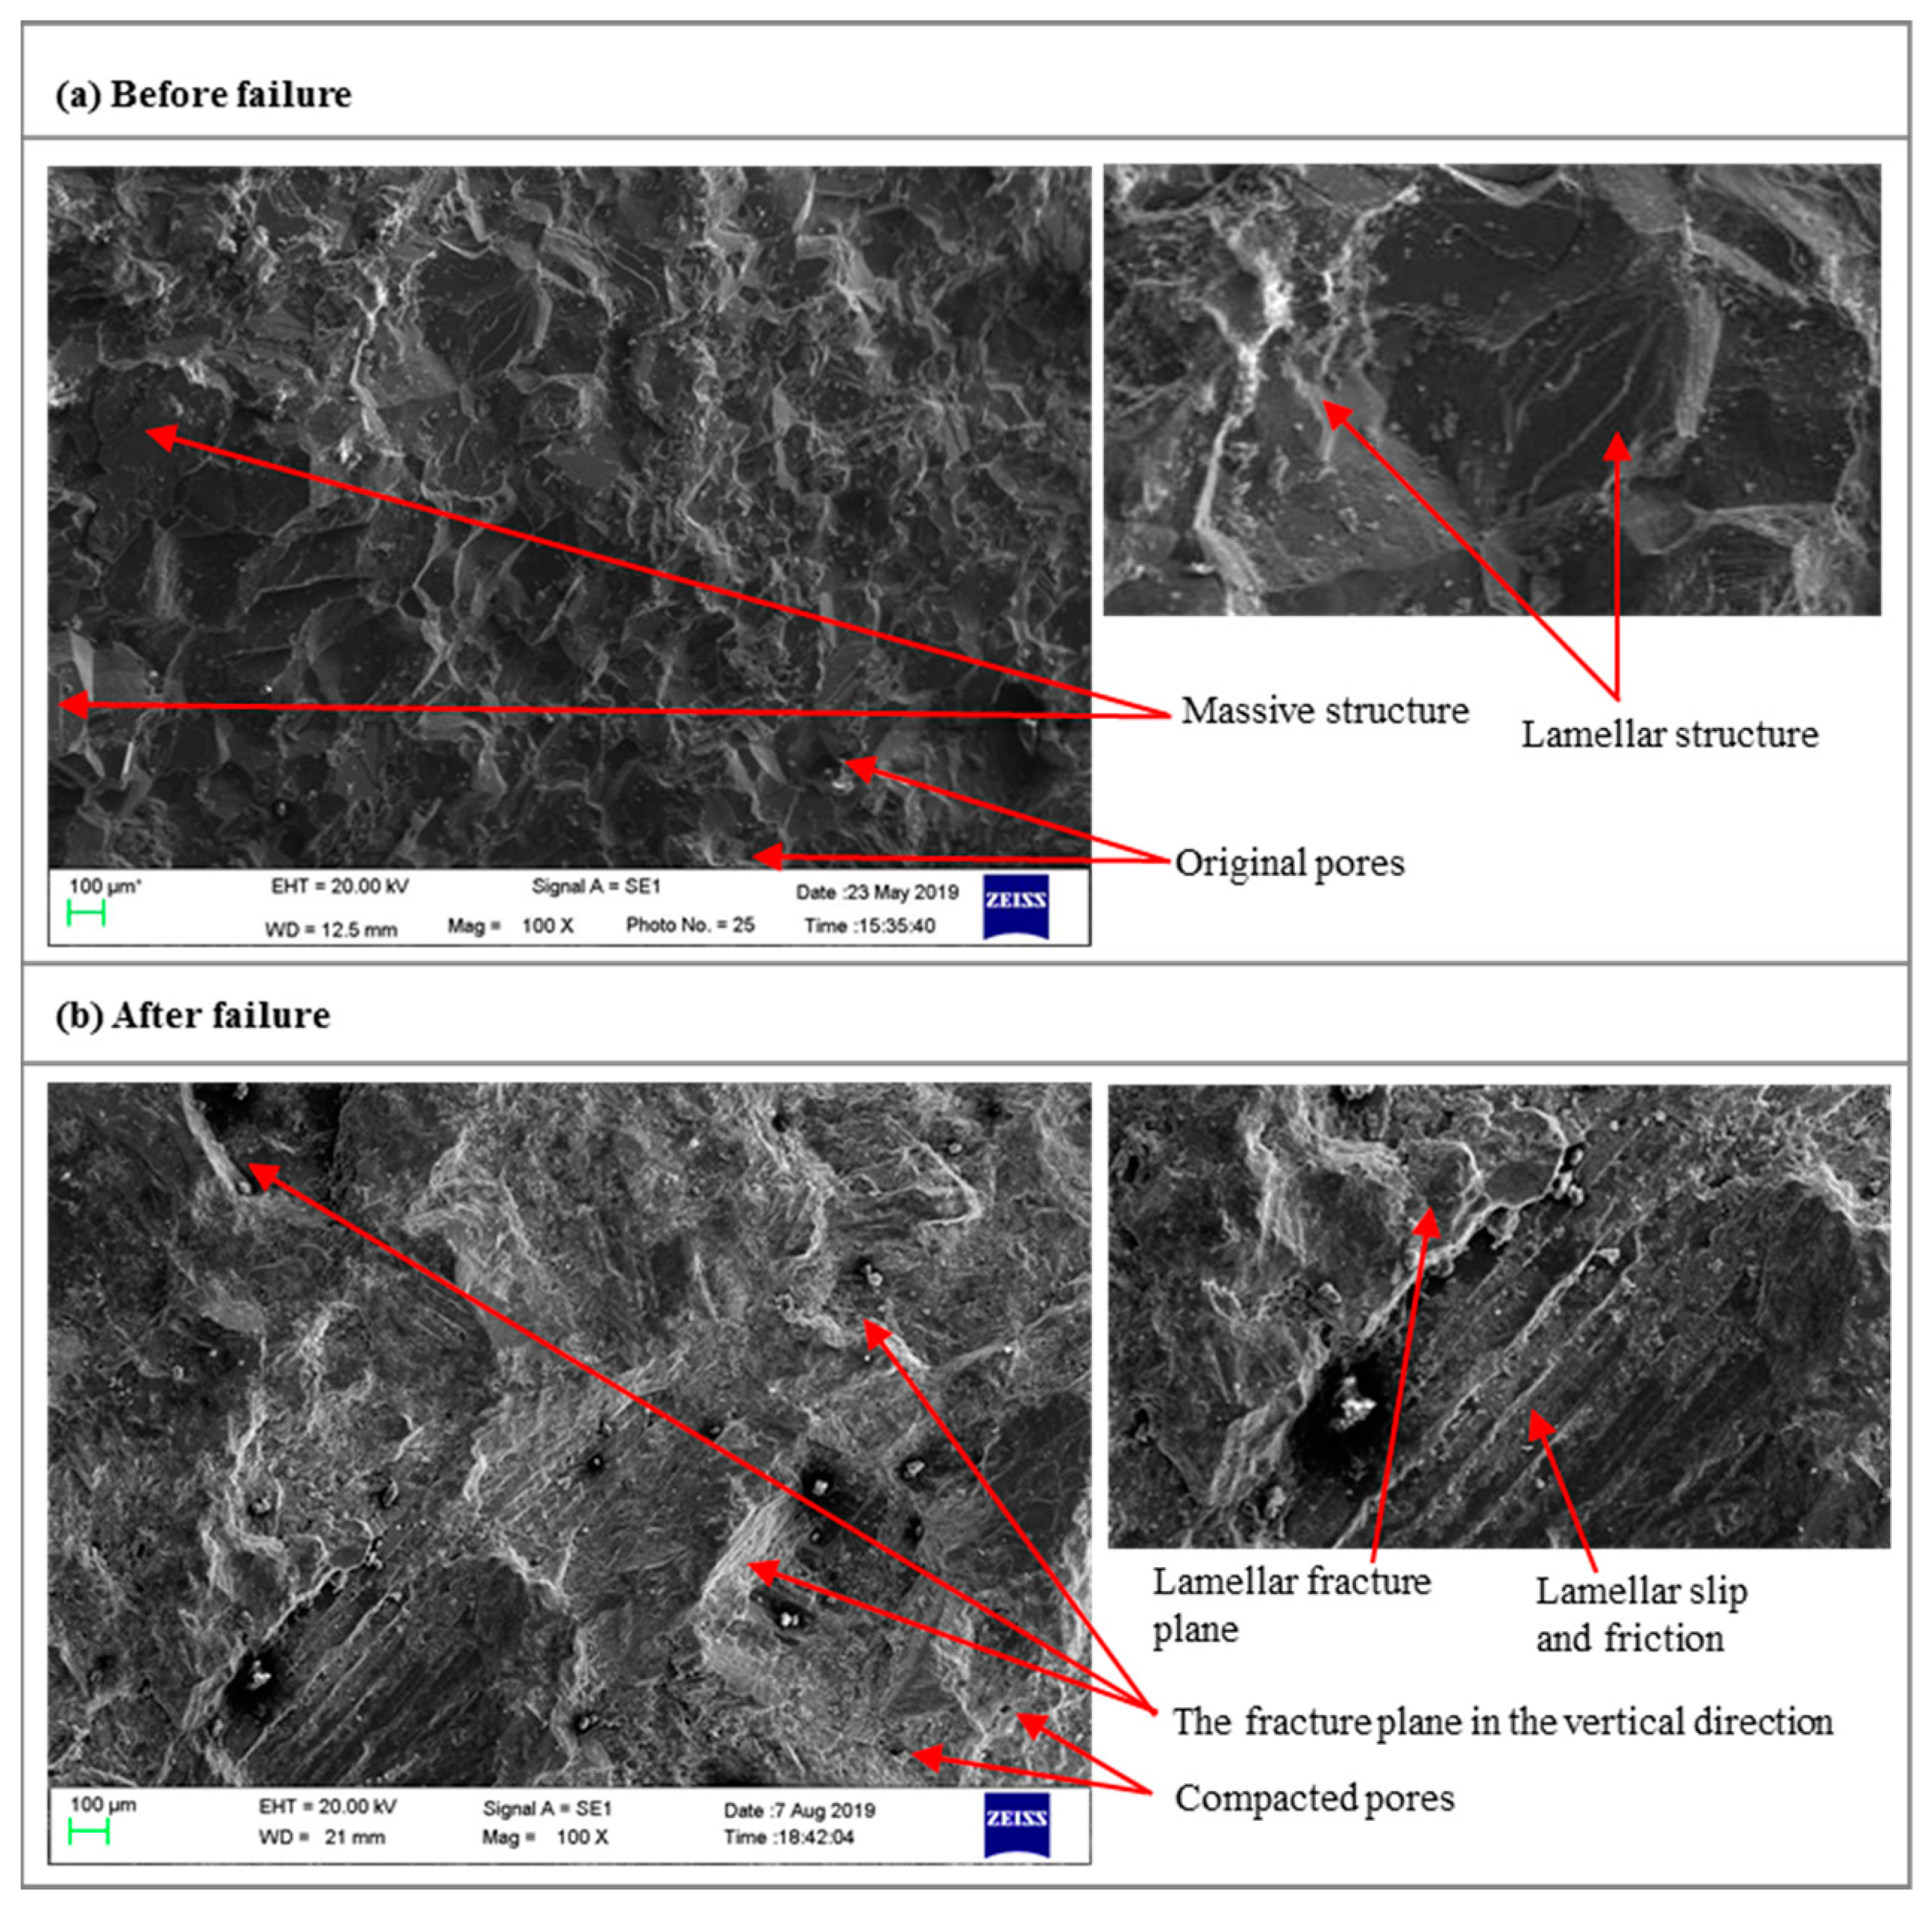
Figure 17.
Observation on the fracture surface of the ECTB sample before and after failure by SEM. (a) Before failure: cracks and fractures were developed and had many large pores, (b) After failure: fractures were strongly developed, exhibiting irregular crossing branches, and most of the larger pores were compressed or compacted.

Table 1.
Main chemical composition of the tailings (wt. %).
| SiO2 | K2O | Fe2O3 | Al2O3 | CaO | MgO | Na2O | CO2 |
| 62.9 | 5.86 | 1.16 | 15.2 | 2.31 | 0.90 | 3.10 | 7.20 |
| Cl | TiO2 | Cr2O3 | MnO | NiO | SrO | BaO | ZrO2 |
| 0.55 | 0.22 | 0.04 | 0.03 | 0.02 | 0.20 | 0.30 | 0.01 |
Table 2.
Chemical composition of Portland cement PC 32.5R (wt. %)
| CaO | Al2O3 | SiO2 | Fe2O3 | MgO | SiO3 | Na2O | K2O | TiO2 |
|---|---|---|---|---|---|---|---|---|
| 62.19 | 4.67 | 21.56 | 3.69 | 2.87 | 1.91 | 0.21 | 0.68 | 0.16 |
Table 3.
Main minerals of the rock core (RC) specimens (wt. %).
| NO. | Smectite | Illite | Kaolinite | Chlorite | Quartz | Potash Feldspar | Plagioclase | Calcite |
|---|---|---|---|---|---|---|---|---|
| 1 | - | 13 | 34 | 14 | 2 | 13 | 21 | - |
| 2 | - | 4 | 41 | 12 | 6 | 17 | 13 | 5 |
| 3 | 31 | 13 | 8 | 3 | 10 | - | - | 44 |
| 4 | 29 | 33 | 2 | 2 | 2 | 16 | 2 | 8 |
| 5 | - | 12 | 19 | 15 | 6 | - | 48 | - |
Table 4.
Number of CTB-RC specimens of different CTR and SC values.
| Number of CTB-RC Specimens | CTR1:4 | CTR1:6 | CTR1:8 |
|---|---|---|---|
| SC 65% | 1 | 1 | 1 |
| SC 70% | 1 | 1 | 1 |
| SC 75% | 4 | 1 | 1 |
Table 5.
The UCS values of different types of specimens.
| Specimens | Size | SC | UCS Values/MPa | |||
|---|---|---|---|---|---|---|
| Diameter/mm | Hight/mm | CTR1:4 | CTR1:6 | CTR1:8 | ||
| CTB-RC specimens | 50 | 100 | 65% | 23.87 | 23.10 | 21.52 |
| 70% | 25.99 | 25.31 | 24.25 | |||
| 75% | 27.66 | 26.71 | 25.55 | |||
| CTB specimens | 50 | 100 | 65% | 1.72 | 1.34 | 1.05 |
| 70% | 1.95 | 2.13 | 1.78 | |||
| 75% | 3.38 | 2.96 | 2.07 | |||
| RC specimen A | 50 | 100 | - | 67.42 | ||
| RC specimen B | 25 | 100 | - | 18.74 | ||
© 2020 by the authors. Licensee MDPI, Basel, Switzerland. This article is an open access article distributed under the terms and conditions of the Creative Commons Attribution (CC BY) license (http://creativecommons.org/licenses/by/4.0/).
Share and Cite
MDPI and ACS Style
Tan, Y.-y.; Zhang, K.; Yu, X.; Song, W.-d.; Wang, J.; Hai, C.-l. The Mechanical and Microstructural Properties of Composite Structures Made of a Cement-Tailing Backfill and Rock Core. Minerals 2020, 10, 159. https://doi.org/10.3390/min10020159
AMA Style
Tan Y-y, Zhang K, Yu X, Song W-d, Wang J, Hai C-l. The Mechanical and Microstructural Properties of Composite Structures Made of a Cement-Tailing Backfill and Rock Core. Minerals. 2020; 10(2):159. https://doi.org/10.3390/min10020159
Chicago/Turabian StyleTan, Yu-ye, Kai Zhang, Xin Yu, Wei-dong Song, Jie Wang, and Cheng-long Hai. 2020. "The Mechanical and Microstructural Properties of Composite Structures Made of a Cement-Tailing Backfill and Rock Core" Minerals 10, no. 2: 159. https://doi.org/10.3390/min10020159
Note that from the first issue of 2016, this journal uses article numbers instead of page numbers. See further details here.