Interphase REE Partitioning at the Boundary between the Earth’s Transition Zone and Lower Mantle: Evidence from Experiments and Atomistic Modeling

Abstract
:1. Introduction
2. Materials and Methods
3. Results
3.1. Textural Relationships, Phase Assemblages, and Major-Element Compositions of Minerals in Run Products
3.2. REE Composition
3.3. Computational Results
4. Discussion
5. Conclusions
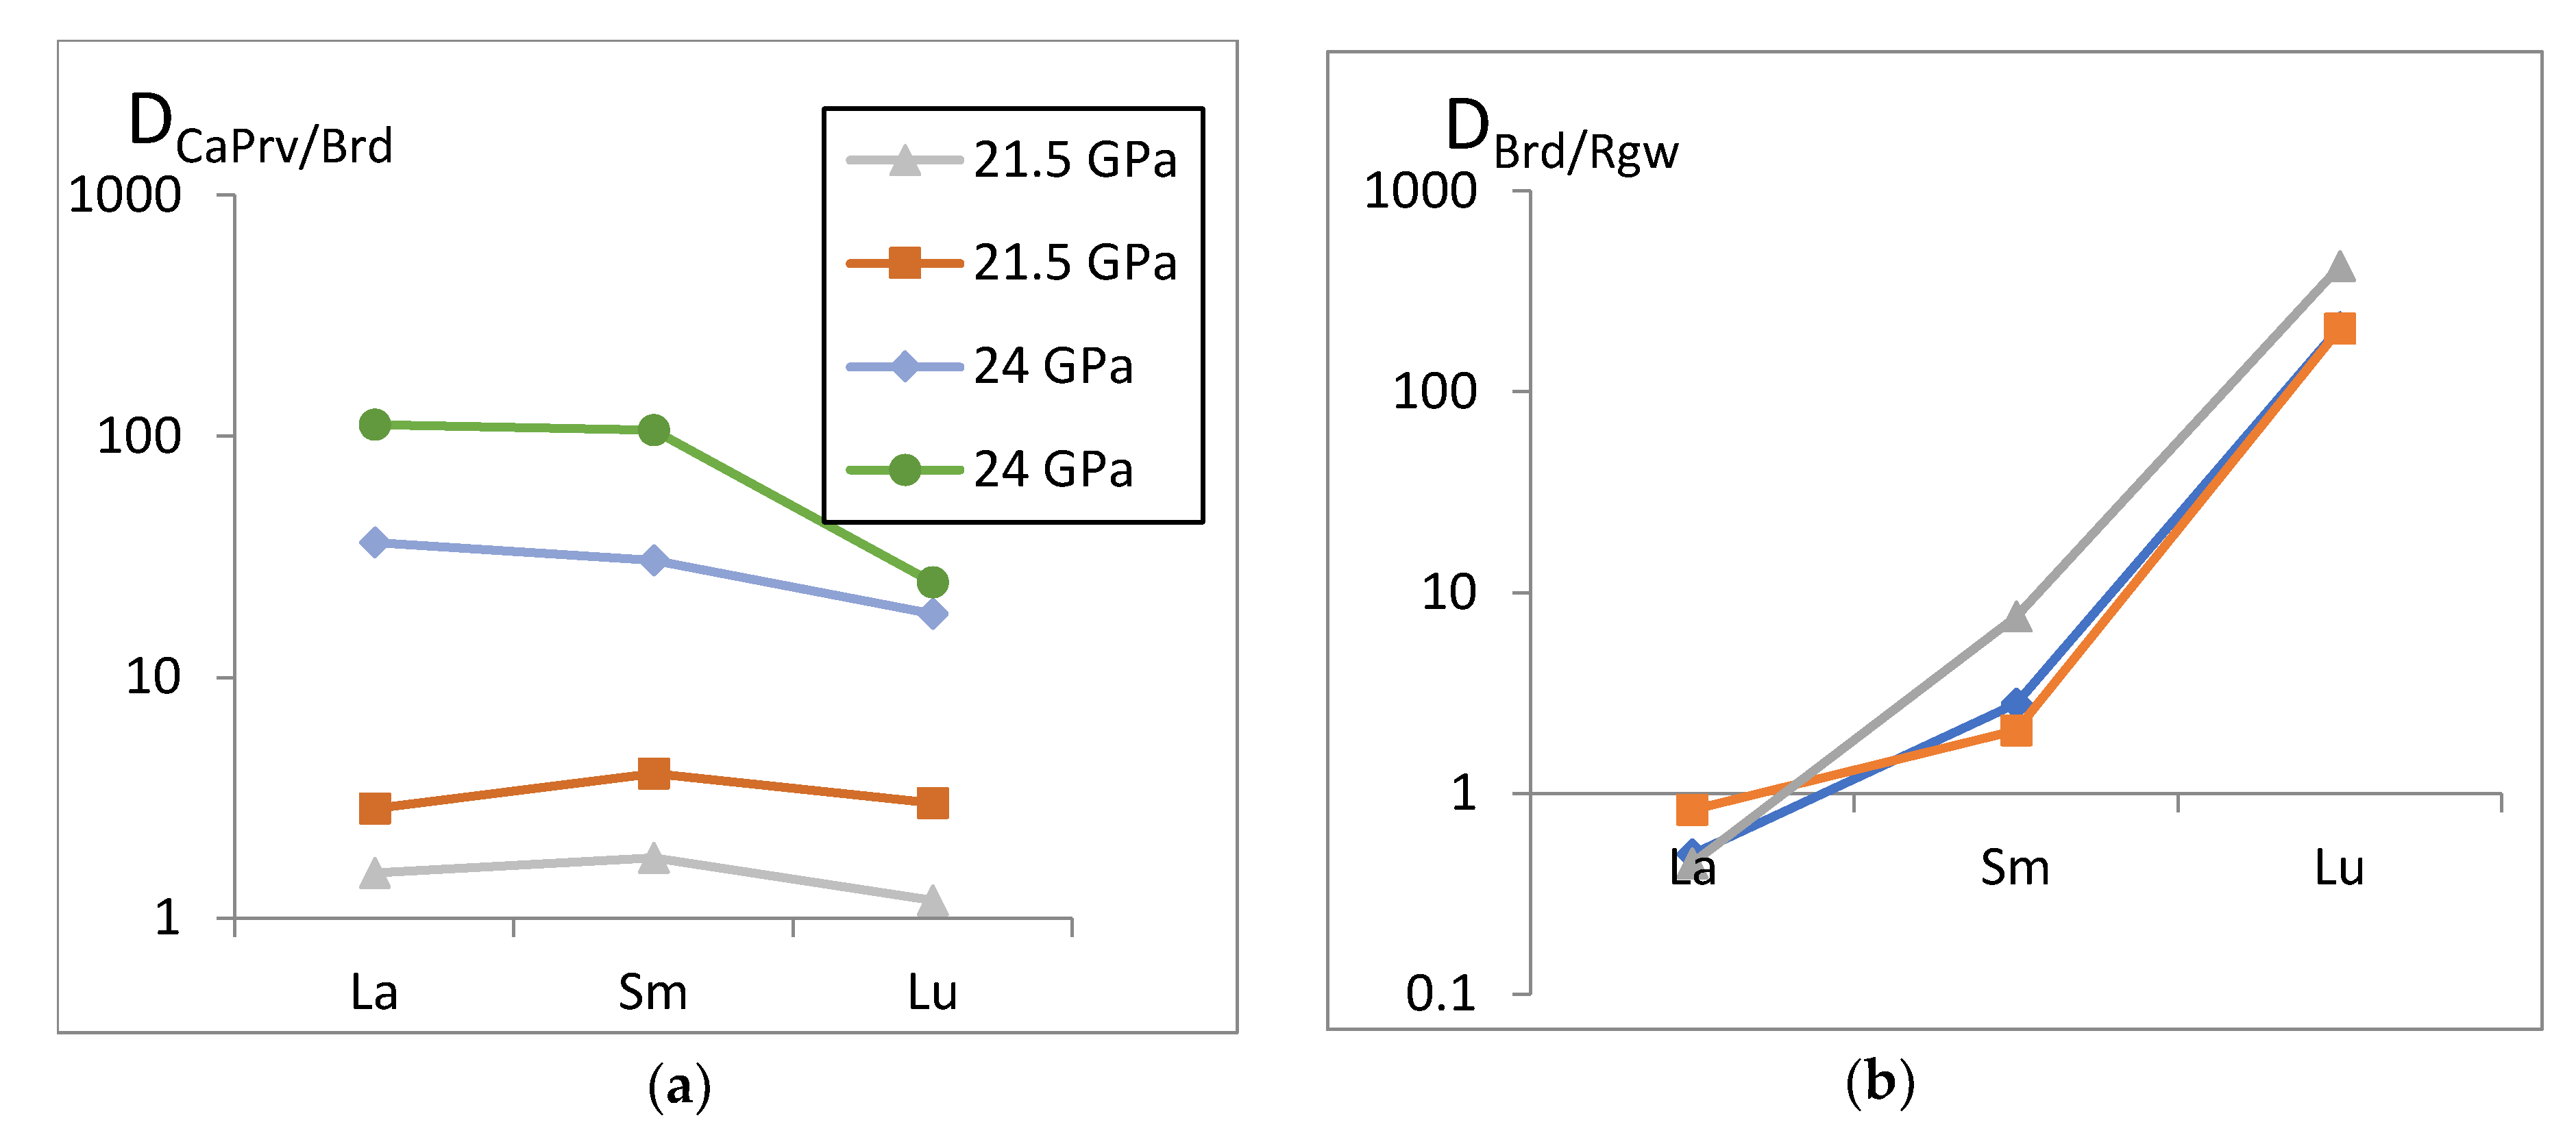
- We performed high-pressure experiments to study the phase relations in key solid-phase reactions CaMgSi2O6 = CaSiO3-perovskite + MgSiO3-bridgmanite and (Mg,Fe)2SiO4-ringwoodite = (Mg,Fe)SiO3-bridgmanite + (Mg,Fe)O with addition of 1 wt % of REE oxides. It was shown that HREE (Er, Tm, Yb, and Lu) are mostly accumulated in bridgmanite, while LREE are predominantly redistributed into CaSiO3. Interphase REE partition coefficients in solid-state reactions were calculated at 21.5 and 24 GPa for the first time.
- The thermodynamic mixing properties of MgSiO3 and CaSiO3 solid solutions containing REE were calculated using a semi-empirical method in supercells. Atomistic modeling displayed the ideal model for the high-pressure minerals. Predominant distribution of HREE (Er, Tm, Yb, and Lu) into bridgmanite and LREE into CaSiO3-perovskite is explained by the proximity of the ionic radii of Er, Tm, Yb, and Lu to Mg, rather than to Ca. Our calculations show that the isomorphic capacity of the studied phases for REE decreases with pressure, in accordance with the rule of depression of isomorphism.
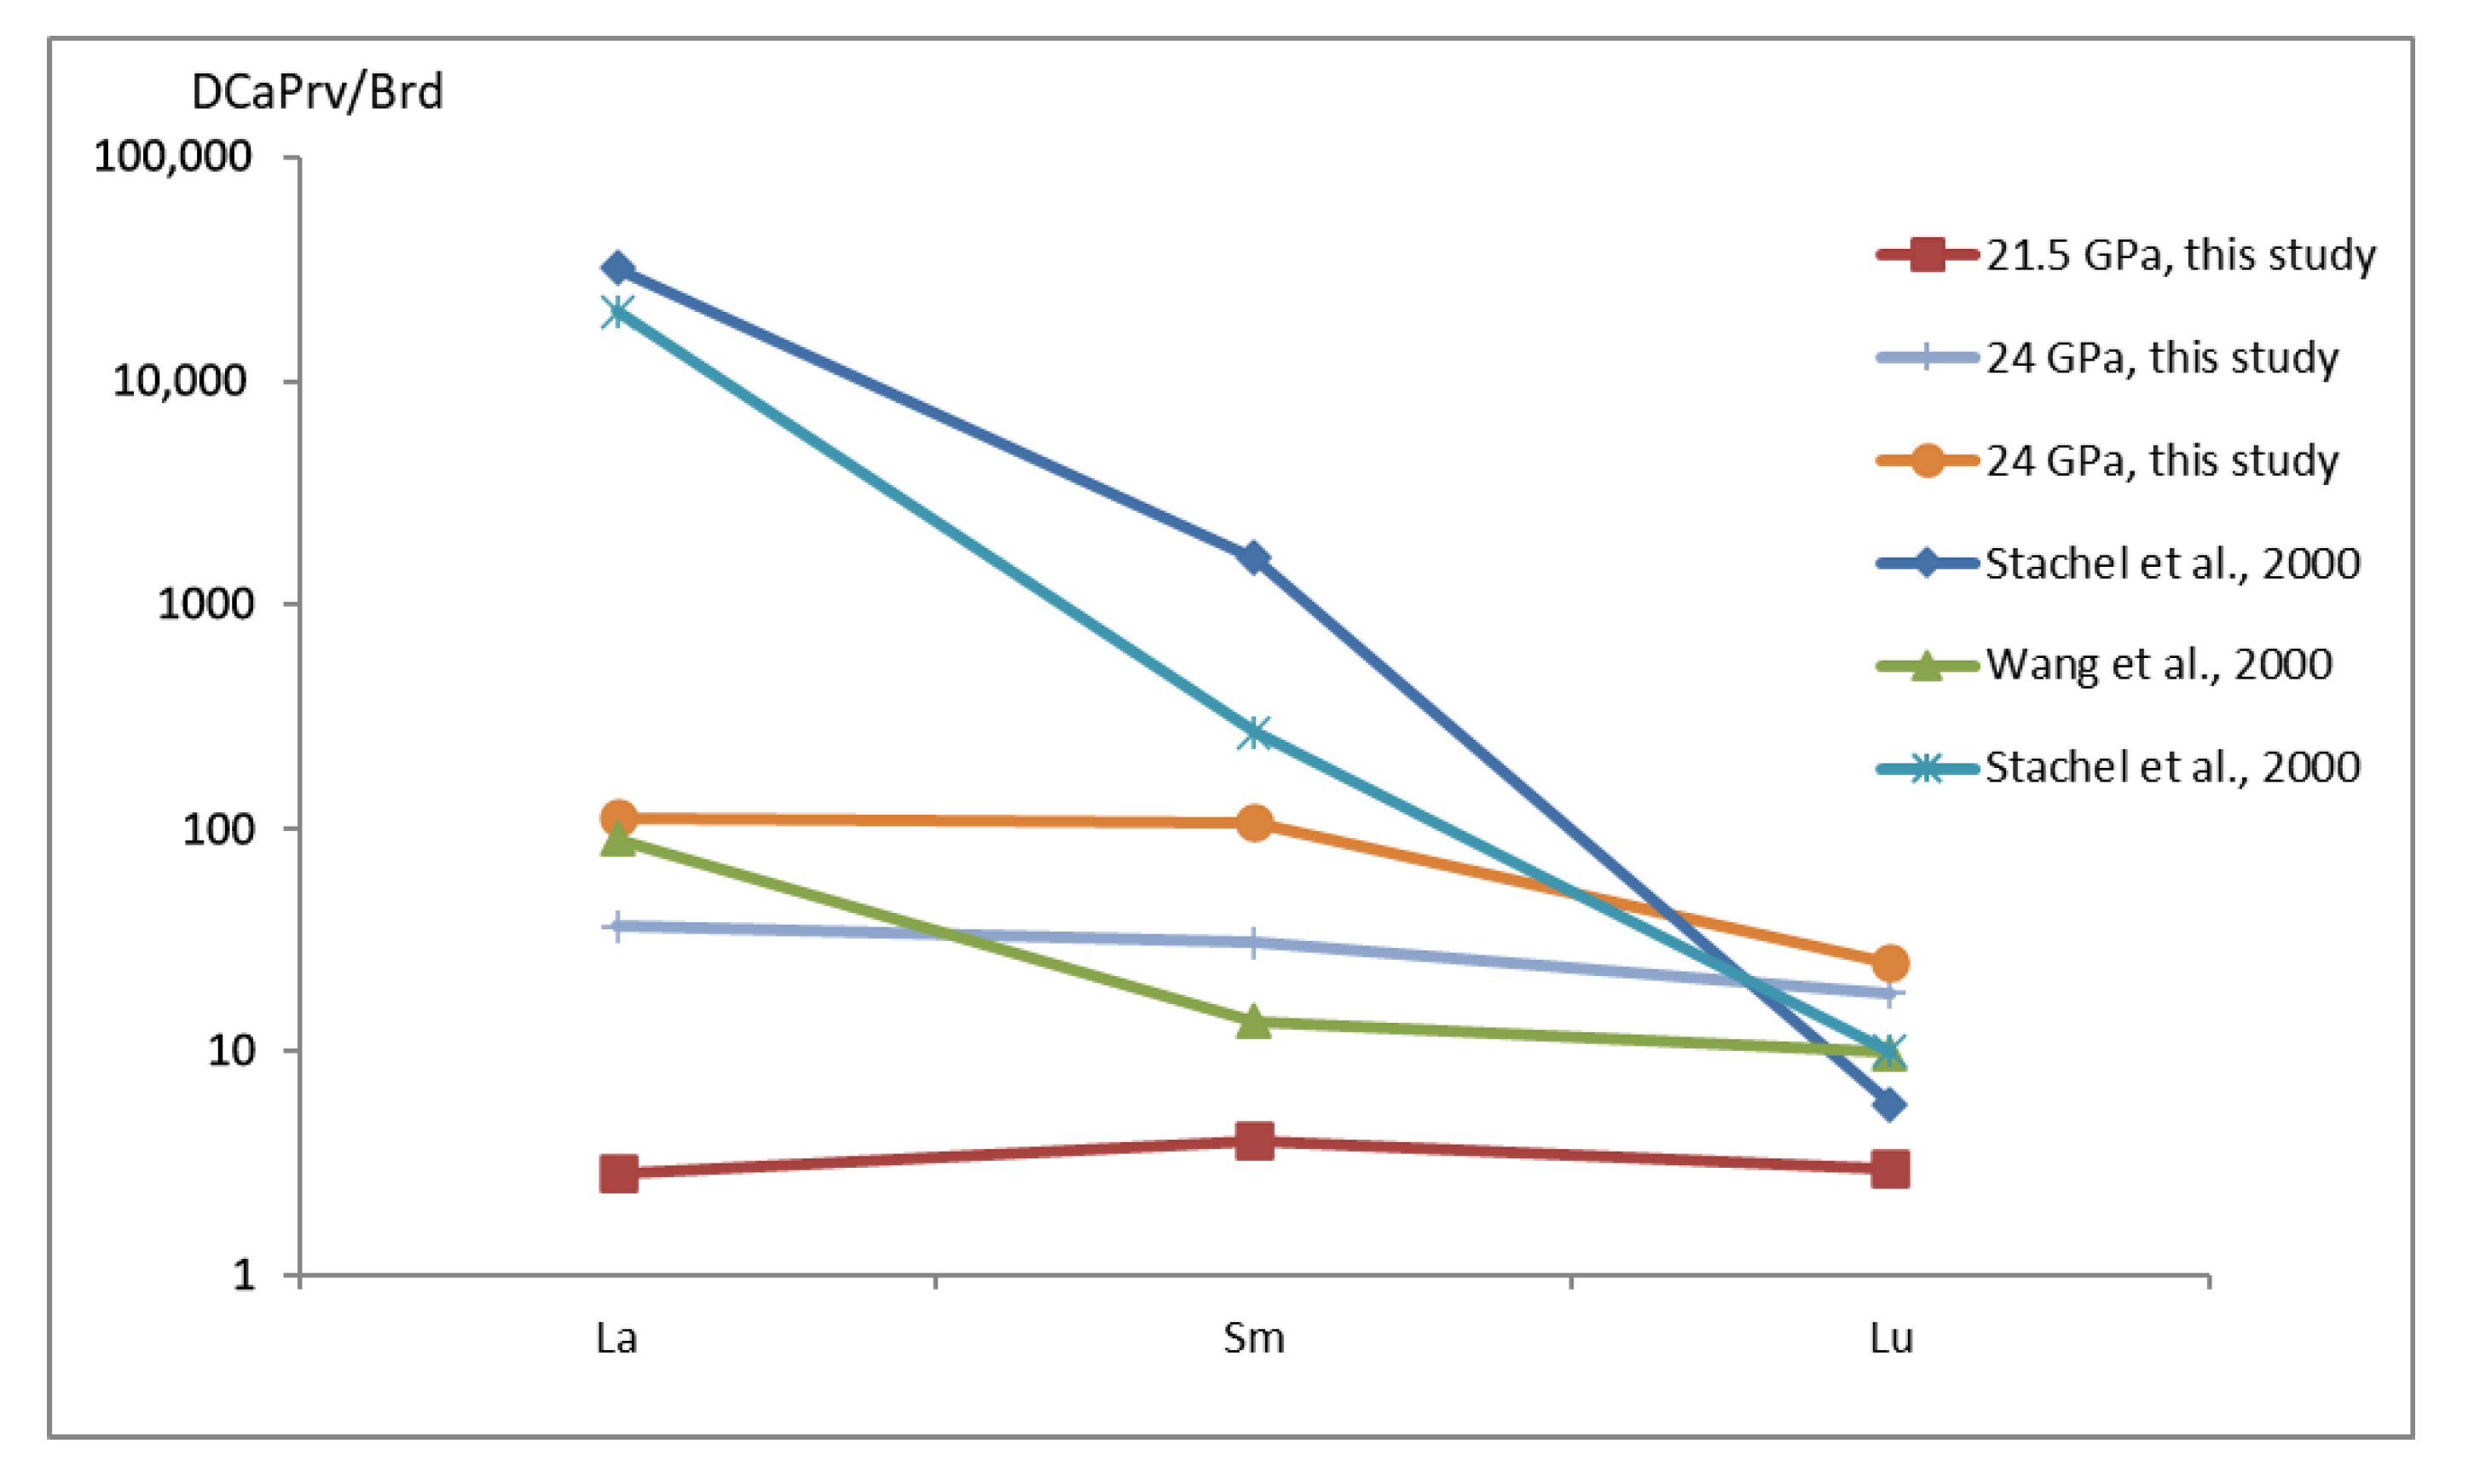
- Comparison of the results of experiments at 21.5 and 24 GPa allows us to estimate an effect of pressure on the trace-element composition of mantle phases and on the interphase REE partition coefficients; both total REE concentrations and CaPrv/Brd interphase REE partition coefficients decrease with pressure. The new data are applicable to interpretation of the trace-element composition of the lower mantle inclusions in natural diamonds from kimberlite; the experimentally determined effect of pressure on the interphase (bridgmanite/CaSiO3-perovskite) REE partition coefficients can be a potential qualitative geobarometer for mineral inclusions in superdeep diamonds.
Supplementary Materials
Author Contributions
Funding
Acknowledgments
Conflicts of Interest
References
- Ringwood, A.E. Phase transformations and their bearing on the constitution and dynamics of the mantle. Geochim. Cosmochim. Acta 1991, 55, 2083–2110. [Google Scholar] [CrossRef]
- Akaogi, M.; Akimoto, S.I. Pyroxene-garnet solid-solution equilibria in the systems Mg4Si4O12–Mg3Al2Si3O12 and Fe4Si4O12–Fe3Al2Si3O12 at high pressures and temperatures. Phys. Earth Planet. Inter. 1977, 15, 90–106. [Google Scholar] [CrossRef]
- Tschauner, O.; Ma, C.; Beckett, J.R.; Prescher, C.; Prakapenka, V.B.; Rossman, G.R. Discovery of bridgmanite, the most abundant mineral in Earth, in a shocked meteorite. Science 2014, 346, 1100–1102. [Google Scholar] [CrossRef] [Green Version]
- Liebske, C.; Corgne, A.; Frost, D.J.; Rubie, D.C.; Wood, B.J. Compositional effects on element partitioning between Mg-silicate perovskite and silicate melts. Contrib. Mineral. Petrol. 2005, 149, 113–128. [Google Scholar] [CrossRef]
- Wood, B.J.; Corgne, A. Mineralogy of the Earth: Trace elements and hydrogen in the Earth’s transition zone and lower mantle. Treatise Geophys. 2009, 2, 63–89. [Google Scholar]
- Kaminsky, F.V. The Earth’s Lower Mantle; Springer: Berlin/Heidelberg, Germany, 2017. [Google Scholar]
- Walter, M.J.; Nakamura, E.; Tronnes, R.G.; Frost, D.J. Experimental constraints on crystallization differentiation in a deep magma ocean. Geochim. Cosmochim. Acta 2004, 68, 4267–4284. [Google Scholar] [CrossRef]
- Corgne, A.; Allan, N.L.; Wood, B.J. Atomistic simulations of trace element incorporation into the large site of MgSiO3 and CaSiO3 perovskites. Phys. Earth Planet. Inter. 2003, 139, 113–127. [Google Scholar] [CrossRef]
- Kawai, N.; Endo, S. The generation of ultrahigh hydrostatic pressures by a split sphere apparatus. Rev. Sci. Instrum. 1970, 41, 1178–1181. [Google Scholar] [CrossRef]
- Sirotkina, E.A.; Bobrov, A.V.; Bindi, L.; Irifune, T. Phase relations and formation of chromium-rich phases in the system Mg4Si4O12–Mg3Cr2Si3O12 at 10–24 GPa and 1600 °C. Contrib. Mineral. Petrol. 2015, 169, 2. [Google Scholar] [CrossRef]
- Irifune, T.; Kurio, A.; Sakamoto, S.; Inoue, T.; Sumiya, H.; Funakoshi, K.I. Formation of pure polycrystalline diamond by direct conversion of graphite at high pressure and high temperature. Phys. Earth Planet. Inter. 2004, 143, 593–600. [Google Scholar] [CrossRef]
- Katsura, T.; Ito, E. The system Mg2SiO4–Fe2SiO4 at high pressures and temperatures: Precise determination of stabilities of olivine, modified spinel, and spinel. J. Geophys. Res. Solid Earth 1989, 94, 15663–15670. [Google Scholar] [CrossRef]
- Eremin, N.N.; Marchenko, E.I.; Petrov, V.G.; Mitrofanov, A.A.; Ulanova, A.S. Solid solutions of monazites and xenotimes of lanthanides and plutonium: Atomistic model of crystal structures, point defects and mixing properties. Comput. Mater. Sci. 2019, 157, 43–50. [Google Scholar] [CrossRef]
- Pedone, A.; Malavasi, G.; Menziani, M.C.; Cormack, A.N.; Segre, U. A New Self-Consistent Empirical Interatomic Potential Model for Oxides, Silicates, and Silica-Based Glasses. J. Phys. Chem. B 2006, 110, 11780–11795. [Google Scholar] [CrossRef]
- Gale, J.D.; Rohl, A.L. The General Utility Lattice Program (GULP). Mol. Simul. 2003, 29, 291–341. [Google Scholar] [CrossRef]
- Akaogi, M.; Yano, M.; Tejima, Y.; Iijima, M.; Kojitani, H. High-pressure transitions of diopside and wollastonite: Phase equilibria and thermochemistry of CaMgSi2O6, CaSiO3, and CaSi2O5–CaTiSiO5 system. Phys. Earth Planet. Inter. 2004, 143, 145–156. [Google Scholar] [CrossRef]
- Bobrov, A.V.; Kojitani, H.; Akaogi, M.; Litvin, Y.A. Phase relations on the diopside-hedenbergite-jadeite join up to 24 GPa and stability of Na-bearing majoritic garnet. Geochim. Cosmochim. Acta 2008, 72, 2392–2408. [Google Scholar] [CrossRef]
- Stachel, T.; Harris, J.W.; Brey, G.P.; Joswig, W. Kankan diamonds (Guinea) II: Lower mantle inclusion parageneses. Contrib. Mineral. Petrol. 2000, 140, 16–27. [Google Scholar] [CrossRef]
- Wang, W.; Gasparik, T.; Rapp, R. Partitioning of rare earth elements between CaSiO3 perovskite and coexisting phases: Constraints on the formation of CaSiO3 inclusions in diamond. Earth Planet. Sci. Lett. 2000, 181, 291–300. [Google Scholar] [CrossRef]
- Burnham, A.D.; Bulanova, G.P.; Smith, C.B.; Whitehead, S.C.; Kohn, S.C.; Gobbo, L.; Walter, M.J. Diamonds from the Machado River alluvial deposit, Rondônia, Brazil, derived from both lithospheric and sublithospheric mantle. Lithos 2016, 265, 199–213. [Google Scholar] [CrossRef] [Green Version]
- Corgne, A.; Wood, B.J. Trace element partitioning and substitution mechanisms in calcium perovskites, Contrib. Mineral. Petrol. 2005, 149, 85–97. [Google Scholar] [CrossRef]
- Corgne, A.; Liebske, C.; Wood, B.J.; Rubie, D.C.; Frost, D.J. Silicate perovskite-melt partitioning of trace elements and geochemical signature of a deep perovskitic reservoir. Geochim. Cosmochim. Acta 2005, 146, 249–260. [Google Scholar] [CrossRef]
- Thomson, A.R.; Kohn, S.C.; Bulanova, G.P.; Smith, C.B.; Araujo, D.; Walter, M.J. Trace element composition of silicate inclusions in sub-lithospheric diamonds from the Juina-5 kimberlite: Evidence for diamond growth from slab melts. Lithos 2016, 265, 108–124. [Google Scholar] [CrossRef] [Green Version]
- Litvin, Y.A.; Spivak, A.V.; Kuzyura, A.V. Fundamentals of the mantle carbonatite concept of diamond genesis. Geochem. Int. 2016, 54, 839–857. [Google Scholar] [CrossRef]
- Righter, K.; Danielson, L.; Drake, M.J.; Domanik, K. Partition coefficients at high pressure and temperature. In Treatise on Geochemistry, 2nd ed.; Carlson, R.W., Ed.; Elsevier: Amsterdam, The Netherlands, 2014; Volume 3, pp. 449–477. [Google Scholar]


| Sample | OS3224-2 (B) | OS3214-2 (B) | OS3638-1 (D) | OS3526-2 (D) | OS3216-1 (A) | ||||
| GPa | 21.5 | 24 | 21.5 | 24 | 21.5 | ||||
| Phase | Brd | CaPrv | Brd | CaPrv | Brd | CaPrv | Brd | CaPrv | Rgw |
| SiO2 | 58.98 (0.35) | 49.28 (0.59) | 61.73 (0.38) | 48.36 (0.43) | 60.56 (0.42) | 49.66 (0.66) | 59.57 (0.43) | 49.02 (0.65) | 40.39 (0.32) |
| MgO | 40.82 (0.27) | 0.35 (0.04) | 38.13 (0.51) | 0.42 (0.02) | 39.04 (0.33) | 0.51 (0.09) | 39.2 (0.72) | 0.27 (0.04) | 47.83 (0.73) |
| FeO | - | - | - | - | - | - | - | - | 11.07 (0.62) |
| CaO | 0.13 (0.01) | 44.74 (0.49) | 0.23 (0.01) | 44.6 (0.17) | 0.28 (0.03) | 47.33 (0.60) | 0.36 (0.06) | 47.56 (0.18) | - |
| TiO2 | b.d.l. | 0.85 (0.09) | 0.09 (0.01) | 0.66 (0.09) | 0.11 (0.02) | 0.52 (0.05) | 0.06 (0.09) | 0.66 (0.08) | 0.27 (0.01) |
| Cr2O3 | 0.18 (0.04) | 0.75 (0.04) | 0.16 (0.02) | 0.58 (0.09) | 0.24 (0.01) | 0.46 (0.03) | 0.46 (0.02) | 0.47 (0.05) | 0.41 (0.03) |
| Total | 100.45 | 99.97 | 100.51 | 98.28 | 100.5 | 98.97 | 100.1 | 98.65 | 100.08 |
| Formula units per given O | |||||||||
| O | 3 | 3 | 3 | 3 | 3 | 3 | 3 | 3 | 4 |
| Si4+ | 1.002 | 0.994 | 1.027 | 0.987 | 1.011 | 0.978 | 0.984 | 1.022 | 0.996 |
| Mg2+ | 0.995 | 0.011 | 0.946 | 0.013 | 0.975 | 0.015 | 1.003 | 0.008 | 1.759 |
| Fe2+ | - | - | - | - | - | - | - | - | 0.228 |
| Ca2+ | 0.002 | 0.967 | 0.004 | 0.975 | 0.005 | 0.998 | 0.006 | 1.007 | - |
| Ti4+ | - | 0.013 | 0.001 | 0.01 | 0.001 | 0.005 | 0.001 | 0.01 | 0.005 |
| Cr3+ | 0.002 | 0.012 | 0.002 | 0.009 | 0.003 | 0.004 | 0.006 | 0.007 | 0.008 |
| Sample | OS3216-1 (A) | OS3214-1 (A) | OS3538-2 (C) | OS3526-1 (C) | |||||
| GPa | 21.5 | 24 | 21.5 | 24 | |||||
| Phase | fPer | Brd | Rgw | fPer | Rgw | fPer | Rgw | Brd | fPer |
| SiO2 | 0.13 (0.05) | 55.8 (0.66) | 40.24 (0.21) | b.d.l. 1 | 40.94 (0.50) | 0.2 (0.01) | 41.31 (0.42) | 56.74 (0.77) | b.d.l. |
| MgO | 58.86 (0.88) | 36.31 (0.45) | 48.77 (0.27) | 72.89 (0.44) | 48.48 (0.68) | 66.47 (0.76) | 48.92 (0.33) | 36.44 (0.52) | 73.84 (0.76) |
| FeO | 38.56 (0.73) | 4.68 (0.09) | 9.71 (0.34) | 23.61 (0.19) | 9.97 (0.52) | 29.9 (0.67) | 10.55 (0.58) | 4.88 (0.11) | 24.91 (0.89) |
| CaO | - | - | - | - | - | - | - | - | - |
| TiO2 | b.d.l. | 1.52 (0.07) | 0.19 (0.04) | 0.09 (0.02) | 0.37 (0.09) | 0.08 (0.03) | 0.14 (0.06) | 0.56 (0.05) | 0.08 (0.01) |
| Cr2O3 | 1.09 (0.04) | 0.86 (0.02) | 0.34 (0.02) | 1.53 (0.03) | 0.58 (0.08) | 1.46 (0.09) | 0.14 (0.07) | 0.54 (0.04) | 0.69 (0.09) |
| Total | 98.63 | 99.96 | 99.38 | 98.58 | 100.09 | 98.22 | 100.61 | 99.46 | 99.82 |
| Formula units per given O | |||||||||
| O | 1 | 3 | 4 | 1 | 4 | 1 | 4 | 3 | 1 |
| Si4+ | 0.001 | 0.964 | 0.993 | - | 1.004 | 0.001 | 1.005 | 0.978 | - |
| Mg2+ | 0.725 | 0.935 | 1.793 | 0.837 | 1.773 | 0.788 | 1.775 | 0.937 | 0.836 |
| Fe2+ | 0.266 | 0.068 | 0.2 | 0.152 | 0.225 | 0.199 | 0.215 | 0.07 | 0.16 |
| Ca2+ | - | - | - | - | - | - | - | - | - |
| Ti4+ | - | 0.02 | 0.004 | 0.001 | 0.007 | 0.001 | 0.003 | 0.007 | 0.001 |
| Cr3+ | 0.007 | 0.012 | 0.007 | 0.009 | 0.011 | 0.009 | 0.003 | 0.007 | 0.004 |
| Sample | os3224-2 (B) | |||||
| P, GPa | 21.5 | |||||
| Phase | CaPrv | +/- 1 | CaPrv | +/- | Brd | +/- |
| La | 10,476.04 | 862.44 | 11,928.96 | 982.05 | 2523.71 | 272.47 |
| Sm | 10,274.47 | 1705.93 | 10,563.46 | 1753.92 | 2333.13 | 387.38 |
| Lu | 8668.9 | 712.45 | 11,605.78 | 953.82 | 3233.54 | 207.4 |
| Sample | os3214-2 (B) | |||||
| P, GPa | 24 | |||||
| Phase | CaPrv | +/- | Brd | +/- | Brd | +/- |
| La | 9049.01 | 744.96 | 81.24 | 6.69 | 252.41 | 20.78 |
| Sm | 8643.95 | 1435.21 | 81.6 | 13.55 | 258.73 | 42.96 |
| Lu | 6314.99 | 519 | 254.43 | 20.91 | 407.29 | 33.47 |
| Sample | os3216-1 (A) | |||||
| P, GPa | 21.5 | |||||
| Phase | Rgw | +/- | Rgw | +/- | fPer | +/- |
| La | 15.35 | 1.26 | 0.51 | 0.04 | 1143.44 | 94.13 |
| Sm | 6.13 | 1.02 | 0.02 | 0.02 | 453.09 | 75.23 |
| Lu | 7.74 | 0.64 | 4.47 | 0.37 | 537.81 | 44.2 |
| Sample | os3214-1 (A) | |||||
| P, GPa | 24 | |||||
| Phase | Brd | +/- | Rgw | +/- | fPer | +/- |
| La | 11.52 | 0.95 | 13.85 | 1.14 | 334.34 | 27.53 |
| Sm | 17.58 | 2.92 | 8.55 | 1.42 | 8.56 | 1.42 |
| Lu | 2574.34 | 211.57 | 12.44 | 1.02 | 12.96 | 1.07 |
| Sample | os3214-1 (A) | [18] | [19] | |||
| P, GPa | 24 | |||||
| Phase | fPer | +/- | CaSiO3 | MgSiO3 | MgSiO3 | CaSiO3 |
| La | 20.97 | 1.73 | 161.45 | 0 | 1.28 | 115.2 |
| Sm | 4.52 | 0.75 | 96.99 | 0.06 | 2.92 | 40 |
| Lu(Yb) | 6.35 | 0.52 | 0.52 | 0.09 | 3.44 | 34.04 |
| Samp. | os3526-1 (C) | os3538-2 (D) | [4] | ||||||||||
|---|---|---|---|---|---|---|---|---|---|---|---|---|---|
| P, GPa | 24 | 21.5 | |||||||||||
| Phase | Rgw | +/- | Brd | +/- | Brd | +/- | fPer | +/- | Rgw | +/- | fPer | +/- | MgSiO3 |
| La | 5.06 | 0.75 | 21.29 | 3.17 | 15.85 | 2.36 | 10.67 | 1.59 | 5.61 | 0.83 | 34.18 | 5.08 | 1 |
| Ce | 3.10 | 0.46 | 7.55 | 1.11 | 10.10 | 1.49 | 8.77 | 1.29 | 2.85 | 0.42 | 9.61 | 1.41 | 8 |
| Pr | 5.31 | 0.66 | 8.65 | 1.07 | 10.44 | 1.30 | 10.24 | 1.27 | 5.29 | 0.66 | 11.57 | 1.44 | n.a.1 |
| Nd | 3.28 | 1.34 | 7.85 | 3.19 | 5.77 | 2.35 | 11.87 | 4.83 | 3.61 | 1.47 | 7.38 | 3.00 | 36 |
| Sm | 3.52 | 1.82 | 6.55 | 3.38 | 5.89 | 3.05 | 0.83 | 0.43 | 3.52 | 1.82 | 3.85 | 1.99 | 72 |
| Eu | 3.14 | 0.39 | 7.24 | 0.91 | 6.69 | 0.84 | 5.11 | 0.64 | 2.07 | 0.26 | 5.61 | 0.70 | 39 |
| Gd | 4.19 | 0.52 | 10.42 | 1.30 | 9.74 | 1.22 | 4.11 | 0.51 | 4.10 | 0.51 | 7.40 | 0.93 | n.a. |
| Tb | 4.08 | 0.48 | 13.87 | 1.62 | 11.16 | 1.30 | 10.74 | 1.26 | 4.04 | 0.47 | 12.20 | 1.43 | n.a. |
| Dy | 5.62 | 1.45 | 18.27 | 4.72 | 12.80 | 3.31 | 8.71 | 2.25 | 5.83 | 1.51 | 12.46 | 3.22 | n.a. |
| Ho | 5.31 | 0.68 | 12.83 | 1.64 | 12.77 | 1.64 | 4.04 | 0.52 | 5.36 | 0.69 | 10.49 | 1.34 | n.a. |
| Er | 6.60 | 0.87 | 34.45 | 4.54 | 28.04 | 3.69 | 12.20 | 1.61 | 6.49 | 0.85 | 9.20 | 1.21 | n.a. |
| Tm | 6.18 | 0.43 | 45.07 | 3.10 | 37.33 | 2.57 | 17.26 | 1.19 | 5.61 | 0.39 | 13.34 | 0.92 | n.a. |
| Yb | 3.59 | 0.52 | 68.26 | 9.97 | 45.42 | 6.63 | 25.17 | 3.68 | 2.70 | 0.39 | 24.50 | 3.58 | n.a. |
| Lu | 6.28 | 1.09 | 85.63 | 14.80 | 65.29 | 11.28 | 28.57 | 4.94 | 5.49 | 0.95 | 21.40 | 3.70 | 576 |
| D Coeff | La | Sm | Lu | Sample | P, GPa |
|---|---|---|---|---|---|
| DRgw/fPer | 0.66 | 1.89 | 1.96 | os3214-1 | 24 |
| DBrd/Rgw | 0.50 | 2.80 | 209.07 | ||
| DBrd/Rgw | 0.83 | 2.06 | 206.94 | ||
| DRgw/fPer | 0.01 | 0.01 | 0.01 | os3216-1 | 21.5 |
| DCaPrv/Brd | 41.50 | 39.71 | 21.28 | os3214-2 | 24 |
| DCaPrv/Brd | 111.39 | 105.93 | 24.82 | ||
| DCaPrv/Brd | 36.30 | 30.58 | 18.27 | ||
| DCaPrv/Brd | 1.95 | 2.03 | 1.82 | os3224-2 | 21.5 |
| DCaPrv/Brd | 2.86 | 3.99 | 3.00 | ||
| DCaPrv/Brd | 1.54 | 1.79 | 1.18 |
| Sample | os3526-1 | os3538-2 | |||||
|---|---|---|---|---|---|---|---|
| P, GPa | 24 | 21.5 | |||||
| D Coeff | DBrd/Rgw | DBrd/Rgw | DBrd/Rgw | DRgw/fPer | DRgw/fPer | DRgw/fPer | DRgw/fPer |
| La | 2.03 | 9.38 | 3.92 | 0.27 | 0.09 | 0.16 | 0.15 |
| Ce | 1.81 | 7.73 | 3.26 | 0.40 | 0.30 | 0.28 | 0.27 |
| Pr | 1.29 | 4.16 | 1.97 | 0.52 | 0.41 | 0.45 | 0.45 |
| Nd | 1.73 | 4.60 | 1.76 | 1.57 | 1.13 | 0.44 | 0.44 |
| Sm | 0.93 | 4.00 | 1.67 | 1.02 | 0.51 | 0.91 | 0.91 |
| Eu | 1.53 | 5.79 | 2.13 | 0.77 | 0.51 | 0.37 | 0.37 |
| Gd | 1.86 | 4.63 | 2.33 | 0.52 | 0.39 | 0.55 | 0.46 |
| Tb | 2.16 | 5.79 | 2.74 | 0.47 | 0.30 | 0.32 | 0.32 |
| Dy | 2.42 | 4.80 | 2.28 | 0.47 | 0.35 | 0.45 | 0.45 |
| Ho | 1.71 | 3.35 | 2.40 | 0.44 | 0.31 | 0.52 | 0.51 |
| Er | 3.08 | 6.19 | 4.25 | 1.81 | 1.06 | 0.66 | 0.66 |
| Tm | 3.06 | 9.84 | 6.04 | 1.56 | 0.66 | 0.42 | 0.40 |
| Yb | 3.84 | 23.72 | 12.65 | 0.75 | 0.15 | 0.12 | 0.11 |
| Lu | 3.32 | 17.22 | 10.39 | 1.81 | 0.44 | 0.26 | 0.25 |
© 2020 by the authors. Licensee MDPI, Basel, Switzerland. This article is an open access article distributed under the terms and conditions of the Creative Commons Attribution (CC BY) license (http://creativecommons.org/licenses/by/4.0/).
Share and Cite
Tamarova, A.P.; Marchenko, E.I.; Bobrov, A.V.; Eremin, N.N.; Zinov’eva, N.G.; Irifune, T.; Hirata, T.; Makino, Y. Interphase REE Partitioning at the Boundary between the Earth’s Transition Zone and Lower Mantle: Evidence from Experiments and Atomistic Modeling. Minerals 2020, 10, 262. https://doi.org/10.3390/min10030262
Tamarova AP, Marchenko EI, Bobrov AV, Eremin NN, Zinov’eva NG, Irifune T, Hirata T, Makino Y. Interphase REE Partitioning at the Boundary between the Earth’s Transition Zone and Lower Mantle: Evidence from Experiments and Atomistic Modeling. Minerals. 2020; 10(3):262. https://doi.org/10.3390/min10030262
Chicago/Turabian StyleTamarova, Anastasia P., Ekaterina I. Marchenko, Andrey V. Bobrov, Nikolay N. Eremin, Nina G. Zinov’eva, Tetsuo Irifune, Takafumi Hirata, and Yoshiki Makino. 2020. "Interphase REE Partitioning at the Boundary between the Earth’s Transition Zone and Lower Mantle: Evidence from Experiments and Atomistic Modeling" Minerals 10, no. 3: 262. https://doi.org/10.3390/min10030262