Allanite Geochemical Response to Hydrothermal Alteration by Alkaline, Low-Temperature Fluids


1
Institute of Geological Sciences, Polish Academy of Sciences, Twarda 51/55, 00-818 Warsaw, Poland
2
Institute of Geochemistry, Mineralogy and Petrology, University of Warsaw, Zwirki i Wigury 93, 02-089 Warsaw, Poland
3
Institute of Geology of the Czech Academy of Sciences, Rozvojová 269, 6 – Lysolaje, 165 00 Praha, Czech Republic
4
Faculty of Geology, Geophysics and Environmental Protection, AGH University of Science and Technology, aleja Adama Mickiewicza 30, PL-30059 Krakow, Poland
*
Author to whom correspondence should be addressed.
Minerals 2020, 10(5), 392; https://doi.org/10.3390/min10050392
Submission received: 20 March 2020
/
Revised: 25 April 2020
/
Accepted: 26 April 2020
/
Published: 28 April 2020
(This article belongs to the Special Issue Accessory Minerals in Silicic Igneous Rocks)
Abstract
:Allanite is one of the main rare earth elements (REE)-rich accessory minerals in composite dykes from the granitoid pluton of Karkonosze. These dykes differ in composition from the bulk of the pluton by elevated rare earth elements (REE), Y, Zr, and alkali contents, suggesting contribution of an additional component. Allanite exhibits complex alteration textures, which can be divided into two stages. The first stage is represented by allanite mantles, formed by fluid infiltration into previously crystallized magmatic allanite. These zones have low totals, are Ca-, Al-, Mg-, and light REE (LREE)-depleted, and Y-, heavy REE (HREE)-, Th-, Ti-, and alkali-enriched. The fractionation between LREE and HREE was caused by different mobility of complexes formed by these elements in aqueous fluids. The second stage includes recrystallized LREE-poor, Y-HREE-rich allanite with variable Ca, Al, Mg, and REE-fluorocarbonates. The alteration products from both stages demonstrate higher Fe3+/(Fe2+ + Fe3+) ratios and a negative Ce anomaly. These features point to the alkaline, low-temperature, and oxidized nature of the fluids. The differences in mobility and solubility of respective ligands show that the fluids from the first stage may have been dominated by Cl, whereas those of the second stage may have been dominated by F and CO2 (and PO4 in case of one sample). The inferred chemistry of the fluids resembles the overall geochemical signature of the composite dykes, indicating a major contribution of the hydrothermal processes to their geochemical evolution.
1. Introduction
Allanite, an REE-Th-rich member of the epidote supergroup with the general formulae (Ca, Ce, La, Nd, Th)2(Fe2+, Fe3+, Ti)(Al, Fe3+)2Si3O12(OH), is one of the main carriers of rare earth elements (REEs) and Th in metaluminous and weakly peraluminous granites from various geological settings [1,2,3,4,5]. Consequently, we are able to trace their behavior during various petrogenetic processes [6]. Apart from the magmatic stage, it preserves the record of postmagmatic hydrothermal alteration [4,7,8,9,10,11,12]. Additionally, metamictization (radiation damage due to radioactive decay of Th and U) may have a significant impact on its composition and facilitate element remobilization by fluids (e.g., [13]). The secondary products of allanite alteration provide crucial information about the physicochemical properties of the fluids and conditions of the postmagmatic environment. This, in turn, may have a significant impact on the whole-rock geochemistry.
The postcollisional pluton of Karkonosze belongs to the calc-alkaline, I-type granitoids of mixed mantle–crust origin [14]. It contains numerous varieties of felsic to mafic composition, including late-stage composite dykes, forming irregular, discontinuous intrusions built of felsic, intermediate, and mafic domains [14]. Their chemical composition significantly differs from the bulk of the pluton by their enrichment in alkalis, Zr, Nb, Y, and REE. In many classifications, they plot on alkalic/alkali-calcic [15] or A-type [16] regions. Whereas the general geochemical modeling of the pluton suggests similar sources for the dykes as for the remaining constituents of the intrusion [14,17], the above-mentioned differences may be attributed to the late or postmagmatic alteration. Słaby et al. [17], Słaby [18], and Kusiak et al. [19] suggested the addition of fluids responsible for the Y-HREE-Zr enrichment, mostly associated with re-equilibrated zircon. However, no precise characterization of the fluids was performed on any of the studied rocks.
Allanite-(Ce) is a common accessory REE-rich phase in the composite dykes and exhibits prominent, complex alteration textures. With the use of major and trace element composition, we characterize the extent of alteration processes, mechanisms of element removal and exchange, as well as physicochemical properties of the percolating fluids.
2. Geological Setting and Research Material
The postcollisional granitoid pluton of Karkonosze is located in the Saxothuringian Zone of the Variscan Orogen, on the NE margin of the Bohemian Massif [20]. It constitutes a part of SE Sudetes and crosscuts the Poland/Czech Republic border. It intruded the metasedimentary and volcanic basement rocks during the Late Carboniferous in a transpressional/transtensional tectonic setting [20] and was formed by a multistage emplacement of several magma batches [14,21]. The age of the pluton was dated to 312.5 ± 0.3 Ma by U–Pb in zircon using chemical abrasion ID-TIMS technique [22].
The pluton consists of various types of granites of intermediate to felsic composition. The bulk of the intrusion is peraluminous, variably evolved porphyritic biotite granite (1.00 < A/CNK < 1.13), whereas batches of equigranular granite (0.98 < A/CNK < 1.14) and metaluminous hybrid granodiorite and quartz diorite (0.82 < A/CNK < 1.01) are less common [14]. Microgranular magmatic enclaves (MME) of variable size are present within some varieties of the porphyritic granite and quartz diorites. Moreover, the pluton is crosscut by multiple lamprophyric, leucocratic, and composite dykes (which are the focus of this study). Following the classification of Barbarin [23], the pluton can be characterized as K-rich calc-alkaline (KCG). Many mineralogical and chemical characteristics of the porphyritic and hybrid granitoids, such as the presence of biotite (instead of muscovite), amphibole, titanite and allanite, amphibole-bearing MMEs, metaluminous to weakly peraluminous character, and high Ca and Sr contents favor the assignment of the pluton to I-type granites [24,25,26]. It is also in agreement with the discrimination diagrams of Whalen et al. [16] (e.g., Ga/Al × 10,000 vs. Zr, Y, Nb, Ce, and Na2O + K2O), where the bulk of the pluton is plotted in the I- and S-type field. According to the classification of Frost et al. [15], the bulk of the pluton is magnesian, calc-alkalic, and peraluminous, which relates to the plutons of the main portion of the Corderillan batholiths.
According to multiple petrological and geochemical studies of the pluton petrogenesis [14,27,28,29,30,31,32,33], the pluton formed by two main mechanisms of differentiation—magma mixing between mantle-derived lamprophyric melt and crust-derived granitic magma, and fractional crystallization of both melts, as well as their hybrids. During the early stages of magmatic evolution, the mafic melt (which most probably formed a separate magmatic chamber) was injected into the granitic magma chamber and intensive mixing of both magmas led to the formation of quartz diorites and granodiorites (which form a substantial part of the pluton, outcropped in the SE part). In the following stages, a new portion of more evolved mafic magma was injected into more viscous granitic magma and formed mafic enclaves, which strongly interacted with the surrounding granitic host. A late stage of mixing is suggested by the presence of composite dykes, which intruded the partially consolidated granite and formed irregular, discontinuous bodies. Lamprophyric dykes are the youngest, based on cross-cutting relationships, and intruded the fully crystallized granite. Whereas the lamprophyre dykes represent the mafic end-member of the mixing system, the equigranular granite is the equivalent of the pure and evolved crust-derived granitic magma [14]. Late to postmagmatic processes related to interaction with fluids have been recorded in specific minerals (chloritized biotite, sericitized feldspar, altered zircon, apatite, titanite, and allanite) [17,18,19,34].
Allanite is present in many granitoid varieties from the Karkonosze pluton (quartz diorites, porphyritic granites, equigranular granite, and composite dykes); however, it occurs most commonly in the rocks representing the late stage of the pluton evolution, especially the composite dykes. These intrusions cut both the equigranular and evolved porphyritic granite, which supports their late origin. They predominate in the eastern part of the pluton where they form the Karpacz-Janowice Wielkie Dyke Swarm. They are usually 2–3 m thick, fine- to medium-grained, and are composed of discontinuous, deformed intermediate to mafic bodies, with compositions ranging from monzodiorite to granodiorite. The interaction between the dykes and the host granite is visible only along sharp contact boundaries. Many dykes are comprised of several domains of either more felsic or more mafic composition, indicating incomplete hybridization of mafic and felsic melts [17].
The two composite dyke samples used in this study come from two localizations: Gruszków (50°49’N, 15°51’E) and Sokoliki (50°52’N, 15°52’E). Both rocks are fine-grained and of granodiorite composition. The mineral assemblages include hornblende, biotite, plagioclase, alkali feldspar, quartz, and accessory apatite, titanite, zircon, allanite, and ilmenite. Biotite is slightly chloritized in both samples. The dykes are weakly peraluminous to peraluminous (1.12 > A/CNK > 1.02). Some geochemical characteristics deviate from the general classification of the pluton, such as Fe number and MALI (modified alkali-lime index) proposed by Frost et al. [15]. The composite dykes, in contrast to the magnesian and calc-alkalic bulk of the pluton, are ferroan and alkali-calcic (close to the boundary between alkali-calcic and alkalic). On the diagrams of Whalen et al. [16], the dykes are usually plotted in an A-type field, showing higher concentrations of Zr, Nb, Ce, Y, and Na2O + K2O than those typical for I- and S-type granites.
Whole-rock chemical composition of Gruszków and Sokoliki is generally similar with few exceptions (data taken from Słaby and Martin [14], where Sokoliki is COM-4 and Gruszków is COM-5). Gruszków dyke has lower contents of Fe, Ca, Na, Ba, and Sr, whereas it is considerably more enriched in K, Rb, Y, and REE (especially LREE). Chondrite-normalized REE patterns are LREE-enriched for both samples, although (La/Yb)N is higher for Gruszków (12.6, compared to 10.7 for Sokoliki). The negative Eu anomaly is also more pronounced for Gruszków (Eu/Eu* = 0.24, compared to 0.61 for Sokoliki).
3. Analytical Methods
3.1. Electron Probe Microanalysis
Back-scattered electron (BSE) photos, as well as chemical analyses of major and minor elements, were performed on carbon-coated, polished, in-situ thin-sections (of slightly increased thickness necessary for LA-ICP-MS analyses), using a Cameca SXFiveFE equipped with five wavelength dispersive spectrometers at the Laboratory of Electron Microscopy and Electron Probe Micro-Analysis (EPMA) of the Faculty of Geology, University of Warsaw, Poland. The parameters set for the spot analyses included 15 keV accelerating voltage, 50 nA beam current, and 5 μm spot size. A defocused beam was used to analyze domains of secondary origin containing increased amounts of water to minimize the sample decomposition. Applied reference materials, diffracting crystals, X-ray lines, counting times, detection limits, as well as the applied corrections for measured elements are given in the Supplementary Table S1. It has to be noted that the measured F is only an approximation, as the applied analytical parameters are not dedicated for a precise F analysis (apatite as a standard and high beam current). Fluorine measurement in F-bearing minerals is a difficult task, as the obtained X-ray intensity depends on mineral orientation, composition, as well as EPMA operating conditions [35,36,37]. Our study concentrates mostly on REE (and some other minor and trace elements), and F was not treated as a crucial component of allanite. Therefore, we did not perform separate measurements of F (with favorable analytical parameters), and the analytical conditions were adapted to suit predominantly REE measurements. Therefore, due to potential error, the presented F concentrations in allanite are used only for a rough qualitative comparison of domains of different origin. A detailed argumentation of the selected analytical parameters, especially in regard to F and REE measurements, is given in Supplementary Material 1 (SM1).
Element distribution maps were performed for four grains with the most representative textures. The maps for the Gruszków sample were performed using the above-mentioned equipment. The analyzed elements included Ca, Nd, Al, Y, Th, Fe, Si, and Ce. Diffracting crystals and X-ray lines were the same as in spot analyses, except for Nd for which Lβ line and LLIF crystal were used, and P, which was measured on LPET. Remaining parameters include 15 keV accelerating voltage, 50 nA beam current, 1–2 μm step size, and 0.05 or 0.09 s dwell time. The maps for the Sokoliki sample were acquired using a JEOL JXA-8230 SuperProbe Electron Probe Microanalyzer equipped with five wavelength spectrometers at the Laboratory for Critical Elements of the AGH University of Science and Technology in Kraków, Poland. The analyzed elements included Ca, La, Nd, Y, Th, Fe, and Ce. The analytical parameters were set at 15 keV accelerating voltage, 50 nA beam current, 2 µm step size, and 0.05 s dwell time. The diffracting crystals and X-ray lines were as followed: LIF and Kα for Fe, PETH and Mα for Th, LLIF and Lα for La, PETJ and Kα for Ca, LIF and Lα for Ce, LIFH and Lα for Nd, LPET and Lα for Y. The full names of the diffracting crystals are given in Table S1.
Allanite structural formula were calculated on the basis of 12.5 oxygen and 8 cations per formula unit using the WinEpclas program developed by Yavuz and Yıldırım [38], which is based on the structure refinement of Armbruster et al. [39]. For allanite domains of unusual composition (lower REE contents and low totals), the formula calculations were normalized to Si = 3, as normalization to 8 cations results in Si > 3.05 [39]. However, it led to incomplete charge-balance, large A vacancies, slight M vacancies, and unrealistic Feox ratios (close to 1). Alternatively, the Feox ratio was calculated by the use of two cationic substitutions: Ca2+ + Fe3+ ⇿ REE3+ + Fe2+ and Ca2+ + Al3+ ⇿ REE3+ + Fe2+, adopted by Petrik et al. [2]. These exchanges include both oxidation states of Fe and were used to graphically derive the Feox ratios, which were in good agreement with Mössbauer measurements [2]. Transformation and rearrangement of the above substitutions leads to the following equation:
where all values are in atoms per formulae units (apfu) and REE3+ + Th4+ sum involves all cations assigned to the A(2) crystallographic site except Ca. However, this equation does not take into account the Si excess and large A site vacancies; therefore, the Feox ratios may not be correct and serve only as an approximation.
Fe3+/(Fe2+ + Fe3+) = [(REE3+ + Th4+)/Al3+] + 1
3.2. LA-ICP-MS Analysis of Trace Elements
A Thermo Scientific Element 2 high-resolution sector field ICP-MS coupled to a 193 nm ArF excimer laser (Teledyne Cetac Analyte Excite laser) at the Institute of Geology of the Czech Academy of Sciences, Prague, Czech Republic was used to acquire the allanite trace element data. The laser was fired at a repetition rate of 10 Hz and fluence of 3.4 J/cm2 with 30 µm laser spot size. Helium carrier gas was flushed through the two-volume ablation cell at a flow rate of 0.7 L/min and mixed with 0.8 L/min Ar and 0.004 L/min N2 prior to introduction into the ICP. The in-house glass signal homogenizer (design of Tunheng and Hirata [40]) was used for mixing all the gases and aerosol, resulting in a smooth, spike-free signal. The signal was tuned for maximum sensitivity while keeping a low oxide level, commonly below 0.1%. Typical acquisitions consisted of 15 s of blank measurement followed by measurement of TE signals from the ablated materials for another 20 s, with 30 s of wash time between each analysis. This ablation pattern was repeated on each analytical spot with first ablation being used for collection of data at the low mass resolution mode (m/Δm = 300: 25Mg, 27Al, 29Si, 43Ca, 57Fe, 88Sr, 89Y, 90Zr, 93Nb, 118Sn, 137Ba, 139La, 140Ce, 141Pr, 146Nd, 147Sm, 153Eu, 157Gd, 159Tb, 163Dy, 165Ho, 166Er, 169Tm, 172Yb, 175Lu, 178Hf, 181Ta, 232Th, and 238U) and the second ablation for collection of data at the medium mass resolution mode (m/Δm = 4000: 24Mg, 27Al, and 56Fe). The measurement sequence consisted of the repeated blocks of two analyses of NIST SRM612, one analysis of BCR-2 standard, and 10 unknowns.
Trace element data were calibrated against the NIST SRM612 glass using the 27Al as internal standard together with concentration values of the studied samples obtained from EMPA analysis. The minimum detection limit values were calculated by multiplying the variance of the background by 3.25 for individual elements and are included in the Supplementary Table S3. The time-resolved signal data were processed using the Glitter software [41]. The precision of the analyses (1 RSD) ranges between 5% and 15% for most elements. The accuracy was monitored by a homogenized basalt reference material BCR-2 (USGS).
4. Results
4.1. Textural Characterization
The material used in this study is composed of five allanite grains, three from the Gruszków sample (GR-1, GR-2, and GR-3) and two from the Sokoliki sample (SOK-1 and SOK-2). Allanite in the Gruszków dyke forms large (up to 0.4 mm) subhedral to euhedral crystals with slightly rounded margins, growing in/between feldspar or quartz and sometimes in direct contact with biotite. Mineral inclusions in allanite are apatite, feldspar, and quartz. The Sokoliki sample contains subhedral to euhedral allanite crystals of up to 0.6 mm in diameter. In some cases, the grains are rounded and slightly corroded. They grow usually between feldspar and quartz, while no direct association with biotite is seen, at least not in the given thin-section. Mineral inclusions are rare and restricted to titanite (apart from BSE-bright domains, which are secondary and will be discussed separately).
All studied allanite grains exhibit complex growth/alteration textures (shown in Figure 1) and can be divided into three main groups based on their common textural features (Figure 2). Almost all crystals (except for the grain SOK-2) contain a BSE-bright homogenous core (zone 1), which represents the earliest stage of primary allanite crystallization. Under the petrographic microscope, zone 1 appears to be dark brown and strongly pleochroic. The core in the grain GR-1 (Figure 1a and Figure 2a) preserved a euhedral shape, whereas in the majority of the grains the cores are small and anhedral (Figure 1c,d,f and Figure 2b,c).
The core is followed by a wide zone of generally decreasing BSE intensity, displaying strong oscillatory zoning following the shape of the primary core. This zone is named ‘the mantle’ (or zone 2) and is present in all grains (Figure 1 and Figure 2). Like zone 1, the mantle is optically pleochroic, but with a color range from bright brown to orange. The outermost part of the mantle is a BSE-dark zone, optically yellow and isotropic in Gruszków allanites, whereas in Sokoliki allanites, it forms a separate BSE-brighter zone of optically brown color. This zone demonstrates a slightly irregular contact with the preceding mantle and usually does not encompass the entire grain (Figure 1e,f). The contact between the core and the mantle exhibits a reaction zone, in which the rims of the core form irregular, lobate domains, and the mantle partly replaces the core, in worm-like structures (Figure 1b). Such shape is characteristic for Gruszków allanites; however, a similar feature is observed in the SOK-2 grain, where the worm-shaped structures replace the core, irregularly crossing the zone boundaries (Figure 1e). The oscillatory zoning of the mantle from Gruszków allanites is characterized by sharp boundaries between alternating BSE-dark and bright zones, whereas in Sokoliki allanites, the boundaries are more gradual and the difference in BSE intensity is subtle (except for the BSE-brighter zone). In the case of Gruszków allanites, certain zones of the mantle demonstrate an undulating shape (e.g., at the top of the image in Figure 1b). In some places, the oscillatory zoning is replaced by patchy zoning or irregular, ‘wavy’ zones (e.g., GR-2, GR-3, and Figure 1c,d and Figure 2b). Two types of fractures are present within the mantle. The first type is represented by those that encompass the entire mantle and these are sometimes filled with a BSE-bright phase (e.g., Figure 1e,f). The second type involves fractures present only in the BSE-darkest zone of the mantle in both Gruszków and Sokoliki grains (Figure 1a,c,d,f).
The third major textural type (zone 3) comprises all remaining crystal zones, which belong neither to the core nor directly to the mantle. These zones are defined as follows: (3a) crystal rims and recrystallized patches within the mantle of variable BSE-intensity (however brighter than the dark mantle zones), optically yellow and slightly pleochroic, and often irregular and discontinuous (Figure 1c,d and Figure 2b); (3b) extremely BSE-bright patches of nonallanite composition within the crystal rims or in the external parts of the mantle (all grains except SOK-1); and (3c) optically bright brown, irregular domains, entering the grain in places where the mantle is in direct contact with other minerals and cross-cut both the mantle and the core (e.g., Figure 1a and Figure 2a). Because the textural features of these zones suggests late or secondary origin, they will be named from now on as the ‘secondary zones’.
4.2. Major and Trace Element Composition
Table 1 contains representative combined EPMA and LA-ICP-MS analyses (where both were performed for each textural domain). The complete dataset of all analyses is given in Supplementary Tables S2 and S3.
4.1.1. The Core—Zone 1
The chemical composition of zone 1 is consistent between all of the studied allanite grains. Almost all elements demonstrate limited variation in their concentrations (e.g., Ca and Al as seen in Figure 3a). The compositions correspond to pure allanite-(Ce) with high totals between 97 and 100 wt %. Major element oxides, such as CaO, FeOtot, Al2O3, and SiO2 demonstrate the following ranges of concentrations: 10.2–10.5 wt %, 15.6–16.3 wt %, 13.0–13.6 wt %, and 30.2–30.9 wt %, respectively. F, Na2O, and K2O exhibit very low concentrations, often below the detection limit. MgO and MnO range between 0.60–0.82 wt % and 0.27–0.33 wt %, respectively. Light rare earth elements demonstrate the following ranges: 7.0–7.8 wt % of La2O3, 11.8–12.2 wt % of Ce2O3, 1.1–1.2 wt % of Pr2O3, and 2.7–3.0 wt % of Nd2O3. TiO2 reaches 1.8 wt %, whereas ThO2 ranges usually between 0.4 and 0.8 wt %. P2O5 is rather low and does not exceed 0.25 wt %.
The results of trace element analyses revealed very low concentrations (<100 ppm) of elements such as Sr, Zr, Nb, Ta, Sn, Ba, Hf, and U, in both Gruszków and Sokoliki allanites (although Sokoliki cores are represented only by one spot). The Th/U ratio, due to the very low concentration of U, appears to be very high for Gruszków cores (90–105) and considerably lower for the Sokoliki core (40, Figure 3c). The opposite is demonstrated by La/Sm ratio, which is lower for Gruszków cores (Figure 3c). The contents of middle REE (MREE) and HREE are as follows: 1900–2750 ppm for Sm, 50–70 ppm for Eu, 800–1250 ppm for Gd, 80–130 ppm for Tb, 310–550 for Dy, 40–85 ppm for Ho, 90–180 ppm for Er, 10–20 ppm for Tm, 50–120 ppm for Yb, and 6–15 ppm for Lu. In general, Sokoliki cores demonstrate slightly lower contents of middle and heavy rare earth elements. The total REE content is exceptionally high and reaches 20.5 wt %. Chondrite-normalized REE patterns demonstrate an extremely high fractionation between LREE and HREE, with (La/Yb)N of 590–790 (Figure 4a,c). Y content ranges from 1030 to 1920 ppm and is slightly higher for Gruszków cores (Figure 3e). The Y/Ho ratio is similar for allanites from both samples and varies between 21 and 24 (Figure 3e).
On the Altot vs. REE + Y + Sr + Th + Mn diagram proposed by Petrik et al. [2], where Altot represents total Al, the primary cores are located roughly in the middle between ferriallanite and allanite (Figure 5a). The plotted Altot values range between 1.48 and 1.55 apfu. It can also be observed that the points are located between the 0.3 and 0.4 Feox isoline (closer to 0.4), whereas the values calculated by the method of Armbruster et al. [34] are slightly lower (0.28–0.33, Table 1).
Although the core exhibits small variations in element concentrations, the main mechanism of element incorporation is clearly expressed by the following coupled substitution: Ca2+ + Al3+ + Fe3+ ⇿ REE3+ + Mg2+ + Fe2+ (Figure 6a). A slightly weaker correlation observed in diagrams shown in Figure 6b,c indicates minor participation of the substitutions mechanisms including Al3+ ⇿ Fetot + Ti4+ and Ca2+ + Al3+ + REE3+ + Mg2+ ⇿ Fetot + Th4+ + Ti4+, where Fetot is total Fe.
The best way to visually compare the core composition to the remaining zones is to observe the element distribution maps (Figure 7) and the line scan performed for the grain GR-1, extending from the rim to the core (EPMA and LA-ICP-MS analyses separately, Figure 8). The homogeneity of the cores in BSE images is reflected by homogeneity in element concentrations. Compared to the mantle (zone 2), the core of the Gruszków grains is enriched in Ca, Al, LREE, Mn, and Mg (Figure 7a,b and Figure 8d). LREE enrichment of the core is similar to that observed for zone 3a. The most prominent depletion of the core, compared to the other zones (especially the mantle), is related to HREE, Th, Ti, Y, Sr, Ba, U, F, and Na (Figure 7 and Figure 8). Sokoliki allanites display one major difference compared to the Gruszków sample—the core is additionally enriched in Fe, which is not observed in Gruszków allanites (Figure 7c).
4.1.2. The Mantle—Zone 2
The innermost part of the mantle that crystallized after, and in interaction with, the core takes the form of worm-shaped thin domains (Figure 1b). Their composition (only measured by EPMA) is given in Table 1 and Supplementary Table S2, while representative compositional differences between these parts and the core are visualized in variation diagrams in Figure 9. The most significant compositional difference of the ‘worms’ in relation to the core include lower totals (possibly due to a higher amount of water in the structure), considerable increase of F (although it is only an assumption, as F values are not entirely reliable), Na, Sr, Ba, Pb, Y, HREE, Si, Ti, and Th contents (e.g., Figure 9b,d–f), and decrease of Mg, Ca, Al, and LREE concentrations (e.g., Figure 9a,c,e,f). Decreased La/Sm ratio is reflected by a significantly flatter LREE-MREE pattern (Figure 9b) compared to zone 1.
The geochemical evolution of zone 2 (the mantle), although similar in principle, shows certain differences between the Gruszków and Sokoliki allanites. The Gruszków mantle is characterized by a gradual and continuous decrease in LREE, Mg, Mn, and Ca contents (Figure 3a, Figure 7a,b, and Figure 8). In case of Al and Fe, the mantle becomes Al-depleted and Fe-enriched during its initial growth and subsequently an Al-rich and Fe-poor zone is formed, which is followed by a slightly Al-depleted and Fe-enriched rim (Figure 7a). Silica contents demonstrate considerable fluctuations, with concentrations usually higher than those of the core. The LREE depletion (with the exception of the Fe-poor, Al-rich zone, which is slightly LREE-enriched) is coupled with a strong and gradual Th, U, and Ti enrichment (Figure 7 and Figure 8c,g). Th/U ratios are lower compared to the core and show no systematic trend during the mantle formation (Figure 3c). Additionally, there is a considerable increase in HREE (Gd–Lu), Y, Sr, Na, and Ba contents towards the rim (Figure 8). The increasing HREE are followed by a drop in (La/Yb)N (which is more significant for Gruszków mantles—from >600 to 13, than for Sokoliki—from 710 to 210) and La/Sm ratios (Figure 3c), which is also seen in chondrite-normalized REE patterns (Figure 4a,c). Some parts of the mantle also show a slight negative Ce anomaly. The Y content increases significantly (reaching 6600 ppm, compared to 1100–1900 ppm in the core), while the Y/Ho ratio decreases to 17 (from 21–24 in the core, Figure 3e).
The Sokoliki mantles demonstrate a similar decrease in LREE, Mg, Mn, and Ca, as well as an increase in Si, Th, U, Ti, HREE (Gd–Lu), Y, Sr, Na, and Ba; however, the trend is less prominent compared to Gruszków allanites (Figure 3a and Figure 7c,d). There are no fluctuations in Al and Fe contents, which both show a gradual decrease. Th/U contents are only slightly lower than those of the Sokoliki core but similar to those of Gruszków mantles (Figure 3d). The decrease in (La/Yb)N as well as La/Sm ratios is considerably smaller, compared to Gruszków allanites. In general, LREE depletion and HREE enrichment, as well as the REE compositional range of Sokoliki mantles, is moderate (Figure 4c). This is in large contrast to Gruszków mantles, which show a significant difference in REE concentrations between the core and the mantle, as well as a large REE compositional range (Figure 4a). The Sokoliki mantles demonstrate a slight increase in both Y content (from 1030 ppm in the core to 1400 ppm) and Y/Ho ratio (from 24 in the core to 28), compared to decreasing Y/Ho in Gruszków mantles (Figure 3f). One of the main differences between Gruszków and Sokoliki is also the phosphorus content, which is unusually high for Sokoliki mantles, and reaches 3.6 wt % of P2O5, compared to rather low values for Gruszków mantles (<0.67 wt %).
While the most drastic geochemical variations are observed along the core/mantle boundary (for both Gruszków and Sokoliki allanites), followed by a rather gradual element distribution within zone 2, a relatively sharp compositional change is also related to the youngest BSE-brighter zone of the Sokoliki mantles. The most significant variations involve an increase in Ca (mostly visible in distribution maps, Figure 7c,d), Sr, Nd–Gd, Si, Th, and Hf and a decrease in Al and La concentrations. Chondrite-normalized REE patterns are slightly LREE-depleted compared to the preceding mantle zones, resulting in lower La/Sm ratios (Figure 3d). Th/U ratios are significantly higher compared to the preceding mantle; however, they are lower than those of the core (Figure 3d).
The description of the mantle composition in terms of cations in the formula unit is limited, as the calculations show certain shortcomings. Normalization to 8 cations leads to Si >> 3 (indicating large A vacancies or incomplete analyses); therefore, the analyses were normalized to Si = 3. However, such normalization introduces considerable errors [34], including A- and M-site vacancies, as well as unreasonable Feox ratios (close to 1). As a comparison, the Feox ratio was calculated based on Petrik et al. [2] (see Section 3.1 for details). Apart from the excessive silica content (higher than allowed in allanite structure), the elements hindering the proper formula unit recalculation include Ti (up to 0.36 apfu) and Th (up to 0.13 apfu). As the analyses cannot be properly recalculated based on allanite stoichiometry, the obtained apfu values have to be treated with caution.
On the Altot vs. REE + Y + Th + Sr + Mn diagram, zone 2 shows large variations. The points are shifted towards and considerably beyond the ferriallanite-epidote join (with the dominance of ferriallanite for most points) (Figure 5a). It is important to note that the worm-shaped domains are located further from the core than the most points of the mantle. Most of the Gruszków mantle falls around the 0.6 Feox isoline, whereas the Sokoliki mantle is concentrated close to the 0.5 isoline. These values are significantly distinct from those calculated according to Armbruster et al. [39] but relatively close to those calculated on the basis of Petrik et al. [2] (Table 1 and Table S2).
Mechanisms of element substitution differ slightly from those operating in the allanite core. On the Ca + Al + Fe3+ vs. REE + Mg + Fe2+ diagram (Figure 6a), both Gruszków and Sokoliki mantles show a mostly positive and rather weak correlation (in contrast to strong negative correlation in the cores), which mainly illustrates the coupled Ca, Al, and REE depletion and Fe enrichment from the core to the mantle rim. Relatively visible negative correlation on Altot vs. Fetot + Ti and Ca + Al + REE + Mg vs. Fe + Th + Ti diagrams may suggest moderate operation of the corresponding substitution mechanisms (Figure 6b,c). The large scatter of the points in all diagrams in Figure 6 reflects the erroneous formula unit calculations due to excessive Si, Ti, and Th, as well as A-vacancies and/or incomplete list of analyzed elements.
4.1.3. Secondary—Zones 3
The alteration zones demonstrate a wide range of compositions. Within the 3a subgroup, CaO and Al2O3 range between 2.9 and 13.7 wt % and 7.8 and 15.6 wt %, respectively. The majority of the points however, show values lower than the core and similar to the mantle. A similar case is observed for Mg, Fe, and LREE, which consistently demonstrate lower contents compared to the core and similar to those of the mantle. Silica demonstrates large variations, from 27.4 to 32.8 wt % SiO2 (encompassing most of the core and the mantle compositions). The 3a zones are enriched in Mn, F, Na, Y, Ti, and Th. Chondrite-normalized REE patterns of the Gruszków 3a domains show a less steep LREE-MREE profile, with higher MREE concentrations compared to the core and the mantle (Figure 4b). The HREE contents are lower compared to the mantle but significantly higher than those measured from the core (Figure 4b). In the case of Sokoliki allanites, the 3a zones are significantly LREE-MREE-depleted (compared to the core and the mantle), with HREE similar to that measured from the mantle (Figure 4c). A characteristic feature of the 3a domains (both Gruszków and Sokoliki) is very low La/Sm and Th/U ratios (Figure 3c,d). (La/Yb)N ratios are similar (~120) for both Gruszków and Sokoliki zone 3a. Yttrium contents and Y/Ho ratios differ slightly between Gruszków and Sokoliki. In the former case, Y/Ho ratio does not change significantly from that of the core, despite higher Y and Ho contents, whereas for zone 3a from Sokoliki, both Y and Y/Ho are similar to that of the core and the mantle (Figure 3c).
On the Altot vs. REE + Y + Th + Sr + Mn diagram, the plotted compositions of the 3a subgroup demonstrate significant scattering, with some of them being plotted close to the compositional range of the core and others closer to the ferriallanite-epidote or allanite-epidote joint (Figure 5b). Similar to zone 2, the determination of the Feox ratio is difficult due to significant inconsistencies between the formula unit of zone 3a and standard allanite stoichiometry (high Si, large A vacancies). Poor correlation between the Feox values calculated by different methods (especially for individual points) is most probably a result of element mobility due to alteration (0.04–1.00 by Armbruster et al. [39], 0.32–0.95 by Petrik et al. [2]).
The substitution mechanisms responsible for compositional variations within the 3a subgroup are in general similar to those operating within the mantle (zone 2), with the same rather poor level of correlation and large scatter of the points (Figure 6b,c). The two major substitution reactions are as follows: Altot ⇿ Fetot + Ti4+ and Ca2+ + Al3+ + REE3+ + Mg2+ ⇿ Fetot + Th4+ + Ti4+.
The most distinguishable parts of the alteration domains are the extremely BSE-bright patches demonstrating distinct compositional characteristics—the 3b zones. They show a wide range of compositions (Table 1 and Table S2), which do not correspond to allanite, as the totals are as low as 58 wt %. They are easily distinguishable in element distribution maps (Figure 2 and Figure 7), especially in grain GR-2. The exceptional enrichments include F (although the exact values are probably imprecise), Y (up to 0.8 wt % of Y2O3 in Sokoliki and 4 wt % in Gruszków), REE (up to 51.5 wt % of total REE2O3), Th (up to 11 wt % of ThO2), and U (up to 2040 ppm). Additionally, SOK bright domains are more enriched in P (up to 18 wt % of P2O5). Compared to all remaining zones there is a considerable decrease in Mg, Ca, Mn, Fe, Al, and Si contents (e.g., Figure 3b). Based on one LA-ICP-MS analysis of one 3b zone from GR-3 grain, there is a considerable enrichment in HREE in relation to LREE, resulting in lower La/Sm and (La/Yb)N ratios (Figure 3d) and less fractionated chondrite-normalized REE patterns (compared to the cores, mantles and zone 3, Figure 4b). There is also a slight negative Ce anomaly (Figure 4). Th/U ratios are as low as in the mantle. Similarly to high Y contents, Y/Ho is significantly higher compared to zones 1, 2, 3a, and 3c (Figure 3c).
From the composition, it is difficult to determine what mineral constitutes the 3b domains. Low totals, as well as high F and REE concentrations, suggest that the composition of these domains approaches slightly that of REE-fluorocarbonates (e.g., bastnäsite-(Ce) or synchysite-(Ce)). On the other hand, presence of elements such as Al, Si, and Fe in relatively high concentrations (higher than allowed in the structure of the proposed REE-fluorocarbonates), may be a remnant of allanite. It is likely that the BSE-bright domains observed in BSE images are, in fact, a mixture of very fine-grained allanite (possibly highly altered) and REE-fluorocarbonates (in case of Sokoliki possibly also monazite), as no intermediate phase exists.
Zone 3c is poorly represented in the dataset, as only one EPMA and one LA-ICP-MS analysis from grain GR-1 is available (Table 1). However, contrasting BSE-intensity, textural context, and different intensities of element concentrations on distribution maps distinguish this zone from the surrounding core and mantle, as well as the other zones from group 3 (Figure 2a and Figure 7a). Compared to the core, elements such as Ca, Al, Si, and Sn show considerably higher concentrations (13.07 wt %, 15.98 wt %, 32.02 wt %, and 220 ppm, respectively), whereas Mg and Ti are significantly depleted (0.23 wt % and 0.50 wt %, respectively). F, Th, and U are on the same level as in the core. Concentration of REEs are in between the values measured for the Gruszków core and the mantle (ΣLREE(La to Nd) = 18.76 wt %, as opposed to 23.2–24.2 wt % for the core and 5.9–19.1 wt % for the mantle; ΣHREE(Gd to Lu) = 2200 ppm, as opposed to 1500–2300 ppm for the core and 1800–5600 ppm for the mantle). The result is an intermediate (between the core and the mantle) chondrite-normalized REE pattern (Figure 4b). There is no significant change in Sm and Eu content (compared to the core or the mantle). (La/Yb)N ratio is similar to that of zone 3a (140). La/Sm and Th/U ratios are almost identical as those of the core. Yttrium content is only slightly higher than that of the core (1800 ppm), whereas the Y/Ho ratio is within a similar range (23, Figure 3c). Compared to the zone 3a, the chondrite-normalized REE pattern is significantly MREE-depleted (while LREE and HREE remain relatively on the same level, Figure 4b).
In Altot vs. REE + Y + Th + Sr + Mn diagram, the zone is located closer to the allanite–epidote join (Figure 5b) and between 0.4 and 0.5 Feox isoline. Such range is in agreement with the Feox value calculated by the use of both Petrik et al. [2] and Armbruster et al. [39] methods—0.44 and 0.42, respectively. Unfortunately, the exact determination of substitution mechanism that operated during the formation of zone 3c is impossible, due to the absence of additional data points
5. Discussion
5.1. Crystallization Conditions of the Allanite Core
Allanite-(Ce) is a common accessory mineral in metaluminous to peraluminous intrusive and volcanic rocks of granitic composition, being of either magmatic, hydrothermal, or mixed origin [2,5,43]. The studied allanite cores are most probably of igneous origin, due to the relatively euhedral shape (seen only in GR-1, as in the remaining grains it is highly altered) and Feox ratios (0.3–0.4) typical of magmatic allanite [2,5]. In general, the crystallization of magmatic allanite, as well as its composition, is strongly dependent on the melt chemistry, temperature, halogen activity, and presence of other accessory minerals. Whereas the bulk-rock A/CNK is one of the main factors dictating the possibility of allanite formation (metaluminous melts are favored over peralkaline and peraluminous melts), relatively high Ca and low P are also required for allanite to crystallize [2,6]. High phosphorus content, coupled with high Ca, Si, and F, would favor monazite and apatite over allanite, although the coexistence of monazite and allanite has been reported [43]. Both Gruszków and Sokoliki samples represent weakly peraluminous facies (A/CNK = 1.02, [14]), and in both, allanite is one of the main REE-bearing phases, next to apatite and titanite. As composite dykes represent late hybrid species, built of numerous felsic, mafic, and intermediate domains, a question arises about the composition of the melt from which the allanite cores crystallized, i.e., if magmatic end-members can be distinguished or if a mixed origin can be inferred. Although there are no well-established systematic compositional differences between allanite from different rock types, the composition of the studied allanite cores can be compared to the existing data on igneous allanite. In the Altot vs. REE + Y + Sr + Th + Mn diagram (Figure 5a), the primary cores of the studied allanites plot roughly in the middle of the ferriallanite-allanite join. Altot values are 1.48–1.55 (apfu), which is typical of allanites from more aluminous rocks [5]. Generally, moderate contribution of the ferriallanite component, as well as higher Altot contents, characterize allanites formed in calcic, alkali-calcic, or calc-alkaline rocks related to orogenic compressional geological settings (mostly I-type); however, some postcollisional granites of A-type affinity may show similar Al content [7]. Feox ratios inferred from the diagram (which are also in good agreement with the ratios calculated from the formula unit) range between 0.35 and 4.10 apfu. Based on the compilation of allanite compositions made by Vlach and Gualda [5], such values are near the boundary marking the distinction between metaluminous, magnetite-bearing rocks from active continental margins and volcanic arcs and metaluminous to peraluminous, ilmenite-bearing rocks originating in active continental margins and collisional regimes. Some allanites formed in extensional regimes, including postcollisional A-type or S-type granites, are characterized by similar Feox ratios (0.3–0.4). It seems that the studied allanite cores share similar compositional features with those from granites of both collisional and postcollisional settings. Consequently, the assignment to specific composition of the magma from which it crystallized (more felsic or mafic affinity) is rather impossible.
Next to the melt chemistry, the allanite stability and time of its crystallization strongly depends on temperature and existence of other accessory REE-bearing minerals. Vazquez et al. [44] found that allanite crystallizes at an interval of 750–770 °C under oxygen fugacity conditions close to Ni–NiO (NNO) buffer and pressures below 7 kbar. At pressures <7 kbar, the crystallization temperature of allanite is independent of the pressure. However, the experiments were performed on high-silica rocks (SiO2 > 75 wt %), so the results may not strictly apply to the studied dykes (~68 wt % of SiO2). Hermann [45] used dacitic melts (60–65 wt % SiO2) in order to constrain allanite-melt partitioning of trace elements; however, his experiments involved pressures >2GPa. The temperatures of allanite crystallization demonstrated a narrow range around 850 °C at 2 GPa, which increased gradually with increasing pressure, reaching ~750–1050 °C at 3.5 GPa. Chesner and Ettlinger [46] reported allanite in volcanic rocks erupting in temperatures <800 °C, whereas in those >800 °C, allanite was absent. Experiments performed by Anenburg and Mavrogenes [47] revealed that no allanite crystallized above 750 °C in melts with abundant apatite and high silica activity. The studied composite dykes contain apatite, titanite, and zircon as the most abundant members of the accessory mineral assemblage. Temperatures of the formation of these minerals were calculated by Gros et al. [34] and are as follows (each for Gruszków and Sokoliki): 925 and 940 °C, 690 and 780 °C, and 830 °C (similar for both Gruszków and Sokoliki), respectively. Taking into account the textural context and temperatures of allanite crystallization presented in literature, it can be stated that the crystallization of allanite cores most probably took place in the temperature interval of 700–800 °C (when most of the accessory minerals already started to crystallize, indicating that it did not impede the formation of allanite). Additionally, a narrow range of chemical composition and no visible zoning in the cores point to crystallization from a relatively homogenous magma. This is in contrast to complex textures observed in alkali feldspar and apatite in these rocks [28,29,30,31], which suggest formation in a heterogeneous environment. However, these minerals crystallized rather early. Whether the core homogeneity points to later homogenization of the melt towards granitic composition or simply to allanite formation from a separate relatively homogenous magma domain, it is difficult to determine.
5.2. Late-Stage Infiltration by Fluids
While the texture and composition of the core undoubtedly points to the magmatic stage, the remaining zones of the studied allanites (in the case of SOK-2, the entire grain) were most probably affected by (or are products of the interaction with) late-stage/postmagmatic fluids. The fact that zones 3 are superimposed over the mantle (and the core in case of zone 3c), indicates that a subsequent (possibly separate) episode of fluid alteration took place.
5.2.1. First-Stage Alteration—Origin of the Mantles (Zone 2)
A major change in chemical composition as well as unusually shaped and sharp textural contact between the cores and the mantle suggest a drastic shift in the crystallization environment. The worm-shaped domains (zone 2) protruding into the core represent an interaction front of an advancing new liquid phase (melt or fluid), significantly changing the allanite composition. The morphology of the interaction resembles, to some extent, the coupled dissolution–reprecipitation textures observed in minerals undergoing hydrothermal alteration by fluids [9,48,49]. The question arises whether the penetrating agent is a new supply of melt or fluid. Zone 2 is characterized in most cases by oscillatory zoning, while in case of GR-2 and GR-3, the ‘wavy’ or patchy zoning dominate. Oscillatory zoning is a common magmatic texture in minerals (e.g., [50]); however, hydrothermal growth may also produce similar textures [51,52,53]. The major compositional changes involve considerable enrichment in Th, U, alkalis, Fe, Ba, Y, HREE, Si, Ti, and Sr and depletion in Mg, Ca, Al, and LREE. If one considers a melt to be a potential liquid interacting with the core, it has to be of sufficiently distinct chemistry, in order to disequilibrate the existing allanite and produce allanite with such compositional differences. Composite dykes are hybrid rocks, formed by late-stage mixing of felsic and mafic melts [14], so the only candidate is a mafic or hybrid melt (if we assume that the core crystallized from a magma of a relatively granitic composition, as indicated by its compositional characteristics). However, a melt of mafic or partially mafic affinity, would most probably destabilize allanite, instead of crystallizing a new, LREE-poor, water-rich (as suggested by low totals) allanite-like phase. While allanite is rather scarce in mafic and intermediate rocks, its composition is usually characterized by high Ca, Al, and Mg and low REE contents [54,55]. In peralkaline rocks, low Al relative to alkalis limits crystallization of allanite (at least in early stages), favoring the formation of other REE-rich phases, e.g., chevkinite [5]. Whereas the studied allanite mantles (zone 2) are enriched in Ba, Sr, Fe, and Ti, which would favor the participation of a lamprophyric, Ba-, Sr-rich melt (which is the mafic end-member in Karkonosze granitoid pluton, [14]), the depletion in Ca, Al, and Mg strongly argues against such hypothesis. Additionally, a melt would crystallize an allanite with a fixed (and rather low) number of volatiles (mostly water), whereas the studied mantles have variable and low totals, associated with Si excess and A-site vacancies, hindering the proper formula calculations (typical for altered/hydrothermal allanite, [6,9,56]). Ca and Mg are easily mobilized in hydrothermal fluids, especially in the presence of Cl [57]. In such case, circulating fluid might have removed Ca and Mg from the magmatic allanite.
REE variations also support hydrothermal origin of the mantle. While LREE significantly decrease, HREE-Y become gradually increased (evidenced by a drastic drop in (La/Yb)N ratio). Such a trend is inconsistent with the evolution of the melts forming the Karkonosze pluton [14], as the bulk-rock Y decreases with increasing SiO2, whereas Yb is highly variable and behaves differently for each rock variety of the pluton (systematically increases only during evolution of the equigranular granite). On the other hand, LREE tend to be more mobile in fluids, while HREE and Y remain fixed in minerals [10,11,58]. Allanites enriched in HREE and Y are more typical of the hydrothermal environment than LREE-rich allanites crystallizing from magmas. Although in the allanite mantles LREE still dominate over HREE and Y, the trend of gradual LREE depletion and HREE-Y enrichment may point to hydrothermal alteration [5,7,9,11,12,59]. Kusiak et al. [19] documented a similar process in case of zircon re-equilibrated with late-magmatic fluids from magmatic enclaves present in the pluton. The porous zones of the zircon, being the result of dissolution–reprecipitation, were LREE-depleted and MREE-HREE-Th-Y-enriched relative to the unaltered zircon domains. The zircons also share a similar feature with zone 2 of the studied allanites, i.e., Ce anomaly, which is positive in zircon and negative in some of the zone 2 domains (mostly in Gruszków allanites). Decoupling of La and Ce is usually attributed to a shift in the oxygen fugacity towards higher values, in which Ce4+ prevails over Ce3+ and/or low temperatures of the hydrothermal fluid. Cerium usually enters the allanite structure in the form of Ce3+, in which case the lower Ce concentrations and negative Ce anomaly would be a direct sign of oxidizing conditions (e.g., [60]). However, there is no rule against the substitution of Th4+ by Ce4+, meaning that the anomaly has a different origin (e.g., different mobility and/or partitioning), impossible to determine on the basis of present data. The oxidizing nature of the fluid would have to be supported by analyses of other alteration-related minerals, in which quadrivalent Ce is present (e.g., zircon, thorite, and cerianite). Unfortunately, no data on Ce content in potentially altered zircons is available. No Th-Ce4+-rich minerals have been found in the close vicinity of the studied allanite crystals, although Th–U mineralization is common within the pluton [37]. Consequently, the negative Ce anomaly may be an indicator of more oxidizing conditions but not a discriminating one.
The variations in Y/Ho between the magmatic core and the potentially hydrothermal mantle also point to the presence of fluid instead of melt. The geochemical behavior of Y and Ho is similar, due to almost identical ionic radii (1.019 Å and 55 1.015 Å, respectively; [61]) and the same valence electron structure. Therefore, in high-temperature igneous processes, these elements are usually not fractionated from each other. On the other hand, deviation from magmatic Y/Ho values is a strong indicator of low-temperature, fluid-related processes [62]. Anenburg et al. [12] reported significantly elevated Y/Ho ratios for hydrothermal fluoroapatite and adequately lower Y/Ho ratios for coexisting hydrothermal allanite (as Y is preferably partitioned into fluoroapatite). Y/Ho fractionation is explained by different solubility of Y and Ho F-complexes [63]. For temperatures >250 °C, solubility of HoF3 decreases relative to YF3, indicating that Y is more easily removed from the mineral structure. Similar relation is observed for Y and Ho Cl-complexes [64]. This strongly agrees with the decreasing Y/Ho ratios in the allanite mantles compared to the core (Figure 3e,f).
In addition to Y, HREE, and F, the mantles become also significantly enriched in Th. Although Th is a relatively immobile element, in contrast to LREE, the presence of fluoride or sulfate ligands can increase its solubility [65,66]. The enrichment in F in the mantle is not significant, suggesting a minor contribution of F− ions. Higher F content in the fluid would remove Th from allanite and redeposit it in Th-rich minerals. The Th–U mineralization is abundant in the Karkonosze pluton [67]; however, no assemblages of Th-rich minerals are found within the studied composite dykes (only one example of possible monazite in Sokoliki allanites). It is possible, that the composition of the particular fluid circulating during the hydrothermal stage of the studied samples, hindered the remobilization of Th. Depletion in Ca and Mg argues for the presence of Cl in the fluid responsible for the zone 2 composition, which does not form stable complexes with Th [68]. Alternatively, Th, which is distinctly enriched in the outermost parts of the mantle, may have also been supplied from the fluid.
One of the characteristic traits of the mantles is also a significant increase in Feox ratios (with one zone demonstrating a drastic drop). While higher Feox (>0.5) is typical for hydrothermal allanites (as well as the trend of allanite crystallization from core to rim is related to an increase in Feox ratios, although not that significant, [2]), it does not necessarily reflect a change in oxygen fugacity towards oxidizing conditions. It is rather related to the decrease in REE contents (which are usually remobilized by fluids during hydrothermal stage), which enter the allanite structure together with Fe2+ [2,11,69]. The physicochemical properties of the fluid also have a considerable influence on the oxidation state of iron. Giuli et al. [70] documented a strong relation between the alkaline nature of the melt/fluid and elevated Fe3+/Fe2+ ratio. Fe3+ is also promoted in lower temperatures [71,72]. Therefore, the increased Feox ratio in allanite mantles may be a result of alkaline, low-temperature, REE-poor fluids.
While the composition of the mantle is clearly a result of fluid alteration, the mechanism of its formation is debatable. It is difficult to determine where the magmatic core ended its crystallization (as in case of many grains, we see only a small remnant in the grain interior), i.e., if the entire mantle (or its part) was originally magmatic (before the infiltration of the fluid) or some part crystallized from the fluid. The partially euhedral shape of the grains supports the former option, as hydrothermal growth would be most probably limited by narrow spaces between the crystallized rock-forming minerals. Alternatively, the thin LREE-rich, Fe-poor zone (visible in GR-1, Figure 1a) may be the original margin of the core. The first zone of the mantle (interacting directly with core) may represent the initial injection of the fluid. Subsequent infiltration produced a BSE-darker undulating zone (visible at the top of the image in Figure 1b). It depleted the mantle in LREE, which were subsequently fixed in the LREE-rich zone. Due to higher LREE content, Fe (as well as Feox) decreased [11,69]. The remaining BSE-dark zone of the mantle crystallized from the fluid, reflecting its compositional characteristics, such as enrichment in HREE, Th, Y, Na, and F. A similar case is observed in Sokoliki allanites, i.e., by the BSE-bright zone crystallizing just before the BSE-dark 3a zone. Its contact with the preceding zone suggests that it may have crystallized after the penetration of the fluids into the core. It is LREE-enriched compared to the mantle, which may be explained by LREE removal by the fluid from the magmatic core.
To summarize, the compositional features of the mantle point to extensive interaction with fluids, mostly resulting in Ca, Mg, Al, and LREE removal from allanite structure and enrichment in relatively immobile Th, HREE, Y, and alkalis. Chondrite-normalized REE patterns are flatter and decreasing Y/Ho ratios point to favored enrichment in HREE relative to Y. Increasing Feox ratios are mostly related to low REE contents but may also reflect alkaline nature and low temperature of the fluids. The fluids penetrated deeply into the core (in the case of SOK-2, they erased the primary core completely). The first half of the mantle can be an altered core, whereas the subsequent zones crystallized most probably from the fluid.
5.2.2. Second-Stage Interaction with Fluids—Formation of Zones 3
The textural context of zones 3, as well as some significant compositional difference in relation the zone 2, suggest a subsequent and separate episode of alteration. The large compositional range of these zones was probably the result of extensive interaction between the particular zones within allanite (core/mantle) and the percolating hydrothermal fluids. The 3a secondary zones, observed along crystal margins, as well as deeper within the mantle, are most probably the products of mantle recrystallization. Despite the chemical variations, these zones are, like the mantle, generally MREE-, HREE-, and Th-enriched (compared to the core) and LREE-depleted, which is typical for hydrothermal and altered allanite, documented from various occurrences [5,7,9,11,12,59]. The enrichment in Th observed in the mantles has also been inherited by 3a zones (although to a smaller extent). The source for Th is most probably the dissolved allanite mantle.
However, there are several differences between the composition of the mantle and zones 3a, which may be related to the elements that were removed from the originally magmatic allanite. Although Ca shows a wide range of concentrations, in many cases the Ca contents of the 3a zones are higher than those of the mantle. Most probably, Ca removed from the primary allanite was subsequently incorporated in the secondary populations of allanites, usually forming rims. LREE content of these rims is still low, indicating that the excess of removed LREEs (from the mantle) still remained in the fluid. The decoupling of Ca and LREE may be explained by the fact that the physicochemical properties of the fluid caused Ca to be more quickly redeposited. A similar case was documented by Poitrasson [9], who stated that REE3+ are more stable in solution, being more strongly complexed by aqueous ligands compared to Ca2+. This is true, as long as the fluids are Cl-free, as even a small amount of Cl causes Ca to be extremely mobile [57]. It can be inferred therefore, that the composition of the fluid forming the mantle and zones 3a was slightly different, resulting in the change of Ca solubility (whereas LREE remained strongly complexed by fluid). This change however, was most probably minor, as some 3a zones show similar Ca content as the mantle. Alternatively, an additional source of Ca in the fluid can be considered, e.g., dissolution of apatite, which is abundant in both Gruszków and Sokoliki samples and bears traces of fluid-induced alteration [31].
The contribution of the ferriallanite component, as well as Feox ratios, in zones 3a are similar to those of the mantle, suggesting similar conditions favoring Fe3+ over Fe2+ (discussed in Section 5.2.1). The 3a zones are also shifted towards the ferriallanite-epidote join. Whereas in many altered zones the ferriallanite component dominates over epidote, some outermost zones are of almost pure epidote composition (in GR-3 and SOK-1) and sometimes also strongly altered. The shift from allanite to epidote composition is one of the typical trends of allanite alteration by hydrothermal fluids [11,12], indicating the termination of REE circulation (as they become removed from the system or fixed in secondary minerals).
The only secondary phase of nonallanite composition related to the postmagmatic alteration are the BSE-bright 3b zones (e.g., Figure 2b). Their chemistry seems to represent a mixture of allanite-(Ce) and bastnäsite-(Ce) or synchysite-(Ce). Formula calculations do not provide any reasonable results, so the chemical analyses are most probably derived from several different minerals. It is probable that the BSE-bright domains are simply fine-grained aggregates of relict allanite and REE-fluorocarbonates, indistinguishable by the use of electron microprobe. REE-fluorocarbonates such as bastnäsite-(Ce) or synchysite-(Ce) have been widely reported as alteration products of allanite [7,59,60,73,74]. Bastnäsite-(Ce) usually forms pseudomorphs after allanite, accompanied by amorphous Si–Al material (which was not recognized in our allanites; however, its presence cannot be excluded). Its formation includes dissolution, transport, and precipitation [74]. In case of the studied allanites, the transport can be excluded as REE-fluorocarbonates crystallized immediately within the altered allanite. Some studies of bastnäsite also indicate that its formation requires the presence of CO2 and F in the fluid and relatively high pH, as well as rather low temperatures ([10,60] and references therein). The chondrite-normalized REE patterns of the zone 3b (which is a mixture of allanite and REE-fluorocarbonates) also demonstrates a negative Ce anomaly, which, similarly to the allanite mantles, may point to an oxidizing and/or low-temperature nature of the fluid [60]; however, this is not necessarily the case.
The LREE, Th, and Y present in elevated concentrations in the zone 3b (more accurately, in REE-fluorocarbonates or other unidentified REE-Th-Y-rich phases) were most probably supplied from the fluid, which previously removed them from primary allanite. Although Th is mobile only in specific fluid conditions [65,66,68], a complete dissolution of allanite would still release Th, which then could be immediately redeposited in 3b aggregates. Additionally, presence of F in the fluids could have facilitated the removal of thorium from allanite and other Th-rich minerals. The source of F (both for zones 2 and 3, whether it is an altered, secondary allanite or REE-fluorocarbonate) can be dissolution of fluorapatite and/or chloritization of biotite, both of which are common in the studied samples. Additionally, the melt from which the studied dykes crystallized was rich in F [34], which could have been inherited by the magma-derived hydrothermal fluid. The absence of F-based minerals, e.g., fluorite, may indicate insufficient F saturation in the fluids and/or low (or changing) Ca content; however, the exact degree of F-enrichment in the fluid is difficult to determine.
While the composition of the altered allanite and secondary minerals undoubtedly indicates REE remobilization, the exact property of the fluid (among those derived on the basis of the alteration products) allowing their transport and/or redeposition can be roughly determined from the available experimental data on REE behavior in hydrothermal fluids. In contrast to a rather old conviction that F-bearing fluids are capable of remobilization and transport of REE in the form of REEF2+ complexes, more recent extensive evaluation of the experimental results led to a conclusion that fluoride acts as a binding ligand, promoting precipitation of secondary REE-F-rich minerals [58,64,75,76]. This is related mostly to the strong association of H+ with F- as HF0 and low solubility of REE-F phases [76]. On the other hand, chloride complexes are the ones responsible for REE transport in hydrothermal systems [58,64,75,76]. In our study, the REE were efficiently removed from the primary allanite structure (zone 2); however, there is no evidence of prolonged transport, as secondary phases precipitated within the same grains, usually on the margins. The simultaneous removal of Ca and Mg from allanite mantles suggests the presence of Cl- ions, which could have also been responsible for REE removal (although the participation of F cannot be entirely excluded). The increase of Ca content in some 3a zones may be, as suggested in the beginning of this section, an indicator of slight change in the composition of the fluid—from Cl- to F-dominated. If the fluid became enriched in F (from dissolution of fluorapatite and/or chloritization of biotite), then the formation of additional REEF2+ complexes (which were possibly already present in the fluid) would result in an immediate redeposition of REE in the form of REE-fluorocarbonates. Additionally, the formation of LREE-F-rich phases (e.g., bastnäsite-(Ce)) and enrichment in HREE in the altered allanite agrees with the documented fractionation of REE by hydrothermal fluid due to differences in the stability of LREE and HREE complexes (regardless of the particular ligand present in the fluid) [75,77].
While zones 3a and 3b formed within the mantle (zone 2), zone 3c is related directly to the core, and its composition demonstrates some differences in the alteration mechanisms. Enrichment in Ca, Al, Si, Mg, and HREE is coupled with LREE, Ti, and Sr depletion, with no modification of Th and F content. The most plausible substitution mechanism responsible for the chemical variations is REE3+ + Fetot + Ti4+ ⇿ Ca2+ + Al3+. The removed REE3+ are represented mostly by LREE, as HREE remained fixed in the altered zones. While the composition of the fluid responsible for the formation of zone 3c is probably similar to that associated with zone 3a, the reason for the resulted distinct chemical trends, lies most probably in the composition of the reacting domain and the alteration mechanisms. In the case of zones 3a and 3b, the fluid was interacting with the Th-, HREE-, and F-rich and LREE-, Ca-poor mantle, leading to its dissolution and further recrystallization, whereas in zone 3c, the alteration affected a LREE-, Ca-rich and Th-, HREE-poor core and involved mostly leaching of selected elements.
5.3. Composition of the Hydrothermal Fluids
While many characteristics of the fluids responsible for the observed alterations were already mentioned in previous sections, here, we would like to provide a more complete description, relate it to the whole-rock chemistry of the studied dykes, and point out the subtle differences between the two studied samples.
The removal of Ca, Mg, and LREE from the allanite mantles indicates the presence of Cl during the earlier stages of hydrothermal alteration. Thorium is rather immobile in Cl-bearing fluids, which resulted in enriched Th contents. The Th-enrichment of the outermost zone of the mantle is most probably a result of high Th content in the fluids themselves. Slightly elevated F concentrations in the mantles may suggest a minor contribution of F in the fluid. Fluid inclusion studies of the hydrothermal solutions in pegmatites from the pluton documented NaCl and CaCl2 salts as the dominating components of the fluid [78]. Some zones of the mantles exhibit a negative Ce anomaly, which may point to dominance of Ce4+ over Ce3+ due to the more oxidizing conditions and low temperature of the fluids. However, there is no additional support for this statement, so it is only a speculation. Increasing Feox ratio is typical for hydrothermal alterations in the presence of alkaline and low-temperature fluids. Elevated content of Na and K also supports the alkaline nature. Additionally, allanite with high Ti content (not unlike the allanite altered domains from this study) is typical of more alkaline environment and extensional tectonic settings [5]. Consequently, the fluids responsible for the alteration of allanite mantles are most probably Cl- and alkali-, Th-, HREE-, and Y-rich (visualized by the enrichment in these elements in the outermost zone of the mantle), with minor amount of F (increasing towards the rim), alkaline, oxidizing, and of low-temperature.
The fluids participating in the formation of zones 3 are similar in many aspects. Higher concentrations of alkalis, crystallization of bastnäsite (which requires high pH), and higher Fe3+/Fe2+ ratio indicate an alkaline and low-temperature nature of the fluid. A negative Ce anomaly in zone 3b points to oxidizing conditions (and low temperature) during alteration. However, immediate crystallization of REE-fluorocarbonates after the dissolution of former allanite, suggests a shift from Cl-dominating to F-dominating composition, in which REE fluoride complexes are less stable and precipitate in the form of REE-fluorocarbonates. The increase in F content was caused most probably by extensive dissolution of apatite (which was insignificant in the early stages of hydrothermal alteration) and chloritization of biotite. Additionally, the fluids contained most probably considerable CO2. Therefore, the fluid can be characterized as F-, CO2-rich (with minor Cl), alkaline, oxidizing, and of low-temperature.
There is one significant difference between the composition of the altered domains in Gruszków and Sokoliki allanites. The latter are additionally enriched in phosphorus and depleted in Y. The sample itself is enriched in P2O5 and Y-poor compared to Gruszków [14]. The fluid percolating in the Sokoliki sample may have contained significant among of PO43- ions, which are considered to form insoluble complexes with REE, leading to precipitation of REE phosphates (e.g., monazite). However, monazite is rare among the alteration products (one BSE-bright domain with high P2O5 content of 18 wt %, may contain a minute inclusion of monazite). Its crystallization was most probably limited by higher pH and high Ca-, F-, and alkali concentrations in the fluid, which promoted crystallization of REE-F-Ca-carbonates, e.g., bastnäsite or synchysite [10,79,80]. It is probable that the fluids in the Sokoliki dyke were enriched in F- and PO43−, compared to Gruszków, which limited the remobilization of REE and Y. This may be one of the reasons of lower ranges of chemical variations in the alteration products and weaker LREE vs. HREE fractionation, visualized by higher LREE/HREE and Y/Ho ratios (Figure 3b,c and Figure 4c).
The alkaline nature of the fluids is reflected in the whole-rock composition of the rocks, which shows enrichment in Na and K [17]. As mentioned in the section Geological Setting and Research Material, the composite dykes are often plotted in the alkali-calcic and alkalic [15] and A-type region [16]. They also exhibit enrichment in high fields strength elements. Słaby et al. [17], Słaby [18], and Kusiak et al. [19] reported Y-HREE-rich assemblages and Y-HREE-rich zircon re-equilibrated by late-magmatic fluids in composite dykes and late magmatic enclaves from the Karkonosze pluton. Although the enrichment in HREE-Y (compared to LREE) in the studied altered allanites may be a result of their lower mobility, it cannot be excluded that they were supplied partially by the fluids. Overall, HREE and HFSE enrichment is typical of A-type alkaline granites from extensional settings [16]. While Słaby [18] proposed a mixed mantle–crust origin of the fluids interacting with the studied minerals, the source of the fluids responsible for allanite alteration cannot be precisely identified on the basis of present data. Nevertheless, the circulating alkaline fluids significantly affected the whole-rock chemistry of composite dykes, completely modifying its geochemical signature and significantly distinguishing them from the surrounding rocks.
5.4. Influence of Metamictization
Metamictization is often documented in allanites due to high concentrations of radioactive elements (mostly Th). It is commonly known that metamict allanite is more prone to alteration (due to structural damage, [13]). Unfortunately, it is often difficult to define the temporal–spatial relationship between metamictization and alteration. The age and temperature determinations of hydrothermal processes may however, provide some estimates. The fluid activity observed in the composite dyke can be roughly related to biotite chloritization and documented Th–U mineralization. The former was studied by Wilamowski [81], who determined chlorite crystallization temperature at 300 °C and, based on hydrogen isotopes, pointed to mixed magmatic–hydrothermal origin of the chloritization waters. Th–U mineralization was summarized by Mochnacka et al. [82] and includes numerous examples of mineral assemblages present in pegmatites or disseminated within granites. Pegmatite crystallization temperatures were estimated at the range 525–100 °C [78,83]. Most of the mineralization is genetically related to the granite and formed from fluids of magmatic origin. Several attempts at dating yielded a wide range of mineralization ages from 326 Ma (Re–Os in molybdenite [84]) to 270 ± 20 Ma (CHIME on monazite and xenotime [85]), indicating that hydrothermal fluids might have been circulating within the pluton over an extended period of time, starting from the late stages of magmatic evolution. Additionally, Kusiak et al. [19] dated zircon re-equilibrated with late-magmatic fluids in a microgranular magmatic enclave to 304 ± 2 Ma (SHRIMP U–Pb), indicating that fluid activity postdates the emplacement of the bulk of the pluton by several millions of years.
Consequently, if the hydrothermal stage took place after a considerable amount of time since the magmatic allanite crystallization, the mantles could have undergone substantial metamictization. During that time, the radioactive decay of abundant Th (which probably increased from core to rim) could have done significant damage to allanite structure, facilitating the element removal by fluids. Textural evidence of metamictization is most seen in BSE-dark areas of the mantle (as these are most Th-enriched), which are cut by numerous curved and radial fractures (e.g., GR-1 and GR-3) and/or demonstrate irregular, wavy zonation pattern (GR-2) [6]. These areas are also the least pleochroic and relatively isotropic in polarized light. The low EPMA-determined oxide totals of the mantle and sublinear substitution reactions in the presented diagrams (Figure 4) can be explained by incorporation of substantial amounts of water, as hydration often accompanies radiation damage [86] and crystallographic defects. The structural damage due to metamictization did not affect the alteration zones and if it continued after the postmagmatic processes, it remained confined to the allanite mantle.
Supplementary Materials
The following are available online at https://www.mdpi.com/2075-163X/10/5/392/s1, Supplementary Material 1 (SM1): Detailed explanation of the selected analytical parameters., Table S1: Conditions of electron microprobe analysis of major and minor elements., Table S2: EPMA analyses of major and minor elements for all studied allanites. Values are given in [wt %], Table S3: LA-ICP-MS analyses of trace elements for all studied allanites. All values are given in [ppm].
Author Contributions
Conceptualization, K.G. and E.S.; methodology, K.G., P.J., J.S. and G.K.-B.; validation, K.G. and E.S.; formal analysis, P.J., J.S. and G.K.-B.; investigation, K.G., E.S., P.J., J.S. and G.K.-B.; resources, K.G., E.S., P.J., J.S. and G.Z.-B.; writing—original draft preparation, K.G. and J.S.; writing—review and editing, K.G., J.S., G.K.-B., P.J.; visualization, K.G.; supervision, K.G. and E.S.; project administration, K.G.; funding acquisition, K.G. and J.S. All authors have read and agreed to the published version of the manuscript.
Funding
This study was funded by IGSci PASci project “Mikro-nano”. Jiri Slama was supported by the Academy of Sciences of the Czech Republic institutional support to the Institute of Geology, ASCR, RVO 67985831.
Acknowledgments
We greatly appreciate the comments and suggestions of the Reviewers, which significantly improved the scientific value of the manuscript. We also want to thank Hans-Jürgen Förster for his valuable comments on the observed textures and compositional variations. We appreciate the help of Alicja Wudarska in text layout and editing.
Conflicts of Interest
The authors declare no conflict of interest.
References
- Ward, C.D.; McArthur, J.M.; Walsh, J.N. Rare earth element behavior during evolution and alteration of the Dartmoor granite, SW England. J. Pet. 1992, 33, 785–815. [Google Scholar] [CrossRef]
- Petrík, I.; Broska, I.; Lipka, J.; Siman, P. Granitoid Allanite-(Ce) Substitution Relations, Redox Conditions and REE Distributions (on an Example of I-Type Granitoids, Western Carpathians, Slovakia). Geol. Carpathian 1995, 46, 79–94. [Google Scholar]
- Bea, F. Residence of REE, Y, Th and U in granites and crustal protoliths; implications for the chemistry of crustal melts. J. Pet. 1996, 37, 521–552. [Google Scholar] [CrossRef]
- Jiang, N.; Sun, S.; Chu, X.; Mizuta, T.; Ishiyama, D. Mobilization and enrichment of high-field strength elements during late- and post-magmatic processes in the Shuiquangou syenitic complex, Northern China. Chem. Geol. 2003, 200, 117–128. [Google Scholar] [CrossRef]
- Vlach, S.R.F.; Gualda, G.A.R. Allanite and chevkinite in A-type granites and syenites of the Graciosa Province, southern Brazil. Lithos 2007, 97, 98–121. [Google Scholar] [CrossRef]
- Gieré, R.; Sorensen, S.S. Allanite and other REE-rich epidote group minerals. Rev. Mineral. Geochem. 2004, 56, 431–493. [Google Scholar] [CrossRef]
- Wood, S.A.; Ricketts, A. Allanite–(Ce) from the Eocene Casto granite, Idaho: Response to hydrothermal alteration. Can. Mineral. 2000, 38, 81–100. [Google Scholar] [CrossRef]
- Chabiron, A.; Cuney, M. Altération de l’allanite dans les granites sous la caldeira de Streltsovka (Transbaïkalie, Russie). Une source possible d’uranium pour les gisements. Earth Planet. Sci. 2001, 332, 99–105. [Google Scholar]
- Poitrasson, F. In situ investigations of allanite hydrothermal alteration: Examples from calc-alkaline and anorogenic granites of Corsica (southeast France). Contrib. Mineral. Pet. 2002, 142, 485–500. [Google Scholar] [CrossRef]
- Meintzer, R.E.; Mitchell, R.S. The epigene alteration of allanite. Can. Mineral. 1988, 26, 945–955. [Google Scholar]
- Anenburg, M.; Katzir, Y.; Rhede, D.; Jöns, N.; Bach, W. Rare earth element evolution and migration in plagiogranites: A record preserved in epidote and allanite of the Troodos ophiolite. Contrib. Mineral. Pet. 2015, 169, 25. [Google Scholar] [CrossRef]
- Anenburg, M.; Mavrogenes, J.A.; Bennett, V.C. The fluorapatite P-REE-Th vein deposit at Nolans Bore: Genesis by carbonatite metasomatism. J. Pet. 2020. [Google Scholar] [CrossRef]
- Morin, J.A. Allanite in granitic rocks of the Kenora-Vermilion Bay area, Northwestern Ontario. Can. Mineral. 1977, 15, 297–302. [Google Scholar]
- Słaby, E.; Martin, H. Mafic and Felsic Magma Interaction in Granites: The Hercynian Karkonosze Pluton (Sudetes, Bohemian Massif). J. Pet. 2008, 49, 353–391. [Google Scholar] [CrossRef] [Green Version]
- Frost, B.R.; Barnes, C.G.; Collins, W.J.; Arculus, R.J.; Ellis, D.J.; Frost, C.D. A Geochemical Classification for Granitic Rocks. J. Pet. 2001, 42, 2033–2048. [Google Scholar] [CrossRef]
- Whalen, J.B.; Currie, K.L.; Chappell, B.W. A-type granites: Geochemical characteristics, discrimination and petrogenesis. Contrib. Mineral. Pet. 1987, 95, 407–419. [Google Scholar] [CrossRef]
- Słaby, E.; Michalik, M.; Mierzejewski, M. Zr-Y-HREE enriched granitic vein rock from Karkonosze (SW Poland)—Record of early fractionation of crustal melt? Pol. Mineral. Soc. Spec. Pap. 2005, 25, 204–207. [Google Scholar]
- Słaby, E. CHARAC- non-CHARAC behaviour of Y/Ho and Zr/ Hf in Karkonosze hybridic and granitic melts. Pol. Mineral. Soc. Spec. Pap. 2005, 25, 200–203. [Google Scholar]
- Kusiak, M.A.; Dunkley, D.J.; Słaby, E.; Martin, H.; Budzyń, B. Sensitive high-resolution ion microprobe analysis of zircon reequilibrated by late magmatic fluids in a hybridized pluton. Geology 2009, 37, 1063–1066. [Google Scholar] [CrossRef]
- Mazur, S.; Aleksandrowski, P. The Tepla(?)/Saxothuringian suture in the Karkonosz–Izera Massif, western Sudetes, Central European Variscides. Int. J. Earth Sci. 2001, 90, 341–360. [Google Scholar] [CrossRef]
- Žák, J.; Verner, K.; Sláma, J.; Kachlík, V.; Chlupáčová, M. Multistagemagma emplacement and progressive strain accumulation in the Krkonoše–Jizera plutonic complex, Bohemian Massif. Tectonics 2013, 32, 1493–1512. [Google Scholar] [CrossRef]
- Kryza, R.; Pin, C.; Oberc-Dziedzic, T.; Crowley, Q.G.; Larionov, A. Deciphering the geochronology of a large granitoid pluton (Karkonosze Granite, SW Poland): An assessment of U–Pb zircon SIMS and Rb–Sr whole-rock dates relative to U–Pb zircon CA-ID-TIMS. Int. Geol. Rev. 2014, 56, 756–782. [Google Scholar] [CrossRef]
- Barbarin, B. A review of the relationships between granitoid types, their origins and their geodynamic environments. Lithos 1999, 46, 605–626. [Google Scholar] [CrossRef]
- White, A.J.R.; Chappell, B.W. Granitoid types and their distribution in the Lachlan Fold Belt, southeastern Australia. In Circum-Pacific Plutonic Terranes; Roddick, J.A., Ed.; Geological Society of America: Memoir, CO, USA, 1983; Volume 159, pp. 21–34. [Google Scholar]
- Clarke, D.B. Granitoid Rocks; Chapman & Hall: London, UK, 1992. [Google Scholar]
- Chappell, B.W.; White, A.J.R. Two contrasting granite types: 25 years later. Aust. J. Earth Sci. 2001, 48, 489–499. [Google Scholar] [CrossRef]
- Słaby, E.; Galbarczyk-Gąsiorowska, L.; Baszkiewicz, A. Mantled alkali-feldspar megacrysts from the marginal part of the Karkonosze granitoid massif (SW Poland). Acta Geol. Pol. 2002, 52, 501–519. [Google Scholar]
- Słaby, E.; Götze, J. Feldspar crystallization under magma mixing conditions shown by cathodoluminescence and geochemical modelling: Case study from the Karkonosze pluton (SW Poland). Mineral. Mag. 2004, 68, 541–557. [Google Scholar] [CrossRef]
- Słaby, E.; Galbarczyk-Gąsiorowska, L.; Seltmann, R.; Müller, A. Alkali feldspar megacryst growth: Geochemical modelling. Mineral. Pet. 2007, 68, 1–29. [Google Scholar] [CrossRef]
- Słaby, E.; Seltmann, R.; Kober, B.; Müller, A.; Galbarczyk-Gąsiorowska, L.; Jeffries, T. LREE distribution patterns in zoned alkali feldspar megacrysts—Implication for parental melt composition. Mineral. Mag. 2007, 71, 193–217. [Google Scholar] [CrossRef]
- Lisowiec, K.; Słaby, E.; Förster, H.J. Polytopic vector analysis (PVA) modelling of whole-rock and apatite chemistry from the Karkonosze composite pluton (Poland, Czech Republic). Lithos 2015, 230, 105–120. [Google Scholar] [CrossRef] [Green Version]
- Słaby, E.; Martin, H. Mechanisms of differentiation of the Karkonosze granite. Pol. Mineral. Soc. Spec. Pap. 2005, 26, 264–267. [Google Scholar]
- Słaby, E.; Götze, J.; Wörner, G.; Simon, K.; Wrzalik, R.; Śmigielski, M. K-feldspar phenocrysts in microgranular magmatic enclaves: A cathodoluminescence and geochemical study of crystal growth as a marker of magma mingling dynamics. Lithos 2008, 105, 85–97. [Google Scholar] [CrossRef]
- Gros, K.; Słaby, E.; Birski, Ł.; Kozub-Budzyń, G.; Slama, J. Titanite major and trace element composition following the evolution path of a composite pluton. Mineral. Petrol. (under review).
- Stormer, J.C.J.; Pierson, M.L.; Tacker, R.C. Variation of F and Cl X-ray intensity due to anisotropic diffusion in apatite during electron microprobe analysis. Am. Mineral. 1993, 78, 641–648. [Google Scholar]
- Goldoff, B.; Webster, J.D.; Harlov, D.E. Characterization of fluor-chlorapatites by electron probe microanalysis with a focus on time-dependent intensity variation of halogens. Am. Mineral. 2012, 97, 1103–1115. [Google Scholar] [CrossRef]
- Stock, M.J.; Humphreys, M.C.S.; Smith, V.C.; Johnson, R.D.; Pyle, D.M. EIMF New constraints on electron-beam induced halogen migration in apatite. Am. Mineral. 2015, 100, 281–293. [Google Scholar] [CrossRef] [Green Version]
- Yavuz, F.; Yıldırım, D.K. A Windows program for calculation and classification of epidote–supergroup minerals. Period. Mineral. 2018, 87, 269–285. [Google Scholar]
- Armbruster, T.; Bonazzi, P.; Akasaka, M.; Bermanec, V.; Chopin, C.; Giere, R.; Heuss-Assbichler, S.; Liebscher, A.; Menchetti, S.; Pan, Y.; et al. Recommended nomenclature of epidote-group minerals. Eur. J. Mineral. 2006, 18, 551–567. [Google Scholar] [CrossRef] [Green Version]
- Tunheng, A.; Hirata, T. Development of signal smoothing device for precise elemental analysis using laser ablation-ICP-mass spectrometry. J. Anal. Atom. Spectrom. 2004, 19, 932–934. [Google Scholar] [CrossRef]
- Van Achterbergh, E.; Ryan, C.G.; Jackson, S.E.; Griffin, W.L. Data reduction software for LA-ICP-MS. In Laser Ablation-ICPMS in the Earth Sciences: Principles and Applications; Sylvester, P.J., Ed.; Mineralogical Association of Canada: Québec, QC, Canada, 2001; pp. 239–243. [Google Scholar]
- Sun, S.S.; McDonough, W.F. Chemical and isotopic systematics of oceanic basalts: Implications for mantle composition and processes. In Magmatism in the Ocean Basins; Special Publications; Saunders, A.D., Norry, M.J., Eds.; Geological Society: London, UK, 1989; Volume 42, pp. 313–345. [Google Scholar]
- Broska, I.; Petrík, I.; Williams, T.C. Coexisting monazite and allanite in peraluminous granitoids of the Tribeè Mountains, Western Carpathians. Am. Mineral. 2000, 85, 22–32. [Google Scholar] [CrossRef]
- Vazquez, J.A.; Manning, C.E.; Reid, M.R. Experimental Determination of Allanite Stability in High-Silica Rhyolite; Abstract V41C-1407; American Geophysical Union: Washington, DC, USA, 2004. [Google Scholar]
- Hermann, J. Allanite: Thorium and light rare earth element carrier in subducted crust. Chem. Geol. 2002, 192, 289–306. [Google Scholar] [CrossRef]
- Chesner, C.A.; Ettlinger, A.D. Composition of volcanic allanite from the Toba Tuffs, Sumatra, Indonésia. Am. Mineral. 1989, 74, 750–758. [Google Scholar]
- Anenburg, M.; Mavrogenes, J.A. Carbonatitic versus hydrothermal origin for fluorapatite REE-Th deposits: Experimental study of REE transport and crustal “antiskarn” metasomatism. Am. J. Sci. 2018, 318, 335–366. [Google Scholar] [CrossRef]
- Spruzeniece, L.; Piazolo, S.; Maynard-Casely, H. Deformation-resembling microstructure created by fluid-mediated dissolution–precipitation reactions. Nat. Commun. 2017, 8, 14032. [Google Scholar] [CrossRef] [PubMed] [Green Version]
- Ruiz-Agudo, E.; Putnis, C.V.; Putnis, A. Coupled dissolution and precipitation at mineral–fluid interfaces. Chem. Geol. 2014, 383, 132–146. [Google Scholar] [CrossRef]
- Allegre, C.J.; Provost, A.; Jaupart, C. Oscillatory zoning: A pathological case of crystal growth. Nature 1981, 294, 223–228. [Google Scholar] [CrossRef]
- Brugger, J.; Lahaye, Y.; Costa, S.; Lambert, D.; Bateman, R. Inhomogeneous distribution of REE in scheelite and dynamics of Archaean hydrothermal systems (Mt. Charlotte and Drysdale gold deposits, Western Australia). Contrib. Mineral. Pet. 2000, 139, 251–264. [Google Scholar] [CrossRef]
- Shore, M.; Fowler, A.D. Oscillatory zoning in minerals; a common phenomenon. Can. Mineral. 1996, 34, 1111–1126. [Google Scholar]
- Barker, S.L.; Cox, S.F. Oscillatory zoning and trace element incorporation in hydrothermal minerals: Insights from calcite growth experiments. Geofluids 2011, 11, 48–56. [Google Scholar] [CrossRef]
- Mitropoulos, P. Primary allanite in andesitic rocks from the Poros Volcano, Greece. Mineral. Mag. 1987, 51, 601–604. [Google Scholar] [CrossRef]
- Pe-Piper, G.; Piper, D.J.W.; Papoutsa, A. Mid Carboniferous lamprophyres, Cobequid Fault Zone, eastern Canada, linked to sodic granites, voluminous gabbro, and albitization. Lithos 2018, 296–299, 316–331. [Google Scholar] [CrossRef]
- Smith, M.P.; Henderson, P.; Jeffries, T. The formation and alteration of allanite in skarn from the Beinn an Dubhaich granite aureole, Skye. Eur. J. Mineral. 2002, 14, 471–486. [Google Scholar] [CrossRef]
- Allen, D.E.; Seyfried, W.E., Jr. REE controls in ultramafic hosted MOR hydrothermal systems: An experimental study at elevated temperature and pressure. Geochim. Cosmochim. Acta 2005, 69, 675–683. [Google Scholar] [CrossRef]
- Migdisov, A.A.; Williams-Jones, A.E.; Wagner, T. An experimental study of the solubility and speciation of the Rare Earth Elements (III) in fluoride- and chloride-bearing aqueous solutions at temperatures up to 300C. Geochim. Cosmochim. Acta 2009, 73, 7087–7109. [Google Scholar] [CrossRef]
- Buda, G.; Nagy, G. Some REE-bearing accessory minerals in two rock types of Variscan granitoids, Hungary. Geol. Carpath. 1995, 46, 67–78. [Google Scholar]
- Anenburg, M.; Burnham, A.D.; Mavrogenes, J.A. REE redistribution textures in altered fluorapatite: Symplectites, veins and phosphate-silicate-carbonate assemblages from the Nolans Bore P–REE–Th deposit, NT, Australia. Can. Mineral. 2018, 56, 331–354. [Google Scholar] [CrossRef]
- Shannon, R.D. Revised effective ionic radii and systematic studies of interatomic distances in halides and chalcogenides. Acta Crystallogr. A 1976, 32, 751–767. [Google Scholar] [CrossRef]
- Bühn, B.; Rankin, A.H. Composition of natural, volatile-rich Na–Ca–REE–Sr carbonatitic fluids trapped in fluid inclusions. Geochim. Cosmochim. Acta 1999, 63, 3781–3797. [Google Scholar] [CrossRef]
- Loges, A.; Migdisov, A.A.; Wagner, T.; Williams-Jones, A.E.; Markl, G. An experimental study of the aqueous solubility and speciation of Y(III) fluoride at temperatures up to 250C. Geochim. Cosmochim. Acta 2013, 123, 403–415. [Google Scholar] [CrossRef]
- Williams-Jones, A.E.; Migdisov, A.A.; Samson, I.M. Hydrothermal mobilization of the rare earth elements—A tale of “Ceria” and “Yttria”. Elements 2012, 8, 355–360. [Google Scholar] [CrossRef]
- Nisbet, H.; Migdisov, A.A.; Williams-Jones, A.E.; Xu, H.; van Hinsberg, V.J.; Roback, R. Challenging the thorium-immobility paradigm. Sci. Rep.-UK 2019, 9, 17035. [Google Scholar] [CrossRef]
- Keppler, H.; Wyllie, P.J. Partitioning of Cu, Sn, Mo, W, U, and Th between melt and aqueous fluid in the systems haplogranite-H2O−HCl and haplogranite-H2O−HF. Contr. Mineral. Pet. 1991, 109, 139–150. [Google Scholar] [CrossRef]
- Mochnacka, K.; Banaś, M. Occurrence and genetic relationships of uranium and thorium mineralization in the Karkonosze Izera Block (the Sudety Mts, SW Poland). Ann. Soc. Geol. Pol. 2000, 70, 137–150. [Google Scholar]
- Nisbet, H.; Migdisov, A.; Xu, H.; Guo, X.; van Hinsberg, V.; Williams-Jones, A.E.; Boukhalfa, H.; Roback, R. An experimental study of the solubility and speciation of thorium in chloride-bearing aqueous solutions at temperatures up to 250 °C. Geochim. Cosmochim. Acta 2018, 239, 363–373. [Google Scholar] [CrossRef]
- Oberli, F.; Meier, M.; Berger, A.; Rosenberg, C.L.; Gieré, R. U–Th–Pb and 230Th/238U disequilibrium isotope systematics: Precise accessory mineral chronology and melt evolution tracing in the Alpine Bergell intrusion. Geochim. Cosmochim. Acta 2004, 68, 2543–2560. [Google Scholar] [CrossRef]
- Giuli, G.; Alonso-Mori, R.; Cicconi, M.R.; Paris, E.; Glatzel, P.; Eeckhout, S.G.; Scaillet, B. Effect of alkalis on the Fe oxidation state and local environment in peralkaline rhyolitic glasses. Am. Mineral. 2012, 97, 468–475. [Google Scholar] [CrossRef] [Green Version]
- Anenburg, M.; O’Neill, H.S.C. Redox in Magmas: Comment on a Recent Treatment of the Kaiserstuhl Volcanics (Braunger et al., Journal of Petrology, 59, 1731–1762, 2018) and Some Other Misconceptions. J. Pet. 2019, 60, 1825–1832. [Google Scholar] [CrossRef]
- Volovetskii, M.V.; Lukanin, O.A.; Rusakov, V.S.; Kargal’tsev, A.A. Influence of oxygen fugacity and temperature on the redox state of iron in natural silicic aluminosilicate melts. Geochem. Int. 2012, 50, 330–343. [Google Scholar] [CrossRef]
- Uher, P.; Ondrejka, M.; Bačík, P.; Broska, I.; Konečný, P. Britholite, monazite, REE carbonates, and calcite: Products of hydrothermal alteration of allanite and apatite in A-type granite from Stupné, Western Carpathians, Slovakia. Lithos 2015, 236–237, 212–225. [Google Scholar] [CrossRef]
- Berger, A.; Gnos, E.; Janots, E.; Fernandez, A.; Giese, J. Formation and composition of rhabdophane, bastnäsite and hydrated thorium minerals during alteration: Implications for geochronology and low-temperature processes. Chem. Geol. 2008, 254, 238–248. [Google Scholar] [CrossRef]
- Migdisov, A.; Williams-Jones, A.E.; Brugger, J.; Caporuscio, F.A. Hydrothermal transport, deposition, and fractionation of the REE: Experimental data and thermodynamic calculations. Chem. Geol. 2016, 439, 13–42. [Google Scholar] [CrossRef] [Green Version]
- Migdisov, A.A.; Williams-Jones, A.E. Hydrothermal transport and deposition of the rare earth elements by fluorine-bearing aqueous liquids. Miner. Depos. 2014, 49, 987–997. [Google Scholar] [CrossRef]
- Migdisov, A.; Guo, X.; Nisbet, H.; Xu, H.; Williams-Jones, A.E. Fractionation of REE, U, and Th in natural ore-forming hydrothermal systems: Thermodynamic modelling. J. Chem. Thermodyn. 2019, 128, 305–319. [Google Scholar] [CrossRef] [Green Version]
- Kozłowski, A.; Marcinowska, A. Hydrothermal activity in the Karkonosze, Strzegom and Strzelin massifs—A fluid inclusion study. In Granitoids in Poland; Archivum Mineralogiae Monograph, no. 1; Kozłowski, A., Wiszniewska, J., Eds.; Faculty of Geology of The Warsaw University: Warsaw, Poland, 2007; pp. 243–252. [Google Scholar]
- Budzyń, B.; Harlov, D.E.; Williams, M.L.; Jercinovic, M.J. Experimental determination of stability relations between monazite, fluorapatite, allanite, and REE-epidote as a function of pressure, temperature, and fluid composition. Am. Mineral. 2011, 96, 1547–1567. [Google Scholar] [CrossRef]
- Krenn, E.; Harlov, D.E.; Finger, F.; Wunder, B. LREE-redistribution among fluorapatite, monazite, and allanite at high pressures and temperatures. Am. Mineral. 2012, 97, 1881–1890. [Google Scholar] [CrossRef]
- Wilamowski, A. Chloritization and polytypism of biotite in the Lomnica granite, Karkonosze Massif, Sudetes, Poland: Stable isotope evidence. Chem. Geol. 2002, 182, 529–547. [Google Scholar] [CrossRef]
- Mochnacka, K.; Oberc-Dziedzic, T.; Mayer, W.; Pieczka, A. Ore mineralization related to geological evolution of the Karkonosze- Izera Massif (the Sudetes, Poland)—Towards a model. Ore Geol. Rev. 2004, 64, 215–238. [Google Scholar] [CrossRef]
- Kozłowski, A. Pneumatolitic and hydrothermal activity in the Karkonosze Block. Acta Geol. Pol. 1978, 28, 171–222. [Google Scholar]
- Mikulski, S.Z.; Stein, H.J. Re–Os age for molybdenite from the West Sudetes, SW Poland. In Granitoids in Poland; Archivum Mineralogiae Monograph, no. 1; Kozłowski, A., Wiszniewska, J., Eds.; Faculty of Geology of The Warsaw University: Warsaw, Poland, 2007; Volume 1, pp. 203–216. [Google Scholar]
- Mikulski, S.Z.; Bagiński, B.; Dzierżanowski, P. The CHIME age calculations on monazite and xenotime in aplogranite from the Szklarska Poręba Huta. Pol. Mineral. Soc. Spec. Pap. 2004, 24, 287–290. [Google Scholar]
- Mitchell, R.S. Metamict minerals: A review. Mineral. Rec. 1973, 4, 177–182. [Google Scholar]
Figure 1.
BSE images of the studied allanite grains. (a) Allanite grain GR-1 with a large preserved core, oscillatory mantle, and zones 3a, 3b, and 3c; (b) a close-up view of the worm-shaped contact between the core and the mantle; (c) allanite grain GR-2 with characteristic wavy zonation in the mantle and numerous 3b zones; (d) allanite grain GR-3 with small remnants of the core, the mantle, and a rim composed of zone 3b; (e) allanite grain SOK-1 with preserved core, the mantle, and a rim composed of zone 3a; and (f) allanite grain SOK-2 with the mantle and zones 3a and 3b. Mineral abbreviations are as follows: qz—quartz, afs—alkali feldspar, pl—plagioclase, ep—epidote, ap—apatite, and bt—biotite. The zones described in the text are annotated in selected grains in Figure 2.

Figure 2.
Selected allanite grains with marked textural zones 1 to 3; (a) GR-1, (b) GR-2, and (c) SOK-1.
Figure 2.
Selected allanite grains with marked textural zones 1 to 3; (a) GR-1, (b) GR-2, and (c) SOK-1.

Figure 3.
Variation diagrams illustrating the compositional differences between the distinguished textural groups; (a,b) Al2O3 vs. CaO [wt %], (c,d) La/Sm vs. Th/U [ppm], and (e,f) Y [ppm] vs. Y/Ho. Gruszków and Sokoliki samples are presented together in (a) and (b), as differences in major element contents are insignificant. The arrows in plots (a,c) and (e) show the evolution of element concentrations as BSE-intensity decreases.

Figure 4.
Chondrite-normalized rare earth elements (REE) patterns of all textural groups. Gruszków and Sokoliki allanites are presented separately. Normalizing values are after Sun and McDonough [42]. (a) Zones 1 and 2 for Gruszków allanites; (b) Zone 3 for Gruszków allanites; (c) Zones 1 to 3 for Sokoliki allanites

Figure 5.
Cationic Altot vs. REE + Y + Th + Sr + Mn plot after Petrik et al. [2], showing the position of the studied allanites in the ferriallanite–allanite–epidote–clinozoisite system. The isolines represent Feox = Fe3+/(Fe2+ + Fe3+) ratio. (a) Zones 1 and 2 for Gruszków and Sokoliki allanites; (b) Zones 3a and 3c for Gruszków and Sokoliki allanites.

Figure 6.
Cationic plots showing possible substitutions in allanite structure: (a) Ca + Al + Fe3+ vs. REE + Mg + Fe2+, (b) Altot vs. Fetot + Ti, (Fetot—total Fe), and (c) Ca + Al + REE + Mg vs. Fe + Th + Ti.
Figure 6.
Cationic plots showing possible substitutions in allanite structure: (a) Ca + Al + Fe3+ vs. REE + Mg + Fe2+, (b) Altot vs. Fetot + Ti, (Fetot—total Fe), and (c) Ca + Al + REE + Mg vs. Fe + Th + Ti.

Figure 7.
X-ray maps of selected elements for Gruszków and Sokoliki allanite grains. (a) grain GR-1; (b) grain GR-2; (c) grain SOK-1 and (d) grain SOK-2. Black spots in Y X-ray maps are after LA-ICP-MS analyses. The scale is shown only for Al (a,b) and Ca (c,d) maps and is identical for all related images.


Figure 8.
EPMA and LA-ICP-MS line profiles for grain GR-1, including zone 3a, 2, and 1; (a) BSE image of GR-1 with EPMA line profile; (b–e) diagrams showing element concentrations for all measured points in the EPMA profile; (f) BSE image of GR-1 with LA-ICP-MS profile; and (g) diagram showing element concentrations for seven points measured by LA-ICP-MS.

Figure 9.
Binary plots showing most prominent compositional differences between the core (zone 1) and the worm-shaped domains of the mantle (zone 2). (a) Al2O3 vs. CaO [wt %]; (b) La/Sm vs Th [ppm]; (c) Al vs. REE + Th [wt %]; (d) REE [wt %] vs. Y [ppm]; (e) Altot vs. Fetot + Ti [apfu]; (f) Ca + Al + REE + Mg vs. Fe + Th + Ti [apfu].


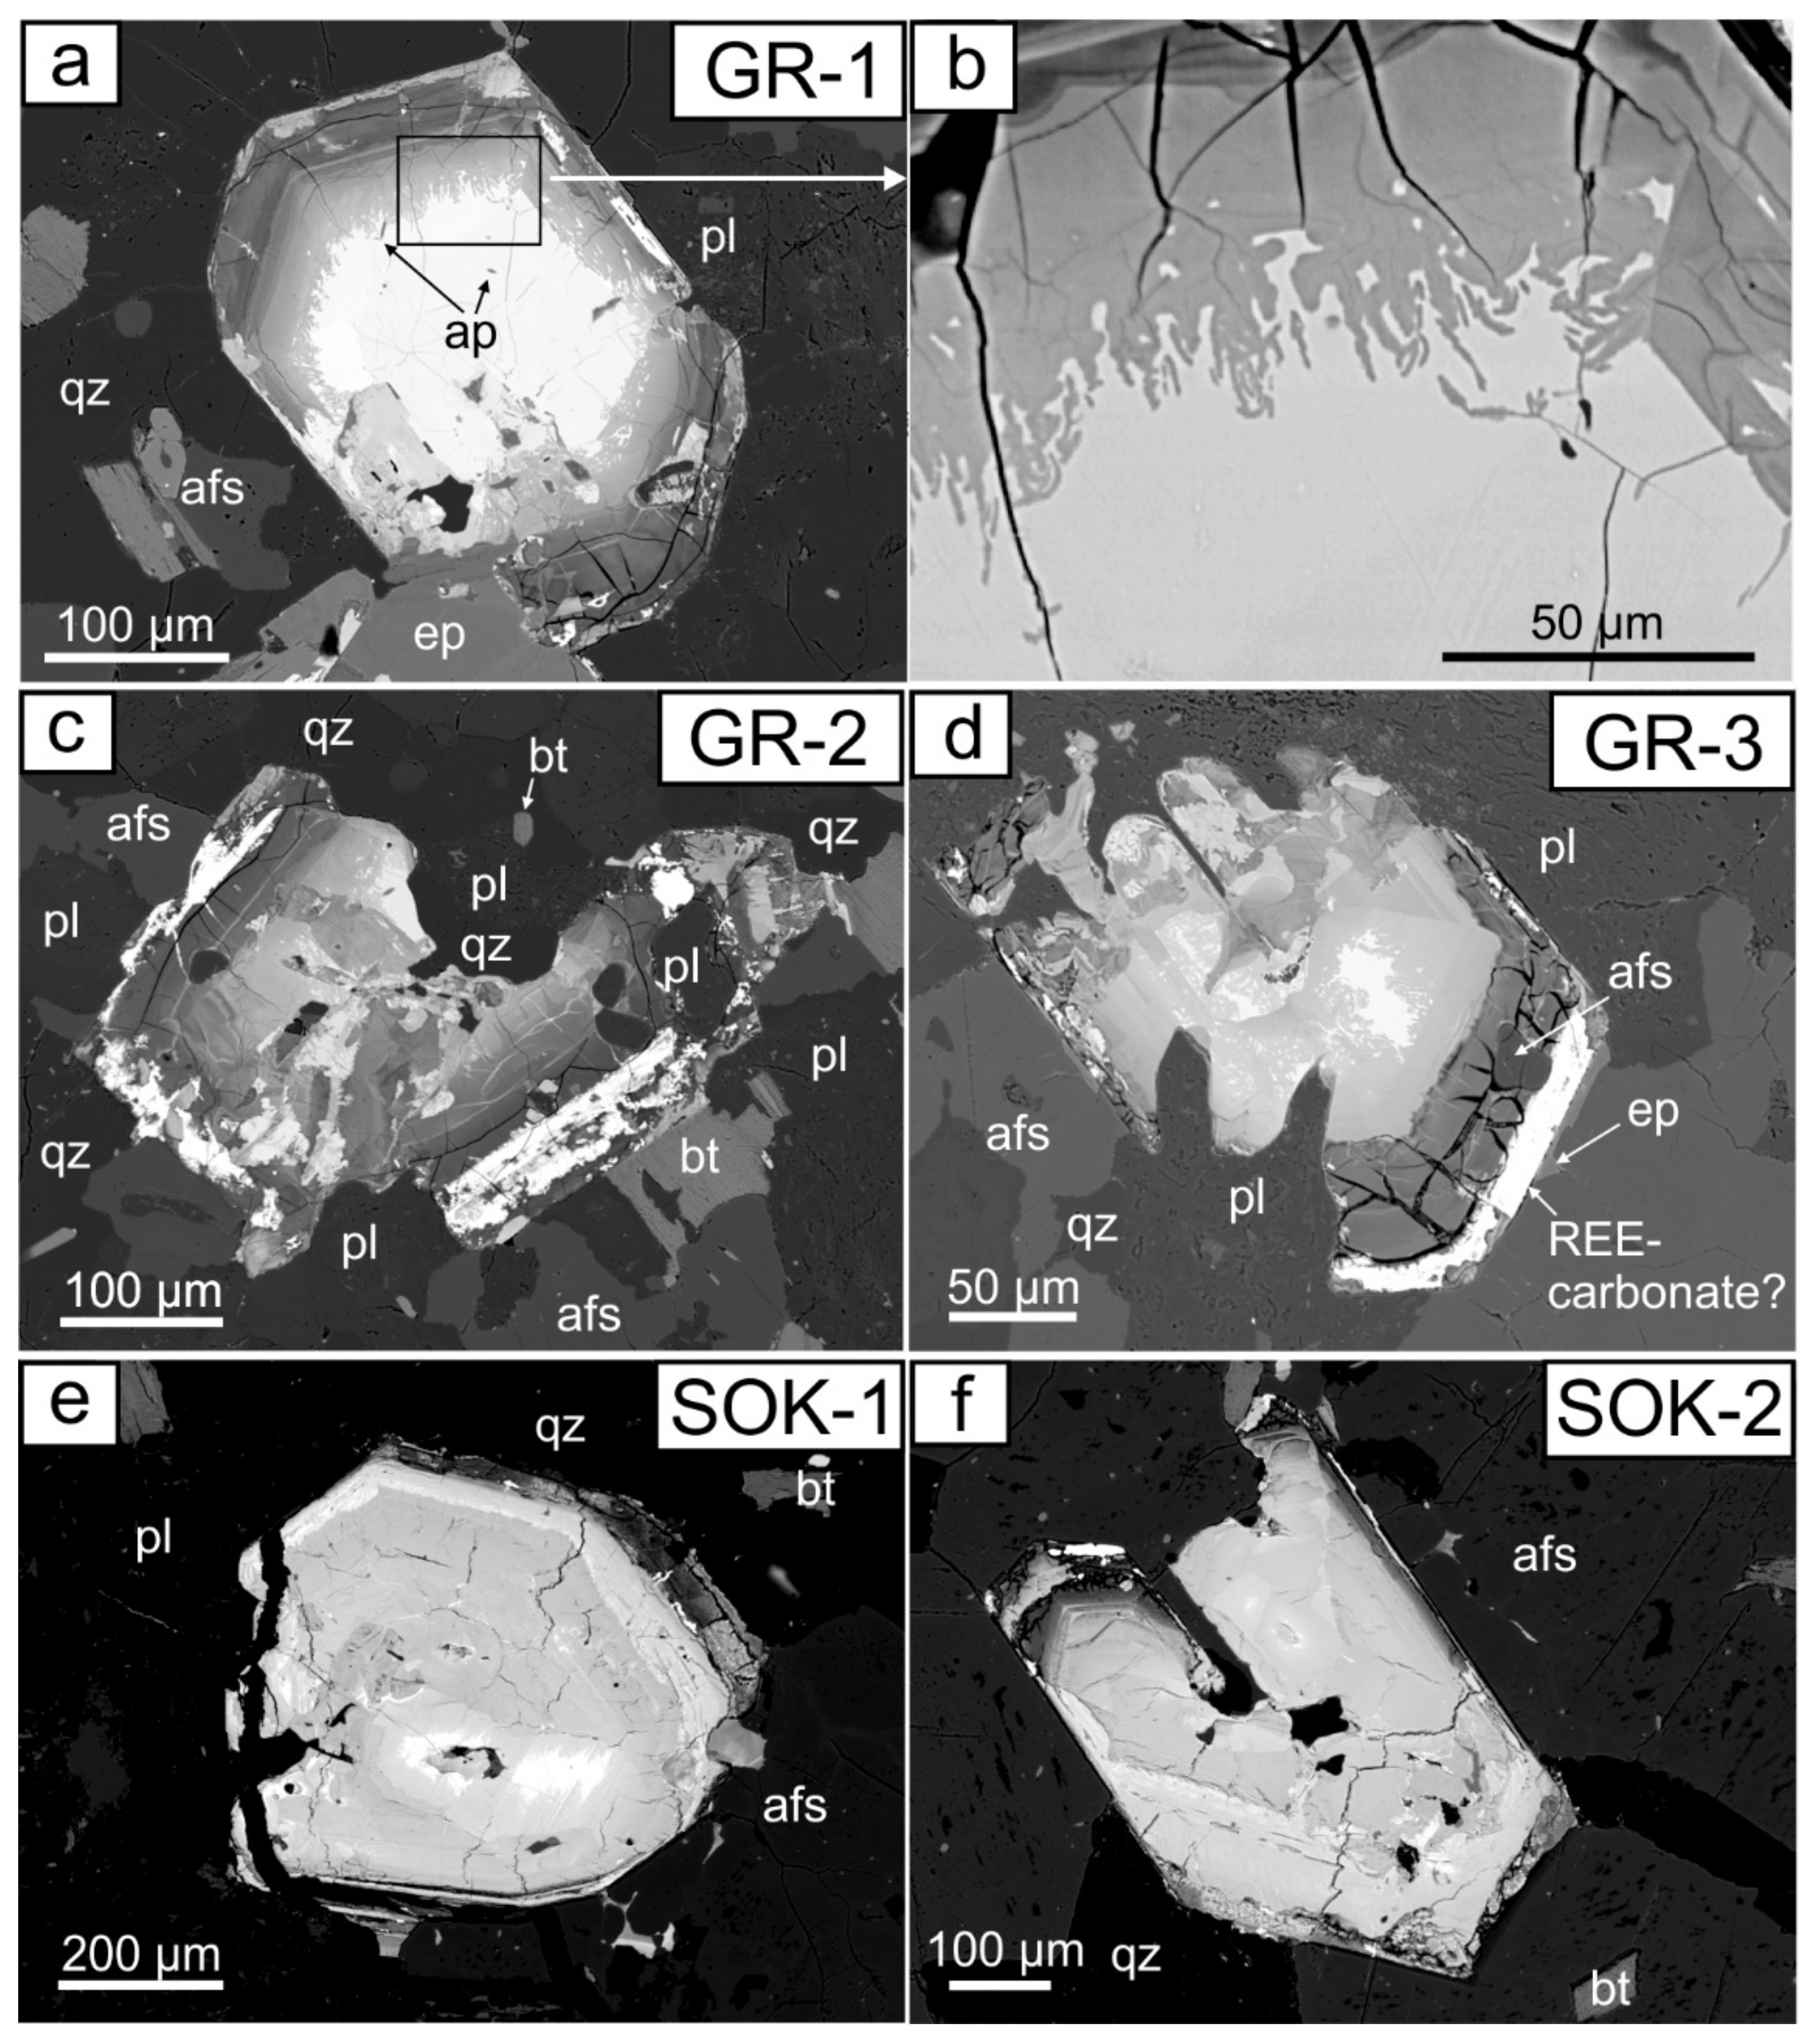
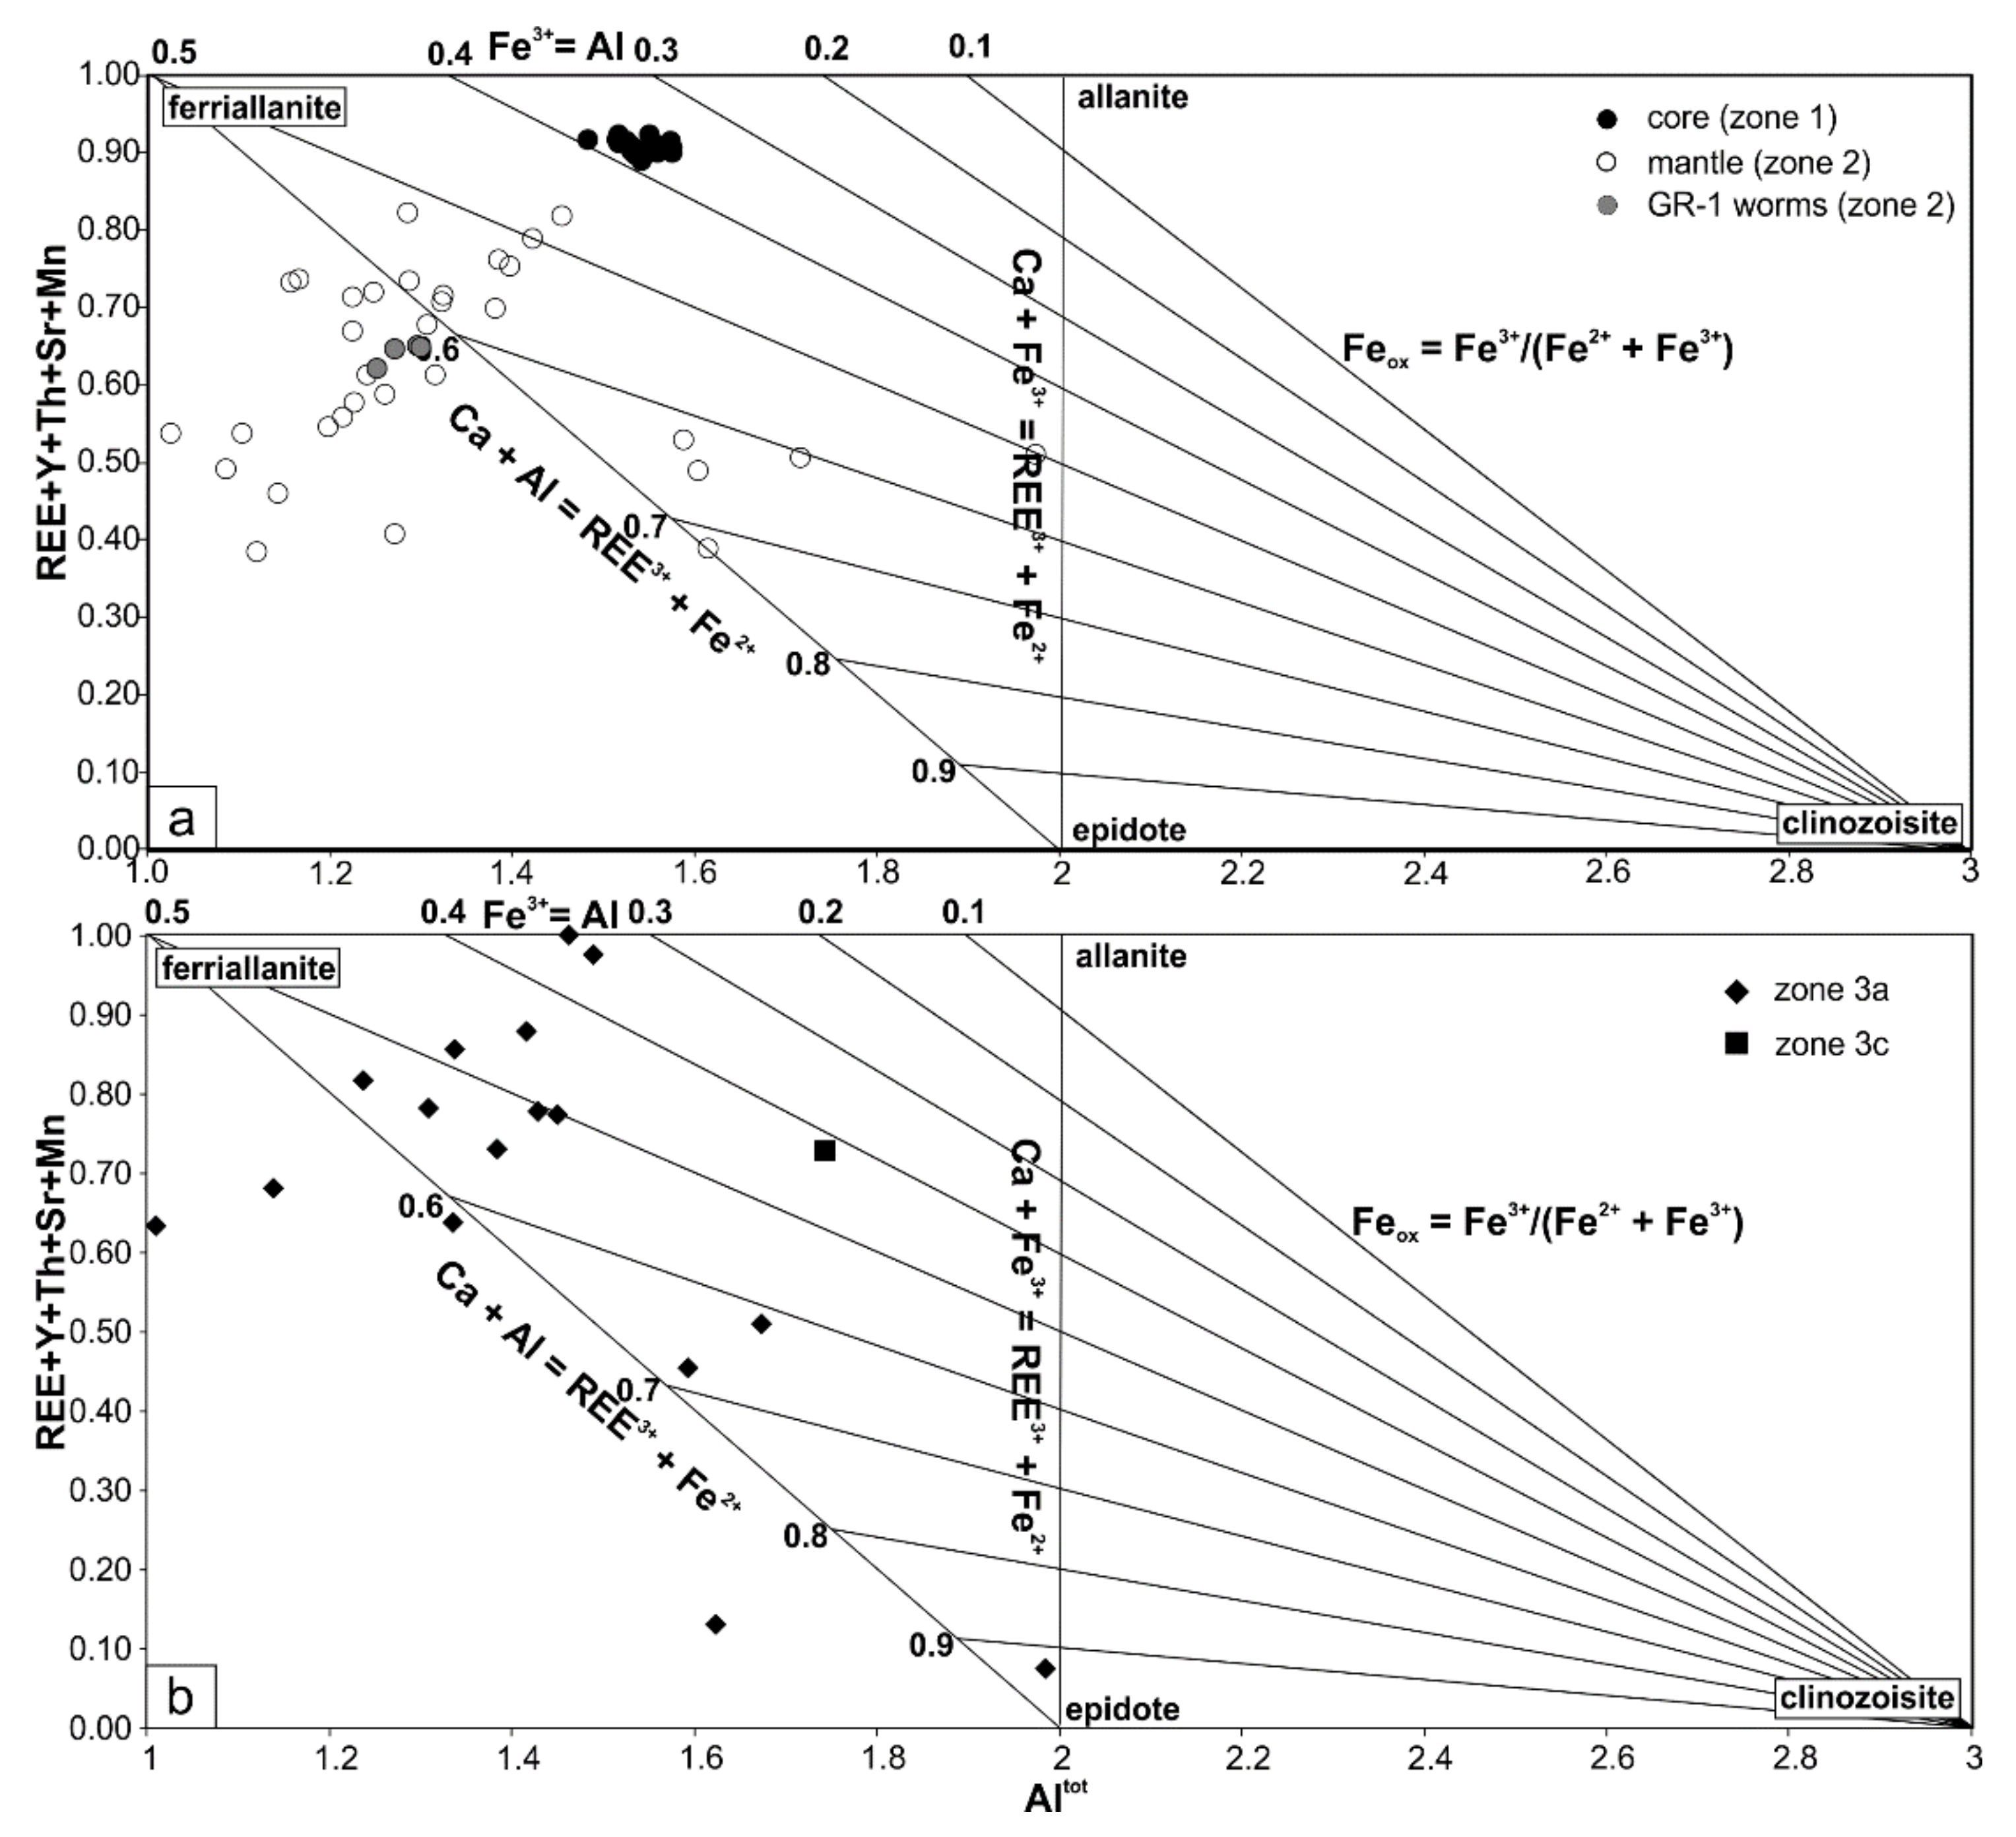
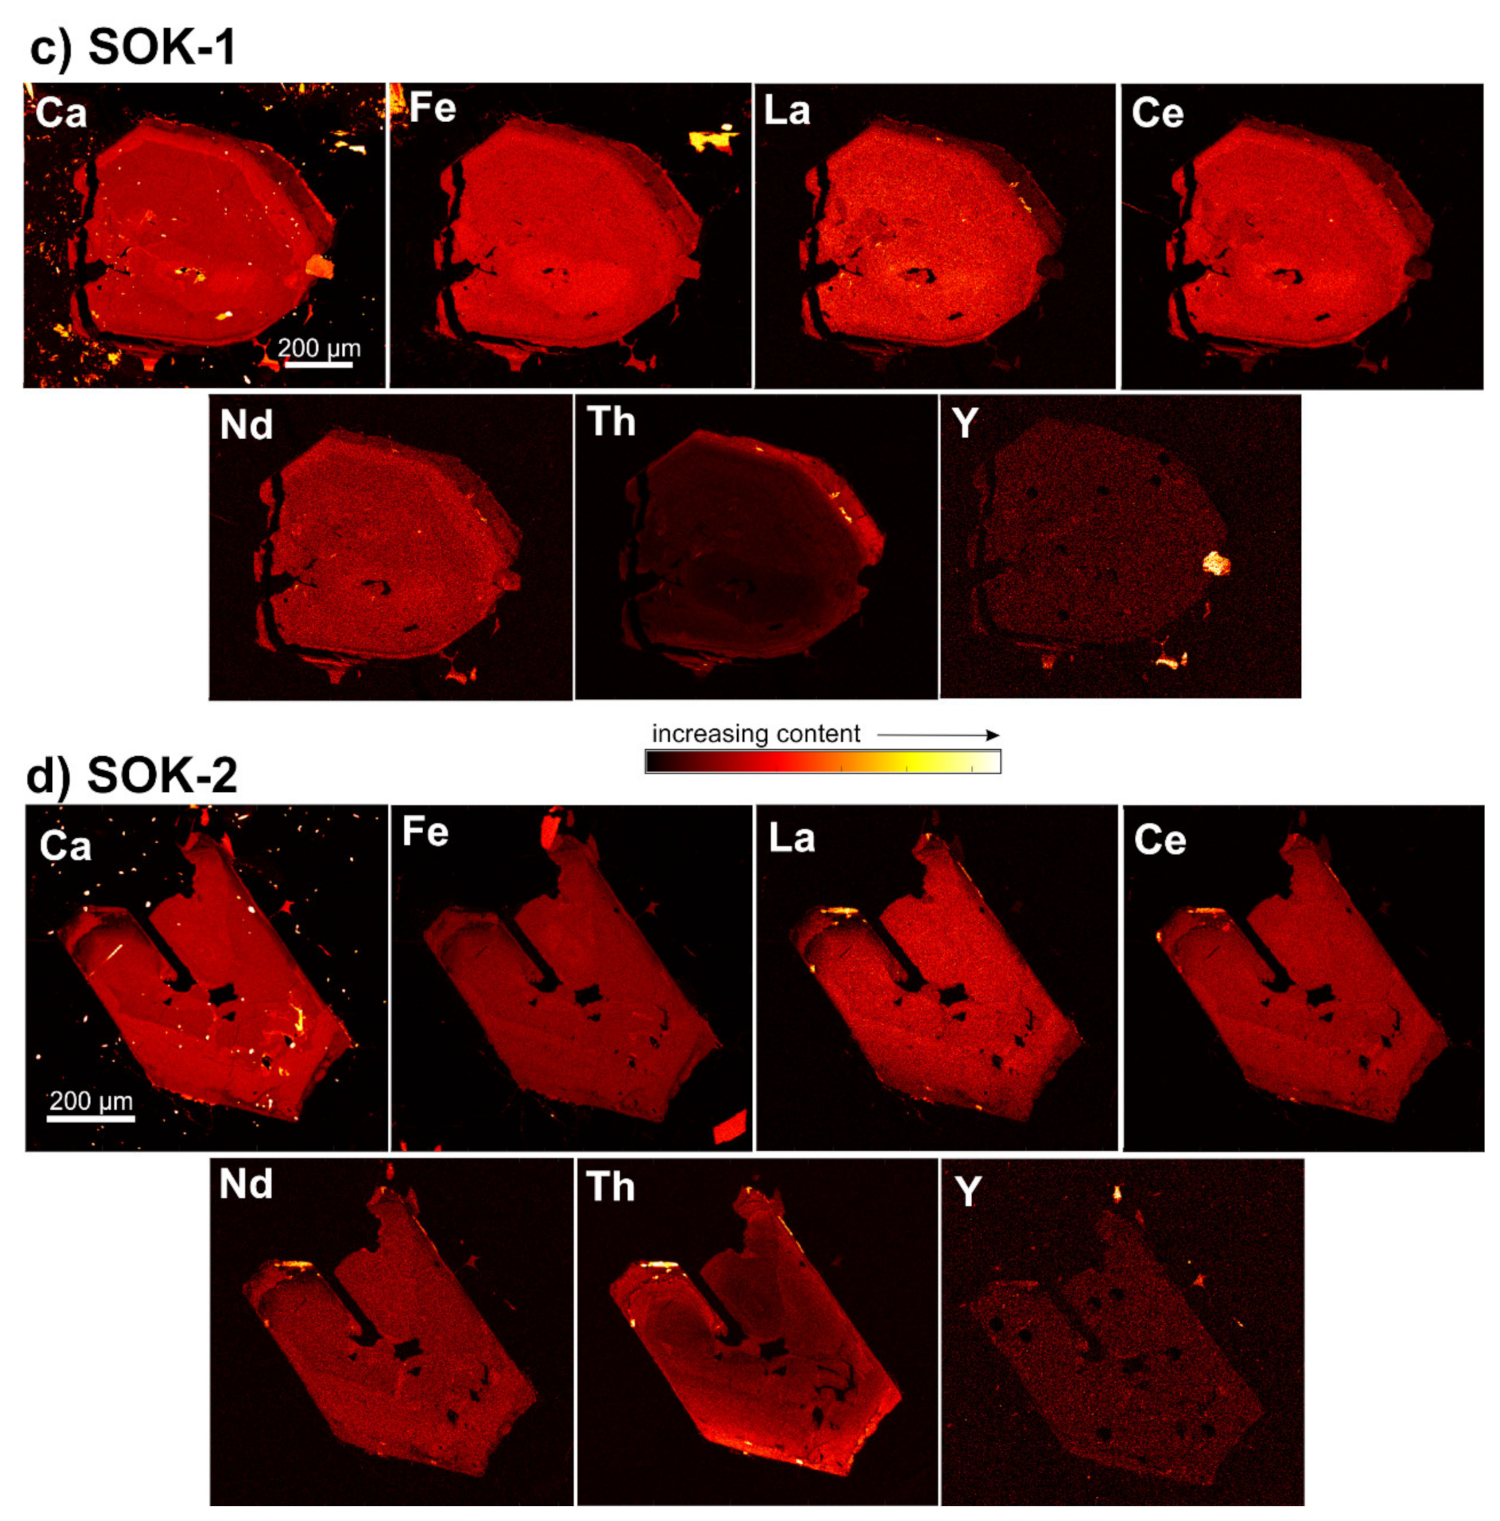
Table 1.
Chemical composition (EPMA + LA-ICP-MS) of selected zones in all studied allanite grains.
| Grain. | GR-1 | GR-1 | GR-1 | GR-1 | GR-1 | GR-2 | GR-2 | GR-3 | GR-3 | GR-3 | GR-3 | SOK-1 | SOK-1 | SOK-1 | SOK-1 | SOK-2 |
|---|---|---|---|---|---|---|---|---|---|---|---|---|---|---|---|---|
| Spot no. (EPMA/LA-ICP-MS) | 1/16 a | 1r | 1’/8 | 2’/10 | 4’/7 | 28/23 | 18’/22 | 7/40 | 8’/35 | 10’/43 | 11’/44 | 10/14 | 17/13 | 18/18 | 19/19 | 22/20 |
| Zone | zone 1 | zone 2 (worms) | zone 2 (bright) | zone 2 (dark) | zone 3c | zone 1 | zone 2 (dark) | zone 1 | zone 3a | zone 2 (dark) | zone 3b | zone 1 | zone 2 (medium) | zone 2 | zone 3a | zone 2 (bright) |
| ThO2 | 0.52 | 1.25 | 1.72 | 5.43 | 0.67 | 0.58 | 1.59 | 0.68 | 1.95 | 2.82 | 2.88 | 0.47 | 1.60 | 2.40 | 6.05 | 0.56 |
| Sm2O3 | 0.32 | 0.29 | 0.29 | 0.21 | 0.26 | 0.28 | 0.30 | 0.26 | 0.45 | 0.14 | 0.84 | 0.19 | 0.19 | 0.24 | 0.17 | 0.21 |
| Nd2O3 | 2.92 | 2.35 | 2.37 | 1.76 | 2.51 | 3.06 | 2.63 | 2.87 | 3.65 | 1.69 | 6.65 | 2.68 | 2.10 | 2.74 | 1.89 | 2.48 |
| Pr2O3 | 1.22 | 0.82 | 0.87 | 0.53 | 0.92 | 1.25 | 1.10 | 1.10 | 1.15 | 0.71 | 1.97 | 1.12 | 0.84 | 1.06 | 0.31 | 0.97 |
| Ce2O3 | 12.22 | 8.39 | 7.15 | 3.59 | 9.60 | 11.82 | 8.35 | 12.20 | 9.17 | 5.05 | 14.10 | 12.23 | 9.89 | 10.13 | 5.73 | 11.04 |
| La2O3 | 7.47 | 5.57 | 4.63 | 1.65 | 5.73 | 7.07 | 5.51 | 7.75 | 4.73 | 3.28 | 9.81 | 7.79 | 6.06 | 5.44 | 2.31 | 6.96 |
| Y2O3 | 0.15 | 0.33 | 0.39 | 0.58 | 0.24 | 0.13 | 0.37 | 0.14 | 0.27 | 0.19 | 0.92 | 0.10 | 0.10 | 0.09 | 0.15 | 0.12 |
| FeO | 15.83 | 20.95 | 21.66 | 15.91 | 15.49 | 15.61 | 19.38 | 16.34 | 16.75 | 14.95 | 4.13 | 16.00 | 13.83 | 13.03 | 9.79 | 16.59 |
| MnO | 0.32 | 0.22 | 0.22 | 0.13 | 0.50 | 0.29 | 0.25 | 0.31 | 0.41 | 0.20 | <DL | 0.30 | 0.54 | 0.50 | 0.41 | 0.35 |
| TiO2 | 1.49 | 2.74 | 2.95 | 4.56 | 0.50 | 1.48 | 2.58 | 1.84 | 1.84 | 3.79 | 1.99 | 1.63 | 3.64 | 2.70 | 3.92 | 1.78 |
| CaO | 10.22 | 7.07 | 6.28 | 3.47 | 13.07 | 10.24 | 6.80 | 10.35 | 9.14 | 4.77 | 2.10 | 10.46 | 8.66 | 9.68 | 6.37 | 9.54 |
| K2O | <DL | <DL | 0.04 | 0.31 | <DL | <DL | 0.15 | <DL | 0.07 | 0.22 | 0.13 | <DL | <DL | 0.02 | 0.31 | < DL |
| P2O5 | 0.11 | 0.10 | 0.07 | 0.34 | 0.14 | 0.13 | 0.13 | 0.14 | 0.11 | 0.12 | 0.12 | 0.12 | 0.48 | 0.31 | 0.98 | 0.16 |
| SiO2 | 30.30 | 32.99 | 33.72 | 29.80 | 32.02 | 30.54 | 32.76 | 30.36 | 31.53 | 28.24 | 6.62 | 30.87 | 33.40 | 30.65 | 27.38 | 31.23 |
| Al2O3 | 13.52 | 12.09 | 11.69 | 9.63 | 15.95 | 13.37 | 12.10 | 12.98 | 12.91 | 12.67 | 3.66 | 13.51 | 11.78 | 11.13 | 7.83 | 12.83 |
| MgO | 0.74 | 0.17 | 0.43 | 0.25 | 0.23 | 0.72 | 0.49 | 0.82 | 0.47 | 0.32 | <DL | 0.64 | 0.57 | 0.34 | 0.34 | 0.55 |
| Na2O | <DL | 0.06 | 0.35 | 0.25 | <DL | <DL | 0.30 | <DL | 0.37 | 0.25 | 0.07 | <DL | 0.56 | 0.25 | 0.37 | 0.13 |
| F b | 0.09 | 0.38 | 0.10 | 0.23 | <DL | <DL | 0.18 | <DL | 0.10 | 0.28 | 2.19 | <DL | 0.18 | 0.27 | 0.12 | 0.16 |
| Total | 97.42 | 95.77 | 94.91 | 78.62 | 97.82 | 96.56 | 94.95 | 98.14 | 95.08 | 79.68 | 58.16 | 98.11 | 94.40 | 91.00 | 74.40 | 95.66 |
| Sr | 30 | 238 | 199 | 46 | 35 | 231 | 31 | 201 | 170 | 163 | 181 | 412 | 911 | 656 | 271 | |
| Eu | 57 | 78 | 65 | 63 | 66 | 70 | 52 | 61 | 45 | 149 | 66 | 63 | 68 | 45 | 71 | |
| Gd | 1014 | 1955 c | 1353 | 1393 | 1021 | 1098 | 1286 | 886 | 1852 | 720 | 3048 | 825 | 713 | 753 | 524 | 837 |
| Tb | 98 | 199 | 232 | 108 | 107 | 185 | 91 | 204 | 100 | 368 | 79 | 72 | 70 | 58 | 81 | |
| Dy | 384 | 1107 | 1252 | 512 | 401 | 972 | 356 | 819 | 536 | 1754 | 310 | 289 | 268 | 244 | 321 | |
| Ho | 52 | 201 | 242 | 81 | 54 | 172 | 48 | 111 | 83 | 292 | 43 | 42 | 37 | 38 | 45 | |
| Er | 115 | 569 | 709 | 196 | 102 | 489 | 93 | 234 | 213 | 678 | 89 | 94 | 76 | 88 | 95 | |
| Tm | 11 | 81 | 103 | 27 | 11 | 73 | 10 | 29 | 34 | 76 | 10 | 11 | 9 | 11 | 11 | |
| Yb | 65 | 575 | 695 | 215 | 62 | 524 | 57 | 191 | 247 | 421 | 53 | 69 | 51 | 69 | 61 | |
| Lu | 7 | 85 | 105 | 31 | 7 | 77 | 7 | 25 | 34 | 55 | 7 | 10 | 7 | 11 | 9 | |
| Zr | 25 | 17 | 15 | 7 | 14 | 21 | 24 | 8 | 18 | 7 | 39 | 246 | 247 | 1456 | 25 | |
| U | 43 | 320 | 402 | 54 | 48 | 301 | 62 | 378 | 1038 | 759 | 126 | 369 | 209 | 1373 | 168 | |
| Nb | <DL | 1 | 1 | <DL | <DL | 1 | 1 | <DL | 1 | 1 | 1 | 5 | 3 | 12 | 1 | |
| Sn | 13 | 31 | 63 | 216 | 16 | 27 | 16 | 50 | 49 | 41 | 16 | 32 | 31 | 88 | 23 | |
| Ba | 3 | 515 | 317 | <DL | 26 | 509 | 7 | 247 | 291 | 295 | 46 | 84 | 82 | 129 | 72 | |
| Hf | 1 | 1 | 1 | 1 | 1 | 2 | 1 | <DL | 1 | <DL | 1 | 1 | 3 | 22 | 1 | |
| Ta | <DL | <DL | <DL | <DL | <DL | <DL | <DL | <DL | <DL | <DL | 0 | <DL | <DL | <DL | <DL | |
| ΣREE [wt %] | 20.80 | 17.61 | 13.50 | 7.09 | 16.47 | 20.24 | 15.66 | 20.81 | 16.71 | 9.49 | 29.20 | 20.65 | 16.42 | 16.88 | 9.00 | 18.66 |
| La/Sm | 23 | 19 | 16 | 8 | 22 | 25 | 18 | 29 | 10 | 23 | 12 | 41 | 31 | 23 | 13 | 32 |
| (La/Yb)N | 669 | - | 47 | 14 | 154 | 657 | 61 | 794 | 144 | 77 | 135 | 849 | 508 | 613 | 194 | 659 |
| Th/U | 106 | 16 | 47 | 119 | 108 | 106 | 46 | 97 | 45 | 24 | 33 | 33 | 38 | 101 | 39 | 29 |
| Cations, calculated based on the structure refinement of Armbruster et al. [39]: | ||||||||||||||||
| Grain | GR-1 | GR-1 | GR-1 | GR-1 | GR-1 | GR-2 | GR-2 | GR-3 | GR-3 | GR-3 | SOK-1 | SOK-1 | SOK-1 | SOK-1 | SOK-2 | |
| Spot no. (EPMA/LA-ICP-MS) | 1/16 | 1r | 1’/8 | 2’/10 | 4’/7 | 28/23 | 18’/22 | 7/40 | 8’/35 | 10’/43 | 10/14 | 17/13 | 18/18 | 19/19 | 22/20 | |
| Zone | zone 1 d | zone 2 (worms) | zone 2 (bright) | zone 2 (dark) | zone 3c | zone 1 | zone 2 (dark) | zone 1 | zone 3a | zone 2 (dark) | zone 1 | zone 2 (medium) | zone 2 (bright) | zone 3a | zone 2 (bright) | |
| Si e | 2.952 | 3.000 | 3.000 | 3.000 | 2.966 | 2.988 | 3.000 | 2.939 | 3.000 | 3.000 | 2.975 | 3.000 | 3.000 | 3.000 | 3.000 | |
| P | 0.009 | - | - | - | 0.011 | 0.010 | - | 0.012 | - | - | 0.010 | - | - | - | - | |
| Al | 0.039 | 0.000 | 0.000 | 0.000 | 0.023 | 0.002 | 0.000 | 0.049 | 0.000 | 0.000 | 0.015 | 0.000 | 0.000 | 0.000 | 0.000 | |
| Total T-site | 3.000 | 3.000 | 3.000 | 3.000 | 3.000 | 3.000 | 3.000 | 3.000 | 3.000 | 3.000 | 3.000 | 3.000 | 3.000 | 3.000 | 3.000 | |
| Ti | 0.109 | 0.188 | 0.197 | 0.346 | 0.035 | 0.109 | 0.177 | 0.134 | 0.132 | 0.303 | 0.118 | 0.246 | 0.199 | 0.323 | 0.129 | |
| Al | 1.512 | 1.295 | 1.226 | 1.143 | 1.718 | 1.540 | 1.306 | 1.432 | 1.448 | 1.586 | 1.519 | 1.247 | 1.284 | 1.011 | 1.453 | |
| Fe3+ | 0.404 | 1.494 | 1.521 | 1.339 | 0.533 | 0.352 | 1.396 | 0.439 | 1.033 | 1.061 | 0.372 | 1.039 | 1.067 | 0.897 | 1.044 | |
| Fe2+ | 0.868 | 0.000 | 0.000 | 0.000 | 0.656 | 0.895 | 0.054 | 0.872 | 0.299 | 0.000 | 0.900 | 0.000 | 0.000 | 0.000 | 0.289 | |
| Mg | 0.107 | 0.023 | 0.057 | 0.037 | 0.032 | 0.104 | 0.067 | 0.119 | 0.066 | 0.050 | 0.091 | 0.076 | 0.050 | 0.056 | 0.078 | |
| Mn2+ | 0.000 | 0.000 | 0.000 | 0.011 | 0.026 | 0.000 | 0.000 | 0.004 | 0.021 | 0.000 | 0.000 | 0.041 | 0.041 | 0.038 | 0.008 | |
| Total M-site | 3.000 | 3.000 | 3.000 | 2.876 | 3.000 | 3.000 | 3.000 | 3.000 | 3.000 | 3.000 | 3.000 | 2.648 | 2.641 | 2.324 | 3.000 | |
| Mn2+ | 0.026 | 0.017 | 0.016 | 0.000 | 0.014 | 0.024 | 0.019 | 0.021 | 0.012 | 0.018 | 0.025 | 0.000 | 0.000 | 0.000 | 0.021 | |
| Fe2+ | 0.016 | 0.048 | 0.091 | 0.000 | 0.010 | 0.031 | 0.034 | 0.011 | 0.000 | 0.000 | 0.018 | 0.000 | 0.000 | 0.000 | 0.000 | |
| Ca | 1.067 | 0.689 | 0.598 | 0.375 | 1.297 | 1.074 | 0.667 | 1.073 | 0.932 | 0.543 | 1.080 | 0.833 | 1.015 | 0.748 | 0.982 | |
| Na | 0.001 | 0.010 | 0.060 | 0.049 | - | - | 0.053 | - | 0.068 | 0.052 | - | 0.097 | 0.048 | 0.078 | 0.024 | |
| K | - | - | 0.004 | 0.039 | - | - | 0.018 | - | 0.009 | 0.030 | - | - | 0.003 | 0.043 | - | |
| P | - | 0.008 | 0.006 | 0.029 | - | - | 0.010 | - | 0.009 | 0.010 | - | 0.037 | 0.026 | 0.091 | 0.013 | |
| REE | 0.875 | 0.608 | 0.520 | 0.323 | 0.661 | 0.853 | 0.621 | 0.873 | 0.689 | 0.438 | 0.860 | 0.638 | 0.715 | 0.431 | 0.775 | |
| Th | 0.012 | 0.026 | 0.035 | 0.124 | 0.014 | 0.013 | 0.033 | 0.015 | 0.042 | 0.068 | 0.010 | 0.033 | 0.053 | 0.151 | 0.012 | |
| Total A-site | 2.000 | 1.407 | 1.335 | 0.942 | 2.000 | 2.000 | 1.465 | 2.000 | 1.764 | 1.165 | 2.000 | 1.644 | 1.873 | 1.552 | 1.832 | |
| Feox Armbruster et al. [39] | 0.31 | 0.97 | 0.94 | 1.00 | 0.44 | 0.28 | 0.94 | 0.33 | 0.78 | 1.00 | 0.29 | 1.00 | 1.00 | 1.00 | 0.78 | |
| Feox Petrik et al. [2] | 0.34 | 0.50 | 0.57 | 0.62 | 0.43 | 0.38 | 0.49 | 0.39 | 0.41 | 0.47 | 0.38 | 0.45 | 0.41 | 0.56 | 0.40 | |
Element oxides were measured by EPMA. Trace elements from Sr to Ta were measured by LA-ICP-MS. a Spot numbers correspond to those given in Supplementary Table S2 (EPMA) and Table S3 (LA-ICP-MS). b F contents are approximate and are given only to show variations between different zones/samples. c Gd concentrations in case of GR-1 spot 1r were measured by EPMA and are above the detection limit. <DL—below detection limit. d Formula unit calculations for zone 1 were based on 8 cations. e Formula unit calculations for zones 2 and 3 were normalized to Si = 3.
© 2020 by the authors. Licensee MDPI, Basel, Switzerland. This article is an open access article distributed under the terms and conditions of the Creative Commons Attribution (CC BY) license (http://creativecommons.org/licenses/by/4.0/).
Share and Cite
MDPI and ACS Style
Gros, K.; Słaby, E.; Jokubauskas, P.; Sláma, J.; Kozub-Budzyń, G. Allanite Geochemical Response to Hydrothermal Alteration by Alkaline, Low-Temperature Fluids. Minerals 2020, 10, 392. https://doi.org/10.3390/min10050392
AMA Style
Gros K, Słaby E, Jokubauskas P, Sláma J, Kozub-Budzyń G. Allanite Geochemical Response to Hydrothermal Alteration by Alkaline, Low-Temperature Fluids. Minerals. 2020; 10(5):392. https://doi.org/10.3390/min10050392
Chicago/Turabian StyleGros, Katarzyna, Ewa Słaby, Petras Jokubauskas, Jiří Sláma, and Gabriela Kozub-Budzyń. 2020. "Allanite Geochemical Response to Hydrothermal Alteration by Alkaline, Low-Temperature Fluids" Minerals 10, no. 5: 392. https://doi.org/10.3390/min10050392
Note that from the first issue of 2016, this journal uses article numbers instead of page numbers. See further details here.