Framework for Monitoring and Control of the Production of Calcined Kaolin


Resource Engineering Section, Department of Geoscience and Engineering, Delft University of Technology, Stevinweg 1, 2628 CN Delft, The Netherlands
*
Author to whom correspondence should be addressed.
Minerals 2020, 10(5), 403; https://doi.org/10.3390/min10050403
Submission received: 26 March 2020
/
Revised: 21 April 2020
/
Accepted: 28 April 2020
/
Published: 29 April 2020
(This article belongs to the Special Issue Industrial Minerals)
Abstract
:In response to the growing demand for sustainable products and services, the kaolin calcination industry is developing practices that optimise the use of resources. The main challenges include more efficient use of raw materials and a reduction in the energy consumed by the calcination furnace. An opportunity to achieve this lies in the optimisation of the calcination process. This can be done by giving real-time feedback on the quality parameters of the generated calcined kaolin. This study proposes the use of infrared spectroscopy as a monitoring technique to determine the chemical properties of the calcined kaolin product. The basis of the monitoring system is the measurement of the kaolin soluble alumina content as one of the most important quality parameters; this property is an indicator of the over- or under-use of raw materials and energy during the calcination process and can advise the operations regarding the optimisation of the working conditions of the furnace. The implementation of an infrared-based monitoring system would lead to increased efficiency in the production of calcined kaolin.
1. Introduction
In the stages involved in the processing of kaolin for speciality applications, calcination is the stage that has the highest consumption of energy [1]. Nevertheless, the focus of the minerals industry in recent years has been towards the sustainable extraction and processing of raw materials. As a consequence, mining companies are developing and implementing practices that include, among others, reduction of energy consumption and reduction of CO2 emissions [2]. In this scenario, the optimisation of the calcination process during the generation of kaolin products is of increasing importance.
The industrial calcination of kaolin occurs in calciners such as the Multiple Hearth Furnace (MHF) [3]. The use of energy and resources in the process greatly depends upon the performance of the calciner, which is operated following a control strategy based on the online measurements of temperature, gas flow and feed rate for the calciner [4]. The quality control of the calcined kaolin product (i.e., soluble alumina and brightness parameters) is carried out with laboratory analyses which prohibit consistent and timely feedback for process control. Buxton and Benndorf [5] stated that, in this scenario, on-site sensor-based material characterisation has the potential to increase the performance of the process by ensuring the adherence of the product to the quality specifications, reducing the necessity of off-line analyses and providing reconciliation data for real-time monitoring and control.
To optimise the performance of the calciner, Jämsä-Jounela et al. [4] proposed the concept for a control strategy enhanced by mineralogy-driven algorithms, which would also include the online measurement of the soluble alumina parameter. Recently, Guatame-García and Buxton [6] proposed the use of infrared sensors to predict the soluble alumina content in calcined kaolin by using a Support Vector Regression (SVR) model. Such a measurement could be integrated into the proposed control strategy, thus providing physical data to optimise the performance of the calciner. The results from that study provided a proof of concept for the validity of the approach and encouraged a more thorough analysis to increase its reliability. The successful implementation of the soluble alumina measurement would depend upon the performance of the predictions and on their relevance for decision making in the control strategy.
In order take a step further towards the implementation of the infrared-based soluble alumina measurements as a monitoring tool in the calcination of kaolin, this study is a continuation on the previous work of the authors [6]. The primary objective is to propose a framework for the monitoring and quality control of products in the generation of calcined kaolin that can be integrated into the enhanced control strategy. The product control builds upon the previously developed measurement of the soluble alumina, presenting an updated model to improve the accuracy of the predictions. This paper further discusses how the soluble alumina measurement can be incorporated into the enhanced control strategy. The integration of the monitoring of kaolin calcination products with the enhanced control strategy would improve its performance having a direct impact on the optimisation of the calcination process.
2. Industrial Calcination of Kaolin
Raw kaolin that is used for generating speciality products contains more than 90% of kaolinite and small amounts of muscovite, illite and quartz. In the industrial calcination of kaolin, the raw material is thermally treated to temperatures above 1000 using the soft calcination method, i.e., exposing the material to high temperatures for a prolonged time. In the initial stage of the process, around 600 , the kaolinite (Al2Si2O5(OH)4) dehydroxylates and transforms into amorphous metakaolinite (Al2Si2O7) (Equation (1)), which has typically high chemical reactivity. Around 980 , the metakaolinite transforms into the spinel phase (Al-spinel (Al2O3) and Si-spinel (SiO2)) (Equation (2)), followed by the nucleation of the spinel and transformation into characteristically abrasive mullite above 1100 (Equation (3)) [7,8,9].
In the calcination of kaolin for speciality applications, the aim is to generate a product in an intermediate stage between the amorphous and crystalline spinel phase. This stage marks the balance point between low reactivity, measured as the soluble alumina content (i.e., amount of Al2O3 that can be extracted under chemical attack with strong acids), and low abrasiveness, given by the presence of mullite. The presence of soluble alumina and mullite above-determined thresholds are deleterious in calcined kaolin products [10].
The Multiple Hearth Furnace (MHF) that is used for the calcination of kaolin is presented in Figure 1. The MHF is composed of eight hearths and eight burners, located at the fourth and sixth hearths, which combust natural gas to provide the necessary heat to trigger the calcination reactions. Adjustment of the gas flow controls the temperature inside the calciner [3,10,11].
Highly refined kaolin is fed into the calciner using an upper weigh feeder bin at the top of the furnace, followed by a weighed hopper via a rotary valve. The feed rate is expressed in kg/minute of zero moisture feed. Once inside the MHF, the kaolin flows downstream through the hearths of the furnace, stirred spirally by rotating rabble blades. Following the changes in the temperature profile, the calcination reactions previously described occur. At the bottom of the eighth hearth, the calcined kaolin is discharged through two drop holes on either side of the furnace base. The calcined kaolin, which leaves the furnace with an approximate temperature of 750 as a powder, is first cooled down to 100 using a high flow stream of ambient air (blast cooling) and then taken to cooler-bag filters to reach ambient temperature. Thomas et al. [10] calculated a residence time for the kaolin within the furnace of 42 min under standard operating conditions. The time comprised between discharge and blast cooling is about 30 min.
In ideal conditions, the transformation from kaolinite to metakaolinite occurs at the fourth hearth, and the transformation of metakaolinite into Al-Si spinel occurs at towards the sixth hearth [4]. As part of the process control strategy, the temperature at hearth six is manipulated to facilitate the absorption of Al into the spinel phase. Since the optimum calcination stage is defined by a point where kaolin has been fully but not excessively calcined, this step is a critical part of the process. At this specific point, over-heating would result in the nucleation of abrasive mullite, whereas under-heating would prevent the absorption of Al in the spinel phase, resulting in a product with high soluble alumina. The produced calcined kaolin has a soluble alumina target of less than .
3. Methods
3.1. Samples
The study of Guatame-García and Buxton [6], which proposed infrared-based measurements to predict the soluble alumina content in calcined kaolin, was limited to a sample set with values near to the maximum accepted soluble alumina. Based on those values, it is only possible to detect samples that are potentially under-calcined. In order to extend the capacity of the predictions also to detect samples that can be over-calcined, it was necessary to include lower soluble alumina values into the prediction models. For this purpose, samples of calcined kaolin products collected in four different sampling campaigns were combined to form a larger sample set with a wide range of soluble alumina. All the samples were obtained from the production route of a kaolin processing plant in Devon (south-west England) after blast cooling. Every sample corresponds to approximately 1 kg of cumulative and homogenised powders taken over a pre-defined period in every campaign.
The samples from the first and second campaigns are the same ones originally used for developing the prediction models based on IR spectroscopy [6]. The first campaign corresponds to daily shifts collected over 23 consecutive days. In the second campaign, the samples were collected every 12 h during 16.5 consecutive days. The samples from the third campaign were obtained in the time span of 26 h in sampling intervals of 2 h. In the fourth campaign, one sample was collected every hour in a time span of six hours for four consecutive days. Table 1 summarises the sampling parameters of all the sample sets.
3.2. Soluble Alumina
The extraction of soluble alumina is employed as the standard operational procedure (SOP) to determine the quality of the calcined kaolin product. This method makes use of the solubility of Al2O3 in the spinel phase (-alumina) in strong acids to estimate the reactivity of the calcined kaolin [12,13,14]. The measurement of soluble alumina followed the methods described by Taylor [15] and Thomas [16], in which of sample is diluted into 10 of concentrated (16M) nitric acid (Analar grade) for 4 h. The concentration of soluble alumina in solution was determined by using inductively coupled plasma atomic emission spectroscopy (ICP-AES) at the plant’s laboratory using a Thermo Electron Iris-AP emission spectrometer. The overall error of the method is reported as . Table 1 presents the descriptive statistics of the soluble alumina values of all the sample sets.
3.3. Infrared Data Acquisition and Processing
Soluble alumina can be estimated from the IR spectra of calcined kaolin by using the method proposed by Guatame-García and Buxton [6]. For the acquisition of the infrared spectra, each sample was placed in a sample cup where the powder was compacted and flattened with a spatula to minimise void spaces. The infrared spectra of kaolin feed and product samples were collected using an Agilent 4300 handheld FTIR spectrometer using a diffuse reflectance interface and coarse silver calibration. To capture the spectral feature that serves as a proxy for the presence of soluble alumina, the spectra of the samples were recorded in the mid-wavelength (MWIR) range, from 1800 to 1538 (5.5 to 6.5 ).
The spectral processing and analysis were carried out in the R environment using the prospectr package [17]. First, the average of five spectral measurements corresponding to each sample was computed; the resulting spectra were subsequently smoothened using the Savitzky-Golay filter with a polynomial order of 3 and windows size of 55 data points. The dataset was subject feature enhancement by applying the continuum removal (CR) technique [18].
3.4. Soluble Alumina Prediction Model
For updating the Support Vector Regression (SVR) model, the datasets from the first, second and third sampling campaigns were merged into a single dataset consisting of 70 samples. The merged data set was split into a training set of 55 samples and a test set of 15 samples using random selection. The update of the SVR model followed the same methodology used in the calibration of the original model: using the R environment, interface to LIBSVM (open source machine learning library for SVM) [19], package e1071 (functions for SVM) [20], and an RBF (radial basis function) kernel function. The optimisation of the parameters and C used a grid search and 10-fold cross-validation.
The assessment of the model performance was based on the statistical parameters root mean squared error of the cross-validation (RMSECV), root mean squared error of the calibration (RMSEC), root mean squared error of the prediction (RMSEP), calculated by Equation (4):
where n refers to the number of samples and and are values determined by the SVR model. Additionally, the dataset of the fourth sampling campaign was used to independently validate the performance of the updated model, using the root mean squared error of the validation (RMSEV) as performance indicator.
The models were also compared by using the coefficient of multiple determination () and the Mean Absolute Error (MAE), which is calculated by Equation (5)
as the arithmetic average of the absolute errors of the prediction () in realtion to the measured values ().
The accuracy of the models was compared using the F-test, which uses the ratio of the RMSEP of two models according to Equation (6)
where The value is compared against , where v = sample size, and = significance level. The differences in the accuracy of the models are evaluated by hypothesis testing to verify if the variances are homogeneous; if is greater than , the hypothesis is rejected.
4. Results
4.1. Model Update
The original SVR model was built based on the samples of the first and second sampling campaigns, with soluble alumina content ranging from 0.26 to 0.64 . As Table 1 shows, the soluble alumina values of the samples of the third campaign range from 0.23 to 0.32 and have a mean of , which indicates that a significant part of the data set lies outside the range of the SVR model. Despite this, the IR spectra were used to calculate the soluble alumina content on these samples using the original SVR model. A comparison with the reference laboratory measurements evidenced the poor performance of the prediction, as noted by an , which is three times as high as the error that the model allows ( ). These results made evident that the SVR model does not adequately represent the entire range of soluble alumina values of the calcined kaolin products.
The newly built data set for updating the model has soluble alumina values that range from 0.23 to 0.64 and a mean value of . Table 2 summarises the calibration and performance parameters of the original and updated models. Regarding the calibration parameters, the value is smaller in the updated model, and the required number of support vectors (SV) is proportionally larger. A smaller value implies that, in order to compensate for the variation added by the low soluble alumina values, this model became more rigid than the original one. Consequently, the model requires a larger proportion of the dataset as support vectors. Nevertheless, the number of SV guarantees that the model does not over-fit the data.
The adjustment of the model comes with the cost of decreased accuracy, as evidenced by the performance indicators. The value decreases from 0.87 to 0.77 which can be interpreted as 11% less accuracy in terms of the variance-accounted-for (VAF). The increase of in the RMSECV and in the RMSEC is also an indication of the reduced accuracy of the updated model. However, a look at the MAE shows that the difference in the accuracy is not substantial. Compared to the RMSE, the increased error of the updated model as indicated by the MAE is only . This is because the RMSE is more sensitive to a small number of outliers that increase the variance of absolute error. The greater variance in the dataset used for the updated model increases the RMSE but does not necessarily imply a significant worsening of the performance of the updated model.
From Table 2 it is also possible to note that the prediction error of the updated model is lower than the original one. The F-test for these errors resulted in , indicating, with a 95% of confidence, that the original model is more accurate than the updated model for the prediction of soluble alumina.
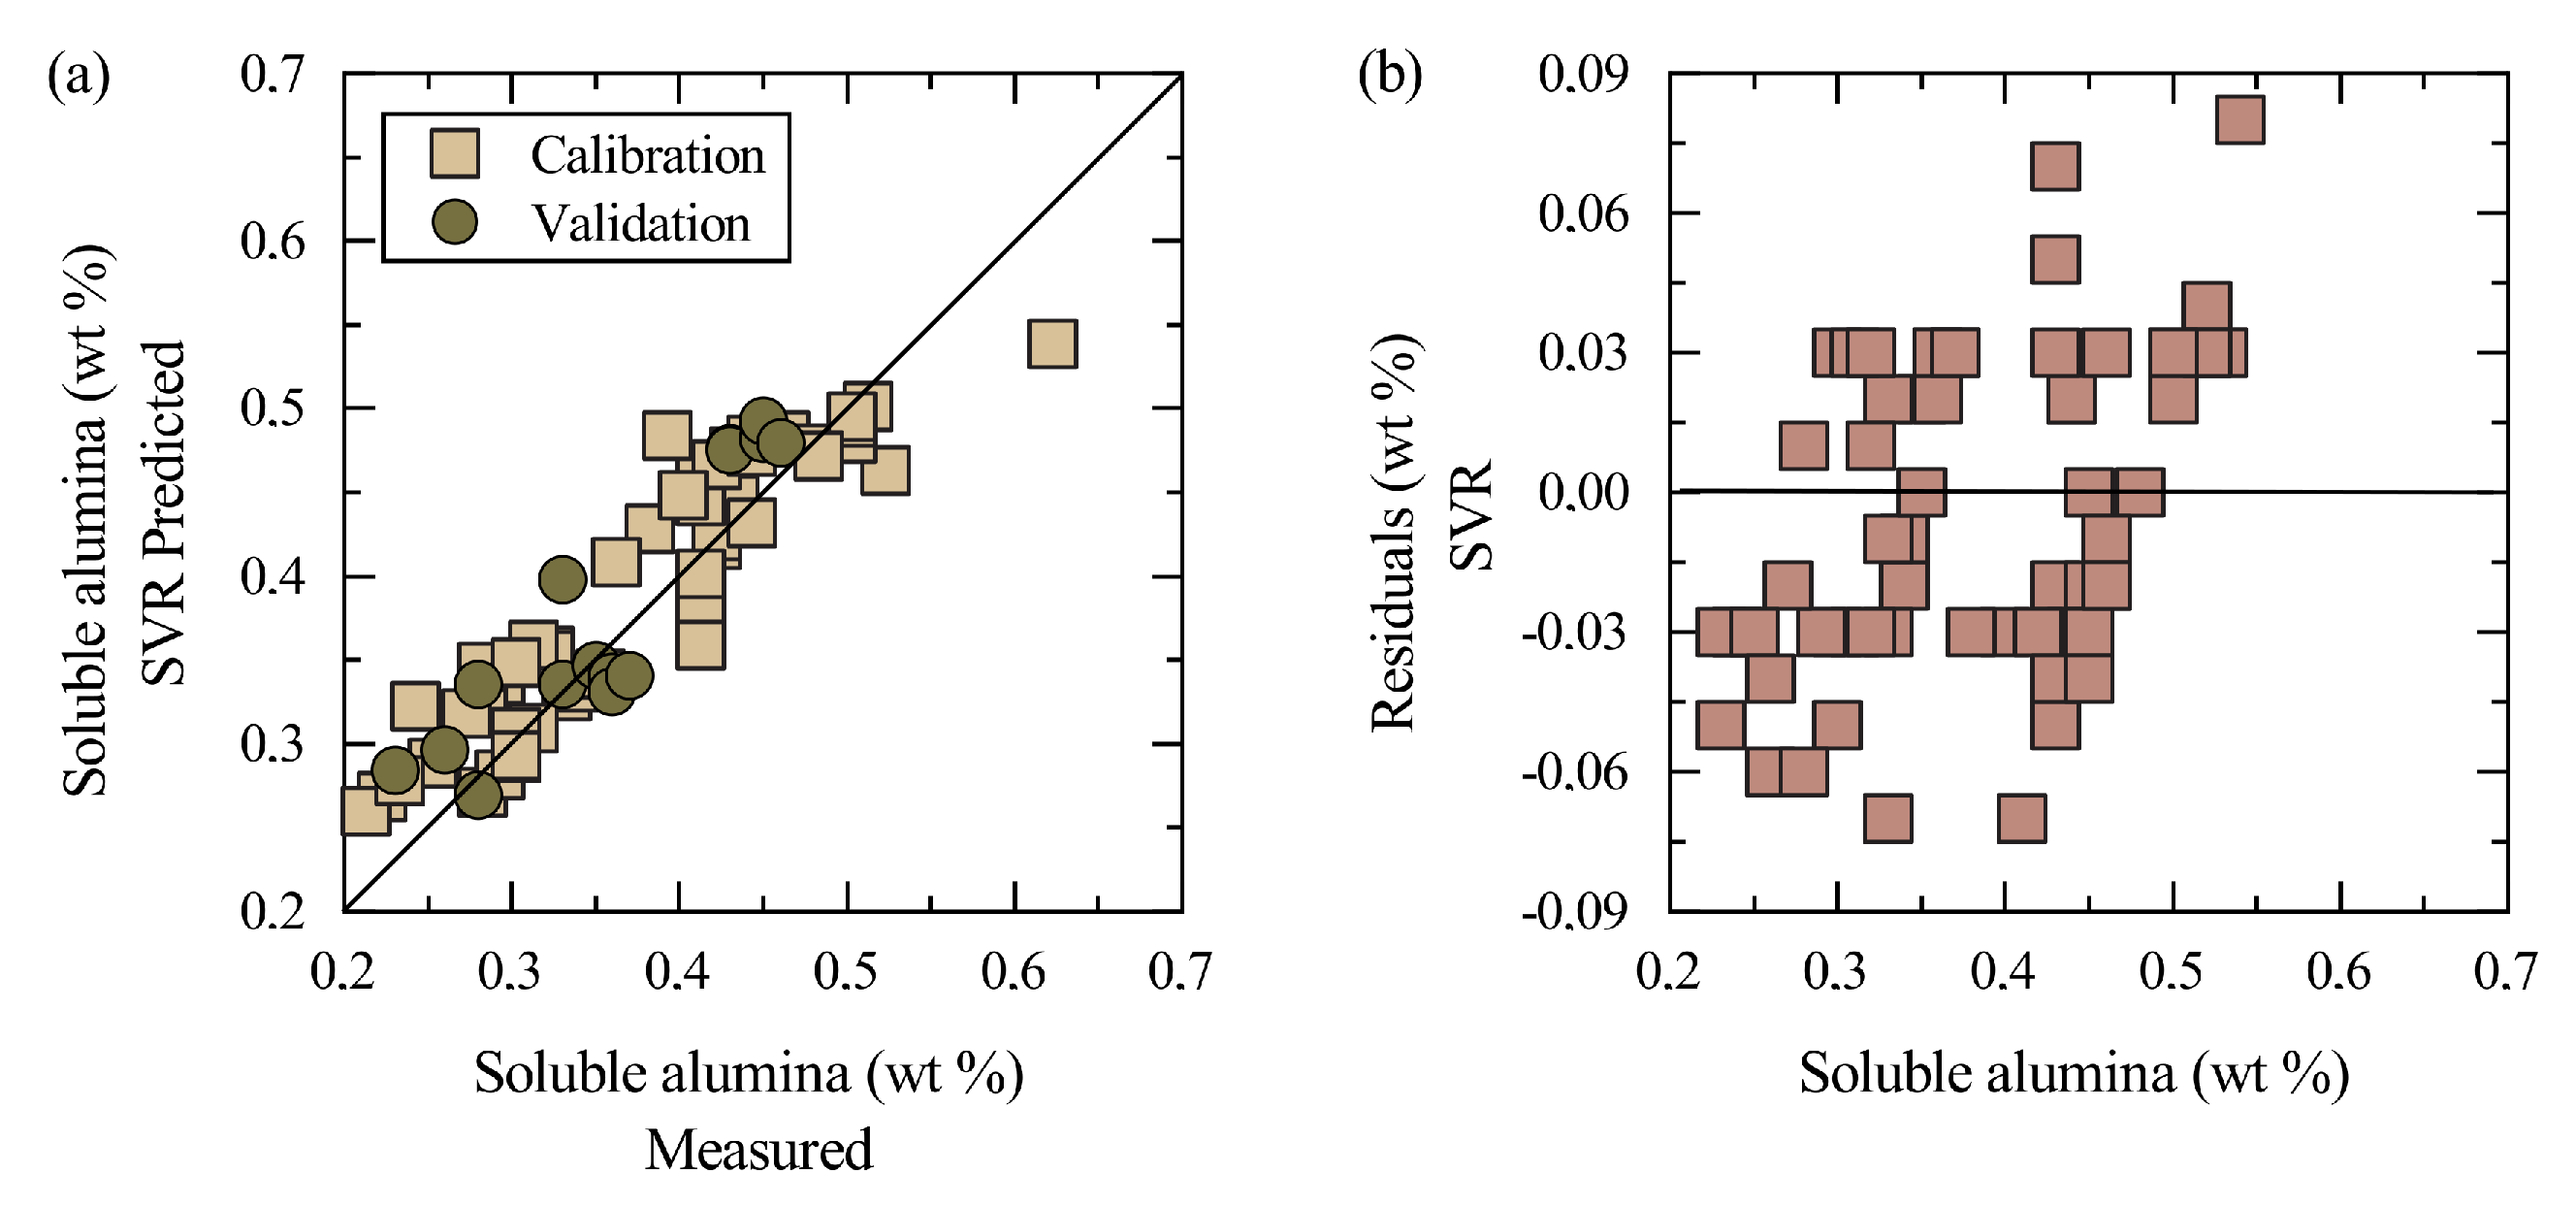
A representation of the results in Figure 2 shows that, despite the increased errors, the updated model produces reasonably good predictions that do not differ significantly from those of the original model, presented in Figure 3. Similarly to the original model, the updated one seems to under-predict high soluble alumina values (above ) and over-predict low values (below ), although in a bigger magnitude than the original model, as evidenced by the residuals plot. These results indicate that even though the updated model compromises the accuracy to cover a more extensive range of soluble alumina values, the model is nonetheless valid.
4.2. Model Validation
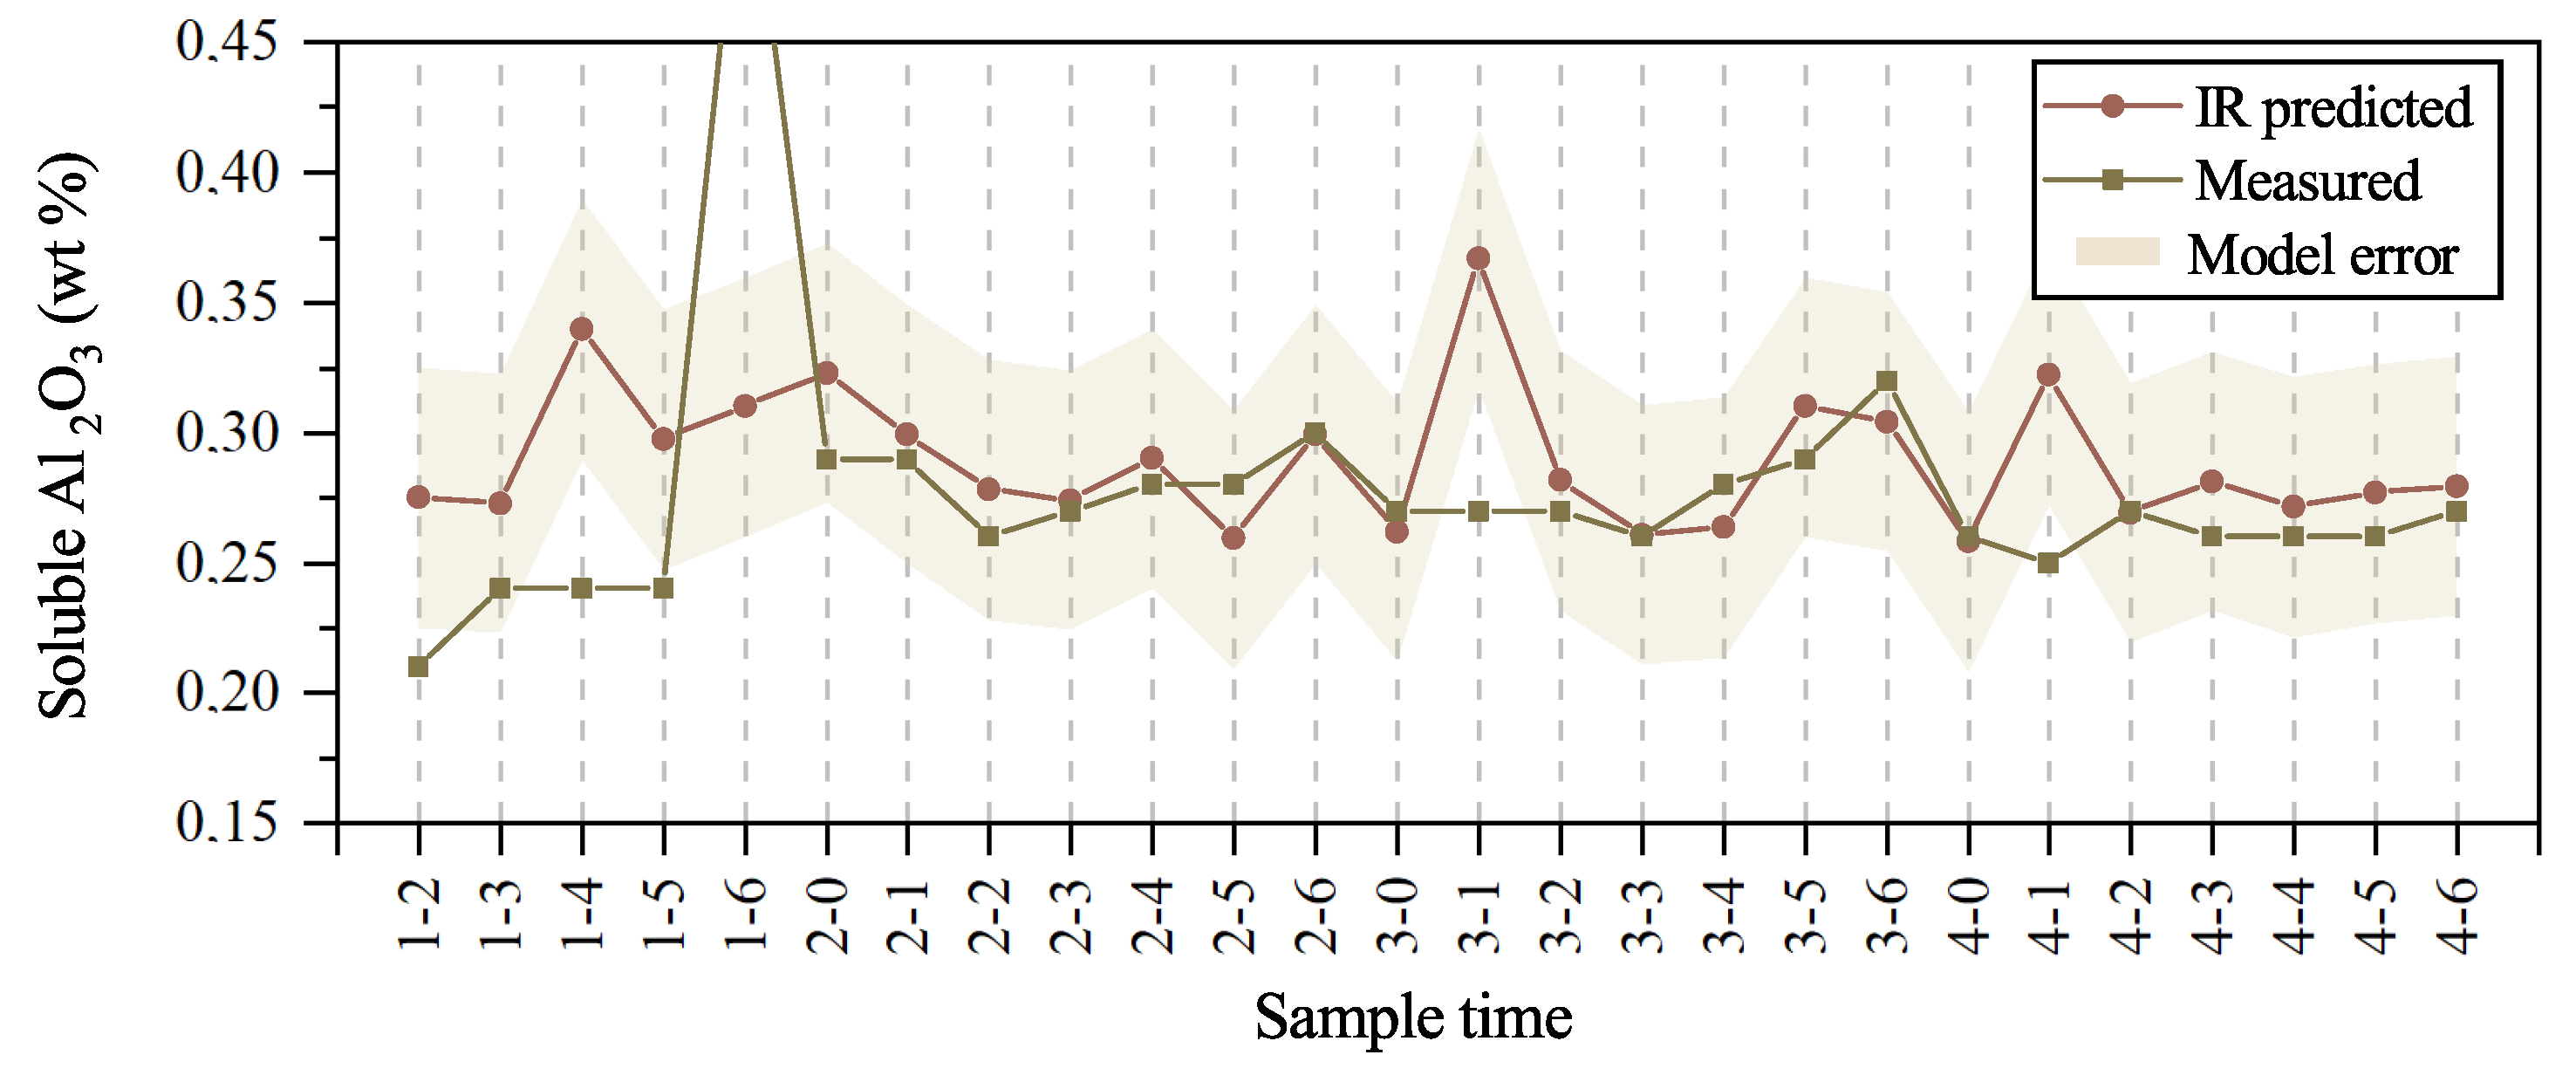
The final validation of the updated SVR model was done using the data set corresponding to the samples of the fourth campaign. This set consists of 26 samples with soluble alumina values that vary from 0.21 to 0.54 , with only one value falling outside the range of the updated SVR model (i.e., ). Figure 4 displays the measured and IR-predicted soluble alumina values of the validation samples using the updated model. In general, there seems to be an acceptable match between the IR-predicted and the measured values, with a reported error . This error is similar to the RMSECV of the updated model ( ), which indicates that the model is adequate for this set of samples. Despite this, there are two remarkable differences between the predicted and the measured values that deserve more detailed analysis.
The most striking difference between the measured and predicted values occurs in the sample labelled as 1–6, namely the last sample collected on day one. The measured soluble alumina value of this sample is , whereas the predicted value is , a difference almost four times as big as the error of the model. Observing the trends of the samples on day 1 (samples 1–2 to 1–6), all the predicted and measured values fluctuate in a narrow range, with the only exception of the measured data point of sample 1–6. Given these trends, and taking into account the operation of the calciner and the consistency of the feed, an error in the laboratory measurement is more likely than the error in the prediction, which suggests a value between 0.26 and . Without this data point, the RMSEV drops to , which is similar to the RMSEC and RMSEP in the model.
The second difference also occurs in the samples collected on day one. Except for sample 1–6, explained above. In the remainder samples, the soluble alumina values are strongly over-predicted, with the measured values lying outside or close to the margin of error. The over-prediction of low values was already observed in the calibration set (Figure 2), and in this validation set, most of the samples have also over-estimated predictions. However, these results indicate that the discrepancy between measured and predicted values becomes stronger at very low values. Nonetheless, taking into account that very low soluble alumina is not critical for the control of the calcined product, the updated SVR model can be considered adequate for monitoring the quality of the calcined kaolin product regarding its reactivity. Since low soluble alumina might be an indicator for over-calcination, low values predicted using the updated model can instead be used as an advising parameter to check the mullite content in the calcined product.
5. Product Monitoring
Currently, in the production of calcined kaolin, the method for the estimation of soluble alumina follows the procedure described by Taylor [15]. Even though it provides accurate measurements, the fact that it is a laboratory-based technique that depends on highly specialised equipment creates a turnaround time of 3 to 4 days [16]. Moreover, the number of assays per day are often limited to minimise the costs. These restrictions in the measurements prohibit timely operational feedback and process optimisation.
The proposed system for product monitoring aims to provide soluble alumina measurements that give timely feedback to the operation of the calciner. The system is based on the soluble alumina SVR-estimation using the IR spectra. The previous results indicate that there is a trade-off between a robust model that has a broad range of soluble alumina detection but a reduced accuracy, that is to say, the updated SVR model, and a model limited to a narrower detection range but with better accuracy, namely the original SVR model. Nevertheless, both models can estimate the amount of soluble alumina in the calcined kaolin with a level of accuracy that is acceptable for practical applications, as in the monitoring of the process.
The SVR models can be incorporated and become an integral part of the enhanced quality control strategy for the MHF proposed by Jämsä-Jounela et al. [4]. The control strategy seeks to optimise the capacity of the furnace and minimise its energy consumption while maintaining the quality standards of the calcined product. Figure 5 presents a simplified version of the concept of the quality control scheme of the furnace developed by Jämsä-Jounela et al. [4], with focus on the input of the IR-based soluble alumina measurement.
In practice, the quality requirements for soluble alumina specify a threshold of as the maximum amount allowed in the product. Therefore, that threshold is the critical value that the monitoring and control system should focus. In this scenario, a combination of the updated and original models would give a more reliable estimation of the quality of the samples.
At first instance, the updated SVR model can provide with an initial estimation of the soluble alumina content in the product, and discriminate low or high values. Based on the response of both models, as observed in Figure 2 and Figure 3, a low–high threshold can be set at . Low values do not impose a warning for the process, and therefore, precise estimation is not highly relevant. Nevertheless, low soluble alumina might suggest over-calcination of the kaolin, in which case, the mullite content of the calcined product should be considered. The furnace control strategy includes a soft-sensor for the determination of mullite, which also dictates changes in the feed rate.
In the case of high values, the soluble alumina content can be re-calculated using the original model that would generate a more accurate estimation. Since the accuracy of the original model is , a threshold at can be set as the point where action needs to be taken to increase the temperature in the furnace, which is controlled by adjusting the gas flow to hearths 4 and 6.
The implementation of an IR-based monitoring strategy for calcined products would enable the frequent collection of data, also creating permanent records. The integration of these data with other historical plant records could be used to perform trend analysis, develop soft-sensors and explore the opportunities for detecting other properties. Furthermore, the routine collection of data would serve to periodically recalibrate the models with the laboratory measurements that are regularly taken for official reporting.
With the existing instrumentation, the system can be used in a semi-offline mode, that is to say, on-site but with the intervention of an operator who collects the sample and manipulates the instrument. The biggest impact of the proposed framework is on the reduction of the turnaround time for operational feedback, which enables the optimisation of the processes with a direct effect on the energy consumption of the furnace and the use of the raw materials. The product monitoring could be carried out at earliest after blast cooling when the temperature of the calcined material allows its manipulation. The collection of the infrared measurements following the procedures used in this work and the calculation of the soluble alumina value using the SVR models takes approximately 10 min. Consequently, the infrared-based soluble alumina value can be obtained about 45 min after the discharge of the calcined powder. This delay is not only adequate for operational feedback but also indicates a significant time improvement from the current laboratory measurements, which are on the scale of days. The implementation of the system does not require extensive knowledge of chemometrics or infrared spectroscopy. A regular plant operator with minimal training could perform the measurements.
Even though the infrared instruments used for conducting this research are portable, full on-site implementation of the methods proposed in this work requires adapting the spectrometers to the mine operations. Adapting the spectrometer to an industrial set-up would require a system to collect and present the samples to the instrument, protection of the spectrometer head to avoid the need for constant cleaning, protection against dust –which is abundant at the operations–, and protection against humidity or moisture, to minimise the influence from the environment. The full automation of the system would require major design modifications of the instrument to make it more robust and autonomous.
6. Conclusions
The increasing demand for generating calcined kaolin products together with the increasing concerns regarding the economics and energy consumption related to the calcination process itself has created the need to generate strategies to optimise the process. This study proposed a framework for the monitoring and quality control of calcined kaolin products that can be integrated into a mineralogy-driven control strategy of the calcination process. The monitoring system estimates the soluble alumina content in the calcined product. It uses a sensor-based approach that uses infrared (IR) spectroscopy and multivariate predictions modelled using Support Vector Regression (SVR). Even though the set-up for the collection of the measurements is used in a semi-offline mode, it has the capacity to be adapted to become an automated on-line system.
The system uses a combination of two SVR models. First, a medium-level accuracy model ( ) that discriminates low and high soluble alumina values (i.e., higher or lower than ). Second, a higher-accuracy model ( ) that focuses on the prediction of values near to the threshold for quality specifications (soluble alumina > ). The integration of this monitoring framework into the enhanced control strategy for the MHF furnace can influence the decision parameters for feed rate and temperature control, with direct repercussions on the optimisation the resource utilisation and energy consumption of the calcination process.
Author Contributions
Conceptualisation, A.G.-G. and M.B.; methodology, validation and formal analysis A.G.-G.; writing–original draft preparation, A.G.-G.; writing–review and editing, M.B.; supervision, project administration and funding acquisition, M.B. All authors have read and agreed to the published version of the manuscript.
Funding
This work has been financially supported by the EIT Raw Materials KAVA funding “Integrated system for Monitoring and Control of Product quality and flexible energy delivery in Calcination” (MONICALC), grant 15045.
Acknowledgments
The authors wish to thank IMERYS Ltd., UK for the design and execution of the sampling campaigns.
Conflicts of Interest
The authors declare no conflict of interest. The funders had no role in the design of the study; in the collection, analyses, or interpretation of data; in the writing of the manuscript, or in the decision to publish the results.
References
- Glass, H.J. Geometallurgy—Driving Innovation in the Mining Value Chain. In Proceedings of the Third AusIMM International Geometallurgy Conference (GeoMet), Perth, Australia, 15–16 June 2016; The Australasian Institute of Mining and Metallurgy: Melbourne, Australia, 2016; Volume 3, pp. 21–28. [Google Scholar]
- Kogel, J.E.; Trivedi, N.; Herpfer, M.A. Measuring sustainable development in industrial minerals mining. Int. J. Min. Miner. Eng. 2014, 5, 4–18. [Google Scholar] [CrossRef]
- Eskelinen, A.; Zakharov, A.; Jämsä-Jounela, S.L.; Hearle, J. Dynamic modeling of a multiple hearth furnace for kaolin calcination. AIChE J. 2015, 61, 3683–3698. [Google Scholar] [CrossRef]
- Jämsä-Jounela, S.L.; Gomez-Fuentes, J.; Hearle, J.; Moseley, D.; Smirnov, A. Control strategy for a multiple hearth furnace in kaolin production. Control Eng. Pract. 2018, 81, 18–27. [Google Scholar] [CrossRef]
- Buxton, M.; Benndorf, J. The use of sensor derived data in optimization along the mine-value-chain: An overview and assessment of techno-economic significance. In Proceedings of the 15th International ISM Congress, Aachen, Germany, 16–20 September 2013; pp. 324–336. [Google Scholar]
- Guatame-García, A.; Buxton, M. Prediction of oluble Al2O3 in calcined kaolin using infrared spectroscopy and multivariate calibration. Minerals 2018, 8, 136. [Google Scholar] [CrossRef] [Green Version]
- Gualtieri, A.; Bellotto, M. Modelling the structure of the metastable phases in the reaction sequence kaolinite-mullite by X-ray scattering experiments. Phys. Chem. Miner. 1998, 25, 442–452. [Google Scholar] [CrossRef]
- Chakraborty, A.K. New Data on Thermal Effects of Kaolinite in the High temperature Region. J. Therm. Anal. Calorim. 2003, 71, 799–808. [Google Scholar] [CrossRef]
- Ptáček, P.; Šoukal, F.; Opravil, T.; Nosková, M.; Havlica, J.; Brandštetr, J. Mid-infrared spectroscopic study of crystallization of cubic spinel phase from metakaolin. J. Solid State Chem. 2011, 184, 2661–2667. [Google Scholar] [CrossRef]
- Thomas, R.; Grose, D.; Obaje, G.; Taylor, R.; Rowson, N.; Blackburn, S. Residence time investigation of a multiple hearth kiln using mineral tracers. Chem. Eng. Process. Process Intensif. 2009, 48, 950–954. [Google Scholar] [CrossRef]
- Gomez-Fuentes, J.; Jämsä-Jounela, S.L. Simplified mechanistic model of the Multiple Hearth Furnace for control development. Simul. Notes Eur. 2018, 28, 97–100. [Google Scholar] [CrossRef] [Green Version]
- Hulbert, S.F.; Huff, D.E. Kinetics of alumina removal from a calcined kaolin with nitric, sulphuric and hydrochloric acids. Clay Miner. 1970, 8, 337–345. [Google Scholar] [CrossRef]
- Phillips, C.V.; Wills, K.J. A laboratory study of the extraction of alumina of smelter grade from China clay micaceous residues by a nitric acid route. Hydrometallurgy 1982, 9, 15–28. [Google Scholar] [CrossRef]
- Ruíz-Santaquiteria, C.; Skibsted, J. Reactivity of Heated Kaolinite from a Combination of Solid State NMR and Chemical Methods. In Calcined Clays for Sustainable Concrete, Proceedings of the 1st International Conference on Calcined Clays for Sustainable Concrete; Scrivener, K., Favier, A., Eds.; Springer: Dordrecht, The Netherlands, 2015; pp. 125–132. [Google Scholar]
- Taylor, R.J. Treatment of Metakaolin. UK Patent Number WO2005108295 A1, 17 November 2005. [Google Scholar]
- Thomas, R. High Temperature Processing of Kaolinitic Materials. Ph.D. Thesis, University of Birmingham, Birmingham, UK, 2010. [Google Scholar]
- Stevens, A.; Ramirez-Lopez, L. An Introduction to the Prospectr Package. Online-Documentation of the Package Prospectr for R. 2014. Available online: https://CRAN.R-project.org/package=prospectr (accessed on 3 February 2017).
- Clark, R.N.; Roush, T.L. Reflectance spectroscopy: Quantitative analysis techniques for remote sensing applications. J. Geophys. Res. 1984, 89, 6329–6340. [Google Scholar] [CrossRef]
- Chang, C.; Lin, C. LIBSVM: A library for support vector machines. ACM Trans. Intell. Syst. Technol. 2011, 2, 1–27. [Google Scholar] [CrossRef]
- Meyer, D. Support Vector Machines: The Interface to Libsvm in Package e1071. Online-Documentation of the Package e1071 for R. Available online: https://CRAN.R-project.org/package=e1071 (accessed on 23 May 2017).
Figure 1.
Schematic cross-section of a Multiple Hearth Furnace depicting the location of the feed inlet and product outlet, as well as the burners that control the temperature profile (Reproduced after Eskelinen et al. [3], with permission).
Figure 1.
Schematic cross-section of a Multiple Hearth Furnace depicting the location of the feed inlet and product outlet, as well as the burners that control the temperature profile (Reproduced after Eskelinen et al. [3], with permission).

Figure 2.
(a) Measured vs Predicted plot of the updated SVR model in the calibration and validation samples, and (b) their respective residuals.
Figure 2.
(a) Measured vs Predicted plot of the updated SVR model in the calibration and validation samples, and (b) their respective residuals.

Figure 3.
(a) Measured vs Predicted plot of the original SVR model in the calibration and validation samples and (b) their respective residuals. Reproduced after Guatame-García and Buxton [6].
Figure 3.
(a) Measured vs Predicted plot of the original SVR model in the calibration and validation samples and (b) their respective residuals. Reproduced after Guatame-García and Buxton [6].

Figure 4.
IR-predicted values of the validation sample set using the updated SVR calibration model, compared to the measured values. The samples are labelled as x-y, where and . Sample 1–6 (measured) not displayed for purposes of scale ().
Figure 4.
IR-predicted values of the validation sample set using the updated SVR calibration model, compared to the measured values. The samples are labelled as x-y, where and . Sample 1–6 (measured) not displayed for purposes of scale ().

Figure 5.
Proposed monitoring scheme for the quality control of the production of calcined kaolin based on the IR estimation of soluble alumina to be integrated into the enhanced control strategy proposed by Jämsä-Jounela et al. [4].
Figure 5.
Proposed monitoring scheme for the quality control of the production of calcined kaolin based on the IR estimation of soluble alumina to be integrated into the enhanced control strategy proposed by Jämsä-Jounela et al. [4].


Table 1.
Sampling collection parameters for the four sampling campaigns and descriptive statistics of their corresponding soluble alumina content ().
Table 1.
Sampling collection parameters for the four sampling campaigns and descriptive statistics of their corresponding soluble alumina content ().
| Sampling Campaign | 1st | 2nd | 3rd | 4th |
|---|---|---|---|---|
| Sampling shift (hours) | 24 | 12 | 2 | 1 |
| Number of samples | 23 | 33 | 14 | 26 |
| Soluble alumina minimum | 0.26 | 0.30 | 0.23 | 0.21 |
| Soluble alumina maximum | 0.43 | 0.64 | 0.32 | 0.54 |
| Soluble alumina mean | 0.34 | 0.46 | 0.27 | 0.28 |
| Soluble alumina SD | 0.04 | 0.06 | 0.03 | 0.06 |
Table 2.
Summary of the optimisation parameters and performance indicators of the original [6] and updated support vector regression (SVR) calibrations.
Table 2.
Summary of the optimisation parameters and performance indicators of the original [6] and updated support vector regression (SVR) calibrations.
| Model | Samples | C | SV | RMSECV | RMSEC | RMSEP | MAE | ||||
|---|---|---|---|---|---|---|---|---|---|---|---|
| Total | Training | Test | (wt %) | (wt %) | (wt %) | (wt %) | |||||
| Original | 56 | 46 | 10 | 3.1 | 0.46 | 19 | 0.046 | 0.025 | 0.044 | 0.027 | 0.87 |
| Updated | 70 | 55 | 15 | 3.0 | 0.3 | 30 | 0.057 | 0.040 | 0.039 | 0.031 | 0.77 |
© 2020 by the authors. Licensee MDPI, Basel, Switzerland. This article is an open access article distributed under the terms and conditions of the Creative Commons Attribution (CC BY) license (http://creativecommons.org/licenses/by/4.0/).
Share and Cite
MDPI and ACS Style
Guatame-Garcia, A.; Buxton, M. Framework for Monitoring and Control of the Production of Calcined Kaolin. Minerals 2020, 10, 403. https://doi.org/10.3390/min10050403
AMA Style
Guatame-Garcia A, Buxton M. Framework for Monitoring and Control of the Production of Calcined Kaolin. Minerals. 2020; 10(5):403. https://doi.org/10.3390/min10050403
Chicago/Turabian StyleGuatame-Garcia, Adriana, and Mike Buxton. 2020. "Framework for Monitoring and Control of the Production of Calcined Kaolin" Minerals 10, no. 5: 403. https://doi.org/10.3390/min10050403
Note that from the first issue of 2016, this journal uses article numbers instead of page numbers. See further details here.