Article

IR Features of Hydrous Mg2SiO4-Ringwoodite, Unannealed and Annealed at 200–600 °C and 1 atm, with Implications to Hydrogen Defects and Water-Coupled Cation Disorder

1
School of Earth and Space Sciences, Peking University, Beijing 100871, China
2
Key Laboratory of Orogenic Belts and Crustal Evolution, Ministry of Education of China, Beijing 100871, China
3
Bayerisches Geoinstitut, University of Bayreuth, D95440 Bayreuth, Germany
4
State Key Laboratory of Geological Processes and Mineral Resources, China University of Geosciences, Wuhan 430074, China
*
Author to whom correspondence should be addressed.
Minerals 2020, 10(6), 499; https://doi.org/10.3390/min10060499
Submission received: 9 May 2020 / Revised: 26 May 2020 / Accepted: 28 May 2020 / Published: 30 May 2020

Abstract

:
Three batches of Mg2SiO4-ringwoodites (Mg-Rw) with different water contents (CH2O = ~1019(238), 5500(229) and 16,307(1219) ppm) were synthesized by using conventional high-P experimental techniques. Thirteen thin sections with different thicknesses (~14–113 μm) were prepared from them and examined for water-related IR peaks using unpolarized infrared spectra at ambient P-T conditions, leading to the observation of 15 IR peaks at ~3682, 3407, 3348, 3278, 3100, 2849, 2660, 2556, 2448, 1352, 1347, 1307, 1282, 1194 and 1186 cm−1. These IR peaks suggest multiple types of hydrogen defects in hydrous Mg-Rw. We have attributed the IR peaks at ~3680, 3650–3000 and 3000–2000 cm−1, respectively, to the hydrogen defects [VSi(OH)4], [VMg(OH)2MgSiSiMg] and [VMg(OH)2]. Combining these IR features with the chemical characteristics of hydrous Rw, we have revealed that the hydrogen defects [VMg(OH)2MgSiSiMg] are dominant in hydrous Rw at high P-T conditions, and the defects [VSi(OH)4] and [VMg(OH)2] play negligible roles. Extensive IR measurements were performed on seven thin sections annealed for several times at T of 200–600 °C and quickly quenched to room T. They display many significant variations, including an absorption enhancement of the peak at ~3680 cm−1, two new peaks occurring at ~3510 and 3461 cm−1, remarkable intensifications of the peaks at ~3405 and 3345 cm−1 and significant absorption reductions of the peaks at ~2500 cm−1. These phenomena imply significant hydrogen migration among different crystallographic sites and rearrangement of the O-H dipoles in hydrous Mg-Rw at high T. From the IR spectra obtained for hydrous Rw both unannealed and annealed at high T, we further infer that substantial amounts of cation disorder should be present in hydrous Rw at the P-T conditions of the mantle transition zone, as required by the formation of the hydrogen defects [VMg(OH)2MgSiSiMg]. The Mg-Si disorder may have very large effects on the physical and chemical properties of Rw, as exampled by its disproportional effects on the unit-cell volume and thermal expansivity.

1. Introduction

It has been widely accepted that ringwoodite (Rw; (Mg,Fe)2SiO4 with a molar Mg/(Mg + Fe) ratio close to ~0.9, crystallizing in the spinel structure), with a volume fraction up to ~60%, is the major phase of the lower part (~520–660 km depth) of the mantle transition zone (~410–660 km depth) [1,2,3,4]. The physical and chemical properties of Rw are therefore very important to unveil the structure, dynamics and evolution of the mantle transition zone. Unfortunately, a large number of variables, such as the chemical composition of Rw [5,6,7], the order-disorder state of its cations [8,9,10] and the incorporation mechanism and content of its water [11,12], can all affect these properties. As to water in Rw, experimental studies have not only indicated that Rw coexisting with a hydrous fluid/melt phase at the P-T conditions of the lower part of the mantle transition zone can host large amounts of water [13,14,15], but also demonstrated that water in Rw can strongly affect the phase relationship [16,17], the melting behavior [18,19], the thermal expansivity [20,21,22,23], the compressibility [15,24,25], the strength and rheology behavior [26,27,28], the seismic velocity [29,30,31], the electrical conductivity [32,33,34], the thermal conductivity [35,36], etc. Since field observation on the Rw inclusions in some diamonds with deep origin has demonstrated significant amounts of water in the Rw structure [37,38], a good understanding about the water incorporation mechanism and solubility bears on important geological implications.
A large number of experimental investigations and theoretical studies have been conducted to explore the issues relevant to the water incorporation mechanism and solubility in Rw, and much knowledge has been obtained [39,40,41,42]. Down the road of the experimental investigations, different techniques, such as single-crystal X-ray diffraction [22,23,43,44], neutron diffraction [45], Raman spectroscopy [46,47,48], infrared spectroscopy [12,49,50,51,52,53,54], 29Si NMR-CPMAS spectroscopy [55], proton-proton scattering [38], elastic recoil detection analysis [56] and secondary ion mass spectroscopy [11,14,57], have been employed. Among these experimental techniques, infrared spectroscopy plays a key role due to some special advantages. Firstly, infrared spectroscopy is extremely sensitive to trace amounts of water in materials [58,59]. Secondly, infrared spectroscopy has the capability of simultaneously detecting water content, water species and water incorporation mechanisms [60,61]. Thirdly, infrared spectrometer is relatively inexpensive, easily maintained, user-friendly and, consequently, commonly available in laboratories worldwide. Fourthly, infrared spectroscopy is a non-destructive microbeam method requiring just tiny samples, and is thus well suitable for small specimens generated in high-P experiments. No wonder that many infrared spectroscopic studies on different aspects of water in Rw synthesized at high P have been carried out.
With all the infrared spectroscopic studies, however, some basic infrared features about water in Rw still have discrepancies. The following are just a few examples. Firstly, the infrared peaks around ~2550 cm−1 have been assigned as in-plane X-OH bending modes in Bolfan-Casanova et al. [49], Chamorro Pérez et al. [51] and Bolfan-Casanova et al. [56], but as overtones of Si-O vibrations in Hofmeister and Mao [62], Koch-Müller and Rhede [57] and Thomas et al. [38]. Secondly, significant difference has been observed between the infrared spectra obtained from hydrous Rw crystals as generated by high-P experiments and those in-situ acquired from hydrous Rw crystals heated up to ~600 °C at ambient P [52]. In contrast, no obvious difference has been detected between the infrared spectra at room T and those in situ collected at T up to ~900 °C under a P of ~18.4 GPa [54]. Thirdly, the molar absorption coefficient for water in Rw has been calibrated for the infrared features in different spectroscopic ranges in different studies, from 4000 to 2500 cm−1 in Koch-Müller and Rhede [57], from 3900 to 2000 cm−1 in Thomas et al. [38] and from 3730 to 2000 cm−1 in Bolfan-Casanova et al. [56]. Thus, it has different values, with somewhat confusing applications.
Much of the controversy in the infrared features about water in Rw may have been caused by the following facts. Firstly, there are many possible crystallographic sites for incorporating water into Rw, resulting in many and severely overlapping infrared peaks [39,40,41,42]. Unfortunately, deconvoluting a sum infrared spectrum to derive the spectroscopic properties for individual infrared peaks is rarely unique, and the result is often inconclusive [63]. Secondly, different hydrogen defects in Rw may have very different light-absorbing capabilities [64], so that their infrared signals cannot be simultaneously unambiguously observed in any single infrared spectrum [65,66]. The relationship between the absorption (A) of one particular type of hydrogen defects in Rw, its concentration (COH) and the thickness of the crystal plate (D) can be described by the Beer-Lambert law:
A = ε × COH × D,
where ε is the molar absorption coefficient. Clearly, for the weakly light-absorbing water species (with small ε), its IR signals can be observed only at high water content or with very thick crystal plate. Under either condition, however, the IR signals of those strongly light-absorbing water species may be already oversaturated, and thus, hard to be correctly observed. This means that crystal plates with a range of appropriate thicknesses should be prepared and investigated in order to obtain a full appreciation of the infrared features of water in Rw. Thirdly, the water content in Rw is usually high and its infrared signals are exceedingly intense, so that crystal plates with thickness down to a few microns may be required for a good infrared spectroscopic observation [67]. This is certainly a hard task to accomplish, especially with those tiny crystals from high-P experiments.
To fully assess the infrared spectroscopic features of water in Rw, we have firstly carried out three high-P experiments to synthesize large Mg2SiO4-Rw (Mg-Rw) crystals with different amounts of water. The water contents have been determined as 1019(238), 5500(229) and 16,307(1219) ppm (more details presented later), and the crystals have been accordingly named as low-H2O Mg-Rw, intermediate-H2O Mg-Rw and high-H2O Mg-Rw, respectively. We have secondly performed systematic infrared spectroscopic analyses on (1) a series of thin sections prepared from the high-H2O Mg-Rw crystals, with the thickness ranging from ~14 to 64 μm, (2) a series of thin sections prepared from the low-H2O Mg-Rw crystals, with the thickness ranging from ~15 to 113 μm and (3) a series of thin sections prepared from the intemediate-H2O Mg-Rw crystals, with the thickness varying little (from ~52 to 69 μm). We have thirdly annealed at different T (~200–600 °C) for different durations, mainly those thin sections made from the intermediate-H2O Mg-Rw crystals, then quickly quenched them to room T and immediately characterized them using infrared spectroscopy. We have also examined these annealed thin sections using a micro-Raman system. With these data, we can fully appreciate the IR features of water in the Mg-Rw crystals, both as-received from conventional high-P synthesizing experiments and as further annealed to different T at 1 atm. It has been found that a large number of differences exist among the IR spectra obtained for hydrous Rw unannealed and annealed at high T. In addition, we have directly observed some of the IR features for the SiO4 structural units in the Mg-Rw, and derived a method for estimating the thickness of the Mg-Rw thin section.

2. Experimental and Analytical Methods

2.1. Synthesizing Mg-Rw Crystals at High P

Three synthesizing high-P experiments, Run 1584, Run 1589 and Run 4753, were conducted at the Bayerisches Geoinstitut, Germany. In these experiments, Pt capsule with starting material loaded was placed into an MgO sleeve, which was in turn placed into a LaCrO3 furnace surrounded by a ZrO2 thermal insulator. The standard 18/11 cell assembly at the Bayerisches Geoinstitut, with a Cr2O3-doped MgO octahedron as pressure medium, was used to generate high P. A W97Re3-W75Re25 thermocouple was used to measure and control the experimental T. The cell assembly was first compressed to a targeted P at ambient T by employing eight tungsten carbide cubes (truncated edge lengths of 11 mm), and then heated up to a targeted T with a rate of ~100 °C/min. After being maintained for a desired amount of heating time at the targeted T, the experiment was quenched to room T by cutting off the heating power and afterwards decompressed to ambient P over ~15 h.
Run 1584 was conducted under nominally dry condition, with a P of ~22 GPa, a T of 1700 °C and a heating time of 2 h. Its starting material was forsterite single crystals, mixed with some fine CsCl powder. With a direct phase transformation from forsterite to Mg-Rw, this experiment yielded very pure Mg-Rw crystals, with the grain sizes in the range of ~150–300 μm. The H2O content (CH2O) has been determined as ~1019(238) ppm by using unpolarized transmission infrared spectroscopy (more details later). The Mg-Rw crystals have been named as low-H2O Mg-Rw in this study.
Run 1589 was also carried out under nominally dry condition, with a P of ~22 GPa, a T of 1700 °C and a heating time of 2 h. Its starting material was forsterite powder, mixed with fine powders of potassium carbonate and magnesium carbonate. This experiment yielded very pure Mg-Rw crystals, with grain sizes in the range of ~150–300 μm. The CH2O has been determined as ~5500(229) ppm. The Mg-Rw crystals have been named as intermediate-H2O Mg-Rw in this study.
Run 4753 was run under wet condition, with a P of ~23 GPa, a T of 1500 °C and a heating time of 5 h. Its starting material was a mixture made of MgO, Mg(OH)2 and SiO2 powders (with an equivalent water content of ~15 wt%). This experiment produced one mega Mg-Rw crystal (up to ~1000 μm), some melt and a trace amount of MgSiO3-perovskite. The CH2O of the Mg-Rw crystal has been determined as ~16,307(1219) ppm. The Mg-Rw crystal has been named as high-H2O Mg-Rw in this study.

2.2. Preparing Single-Crystal Thin Sections

Clear and fracture-free Mg-Rw crystals from the high-P experimental products were handpicked under an optical microscope, and processed to generate nominally parallel-sided, stand-alone, doubly-polished single-crystal thin sections for later annealing experiments and IR measurements. We followed the general preparation procedure described in Liu et al. [66] and He et al. [68]. The Mg-Rw crystals were firstly mounted to glass slides with crystal-bond by using a hot plate running at ~145 °C, secondly manually ground and slowly reduced under an optical microscope to the desired thicknesses by using a series of silicon carbide abrasive sandpaper and thirdly polished well to generate scratch-free surfaces. The resulting thin sections were then immersed in acetone for 15 min to remove the crystal-bond, washed repeatedly in anhydrous ethanol and deionized water and dried in a drying oven at 110 °C.
The relatively small crystal size of the Mg-Rw presented an obstacle for the preparation of really parallel thin sections and usually led to wedged crystal plates. The thickness of the crystal plates was consequently estimated with two methods: one was a direct thickness measurement by using a micrometer (termed as Dm hereafter) and the other was an indirect thickness calculation by using the integrated IR absorption in the range of ~1850–1500 cm−1. The IR peaks in this wavenumber range are the combination bands/overtones of the SiO4 structure units [62], and the absorption can be used to accurately constrain the thickness of the sample precisely at the analyzing spot (discussed further below). In rare cases, interference fringes occurred in the IR spectra acquired from truly parallel thin sections; the thickness could be determined with a third method, as detailed later.

2.3. Annealing Single-Crystal Thin Sections at 1 atm

All thin sections prepared from the intermediate-H2O Mg-Rw crystals, plus one made from a low-H2O Mg-Rw crystal, were annealed at various T for various amounts of time by using a heating platform (Model DB-C600 with a heating capability up to ~650 °C). The annealing T varied from 200 to 600 °C. Each thin section was placed in a small thin-walled Pt boat (10 × 10 × 5 mm3 in size), which was in turn positioned at the hot spot of the heating platform. The uncertainty of the annealing T was presumably less than ~5 degrees. After annealed for a desired amount of time, the Pt boat was quickly removed from the heating platform, placed on a large piece of stainless steel plate, and cooled to room T in open air. The whole process might take less than ~10 s. The annealed thin section was then picked up under an optical microscope, transported and analyzed by an IR spectrometer. After finishing the IR analyses, the thin section was reannealed and reanalyzed. This experimental procedure might be repeated for several times.

2.4. Unpolarized Transmission IR Measurements

The single-crystal thin sections, without or with certain annealing at certain T and 1 atm, were placed on a clean BaF2 sample holder and subsequently probed at ambient P-T conditions by using a Nicolet iN10 MX IR Microscope installed at the High-Pressure Laboratory of Peking University [65,66]. Unpolarized transmission IR spectra were collected for the data range of 4000–675 cm−1. In these measurements, we used a high-energy Ever-Glo™ infrared source, a standard KBr beam splitter and an MCT detector that was cooled by liquid N2. We chose an aperture size of 40 × 40 μm2. We performed 512 scans in every individual analysis and set the spectroscopic resolution as 4 cm−1, both for the background and for the sample. The IR spectra were processed either by using the OMNIC 8.2 software or by using the Peakfit v4.12 software.

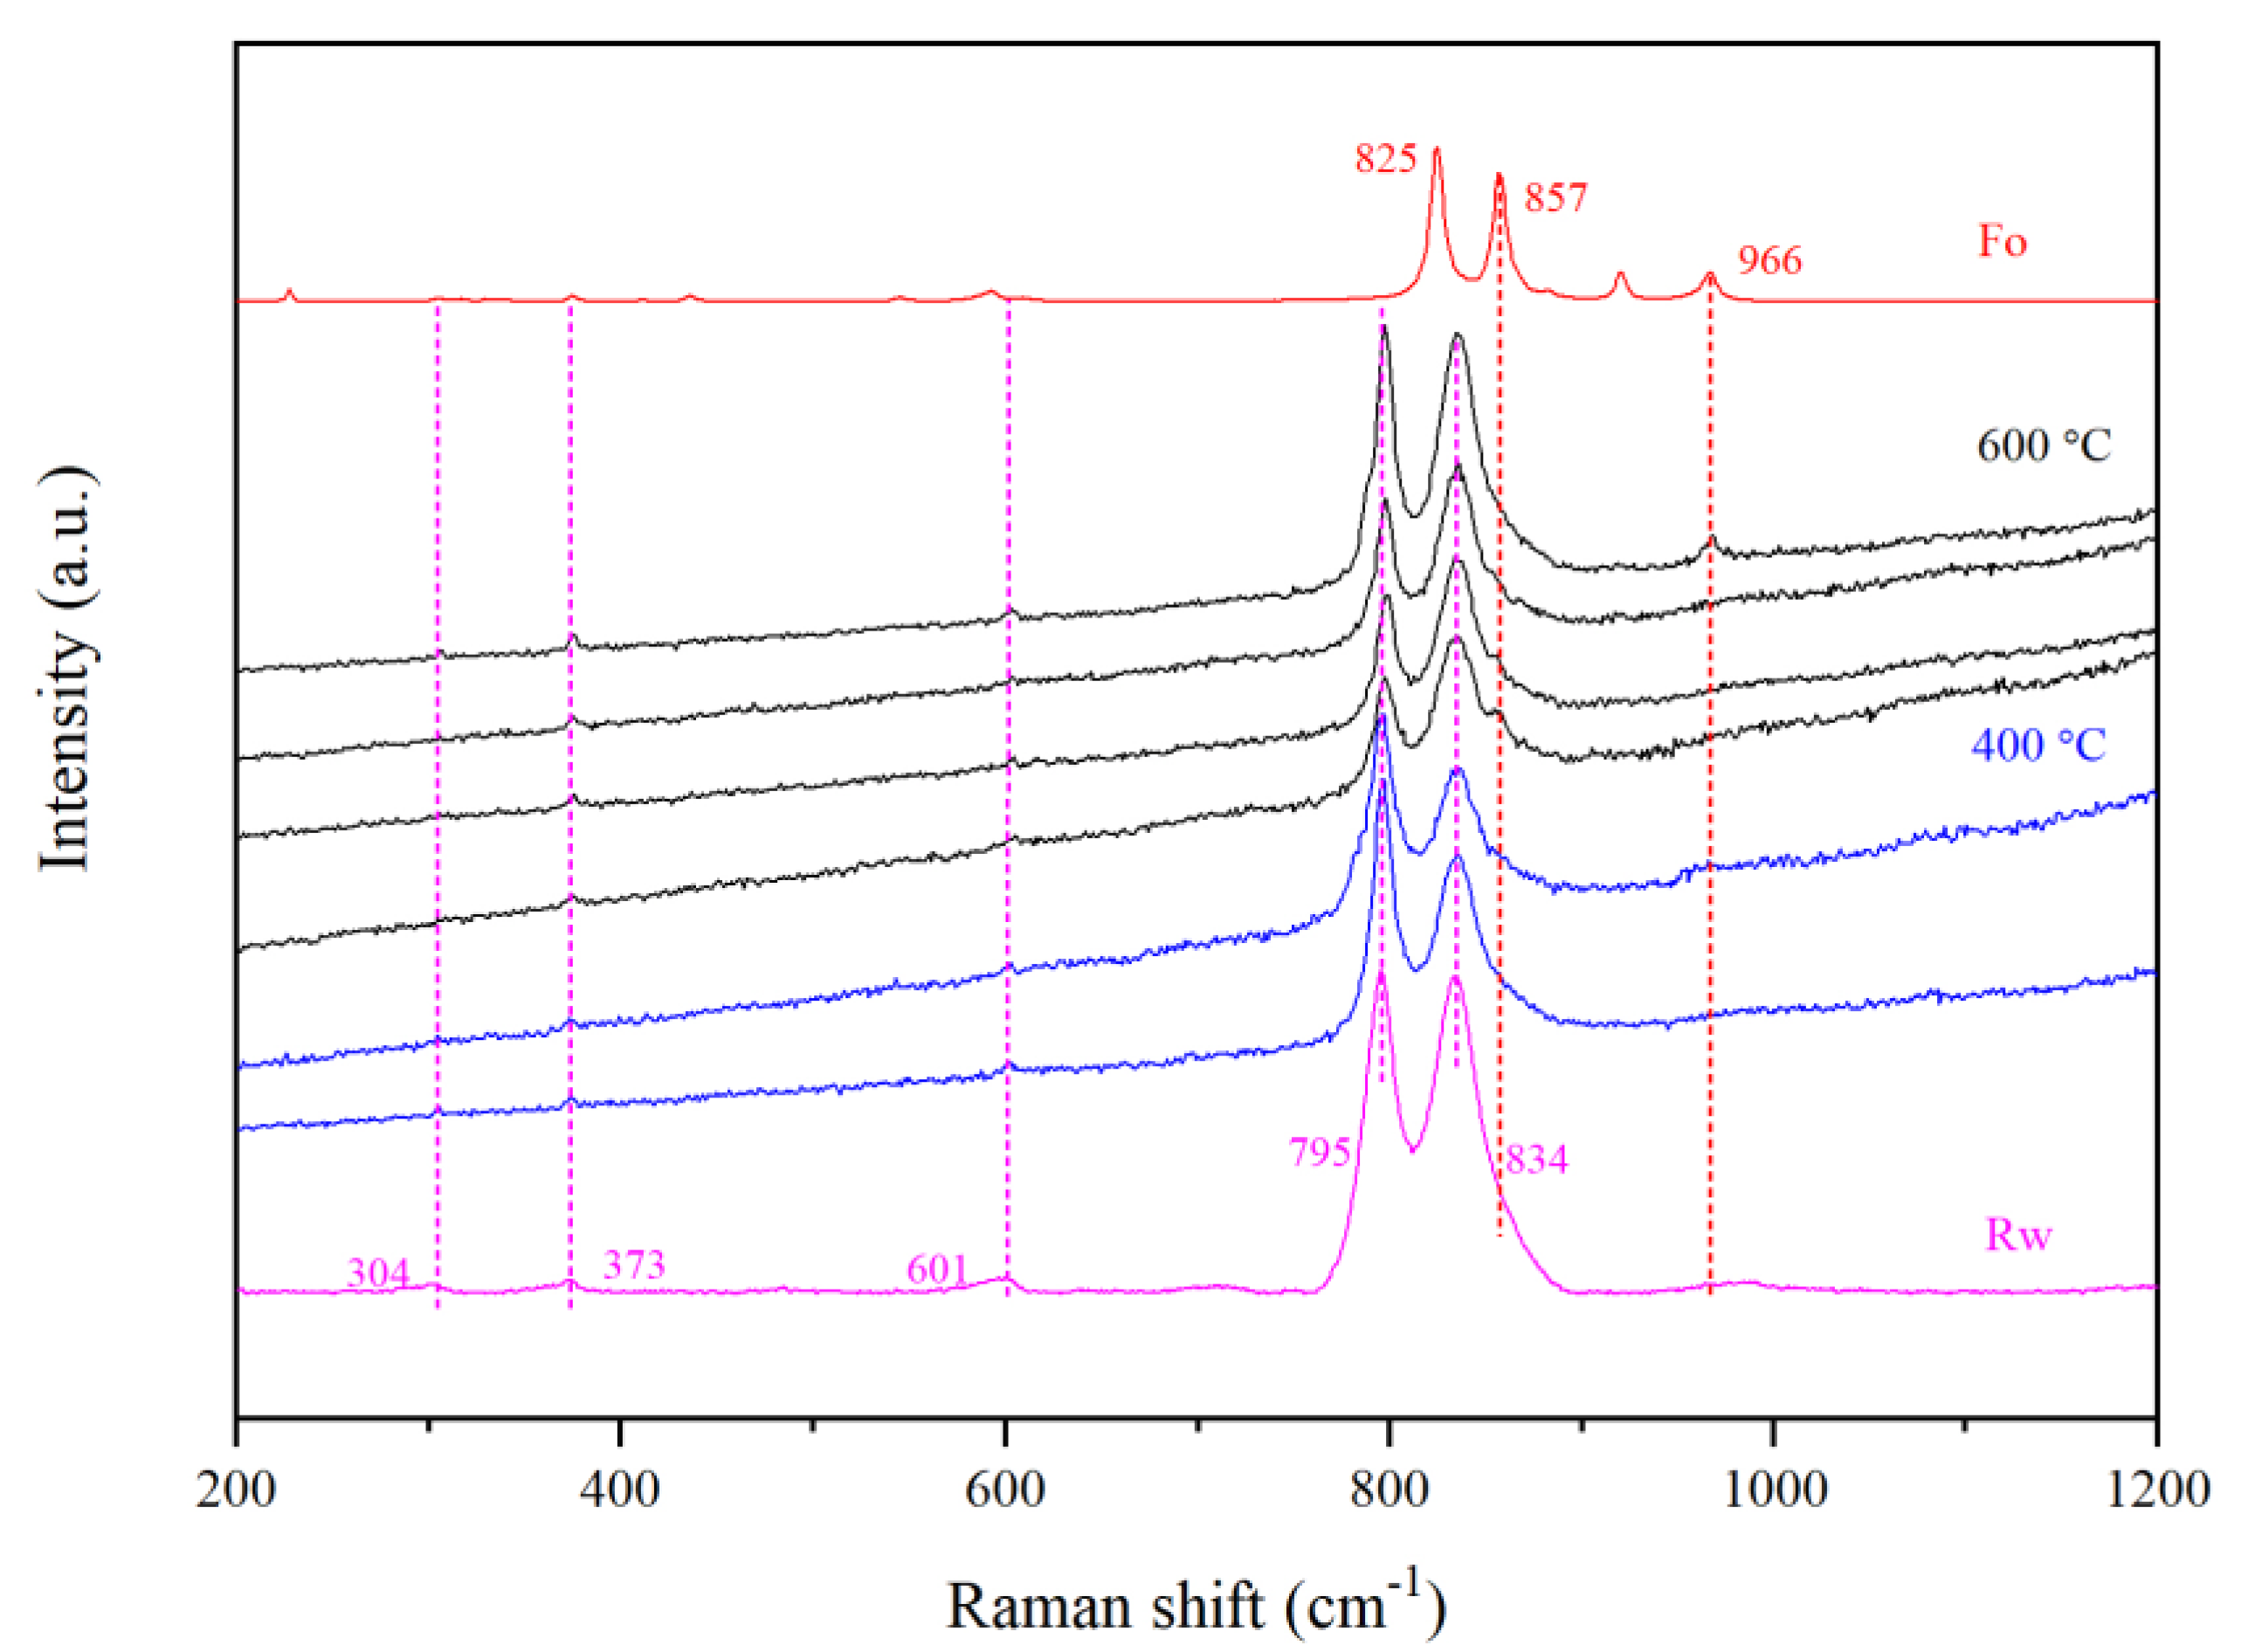
2.5. Unpolarized Raman Spectroscopic Characterizations

After completing the IR analyses, some annealed Mg-Rw thin sections were characterized at ambient P-T conditions by using a confocal micro-Raman system in a back-scattering geometry (Renishaw inVia Reflex system) [10,69]. Unpolarized Raman spectrum was collected from 1350 to 100 cm−1. A 532 nm laser with an emission power of ~50 mW and a 50× long-distance objective were used in all analyses. Other analytical conditions were ~1 μm light spot, 1 cm−1 spectral resolution and 20 successive scans for every analysis (10 s for each scan).

2.6. Quantifying Water Content of Mg-Rw

Rw is an optically isotropic mineral. Its water content can be quantified by using the following equation, which is merely another form of the Beer-Lambert law:
C H 2 O = 1.8 × A t o t d × ρ × ε t o t × 10 4 ,
where C H 2 O is the concentration of H2O in weight (ppm), Atot is the total integrated absorption, which is calculated as three times the integrated absorption (cm−1) in an unpolarized IR spectrum, d is the thickness of the crystal thin section (cm), ρ is the Rw density (g/cm3) and ε t o t is the total integrated molar absorption coefficient (L·mol−1·cm−2). For quantifying the water contents of our Mg-Rw, we used ρ = 3.527 g/cm3 from Ye et al. (for the Mg-Rw with ~0.76 wt% H2O) [23], and ε t o t = 118,500(5000) L·mol−1·cm−2 from Bolfan-Casanova et al. [56]. We integrated the unpolarized IR spectrum in the energy range 3730–2000 cm−1 to derive the integrated absorption, which was in turn multiplied by 3 to obtain the total integrated absorption [56]. Eventually, we have obtained 1019(238), 5500(229) and 16,307(1219) ppm H2O for the Mg-Rw crystals from Run 1584, Run 1589 and Run 4753, respectively.

3. Results and Discussions

The details and results of the ambient unpolarized IR measurements performed on the thin sections prepared from the Mg-Rw crystals, as generated from our conventional high-P experiments, are listed in Table 1. The details and results of the ambient unpolarized IR measurements performed on those successively annealed and quickly quenched Mg-Rw thin sections are listed in Table 2. The infrared spectrum has been numbered as Run #-Crystal #-Spectrum # (e.g., 1584-01-01 in Table 1), with the first term representing a high-P experiment (Run 1584 here), the second term representing a thin section made from an Mg-Rw crystal from that experiment (01 here) and the third term representing an infrared spectrum taken from that thin section (01 here). In total, 13 thin sections were prepared and 56 infrared spectra were collected. In most cases, multiple infrared spectra were taken at different spots of one thin section, annealed or unannealed (Table 1 and Table 2). The IR features for water in the Mg-Rw demonstrated by these ambient IR spectra are summarized and compared in Table 3.

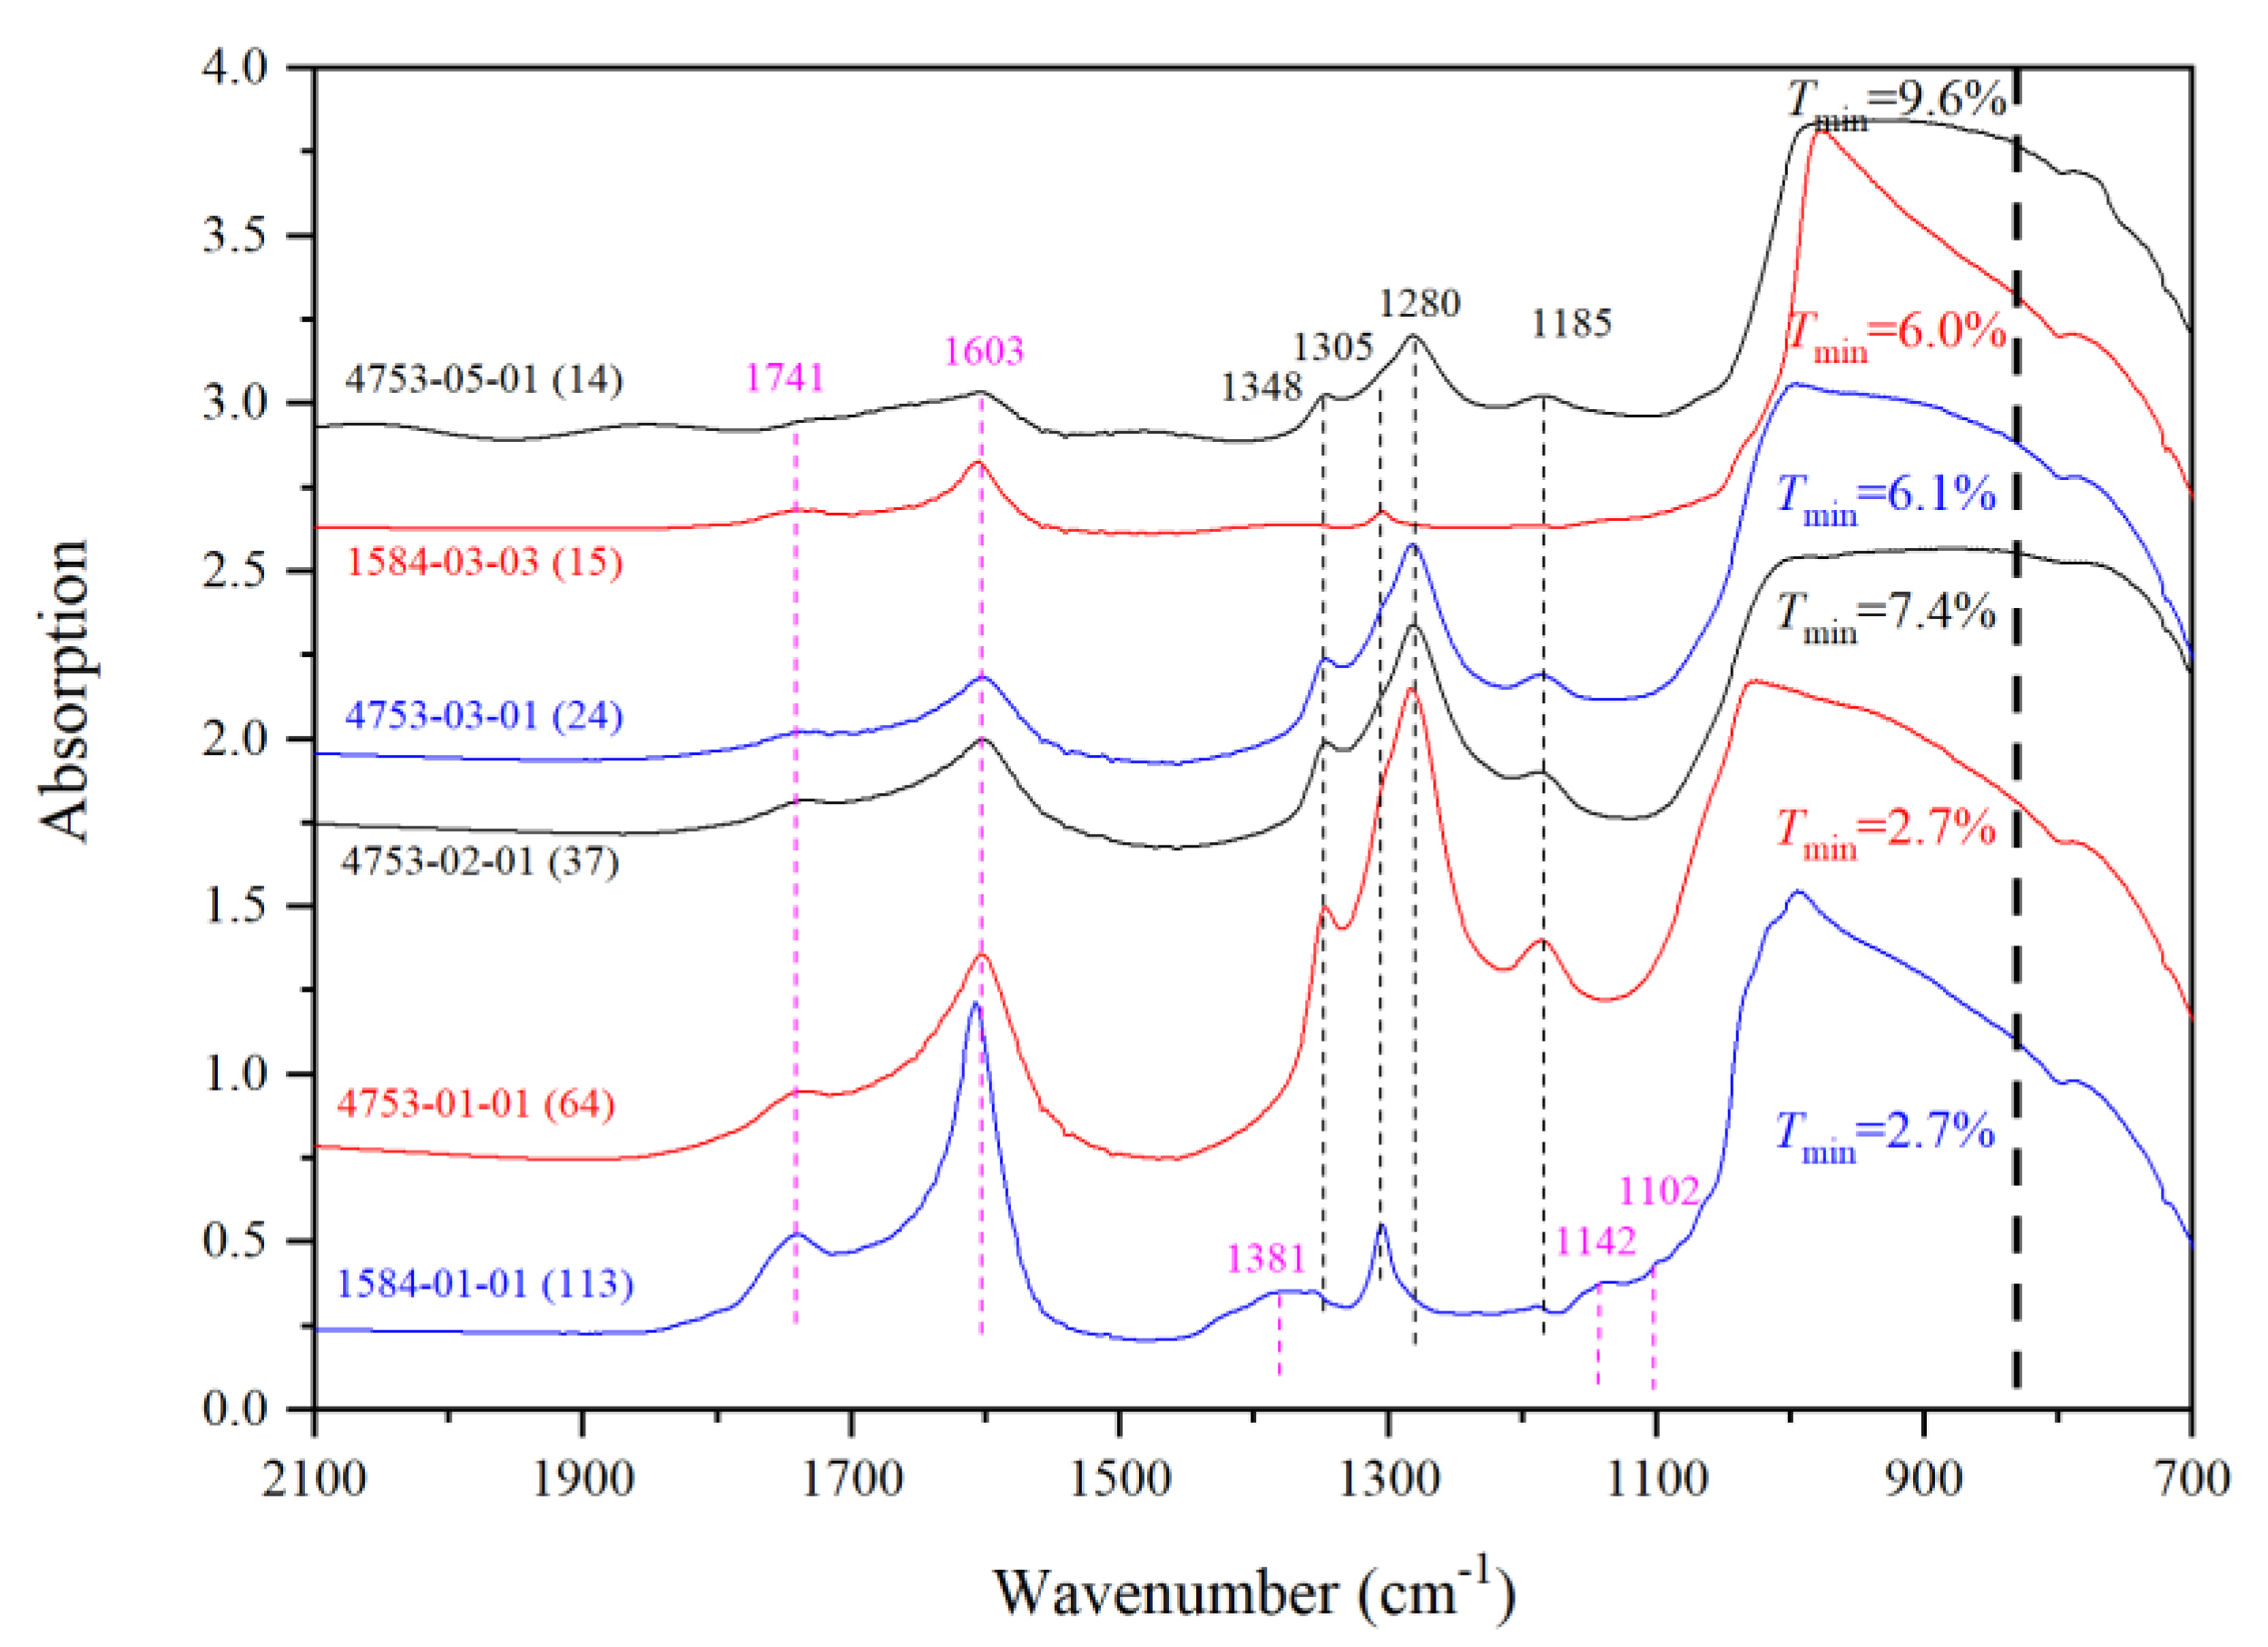
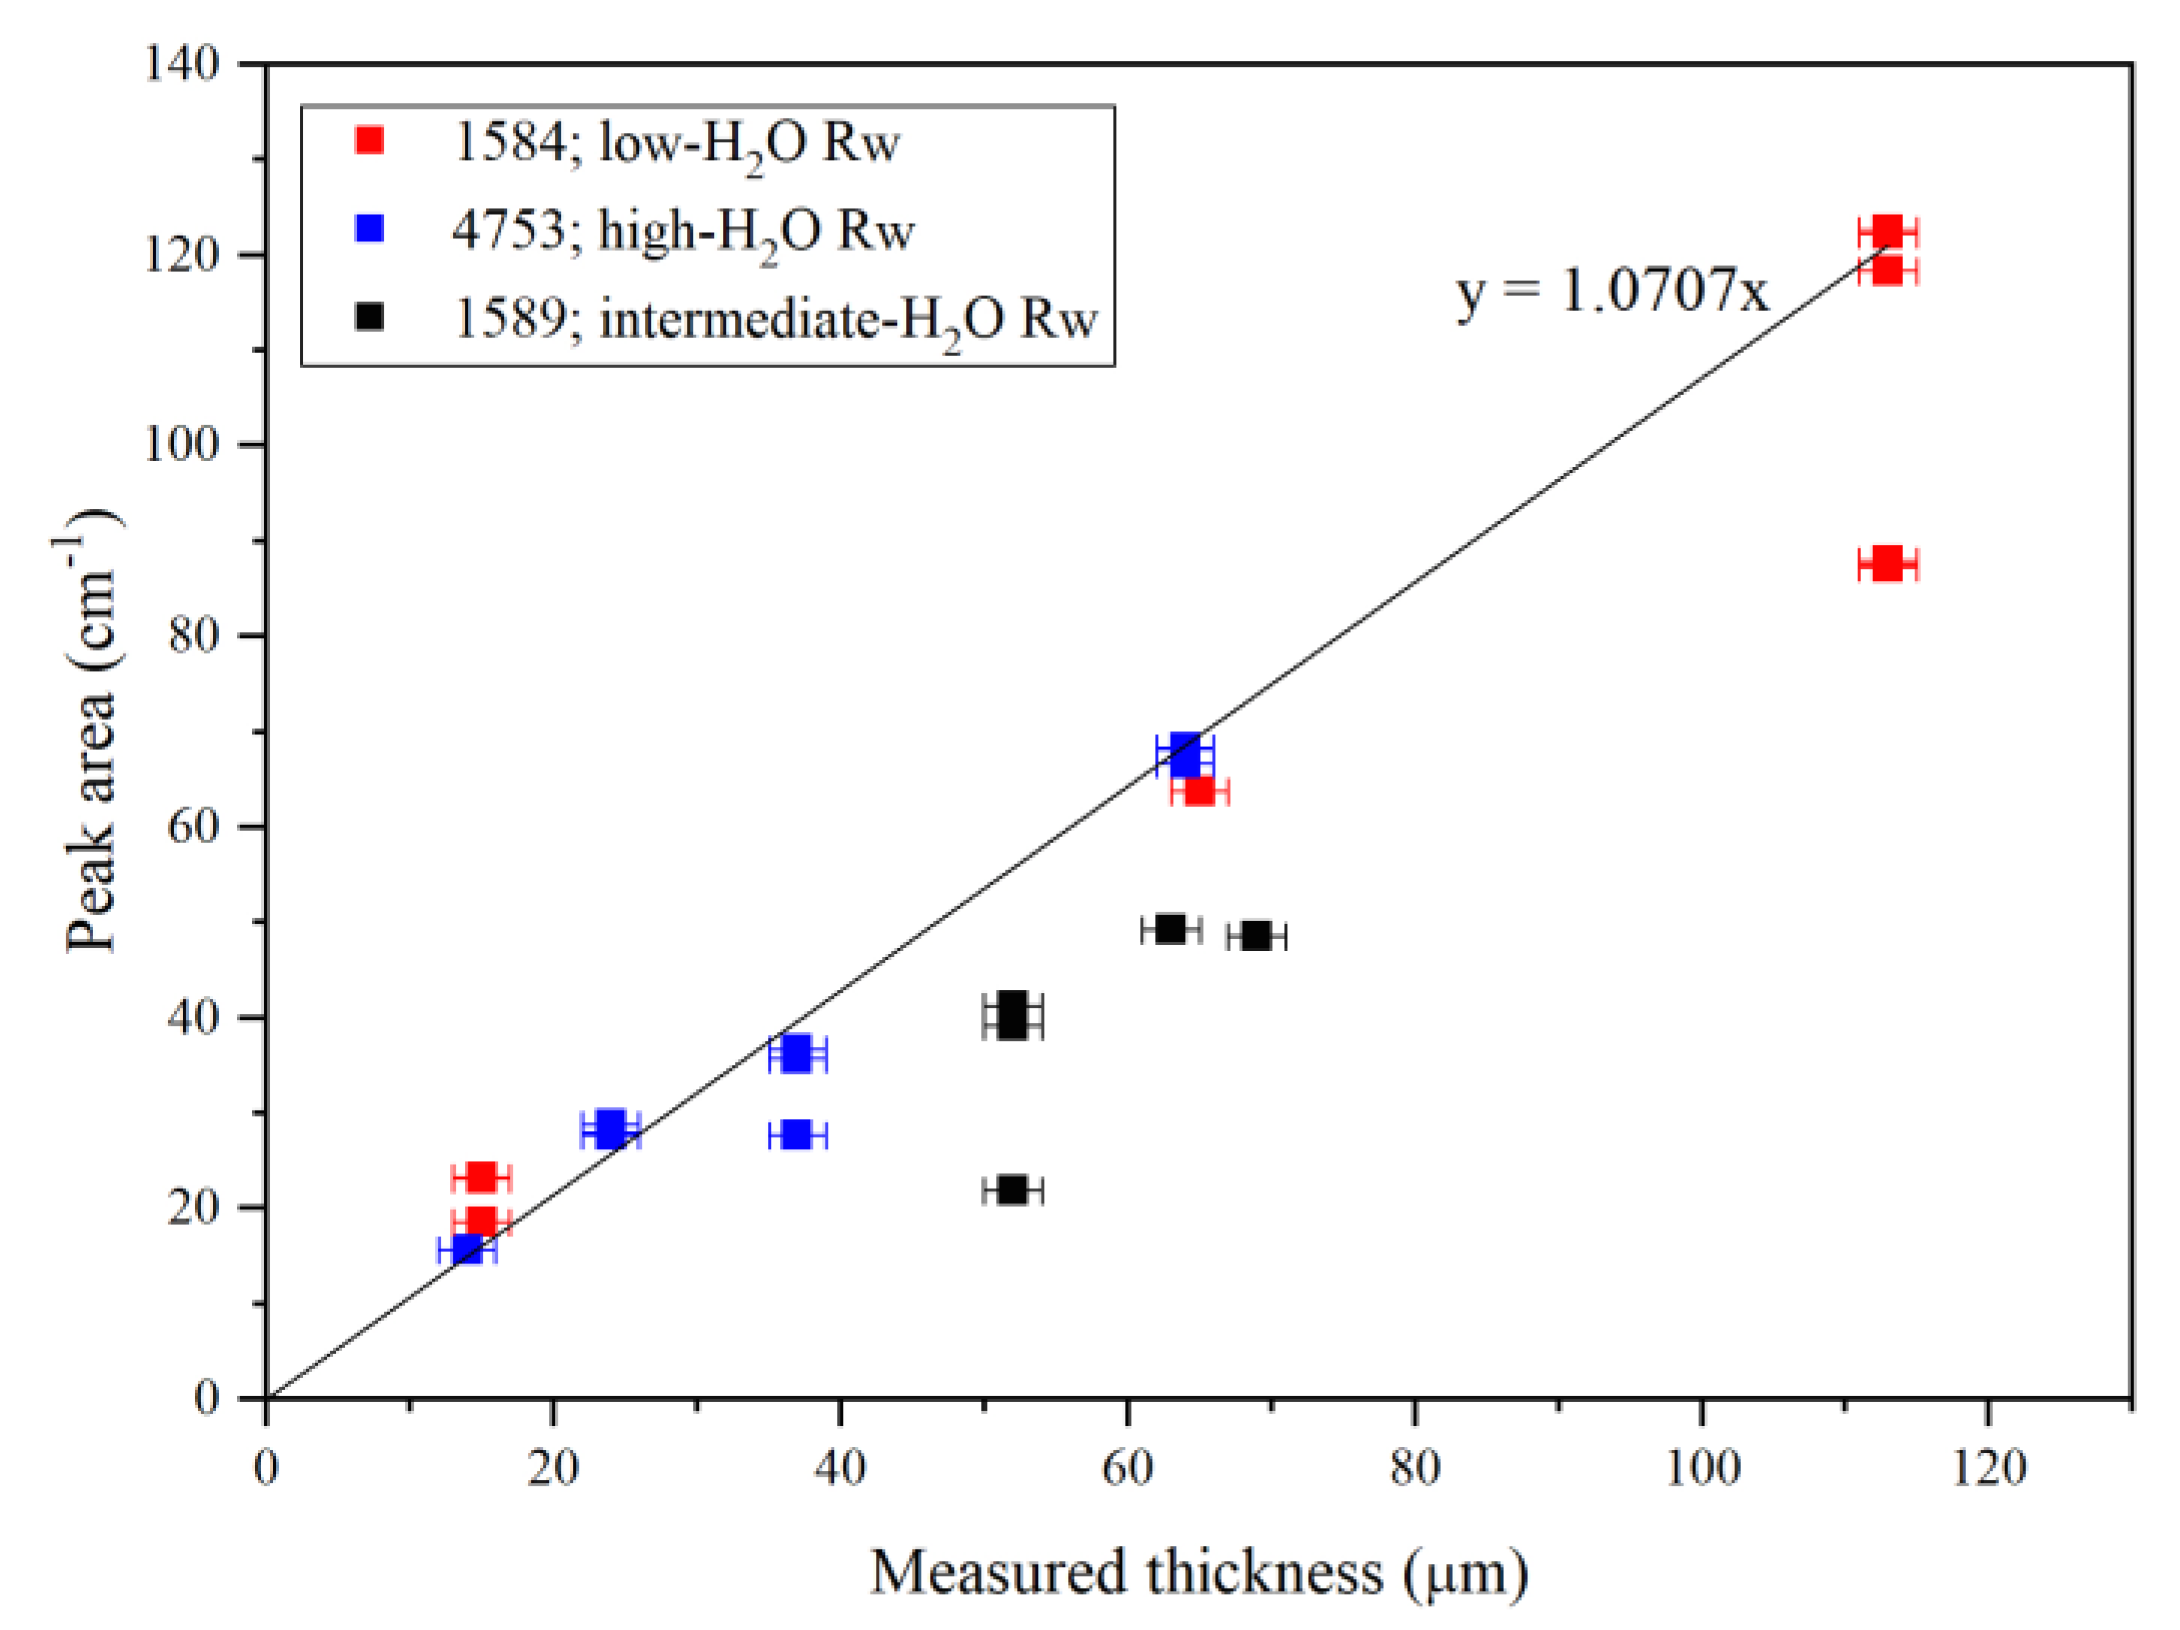
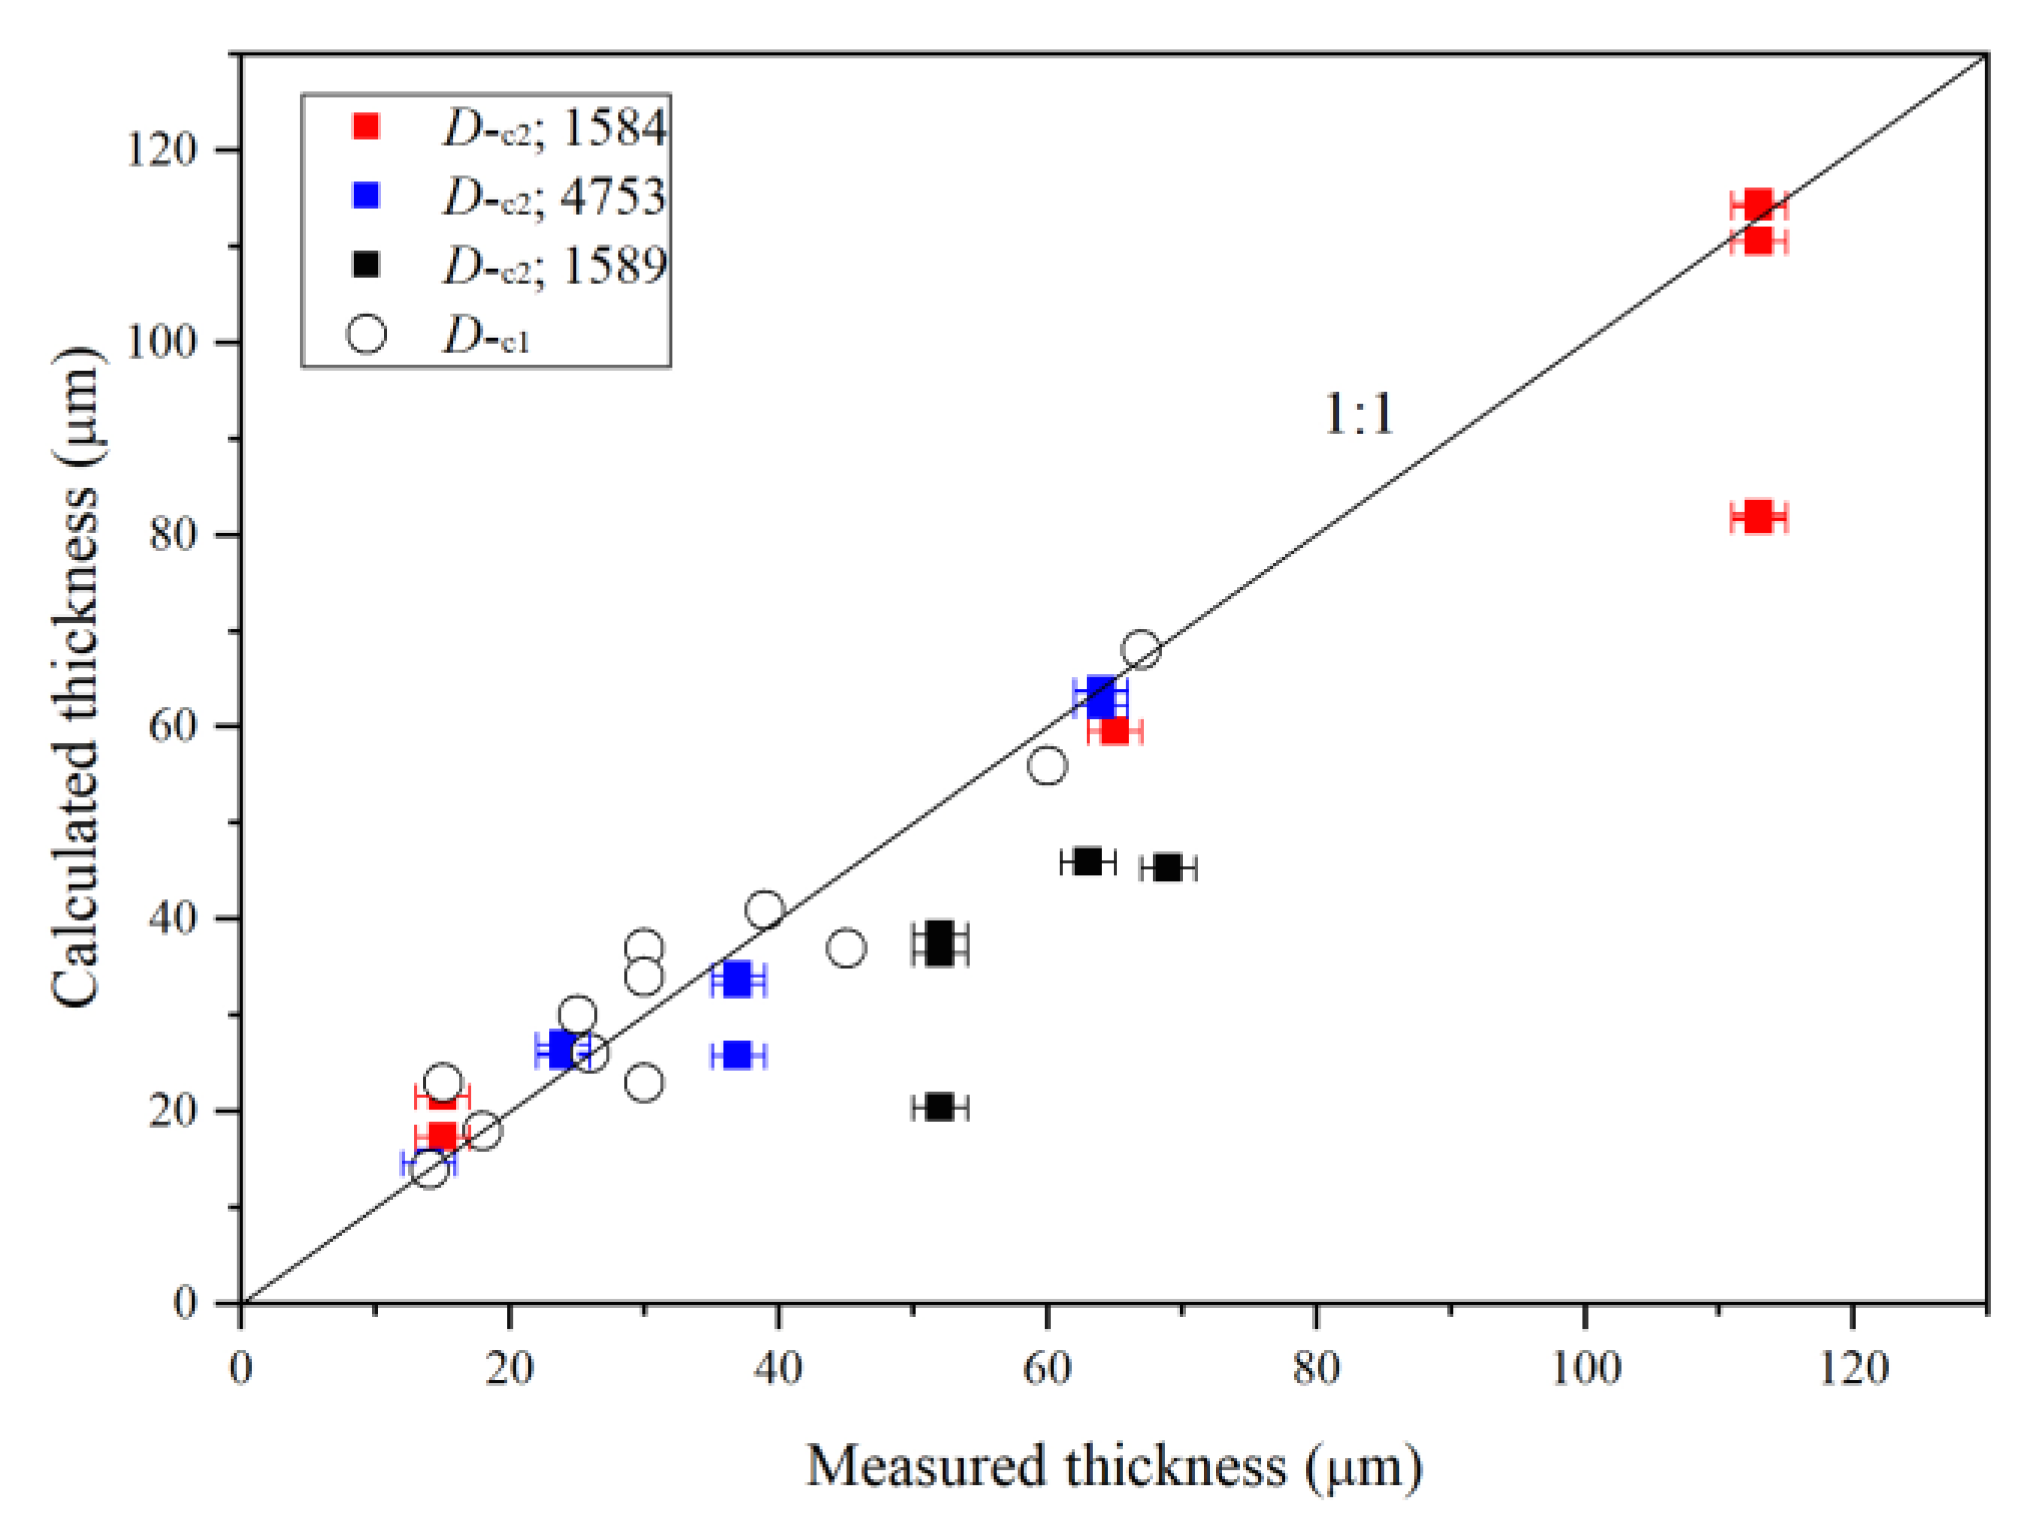
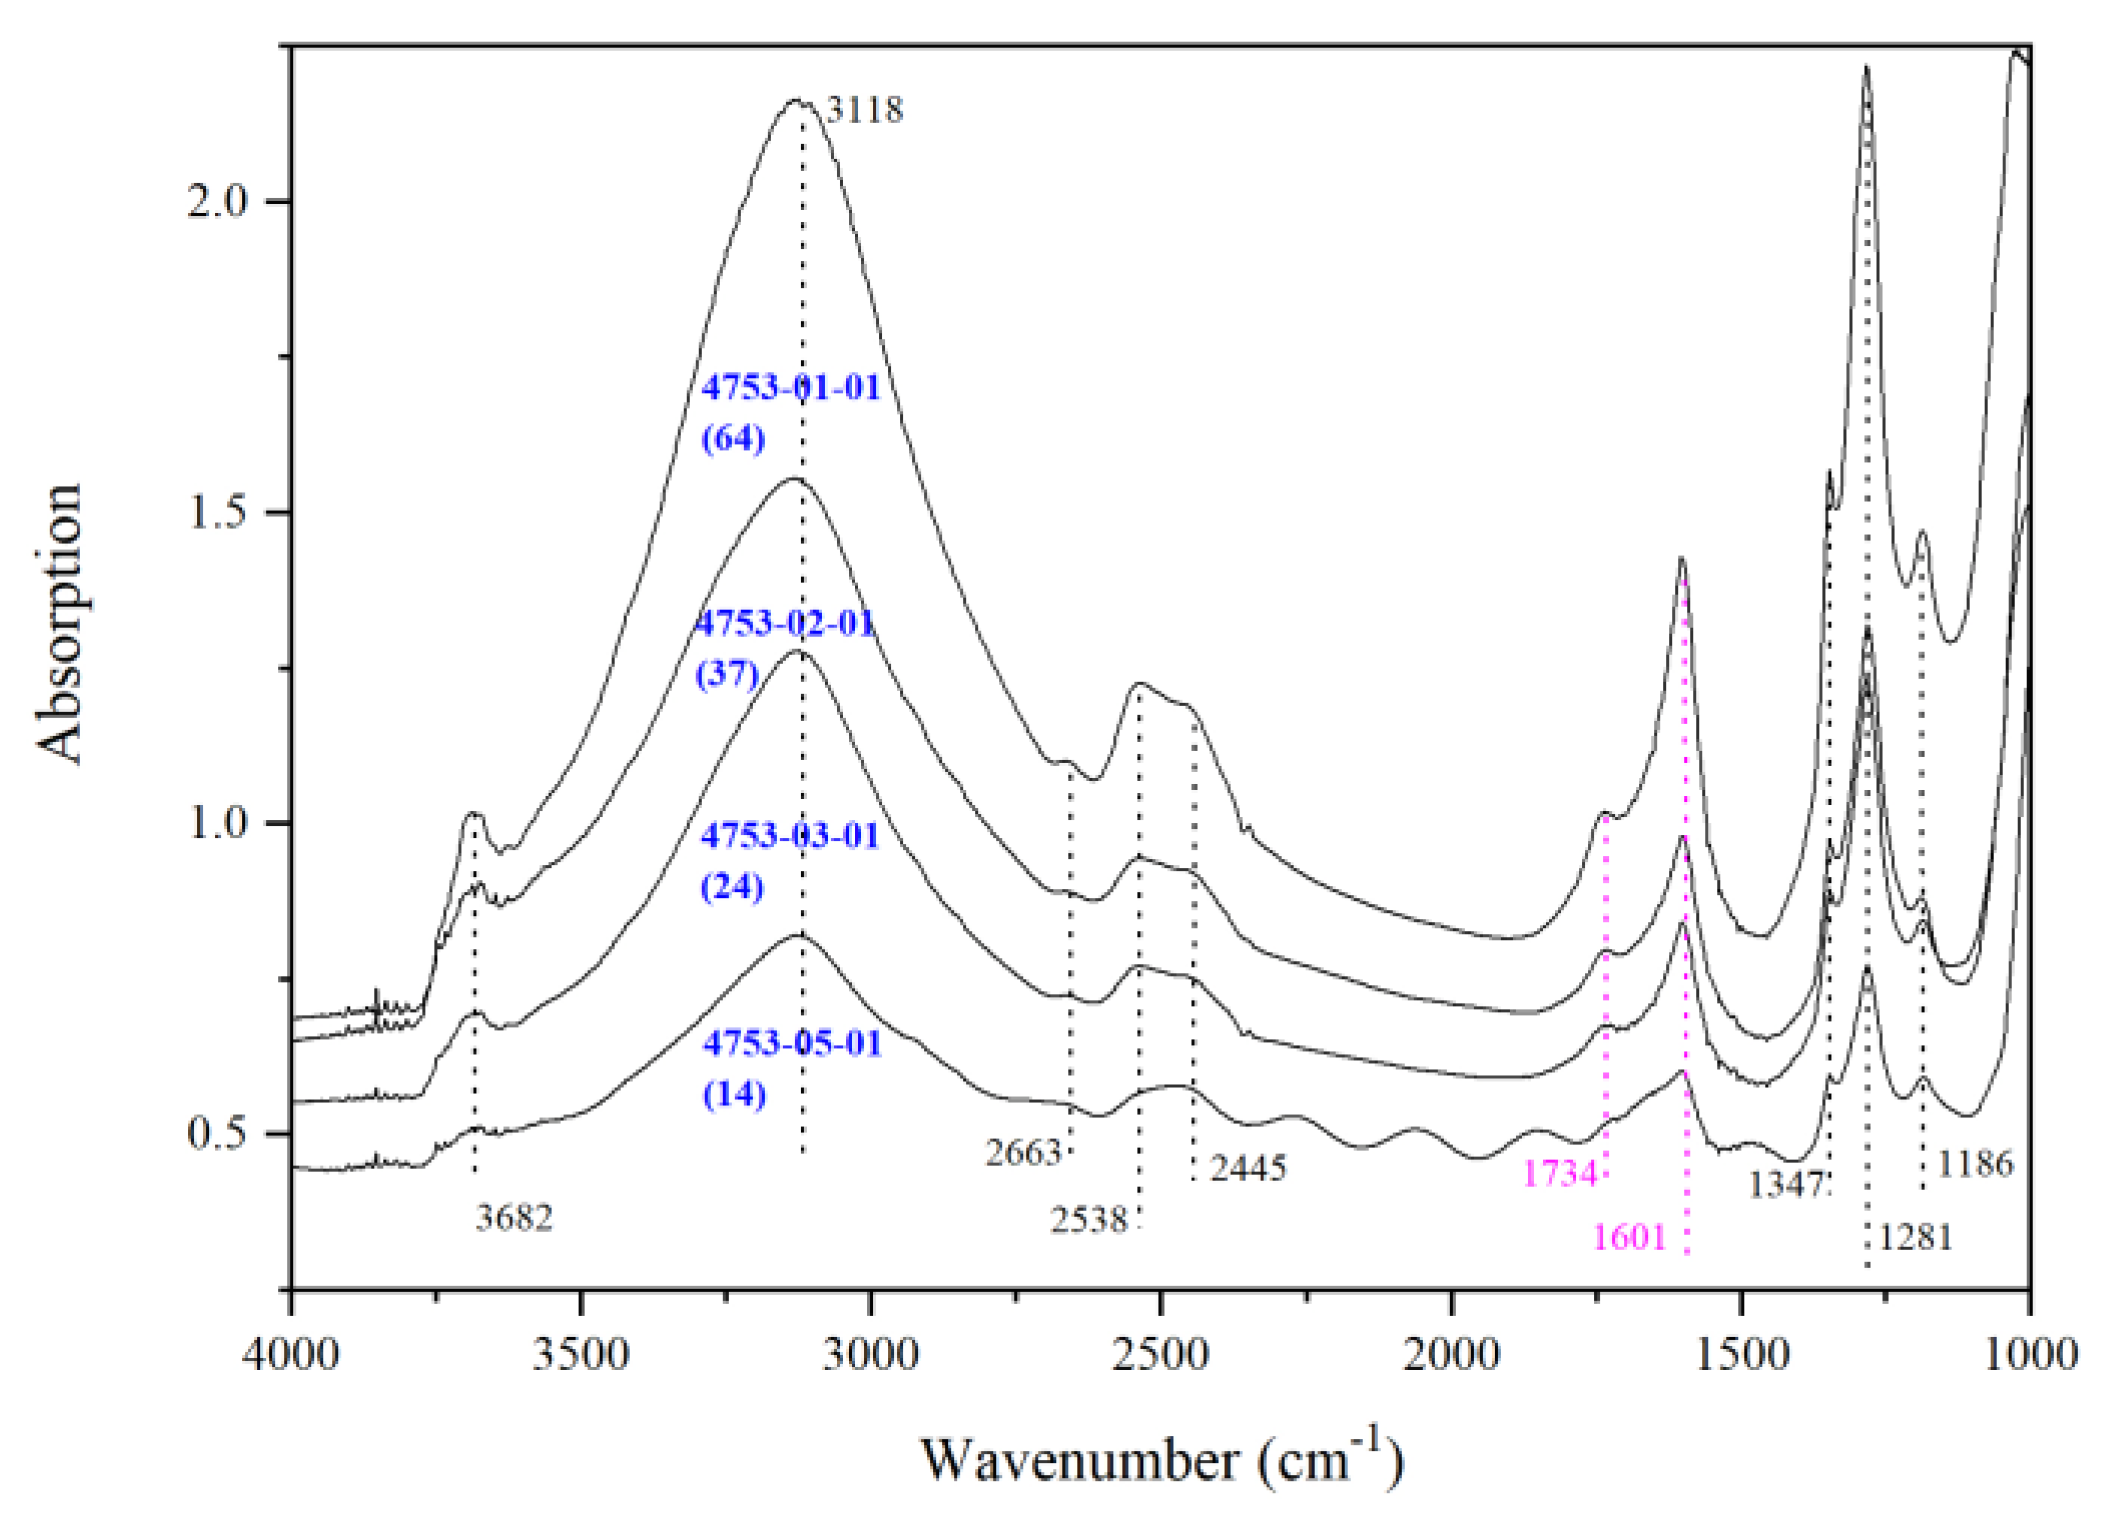
3.1. Fundamentals, Combinations/Overtones, Thickness Estimates and Water Quantifications

Figure 1 shows some IR spectra (~2100–700 cm−1) taking from some thin sections with various thicknesses made from some high-H2O and low-H2O Mg-Rw crystals. The independent variables there are the thickness and the H2O content. We have arranged the spectra according to the measured thickness, with Dm increasing from the top spectrum (~14 μm) to the bottom spectrum (~113 μm), so that we could readily observe positive correlations between the thicknesses and the absorptions for those IR peaks unrelated to the hydrogen defects. For those IR peaks relevant to the hydrogen defects, any such correlations should be generally masked by the fluctuation of the water content.
The spectra shown in Figure 1 can be roughly divided into three segments, segment ~1850–1500 cm−1, segment ~1500–1150 cm−1 and segment ~1150–700 cm−1. In segment ~1850–1500 cm−1, there are likely two IR peaks at ~1741 and 1603 cm−1, with their intensities generally positively correlating with the thickness of the thin sections. They are the combination bands/overtones of the SiO4 structure units in Mg-Rw, as suggested by Bolfan-Casanova et al. [49] and Chamorro Pérez et al. [51]. In the segment ~1500–1150 cm−1, there are at least four IR peaks at ~1348, 1305, 1280 and 1185 cm−1 (more discussion later), with their intensities erratically correlating with the thickness. Hence, we attribute them to the hydrogen defects in Mg-Rw, as suggested by Bolfan-Casanova et al. [49] and Chamorro Pérez et al. [51]. In the segment ~1150–700 cm−1, there are potentially many IR peaks with different origins [62]. For the purpose of convenience, we choose to loosely and collectively name them as the fundamentals of the SiO4 structure units in Mg-Rw, although only one fundamental should be expected in this wavenumber range [41,71].
The fundamentals in the segment ~1150–700 cm−1 seem poorly resolved still. Similar to quartz [68], coesite [66] and olivine [65], these vibrational modes in Mg-Rw are very light-absorbing, so that the infrared light has been completely blocked for any thin section with thickness > ~40 μm (Figure 1). For the thicker thin sections, the minimum percentage of the transmitted light (Tmin) is constantly ~2%–3%, which is definitely an artifact, as discussed by He et al. [68]. When the thickness of the thin sections becomes smaller, the Tmin starts to increase, and the true absorption peaks start to emerge and overall change from a nominally round IR feature to an absorption platform (generally wider than ~200 wavenumbers). From the high-H2O Mg-Rw thin sections, the maximum Tmin observed is ~9.6% (4753-05-01; Dm = 14 μm). We believe that this IR spectrum is generally reliable, on the basis of the consistent appearance of the absorption platform in the IR spectra acquired from the thin sections with Dm < ~40 μm. In contrast, the IR spectra from the low-H2O Mg-Rw are rather different, in terms of the shape of the absorption feature and the Tmin. For example, the spectrum 1584-03-03 collected from the low-H2O Mg-Rw thin section with Dm = 15 μm seems much comparable to the IR spectrum 1584-01-01 from the low-H2O Mg-Rw thin section with Dm = 113 μm, rather than similar to the IR spectrum 4753-05-01 from the high-H2O Mg-Rw thin section with Dm = 14 μm (Figure 1). This strongly implies that the H2O content in Mg-Rw has important influence on the fundamentals. The Mg-Rw crystals from Run 1584 have a much lower H2O content than those from Run 4753 (1019(238) vs. 16,307(1219) ppm), so that their hydrogarnet substitution, Si4+ + 4O2− ↔ [4]□(Si) + 4OH should be much lower [39,40,41,42,45], and their SiO4 structure units causing the absorption features in the segment ~1150–700 cm−1 are correspondingly more abundant.
The fundamentals in the segment ~1150–700 cm−1 were previously investigated by a few studies. Akaogi et al. [72] carried out an IR study using a nominally H2O-free Mg-Rw powder sample admixed with some KBr (Rw:KBr = 3:250 in weight). However, they did not report the experimental details such as the particle size of the Mg-Rw and the thickness of the probed KBr disc, so that the amount of the Mg-Rw probed by the IR beam was unknown. Hofmeister and Mao [62] collected some absorption data from a nominally H2O-free Mg-Rw single-crystal sample, and observed a severe peak intensity saturation (as shown in their Figure 7). The thickness of their crystal plate was not reported, but has been calculated here as ~146 μm using the interference fringes around ~1100 cm−1. The used equation in the calculation is:
Dc1 = 1/(2 × n × ν),
where Dc1 is the calculated thickness (cm) of the thin section, n the refractive index of Rw (1.708 for nominally anhydrous Mg-Rw; Binns [73]; Inoue et al. [14]) and ν the wavelength (cm−1) of the interference fringes. Both Akaogi et al. [72] and Hofmeister and Mao [62] reported a round IR feature in the energy range ~1150–700 cm−1, which is very similar to what we have observed with our thick thin sections. The results are, thus, highly questionable. Furthermore, Chamorro Pérez et al. [51] and Koch-Müller et al. [74], respectively, investigated the IR features of water-rich Mg-Rw (~1.0–1.7 wt% H2O) and water-poor Rw (<~0.61 wt% H2O) up to ~30 GPa, and reported some high-P data for the fundamentals in the corresponding energy range ~1150–700 cm−1 at ambient P. The initial thickness of the sample (with 1.7 wt% H2O) in Load 1 of Chamorro Pérez et al. [51] was just 26 μm, and the observed IR feature at all P was an absorption platform with a width > ~200 wavenumbers, which is similar to what we have observed from the high-H2O Mg-Rw thin sections with Dm < ~40 μm. The exact thickness of the samples in Koch-Müller et al. [74] was not released. Luckily enough, some of the reported IR spectra display interference fringes around ~1500 cm−1, which can be used to estimate the sample thickness by resorting to Equation (3). For the two series of compression experiments with the MA-120 Rw (0.6 wt% H2O), respectively in an annealed argon pressure medium and in an unannealed argon pressure medium, our estimated sample thickness is ~41 μm at 0.1 GPa and ~34 μm at 13.3 GPa for the former, and ~27.5 μm at 0.2 GPa, 26.7 μm at 12 GPa and 25.0 μm at 31.7 GPa for the latter. All the observed IR features did not show broad absorption platforms, similar to our observations made either with the thick thin sections (Dm > ~40 μm) prepared from the high-H2O Mg-Rw or with the thin sections (Dm ≥ ~15 μm) prepared from the low-H2O Mg-Rw. It follows that the fundamentals in the energy range ~1150–700 cm−1 are generally known for water-rich Mg-Rw, but still unclear for dry or water-poor Mg-Rw.
To quantify the H2O contents in our Mg-Rw, accurate thickness estimation is critical. The common absence of interference fringes in the IR spectra both in the literature and in this study suggests that thin sections prepared from tiny crystals tend to be wedged to some extent. As a result, any direct thickness measurement with a micrometer should often yield a maximum value for the entire thin section, which may be significantly larger than the exact sample thickness at the analyzing spot of the IR beam. It is then desirable to develop a method which can be used to calculate the sample thickness directly from an IR spectrum. Apparently, the Mg-Rw IR features in the segment ~1850–1500 cm−1 (Figure 1) can fulfill this duty. Figure 2 plots the integrated absorption data against the measured thickness data for our thin sections (Table 1). Assuming that the six IR spectra, from 1584-01-01 to 1584-01-06, have well sampled our thickest Mg-Rw thin section (Dm = 113 μm), and collecting the data with the highest absorption among them (i.e., the maximum sample thickness and the highest absorption) to the origin (i.e., 0 sample and 0 absorption), we arrive at the following equation:
A = 1.0707 × Dc2
where A is in cm−1 and Dc2 is in μm. Theoretically, Equation (4) is equal to Equation (1), with the constant 1.0707 approximating εSiO4 × CSiO4. Our assumption is obviously justified because nearly all data, with only a few exceptions at very small thin section thickness, are plotted to the right of the straight line dictated by Equation (4), matching the expectation that Dm should be often larger than Dc2. Furthermore, Equation (4) seems applicable to Mg-Rw with different amounts of H2O, since Figure 2 displays no apparent correlation between the deviation of the experimental data from the straight line and the H2O content. Even more, Equation (4) should be largely applicable to Rw with different amounts of iron, since the IR features in the segment ~1850–1500 cm−1 are directly related to the SiO4 structure units only.
The accuracy of Equation (4) has been independently verified, as shown in Figure 3. Our IR spectra 4753-05-01, taken from a thin section with Dm = 14 μm, and 1584-03-01, obtained from a thin section with Dm = 15 μm, display the IR features in the segment ~1850–1500 cm−1 and some interference fringes around ~2150 cm−1 (shown later), so that both Equation (3) and Equation (4) can be simultaneously applied to them. In both cases, we have obtained essentially identical results, Dc1 = 14.0 μm and Dc2 = 14.6 μm for the former, and Dc1 = 22.5 μm and Dc2 = 21.6 μm for the latter. Equation (3) is a well-known and standard formula for calculating the thickness of parallel thin sections [75,76], a point that can also be illustrated by the data of Rw with different H2O and Fe contents, as summarized in Figure 3. Consequently, Equation (4) should have a wide application, both to parallel thin sections and to wedged thin sections, and its verification is thus very meaningful.
The H2O contents of the Mg-Rw crystals calculated with the Dc2 values are compared to those calculated with the Dm values in Figure 4. As expected, the former are much less scattered than the latter, and are thus better. Removing two abnormal IR analyses, 1584-03-01 and 1589-03-01 (Table 1), we have accordingly determined the water contents of the Mg-Rw in Run 1584, Run 1589 and Run 4753 as 1019(238), 5500(229) and 16,307(1219) ppm, respectively. The abnormal H2O content estimated from 1584-03-01 may be caused by a combined influence of the low H2O content and the apparent interference fringes (shown later). However, reason for the abnormal H2O content estimated from 1589-03-01 is unclear.

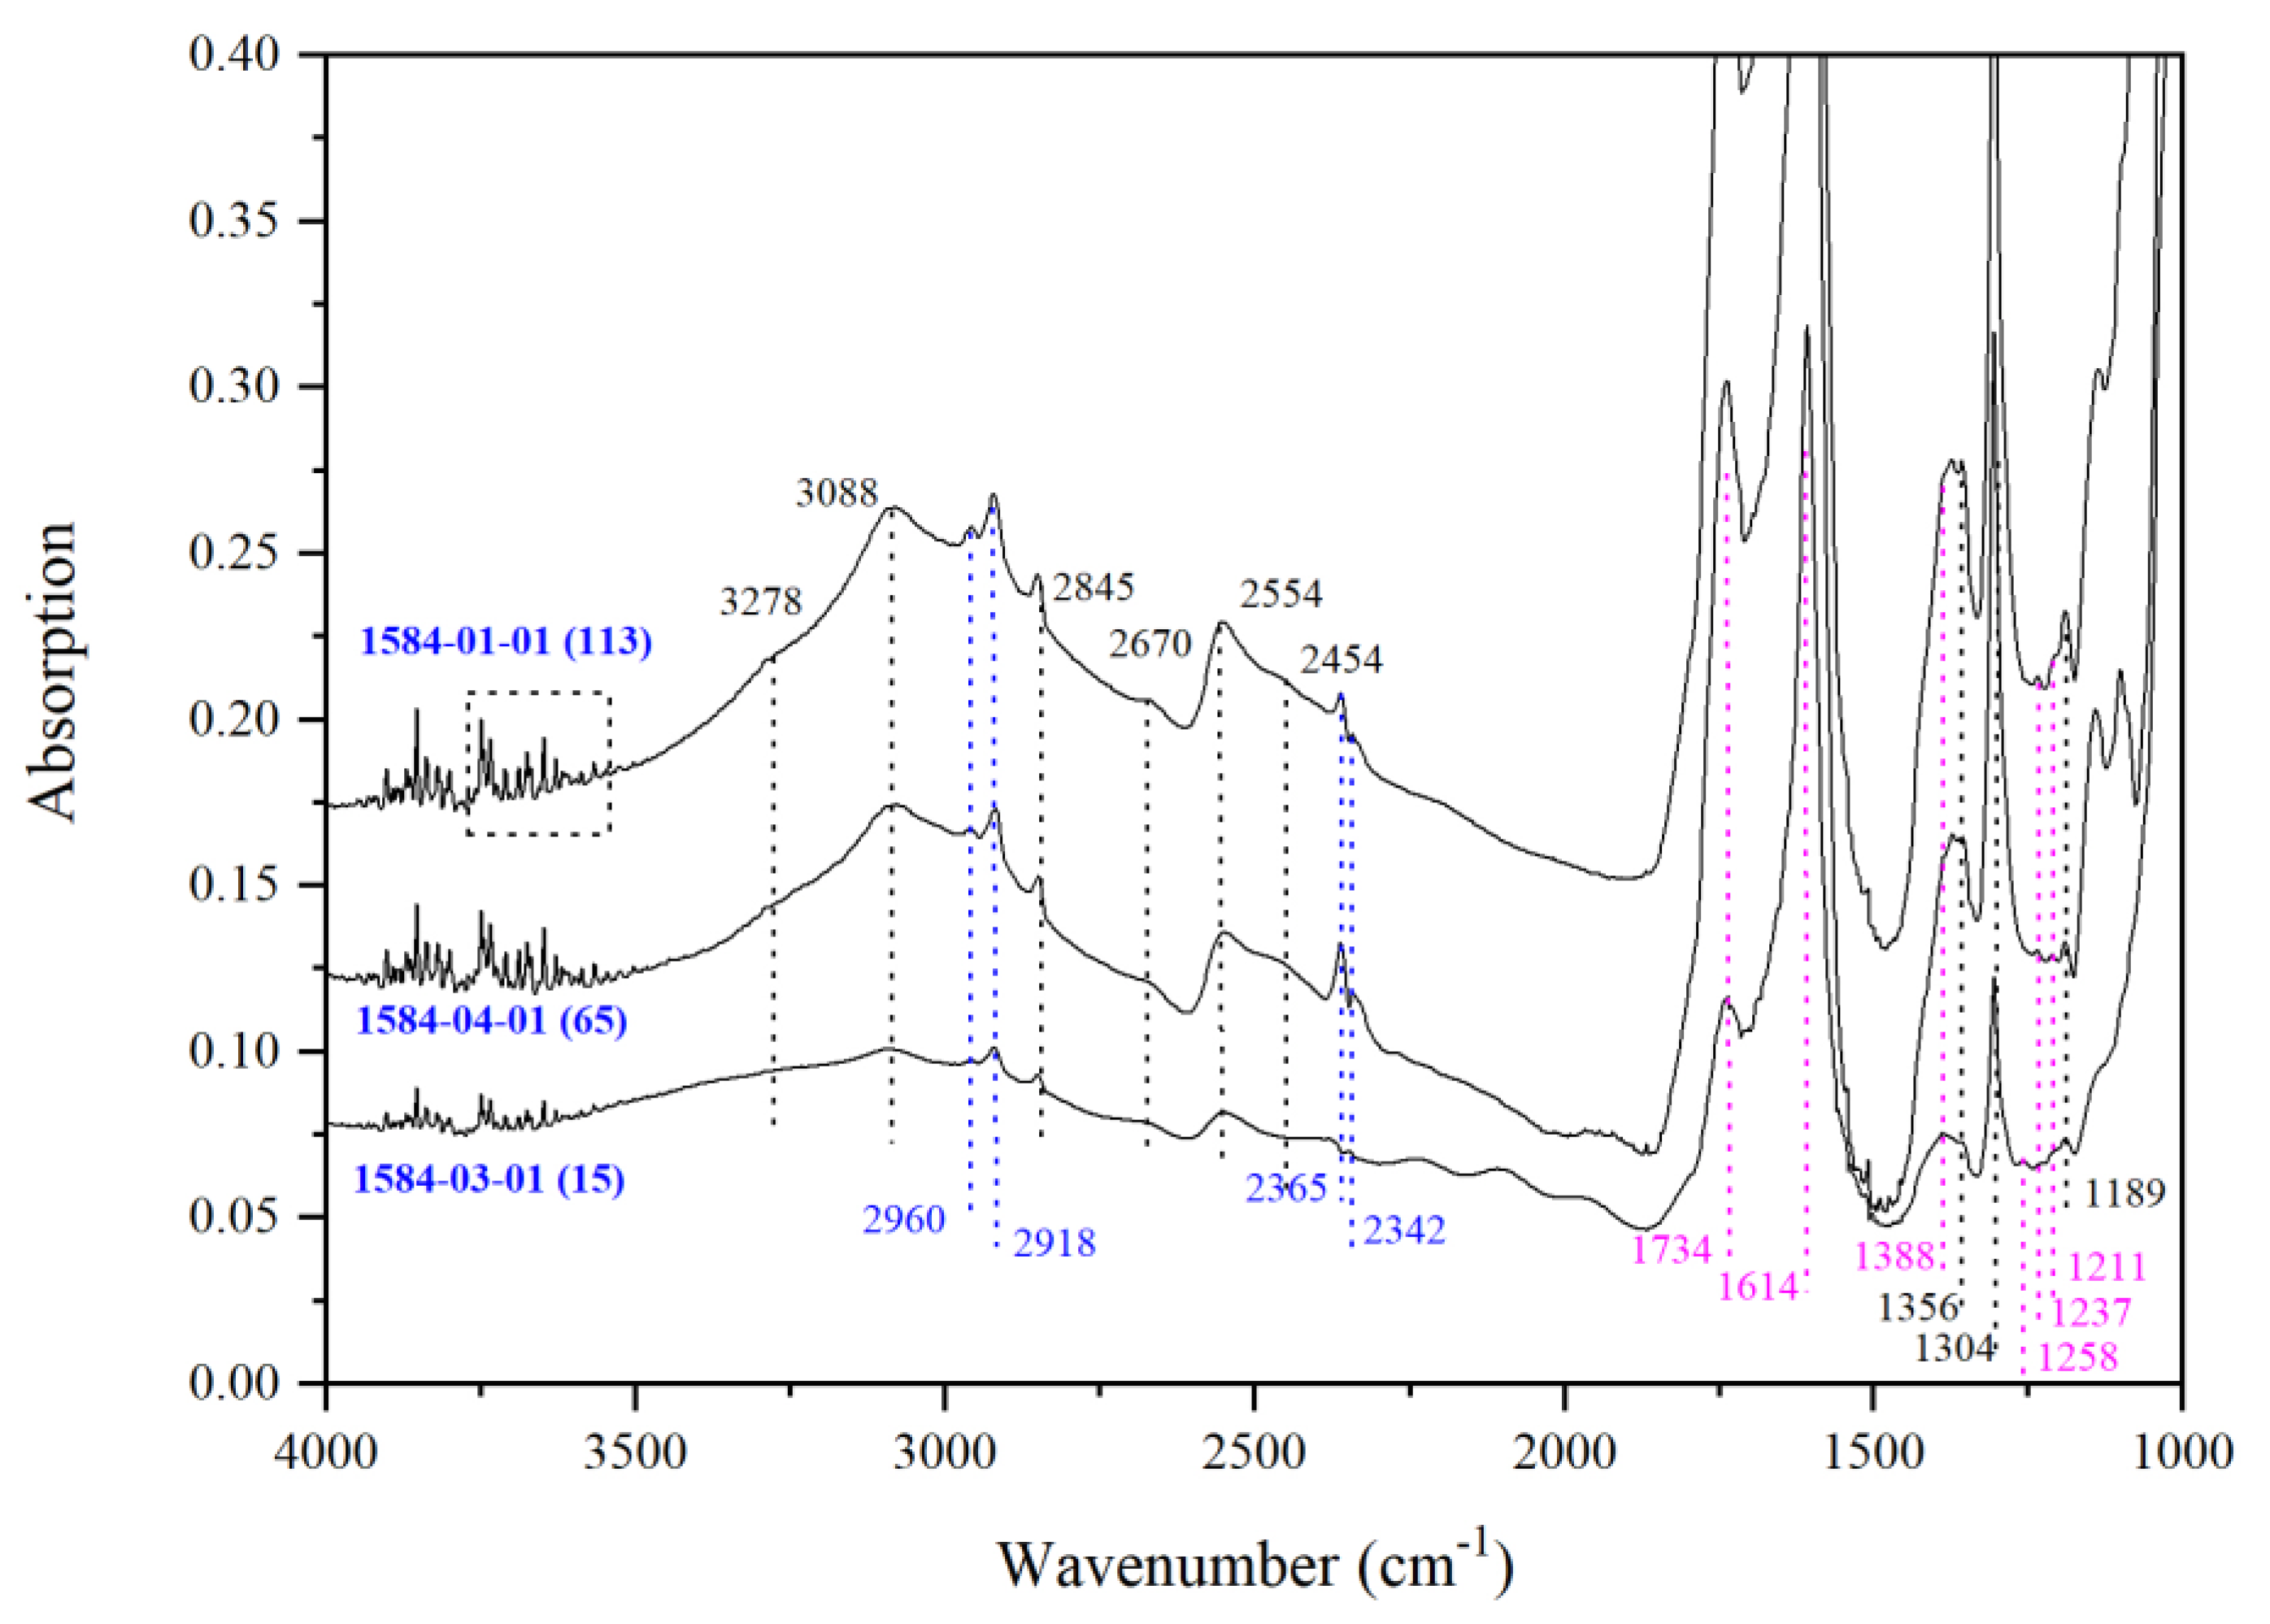
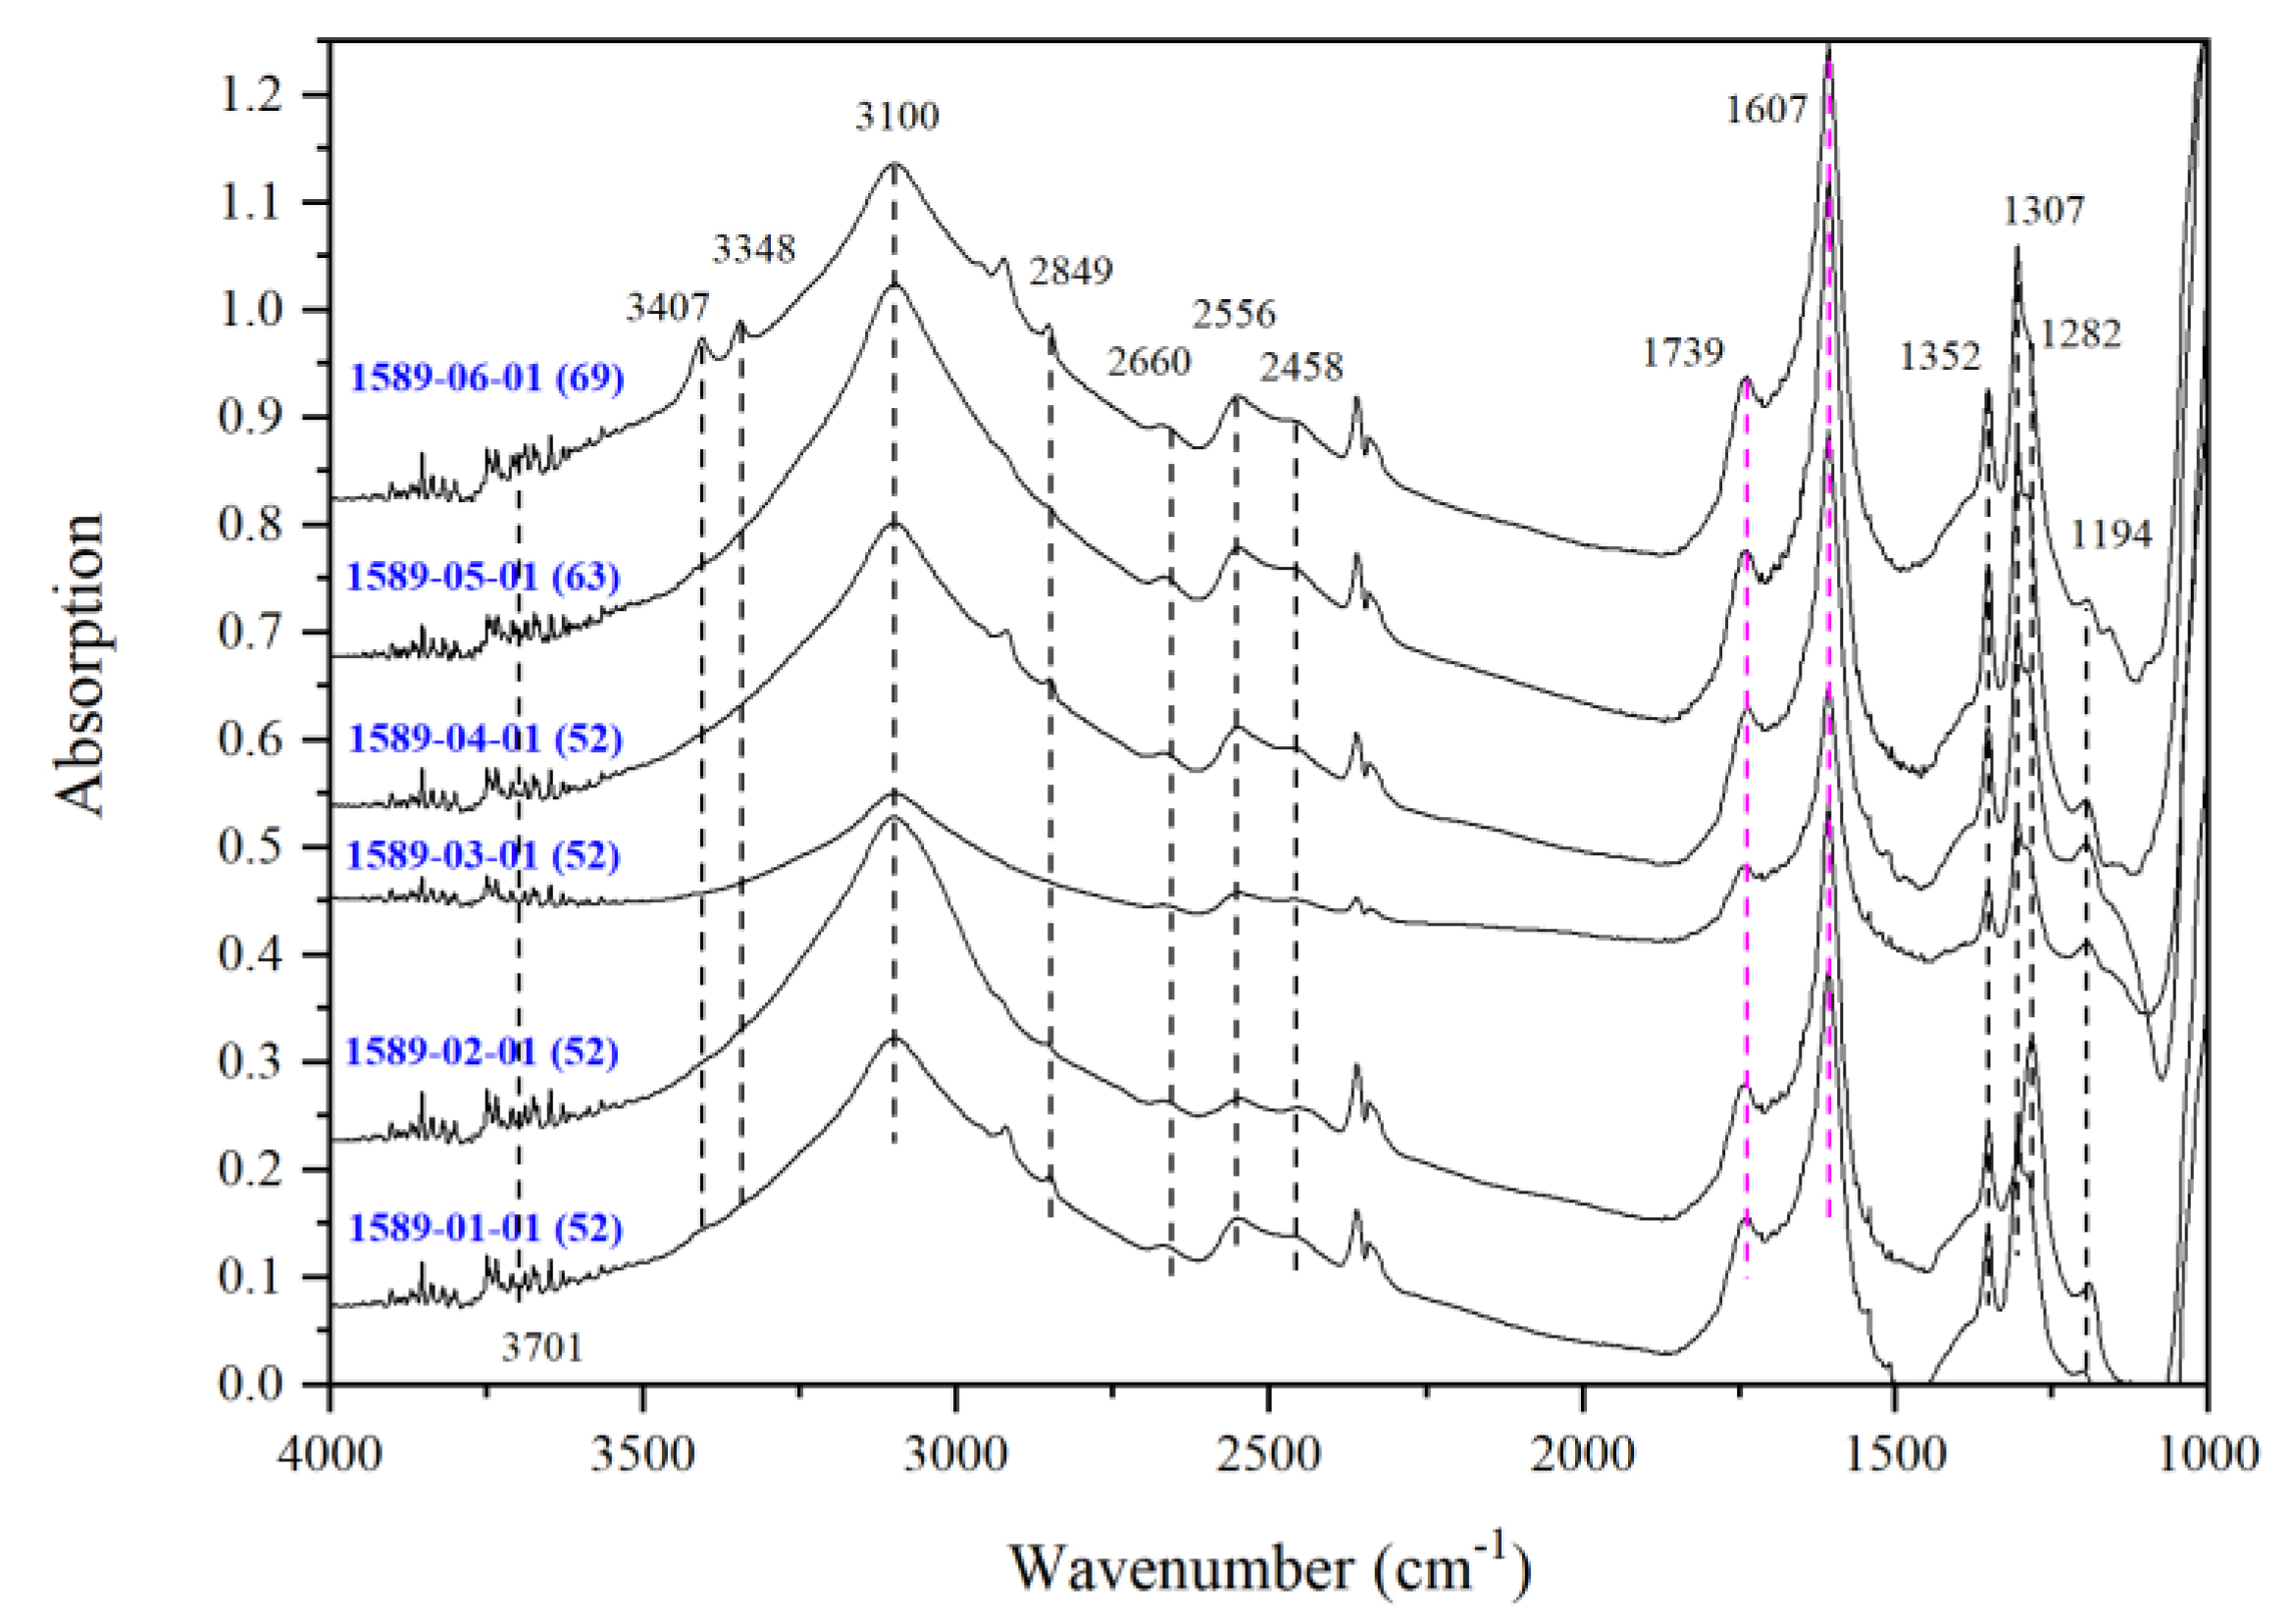
3.2. IR Peaks for Water in Mg-Rw without Anealing

Rw has a cubic spinel structure (space group Fd 3 ¯ m), which has only one distinct site for each element [79]. Oxygens appear as a cubic close packing array, Si cations occupy one eighth of the tetrahedral sites (T-sites; 8a), and Mg and/or Fe cations take half of the octahedral sites (M-sites; 16d). There is another octahedral site (16c) in the spinel structure, which is usually vacant (vacant M-sites). According to theoretical investigations [39,40,41,42], hydrogen atoms may enter all the T-sites and M-sites (filled or not) to significant amounts, resulting in many IR peaks. Cation disordering on the T-sites and M-sites may further complicate the IR features [43,44,52].
Figure 5 shows the infrared spectra (4000–1000 cm−1) taken from the high-H2O Mg-Rw thin sections with Dm = 14–64 μm (CH2O = 16,307(1219) ppm). Mainly, there are five sets of IR peaks occurring in the energy ranges of ~3750–3620, ~3620–2700, ~2700–2300, ~1850–1500 and ~1500–1150 cm−1. Peak Set I, appearing in the energy range of ~3750–3620 cm−1, contains a relatively weak and broad feature centering at ~3682 cm−1. This broad feature was previously observed in the IR spectra for water-rich Rw [12,28,49,51,56], but hardly detected in those for water-poor Rw [12,28,49,53,56]. Following Blanchard et al. [40], Li et al. [41] and Mrosko et al. [52], we attribute this weak peak to the hydrogens on the T-sites. Peak Set II, appearing in the energy range of ~3620–2700 cm−1, is nominally made of one intense and broad peak centering at ~3118 cm−1. It is the major water peak that was usually observed and commonly assigned to the hydrogens on the M-sites [40,41,52]. Peak Set III, appearing in the energy range of ~2700–2300 cm−1, may contain three weak peaks at ~2663, 2538 and 2445 cm−1. Whether they are related to any hydrogen or not has been a controversial issue, but will be resolved later in this study. Peak Set IV, appearing in the energy range of ~1850–1500 cm−1, may have two peaks at ~1734 and 1601 cm−1. They are not related to any hydrogen, as previously discussed (Figure 1). Peak Set V, appearing in the energy range of ~1500–1150 cm−1, is generally composed of three water-related peaks at ~1347, 1281 and 1186 cm−1 [49]. As shown later, there may be some more weak and hidden IR peaks though. For the energy interval ~2300–1850 cm−1, there is no apparent IR peak intrinsic to Rw, so that it is the ideal wavenumber range to display the interference fringes, as exampled by the spectrum 4753-05-01 (Figure 5).
Figure 6 shows the infrared spectra (4000–1000 cm−1) taken from the low-H2O Mg-Rw thin sections with Dm = 15–113 μm (CH2O = 1019(238) ppm). As we can see, the weak and broad feature in Peak Set I (~3750–3620 cm−1) previously observed for the high-H2O Mg-Rw is now gone and completely replaced by a large number of tiny peaks (highlighted by the broken square), whose intensities are highly similar to those tiny peaks at > ~3750 cm−1. The low-H2O Mg-Rw thus likely has a negligible amount of hydrogen on its T-sites, as suggested by Ye et al. [23]. The intense and broad peak in Peak Set II (~3620–2700 cm−1) is still there, but centers at ~3088 cm−1, with two new peaks appearing at ~3278 and 2845 cm−1. In addition, those peaks at ~2960 and 2918 cm−1 should belong to the acetone residues [80]. The three weak peaks in Peak Set III (~2700–2300 cm−1) are still there, with slightly different peak positions though (at ~2670, 2554 and 2454 cm−1). Similarly, the two water-irrelevant peaks in Peak Set IV (~1850–1500 cm−1) remain, but appear at ~1734 and 1614 cm−1. Peak Set V (1500–1150 cm−1) now has much more component peaks, with one group of sharp peaks at ~1356, 1304 and 1189 cm−1 and another group of weak and broad peaks at ~1388, 1258, 1237 and 1211 cm−1. We assign the former to the hydrogen defects in Mg-Rw and the latter as the combinations/overtones. Additionally, note the interference fringes around ~2150 cm−1 in the spectrum 1584-03-01.
The IR peaks for water in Mg-Rw have been further examined with a large number of intermediate-H2O Mg-Rw thin sections with similar thickness (from 52 to 69 μm; Figure 7). Now, the water peaks appear at ~3701 cm−1 (Peak Set I), 3407, 3348, 3100 and 2849 cm−1 (Peak Set II), 2660, 2556 and 2458 cm−1 (Peak Set III) and 1352, 1307, 1282 and 1194 cm−1 (Peak Set V). The features of the water peaks in Peak Set I, Peak Set III and Peak Set V observed for the intermediate-H2O Mg-Rw generally lie in the middle of the features observed for the high-H2O Mg-Rw and for the low-H2O Mg-Rw. This behavior is followed by the two peaks at 3100 and 2849 cm−1 in Peak Set II, but not by the rest two peaks at ~3407 and 3348 cm−1.
Collectively, Figure 5, Figure 6 and Figure 7 have suggested the following 15 water peaks for our Mg-Rw synthesized with conventional high-P experimental techniques (Table 3): one peak at ~3701 cm−1 (Peak Set I), five peaks at 3407, 3348, 3278, 3100 and 2849 cm−1 (Peak Set II), three peaks at ~2660, 2556 and 2458 cm−1 (Peak Set III) and six peaks at ~1356, 1347, 1303, 1282, 1190 and 1186 cm−1 (Peak Set V). This result is based on a large number of thin sections, with the CH2O varying from 1019(238) to 16,307(1219) ppm and the thickness varying from ~14 to 113 μm, so that it is very comprehensive.
There have been some debates on the relationship between the IR peaks of Peak Set V (from ~1500 to 1150 cm−1) and the water in Rw. Bolfan-Casanova et al. [49] compared the IR features of one nominally dry polycrystalline sample and two water-rich Mg-Rw crystal plates (~7500–7800 ppm H2O), and concluded that the peaks at ~1347, 1286 and 1191 cm−1 should be considered as in-plane X-OH bending vibrations since they only occurred in the IR spectra of the water-rich Mg-Rw. Their conclusion was supported by Chamorro Pérez et al. [51], in which an Mg-Rw with an even higher H2O content (~17,000 ppm) was investigated. Hofmeister and Mao [62], however, interpreted the IR features from ~1500 to 1150 cm−1 as combinations of the first-order overtones of the Si-O stretching, O-Si-O bending and translation of octahedral and tetrahedral cations while they investigated a very water-poor Mg-Rw [23,79]. Here, we have observed two groups of IR peaks with distinctly different features, as shown in Figure 1. The weak and broad IR peaks at ~1381, 1142 and 1102 cm−1, present in the spectrum 1584-01-01 from the thick low-H2O Mg-Rw thin section (Dm = 113 μm), are absent in the spectrum 1584-03-03 from a much thinner thin section (Dm = 15 μm). In comparison, they are completely concealed by the strong water-related IR peaks at ~1348, 1280 and 1185 cm−1 in the spectra 4753-01-01 and 4753-05-01 from the high-H2O Mg-Rw thin sections (Dm = 64 and 14 μm, respectively). Since they can be observed only with water-poor Mg-Rw thin sections with large thickness, they have nothing to do with water, and should be assigned as the combinations of the first-order overtones of the Si-O stretching, O-Si-O bending and translation of octahedral and tetrahedral cations. No doubt that there are water-related peaks in the energy range of ~1500–1150 cm−1, as detected at ~1347, 1281 and 1186 cm−1 for the high-H2O Mg-Rw (Figure 5). More interestingly, a peak at ~1305 cm−1 can be clearly observed for the low-H2O Mg-Rw (e.g., 1584-01-01 in Figure 1), and can be vaguely detected as a shoulder on the high wavenumber side of the strong but generally broad water-related peak at ~1280 cm−1 in the IR spectrum 4753-01-01 (Figure 1). Similar to the peak at ~1280 cm−1, the water-related peak at ~1185 cm−1 in the IR spectrum 4753-01-01 is also very broad, and might contain two components, with the major one at ~1185 cm−1 and the minor one presumably at a slightly higher wavenumber, say ~1190 cm−1. Furthermore, the peak at ~1381 cm−1 in the spectrum 1584-01-01 is extremely broad, suggesting multiple peak components (Figure 1). Indeed, there is a minor water peak at ~1356 cm−1 (Figure 6) or at ~1352 cm−1 (Figure 7). Consequently, we have assigned these three small peaks at ~1356, 1305 and 1190 cm−1 as water peaks. Since there are different types of hydrogen defects in Rw, it is possible that these peaks might just represent other types of hydrogen defects, whose IR signals can be clearly observed, with only Rw having appropriate amounts of water.
The IR peak at ~1604 cm−1 is worthy of a few words. Following Bolfan-Casanova et al. [49] and Chamorro Pérez et al. [51], we have already interpreted it as a combination band/overtone of the SiO4 structure units in Rw. An IR peak at similar energies is usually observed for water-rich silicate glasses [76,81] and some hydrous minerals such as lawsonite [82], and attributed to the bending vibration of water molecules. Rw seemingly has no water molecules in its structure.
There have been intense discussions on the nature of the IR peaks at ~2550 cm−1. Bolfan-Casanova et al. [49], Chamorro Pérez et al. [51] and Bolfan-Casanova et al. [56] treated them as the first-order overtones of the X-OH bending vibrations occurring in the energy range of ~1500–1150 cm−1, whereas Hofmeister and Mao [62] and Thomas et al. [38] interpreted them as the second-order overtones and combinations of the Si-O vibrations. The same IR spectra shown in Figure 1 are shown for a different energy range in Figure 8. On one hand, there is no positive correlation between the intensities of the peaks at ~2656, 2551 and 2453 cm−1 and the thickness of the thin sections, suggesting that these peaks are not the second-order overtones and combinations of the Si-O vibrations. On the other hand, the much high intensity of these peaks for the high-H2O Rw than for the low-H2O Rw straightforwardly indicates their relations to water. If these peaks were the second-order overtones and combinations of the Si-O vibrations, their intensities should be about one tenth of the intensities of the first-order overtones/combinations appearing at ~1850–1500 cm−1 [83], which is clearly not the case (Figure 5). Furthermore, the assignment of these water peaks at ~2550 cm−1 as the first-order overtones of the X-OH bending vibrations occurring in the energy range of ~1500–1150 cm−1 [49,51,56] is also not supported by our data. These peaks are just too intense (Figure 5 and Figure 6). Therefore, we tend to believe that these water peaks might have some special relations to the quench process of the high-P experiments. Indeed, Mrosko et al. [52] observed their almost complete disappearance at ~500 °C but reappearance at room T.
There has not been any doubt on the relations between the water in Rw and the IR peaks of Peak Set II (from ~3620 to 2700 cm−1) and Peak Set I (from ~3750 to 3620 cm−1). For Peak Set II, two more weak and broad water peaks were observed at ~3598 and 3568 cm−1, respectively, by Ye et al. [23] and Thomas et al. [38]. Based on the IR measurement [23], and the Raman measurement and proton-proton scattering measurement [38], the investigated Mg-Rw SZ0820 mostly contained ~1.77(35) wt% H2O, similar to our high-H2O Mg-Rw (~1.63(12)%). The thickness of the thin sections was either ~30 μm [23] or 84 μm [38], generally in the thickness range of our thin sections (Table 1). Since we do not observe these two peaks in our IR spectra (Figure 5), and since Panero et al. [53] did not observe them in the IR spectra taking from the Mg-Rw SZ0820 (thickness = 25 μm), the identity of these two peaks may be problematic and require further investigation (Table 3). For Peak Set II, most studies, ours included, usually suggest one weak and broad IR peak at ~3680 cm−1, but Bolfan-Casanova et al. [56] reveals two peaks at ~3733 and 3687 cm−1.

3.3. IR Features of Water in Annealed Mg-Rw

One low-H2O Mg-Rw thin section (1019(238) ppm H2O) was successively annealed for five times, two times at 200 °C (30 and 60 min, respectively), two times at 250 °C (90 and 30 min, respectively) and one time at 300 °C (60 min). Six intermediate-H2O Mg-Rw thin sections (5500(229) ppm H2O) were, respectively, annealed at 350, 400, 450, 500, 550 and 600 °C. For each of these six thin sections, the annealing experiment was successively carried out for two–five times with an annealing duration of usually 15 min (Table 2). It should be noted that all these six thin sections have much similar thickness, ranging from 52–69 μm, so that their IR spectra can be generally directly compared to examine the effects of annealing T and duration.

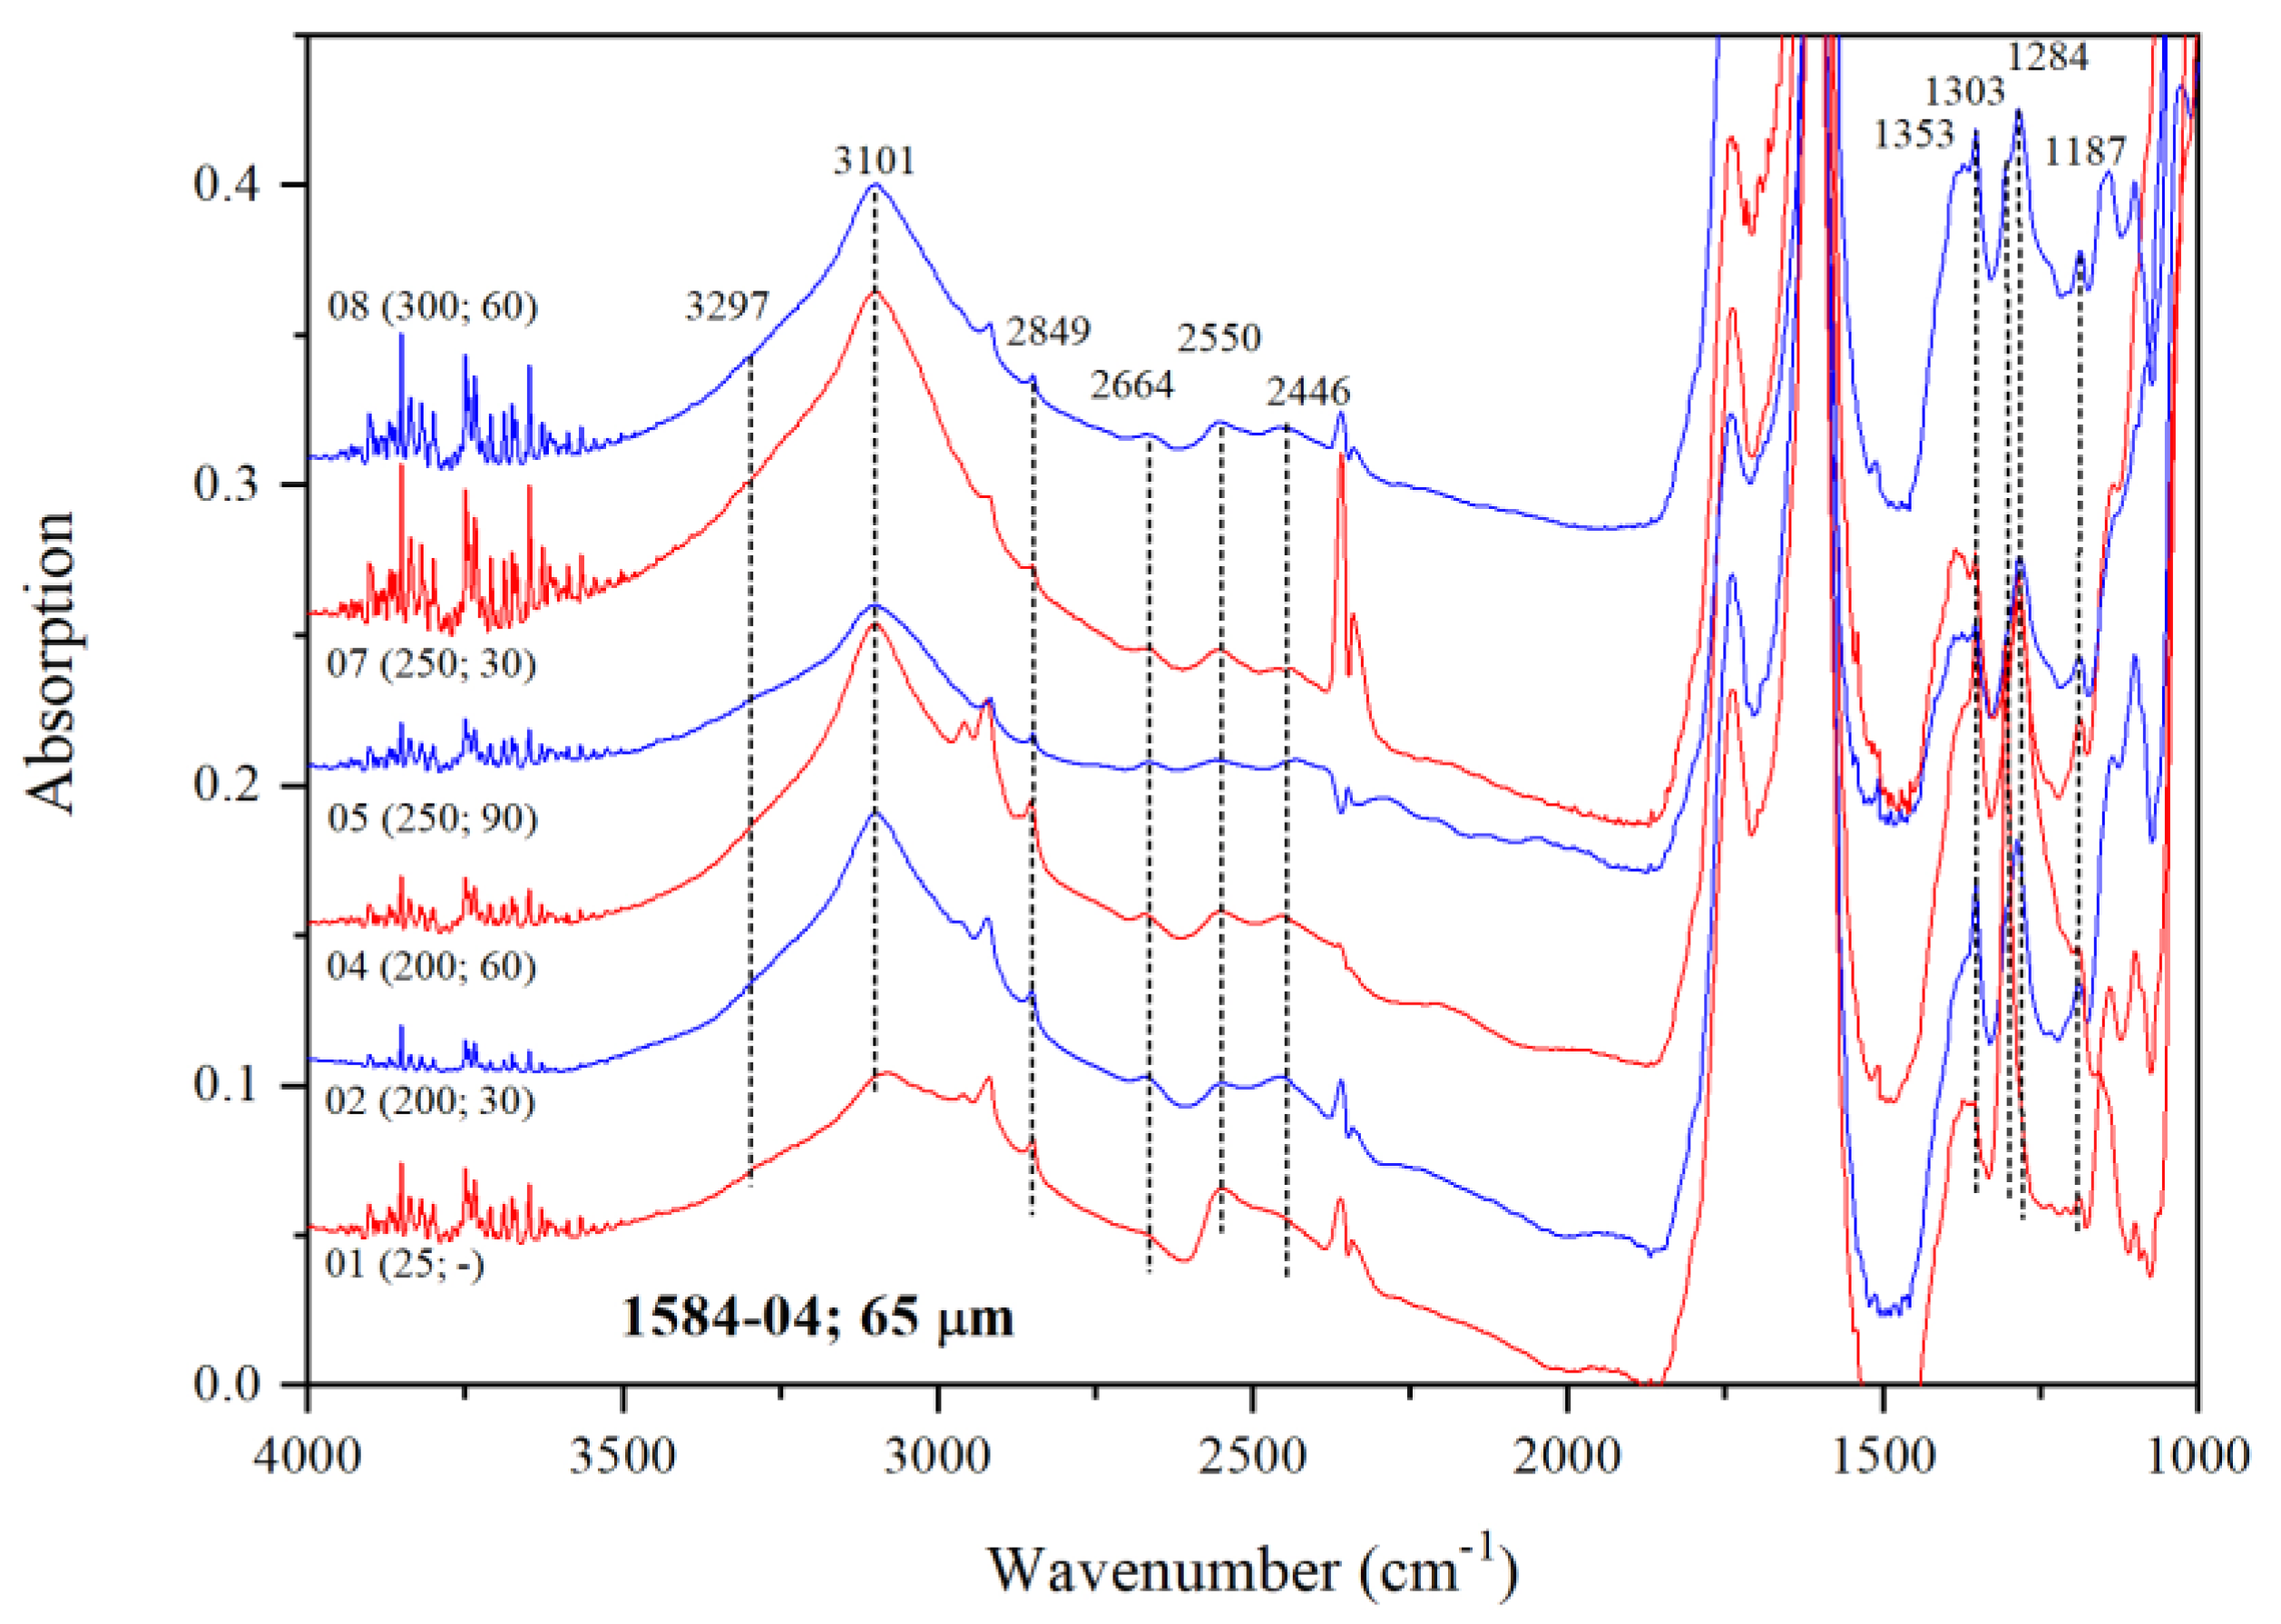
3.3.1. IR Features of Water in low-H2O Mg-Rw Annealed at 200, 250 and 300 °C

The IR spectra are summarized in Figure 9. In total, we can observe 10 water peaks at ~3297, 3101, 2849, 2664, 2550, 2446, 1353, 1303, 1284 and 1187 cm−1 from these spectra. As the annealing experiments proceed, little change of the water peaks can be easily observed, suggesting limited hydrogen migration among the different crystallographic sites or negligible rearrangement of the O-H dipoles in the Rw structure at 200, 250 and 300 °C.

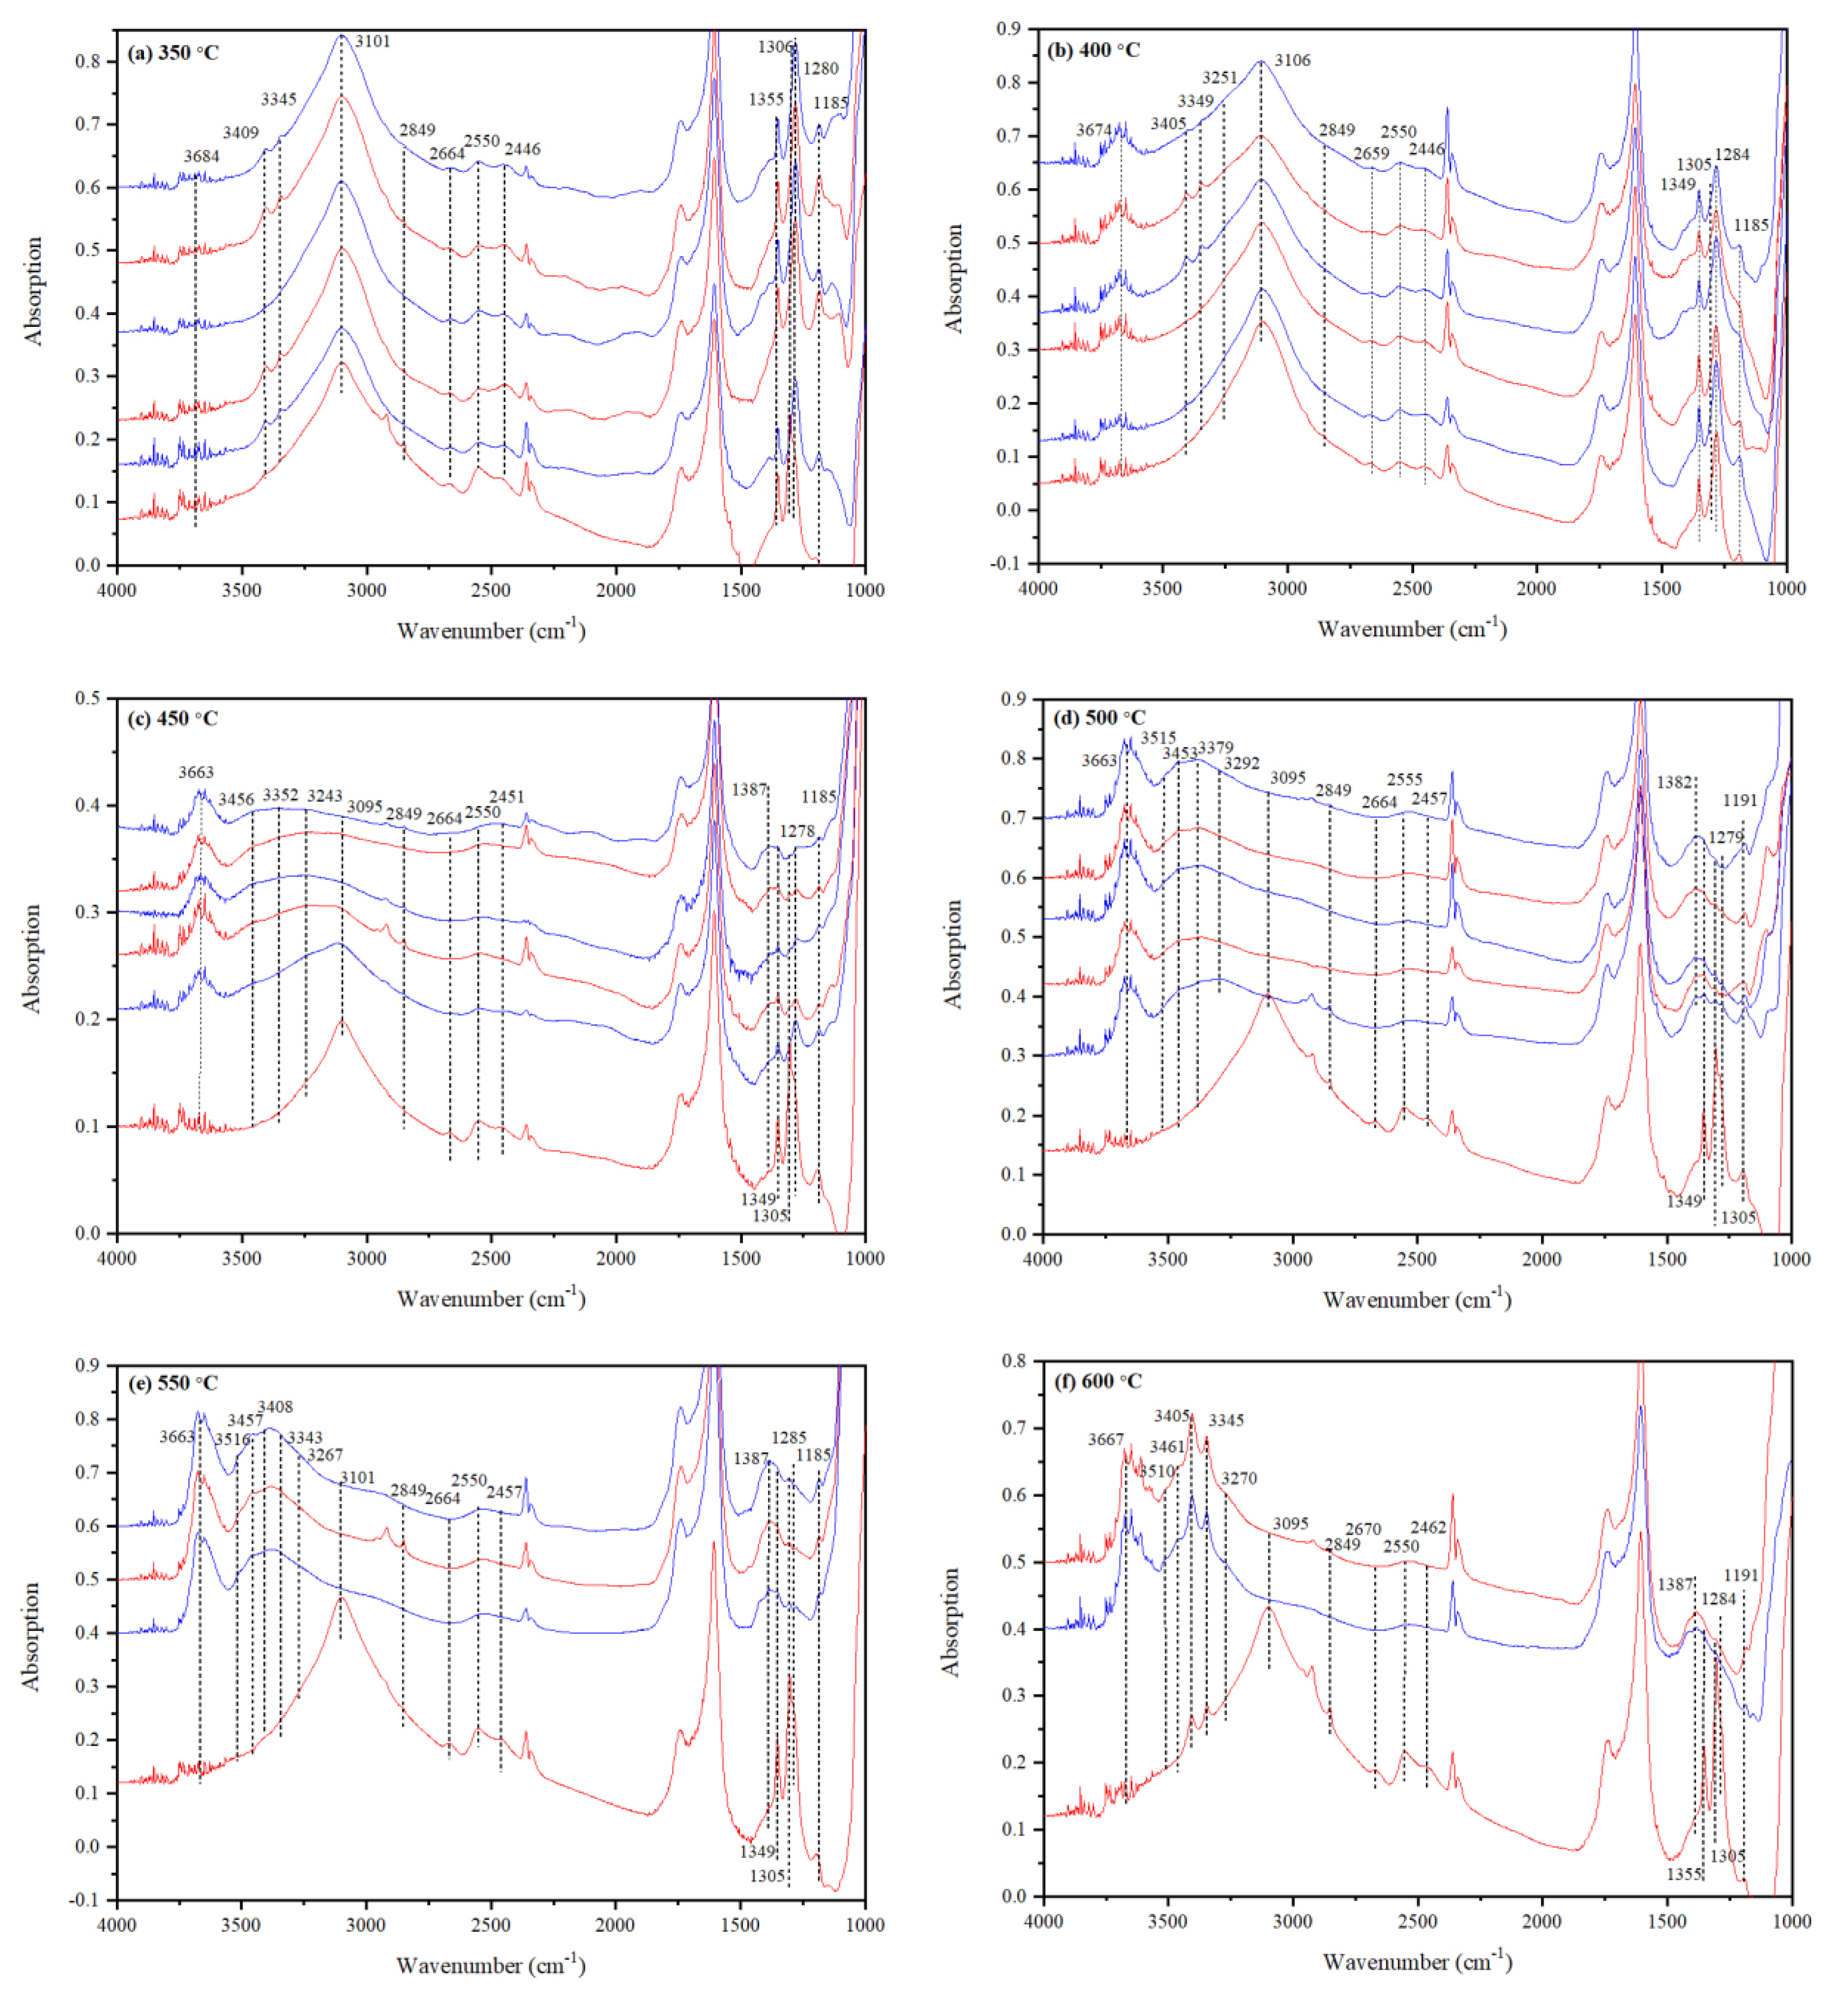
3.3.2. IR Features of Water in Intermediate-H2O Mg-Rw Annealed at 350 °C

The IR spectra are summarized in Figure 10a. Largely due to the relatively high water content, three more weak water peaks at ~3684, 3409 and 3345 cm−1 have been observed. In contrary, the peak at ~3297 cm−1 observed for the low-H2O Mg-Rw (Figure 10) is gone, presumably blocked by the intensified major water peak at ~3101 cm−1. As the annealing experiments proceed, little change of the water peaks can be easily observed, suggesting limited hydrogen migration among the different crystallographic sites or negligible rearrangement of the O-H dipoles in the Rw structure at 350 °C.

3.3.3. IR Features of Water in Intermediate-H2O Mg-Rw Annealed at 400 °C

The IR spectra are summarized in Figure 10b. As the annealing experiments proceed, a large number of changes can be observed for the water peaks. Firstly, the weak and broad peak at ~3674 cm−1 gradually increases its intensity. Secondly, the main water peak near ~3106 cm−1 progressively decreases its intensity and becomes broader, leading to the emergence of one weak water peak at ~3251 cm−1. Thirdly, both the water peaks at ~2700–2300 cm−1 and at 1500–1150 cm−1 seem to slowly decrease their intensities. Consequently, there must have been some hydrogen migration among the different crystallographic sites and rearrangement of the O-H dipoles in the Rw structure at 400 °C, with their equilibrium states unclear though.

3.3.4. IR Features of Water in Intermediate-H2O Mg-Rw Annealed at 450 °C

As shown in Figure 10c, the changes of the IR features slowly developing at 400 °C happen very fast at 450 °C; with the first annealing experiment at 450 °C, all of them can be readily observed. After completing all five annealing experiments, we can easily tell from the IR spectra that (1) the broad peak at ~3663 cm−1 has become very prominent; (2) the usually seen main water peak at ~3095 cm−1 has almost completely gone, more minor water peaks have vaguely appeared at ~3456, 3352 and 3243 cm−1 and altogether they have formed a very broad IR feature with very low intensity; (3) the water peaks in the range ~2700–2300 cm−1 have become hardly detectable; (4) the water peaks at ~1349, 1305, 1278 and 1185 cm−1 have achieved much reduction in their intensities, and one additional broad water peak has appeared at ~1387 cm−1. At the annealing T of 450 °C, therefore, there must have been significant hydrogen migrations among the different crystallographic sites and rearrangement of the O-H dipoles in the Rw structure. On the basis of the similarity of the last three or four IR spectra, we believe that a new equilibrium state among the different types of hydrogen defects has been generally established by these annealing experiments.

3.3.5. IR Features of Water in Intermediate-H2O Mg-Rw Annealed at 500 °C

As shown in Figure 10d, all the changes observed at 450 °C have been not only reproduced at 500 °C, but also intensified. Clearly, the broad peak at ~3663 cm−1 has a larger intensity now. More and better-resolved weak water peaks are observed at ~3515, 3453, 3379 and 3292 cm−1, and altogether, they form a broad but apparent IR feature in the range of ~3550–3095 cm−1. The usually seen main water peak at ~3095 cm−1 is completely gone. The water peaks at ~2700–2300 cm−1 have turned into a weak and broad feature centering at ~2555 cm−1. For the energy range 1500–1150 cm−1, we now see three broad features, respectively, at ~1382, 1279 and 1191 cm−1, with the one at ~1382 cm−1 dominating. These IR signals may indicate that the initial hydrogen defects in the Mg-Rw as synthesized in and conventionally quenched from high-P experiment have been completely altered by the annealing experiments at 500 °C.

3.3.6. IR Features of Water in Intermediate-H2O Mg-Rw Annealed at 550 °C

As shown in Figure 10e, the annealing experiments at 550 °C well reproduce the results of those annealing experiments at 500 °C, with better IR signals though. This implies that the hydrogen defects in the Rw at 550 °C are much similar to those at 500 °C.

3.3.7. IR Features of Water in Intermediate-H2O Mg-Rw Annealed at 600 °C

As shown in Figure 10f, the annealing experiments at 600 °C well reproduce the results of those annealing experiments at 550 °C and 500 °C. The water peaks at ~3510, 3461, 3405 and 3270 cm−1, once forming a broad feature locating in the energy range of ~3550–3095 cm−1 at 550 °C and 500 °C, are well resolved now. We thus conclude that the hydrogen defects in the Rw at 600 °C are very similar to those at 550 °C and 500 °C.

3.3.8. IR Features of Water in Mg-Rw Annealed at Different T: A Summary

Mg-Rw is metastable at ambient P, and may transit to the isochemical stable phase forsterite if heated for adequate amounts of time at certain T [21,46]. To examine this potential phase transition, the thin sections annealed at 400 and 600 °C (initial CH2O = 5500(229) ppm) have been probed by a Raman spectrometer. The data are shown in Figure 11. Clearly, no any phase transition can be observed for the Mg-Rw thin section annealed at 400 °C for the cumulated annealing time of 75 min. In contrast, a minor fraction of the Mg-Rw thin section annealed at 600 °C for the cumulated annealing time of 30 min may have transited to forsterite, as indicated by the tiny new Raman peak at ~857 cm−1. Nevertheless, the infrared spectrum 1589-06-03 (Figure 10f), probing both the surface material and the interior material of the thin section, show water peaks completely different to those of forsterite [84,85,86,87], implying a totally negligible amount of phase transition.
The evolutions of the water contents for the intermediate-H2O Mg-Rw thin sections annealed at 350–600 °C are summarized in Figure 12. For the annealing temperatures of 350 and 400 °C, water slowly diffused out of the thin sections, and ~25% water had been lost for the cumulated annealing time of 75 min. For the annealing temperatures of 450, 500, 550 and 600 °C, an average of ~60% water seemingly had been lost. At all these temperatures, however, much of the nominal water reduction took place during the first annealing experiment (Figure 10), and was distinctly accompanied by completely new infrared spectra with much higher weighted mean wavenumbers for the water peaks. Since the molar absorption coefficients negatively correlate with the wavenumbers of the water peaks [57,67,88,89,90], increased mean wavenumbers mean reduced molar absorption coefficients, and underestimated water contents in turn. A quick examination on the infrared spectra shown in Figure 10f has suggested that the change of the weighted mean wavenumbers should be ~350 wavenumbers (from ~3100 to 3450 cm−1), implying a ~45% reduction of the molar absorption coefficients [40] and a ~45% underestimation of the water contents. This would suggest that the four trends for the annealing temperatures of 450, 500, 550 and 600 °C shown in Figure 12 should generally overlap with those trends for the annealing temperatures of 400 and 350 °C. The water-losing process thus does not seem strongly affected by T in the T interval of 350–600 °C.
In contrast, distinct differences have been observed for the hydrogen migration processes and rearrangements of the O-H dipoles in the Rw structure at high T and at low T. Our infrared data have clearly suggested that (1) not much happens at annealing T < ~375 °C, and the initial IR features of water usually observed for the Mg-Rw conventionally synthesized in and quenched from high-P experiments do not experience much change; (2) at annealing T > ~375 °C, significant hydrogen migration and rearrangements of the O-H dipoles take place (with slow rates at T < ~425 °C but fast rates at T > ~425 °C), resulting in the elimination of some initial IR features and the formation of some new IR features (Figure 10). Additionally, these new IR features are persistent at least up to 600 °C, and mostly quenchable to room T. These observations are in good agreement with Panero et al. [53] and Mrosko et al. [52]. Panero et al. [53] did not observe any major change in the IR features of water in Mg-Rw in their low-T experiments (T < room T), and Mrosko et al. [52] detected significant changes in their high-T experiments (T > ~300 °C), with most of the changes quenchable.
Taking into account potential effects of different water contents in Mg-Rw, our annealing experiments reported here may imply the following important changes for the water peaks in Rw at relatively high T (T > ~375 °C; Table 3): (1) a significant enhancing of the intensity of the water peak at ~3667 cm−1, (2) two new peaks appearing at ~3510 and 3461 cm−1, which, along with the peaks at 3405, 3345 and ~3270 cm−1, may form a broad new IR feature centering at ~3450 cm−1, (3) the complete disappearance of the conventionally observed major water peak at ~3100 cm−1, (4) merging the IR peaks in the energy range 2700–2300 cm−1 to form a weak and broad feature at ~2550 cm−1 and (5) a broad IR feature appearing at ~1387 cm−1. According to the results reported for an annealed Fe-bearing Rw by Mrosko et al. [52], the broad feature at ~2550 cm−1 should not have existed at high T, but formed during the quench process. Its much lower absorption observed for the annealed Mg-Rw thin sections than for the unannealed ones agrees with the fact that our room-P quench process proceeded much faster. Therefore, we come to the conclusion that the IR features usually observed on hydrous Rw directly from conventional high-P synthesizing experiments do not exactly reflect the locations of the hydrogen defects at high T.

3.4. Hydrogen Defects and Its IR Features in Mg-Rw at High P-T Conditions

The influence of water on the physical and chemical properties of a material is not only dependent on how much water is hosted in the phase, but on how water is incorporated into its structure. In the case of Rw at the P-T conditions of the mantle transition zone, it has been well agreed that water up to ~2.5% can be stored [13,14,15,43], but little agreement has been reached on the hydrogen incorporation mechanisms [39,43,44,45,51]. Our extensive IR data can shed new lights on the hydrogen defects in Rw.
The hydrogen defects in Rw have been experimentally investigated by a few studies. The single-crystal X-ray diffraction study of Kudoh et al. [43] suggested the presence of octahedral vacancies and some Mg-Si disorder in the Rw structure. Aided with the correlation between the Mg/Si ratio and water content, Kudoh et al. [43,91] proposed that hydrogen in Rw is mostly incorporated via two mechanisms, Mg = 2H and Mg2Si = 8H, and its possible sites are between the O-O pairs around the octahedra in order to interpret the broad major water peak at ~3160 cm−1. On the other hand, the single-crystal X-ray diffraction study of Smyth et al. [44] concluded that the principle hydration mechanism involves octahedral vacancies and the IR spectrum is consistent with protonation sites around the tetrahedral edges. Chamorro Pérez et al. [51] investigated the room-T IR features up to ~30 GPa and argued that the major IR peak at ~3150 cm−1 should be attributed to the protonation of the tetrahedral edges and the relatively weak IR peak at ~3679 cm−1 could be consistent with a partial protonation of the octahedral edges. Stebbins et al. [55] conducted a 29Si NMR spectroscopic study, and observed some new peaks which cross-polarize very rapidly, indicating very short Si-H distances and the presence of Si-OH, as expected from the Mg = 2H mechanism with the formation of octahedral vacancies. More recently, Purevjav et al. [45] carried out a neutron diffraction study and found that hydrogen exchanges not only with Mg or Fe but also with Si. One major drawback in all these studies is that they were all conducted at ambient T with hydrous Rw synthesized by employing conventional high-P experimental techniques. The samples investigated might have been subject to some quench-related structural modification, a phenomenon well known for the spinel structure [55,92].
Four types of hydrogen defects in Mg-Rw have been theoretically investigated to some degrees, although the number of the cation configurations examined for each type of the hydrogen defects has been limited [39,40,41,42]. They are [VMg(OH)2], [VSi(OH)4], [VMg(OH)2MgSiSiMg] and [MgSi(OH)2] (Kröger-Vink notation), with the first type representing a 16d octahedral vacancy created by the substitution reaction Mg = 2H, the second type representing a tetrahedral vacancy created by the substitution reaction Si = 4H (i.e., hydrogarnet substitution), the third type representing an octahedral vacancy locating near an Mg-Si substitution (i.e., cations switching their positions, or cation disordering) and the fourth type representing two protons compensating an Mg substituting for a Si in a tetrahedron (i.e., Si = Mg + 2H). According to Blanchard et al. [40] and Panero [42], their relative stabilities at static conditions are generally in the order of [VMg(OH)2] ≈ [VSi(OH)4] > [VMg(OH)2MgSiSiMg] > [MgSi(OH)2]. P has a mostly negligible effect on their relative stability, but T might have some impacts, which have not been constrained though [40,41,42].
The populations of these different types of hydrogen defects in the hydrous Rw at high P-T conditions may be faithfully recorded by the variations of the compositions determined on the quenched hydrous Rw. In general, the diffusion reaction in a solid phase is slow, and the conventional quench process of a high-P experiment is not expected to significantly modify the phase composition. Figure 13 shows the most recent and high quality compositional data for the hydrous Rw, along with those for hydrous wadsleyite (Wad), from Bolfan-Casanova et al. [56]. As pointed out by Bolfan-Casanova et al. [56], the net substitution reaction in hydrous Rw is, Mg = 2H, much similar to that in hydrous Wad. Obviously, Figure 13 suggests that the hydrogen defects [VMg(OH)2] and [VMg(OH)2MgSiSiMg] may play major roles in the formation of hydrous Rw, the defect [VSi(OH)4] may have a minor contribution and the defect [MgSi(OH)2] may not contribute at all at the P-T conditions of the mantle transition zone. Indeed, the defect [MgSi(OH)2] is the least stable hydrogen defects in hydrous Rw, according to the predictions of Blanchard et al. [40] and Panero [42].
Our new and extensive ambient-T IR spectra collected from the hydrous Rw, unannealed or annealed at 1 atm, display 11 IR peaks occurring from ~3800 to 2000 cm−1 (Table 3). Moreover, for those two weak water peaks at ~3598 and 3568 cm−1, which are presumably detectable with thick and water-rich thin sections only [23,38], 13 IR peaks have been observed for the water in Mg-Rw, strongly indicating the coexistence of different types of hydrogen defects in the Rw structure at 1 atm. We propose that the broad IR peak at ~3701–3682 cm−1 should be assigned to the defects [VSi(OH)4] around the tetrahedra, those from ~3600 to 3000 cm−1 to the defects [VMg(OH)2MgSiSiMg] around the octahedra and those from ~3000 to 2000 cm−1 to the defects [VMg(OH)2] around the octahedra, following the theoretical predictions of Blanchard et al. [40] and Li et al. [41]. It should be noted that this assignment is in general agreement with the correlations between the O-H stretching frequency (as observed in the IR spectra) and the O-O distance around the hydrogen defects, as established by Nakamoto [93] and Libowitzky [94]. Due to the formation of the hydrogen bonds, the O-O distances of the tetrahedra are 3.08–3.16 Å, the O-O distances of the edges shared by the 16c and 16d octahedra (where the defects [VMg(OH)2MgSiSiMg] locate) are ~2.67–2.79 Å, and the O-O distances of the 16d octahedra are 2.68 Å [40]. Considering the relative magnitudes of the IR absorptions at ~3701 to 3682 cm−1, and in the energy ranges of ~3600 to 3000 cm−1 and ~3000 to 2000 cm−1, the defects [VMg(OH)2MgSiSiMg] should be dominant in our low-H2O Mg-Rw at 1 atm (Figure 6). For our high-H2O Mg-Rw at 1 atm (Figure 5), the scenario is more complicated. The IR spectrum 4753-01-01 shows that the ratio of the integrated absorptions for the regions of 3800–3550 cm−1 and 3550–3000 cm−1 is ~0.145. Taking into account the effects of the mean wavenumbers of these two IR features (roughly ~3700 and 3100 cm−1, respectively) on the molar absorption coefficients [40], the ratio of the waters ascribed as the hydrogen defects [VSi(OH)4] and [VMg(OH)2MgSiSiMg] is ~0.61, which contradicts with the chemical characteristics of the Rw at high P-T conditions (Figure 13). This implies that the quench process at high P must have substantially altered the ratio of the hydrogen defects [VSi(OH)4] and [VMg(OH)2MgSiSiMg]. Indeed, the ready conversion between these two types of hydrogen defects has been firmly established in this study (Figure 10).
Rather unfortunately, the hydrogen defects [VMg(OH)2MgSiSiMg] in hydrous Rw have not been well investigated either by experimental techniques or by simulation approaches. Blanchard et al. [40] presents as the only study at this moment. In that study, just three or four cation configurations were relaxed and examined, and only two IR peaks at 3343 and 3004 cm−1 were determined for the hydrogen defects [VMg(OH)2MgSiSiMg]. With the site-exchanging of some Mg and Si cations along with this type of hydrogen defects, however, a much larger number of cation configurations are possible, and many more IR peaks are expected. Furthermore, the site-exchanging process (i.e., cation disordering) is usually T-dependent [92], so that the energetically stable cation configurations may vary with T, and the IR signals may significantly change with T. Indeed, dramatic variations of the IR peaks in the energy range of ~3600–3000 cm−1 have been observed from our hydrous Mg-Rw crystal plates annealed at various T (Figure 10), signifying a dynamic adjustment of the arrangements of the O-H bonds in accordance to the variations of the cation-disorder states at different T.
It is beneficial to explore the influences on the IR features of the quench processes at high P and 1 atm. The quench process at high P may be responsible for the following modifications, (1) the appearance of the IR peak at ~3700 cm−1, which has been attributed to the hydrogen defects [VSi(OH)4] most non-existing at high P-T conditions, (2) the formation of the conventionally observed major water peak at ~3100 cm−1 by merging most IR peaks (~3600 to 3000 cm−1) caused by the dominant hydrogen defects [VMg(OH)2MgSiSiMg] and (3) the appearance of the IR peaks at ~2550 cm−1, which have been attributed to the hydrogen defects [VMg(OH)2] mostly non-existing in any significant amount at high P-T conditions. The influence on the appearance of the IR peak at ~3700 cm−1 may be dependent on the water content of the Rw, being extremely small at low CH2O but relatively large at high CH2O (Figure 14). As being annealed at high T and 1 atm, the Rw quenched from high-P synthesizing experiments may progressively relax its structure, rearrange the O-H dipoles and attain new equilibrium for the different types of hydrogen defects, which bring forth the changes to the IR features as observed in this study (Figure 10 and Figure 14). These new IR features at high T may be well preserved if the quench process at 1 atm is fast enough.

3.5. Water-Coupled Cation Disorder in Mg-Rw and Its Influences

One of the most puzzling issues about the Rw in the mantle transition zone is whether it attains cation-disordering to some degrees. As we mentioned before, Rw crystalizes into the spinel structure, which contains two cation sites, the T-sites and the M-sites. For some spinels with the general chemical formula AB2O4 (e.g., MgAl2O4-Sp), cation disordering, with some of the A and B cations (e.g., Mg and Al cations) exchanging their positions (e.g., some Mg cations usually appearing on the T-sites jump to the M-sites and some Al cations commonly docking on the M-sites relocate to the T-sites), has been well observed and intensely investigated [92]. Since cation disorder may significantly modify the physical and chemical properties of the spinel structure [8,9,95,96,97], it is fundamentally important to examine whether cation-disordering really happens to Rw.
Mg-Rw has been conventionally established as a normal spinel, with all Si cations on the T-sites and all Mg cations on the M-sites (i.e., [4](Si)[6](Mg2)O4). Its potential cation-disordering process can be adequately described by an inversion parameter, x, which stands for the reduction of the Si cations on the T-sites or the fraction of the Si cations appearing on the M-sites (i.e., [4](Si1-xMgx)[6](Mg2-xSix)O4). Apparently, x = 0 refers to an Mg-Rw having a normal spinel structure, x = 2/3 an Mg-Rw having a completely disordered spinel structure, and x = 1 an Mg-Rw having an inverse spinel structure. The single-crystal X-ray diffraction study of Sasaki et al. [79] suggested x = 0.2 for their nominally anhydrous Mg-Rw, indicating a partial cation-disordering status. This result, however, is hardly conclusive because of the similarity in the scattering factors of Mg and Si. The single-crystal X-ray diffraction study of Hazen et al. [98], performed with some nominally anhydrous iron-bearing Rw, suggested x = ~0.04, indicating a very limited degree of cation-disordering. The 29Si NMR studies of Stebbins et al. [55,99] suggested x < 0.02 for their anhydrous or hydrous Mg-Rw. Recently, the Raman spectroscopic investigation of Liu et al. [10] suggested x = 0.667 for the small amount of Si cations in the disordered MgAl2O4-Sp, hinting a possibility of a fully disordered Si status in the Mg-Rw. To explain the limited cation-disordering status usually experimentally observed for the Mg-Rw, Liu et al. [10] resorted to the T-quench process at high P which might have severely reordered the cations, and led to the usually observed normal spinel structure. Indeed, there has been trace evidence preserved in a meteoritic Rw grain, with one part of the grain being colorless and indicating an inverse spinel structure whereas the other part being blue and suggesting an undetermined degree of cation disorder [100]. The quick T-quench process experienced by the meteoritic Rw, much faster than in a high-P experiment [101,102], must have helped the preservation of the high-T cation configuration.
The cation disorder issue in anhydrous Rw remains unclear [79,96,98,100], but it is very obvious in hydrous Rw. As the hydrogen defects [VMg(OH)2MgSiSiMg] is dominant in hydrous Rw at the P-T conditions of the mantle transition zone, there must be a water-coupled cation disorder to some degree.
The best way to resolve the cation-disordering issue of the hydrous Rw is presumably to systematically perform in situ high-T single-crystal X-ray diffraction experiments, as done by Ye et al. [22,23]. Thus far, Ye et al. [23] reported the most comprehensive in situ structural analyses of one water-rich Mg-Rw crystal (SZ0820) at T up to ~463 °C. They observed an irreversible unit-cell expansion above ~313 °C, and proposed that the irreversible unit-cell expansion could be attributed to some hydrogen migration from the M-sites to the T-sites, with the substituted Si cations relocating to nearby empty M-sites (16c). Due to the limited resolution of the single-crystal X-ray diffraction data and lacking high-T IR data, however, the role of the cation-disordering was somewhat uncertain. Our extensive IR data reported in this study can make some semi-quantitative assessment on their proposal.
The crystal used in Ye et al. [23] was synthesized also at the Bayerisches Geoinstitut, Germany, with the P-T conditions (~20 GPa and 1250 °C) similar to our Run 4753 (~23 GPa and 1500 °C). Its water content, ~1.77(35) wt%, is similar to our high-H2O Mg-Rw (~1.63(12)%). Using Figure 13, we can estimate its Mg:Si ratio as ~1.87 and its chemical formula then as Mg1.87SiH0.26O4. Since the hydrogen defects [VMg(OH)2MgSiSiMg] should be dominant at the synthesizing P-T conditions, its structural formula can be approximated as [4](Si0.87Mg0.13)[6](Mg1.74Si0.13H0.26)O4), and its inversion parameter x as 0.13. When the synthesizing experiment quenched to room T, some protons might migrate into the T-sites, leading to the formation of the weak IR peak at ~3688 cm−1. If we assume that the synthesizing experiment SZ0820 of Ye et al. [23] and our Run 4753 experienced similar quench processes, we can estimate the amount of protons that migrated. Our IR spectrum 4753-01-01 suggests that the ratio of the water on the T-sites and the M-sites is ~0.61. This means ~0.67% H2O on the T-sites and 1.10% H2O on the M-sites of the quenched Mg-Rw from the experiment SZ0820. Accompanying the hydrogen migration, all Mg and Si cations have been completely reordered (i.e., x = 0), as indicated by the single-crystal X-ray diffraction data at room P and T [23].
The size of the water-rich Mg-Rw crystal used in the in-situ single-crystal X-ray diffraction experiments of Ye et al. [23] was ~100 × 85 × 70 μm3, with its smallest dimension much comparable to the thickness of the thin sections used in our annealing experiments (from 52 to 69 μm). At every experimental T, the data-collecting time was ~4 h. According to the IR results of our annealing experiments (Figure 10 and Figure 12), water lost from this crystal should have been minimum at T ≤ 313 °C, but gradually become more important at higher experimental temperatures of 362, 412 and 463 °C. Any sudden and complete dehydration should not be anticipated due to the large size of the crystal and the relative low experimental T. Indeed, no abrupt volume reduction caused by a substantial water-losing had ever been observed by the in situ experiments. The crystal structures at 362, 412 and 463 °C then should be better viewed as partially dehydrated Mg-Rw, with the dehydration extent increasing with T increase. On the base of the water evolution in our annealed thin sections (Figure 12), we may assume that ~50% water (likely a low value) was eventually lost after collecting the in situ single-crystal X-ray diffraction data at 463 °C, and then ~0.88% H2O retained in the quenched crystal. Our IR spectra 1589-05-02 and 1589-06-02 show that the ratio of the integrated absorptions for the regions of ~3800–3550 cm−1 and ~3550–3000 cm−1 is ~0.5. Taking into account the effects of the mean wavenumbers of these two IR features (roughly ~3660 and 3450 cm−1, respectively) on the molar absorption coefficients [40], the ratio of the contents of the water on the T-sites and on the M-sites should be ~0.96. This means ~0.43% H2O on the T-sites and ~0.45% H2O on the M-sites of the quenched Mg-Rw from the high-T single-crystal X-ray diffraction experiments at room P. Consequently, water on the T-sites and water on the M-sites simultaneously diffused out at high T, requiring no hydrogen migration from the M-sites to the T-sites.
It follows that the irreversible unit-cell expansion observed by Ye et al. [23] is best explained by some Mg-Si cation-disordering triggered by high T, rather than by hydrogen migration from the M-sites to the T-sites. This cation-disordering process in the Mg-Rw is likely slow at low T, but becomes fast at high T, as in the case for the MgAl2O4-spinel [92]. Due to the very quick quench process in the single-crystal X-ray diffraction experiments at room P, the cation-disorder state achieved at high T can be at least partially preserved, leading to the irreversible unit-cell expansion. Indeed, the structural refinements using the in situ X-ray diffraction data collected at 362, 412 and 463 °C, respectively, suggested x = 0.05(2), x = 0.05(2) and x = 0.07(2), and those using the X-ray diffraction data collected on the crystal quenched from these temperatures to room T suggested x = 0.04(2), x = 0.06(2) and x = 0.09(2), respectively [23].
One interesting observation pertinent to the Mg-Si cation-disordering at high T reported by Ye et al. [23] is that the relocated Si cations may appear not on the 16d M-sites usually filled by the Mg cations, but on the normally vacant 16c M-sites at (1/2, 1/2, 0). In comparison, Smyth et al. [44] observed a potential partial occupation of the normally vacant T-sites at (5/8, 5/8, 5/8) by Mg cations. These phenomena are very important, and deserve further investigation.
Theoretical results have suggested that the Mg-Si cation-disordering may have great impacts on many physical and chemical properties of the Mg-Rw, e.g., a 12.5% Si-Mg disorder decreasing the seismic velocities by ~3%–5% [9,96]. Experimental evidence is lacking though. Here, we can demonstrate a couple of examples. As shown by the solid blue arrow in Figure 15, the effect of the cation disordering on the volume of the partially dehydrated Mg-Rw is very large, ~1.1% volume expansion for a ~10% cation disorder, which is significantly larger than predicted for anhydrous Mg-Rw by the simplified model of Hazen and Yang ([8]; the broken blue arrow). If one takes into account the influences on the volumes of the various water contents in these structures quenched from 362, 412 and 463 °C, the solid blue arrow then goes steeper, implying an even larger effect. The second example is an exceedingly large effect on the thermal expansivity of the partially dehydrated Mg-Rw [23]. As the fraction of the Si cations on the T-sites reduces at 362, 412 and 463 °C, some Mg cations enter the T-sites, which makes the T-sites much larger and softer, and the tetrahedra expand more easily. This results in a much larger thermal expansivity for the Mg-Rw at these high temperatures, demonstrated by the nearly identical volume expansions for the T intervals of 30–313 °C and 362–463 °C (the black double-headed arrow vs. the red double-headed arrow in Figure 15). If one takes into account the influences on the volumes of the various water contents in these structures at 362, 412 and 463 °C, the red double-headed arrow should extend its length, implying an even larger effect for the cation-disordering process.
Many experiments have been carried out to investigate the physical properties of Rw (hydrous or anhydrous), with the materials synthesized by conventional high-P techniques. It is highly possible that these materials were severely modified by the quench process, with poor preservations of the cation disorder states once attained at high P-T conditions [10,55,79,99]. Note the large difference between the experimentally determined x value at ambient P-T conditions (~0; Figure 15) and the potential x value (close to ~0.13) predicted for the hydrous Mg-Rw with ~1.77% H2O at high P-T conditions (Figure 13; ignoring any possible effects of the unlike minor hydrogen defects [VSi(OH)4] and [VMg(OH)2]). It is also highly possible that the Mg-Si disordering process in the Rw is kinetically much slower than the Mg-Si ordering process, similar to the well-investigated Mg-Al order-disorder process in the MgAl2O4 spinel [92]. Therefore, in those experiments with quench-modified Rw performed at relatively low T, say ≤400 °C, the cation-disordering process might have not been successfully triggered, and the results might not be applicable to the Earth. In those experiments performed at relatively high T but with generally limited experimental dwelling time at every T (like that in the sound velocity measurement), the cation-disordering process might have been started, but equilibrated cation distributions might have never been achieved. The measurements then might reflect a mélange of changing Mg-Si order-disorder states of the Rw [8], and the results should be viewed with great caution.

4. Conclusions

  • With extensive IR spectroscopic measurements performed on a large number of thin sections of different thickness and different CH2O, we have found at least up to ~15 IR water peaks for hydrous Mg-Rw quenched from conventional high-P experiments, suggesting multiple types of hydrogen defects in the Rw structure.
  • There are many significant variations in the IR spectra of hydrous Mg-Rw at high T, as observed from thin sections annealed and quickly quenched from different T to room T. The major variations include an absorption enhancement of the peak at ~3680 cm−1, some new peaks occurring at ~3510 and 3461 cm−1 and significant absorption reductions of the peaks at ~2550 cm−1, signifying hydrogen migration among different crystallographic sites and rearrangement of the O-H dipoles in hydrous Rw at high T.
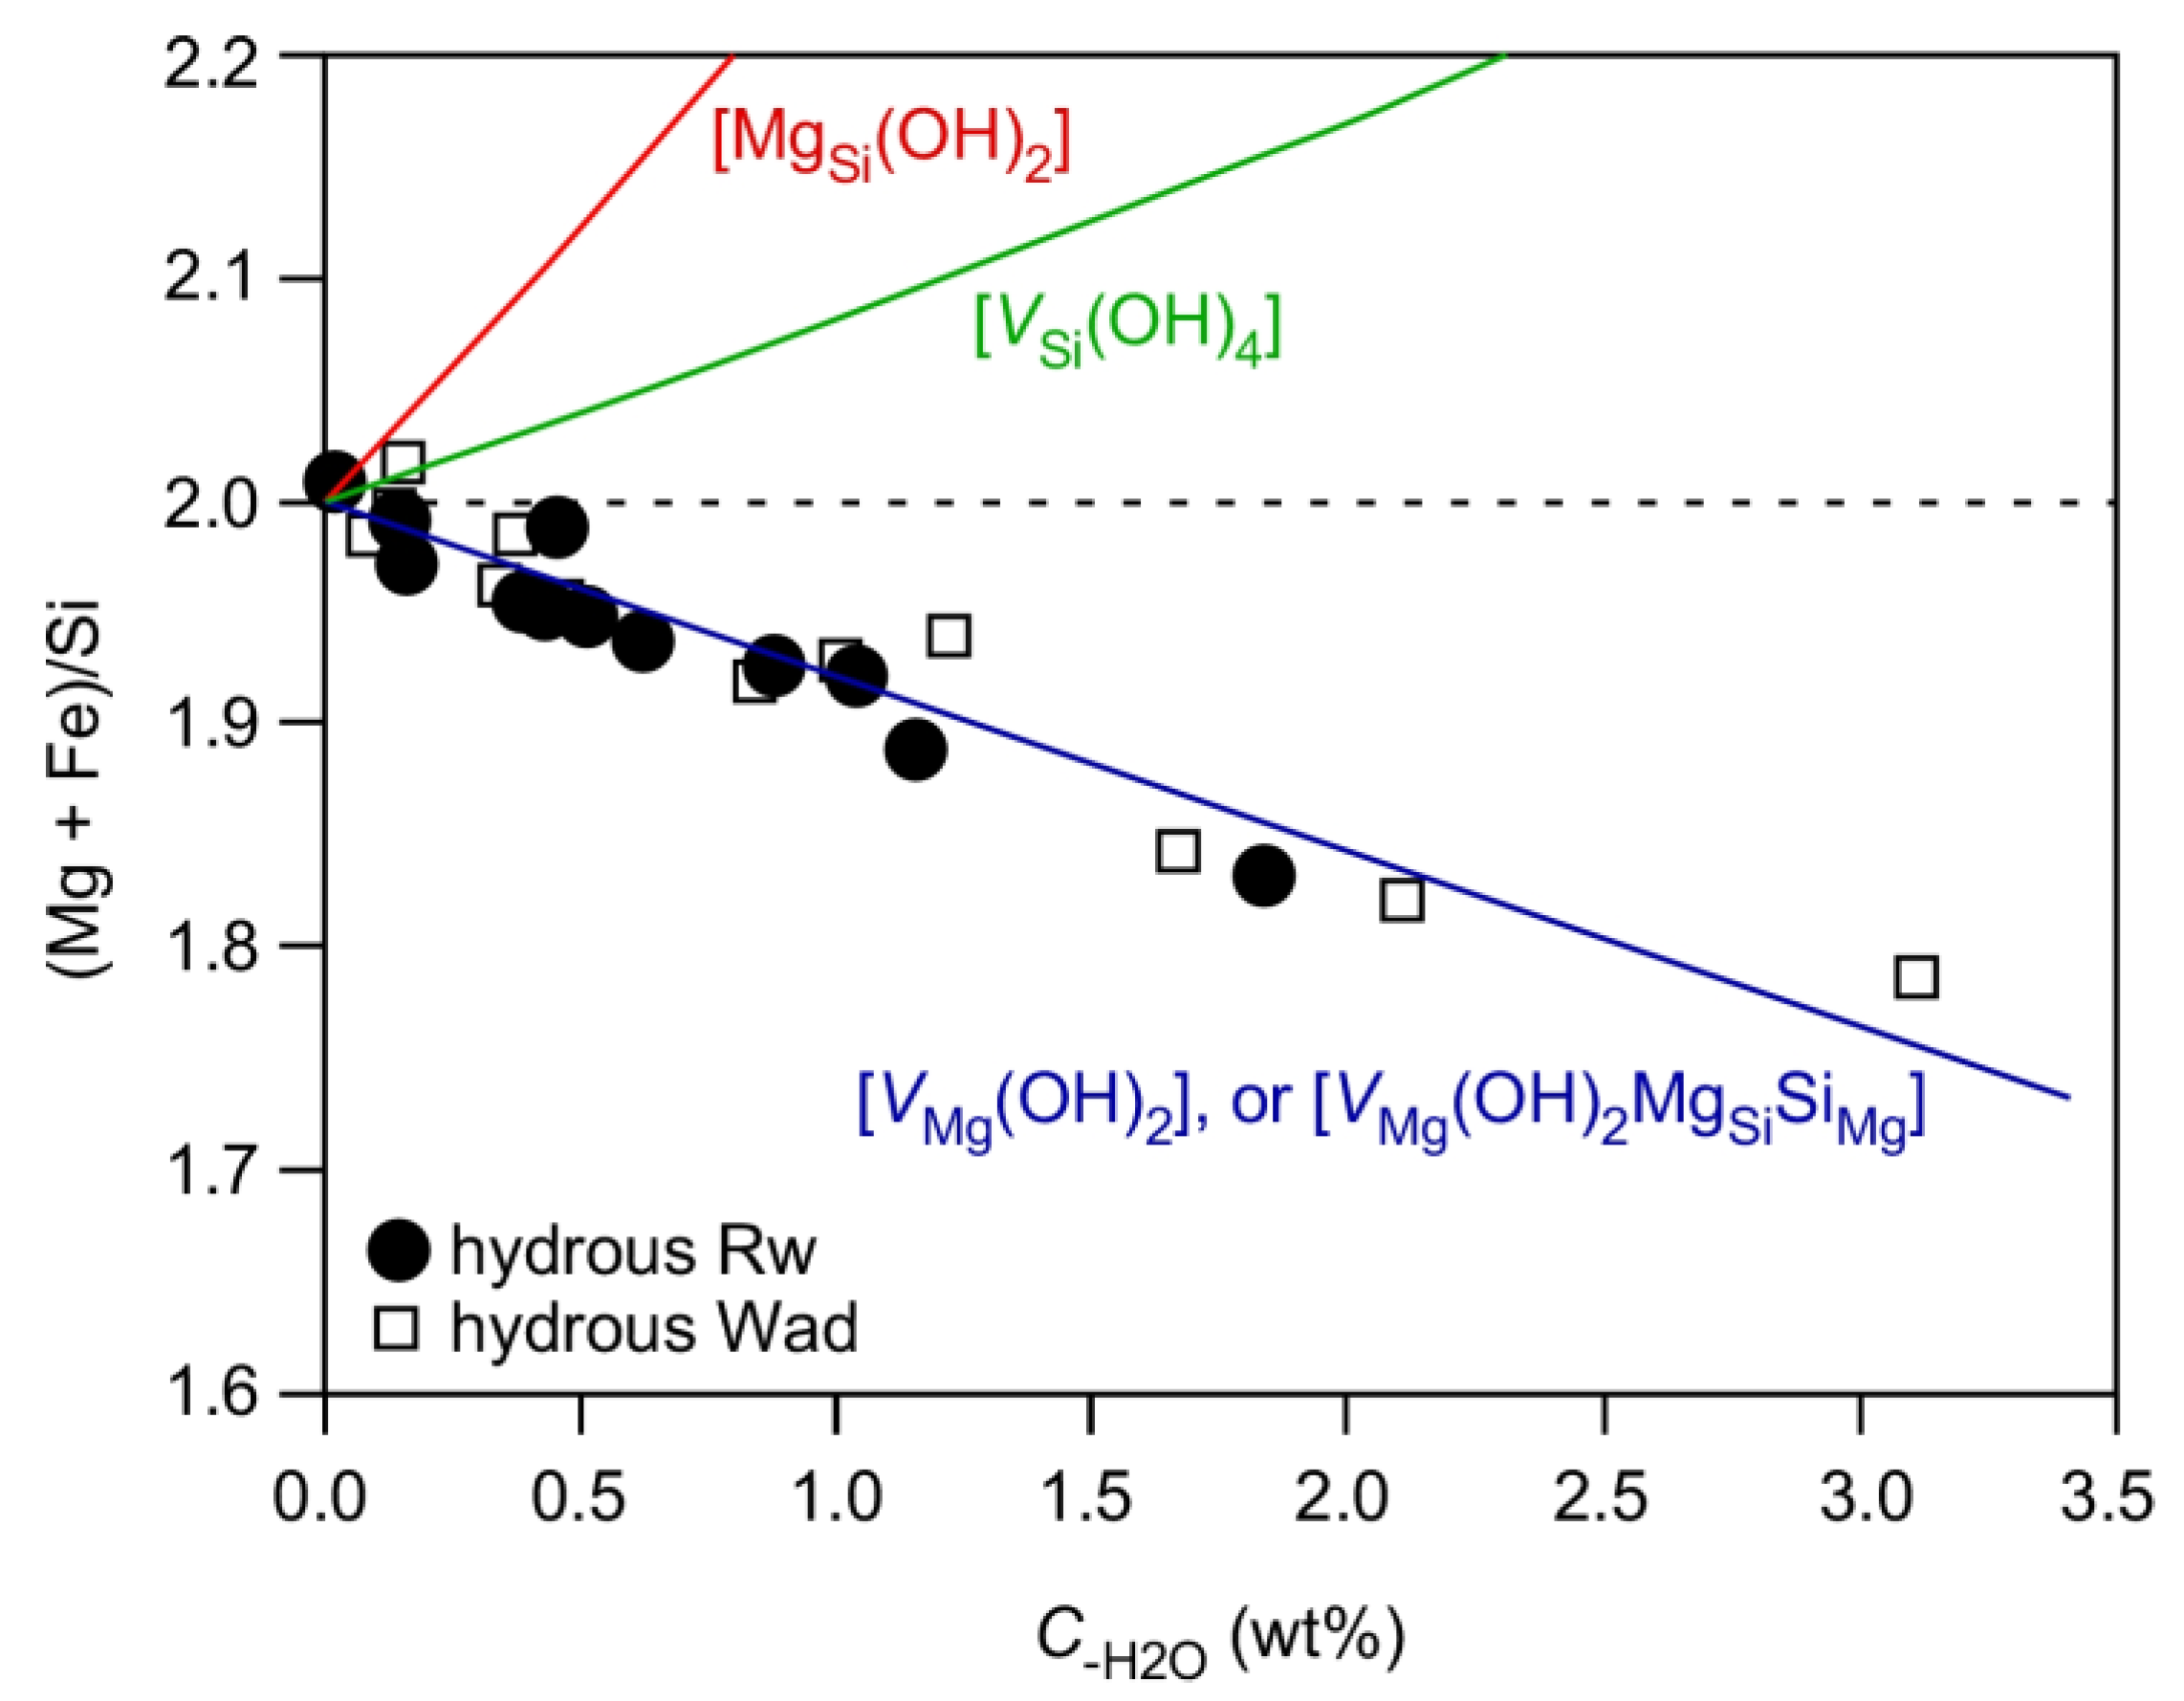
  • The IR peaks at ~3680, 3650–3000 and 3000–2000 cm−1 have been attributed to the hydrogen defects [VSi(OH)4], [VMg(OH)2MgSiSiMg] and [VMg(OH)2], respectively. The hydrogen defects [VMg(OH)2MgSiSiMg] are dominant in hydrous Rw at high P-T conditions, in good agreement with the chemical characteristics of hydrous Rw. Both the defects [VSi(OH)4] and the defects [VMg(OH)2] may play minor roles whereas the defects [MgSi(OH)2] may not operate at all.
  • Substantial amounts of cation disorder should be present in hydrous Rw, as required by the formation of the hydrogen defects [VMg(OH)2MgSiSiMg]. The Mg-Si disorder may have very large effects on the physical and chemical properties, as exampled by the effects on the unit-cell volume and thermal expansivity. These effects should be carefully investigated in future.

Author Contributions

X.L., designing and supervising the project, interpreting and finalizing the results and writing the paper; Z.S., preparing the thin sections, collecting the infrared spectra and preparing drafts of the figures; H.F., conducting the high-P synthesizing experiments and interpreting the results. W.Y., collecting and interpreting the IR data. Y.M., discussing and interpreting the results. Y.Y., discussing and interpreting the results. All authors have read and agreed to the published version of the manuscript.

Funding

This study is financially supported by the Strategic Priority Research Program (B) of the Chinese Academy of Sciences (Grant No. XDB18000000) and by the DREAM Project of MOST, China (Grant No. 2016YFC0600408).

Acknowledgments

We thank H. Ding from Peking University for the technical support to the Raman analyses. We thank two anonymous reviewers who made very detailed and constructive comments on this paper.

Conflicts of Interest

The authors declare no conflict of interest.

References

  1. Anderson, D.L.; Bass, J.D. Transition region of the Earth’s upper mantle. Nature 1986, 320, 321–328. [Google Scholar] [CrossRef]
  2. Irifune, T.; Ringwood, A.E. Phase transformation in primitive MORB and pyrolite compositions to 25 GPa and some geophysical implications. High Press. Res. Miner. Phys. 1987, 39, 235–246. [Google Scholar]
  3. Fei, Y.; Bertka, C.M. Phase transitions in the Earth’s mantle and mantle mineralogy. Mantle Petrol. 1999, 6, 189–207. [Google Scholar]
  4. Frost, D.J. The upper mantle and transition zone. Elements 2008, 4, 171–176. [Google Scholar] [CrossRef]
  5. Hazen, R.M. Comparative compressibilities of silicate spinels: anomalous behavior of (Mg,Fe)2SiO4. Science 1993, 259, 206–209. [Google Scholar] [CrossRef] [Green Version]
  6. Higo, Y.; Inoue, T.; Li, B.; Irifune, T.; Liebermann, R.C. The effect of iron on the elastic properties of ringwoodite at high pressure. Phys. Earth Planet. Inter. 2006, 159, 276–285. [Google Scholar] [CrossRef]
  7. Liu, X.; Xiong, Z.; Chang, L.; He, Q.; Wang, F.; Shieh, S.R.; Wu, C.; Li, B.; Zhang, L. Anhydrous ringwoodites in the mantle transition zone: their bulk modulus, solid solution behavior, compositional variation, and sound velocity feature. Solid Earth Sci. 2016, 1, 28–47. [Google Scholar] [CrossRef] [Green Version]
  8. Hazen, R.M.; Yang, H. Effects of cation substitution and order-disorder on P-V-T equations of state of cubic spinels. Am. Miner. 1999, 84, 1956–1960. [Google Scholar] [CrossRef]
  9. Li, L.; Carrez, P.; Weidner, D. Effect of cation ordering and pressure on spinel elasticity by ab initio simulation. Am. Miner. 2007, 92, 174–178. [Google Scholar] [CrossRef]
  10. Liu, L.; Liu, X.; Bao, X.; He, Q.; Yan, W.; Ma, Y.; He, M.; Tao, R.; Zou, R. Si-disordering in MgAl2O4-spinel under high P-T conditions, with implications for Si-Mg disorder in Mg2SiO4-ringwoodite. Minerals 2018, 8, 210. [Google Scholar] [CrossRef] [Green Version]
  11. Ohtani, E.; Mizobata, H.; Yurimoto, H. Stability of dense hydrous magnesium silicate phases in the systems Mg2SiO4-H2O and MgSiO3-H2O at pressures up to 27 GPa. Phys. Chem. Miner. 2000, 27, 533–544. [Google Scholar] [CrossRef]
  12. Fei, H.; Katsura, T. High water solubility of ringwoodite at mantle transition zone temperature. Earth Planet. Sci. Lett. 2020, 531, 115987. [Google Scholar] [CrossRef]
  13. Kohlstedt, D.L.; Keppler, H.; Rubie, D.C. Solubility of water in the α, β and γ phases of (Mg,Fe)2 SiO4. Contrib. Miner. Pet. 1996, 123, 345–357. [Google Scholar] [CrossRef]
  14. Inoue, T.; Weidner, D.J.; A Northrup, P.; Parise, J.B. Elastic properties of hydrous ringwoodite (γ-phase) in Mg2SiO4. Earth Planet. Sci. Lett. 1998, 160, 107–113. [Google Scholar] [CrossRef]
  15. Yusa, H.; Inoue, T.; Ohishi, Y. Isothermal compressibility of hydrous ringwoodite and its relation to the mantle discontinuities. Geophys. Res. Lett. 2000, 27, 413–416. [Google Scholar] [CrossRef]
  16. Koch-Müller, M.; Rhede, D.; Schulz, R.; Wirth, R. Breakdown of hydrous ringwoodite to pyroxene and spinelloid at high P and T and oxidizing conditions. Phys. Chem. Miner. 2008, 36, 329–341. [Google Scholar] [CrossRef] [Green Version]
  17. Ghosh, S.; Ohtani, E.; Litasov, K.; Suzuki, A.; Dobson, D.P.; Funakoshi, K. Effect of water in depleted mantle on post-spinel transition and implication for 660km seismic discontinuity. Earth Planet. Sci. Lett. 2013, 371, 103–111. [Google Scholar] [CrossRef]
  18. Litasov, K.D.; Ohtani, E. Effect of water on the phase relations in Earth’s mantle and deep water cycle—Special Paper. Geol. Soc. Am. 2007, 421, 115–156. [Google Scholar]
  19. Schmandt, B.; Jacobsen, S.; Becker, T.W.; Liu, Z.; Dueker, K.G. Dehydration melting at the top of the lower mantle. Science 2014, 344, 1265–1268. [Google Scholar] [CrossRef]
  20. Suzuki, I.; Ohtani, E.; Kumazawa, M. Thermal expansion of modified spinel, γ-Mg2SiO4. J. Phys. Earth 1980, 28, 273–280. [Google Scholar] [CrossRef]
  21. Inoue, T.; Tanimoto, Y.; Irifune, T.; Suzuki, T.; Fukui, H.; Ohtaka, O. Thermal expansion of wadsleyite, ringwoodite, hydrous wadsleyite and hydrous ringwoodite. Phys. Earth Planet. Inter. 2004, 143–144, 279–290. [Google Scholar] [CrossRef]
  22. Ye, Y.; Schwering, R.A.; Smyth, J. Effects of hydration on thermal expansion of forsterite, wadsleyite, and ringwoodite at ambient pressure. Am. Miner. 2009, 94, 899–904. [Google Scholar] [CrossRef]
  23. Ye, Y.; Brown, D.A.; Smyth, J.; Panero, W.R.; Jacobsen, S.; Chang, Y.-Y.; Townsend, J.P.; Thomas, S.-M.; Hauri, E.H.; Dera, P.; et al. Compressibility and thermal expansion of hydrous ringwoodite with 2.5(3) wt% H2O. Am. Miner. 2012, 97, 573–582. [Google Scholar] [CrossRef]
  24. Jacobsen, S.D.; Smyth, J.R.; Spetzler, H.; Holl, C.M.; Frost, D.J. Sound velocities and elastic constants of iron-bearing hydrous ringwoodite. Phys. Earth Planet. Inter. 2004, 143–144, 47–56. [Google Scholar] [CrossRef]
  25. Chang, Y.-Y.; Jacobsen, S.; Bina, C.R.; Thomas, S.-M.; Smyth, J.R.; Frost, D.J.; Ballaran, T.B.; McCammon, C.A.; Hauri, E.H.; Inoue, T.; et al. Comparative compressibility of hydrous wadsleyite and ringwoodite: Effect of H2O and implications for detecting water in the transition zone. J. Geophys. Res. Solid Earth 2015, 120, 8259–8280. [Google Scholar] [CrossRef]
  26. Chen, J.; Weidner, D.; Vaughan, M.; Inoue, T.; Wu, Y. Strength and water weakening of mantle minerals, olivine, wadsleyite and ringwoodite. Geophys. Res. Lett. 1998, 25, 575–578. [Google Scholar] [CrossRef]
  27. Kavner, A. Elasticity and strength of hydrous ringwoodite at high pressure. Earth Planet. Sci. Lett. 2003, 214, 645–654. [Google Scholar] [CrossRef]
  28. Fei, H.; Yamazaki, D.; Sakurai, M.; Miyajima, N.; Ohfuji, H.; Katsura, T.; Yamamoto, T. A nearly water-saturated mantle transition zone inferred from mineral viscosity. Sci. Adv. 2017, 3, e1603024. [Google Scholar] [CrossRef] [Green Version]
  29. Wang, J.; Sinogeikin, S.V.; Inoue, T.; Bass, J.D. Elastic properties of hydrous ringwoodite. Am. Miner. 2003, 88, 1608–1611. [Google Scholar] [CrossRef]
  30. Mao, Z.; Lin, J.-F.; Jacobsen, S.D.; Duffy, T.S.; Chang, Y.-Y.; Smyth, J.R.; Frost, D.J.; Hauri, E.H.; Prakapenka, V.B. Sound velocities of hydrous ringwoodite at 16 GPa and 673 K. Earth Planet. Sci. Lett. 2012, 331–332, 112–119. [Google Scholar] [CrossRef]
  31. Schulze, K.; Marquardt, H.; Kawazoe, T.; Boffa Ballaran, T.; McCammon, C.; Koch-Müller, M.; Kurnosov, A.; Marquardt, K. Seismically invisible water in Earth’s transition zone? Earth Planet. Sci. Lett. 2018, 498, 9–16. [Google Scholar] [CrossRef] [Green Version]
  32. Huang, X.; Xu, Y.; Karato, S.-I. Water content in the transition zone from electrical conductivity of wadsleyite and ringwoodite. Nature 2005, 434, 746–749. [Google Scholar] [CrossRef] [PubMed]
  33. Yoshino, T.; Matsuzaki, T.; Shatskiy, A.; Katsura, T. The effect of water on the electrical conductivity of olivine aggregates and its implications for the electrical structure of the upper mantle. Earth Planet. Sci. Lett. 2009, 288, 291–300. [Google Scholar] [CrossRef]
  34. Zhang, B.; Yoshino, T.; Zhao, C. The effect of water on Fe-Mg interdiffusion rates in ringwoodite and implications for the electrical conductivity in the mantle transition zone. J. Geophys. Res. Solid Earth 2019, 124, 2510–2524. [Google Scholar] [CrossRef]
  35. Keppler, H.; Smyth, J.R. Optical and near infrared spectra of ringwoodite to 21.5 GPa: Implications for radiative heat transport in the mantle. Am. Miner. 2005, 90, 1209–1212. [Google Scholar] [CrossRef]
  36. Thomas, S.-M.; Bina, C.R.; Jacobsen, S.; Goncharov, A.F. Radiative heat transfer in a hydrous mantle transition zone. Earth Planet. Sci. Lett. 2012, 357, 130–136. [Google Scholar] [CrossRef]
  37. Pearson, D.G.; Brenker, F.E.; Nestola, F.; McNeill, J.; Nasdala, L.; Hutchison, M.T.; Matveev, S.; Mather, K.; Silversmit, G.; Schmitz, S.; et al. Hydrous mantle transition zone indicated by ringwoodite included within diamond. Nature 2014, 507, 221–224. [Google Scholar] [CrossRef]
  38. Thomas, S.-M.; Jacobsen, S.; Bina, C.R.; Reichart, P.; Moser, M.; Hauri, E.H.; Koch-Müller, M.; Smyth, J.; Dollinger, G. Quantification of water in hydrous ringwoodite. Front. Earth Sci. 2015, 2, 38. [Google Scholar] [CrossRef] [Green Version]
  39. Blanchard, M.; Wright, K.; Gale, J.D. A computer simulation study of OH defects in Mg2SiO4 and Mg2GeO4 spinels. Phys. Chem. Miner. 2005, 32, 585–593. [Google Scholar] [CrossRef]
  40. Blanchard, M.; Balan, E.; Wright, K. Incorporation of water in iron-free ringwoodite: A first-principles study. Am. Miner. 2009, 94, 83–89. [Google Scholar] [CrossRef]
  41. Li, L.; Brodholt, J.; Alfè, D. Structure and elasticity of hydrous ringwoodite: A first principle investigation. Phys. Earth Planet. Inter. 2009, 177, 103–115. [Google Scholar] [CrossRef]
  42. Panero, W.R. First principles determination of the structure and elasticity of hydrous ringwoodite. J. Geophys. Res. Space Phys. 2010, 115, 03203. [Google Scholar] [CrossRef]
  43. Kudoh, Y.; Kuribayashi, T.; Mizobata, H.; Ohtani, E. Structure and cation disorder of hydrous ringwoodite, γ-Mg1.89 Si0.98 H0.30 O4. Phys. Chem. Miner. 2000, 27, 474–479. [Google Scholar] [CrossRef]
  44. Smyth, J.R.; Holl, C.M.; Frost, D.J.; Jacobsen, S.; Langenhorst, F.; McCammon, C. Structural systematics of hydrous ringwoodite and water in Earth’s interior. Am. Miner. 2003, 88, 1402–1407. [Google Scholar] [CrossRef]
  45. Purevjav, N.; Okuchi, T.; Tomioka, N.; Abe, J.; Harjo, S. Hydrogen site analysis of hydrous ringwoodite in mantle transition zone by pulsed neutron diffraction. Geophys. Res. Lett. 2014, 41, 6718–6724. [Google Scholar] [CrossRef]
  46. Liu, L.; Lin, C.-C.; Mernagh, T.P.; Inoue, T. Raman spectra of hydrous γ-Mg2SiO4 at various pressures and temperatures. Phys. Chem. Miner. 2002, 29, 181–187. [Google Scholar] [CrossRef]
  47. Kleppe, A.K.; Jephcoat, A.P.; Smyth, J.; Frost, D.J. On protons, iron and the high-pressure behavior of ringwoodite. Geophys. Res. Lett. 2002, 29, 171–174. [Google Scholar] [CrossRef] [Green Version]
  48. Kleppe, A.K.; Jephcoat, A.P.; Smyth, J.R. Raman spectroscopy study of hydrous γ-Mg2SiO4 to 56.5 GPa. Phys. Chem. Miner. 2002, 29, 473–476. [Google Scholar] [CrossRef]
  49. Bolfan-Casanova, N. Water partitioning between nominally anhydrous minerals in the MgO–SiO2–H2O system up to 24 GPa: Implications for the distribution of water in the Earth’s mantle. Earth Planet. Sci. Lett. 2000, 182, 209–221. [Google Scholar] [CrossRef]
  50. Litasov, K.; Ohtani, E. Stability of various hydrous phases in CMAS pyrolite-H2O system up to 25 GPa. Phys. Chem. Miner. 2003, 30, 147–156. [Google Scholar] [CrossRef]
  51. Chamorro Pérez, E.M.; Daniel, I.; Chervin, J.-C.; Dumas, P.; Bass, J.D.; Inoue, T. Synchrotron IR study of hydrous ringwoodite (γ-Mg2SiO4) up to 30 GPa. Phys. Chem. Miner. 2006, 33, 502–510. [Google Scholar] [CrossRef]
  52. Mrosko, M.; Lenz, S.; McCammon, C.A.; Taran, M.; Wirth, R.; Koch-Müller, M. Hydrogen incorporation and the oxidation state of iron in ringwoodite: A spectroscopic study. Am. Miner. 2013, 98, 629–636. [Google Scholar] [CrossRef]
  53. Panero, W.R.; Smyth, J.; Pigott, J.S.; Liu, Z.; Frost, D.J. Hydrous ringwoodite to 5 K and 35 GPa: Multiple hydrogen bonding sites resolved with FTIR spectroscopy. Am. Miner. 2013, 98, 637–642. [Google Scholar] [CrossRef]
  54. Yang, X.; Keppler, H.; Dubrovinsky, L.; Kurnosov, A. In-situ infrared spectra of hydroxyl in wadsleyite and ringwoodite at high pressure and high temperature. Am. Miner. 2014, 99, 724–729. [Google Scholar] [CrossRef]
  55. Stebbins, J.F.; Smyth, J.; Panero, W.R.; Frost, D.J. Forsterite, hydrous and anhydrous wadsleyite and ringwoodite (Mg2SiO4): 29Si NMR results for chemical shift anisotropy, spin-lattice relaxation, and mechanism of hydration. Am. Miner. 2009, 94, 905–915. [Google Scholar] [CrossRef]
  56. Bolfan-Casanova, N.; Schiavi, F.; Novella, D.; Bureau, H.; Raepsaet, C.; Khodja, H.; Demouchy, S. Examination of water quantification and incorporation in transition zone minerals: wadsleyite, ringwoodite and phase D using ERDA (Elastic Recoil Detection Analysis). Front. Earth Sci. 2018, 6, 75. [Google Scholar] [CrossRef]
  57. Koch-Müller, M.; Rhede, D. IR absorption coefficients for water in nominally anhydrous high-pressure minerals. Am. Miner. 2010, 95, 770–775. [Google Scholar] [CrossRef] [Green Version]
  58. Rossman, G.R. Chapter 6. Vibrational spectroscopy of hydrous components. Spectrosc. Methods Mineral. Geol. 1988, 18, 193–206. [Google Scholar] [CrossRef]
  59. Rossman, G. Analytical methods for measuring water in nominally anhydrous minerals. Rev. Miner. Geochem. 2006, 62, 1–28. [Google Scholar] [CrossRef]
  60. McMillan, P.F.; Hofmeister, A.M. Infrared and Raman spectroscopy. Rev. Mineral. 1988, 18, 99–159. [Google Scholar]
  61. Libowitzky, E.; Beran, A.; Papp, G. IR spectroscopic characterisation of hydrous species in minerals. Spectrosc. Methods Mineral. 2004, 6, 227–279. [Google Scholar] [CrossRef]
  62. Hofmeister, A.; Mao, H. Evaluation of shear moduli and other properties of silicates with the spinel structure from IR spectroscopy. Am. Miner. 2001, 86, 622–639. [Google Scholar] [CrossRef]
  63. Ma, Y.; Yan, W.; Sun, Q.; Liu, X. Raman and infrared spectroscopic quantification of the carbonate concentration in K2CO3 aqueous solutions with water as an internal standard. Geosci. Front. 2020. [Google Scholar] [CrossRef]
  64. Kovács, I.; O’Neill, H.S.C.; Hermann, J.; Hauri, E.H. Site-specific infrared O-H absorption coefficients for water substitution into olivine. Am. Miner. 2010, 95, 292–299. [Google Scholar] [CrossRef]
  65. Wang, F.; Liu, X.; Zheng, H.; Zhang, L. Anharmonic vibration of the SiO4 tetrahedron in olivine at temperatures in the subduction zone: An infrared absorbance spectroscopic study. Acta Petrol. Sin. 2015, 31, 1891–1900. [Google Scholar]
  66. Liu, X.; Ma, Y.; He, Q.; He, M. Some IR features of SiO4 and OH in coesite, and its amorphization and dehydration at ambient pressure. J. Asian Earth Sci. 2017, 148, 315–323. [Google Scholar] [CrossRef]
  67. Libowitzky, E.; Rossman, G. An IR absorption calibration for water in minerals. Am. Miner. 1997, 82, 1111–1115. [Google Scholar] [CrossRef]
  68. He, M.; Yan, W.; Chang, Y.-D.; Liu, K.; Liu, X. Fundamental infrared absorption features of α-quartz: An unpolarized single-crystal absorption infrared spectroscopic study. Vib. Spectrosc. 2019, 101, 52–63. [Google Scholar] [CrossRef]
  69. Lu, A.; Li, Y.; Ding, H.; Xu, X.; Li, Y.; Ren, G.; Liang, J.; Liu, Y.; Hong, H.; Chen, N.; et al. Photoelectric conversion on Earth’s surface via widespread Fe- and Mn-mineral coatings. Proc. Natl. Acad. Sci. USA 2019, 116, 9741–9746. [Google Scholar] [CrossRef] [Green Version]
  70. Bolfan-Casanova, N.; Keppler, H.; Rubie, D.C. Water partitioning at 660 km depth and evidence for very low water solubility in magnesium silicate perovskite. Geophys. Res. Lett. 2003, 30. [Google Scholar] [CrossRef]
  71. Yu, Y.G.; Wentzcovitch, R.M. Density functional study of vibrational and thermodynamic properties of ringwoodite. J. Geophys. Res. Space Phys. 2006, 111, 12202. [Google Scholar] [CrossRef] [Green Version]
  72. Akaogi, M.; Ross, N.L.; McMillan, P.; Navrotsky, A. The Mg2SiO4 polymorphs (olivine, modified spinel and spinel)-thermodynamic properties from oxide melt solution calorimetry, phase relations, and models of lattice vibrations. Am. Mineral. 1984, 69, 499–512. [Google Scholar]
  73. Binns, R. (Mg,Fe)2SiO4 spinel in a meteorite. Phys. Earth Planet. Inter. 1970, 3, 156–160. [Google Scholar] [CrossRef]
  74. Koch-Müller, M.; Speziale, S.; Deon, F.; Mrosko, M.; Schade, U. Stress-induced proton disorder in hydrous ringwoodite. Phys. Chem. Miner. 2010, 38, 65–73. [Google Scholar] [CrossRef] [Green Version]
  75. Shinoda, K.; Aikawa, N. Polarized infrared absorbance spectra of an optically anisotropic crystal: Application to the orientation of the OH dipole in quartz. Phys. Chem. Miner. 1993, 20, 308–314. [Google Scholar] [CrossRef]
  76. Liu, X.; O’Neill, H.S.C.; Berry, A.J. The effects of small amounts of H2O, CO2 and Na2O on the partial melting of spinel lherzolite in the system CaO-MgO-Al2O3-SiO2 ± H2O ± CO2 ± Na2O at 1.1 GPa. J. Petrol. 2006, 47, 409–434. [Google Scholar] [CrossRef] [Green Version]
  77. Ganskow, G.; Ballaran, T.B.; Langenhorst, F. Effect of iron on the compressibility of hydrous ringwoodite. Am. Miner. 2010, 95, 747–753. [Google Scholar] [CrossRef]
  78. Bolfan-Casanova, N. Water in the Earth’s mantle. Miner. Mag. 2005, 69, 229–257. [Google Scholar] [CrossRef]
  79. Sasaki, S.; Prewitt, C.T.; Sato, Y.; Ito, E. Single-crystal X ray study of γ Mg2SiO4. J. Geophys. Res. Space Phys. 1982, 87, 7829–7832. [Google Scholar] [CrossRef]
  80. Hudson, R.L.; Gerakines, P.A.; Ferrante, R.F. IR spectra and properties of solid acetone, an interstellar and cometary molecule. Spectrochim. Acta Part A Mol. Biomol. Spectrosc. 2018, 193, 33–39. [Google Scholar] [CrossRef]
  81. Zhang, Y.; Belcher, R.; Ihinger, P.; Wang, L.; Xu, Z.; Newman, S. New calibration of infrared measurement of dissolved water in rhyolitic glasses. Geochim. Cosmochim. Acta 1997, 61, 3089–3100. [Google Scholar] [CrossRef]
  82. Scott, H.P.; Williams, Q. An infrared spectroscopic study of lawsonite to 20 GPa. Phys. Chem. Miner. 1999, 26, 437–445. [Google Scholar] [CrossRef]
  83. Lehmann, K.; Smith, A.M. Where does overtone intensity come from? J. Chem. Phys. 1990, 93, 6140–6147. [Google Scholar] [CrossRef]
  84. Matveev, S.; O’Neill, H.S.C.; Ballhaus, C.; Taylor, W.R.; Green, D. Effect of silica activity on OH-IR spectra of olivine: Implications for low-aSiO2 mantle metasomatism. J. Pet. 2001, 42, 721–729. [Google Scholar] [CrossRef] [Green Version]
  85. Mosenfelder, J.L.; Deligne, N.; Asimow, P.D.; Rossman, G. Hydrogen incorporation in olivine from 2–12 GPa. Am. Miner. 2006, 91, 285–294. [Google Scholar] [CrossRef]
  86. Liu, D.; Wang, S.; Smyth, J.R.; Zhang, J.; Wang, X.; Zhu, X.; Ye, Y. In situ infrared spectra for hydrous forsterite up to 1243 K: Hydration effect on thermodynamic properties. Minerals 2019, 9, 512. [Google Scholar] [CrossRef] [Green Version]
  87. Wang, Y.; He, M.; Yan, W.; Yang, M.; Liu, X. Jianite: Massive dunite solely made of virtually pure forsterite from Ji’an County, Jilin Province, Northeast China. Minerals 2020, 10, 220. [Google Scholar] [CrossRef] [Green Version]
  88. Paterson, M.S. The determination of hydroxyl by infrared absorption in quartz, silicate glasses and similar materials. Bull. Minéral. 1982, 105, 20–29. [Google Scholar] [CrossRef]
  89. Kubicki, J.D.; Sykes, D.; Rossman, G. Calculated trends of oh infrared stretching vibrations with composition and structure in aluminosilicate molecules. Phys. Chem. Miner. 1993, 20, 425–432. [Google Scholar] [CrossRef]
  90. Balan, E.; Refson, K.; Blanchard, M.; Delattre, S.; Lazzeri, M.; Ingrin, J.; Mauri, F.; Wright, K.; Winkler, B. Theoretical infrared absorption coefficient of OH groups in minerals. Am. Miner. 2008, 93, 950–953. [Google Scholar] [CrossRef]
  91. Kudoh, Y. Structural relation of hydrous ringwoodite to hydrous wadsleyite. Phys. Chem. Miner. 2001, 28, 523–530. [Google Scholar] [CrossRef]
  92. Ma, Y.; Liu, X. Kinetics and thermodynamics of Mg-Al disorder in MgAl2O4-spinel: A review. Molecules 2019, 24, 1704. [Google Scholar] [CrossRef] [Green Version]
  93. Nakamoto, K.; Margoshes, M.; Rundle, R.E. Stretching frequencies as a function of distances in hydrogen bonds. J. Am. Chem. Soc. 1955, 77, 6480–6486. [Google Scholar] [CrossRef]
  94. Libowitzky, E. Correlation of O-H stretching frequencies and O-H…O hydrogen bond lengths in minerals. Mon. Chem. Chem. Mon. 1999, 130, 1047–1059. [Google Scholar] [CrossRef]
  95. Kiefer, B.; Stixrude, L.; Wentzcovitch, R. Normal and inverse ringwoodite at high pressures. Am. Miner. 1999, 84, 288–293. [Google Scholar] [CrossRef]
  96. Panero, W.R. Cation disorder in ringwoodite and its effects on wave speeds in the Earth’s transition zone. J. Geophys. Res. 2008, 113, B10204. [Google Scholar] [CrossRef]
  97. Liu, L.; Ma, Y.; Yan, W.; Liu, X. Trace element partitioning between MgAl2O4-spinel and carbonatitic silicate melt from 3 to 6 GPa, with emphasis on the role of cation order-disorder. Solid Earth Sci. 2019, 4, 43–65. [Google Scholar] [CrossRef]
  98. Hazen, R.P.; Downs, R.T.; Finger, L.W.; Ko, J. Crystal chemistry of ferromagnesian silicate spinels: Evidence for Mg-Si disorder. Am. Mineral. 1993, 78, 1320–1323. [Google Scholar]
  99. Stebbins, J.F.; Panero, W.R.; Smyth, J.; Frost, D.J. Forsterite, wadsleyite, and ringwoodite (Mg2SiO4): 29Si NMR constraints on structural disorder and effects of paramagnetic impurity ions. Am. Miner. 2009, 94, 626–629. [Google Scholar] [CrossRef]
  100. Taran, M.; Koch-Müller, M.; Wirth, R.; Abs-Wurmbach, I.; Rhede, D.; Greshake, A. Spectroscopic studies of synthetic and natural ringwoodite, γ-(Mg, Fe)2SiO4. Phys. Chem. Miner. 2008, 36, 217–232. [Google Scholar] [CrossRef]
  101. Ohtani, E.; Kimura, Y.; Kimura, M.; Takata, T.; Kondo, T.; Kubo, T. Formation of high-pressure minerals in shocked L6 chondrite Yamato 791384: Constraints on shock conditions and parent body size. Earth Planet. Sci. Lett. 2004, 227, 505–515. [Google Scholar] [CrossRef]
  102. Liu, X. Phase relations in the system KAlSi3O8–NaAlSi3O8 at high pressure–high temperature conditions and their implication for the petrogenesis of lingunite. Earth Planet. Sci. Lett. 2006, 246, 317–325. [Google Scholar] [CrossRef]
Figure 1. Thickness dependence of the absorptions of the IR peaks in the energy range ~2100–700 cm−1. The IR spectra were taken from some thin sections made from high-H2O Mg-Rw (Run 4753) and low-H2O Mg-Rw (Run 1584). The IR # is followed by the measured thickness of the thin section (Dm in parentheses). Tmin stands for the minimum percentage of the transmitted light for the segment ~1150–700 cm−1. The only expected fundamental at ~830 cm−1 is denoted by the thick broken line.
Minerals 10 00499 g001
Figure 2. Integrated absorbance for the IR segment ~1850–1500 cm−1 vs. measured thickness (Dm) of the thin sections. The solid line simply collects the origin and the data point with the maximum absorbance and plate thickness.
Minerals 10 00499 g002
Figure 3. Calculated thickness (Dc1 or Dc2) vs. measured thickness (Dm) for thin sections of Rw with various compositions. Dc1 is calculated using Equation (3), whereas Dc2 is calculated using Equation (4). Data sources for the Dc1 calculations are this study (4753-05-01 with Dc1 = 14.0 μm and 1584-03-01 with Dc1 = 22.5 μm; see Table 1 for other details), Koch-Müller et al. [16] (MA062, with Dm = 25(5) μm and Dc1 = 29.5 μm), Ganskow et al. [77] (run 3854, with Dm = 30 μm and Dc1 = 37.4 μm), Jacobsen et al. [24] (Dm = 30 μm and Dc1 = 33.7 μm), Thomas et al. [38] (SZ0570, with Dm = 18 μm and Dc1 = 18.3 μm; SZ9901, with Dm = 39 μm and Dc1 = 44.1 μm), Ye et al. [23] (SZ0820T, with Dm = 30 μm and Dc1 = 22.7 μm), Bolfan-Casanova [78] (Dm = 67 μm and Dc1 = 68.2 μm), Chamorro Pérez et al. [51] (load 1, with Dm = 26 μm and Dc1 = 26.2 μm), Panero et al. [53] (SZ0820, with Dm = 60 μm and Dc1 = 55.8 μm) and Bolfan-Casanova et al. [49] (1936, with Dm = 45(5) μm and Dc1 = 37.3 μm). Ignoring the small effect of water [14], the refractory index of Rw with different Fe contents has been estimated according to Binns [73].
Minerals 10 00499 g003
Figure 4. Water content (CH2O) of Mg-Rw from Run 1584, Run 1589 and Run 4753. Empty symbols represent water contents derived with measured crystal plate thickness (Dm), whereas filled symbols represent water contents derived with calculated crystal plate thickness (Dc2), with the former showing more scattering.
Minerals 10 00499 g004
Figure 5. Typical unpolarized IR spectra taken on four crystal plates made from the high-H2O Mg-Rw in Run 4753. The IR # is followed by the measured thickness of the crystal plate (Dm in parentheses). Note the interference fringes around ~2150 cm−1 in the spectrum 4753-05-01, which can be used to calculate the thickness.
Minerals 10 00499 g005
Figure 6. Typical unpolarized IR spectra taken on three crystal plates made from the low-H2O Mg-Rw in Run 1584. The IR # is followed by the measured thickness of the crystal plate (Dm in parentheses). Note the interference fringes around ~2150 cm−1 in the spectrum 1584-03-01, which can be used to calculate the thickness. The peaks at ~2365 and 2342 cm−1 are due to the CO2 in air, whereas those at ~2960 and 2918 cm−1 are due to the acetone residue.
Minerals 10 00499 g006
Figure 7. Unpolarized IR spectra taken on different crystal plates made from the intemediate-H2O Mg-Rw in Run 1589. The IR # is followed by the measured thickness of the crystal plate (Dm in parentheses). Note the absence of any interference fringes in these spectra, suggesting that all thin sections are wedged.
Minerals 10 00499 g007
Figure 8. Thickness dependence of the absorptions of the IR peaks in the energy range ~3000–2000 cm−1. The IR spectra were taken from some thin sections made from high-H2O Mg-Rw (Run 4753) and low-H2O Mg-Rw (Run 1584). The IR # is followed by the measured thickness of the crystal plate (Dm in parentheses).
Minerals 10 00499 g008
Figure 9. Unpolarized IR spectra (4000–1000 cm−1) collected on the thin section (Dm = 65 μm) annealed at different T (200–300 °C) for different durations (30–90 min). The thin section was prepared from a low-H2O Mg-Rw (Crystal # 04), synthesized in Run 1584. The IR #, with the Run # and Crystal # omitted, is followed by the annealing T (°C) and annealing duration (min) in parentheses. As a comparison, the IR spectrum collected before the annealing experiments is also shown.
Minerals 10 00499 g009
Figure 10. Unpolarized IR spectra (4000–1000 cm−1) collected on the thin sections: (a) 1589-01 (Dm = 52 μm) annealed at 350 °C; (b) 1589-02 (Dm = 52 μm) annealed at 400 °C; (c) 1589-03 (Dm = 52 μm) annealed at 450 °C; (d) 1589-04 (Dm = 52 μm) annealed at 500 °C; (e) 1589-05 (Dm = 63 μm) annealed at 550 °C; (f) 1589-06 (Dm = 69 μm) annealed at 600 °C. For the purpose of comparison, the IR spectrum collected for each thin section before the annealing experiments is also shown at the bottom of each graph. It is followed, from the bottom to the top, by the first IR spectrum to the last spectrum taken on the successively annealed thin section. For the experimental details, see Table 2.
Minerals 10 00499 g010
Figure 11. Multiple Raman spectra taken on two Mg-Rw crystal plates after finishing the annealing experiments (respectively, at 400 and 600 °C) and the IR measurements. For the purpose of comparison, the Raman spectra of forsterite (Fo) [10] and Mg-Rw (http://rruff.info) are displayed.
Minerals 10 00499 g011
Figure 12. Variation of water content (CH2O) of the Mg-Rw crystal plates with cumulated annealing time at different T (°C). All data are for the crystal plates made from the intermediate-H2O Mg-Rw crystals.
Minerals 10 00499 g012
Figure 13. Effects of different types of hydrogen defects on (Mg + Fe)/Si ratios of Rw with various Mg/Fe ratios. Data are from Bolfan-Casanova et al. [56] (data from experiments 224 and 271 excluded due to typing mistakes). For the purpose of comparison, the data for hydrous wadsleyite (Wad) from Bolfan-Casanova et al. [56] are also plotted. The CH2O contents of these Rw and Wad were obtained via elastic recoil detection analyses.
Minerals 10 00499 g013
Figure 14. Effects on the broad water peak at ~3700–3660 cm−1 of the quench processes at high P and at 1 atm. For the low-H2O and intermediate-H2O Mg-Rw (Run 1584 and Run 1589, respectively), the quench process at high P did not lead to the formation of a peak at ~3700 cm−1 (black curves). However, for the high-H2O Mg-Rw (Run 4753), it resulted in an apparent water peak with a roughly-weighted mean wavenumber of ~3700 cm−1 (blue curve). The quench process at 1 atm may lead to a good preservation of the high-T IR signals formed by the new equilibrium at the annealing T and 1 atm, as exampled by the broad water peak with a roughly-weighted mean wavenumber of ~3660 cm−1 (red curves).
Minerals 10 00499 g014
Figure 15. Effects of cation disorder on unit-cell volume and thermal expansivity of Mg-Rw. HY99, Hazen and Yang [8]; Y2012, Ye et al. [23]. The numbers along the symbols represent the T (in °C) for the single-crystal X-ray diffraction measurements. The size of the used crystal (SZ0820) was ~100 × 85 × 70 μm3, and the initial CH2O was about 1.77%. The X-ray data-collecting time at very T was ~4 h.
Minerals 10 00499 g015
Table 1. Ambient unpolarized IR experiments performed on doubly-polished thin sections of low-H2O Mg-Rw (Run 1584), intermediate-H2O Mg-Rw (Run 1589) and high-H2O Mg-Rw (Run 4753).
RunCrystalDmaIRA1850–1500bDc2cA3730–2000bCH2O
##(μm)#(cm−1)(μm)(cm−1)(ppm)
1584011131584-01-0187.4581.770.311149
1584-01-0287.2381.570.271151
1584-01-03122.55114.583.4972
1584-01-04122.12114.176.5895
1584-01-05118.33110.584.351019
1584-01-0687.9282.174.051204
03151584-03-0123.1321.651.863203 d
1584-03-0223.1621.626.561639
1584-03-0318.5217.319.231483
04651584-04-0163.6759.553.921210
158901521589-01-0139.0636.5148.145418
02521589-02-0139.0536.5158.255791
03521589-03-0121.8320.445.162956 d
04521589-04-0141.1738.4150.085209
05631589-05-0149.2446186.675416
06691589-06-0148.4745.3192.165665
4753016401/01/475368.263.7761.815,961
02/01/475368.2663.8786.6416,465
03/01/475366.5562.2763.6316,394
023701/02/475336.6534.2441.2817,206
02/02/475327.5825.8258.6313,401
03/02/475335.6433.3410.1916,447
032401/03/475327.9326.1343.5417,577
02/03/475327.5825.8336.5217,435
03/03/475328.7926.9310.1115,390
051401/05/475315.6114.6183.3816,789
The O contents of the Mg-Rw from Run 1584, 1589 and 4753 are, respectively, 1019(238), 5500(229) and 16,307(1219) ppm, and the Mg-Rw crystals from these runs are, respectively, termed low-H2O Mg-Rw, intermediate-H2O Mg-Rw and high-H2O Mg-Rw in this study. a Thickness of the thin section, as measured by a micrometer. b Integrated absorption for the energy range of ~1850–1500 or 3730–2000 cm−1. c Calculated thickness of the sample material at the analyzing spot of the IR beam, as derived with the integrated absorption in the range of ~1850–1500 cm−1 (i.e., Equation (4)). d Outlier.
Table 2. Ambient unpolarized IR experiments performed on doubly-polished Mg-Rw thin sections, annealed at various temperatures (T) for various durations (t) and quickly quenched to room T.
CrystalDmaTtIRA1850–1500bDc2cA3730–2000bCH2O
#(μm)(°C)(min)#(cm−1)(μm)(cm−1)(ppm)
Crystals from Run 1584
0465200301584-04-0264.3460.157.51277
200601584-04-0472.1367.458.441158
250901584-04-0541.3538.634.111179
250301584-04-0761.3757.369.051608
300601584-04-0860.3656.450.21188
Crystals from Run 1589
0152350151589-01-0231.4329.4101.194600
350151589-01-0339.2336.6111.284053
350151589-01-0439.2336.693.033388
350151589-01-0538.7936.2119.874415
350151589-01-0636.6734.2104.084056
0252400151589-02-0239.9937.3138.044932
400151589-02-0338.9636.4127.114662
400151589-02-0438.7636.2126.814675
400151589-02-0534.5132.2110.94591
400151589-02-0640.8738.2115.114025
03 d52450151589-03-0219.6218.335.132558
450151589-03-0319.8918.641.532983
450151589-03-0420.8519.535.042401
450151589-03-0521.7620.340.492659
450151589-03-0619.5318.218.581359
0452500151589-04-0239.4136.886.333130
500151589-04-0335.0532.752.462138
500151589-04-0436.9834.576.352950
500151589-04-0535.1732.863.392575
500301589-04-0639.3736.869.72530
0563550151589-05-0260.756.783.661969
550151589-05-0362.4958.4103.492367
550151589-05-0463.165993.242109
0669600151589-06-0239.3536.875.542743
600151589-06-0346.1943.194.622927
a Thickness of the thin section, as measured by a micrometer. b Integrated absorbance. c Calculated thickness of the sample material at the analyzing spot of the IR beam, as derived from the integrated absorption in the range of ~1850–1500 cm−1 (i.e., Equation (4)). d This thin section has an unusually low water content; however, this does not affect our IR spectroscopic analysis.
Table 3. IR peaks for water in Mg-Rw from different studies.
Study/RunD/CH2OaIR Peaks (cm−1) at Ambient P and T
Mg-Rw as synthesized from conventional high-P experiments
B03/H130250/0.213700--------3120--2540-------
B00/H89245/0.783695--------3120---2455 1347-12861191-
P13/SZ0817 b20/1.0--------(3273)3127(3088)-----------
Y14/-30/1.13695--------3115--25502472------
C06/load 2 c16/1.73668--------3151--25432460-1349-1279-1184
Y12/SZ082030/1.7736883598-------31272830265425382350------
P13/SZ082025/1.773662--------3122----1352--1286-1176
T15/SZ0820 d84/1.773670-3568--3412---31302809-2504-------
TS/1584-/0.10--------3278308828452670255424541356-1304-1189-
TS/1589-/0.553701----3407-3348-310028492660255624481352-130712821194-
TS/4753-/1.633682--------3118-266325382445-1347-1281-1186
Mg-Rw as further annealed at high 600 °C and 1 atm
TS/1589-/0.553667--351034613405-33453270-2849-250024481387-130712841191-
TS—this study; B03—Bolfan-Casanova et al. [70]; B00—Bolfan-Casanova et al. [49]; P13—Panero et al. [53]; Y14—Yang et al. [54]; C06—Camorro Pérez et al. [51]; Y12—Ye et al. [23]; T15—Thomas et al. [38]. a D/CH2O—thickness of the studied thin section (μm)/H2O content of the Mg-Rw (wt%). b As cooled to T < −73 °C, peak at 3127 cm−1 splitting into two peaks at 3273 and 3088 cm−1. c Two minor peaks at 1283 and 1179 cm−1 appeared at high P. d Peak at 2504 cm−1 has been reinterpreted as a water peak caused by the quench process at high P.

