A Reconstitution Approach for Whole Rock Major and Trace Element Compositions of Granulites from the Kapuskasing Structural Zone


School of Earth and Atmospheric Sciences, Queensland University of Technology, Brisbane, QLD 4000, Australia
*
Author to whom correspondence should be addressed.
Minerals 2020, 10(6), 573; https://doi.org/10.3390/min10060573
Submission received: 8 May 2020
/
Revised: 18 June 2020
/
Accepted: 22 June 2020
/
Published: 25 June 2020
(This article belongs to the Section Mineral Geochemistry and Geochronology)
Abstract
:Current estimates for the composition of the lower continental crust show significant variation for the concentrations of the highly incompatible elements, including large uncertainties for the heat-producing elements. This has consequences for models of the formation of lower crust. For example, is lower continental crust inherently poor in incompatible elements or has it become so after extraction of partial melts caused by thermal incubation? Answering these questions will require better agreement between estimates for the chemistry of the lower crust. One issue is that granulite samples may have been altered during ascent. Xenoliths often experience contamination from the entraining alkaline magma, potentially resulting in elevated concentrations of incompatible trace elements when analysed by conventional bulk rock techniques. To avoid this, we assessed an in situ approach for reconstructing whole rock compositions with granulites from the Kapuskasing Structural Zone, Superior Province, Canada. As terrain samples, they have not been affected by host magma contamination, and as subrecent glacial exposures, they show minimal modern weathering. We used scanning electron microscope electron dispersive spectroscopy (SEM-EDS) phase mapping to establish the modal mineralogy. Major and trace element concentrations of mineral phases were determined by electron microprobe and laser ablation inductively coupled plasma mass spectrometry (LA-ICPMS), respectively. These concentrations were combined with the modal mineralogies to obtain reconstructed whole rock compositions, which were compared to conventional bulk rock analyses. The reconstructed data show good reproducibility relative to the conventional analyses for samples with massive textures. However, the conventional bulk rock chemistry systematically yields higher K concentrations, which are hosted in altered feldspars. Thus, even in terrain samples, minor alteration can lead to elevated incompatible element estimates that may not represent genuine lower continental crust.
1. Introduction
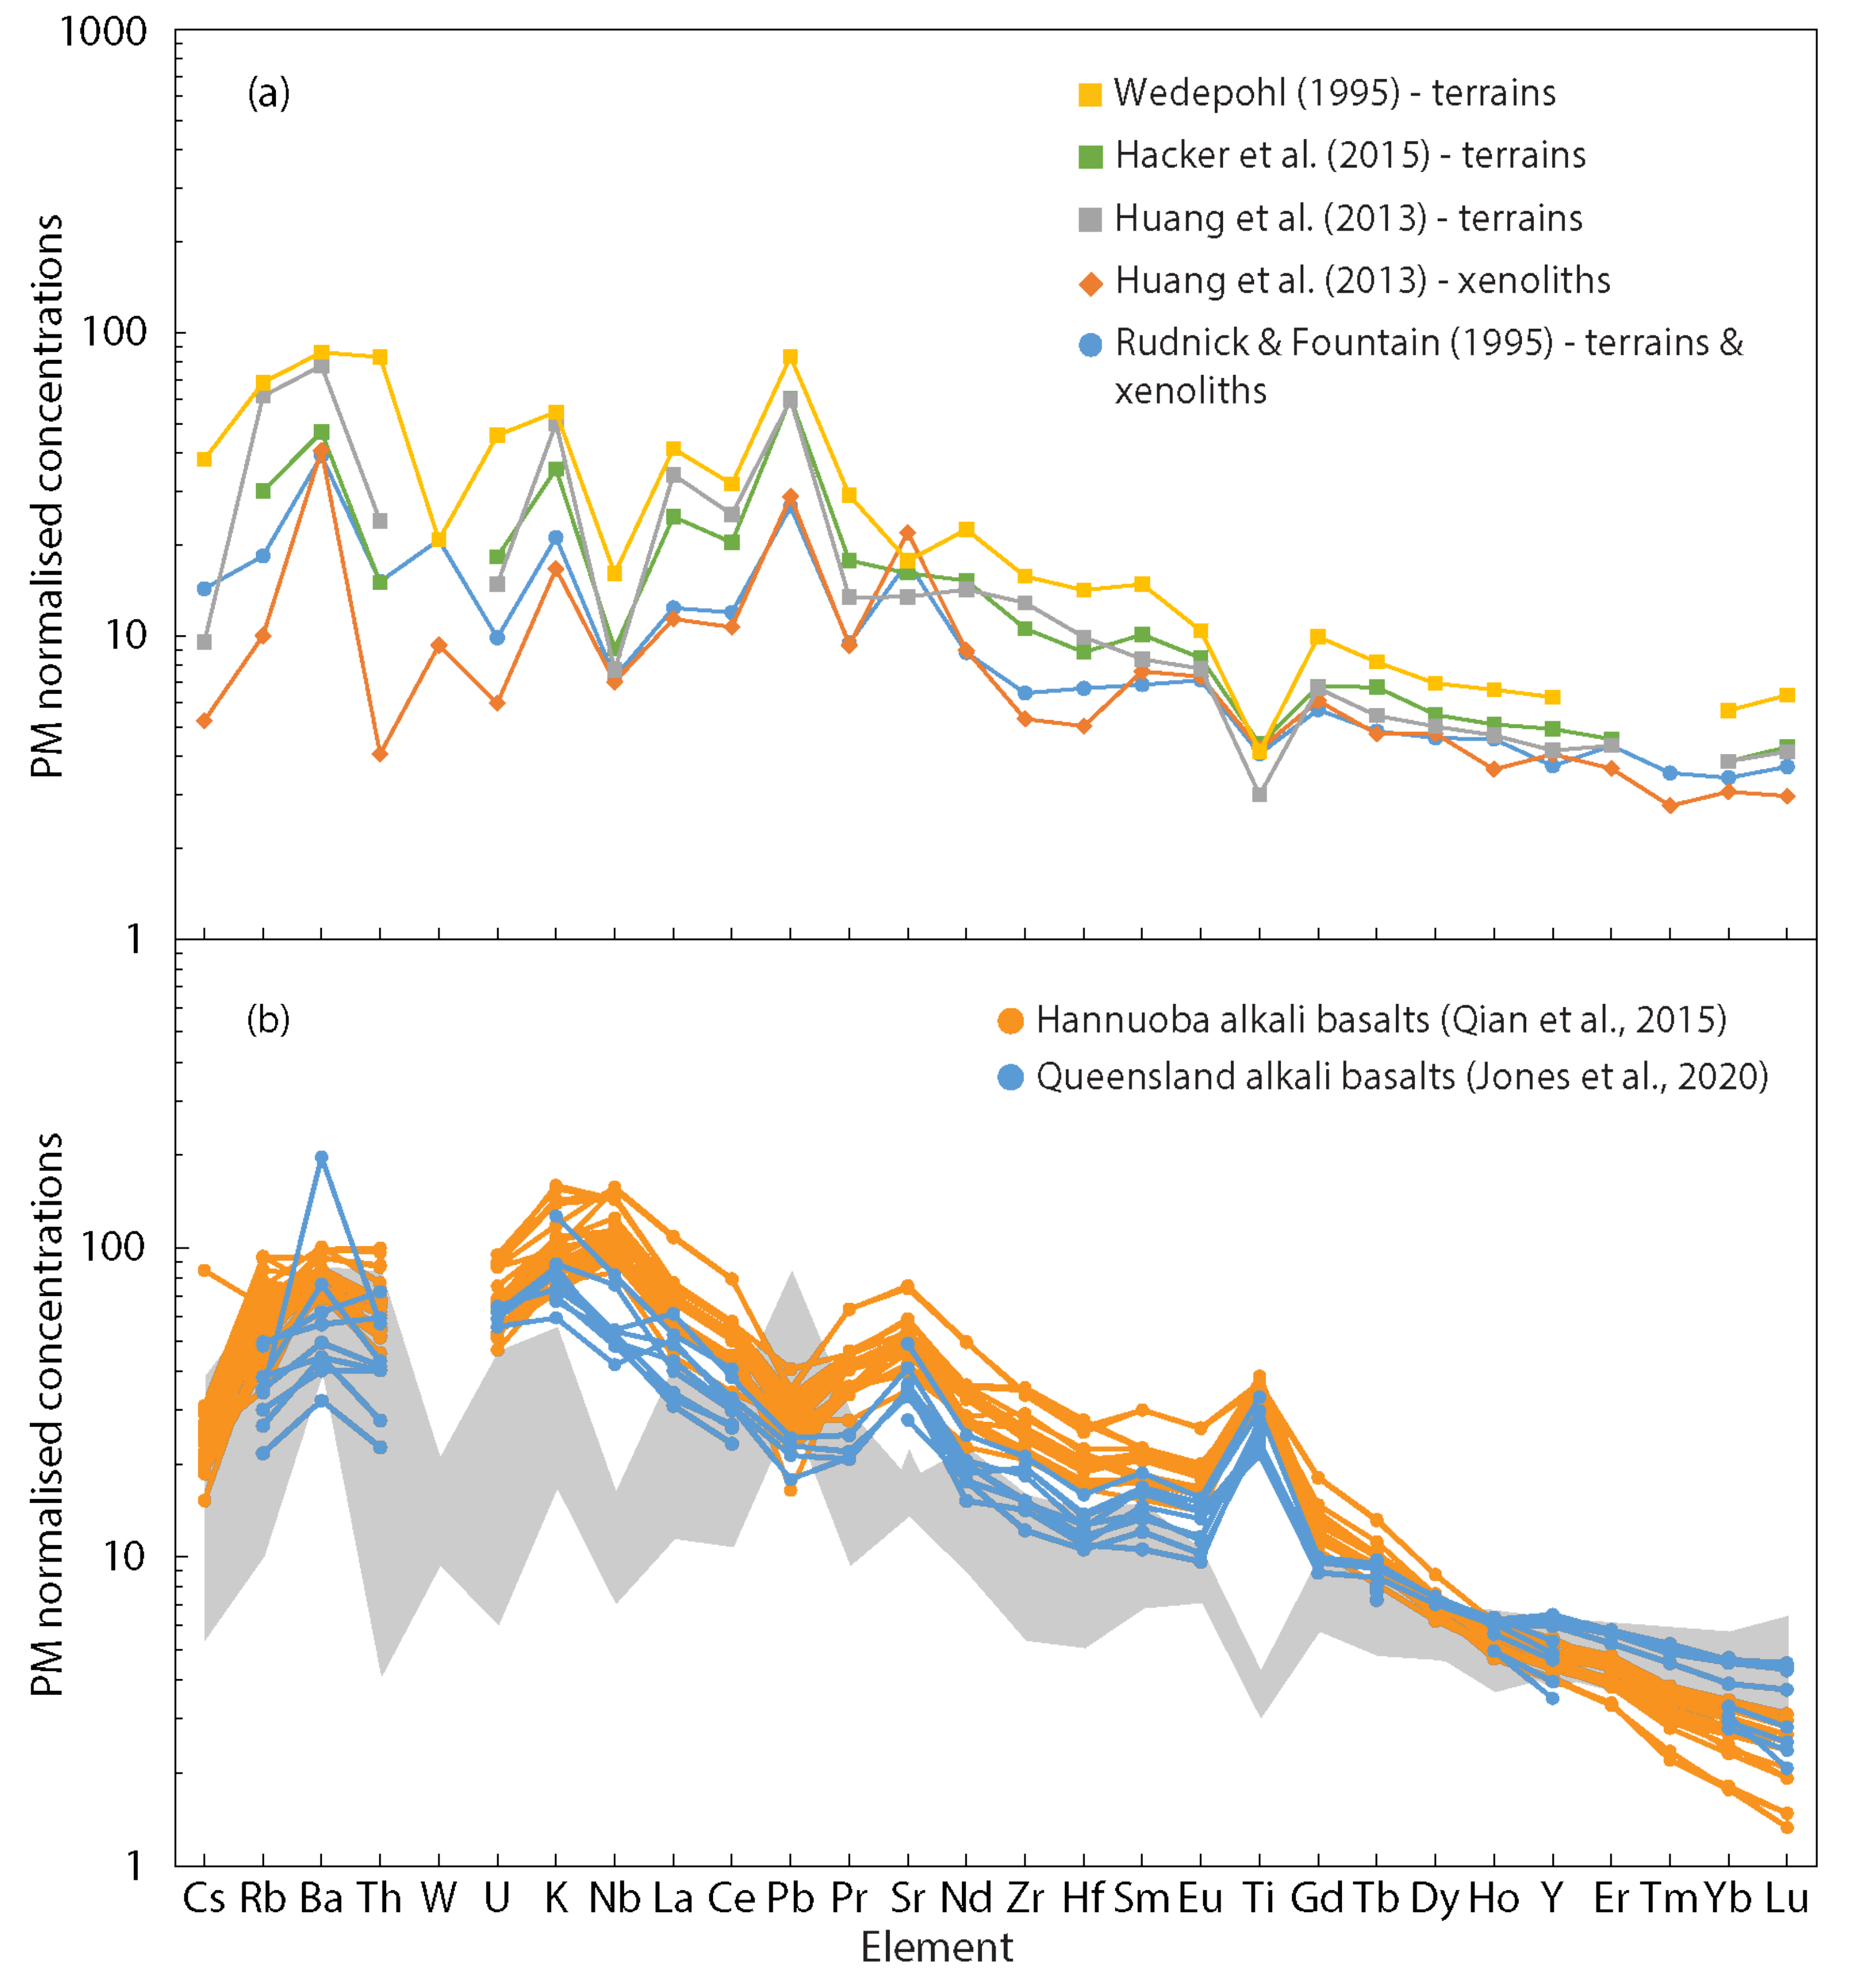
The chemical composition of the lower continental crust (LCC) is poorly constrained compared to the upper crust partly due to its inaccessibility and scarcity of exposed samples. This is one reason for the large variation in estimated trace element compositions between different models of lower crustal composition (Figure 1). There are two sample types used to construct these LCC estimates, exhumed granulite terrains and granulite-facies xenoliths brought to the surface by rapidly rising magmas [1,2,3,4,5]. Samples collected from granulite terrains are typically more felsic than granulite xenoliths [1,2,6,7], and many of the terrains have been involved in orogenesis. Most terrains are interpreted to have resided transiently in the deep crust but were not originally formed there [1,2,6]. Granulite xenoliths, which commonly show equilibrated granular textures, come from greater depths than terrains and are widely thought to be more representative of the deepest parts of the continental crust [6,8,9,10]. However, these xenoliths are quite rare and often too small to be analysed with conventional bulk rock samples, posing issues of representativeness. Additionally, the chemical composition of xenoliths has the potential to be affected by magma contamination. The most common host rock types are alkali basalts and kimberlites [1], and both are vastly more enriched in incompatible trace elements, including the heat-producing elements (HPE) Th, U and K, compared to mafic granulite xenoliths. Therefore, a small degree of infiltration by or reaction with the host magma could significantly affect the trace element budget of the xenolith when analysed by conventional bulk rock techniques.
The current gap in knowledge is readily illustrated with the HPE. Widely used published lower crustal estimates vary in the concentrations for Th, U and K by factors 20, 8 and 3, respectively (Figure 1). This variation is significantly higher than the estimated uncertainties for HPE concentrations in the upper crust [1]. As the major reservoir for the HPE, the continental crust plays a key role in Earth’s heat budget. While the contribution of the lower crust to Earth’s radiogenic heat production is lower than the upper crust, the large uncertainties associated with lower crustal HPE concentrations are propagated through physical and chemical models for Earth evolution that rely on these estimates as input parameters. For example, the uncertainty in lower crustal HPE concentration has significant implications for investigations into Earth’s thermal budget and for constraining the ratio of Earth’s internal heat production to its surface heat flux (Urey ratio) [11,12], which in turn are important for investigating the thermal evolution of our planet. More reliable estimates of lower crustal HPE concentrations will help to reduce the uncertainties of these models and improve our understanding of the temporal evolution of the continents.
The effect of host magma contamination on the bulk rock composition has long been recognised in the very incompatible element-depleted mantle xenoliths, particularly for those entrained by kimberlites. This problem has been addressed with reconstitution methods [13,14,15] in which the modal mineralogy is calculated with bulk rock and mineral chemistry or point counting, and the trace element inventory determined with in situ mineral analysis. This approach has not been widely applied to lower crustal granulite samples even though some of them are highly depleted in very incompatible elements and thus prone to secondary enrichment artefacts. In some lower crustal models, the measured concentrations for certain incompatible elements (e.g., K, Ba) in kimberlite-hosted lower crustal xenoliths are excluded when making interpretations based on the reasoning that these elements are commonly enriched in kimberlitic magmas and would likely skew the concentrations of these elements in the xenoliths to higher values through contamination [7]. Alkali basalt hosts can also be enriched in highly incompatible elements (Figure 1b). However, the effects of contamination by alkali basalt host magmas on crustal xenolith whole rock compositions have largely not been explored, and the reconstruction approach has not been widely utilised for lower crustal xenoliths [16,17], particularly for trace elements.
The trace element reconstitution approach cannot easily be validated with mantle peridotites. Orogenic mantle peridotites have avoided contamination by a host magma and could thus theoretically serve as validation test cases. However, they are often serpentinised or otherwise altered due to the instability of olivine and orthopyroxene at the Earth’s surface. Even the freshest peridotites show unexpectedly elevated highly incompatible element concentrations (e.g., [18]). By contrast, terrain granulites are generally much fresher than orogenic peridotites and can potentially serve as a control group that has not undergone host magma contamination. Such granulites are hypothesised to be useful for exploring the distribution of highly incompatible trace elements in lower crustal mineralogies, and to test how accurately the derived composition of lower crustal samples reflects the bulk rock composition.
In this study, we investigated the whole rock major and trace element compositions of fresh granulite rocks from the Kapuskasing Structural Zone (KSZ), an amphibolite-granulite terrain in the Superior Province, Canada. We first analysed the samples using conventional bulk rock techniques: X-ray fluorescence (XRF) for major element compositions and solution inductively coupled plasma mass spectrometry (ICPMS) for trace element concentrations. We then analysed the whole rock compositions using the reconstruction approach for comparison. The modal abundances of each sample were determined through scanning electron microscope electron dispersive spectroscopy (SEM-EDS) elemental mapping. Major element compositions of each mineral phase were analysed by electron probe micro-analysis (EPMA), and laser ablation (LA) ICPMS analysis was used to determine selected trace element concentrations of each phase. The combined modal mineralogies and major and trace element concentrations of each mineral phase were used to reconstruct the whole rock composition, which could then be compared to the compositions obtained by conventional bulk rock analysis.
2. Materials and Methods
2.1. Materials
The KSZ in the southeastern Superior Province, Canada, is an uplifted mid-to-lower crustal section of high-grade metamorphic rocks marked by a strong positive gravity anomaly [22,23,24]. The main rock types found in the KSZ are upper amphibolite- and granulite-grade mafic to tonalitic gneisses. Five gneiss samples from the KSZ were selected for this study based on the fact that they are fresh, relatively free from secondary alteration and display a range of fabrics. The sample types range from mafic gneiss (6KB63, 6KB67) to tonalite gneiss (6KB50, 6KB52, 7KB42). Specimen 6KB63 consists of hornblende + garnet + plagioclase + clinopyroxene and 6KB67 consists of hornblende + plagioclase + garnet + biotite. The tonalite gneisses are strongly banded and consist of hornblende + plagioclase + garnet + quartz ± clinopyroxene ± biotite. Accessory phases include apatite, ilmenite, titanite and zircon. All samples show some degree of banding, on the mm-scale for samples 6KB63, 6KB67 and 7KB42, and on the cm-scale for samples 6KB50 and 6KB52. Felsic bands are dominated by quartz and feldspar, while mafic bands are dominated by hornblende, pyroxene and garnet. Zircon from samples collected from the same outcrops as the samples listed above have ages ranging from 3200–2640 Ma [25] and indicate that partial melts were extracted from at least some of the granulites. The KSZ experienced differential uplift of >20 km during a protracted history [26].
2.2. Bulk Rock Major and Trace Element Analysis (X-Ray Fluorescence (XRF) and Solution Inductively Coupled Plasma Mass Spectrometry (ICPMS))
The five selected samples for this study were crushed in a steel jaw crusher and then powdered in an agate ring mill. Bulk rock major, minor and some trace element compositions of the granulite gneisses were determined by XRF using a PANalytical AXIOS Wavelength Dispersive XRF at the Central Analytical Research Facility (CARF), Queensland University of Technology. For major element analysis, 1.15 g of powdered sample was mixed with 8.85 g of lithium tetraborate flux and heated to 1050 °C to form a fused disc. Loss on ignition was used to determine the volatile content of each sample by heating ~1 g of powdered sample to 1050 °C. Minor and selected trace element analyses were conducted on a pressed powdered pellet containing 12 g of sample and 3 g of a binding agent.
For solution ICPMS trace element analysis, digestion was undertaken at the Radiogenic Isotope Facility (RIF) at the University of Queensland. Approximately 100 mg of powdered sample was added to ultra-clean Teflon bombs with 0.5 mL 15.8 N HNO3 + 2.5 mL 29 N HF. Capped bombs were heated on a hot plate at 120 °C overnight, then dried at 90 °C. A further 0.5 mL 15.8 N HNO3 + 2.5 mL 29 N HF was added and bombs were transferred to jackets and placed in an oven at 185 °C for five days. After cooling, the contents were transferred to ultra-clean 20 mL beakers with 3× rinsing with 1 mL 2% HNO3 to ensure complete transfer. The solutions were then dried at 90 °C. Once dry, 6 mL of 10% aqua regia was added to each beaker and heated on a hot plate at 120 °C for two days. Samples were checked for residual fluorides and additional aqua regia added as necessary. After drying at 90 °C, samples were converted initially using 15.8 N and then 7 N HNO3 before being taken up in 5 mL of 2 N HNO3. Samples were diluted at 3500× and spiked with 6 ppb multi-element internal standard in 12 mL ultra-clean Teflon tubes. Bulk rock trace element analysis of the five samples was conducted by solution ICPMS with an Agilent 7900 ICPMS at the Environmental Geochemistry Laboratory, The University of Queensland. In-house solutions of US Geological Survey rock reference materials W-2a, BHVO-2 and BIR-1 were used for calibration, with procedural digestions of GDP-2 and BHVO-2 used as quality control monitors (Table S1).
2.3. Scanning Electron Microscope Electron Dispersive Spectroscopy (SEM-EDS) Phase Mapping
Modal abundances of the five gneisses were obtained on carbon-coated (10 nm) thin sections by large area SEM-EDS phase mapping using a JEOL7001f Field Emission-SEM equipped with an Oxford X-Max 80 mm2 detector at CARF. The acceleration voltage and beam current were 15 kV and 16–17 nA, respectively. Maps were collected at a pixel resolution of ~4 μm/pixel and a dwell time between 300 and 400 μs. The process time preset level of the EDS system was 2 and the dead time was between 40% and 50%. The stored count rate was between 90,000 and 100,000 cps. With the applied pixel resolution and dwell times, this equates to ~200 counts/pixel. The automated phase mapping feature of the Oxford AztecOne software was used to identify individual mineral phases and obtain modal abundances based on the pixel percentage of each phase (Figure 2, Table 1). Average mineral densities were used to convert volumetric modes to mass abundances, with densities corrected for solid solution phases. The overall uncertainty of the modal mineralogy of an individual mapped area ranged between 2% and 5% based on the percentage of unassigned pixels and an estimated percentage of pixels with spectra that show mixing between multiple phases. The estimated uncertainty for the abundances of the accessory phases is higher (approximately 5–10%) due to the smaller grain size and lower abundance of these phases. However, it is highly unlikely that the phase mapping software significantly underestimates the abundance of or entirely misses trace-element rich accessory phases (e.g., zircon, monazite) as they have distinct chemistries that are easily recognised by the software. In addition to the EDS maps, separate high-resolution (1 μm/pixel) back-scattered electron (BSE) maps were obtained to help with the identification of potential small trace element-bearing accessory phases (Supplementary Figure S1). These minerals have bright BSE responses, and their distribution was compared to the EDS-derived phase maps. No additional accessory phases were found in the BSE maps.
2.4. EPMA Major Element Analysis
Quantitative major element compositions of mineral phases were obtained using a JEOL JXA-8530F Hyperprobe equipped with five wavelength dispersive spectrometers at CARF. The beam conditions were as follows: 15 kV accelerating voltage, 30 nA beam current and a beam diameter of 3 μm, except for feldspar and apatite analyses which used a beam diameter of 10 μm. A suite of natural and synthetic reference materials was used for calibration. Several matrix-matched standards were analysed as quality control monitors before and after each session (Table S2). For the KSZ samples, multiple grains of each phase were analysed throughout each thin section, with at least 3 spot analyses conducted across most grains. The analyses were screened using stoichiometry and totals (98.5–101.5 wt% for anhydrous phases and 95–101.5 wt% for hydrous phases). Major element variation between cores and rims of grains of all phases was limited, showing the phases are well equilibrated. Individual spot results are provided in the Supplementary Materials. Average major element compositions for each phase were combined with the modal mineral abundances obtained by EDS to reconstitute the bulk rock composition.
Major element mapping of regions of interest within the samples was conducted using a similar EPMA set up to the spot analysis to further assess the degree of intragrain variation in the samples. Dwell times of 500 μs/pixel were used, and the spatial resolution was 3 µm/pixel. The background was corrected for using a mean atomic number fit obtained from the analysis of a suite of reference materials.
2.5. Laser Ablation ICPMS (LA-ICPMS) Trace Element Analysis
Trace element concentrations of major mineral phases and zircon from the KSZ samples were analysed by LA-ICPMS at CARF. For this method evaluation project, the analyses were conducted with an older instrument, an ESI NWR193 LA system connected to an Agilent 8800 ICPMS. This setup does not have the sensitivity of modern instrumentation and only allows analysis of a limited number of low-concentration elements. The main target elements were the large ion lithophile elements (K, Rb, Cs, Ba, Tl), U and Th, as they exhibit the largest degree of variation in lower crustal estimates (Figure 1a). The rare earth elements (REE), Nb (to represent the high field strength elements) and Sc (as a relatively compatible element) were also measured. Due to the limitation of the LA-ICPMS setup, only a selection of the REE were analysed (La, Sm, Eu, Gd and Yb). Appropriate mass dwell times of each analyte were chosen for different mineral phases based on the abundance of the elements expected from pilot traverses across each phase. Line scans, with an 80 μm beam diameter, were conducted across grains of the major phases. Zircon trace element concentrations were determined by spot analysis, using a 30 μm spot size and a 30 s ablation time. The laser fluence and repetition rate for all analyses were 3.5–4.0 J·cm−2 and 10–15 Hz, respectively. The glass standard NIST610 was used as the primary calibration standard for all analyses [27]. The in-house obsidian glass BK2 was used as a quality control standard for the major phases [28], while the zircon reference material 91500 was used for the zircon analyses [29]. Appropriate internal elemental standards were chosen for each mineral phase, typically Si or Ca, and the data were reduced using the Iolite v3 software package.
Trace element concentrations in apatite and titanite grains were analysed using a Teledyne Photon Machines Analyte Excite 193 nm ArF Excimer LA system coupled to an Agilent 7900 ICPMS at Trinity College Dublin. Spot analyses (47–60 μm) were conducted on grains in thin section, with a laser energy of 2.5 J·cm−2 and a repetition rate of 10–15 Hz. The glass standard NIST612 was used as the primary calibration standard [27]. The apatite reference materials Durango, Madagascar and McClure Mountain were analysed as quality control monitors for apatite analysis [30,31]. The titanite reference materials MKED1 and OLT1 were used as secondary standards for titanite analysis [32,33]. Calcium was used as an internal elemental standard for both apatite and titanite, and the data were reduced using Iolite v3. All LA-ICPMS secondary standard data can be found in the Supplementary Materials (Table S3).
3. Results
The major and trace element concentrations obtained by XRF and solution ICPMS are listed in Table 2. The reconstructed compositions are shown in Table 3. Individual spot and linescan data from the EPMA and LA-ICPMS analysis can be found in the Supplementary Materials (Tables S4 and S5). Comparisons between the conventional bulk rock data and the reconstitution approach are shown in Figure 3 and Figure 4.
4. Discussion
4.1. Evaluation of the Reconstitution Approach
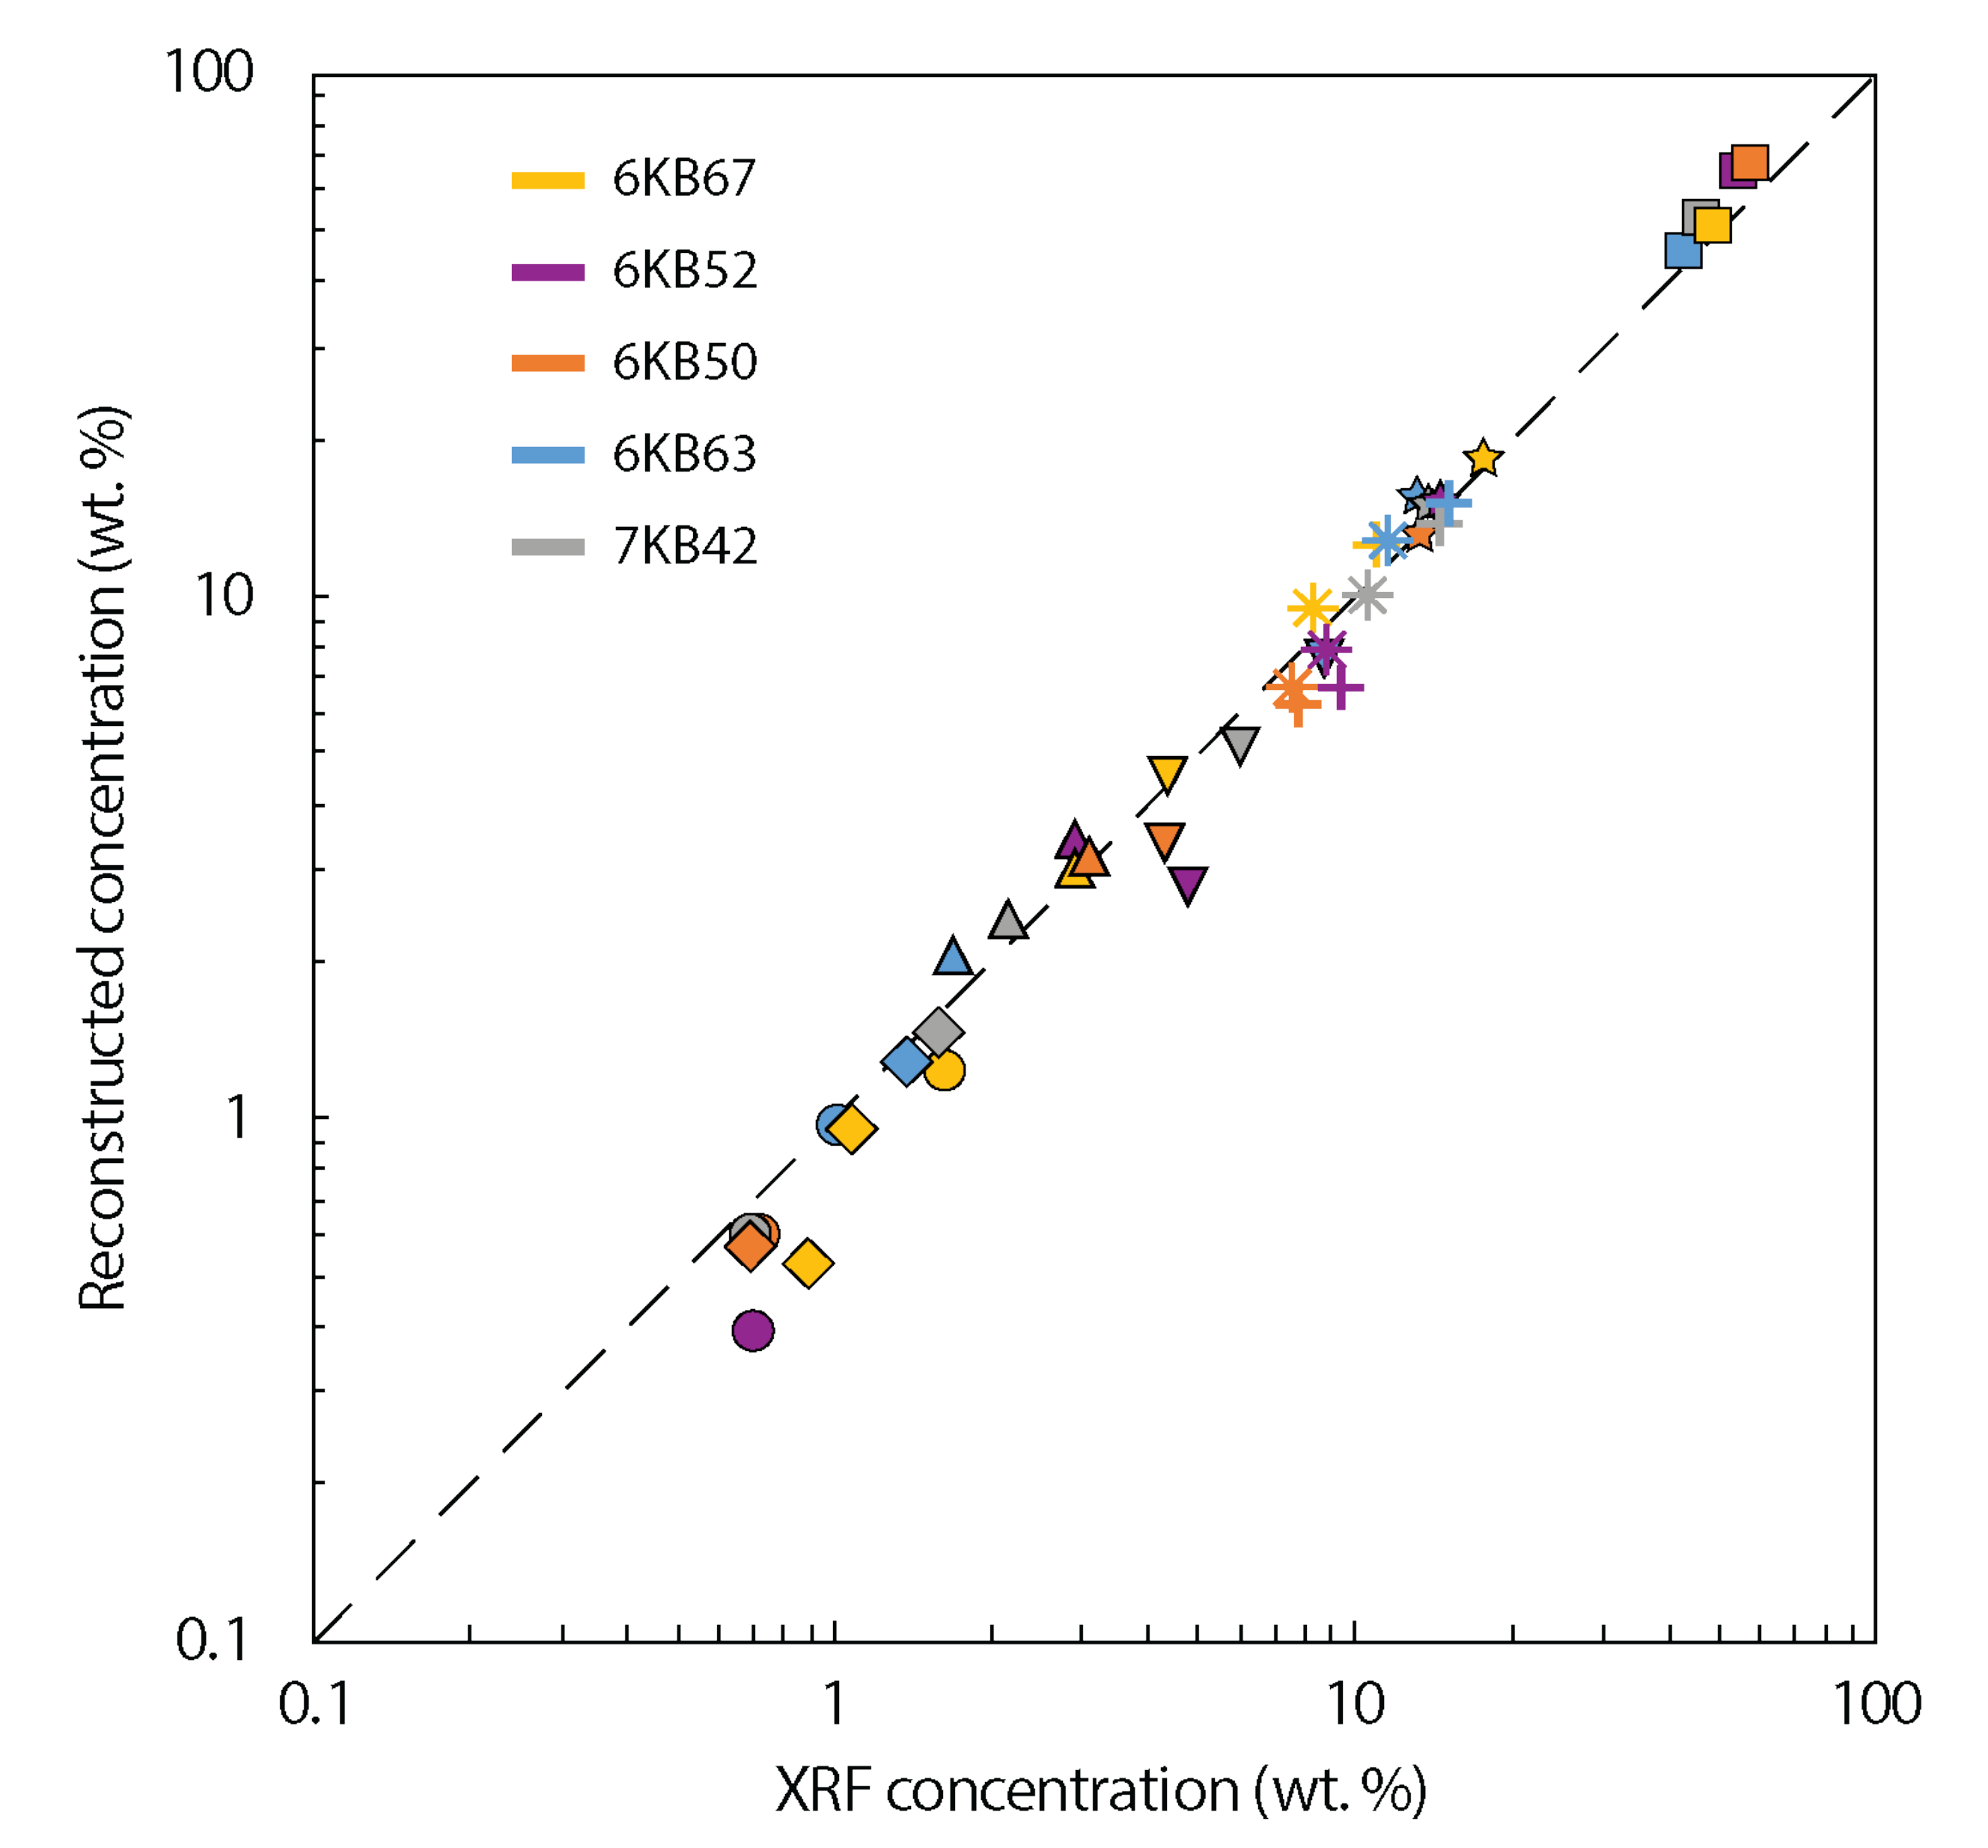
The accuracy of the reconstructed whole rock compositions can be evaluated by comparison to the bulk rock major and trace element compositions obtained by XRF and solution ICPMS, respectively. For the three least banded samples (6KB63, 6KB67 and 7KB42) the reconstruction concentrations are within 15% of the XRF and solution ICPMS values for most major and trace elements. The data for the remaining two samples (6KB50 and 6KB52), which show strong compositional banding, do not match as well, with most element concentrations falling within 30% and 50% of the bulk rock data. Significantly, there is a systematic underestimation of K2O (wt%) in the reconstitution approach relative to the XRF whole rock compositions in all samples. There are several possible causes for this: (1) systematic overestimation of K during XRF analysis; (2) systematic underestimation of K in EPMA spot analysis; (3) underestimation of the modal abundance of relatively K-rich phases or zones within phases and subsequent limited or non-detection of these areas during EPMA spot analysis. The first two possibilities can by discounted upon investigation of the secondary standards used in the XRF and EPMA analysis as quality controls, as these are within error of the accepted published values (Tables S1 and S2). Further evidence that discounts a possible systematic analytical cause is the fact that reconstructed Rb concentrations are similarly depleted relative to the measured solution ICPMS concentrations and the magnitude of the discrepancy matches that of K for a given sample.
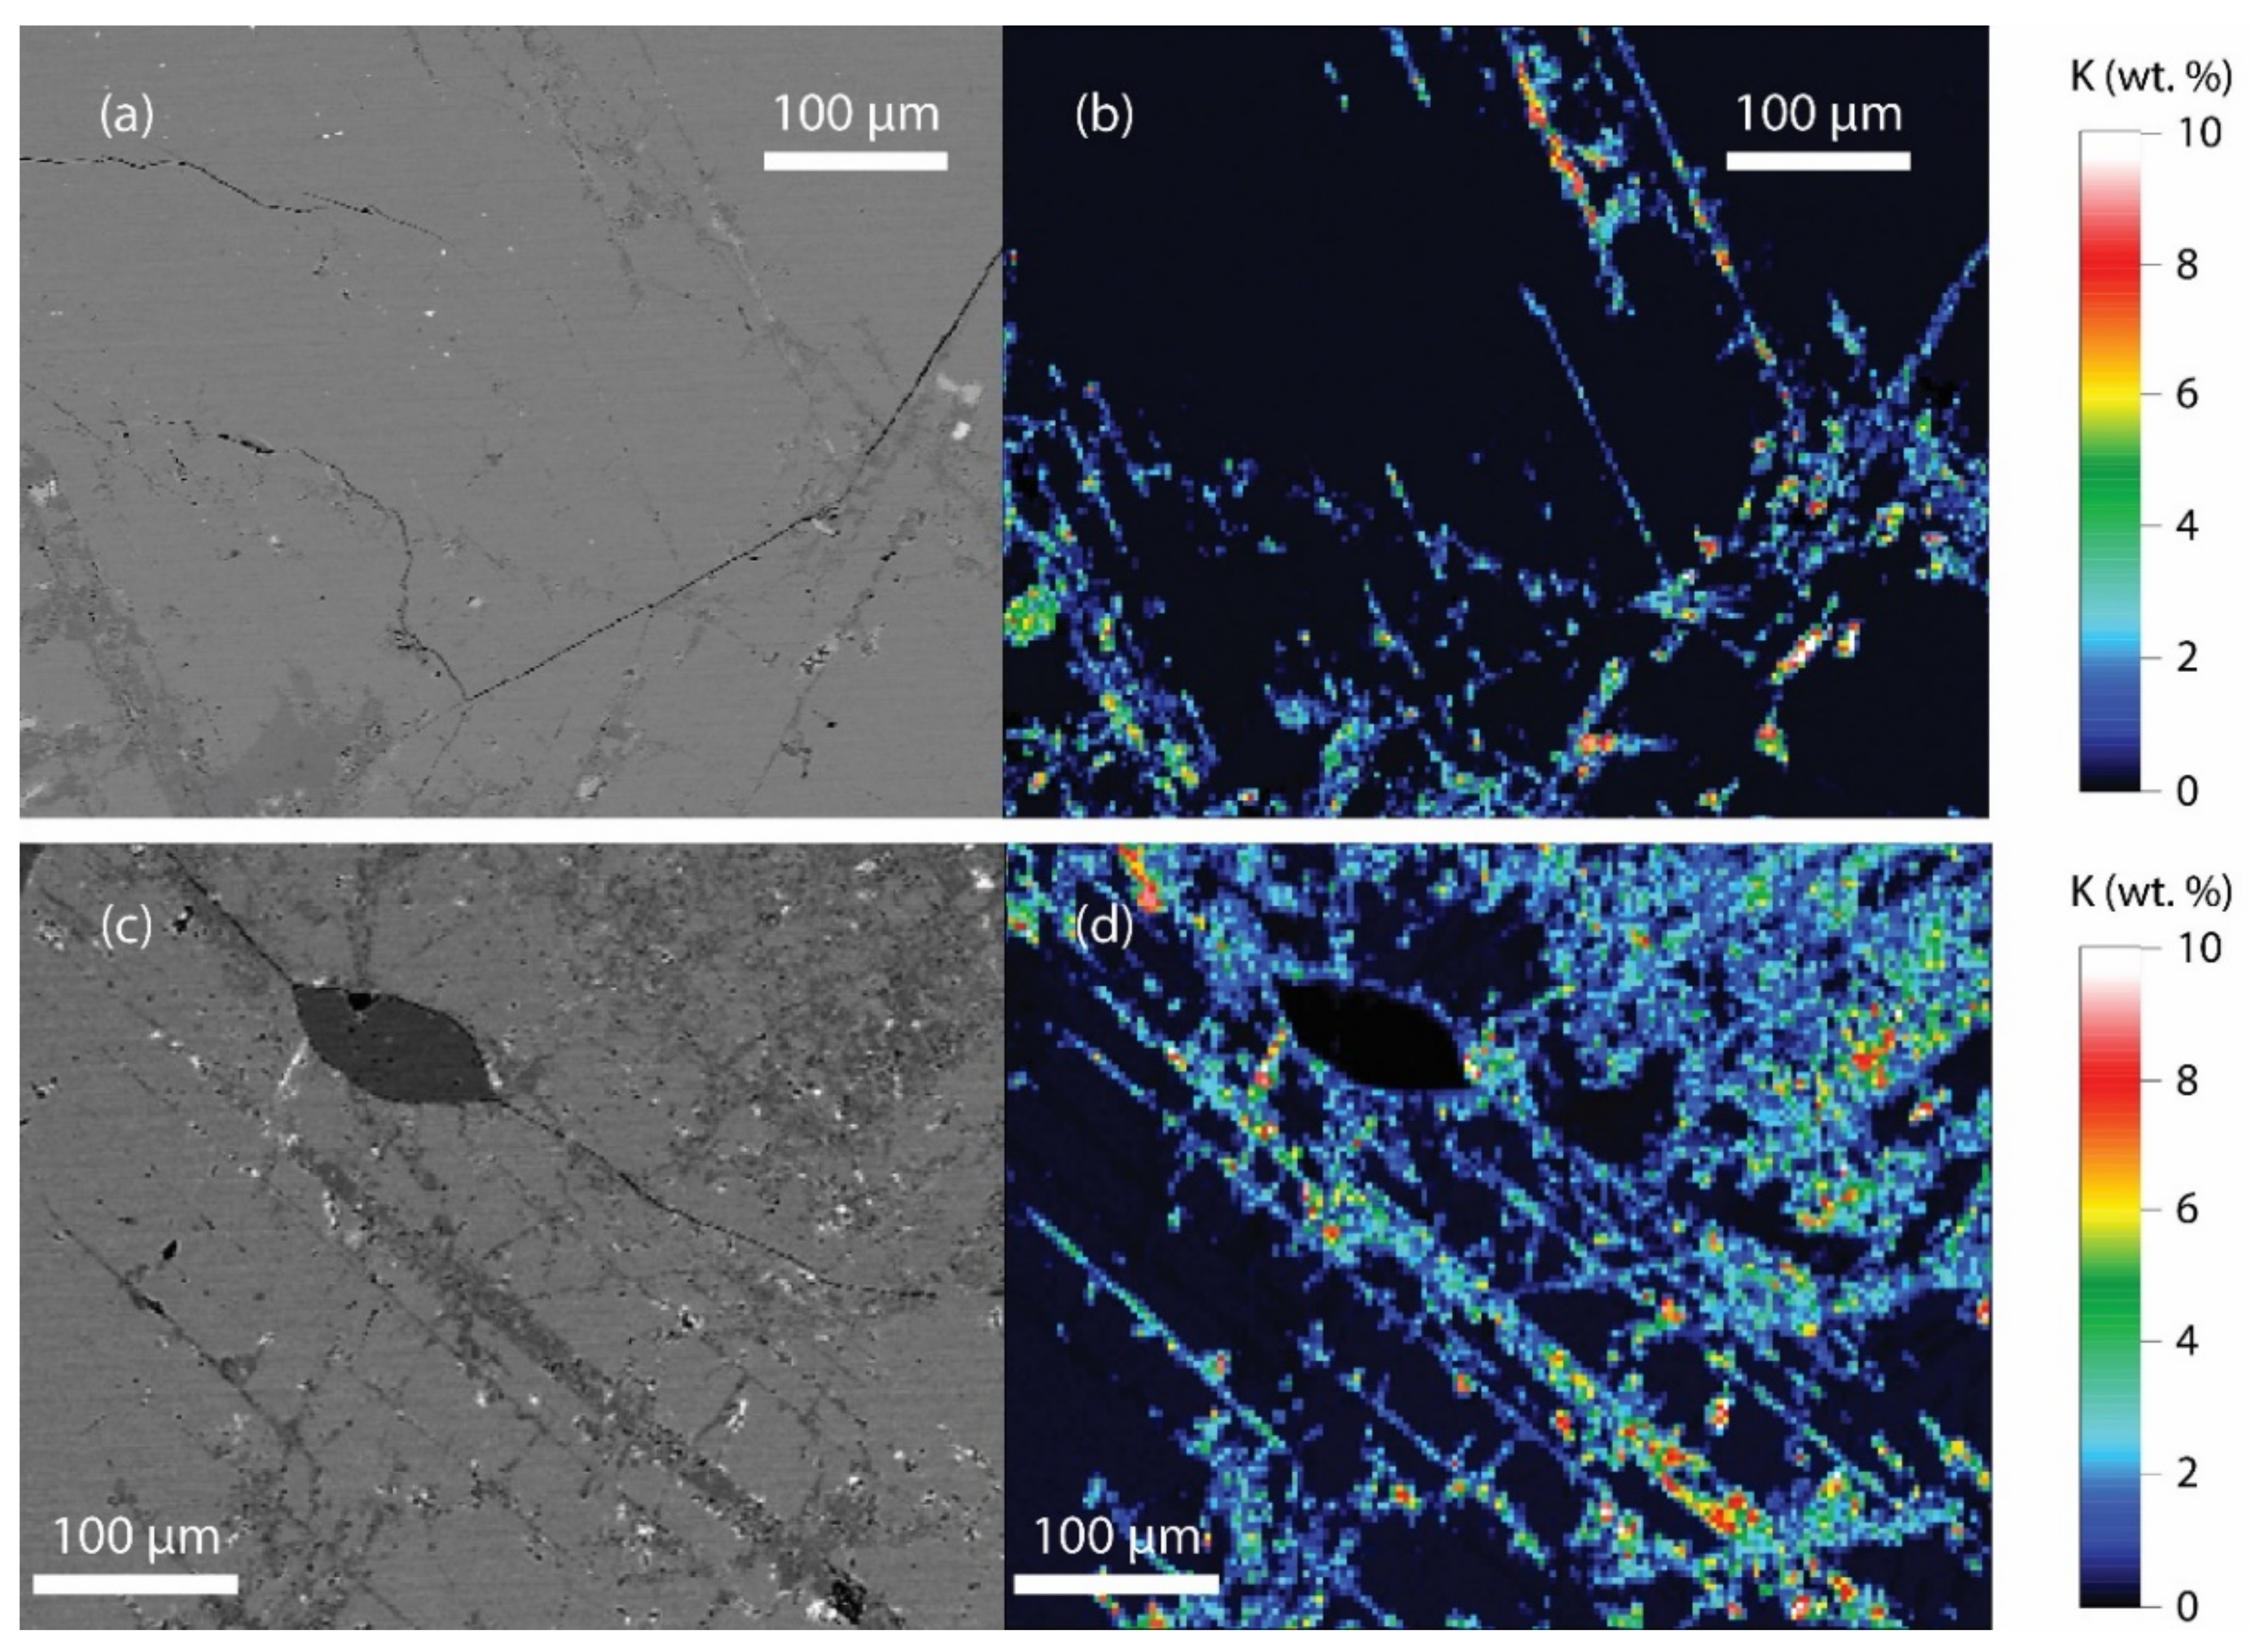
As K abundances are low in all samples (bulk rock XRF K2O concentrations of 0.70–1.65 wt%), even slight variations in K concentration in a major phase (e.g., hornblende or feldspar) could skew the resulting reconstructed K wt% significantly, relative to the XRF concentration. Quantitative major element mapping of feldspar and hornblende grains was conducted by EPMA to explore this further. The maps revealed K-rich areas in feldspar (up to ~10 wt%) (Figure 5), which correspond to grains that show signs of sericite alteration (cloudy and patchy areas when viewed in transmitted light). These zones were not detected as a separate phase during EDS phase mapping. This is likely due to the fine-scale of the K-rich zones (typically <10 μm) and the fact that most of the K variation in the feldspars is still low in concentration relative to Ca and Na, so the semi-quantitative EDS phase mapping does not detect it as a separate phase. Higher count rates and mapping at higher spatial resolution would detect these areas, but with current detector technology, entire thin section maps would become unfeasibly long (many days).
The identified K-addition to feldspar most likely occurred during the protracted uplift of the KSZ. Proterozoic Ar–Ar and Rb–Sr mica and feldspar ages have been reported and were attributed to hydrothermal activity both syn- and post-uplift [24,26,34]. Furthermore, clouding of feldspar in dykes that intruded the KSZ is closely associated with a post-2.45 Ga magnetic reversal [35]. Therefore, the bulk rock XRF analysis, which includes the secondarily enriched K zones, may not be representative of the rock when it resided in the mid-lower crust. If true, the reconstruction approach might yield more accurate primary compositions for granulite terrain samples that exhibit fluid-induced alteration during or after uplift. Even if the secondary alteration is volumetrically minor, it can have a significant effect on the concentration of mobile, highly incompatible elements such as Rb and K, as these elements are typically enriched in the fluids that would be involved in a post-exhumation alteration event.
Other discrepancies between the reconstitution major element compositions and the XRF data include varying FeO and MgO concentrations, typically reversely proportional to SiO2. This is likely explained by compositional banding. A single thin section cut in one orientation is not representative of the whole rock sample that is powdered for XRF analysis, which is typically at least fist-sized. Samples 6KB50 and 6KB52 exhibit the thickest and most prominent compositional bands (>10 mm) and these two samples show the greatest deficiencies in Fe and Mg concentrations, relative to the XRF data. They also have lower concentrations for most trace elements compared to the solution ICPMS data (Figure 4). This indicates that, relative to the bulk rock, the thin sections have higher proportions of quartz and plagioclase feldspar, which contain little to no Fe, Mg and most incompatible trace elements, and lower proportions of the most abundant mafic phase, hornblende. Lower crustal xenoliths, by contrast to gneisses from terrains, are commonly granoblastic and have massive equilibrated textures and relatively simple mineralogies (Figure 6) [36,37,38]. This is primarily because xenoliths are entrained by rapidly rising magmas rather than being tectonically exhumed, improving survival of massive, granoblastic textures. Therefore, bias due to oversampling of bands of a particular composition is not expected to be an issue for most xenoliths. When banded samples are investigated using this approach, caution must be exercised, and it is recommended that multiple thin sections in the three major directions are cut if possible so an average modal mineralogy can be obtained.
From the point of view of pure analytical uncertainty, the EDS phase mapping is the largest source and propagates through the entire reconstruction method. The pixel resolution (4 μm/pixel in this study) and the count rate together control the uncertainties associated with EDS phase mapping. They are primarily a function of EDS detector size and time limitations. For each specimen, the introduced uncertainty is unique because grain size, grain shape, and the number of phases present all increase uncertainty. In mineralogically simple samples with large grains and straight grain boundaries, the uncertainty on the rock-forming phase abundance is <2%, on par with the uncertainty in mineral densities that are used for converting volumetric modes to mass abundance. In more complex samples, the modal uncertainty for rock-forming minerals can be as high as 5%. Due to their smaller grain size, the estimated uncertainty of the accessory phases increases to 5–10%, depending on the paucity of the phase, and is not improved with higher spatial resolution BSE maps. In compositionally banded samples, the phase-mapping uncertainty is still smaller than issues arising from the representativeness of the thin section.
The alternative to EDS phase mapping would be to combine bulk rock major element and mineral composition to calculate the modal mineralogy [15,39]. This approach a priori requires samples large enough for crushing and milling for the bulk rock analysis. It also carries the limitation that the bulk rock could be influenced by secondary enrichment (e.g., in K and Na) such that certain phases might be overestimated. For accessory phases, an additional problem arises when the rock-forming minerals contain significant inventories of the elements (e.g., Zr, P, Ti) that are the main constituents of the accessory mineral (e.g., zircon, apatite, rutile). With rapidly improving EDS detector technology, whole thin section phase mapping at higher spatial resolution and with higher count rates will reduce the current main uncertainty of the approach.
Accuracy and precision of the EMPA major element data and variation in major element composition are not a significant source of uncertainty in these types of sample. As expected for well-equilibrated granulite rocks, the variability within the EPMA analyses is not much greater than the analytical uncertainty. The mineral trace element data obtained by LA-ICPMS are less precise than the bulk rock solution ICPMS data (typically ca. 2% [40]). However, to obtain more accurate, primary compositions for lower crustal samples, similar to mantle samples [15], it is critical to identify potential areas of secondary incompatible trace element enrichment and the in situ analysis is superior in this regard. The LA-ICPMS uncertainty depends on many factors, including the number of elements analysed (as dwell time decreases for more analytes), the sensitivity of the instrument, the size of the laser beam, and absolute elemental concentration. The uncertainty ranges from 3–5% for more abundant trace elements to 25% for ultra-low concentration elements. A conservative estimate for the aggregated trace element analytical uncertainty of the approach is 25%. We argue that the lower precision of the reconstruction approach compared to bulk rock analysis is a necessary trade-off to obtain a more accurate estimate of the original composition of the lower crust, avoiding issues related to later re-enrichment. In samples that are compositionally banded, the approach should only be used if several thin sections are cut to capture the full compositional range.
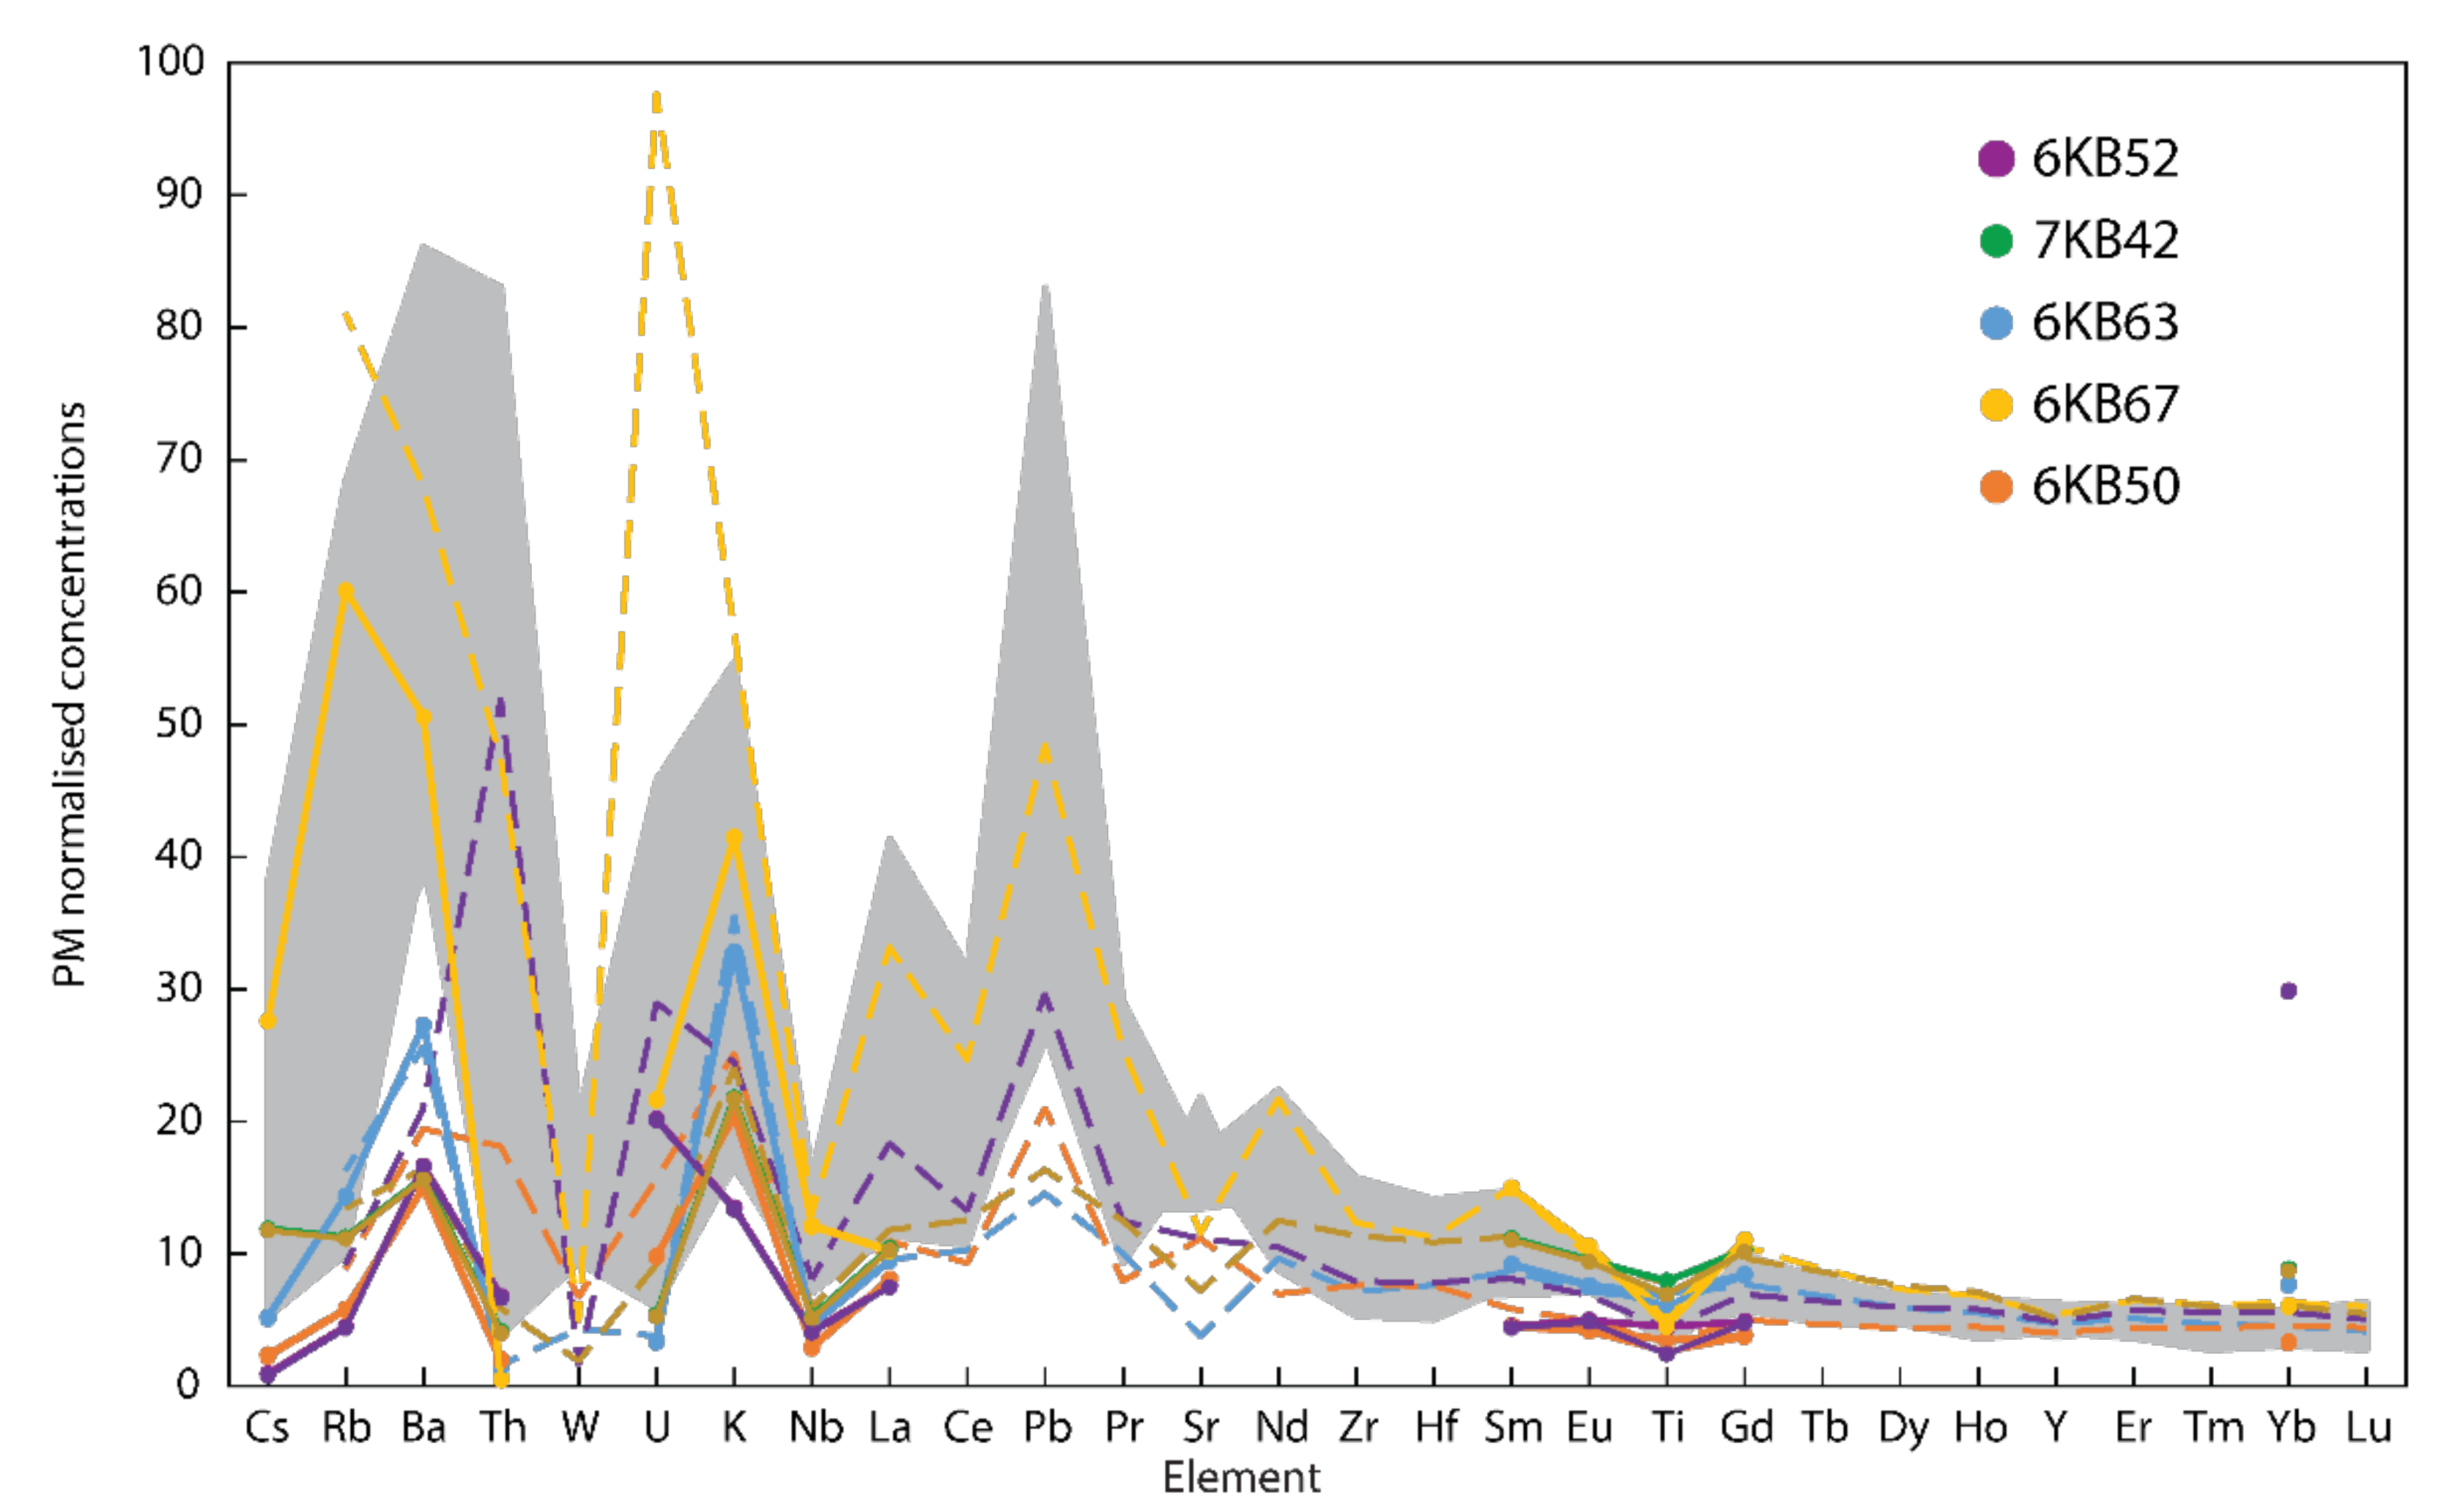
The analytical uncertainty of the reconstruction approach pales in comparison with the discrepancy between current lower continental crustal estimates for the highly lithophile elements. The comparison of the reconstituted and bulk rock data for the KSZ granulites with published best estimates of average lower crustal composition highlights the magnitude of the issue (Figure 7). Whether analysed by bulk methods or reconstituted, the KSZ granulites plot at the lower concentration end of current estimates, and in some elements (e.g. Ba, La) the gneisses are below even the most refractory estimates. This difference is likely a reflection of representativeness, and in this regard, the reconstruction approach has the potential to vastly increase the number of samples than can be used for chemical estimates because small samples can be measured. Using the approach with smaller samples may also help to reduce sampling bias, as mafic xenoliths may be more likely to avoid disaggregation in the basaltic magma than felsic xenoliths [2].
4.2. Distribution of the Trace Elements
Using a reconstruction approach provides insight into how the different trace elements are distributed through the various mineral phases present in each sample. The trace elements measured by in situ analysis were chosen to cover a range of chemical behaviours in common rock-forming and accessory minerals, with a focus on the most incompatible elements and the HPE. In the KSZ samples, Sc, as a relatively compatible element, is distributed between the major mafic phases, hornblende, pyroxene and garnet. Its underestimation in the reconstructed compositions of samples 6KB50 and 6KB52 relative to the bulk rock concentrations (Figure 4) highlights again that the modal abundances of these samples are likely skewed towards higher felsic mineral proportions. Barium is typically evenly distributed between hornblende and feldspar. If present in a sample, biotite is the other major host of Ba. As hornblende and feldspar are the most abundant mafic and felsic phases, respectively, the Ba content calculated from the reconstitution approach generally follows the bulk rock concentration quite well. The other large ion lithophile elements investigated in this study, Rb, Cs and Tl, are primarily concentrated in hornblende and biotite if present. The reconstituted Rb and Cs concentrations follow a similar trend to K, indicating later addition of these elements to the granulites with secondary phases. Niobium, which was measured to get an idea of the high field strength element distribution, is dominantly controlled by hornblende and the Ti-phases, ilmenite and titanite. The reconstructed Nb concentrations reproduce the bulk rock data for the three mafic samples but are lower for the two felsic, banded samples.
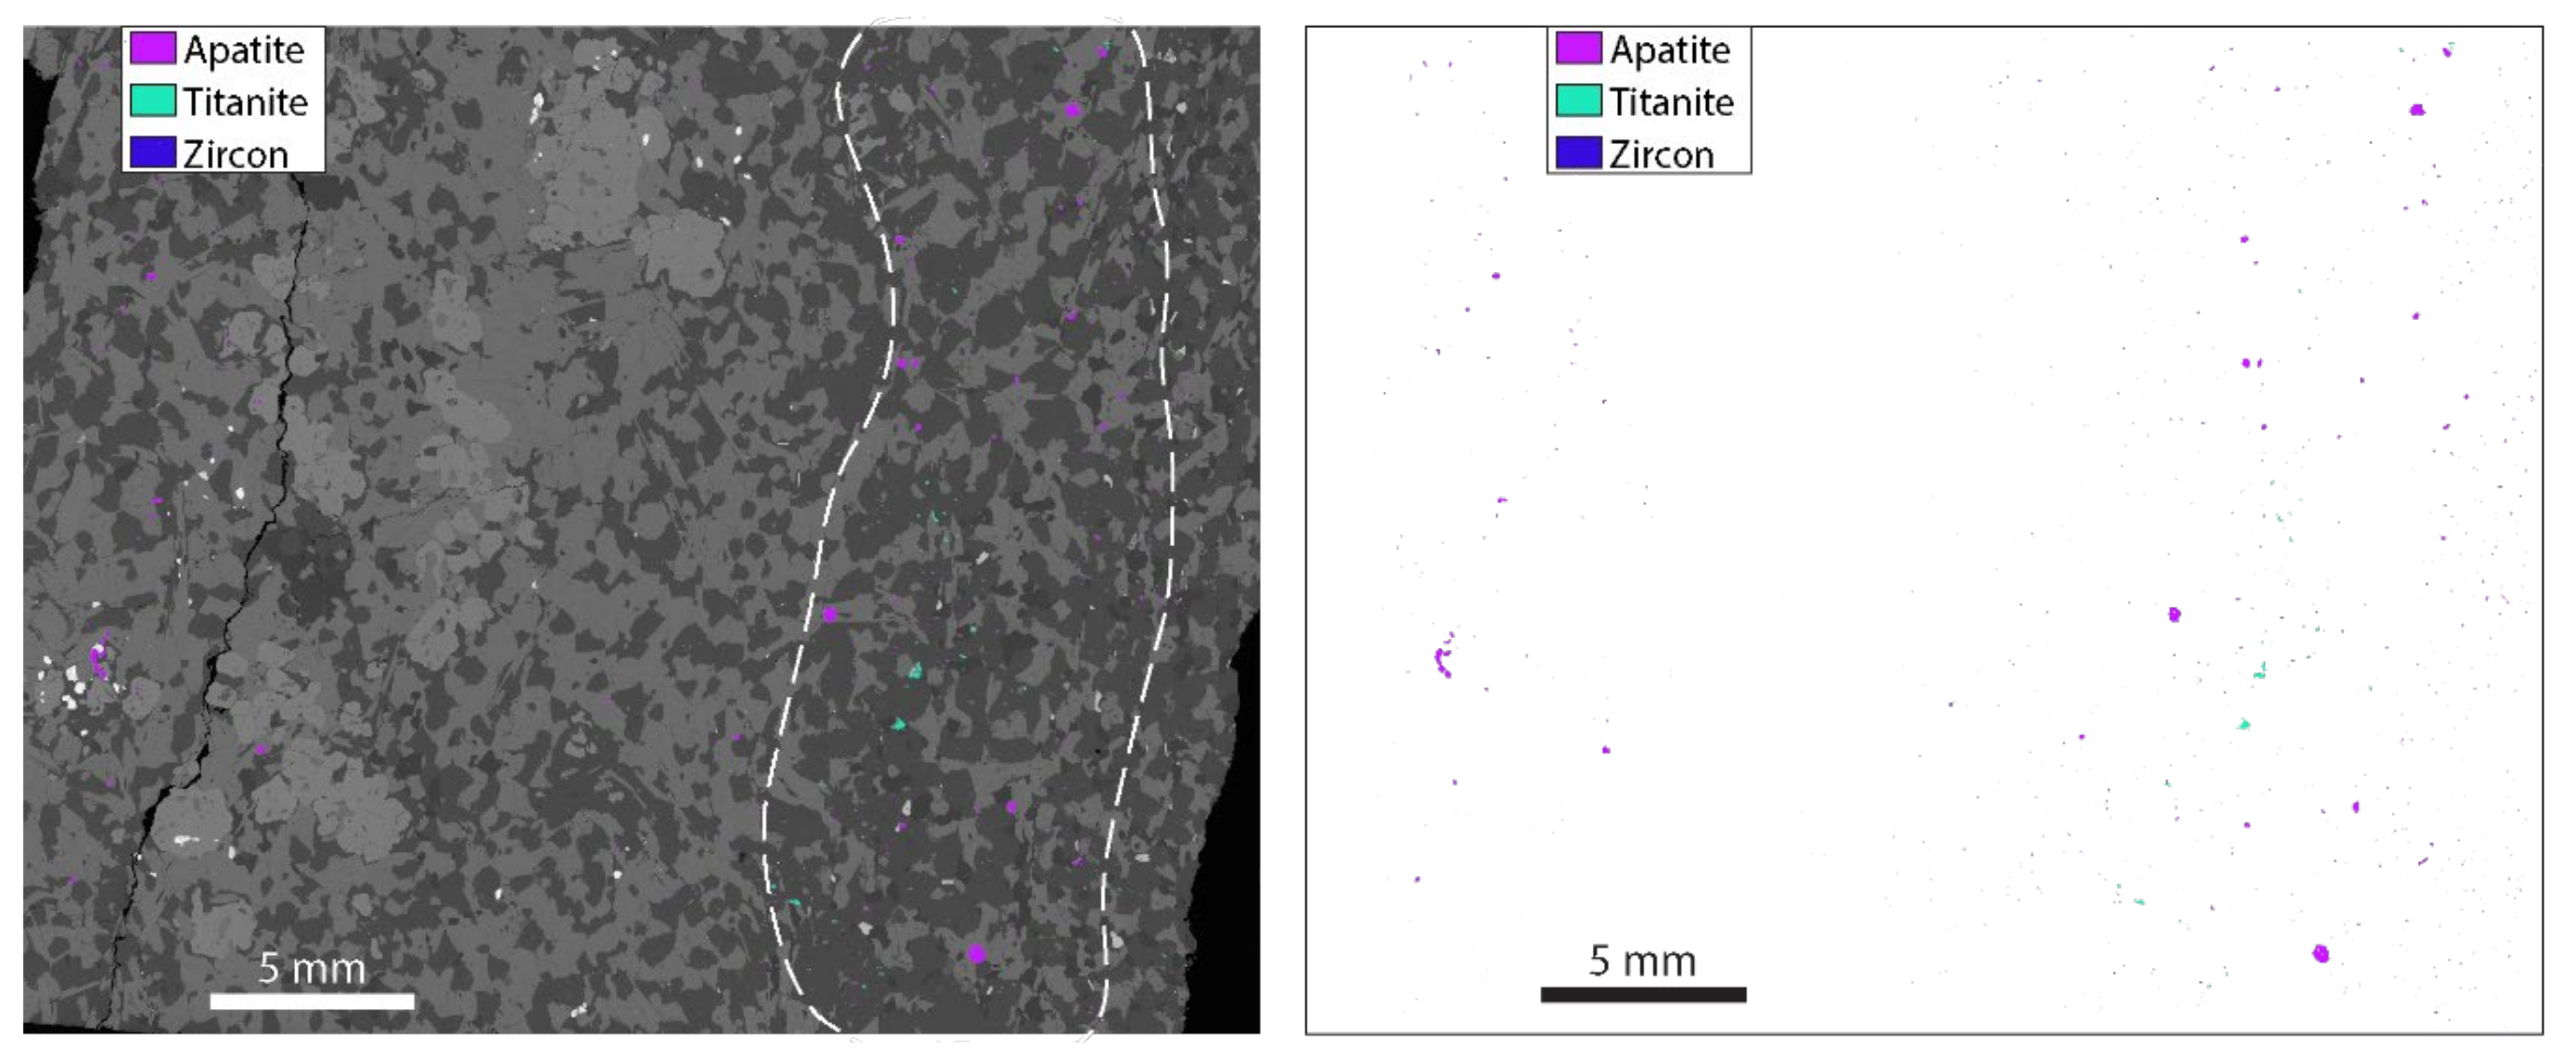
The light and medium REE, U and Th whole rock budget of the KSZ gneisses is largely controlled by amphibole and the accessory phases apatite, titanite and zircon, while the heavy REE concentrations are predictably controlled by garnet. Accurately constraining the abundance and distribution of the accessory phases, and any inter- and intra-grain trace element variation of these phases is essential for reconstructing whole rock trace element compositions. For samples 6KB63 and 7KB42, reconstructed trace element concentrations show good correspondence to the solution ICPMS data for the light and medium REE, U and Th (Figure 4). In Sample 6KB67, the reconstituted Th, U and La concentrations are lower than the solution ICPMS data. This discrepancy suggests that the accessory phase abundances are underestimated in this sample. In thin section, most of the titanite, apatite and zircon grains in this sample are distributed throughout a ~1 cm thick felsic band in this sample (Figure 8).
Combining the approach in this study and in situ isotopic analysis, with a focus on how the accessory phases are distributed could provide further insight into the formation, composition and evolution of difficult samples that have been affected by secondary processes. In situ isotopic analysis (e.g., Sm–Nd) of datable REE, Th, U-bearing accessory phases has recently become a useful tool for investigating crustal evolution as the age data, isotopic information and trace element systematics can be combined to assess if (and when) the whole rock Sm–Nd system has been disturbed [41,42,43,44].
In samples where accessory phases are more randomly distributed throughout the sample (e.g., 6KB63 and 7KB42), the Th, U, light REE and middle REE concentrations closely match the conventional bulk rock data. This again highlights the limitations of the reconstruction approach for banded samples, and this problem can be particularly amplified for trace elements that are highly concentrated in accessory phases. Non-banded lower crustal xenoliths, however, would suffer substantially less from this limitation. Most of the whole rock heavy REE budget is sequestered into garnet. Therefore, the Yb content in the reconstituted compositions provides a good indicator of whether the proportion of garnet in thin section is being overestimated (6KB52 and, to a lesser extent, 6KB63), slightly underestimated (6KB50) or accurately estimated (6KB67 and 7KB42) relative to the bulk rock contents.
The reconstruction approach is particularly useful for obtaining accurate trace element concentrations of lower crustal samples when they resided in the deep crust, especially for mobile, highly incompatible elements, such as Rb and Cs, that are enriched in carrier basalts or in fluids that may infiltrate the rock during an alteration/metasomatic event. It is recommended that future studies investigating the whole rock chemistry of lower crustal xenoliths and granulite terrain rocks that exhibit alteration, even if it is relatively minor, utilise a reconstitution approach. This will ensure that the compositions obtained will be the best representation of lower crustal samples when they resided in the deep crust. These reconstructed concentrations can be used to more accurately estimate the composition of the LCC.
By comparison with the disparity in current estimates of LCC HPE concentrations, ranging from factors of 3 (K) to 20 (Th), the inaccuracies of the reconstituted elemental abundances of this study are significantly smaller, except for sample KB67 with the strongly accessory mineral-enriched band (Figure 8). Therefore, we propose that this method holds promise to obtain better convergence on the incompatible element inventory of the LCC. The current method is limited to the analysis of relatively few trace elements, but this can be overcome with the use of a more sensitive quadrupole ICPMS (e.g., [45]) or an ICP time-of-flight MS instrument (e.g., [46]).
5. Conclusions
A reconstruction approach for analysing whole rock major and trace element compositions of lower crustal rocks was tested on samples from the KSZ, with a particular emphasis on the most incompatible elements. Mineral major and trace element concentrations were combined with modal abundances obtained by SEM-EDS phase mapping. A comparison of the reconstituted data with conventional bulk rock data of the samples provided an insight into potential pitfalls and benefits of using a reconstitution approach for lower crustal samples.
The reconstructed major element compositions match up closely with the XRF bulk rock data unless the sample exhibits coarse banding or alteration. For the trace elements, higher concentrations of highly incompatible elements, such as K and Rb, in the bulk rock data are attributed to post-exhumation hydrothermal activity leading to sericitisation of feldspars. Even a small amount of this alteration could greatly affect the trace element budget. Other trace element concentrations obtained by the reconstitution approach accurately reflect the bulk rock concentrations if the modal abundances of the accessory phases are accurately estimated.
The trace element data show that the incompatible trace elements are distributed throughout the major phases as well as the accessory phases, so all phases in granulite samples must be accurately analysed to obtain meaningful reconstructed compositions. The approach can be used to determine the primary composition of lower crustal rocks when they resided in the deep crust and can avoid the effects of host magma contamination or alteration products, which are commonly enriched in highly incompatible elements. Avoiding these enriched secondary products when obtaining whole rock data of granulite samples will help to more accurately constrain the composition of the deepest reaches of Earth’s continental crust.
The approach will be particularly useful for expanding the sample inventory of the lower crust, as it can be applied to small samples (1–3 cm diameter) that often dominate lower crustal xenolith populations but have remained unsuitable for bulk rock analysis.
Supplementary Materials
The following are available online at https://www.mdpi.com/2075-163X/10/6/573/s1: Table S1: Bulk rock major and trace element data of secondary standards from XRF and solution ICPMS analysis, Table S2: Major element data for the secondary standards analysed by EPMA. Table S3: Trace element data for secondary standards analysed by LA-ICPMS, Table S4: Major element data for mineral phases in the KSZ gneiss samples measured by EPMA, Table S5: Trace element data for mineral phases in the KSZ gneiss samples measured by LA-ICPMS, Supplementary Figure S1: BSE maps of the KSZ gneiss samples.
Author Contributions
Conceptualization, R.B.E. and B.S.K.; Formal analysis, R.B.E.; Writing—original draft, R.B.E.; Writing—review and editing, R.B.E. and B.S.K. All authors have read and agreed to the published version of the manuscript.
Funding
This research was supported by the W.H. Bryan PhD Scholarship awarded to Robert Emo by the Bryan Foundation.
Acknowledgments
Some of the data reported in this paper were obtained at the Central Analytical Research Facility operated by the Institute for Future Environments, Queensland University of Technology. The authors would like to thank Keith Benn for providing the samples for this study. Gus Luthje, Karine Harumi Morozimato, Chris East, Henrietta Cathey, John Caulfield, Foteini Drakou and David Chew are thanked for their assistance during sample preparation and analysis. Two anonymous reviewers provided very constructive suggestions for improvements of the original manuscript.
Conflicts of Interest
The authors declare no conflict of interest. The funders had no role in the design of the study; in the collection, analyses, or interpretation of data; in the writing of the manuscript; or in the decision to publish the results.
References
- Rudnick, R.L.; Gao, S. Composition of the Continental Crust. In Treatise on Geochemistry; Holland, H.D., Turekian, K.K., Eds.; Pergamon: Oxford, UK, 2003; pp. 1–64. [Google Scholar] [CrossRef]
- Rudnick, R.L.; Fountain, D.M. Nature and composition of the continental crust: A lower crustal perspective. Rev. Geophys. 1995, 33, 267–309. [Google Scholar] [CrossRef] [Green Version]
- Wedepohl, K.H. The composition of the continental crust. Geochim. Cosmochim. Acta 1995, 59, 1217–1232. [Google Scholar] [CrossRef]
- Hacker, B.R.; Kelemen, P.B.; Behn, M.D. Continental Lower Crust. Annu. Rev. Earth Planet. Sci. 2015, 43, 167–205. [Google Scholar] [CrossRef] [Green Version]
- Huang, Y.; Chubakov, V.; Mantovani, F.; Rudnick, R.L.; McDonough, W.F. A reference Earth model for the heat-producing elements and associated geoneutrino flux. Geochem. Geophys. Geosystems 2013, 14, 2003–2029. [Google Scholar] [CrossRef] [Green Version]
- Bohlen, S.R.; Mezger, K. Origin of Granulite Terranes and the Formation of the Lowermost Continental Crust. Science 1989, 244, 326–329. [Google Scholar] [CrossRef]
- Rudnick, R.L.; Presper, T. Geochemistry of Intermediate to High-Pressure Granulites. In Granulites and Crustal Evolution; Vielzeuf, D., Vidal, P., Eds.; Kluwer: Amsterdam, The Netherlands, 1990; pp. 523–550. [Google Scholar] [CrossRef]
- Chen, S.; O’Reilly, S.Y.; Zhou, X.; Griffin, W.L.; Zhang, G.; Sun, M.; Feng, J.; Zhang, M. Thermal and petrological structure of the lithosphere beneath Hannuoba, Sino-Korean Craton, China: Evidence from xenoliths. Lithos 2001, 56, 267–301. [Google Scholar] [CrossRef]
- Downes, H. The nature of the lower continental crust of Europe: Petrological and geochemical evidence from xenoliths. Phys. Earth Planet. Inter. 1993, 79, 195–218. [Google Scholar] [CrossRef]
- Griffin, W.L.; Sutherland, F.L.; Hollis, J.D. Geothermal profile and crust-mantle transition beneath east-central Queensland: Volcanology, xenolith petrology and seismic data. J. Volcanol. Geotherm. Res. 1987, 31, 177–203. [Google Scholar] [CrossRef]
- Korenaga, J. Urey ratio and the structure and evolution of Earth’s mantle. Rev. Geophys. 2008, 46. [Google Scholar] [CrossRef] [Green Version]
- Jaupart, C.; Labrosse, S.; Lucazeau, F.; Mareschal, J.-C. Temperatures, Heat, and Energy in the Mantle of the Earth. Treatise Geophys. 2015, 223–270. [Google Scholar] [CrossRef]
- Ireland, T.R.; Rudnick, R.L.; Spetsius, Z. Trace elements in diamond inclusions from eclogites reveal link to Archean granites. Earth Planet. Sci. Lett. 1994, 128, 199–213. [Google Scholar] [CrossRef]
- Jacob, D.E. Nature and origin of eclogite xenoliths from kimberlites. Lithos 2004, 77, 295–316. [Google Scholar] [CrossRef]
- Eggins, S.M.; Rudnick, R.L.; McDonough, W.F. The composition of peridotites and their minerals: A laser-ablation ICP–MS study. Earth Planet. Sci. Lett. 1998, 154, 53–71. [Google Scholar] [CrossRef]
- Barnhart, K.R.; Mahan, K.H.; Blackburn, T.J.; Bowring, S.A.; Dudas, F.O. Deep crustal xenoliths from central Montana, USA: Implications for the timing and mechanisms of high-velocity lower crust formation. Geosphere 2012, 8, 1408–1428. [Google Scholar] [CrossRef]
- Barth, M.G.; Rudnick, R.L.; Horn, I.; McDonough, W.F.; Spicuzza, M.J.; Valley, J.W.; Haggerty, S.E. Geochemistry of xenolithic eclogites from West Africa, part I: A link between low MgO eclogites and archean crust formation. Geochim. Cosmochim. Acta 2001, 65, 1499–1527. [Google Scholar] [CrossRef]
- Babechuk, M.G.; Kamber, B.S.; Greig, A.; Canil, D.; Kodolányi, J. The behaviour of tungsten during mantle melting revisited with implications for planetary differentiation time scales. Geochim. Cosmochim. Acta 2010, 74, 1448–1470. [Google Scholar] [CrossRef]
- McDonough, W.F.; Sun, S.-S. The composition of the Earth. Chem. Geol. 1995, 120, 223–253. [Google Scholar] [CrossRef]
- Qian, S.-P.; Ren, Z.-Y.; Zhang, L.; Hong, L.-B.; Liu, J.-Q. Chemical and Pb isotope composition of olivine-hosted melt inclusions from the Hannuoba basalts, North China Craton: Implications for petrogenesis and mantle source. Chem. Geol. 2015, 401, 111–125. [Google Scholar] [CrossRef]
- Jones, I.; Ubide, T.; Crossingham, T.; Wilding, B.; Verdel, C. Evidence of a common source component for east Australian Cenozoic mafic magmatism. Lithos 2020, 354–355, 105254. [Google Scholar] [CrossRef]
- Boland, A.V.; Ellis, R.M.; Northey, D.J.; West, G.F.; Green, A.G.; Forsyth, D.A.; Mereu, R.F.; Meyer, R.P.; Morel-à-I’Huissier, P.; Buchbinder, G.G.R.; et al. Seismic delineation of upthrust Archaean crust in Kapuskasing, Northern Ontario. Nature 1988, 335, 711–713. [Google Scholar] [CrossRef]
- Fountain, D.M.; Salisbury, M.H.; Percival, J. Seismic structure of the continental crust based on rock velocity measurements from the Kapuskasing Uplift. J. Geophys. Res. Solid Earth 1990, 95, 1167–1186. [Google Scholar] [CrossRef]
- Percival, J.A.; West, G.F. The Kapuskasing uplift: A geological and geophysical synthesis. Can. J. Earth Sci. 1994, 31, 1256–1286. [Google Scholar] [CrossRef]
- Benn, K.; Kamber, B.S. In Situ U/Pb Granulite-Hosted Zircon Dates, Kapuskasing Structural Zone, Ontario: A Late Archean Large Igneous Province (LIP) as a Substrate for Juvenile Crust. J. Geol. 2009, 117, 519–541. [Google Scholar] [CrossRef]
- Hanes, J.A.; Archibald, D.A.; Queen, M.; Farrar, E. Constraints from 40Ar/39Ar geochronology on the tectonothermal history of the Kapuskasing uplift in the Canadian Superior Province. Can. J. Earth Sci. 1994, 31, 1146–1171. [Google Scholar] [CrossRef]
- Jochum, K.P.; Weis, U.; Stoll, B.; Kuzmin, D.; Yang, Q.; Raczek, I.; Jacob, D.E.; Stracke, A.; Birbaum, K.; Frick, D.A.; et al. Determination of Reference Values for NIST SRM 610–617 Glasses Following ISO Guidelines. Geostand. Geoanalytical Res. 2011, 35, 397–429. [Google Scholar] [CrossRef]
- Ulrich, T.; Kamber, B.S. Natural Obsidian Glass as an External Accuracy Reference Material in Laser Ablation-Inductively Coupled Plasma-Mass Spectrometry. Geostand. Geoanalytical Res. 2013, 37, 169–188. [Google Scholar] [CrossRef]
- Wiedenbeck, M.; Hanchar, J.M.; Peck, W.H.; Sylvester, P.; Valley, J.; Whitehouse, M.J.; Kronz, A.; Morishita, Y.; Nasdala, L.; Fiebig, J.; et al. Further Characterisation of the 91500 Zircon Crystal. Geostand. Geoanalytical Res. 2004, 28, 9–39. [Google Scholar] [CrossRef]
- Chew, D.M.; Babechuk, M.G.; Cogné, N.; Mark, C.; O’Sullivan, G.J.; Henrichs, I.A.; Doepke, D.; McKenna, C.A. (LA,Q)-ICPMS trace-element analyses of Durango and McClure Mountain apatite and implications for making natural LA-ICPMS mineral standards. Chem. Geol. 2016, 435, 35–48. [Google Scholar] [CrossRef]
- Yang, Y.-H.; Wu, F.-Y.; Yang, J.-H.; Chew, D.M.; Xie, L.-W.; Chu, Z.-Y.; Zhang, Y.-B.; Huang, C. Sr and Nd isotopic compositions of apatite reference materials used in U–Th–Pb geochronology. Chem. Geol. 2014, 385, 35–55. [Google Scholar] [CrossRef]
- Ma, Q.; Evans, N.J.; Ling, X.-X.; Yang, J.-H.; Wu, F.-Y.; Zhao, Z.-D.; Yang, Y.-H. Natural Titanite Reference Materials for In Situ U-Pb and Sm-Nd Isotopic Measurements by LA-(MC)-ICP-MS. Geostand. Geoanalytical Res. 2019, 43, 355–384. [Google Scholar] [CrossRef]
- Spandler, C.; Hammerli, J.; Sha, P.; Hilbert-Wolf, H.; Hu, Y.; Roberts, E.; Schmitz, M. MKED1: A new titanite standard for in situ analysis of Sm–Nd isotopes and U–Pb geochronology. Chem. Geol. 2016, 425, 110–126. [Google Scholar] [CrossRef]
- Percival, J.A.; Peterman, Z.E. Rb–Sr biotite and whole-rock data from the Kapuskasing uplift and their bearing on the cooling and exhumation history. Can. J. Earth Sci. 1994, 31, 1172–1181. [Google Scholar] [CrossRef]
- Halls, H.C.; Zhang, B. Crustal uplift in the southern Superior Province, Canada, revealed by paleomagnetism. Tectonophysics 2003, 362, 123–136. [Google Scholar] [CrossRef]
- Thakurdin, Y.; Bolhar, R.; Horváth, P.; Rocholl, A.; Collerson, K. Characterization of crustal xenoliths from the Bearpaw Mountains, Montana (USA), using U-Pb geochronology, whole-rock geochemistry and thermobarometry, with implications for lower crustal processes and evolution of the Wyoming Craton. Chem. Geol. 2019, 524, 295–322. [Google Scholar] [CrossRef]
- Rudnick, R.L.; Taylor, S.R. The composition and petrogenesis of the lower crust: A xenolith study. J. Geophys. Res. Solid Earth 1987, 92, 13981–14005. [Google Scholar] [CrossRef]
- Scherer, E.E.; Cameron, K.L.; Johnson, C.M.; Beard, B.L.; Barovich, K.M.; Collerson, K.D. Lu-Hf geochronology applied to dating Cenozoic events affecting lower crustal xenoliths from Kilbourne Hole, New Mexico. Chem. Geol. 1997, 142, 63–78. [Google Scholar] [CrossRef]
- Boyd, F.R.; McCallister, R.H. Densities of fertile and sterile garnet peridotites. Geophys. Res. Lett. 1976, 3, 509–512. [Google Scholar] [CrossRef]
- Eggins, S.M.; Woodhead, J.D.; Kinsley, L.P.J.; Mortimer, G.E.; Sylvester, P.; McCulloch, M.T.; Hergt, J.M.; Handler, M.R. A simple method for the precise determination of ≥ 40 trace elements in geological samples by ICPMS using enriched isotope internal standardisation. Chem. Geol. 1997, 134, 311–326. [Google Scholar] [CrossRef]
- McFarlane, C.R.M.; McCulloch, M.T. Coupling of in-situ Sm–Nd systematics and U–Pb dating of monazite and allanite with applications to crustal evolution studies. Chem. Geol. 2007, 245, 45–60. [Google Scholar] [CrossRef]
- Fisher, C.M.; Bauer, A.M.; Luo, Y.; Sarkar, C.; Hanchar, J.M.; Vervoort, J.D.; Tapster, S.R.; Horstwood, M.; Pearson, D.G. Laser ablation split-stream analysis of the Sm-Nd and U-Pb isotope compositions of monazite, titanite, and apatite—Improvements, potential reference materials, and application to the Archean Saglek Block gneisses. Chem. Geol. 2020, 539, 119493. [Google Scholar] [CrossRef]
- Fisher, C.M.; Bauer, A.M.; Vervoort, J.D. Disturbances in the Sm–Nd isotope system of the Acasta Gneiss Complex—Implications for the Nd isotope record of the early Earth. Earth Planet. Sci. Lett. 2020, 530, 115900. [Google Scholar] [CrossRef]
- Hammerli, J.; Kemp, A.I.S.; Whitehouse, M.J. In situ trace element and Sm-Nd isotope analysis of accessory minerals in an Eoarchean tonalitic gneiss from Greenland: Implications for Hf and Nd isotope decoupling in Earth’s ancient rocks. Chem. Geol. 2019, 524, 394–405. [Google Scholar] [CrossRef]
- Petrus, J.A.; Chew, D.M.; Leybourne, M.I.; Kamber, B.S. A new approach to laser-ablation inductively-coupled-plasma mass-spectrometry (LA-ICP-MS) using the flexible map interrogation tool ‘Monocle’. Chem. Geol. 2017, 463, 76–93. [Google Scholar] [CrossRef]
- Burger, M.; Schwarz, G.; Gundlach-Graham, A.; Käser, D.; Hattendorf, B.; Günther, D. Capabilities of laser ablation inductively coupled plasma time-of-flight mass spectrometry. J. Anal. At. Spectrom. 2017, 32, 1946–1959. [Google Scholar] [CrossRef]
Figure 1.
Primitive mantle (PM)-normalized [19] extended trace element plots for (a) published compositional estimates of the lower continental crust. The xenolith and terrain estimates of Huang et al. [5] uses median values from their database; (b) alkali basalt samples from the Hannuoba volcanic province [20], a xenolith-bearing province in the North China Craton, and xenolith-bearing Cenozoic volcanic provinces of eastern Queensland, Australia [21]. The range of lower crustal compositions from (a) is shown in grey.

Figure 2.
Simplified mineral phase maps of the KSZ gneiss samples obtained by scanning electron microscope electron-dispersive spectroscopy (SEM-EDS) analysis.
Figure 2.
Simplified mineral phase maps of the KSZ gneiss samples obtained by scanning electron microscope electron-dispersive spectroscopy (SEM-EDS) analysis.
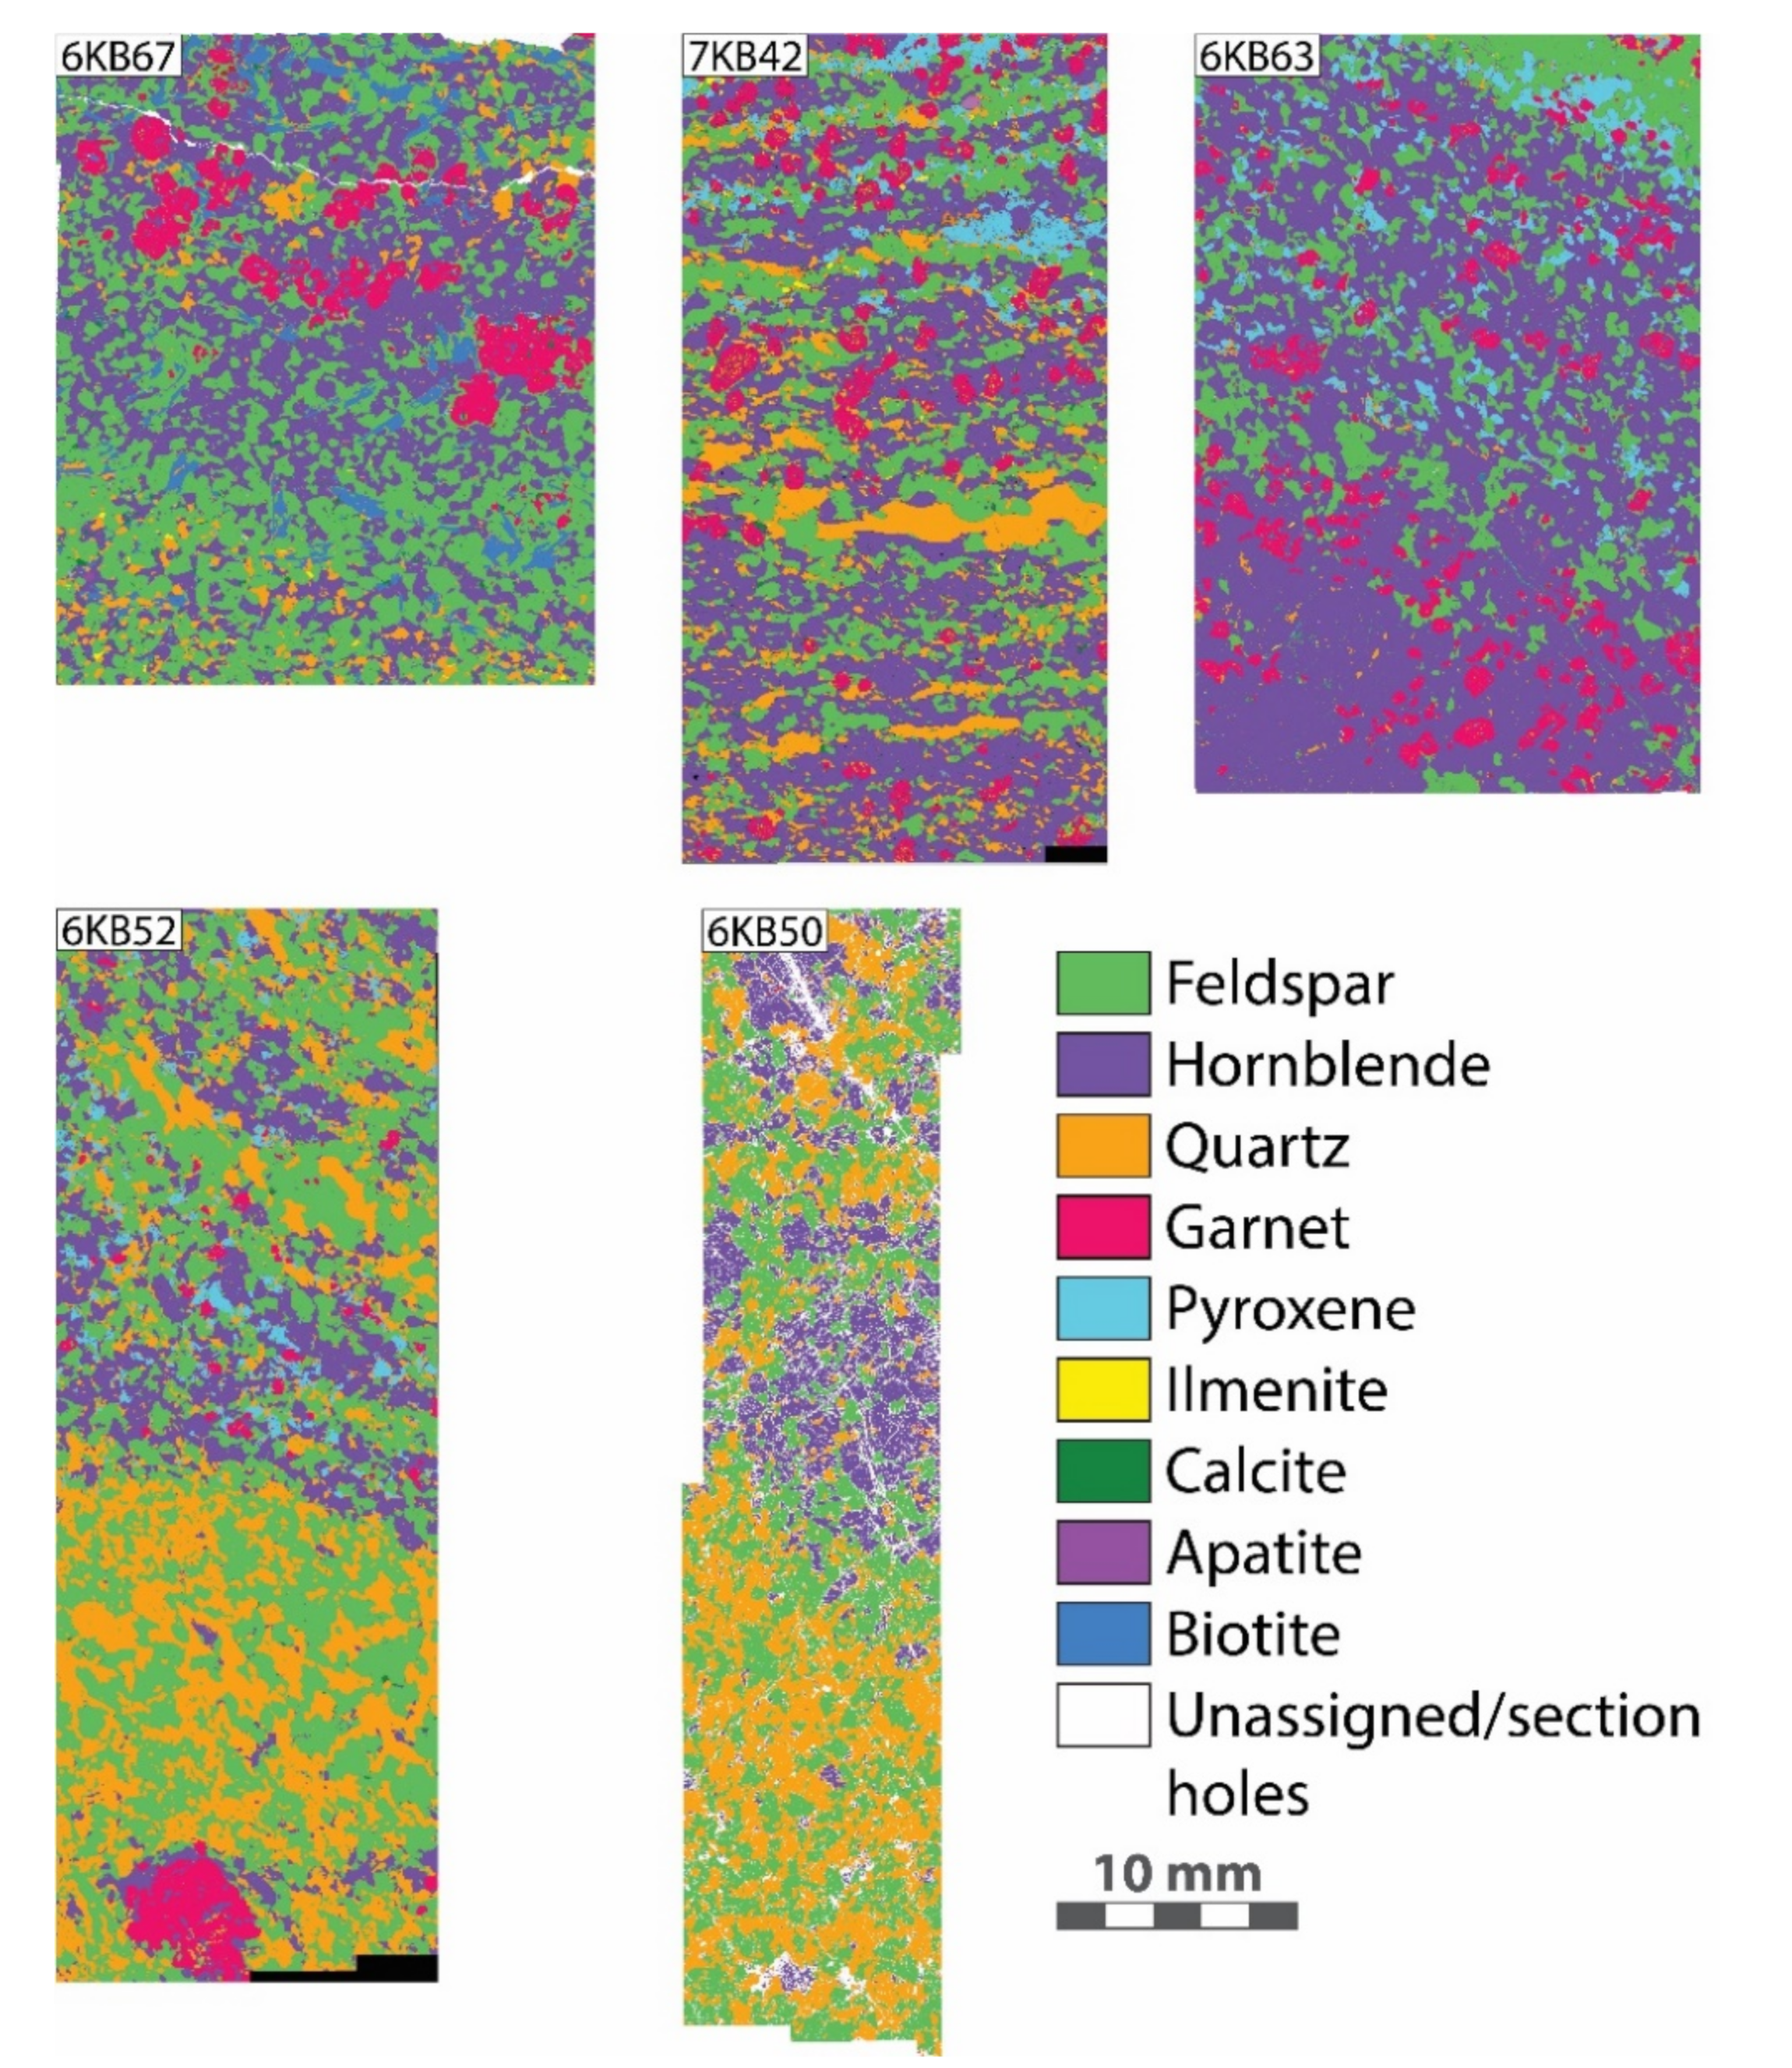
Figure 3.
Comparison of major element concentrations of the five KSZ samples obtained by bulk rock X-ray fluorescence (XRF) and by the reconstruction approach. Symbols refer to different oxides: circles = K2O, diamonds = TiO2, triangles = Na2O, inverted triangles = MgO, asterisks = CaO, plus = FeO, stars = Al2O3, squares = SiO2. The dashed black line shows the theoretical 1:1 fit.

Figure 4.
Comparison of trace element concentrations of the KSZ samples obtained by conventional solution inductively coupled plasma mass spectrometry (ICPMS) and by the reconstruction approach. The dashed black lines show the theoretical 1:1 fits.
Figure 4.
Comparison of trace element concentrations of the KSZ samples obtained by conventional solution inductively coupled plasma mass spectrometry (ICPMS) and by the reconstruction approach. The dashed black lines show the theoretical 1:1 fits.
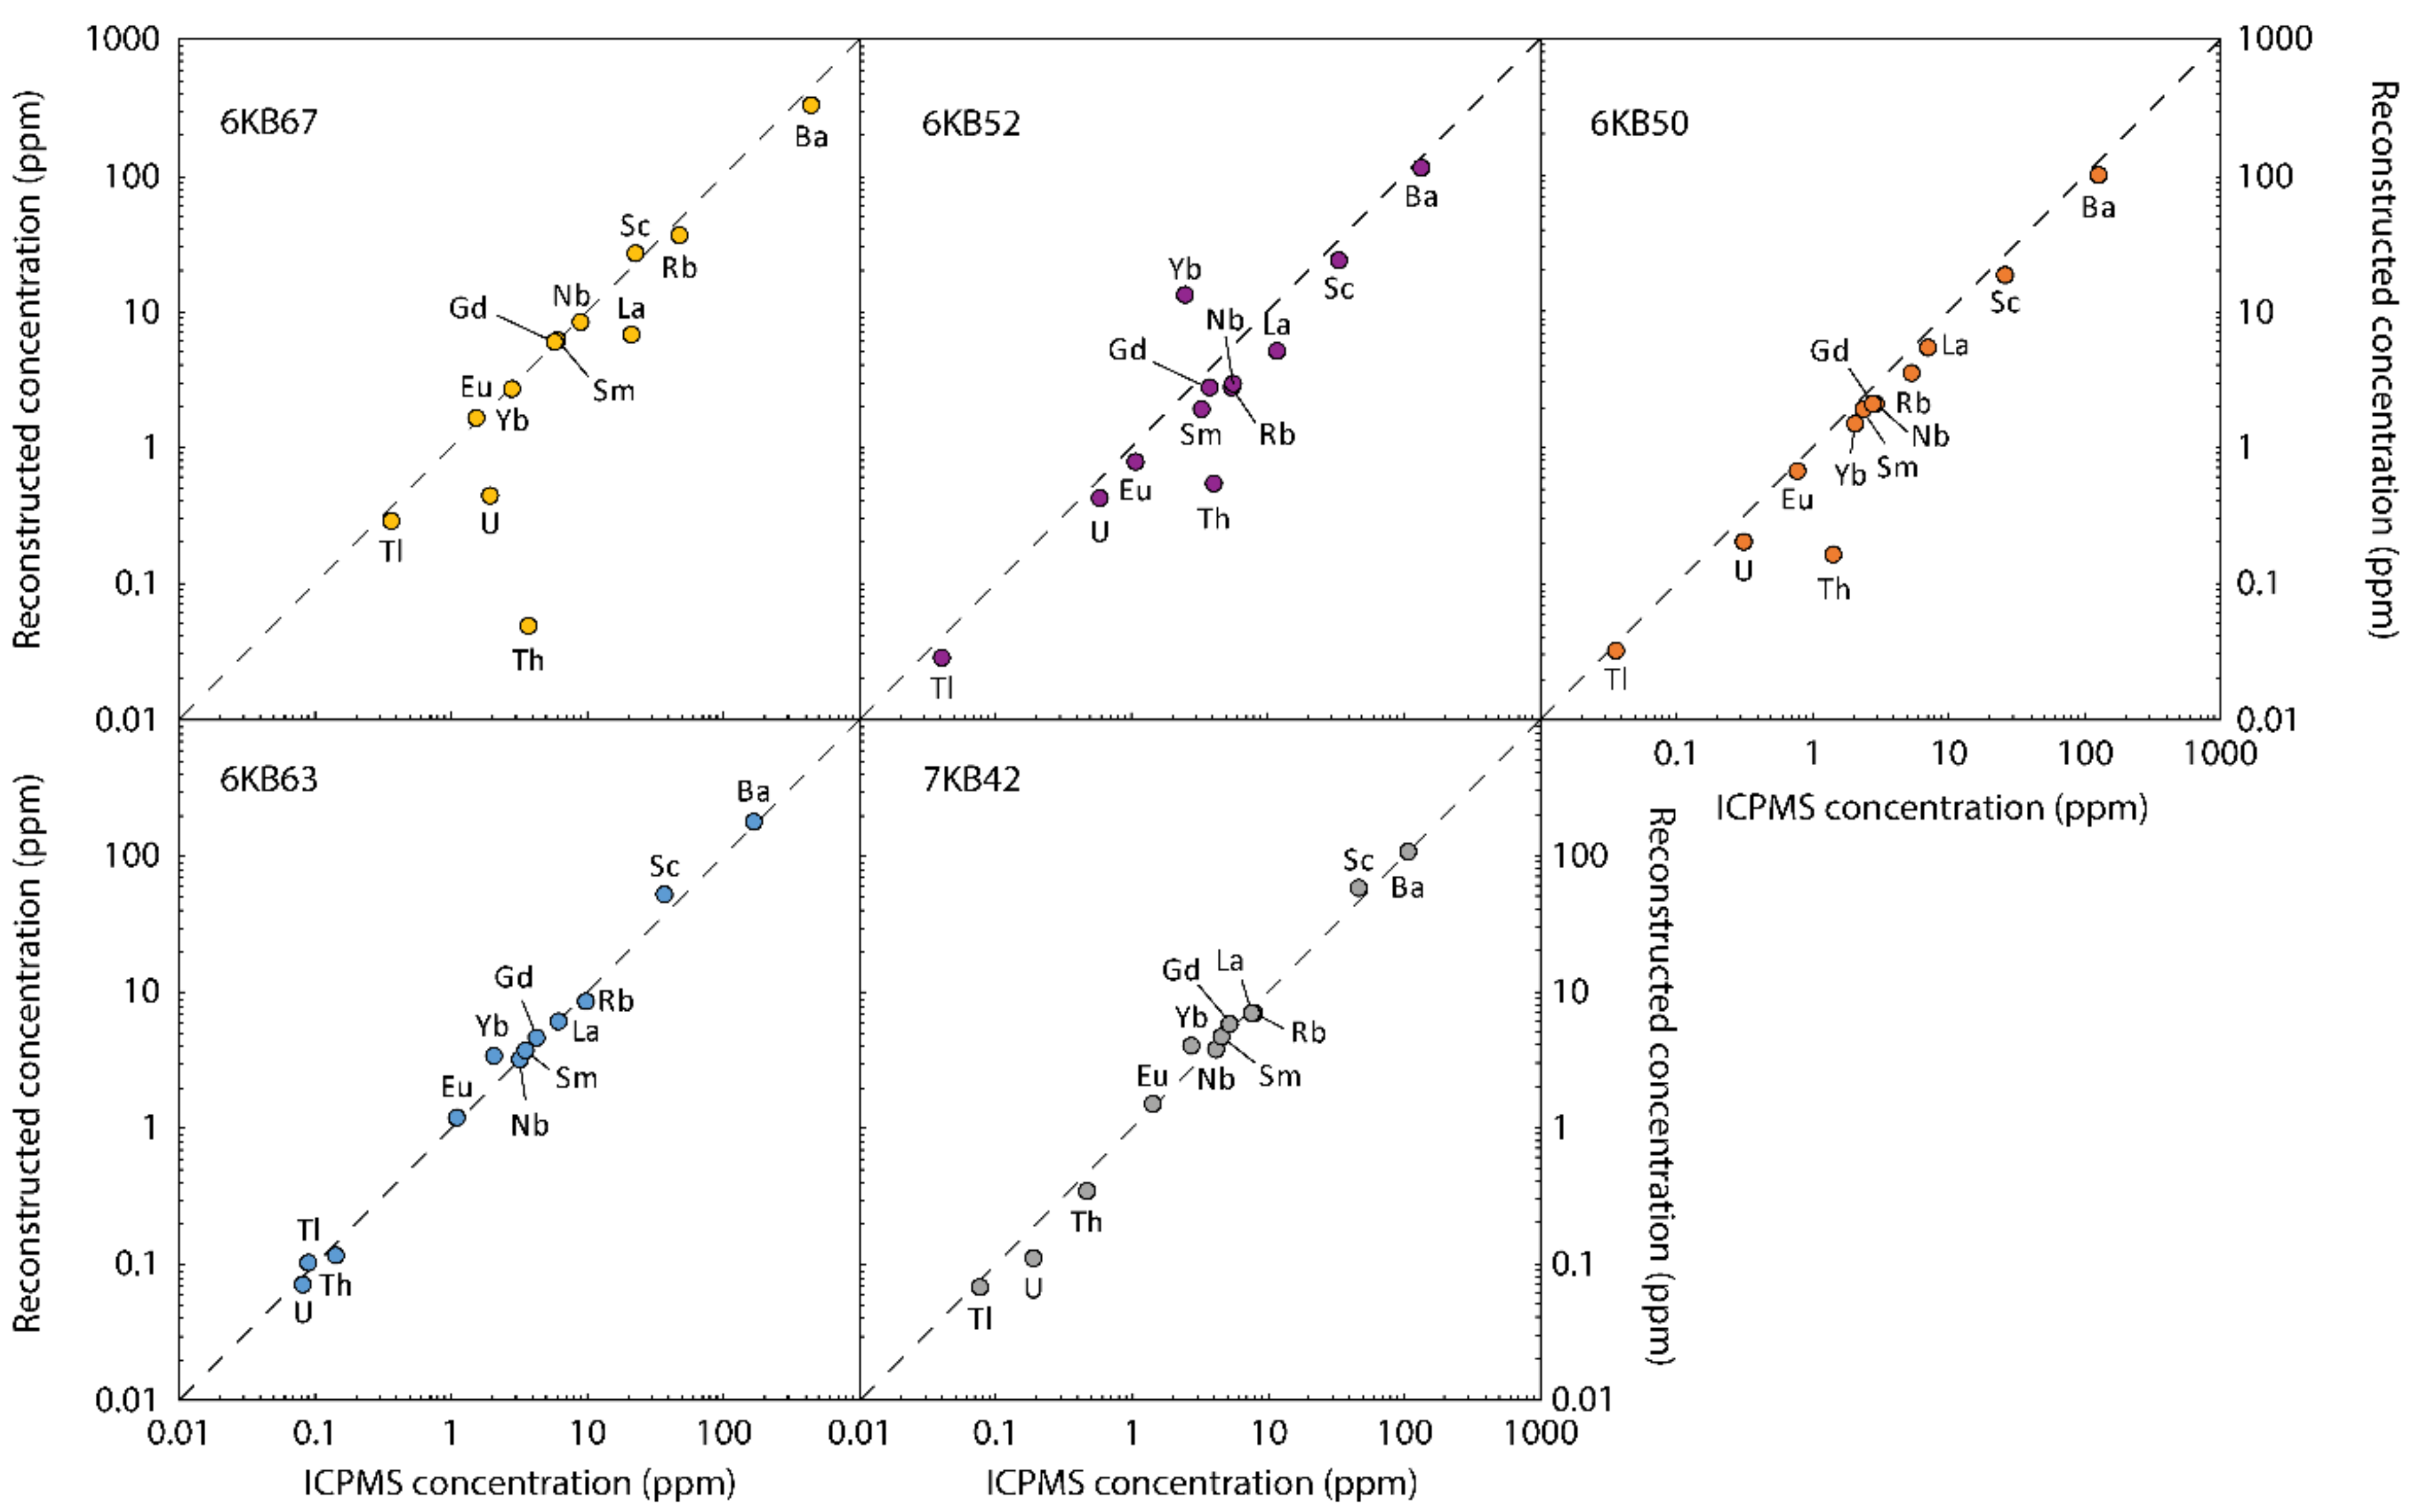
Figure 5.
(a) Back-scattered electron (BSE) image of a feldspar grain, sample 6KB52; (b) quantitative K (wt.%) distribution map of the same grain, obtained by EPMA; (c) BSE image of a feldspar and quartz grain (darker grain) in sample 6KB50; (d) quantitative K (wt.%) distribution map of the same area.

Figure 6.
(a) Transmitted light image of a lower crustal xenolith from central Queensland, Australia showing massive, granoblastic textures; (b) an SEM-EDS phase map of the same sample.
Figure 6.
(a) Transmitted light image of a lower crustal xenolith from central Queensland, Australia showing massive, granoblastic textures; (b) an SEM-EDS phase map of the same sample.
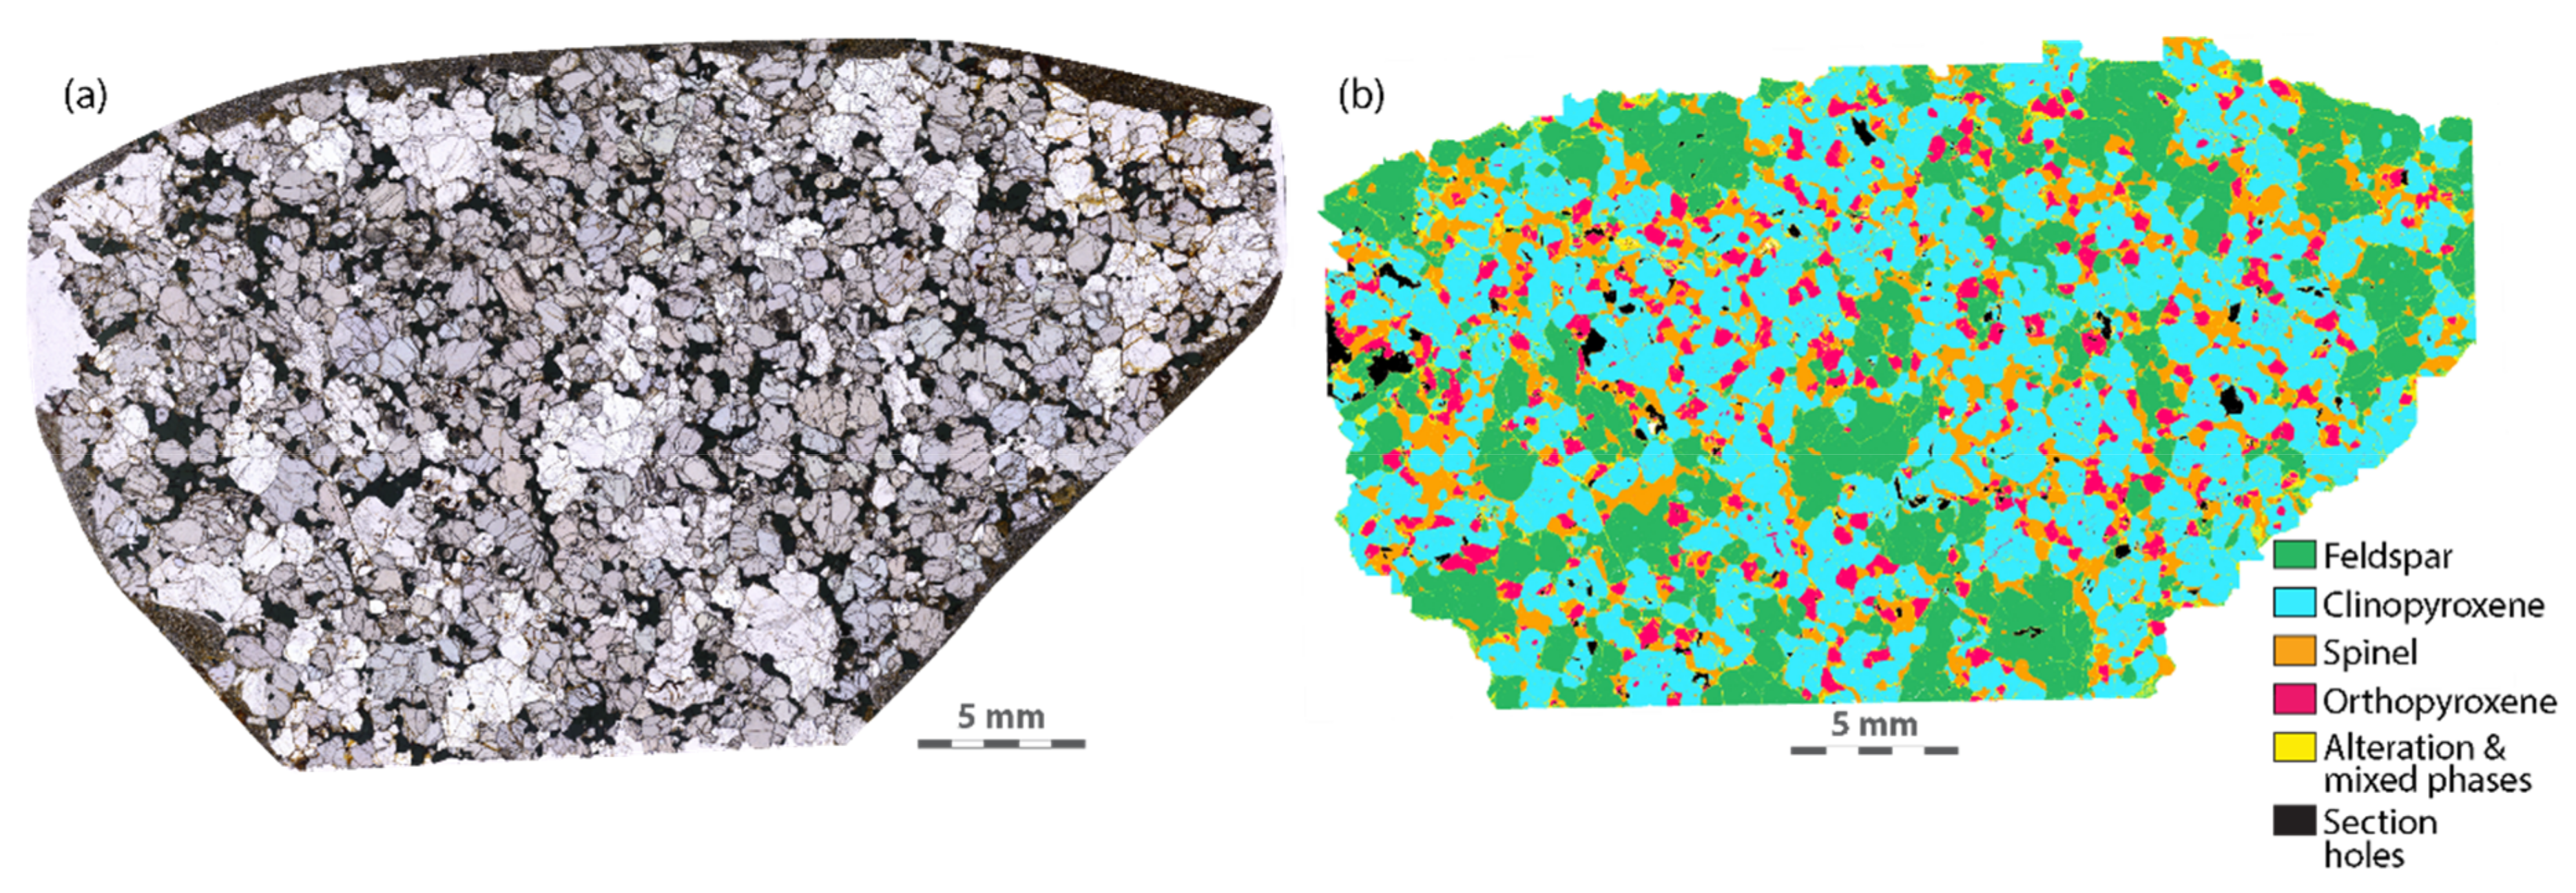
Figure 7.
Primitive mantle (PM)-normalized [19] extended trace element plot for the reconstituted (solid lines with markers) and bulk rock (dashed lines) concentrations of the KSZ samples on a linear scale. The range of lower crustal compositions from Figure 1a is shown in grey and does not include the internal uncertainties of each model.

Figure 8.
Distribution of the accessory phases in sample 6KB67 with and without the BSE underlay. The dashed white line in the left panel shows the band that contains the majority of the accessory phases in thin section.
Figure 8.
Distribution of the accessory phases in sample 6KB67 with and without the BSE underlay. The dashed white line in the left panel shows the band that contains the majority of the accessory phases in thin section.


Table 1.
Modal mineral abundances of the Kapuskasing Structural Zone (KSZ) samples from SEM-EDS phase mapping.
Table 1.
Modal mineral abundances of the Kapuskasing Structural Zone (KSZ) samples from SEM-EDS phase mapping.
| Sample | 6KB63 | 6KB50 | 6KB52 | 7KB42 | 6KB67 |
|---|---|---|---|---|---|
| quartz | 0.88 | 33.48 | 27.00 | 14.24 | 6.18 |
| plagioclase | 20.21 | 39.05 | 43.12 | 27.90 | 39.50 |
| hornblende | 63.32 | 27.18 | 22.07 | 43.47 | 38.26 |
| garnet | 8.70 | 0.10 | 3.47 | 8.30 | 7.14 |
| clinopyroxene | 4.99 | 0.00 | 3.09 | 4.39 | 0.00 |
| biotite | 0.83 | 0.00 | 0.00 | 0.33 | 6.90 |
| K-feldspar | 0.03 | <0.01 | 0.01 | 0.00 | 0.01 |
| calcite | 0.69 | 0.02 | 0.10 | 0.55 | 1.16 |
| epidote | 0.00 | 0.00 | 0.82 | 0.00 | 0.00 |
| ilmenite | 0.05 | 0.00 | 0.00 | 0.63 | 0.17 |
| Fe-oxide | 0.00 | 0.01 | 0.09 | 0.04 | 0.00 |
| pyrite | 0.09 | 0.10 | 0.05 | 0.03 | 0.16 |
| apatite | 0.22 | 0.06 | 0.07 | 0.12 | 0.22 |
| zircon | <0.01 | <0.01 | <0.01 | <0.01 | <0.01 |
| titanite | <0.01 | <0.01 | 0.09 | <0.01 | 0.03 |
| chlorite | 0.00 | 0.00 | 0.00 | 0.00 | 0.28 |
| Total | 100.00 | 100.00 | 100.00 | 100.00 | 100.00 |
Table 2.
Bulk rock major (wt%) and trace element (ppm) concentrations of the KSZ samples obtained by XRF and solution ICPMS, respectively.
Table 2.
Bulk rock major (wt%) and trace element (ppm) concentrations of the KSZ samples obtained by XRF and solution ICPMS, respectively.
| Sample | 6KB63 | 6KB50 | 6KB52 | 7KB42 | 6KB67 |
|---|---|---|---|---|---|
| SiO2 (wt%) | 43.39 | 58.55 | 55.17 | 46.59 | 49.41 |
| TiO2 | 1.40 | 0.70 | 0.90 | 1.60 | 1.10 |
| Al2O3 | 13.35 | 13.59 | 14.86 | 14.06 | 17.82 |
| FeO | 15.40 | 7.91 | 9.58 | 14.70 | 11.15 |
| MnO | 0.18 | 0.14 | 0.17 | 0.22 | 0.34 |
| MgO | 8.84 | 4.38 | 4.84 | 6.08 | 4.42 |
| CaO | 11.70 | 7.72 | 8.92 | 10.79 | 8.46 |
| Na2O | 1.73 | 3.15 | 2.96 | 2.20 | 2.95 |
| K2O | 1.03 | 0.73 | 0.71 | 0.70 | 1.65 |
| P2O5 | 0.12 | 0.08 | 0.11 | 0.25 | 0.27 |
| LOI | 1.06 | 2.19 | 0.90 | 1.04 | 1.05 |
| Total | 99.90 | 100.02 | 100.17 | 99.86 | 99.87 |
| Li (ppm) | 16.5 | 13.4 | 9.79 | 12.4 | 19.8 |
| Be | 0.67 | 0.75 | 1.30 | 0.68 | 1.59 |
| Sc | 37.4 | 26.3 | 34.1 | 47.1 | 23.2 |
| V | 361 | 196 | 249 | 441 | 321 |
| Cr | 190 | 112 | 217 | 210 | 20 |
| Co | 60.0 | 32.0 | 38.9 | 58.3 | 32.4 |
| Ni | 127 | 59 | 124 | 117 | 44 |
| Cu | 91.2 | 106 | 131 | 160 | 58.1 |
| Zn | 273 | 74.94 | 90.60 | 175 | 122 |
| Ga | 22.3 | 16.9 | 18.6 | 22.2 | 22.2 |
| Ge | 1.09 | 0.49 | 0.62 | 1.01 | 0.75 |
| Rb | 9.84 | 5.39 | 5.60 | 8.13 | 48.6 |
| Sr | 77.9 | 224 | 224 | 147 | 233 |
| Y | 20.9 | 17.9 | 21.6 | 22.8 | 23.8 |
| Zr | 76.36 | 81.37 | 84.58 | 121 | 131 |
| Nb | 3.28 | 2.94 | 5.65 | 4.19 | 9.01 |
| Mo | 0.48 | 0.27 | 0.39 | 0.33 | 0.49 |
| Cd | 0.09 | 0.04 | 0.05 | 0.08 | 0.09 |
| Sn | 1.73 | 1.03 | 1.48 | 1.16 | 1.23 |
| Ba | 170 | 129 | 139 | 109 | 449 |
| La | 6.29 | 7.18 | 11.96 | 7.73 | 21.53 |
| Ce | 17.44 | 15.83 | 22.41 | 21.25 | 41.52 |
| Pr | 2.59 | 2.05 | 3.20 | 3.21 | 6.51 |
| Nd | 12.25 | 8.88 | 13.31 | 15.80 | 27.27 |
| Sm | 3.59 | 2.43 | 3.35 | 4.64 | 6.14 |
| Eu | 1.11 | 0.78 | 1.08 | 1.45 | 1.54 |
| Gd | 4.26 | 2.80 | 3.85 | 5.33 | 5.80 |
| Tb | 0.69 | 0.48 | 0.65 | 0.87 | 0.89 |
| Dy | 4.11 | 3.05 | 4.11 | 5.21 | 5.05 |
| Ho | 0.85 | 0.69 | 0.89 | 1.08 | 1.04 |
| Er | 2.31 | 2.01 | 2.57 | 2.96 | 2.90 |
| Tm | 0.33 | 0.31 | 0.39 | 0.42 | 0.43 |
| Yb | 2.07 | 2.07 | 2.52 | 2.75 | 2.85 |
| Lu | 0.29 | 0.31 | 0.35 | 0.38 | 0.42 |
| Hf | 2.20 | 2.19 | 2.26 | 3.12 | 3.22 |
| Ta | 0.17 | 0.20 | 0.44 | 0.23 | 0.61 |
| W | 0.13 | 0.20 | 0.05 | 0.06 | 0.15 |
| Tl | 0.09 | 0.04 | 0.04 | 0.08 | 0.36 |
| Pb | 2.20 | 3.17 | 4.46 | 2.47 | 7.27 |
| Bi | 0.13 | 0.13 | 0.04 | 0.03 | 0.08 |
| Th | 0.14 | 1.45 | 4.13 | 0.48 | 3.77 |
| U | 0.08 | 0.32 | 0.59 | 0.19 | 1.98 |
Table 3.
Major (wt%) and trace element (ppm) concentrations of the KSZ samples obtained with the reconstitution approach.
Table 3.
Major (wt%) and trace element (ppm) concentrations of the KSZ samples obtained with the reconstitution approach.
| Sample | 6KB63 | 6KB50 | 6KB52 | 7KB42 | 6KB67 |
|---|---|---|---|---|---|
| SiO2 (wt%) | 45.04 | 66.10 | 63.43 | 52.35 | 50.07 |
| TiO2 | 1.26 | 0.56 | 0.52 | 1.42 | 0.93 |
| Al2O3 | 15.27 | 13.06 | 14.98 | 14.41 | 18.16 |
| FeO | 14.84 | 6.36 | 6.57 | 13.64 | 12.39 |
| MnO | 0.24 | 0.11 | 0.22 | 0.24 | 0.49 |
| MgO | 7.44 | 3.29 | 2.73 | 5.02 | 4.42 |
| CaO | 12.53 | 6.51 | 7.71 | 9.51 | 8.98 |
| Na2O | 2.01 | 3.12 | 3.33 | 2.49 | 2.98 |
| K2O | 0.95 | 0.59 | 0.39 | 0.63 | 1.20 |
| P2O5 | 0.09 | 0.03 | 0.04 | 0.05 | 0.10 |
| Total | 99.68 | 99.74 | 99.92 | 99.76 | 99.72 |
| Sc (ppm) | 52.7 | 18.3 | 23.0 | 55.8 | 26.6 |
| Rb | 8.63 | 3.50 | 2.72 | 6.76 | 36.07 |
| Nb | 3.21 | 2.06 | 2.88 | 3.62 | 8.33 |
| Cs | 0.11 | 0.05 | 0.02 | 0.25 | 0.58 |
| Ba | 180 | 99 | 110 | 104 | 334 |
| La | 6.18 | 5.26 | 4.94 | 6.75 | 6.68 |
| Sm | 3.76 | 1.87 | 1.85 | 4.54 | 6.09 |
| Eu | 1.18 | 0.66 | 0.77 | 1.47 | 1.63 |
| Gd | 4.61 | 2.09 | 2.67 | 5.60 | 6.02 |
| Yb | 3.40 | 1.48 | 13.18 | 3.91 | 2.70 |
| Tl | 0.10 | 0.03 | 0.03 | 0.07 | 0.28 |
| Th | 0.12 | 0.16 | 0.54 | 0.33 | 0.05 |
| U | 0.07 | 0.20 | 0.41 | 0.11 | 0.44 |
© 2020 by the authors. Licensee MDPI, Basel, Switzerland. This article is an open access article distributed under the terms and conditions of the Creative Commons Attribution (CC BY) license (http://creativecommons.org/licenses/by/4.0/).
Share and Cite
MDPI and ACS Style
Emo, R.B.; Kamber, B.S. A Reconstitution Approach for Whole Rock Major and Trace Element Compositions of Granulites from the Kapuskasing Structural Zone. Minerals 2020, 10, 573. https://doi.org/10.3390/min10060573
AMA Style
Emo RB, Kamber BS. A Reconstitution Approach for Whole Rock Major and Trace Element Compositions of Granulites from the Kapuskasing Structural Zone. Minerals. 2020; 10(6):573. https://doi.org/10.3390/min10060573
Chicago/Turabian StyleEmo, Robert B., and Balz S. Kamber. 2020. "A Reconstitution Approach for Whole Rock Major and Trace Element Compositions of Granulites from the Kapuskasing Structural Zone" Minerals 10, no. 6: 573. https://doi.org/10.3390/min10060573
Note that from the first issue of 2016, this journal uses article numbers instead of page numbers. See further details here.