
Nanometer Pore Structure Characterization of Taiyuan Formation Shale in the Lin-Xing Area Based on Nitrogen Adsorption Experiments


1
State Key Laboratory of Shale Oil and Gas Enrichment Mechanisms and Effective Development, Sinopec, Beijing 100083, China
2
School of Resources and Geoscience, China University of Mining and Technology, Xuzhou 221116, China
3
Institute of Geochemistry, Chinese Academy of Sciences, Guiyang 550002, China
*
Author to whom correspondence should be addressed.
Minerals 2021, 11(3), 298; https://doi.org/10.3390/min11030298
Submission received: 30 January 2021
/
Revised: 23 February 2021
/
Accepted: 9 March 2021
/
Published: 11 March 2021
(This article belongs to the Special Issue Mineralogy and Geochemistry of Oil Shale)
Abstract
:Ordos Basin is an important continental shale gas exploration site in China. The micropore structure of the shale reservoir is of great importance for shale gas evaluation. The Taiyuan Formation of the lower Permian is the main exploration interval for this area. To examine the nanometer pore structures in the Taiyuan Formation shale reservoirs in the Lin-Xing area, Northern Shaanxi, the microscopic pore structure characteristics were analyzed via nitrogen adsorption experiments. The pore structure parameters, such as specific surface area, pore volume, and aperture distribution, of shale were calculated; the significance of the pore structure for shale gas storage was analyzed; and the main controlling factors of pore development were assessed. The results indicated the surface area and hole volume of the shale sample to be 0.141–2.188 m2/g and 0.001398–0.008718 cm3/g, respectively. According to the IUPAC (International Union of Pure and Applied Chemistry) classification, mesopores and macropores were dominant in the pore structure, with the presence of a certain number of micropores. The adsorption curves were similar to the standard IV (a)-type isotherm line, and the hysteresis loop type was mainly similar to H3 and H4 types, indicating that most pores are dominated by open type pores, such as parallel plate-shaped pores and wedge-shaped slit pores. The micropores and mesopores provide the vast majority of the specific surface area, functioning as the main area for the adsorption of gas in the shale. The mesopores and macropores provide the vast majority of the pore volume, functioning as the main storage areas for the gas in the shale. Total organic carbon had no notable linear correlation with the total pore volume and the specific surface area. Vitrinite reflectance (Ro) had no notable correlation with the specific surface area, but did have a low “U” curve correlation with the total pore volume. There was no relationship between the quartz content and specific surface area and total pore volume. In addition, there was no notable correlation between the clay mineral content and total specific surface area and total pore volume.
1. Introduction
Shale is often investigated as source rock and caprock in traditional oil and gas theory. Recently, with the study of micrometer and nanometer pores in shale, shale can be used as a good reservoir for oil and gas, providing conditions for shale gas accumulation. Faced with the increasing consumption of conventional energy, such as coal, oil, and natural gas, abundant shale gas resources play a key role in easing the energy tensions caused by social development, and have substantial development potential. Compared with coalbed methane and tight sandstone gas, shale gas development in the United States started late. In the 1990s, especially since the 21st century, related exploration and development technologies have been widely used, such that the annual production and economic and technical recoverable reserves have increased rapidly [1]. By the end of 2009, 30 shale gas basins had been discovered in North America, with more than 50,000 development wells with depths of 2500–4500 m; the annual output in 2009 was 950 × 108 m3 [2]. Recently, Canada has also strengthened its shale gas exploration and experimental research, evaluating the exploration potential of Devonian, Carboniferous, and Jurassic shale gas [3,4]. At present, shale gas exploration and development throughout the world are mainly aimed at marine shale series. The exploration of continental shale gas has recently achieved a series of breakthroughs in the geological knowledge of Ordos Basin, confirming that Ordos Basin has the appropriate geological conditions to carry a significant resource potential for shale gas accumulation [5].
The pore structure of shale reservoir rock is the main factor affecting its reservoir capacity and shale gas production [6]. Nanometer pores constitute the main gas storage areas in shale, where gas exists through the processes of adsorption and dissociation in the pores [7,8]. Interconnected nano-to-micrometer-sized shale pores, together with natural fractures, form a fluid migration network and natural gas permeability channels in unconventional shale reservoirs [9,10]. The shape and size of the pores in the shale are different and have strong heterogeneity [11]. The difference in pore types has a significant influence on the storage and migration of shale gas [12]. Therefore, studying both the nanopore structure of shale in gas-containing shale reservoirs and the exploration and development of shale gas is important [13,14].
At present, there are mainly qualitative and quantitative methods for the study of oil and gas reservoir porosity. Qualitative observation adopts high-resolution image observation technology to directly observe the pore morphology, size, and connectivity of shale. Common technical methods include transmission electron microscopy (TEM), atomic force microscopy (AFM), nano-CT (Nano-CT), field emission scanning electron microscopy (FESEM), and focused ion beam scanning electron microscopy (FIB-SEM). An atomic force microscope (AFM) can detect the interaction between the probe and the sample atoms, so as to achieve the purpose of studying the morphology characteristics of the sample. This method has good adaptability, but it is easily affected by the surface roughness of the sample when characterizing the pores of shale [9]. Nano-CT can reconstruct the three-dimensional characteristics of pores without damaging samples, and the research accuracy can reach tens of nm, which has also been widely used [15,16]. Although scanning electron microscopy can provide important support for the study of pore characteristics of shale, the analysis area of scanning electron microscopy is limited. The strong heterogeneity of shale means that the observation results cannot fully represent the whole sample, so it is necessary to combine them with other research methods to improve the reliability of analysis. Quantitative characterization methods include mercury injection tests, gas adsorption methods, small-angle-X-ray-scattering (SAXS), and nuclear magnetic resonance (NMR) [17,18]. The gas adsorption method is widely used in the measurement of pore structures [19], mainly to analyze micropores. Nitrogen adsorption is a common method in gas adsorption, which can better reflect the pore structure characteristics of shale [20], and is widely used in shale reservoir evaluation in different blocks of China [21,22,23]. Liquid mercury is pressed into porous solid by a mercury porosimeter to obtain pore characteristics in the mercury injection method. Liquid mercury filled pores with different pore sizes under different pressure conditions. The pore size corresponding to pressure can be obtained by using Washburn formula. The mercury injection method is generally used in the analysis of mesopores and macropores, but high pressures can easily cause shale to crack, resulting in human error [24]. Nuclear magnetic resonance (NMR) is not affected by the composition of rock skeleton, but is susceptible to the test environment, instrument parameters, micropores in samples, paramagnetic substances, and fluid types [25]. Small angle scattering (SAS) and ultra-small angle scattering (USAS) can be used to obtain pore structure characteristics by using ray scattering information, which can be used for the nondestructive analysis of samples under different temperature and pressure conditions. However, the method requires few neutron sources, and the research cost is too expensive [26,27]. Under conditions of low temperature and low pressure, the isothermal adsorption of N2 can effectively reflect the pore size distribution of pores in shale, such that pore structure parameters can be calculated with the BET and BJH equations, as well as the isothermal adsorption and desorption curves [28]. The BET equation is a multi-layer adsorption formula derived by three scientists (Brunauer, Emmett, and Teller) from the classical statistical theory. The basic assumptions of the model are as follows: 1, the solid surface is uniform, and multi-layer adsorption occurs; 2, the adsorption heat of all layers except the first layer is equal to the liquefaction heat of the adsorbate. The BET equation has a wide range of applications and is suitable for the adsorption of porous materials. The BJH method was proposed by Barret, Joyner, and Halenda. The amount of nitrogen adsorbed on the surface of porous solid at 77 K is the function of pressure. The measured amount of nitrogen adsorption can be divided into two parts: the change of membrane thickness and the amount of capillary condensation or removal. During the adsorption process, with the increase in gas pressure, monolayer and multilayer adsorptions occur on the surface and wall of porous materials and form liquid films. Subsequently, capillary condensation occurs in the pores and forms meniscus similar to liquid. Accordingly, a set of (relative pressure and adsorption capacity) adsorption data obtained from the measured sample can be used to calculate the variation of the liquid film volume caused by the change of film thickness between two adjacent data, and the variation of the condensed volume in the corresponding pore size due to capillary condensation or removal, and then the pore size, pore volume, and pore surface area distribution data of the sample under this assumption can be obtained [29]. In this paper, through nitrogen adsorption experiments on shale, we analyze the micropore structure characteristics of shale from the Taiyuan Formation in the Lin-Xing area and examine the influence of the micropore structure on gas storage.
2. Sample and Methods
2.1. Samples
Samples were collected from the lower Permian Taiyuan Formation in the Lin-Xing area of the northeastern Ordos Basin, China (Figure 1). The Taiyuan Formation is located in Linxian and Xingxian counties north of Lvliang City, Shanxi Province. Ordos Basin is among the largest sedimentary basins in China, which is rich in oil and gas resources. A set of marine-continental coal measures strata was developed in the Upper Paleozoic of the basin, which not only has abundant coal resources but also has unconventional natural gas resources, such as coalbed methane, tight sandstone gas, and shale gas. The discovery of Jingbian, Sulige, Wushenqi, Yulin, and Daniudi gas fields indicates that the Upper Paleozoic coal measures gas in Ordos Basin has good exploration and development prospects. The Lin-Xing area is located in the northeast of Ordos Basin; Linxian and Xingxian in the north of Lvliang City; Shanxi Province, west of the northern Shaanxi slope and east of Lvliang uplift. There is an uplift area formed by magmatic intrusion in the study area, with more faults and radial surrounding uplift. The central part is the syncline area surrounded by the uplift, which is distributed in a ring; the western, northern, and southern parts of the study area are gentle fold areas, where small faults are developed, mainly distributed in the northern part of the study area and around the magmatic intrusion. Vertically, the Upper Paleozoic strata in the study area were superimposed by coalbed methane, shale gas, and tight sandstone gas [30]. Oil and gas production was achieved in 7 tight sandstone gas wells in the early stage of the Lin-Xing area, and several nearby tight gas fields and coalbed methane fields were developed, showing the great development potential of “three gas” in coal series in this block. Unconventional gas resources are predicted to be 100 billion cubic meters, with a proven superimposed gas-bearing area of 674.32 km2 and reserves of 725.04 × 10⁸ m3, and annual production capacity of more than 1 billion cubic meters. The Taiyuan Formation in the study area is mainly dominated by dark-gray, black mudstone, shale, silty mudstone, and sandstone, reflecting that the sedimentary environment was mainly a stable sedimentary delta, carbonate platform, lagoon tidal flat environment with stable deposition in warm and humid weather conditions. The shale core was drilled and extracted from the drilling holes of Lin-Xing area by a large drilling rig, and then the samples with a diameter of 10 cm were obtained by a small drilling rig and sent to the laboratory. The samples were not contaminated during the period. The shale samples were mainly sapropelic and containing inertinite, with relatively low amounts of vitrinite and exinite (exinite can be neglected). According to our calculations, the kerogen type of the shale in the study area is mainly II1 and II2; only one sample was type III;. The results show that the oil and gas generating capacity of the Taiyuan Formation shale in the study area was medium, with a slightly strong gas generation capacity. Organic matter mainly derives from plankton and microorganisms, containing a small amount of terrestrial plant debris. The Taiyuan Formation shale in the study area has a high abundance of organic matter; the total organic carbon (TOC) is mainly between 1.59 and 6.06%, which reaches 22% in some layers, with an average of 2.77%, belonging to the effective shale reservoir [31]. The vitrinite reflectance of the organic matter (Ro) in the shale is between 1% and 1.34%, with an average of 1.23% (Table 1), which indicates that the organic matter is in a middle mature stage. Kerogen mainly forms oil through thermal degradation and generates hydrocarbons with low-medium molecular weight. The thermal evolution degree of the organic matter is similar to that of the shale from the Yanchang Formation in Ordos Basin, while the thermal maturity of the New Albany and Ohio shales is relatively low, with Ro values of 0.44%–1.50% and 0.4%–1.3%, respectively [8,32].
The mineral composition of the samples was determined using AXS D8 ADVANCE X-ray diffractometer (Bruker, Billerica, MA, USA). Table 2 and Table 3 list the results, which are also depicted in Figure 2. As indicated in Table 2 and Figure 2, the main minerals in the shale samples from the Taiyuan Formation in the study area are quartz and clay minerals, followed by carbonate minerals, feldspar, and pyrite. The quartz content is 20.07–55.99%, with an average of 38.89%. Feldspar content is lower than that of North American shale (4%–17%) [33]. The mass fraction of clay minerals is 19.43%–78.08%, with an average of 52.16%. The clay mineral content of the Bossier shale in the United States of America is as high as 70%, while that of the Ohio and Woodford-type Barnett shale ranges from 15 to 65% [34]. The clay minerals are mainly composed of illite montmorillonite mixed layers, illite, kaolinite, and chlorite (Table 3). The contents of the illite montmorillonite mixed layer and kaolinite account for the vast majority. The mineral content of the kaolinite and illite montmorillonite mixed layer is significantly higher than that of the illite, which indicates that the Taiyuan Formation shale is in the mature stage.
2.2. Nitrogen Adsorption Experiments
The nitrogen adsorption experiments with the samples from the study area were carried out on a Tristar II 3020 automatic specific surface area and pore analyzer (Micromeritics Instrument, Norcross, GA, USA); the test pore range was 1.2–135 nm. Before the experiment, the shale samples were pretreated, crushed, and screened with a 60-mesh experimental sieve. In order to eliminate the residual bound water, capillary water, and volatile components in the samples, all samples were pretreated by vacuum at 300 °C for 3 h before the nitrogen adsorption experiment [35]; the samples were then placed into the instrument for analysis. After that, the high purity nitrogen with purity more than 99.999% was used as adsorbent, and the nitrogen adsorption capacity under different relative pressures was measured at 77.15 K. Low-temperature and low-pressure environments (77.15 and 127 kPa) were maintained during the experiment. The adsorption desorption diagram of nitrogen was drawn with relative pressure as abscissa and adsorption capacity per unit sample mass as ordinate via the experimental results.
The BET theoretical method was used to calculate the specific surface area of shale samples. The BET linear graph was made in the range of relative pressure between 0.05 and 0.35 to obtain the saturation adsorption capacity of the single molecular layer, and then the BET specific surface area of the samples was calculated. The BJH method was used to calculate the volume change of the membrane thickness between two adjacent data (pressure and adsorption capacity), and the volume change of the pore size that causes by capillary condensation or removal, and then the pore size distribution data of the sample were obtained. The mean pore size and pore volume were calculated by nitrogen adsorption at a relative pressure of about 0.993.
3. Experimental Results and Discussion
3.1. Adsorption and Desorption Isotherms
The latest report from the International Union of Pure and Applied Chemistry (IUPAC) in 2015 divided the gas adsorption isotherms into eight categories, mainly adding two subclasses to represent the characteristics of different pores in porous materials [36]. By comparing the adsorption and desorption curves of the Taiyuan Formation shale samples with the eight IUPAC standards, we can conclude that there are some differences in the adsorption and desorption curves of the different shale samples, but the overall curve shape is roughly the same, which is the reverse “s” curve with a hysteresis loop. The specific performance is as follows. When the relative pressure is low (0 < p and p0 < 0.1), the adsorption curve of nitrogen rises slowly, showing a slightly convex shape. With an increase in the relative pressure, the adsorption curve is approximately linear. When the relative pressure further increased above 0.8, the adsorption capacity of nitrogen increased rapidly, showing a concave shape and did not reach the adsorption saturation near the saturated vapor pressure. The adsorption curve is similar to the type IV(a) isotherm in Figure 3, indicating that the pores in the shale samples are mainly mesopores. The difference between the adsorption curve and the standard curve is that there is no adsorption saturation phenomenon, which indicates that there are some macropores in the samples.
The desorption curve is separated from the adsorption curve to form a hysteresis loop, which reflects the pore structure of the sample. According to the latest classification of hysteresis loops by IUPAC in Figure 4, the hysteresis loops of shale samples in Figure 5 are mainly similar to H3 and H4 types. Samples LX1-1, LX1-3, LX3-1, LX4-1, LX5-1, LX5-2, and LX7-2 have the characteristics of both the H3 and H4 loops. When the relative pressure is over 0.75, the hysteresis loop is relatively steep, showing the characteristics of the H3 type curve. When the relative pressure is between 0.45 and 0.75, the adsorption and desorption curves tend to be gentle, similar to the H4 type curve, reflecting that wedge-shaped slit pores and parallel plate-shaped pores are dominant. Samples LX1-2, LX2-1, LX6-1, LX7-1, and LX7-3 are mainly similar to the H3 type. The adsorption and desorption curves rise steadily in the middle, and rise rapidly when the relative pressure is near 1, which reflects the pore characteristics of parallel plate-shaped pores. According to the test results of the Taiyuan Formation shale samples, the shale pores in the study area are mainly wedge-shaped and parallel plate-shaped pores, which are favorable for shale gas migration and good pore connectivity. The lack of closure of the hysteresis loop at lower relative pressure has been widely reported in previous studies [37,38,39]. This phenomenon may be attributed to the irreversible uptake of molecules in pores of approximately similar width to that of the adsorbate molecule, or an irreversible chemical interaction between the adsorbate and adsorbent [37]. Burgess et al. believed that low-pressure hysteresis often occurs when the average pore size of the adsorbent is commensurate with the size of the adsorptive molecule [38]. In general, the variations of hysteresis loop shapes in samples demonstrate that pores in shale exhibit a variety of morphologies and sizes as a result of the heterogeneous nature of shale.
3.2. Specific Surface Area and Pore Volume of Shale
According to IUPAC, pores can be divided into three types: micropores (pore size less than 2 nm), mesopores (pore sizes between 2 and 50 nm), and macropores (pore sizes greater than 50 nm). Table 4 and Table 5 list the pore structure parameters of the shale samples. The specific surface area of sample LX5-1 was the largest (2.188 m2/g), and the specific surface area of sample LX2-1 was the smallest (0.143 m2/g), with an average of 1.191 m2/g, which is significantly smaller than the specific surface area of 18.29 m2/g for the Longmaxi Formation shale in Southern China [40]. The pore volume of sample LX4-1 was the largest (0.008718 cm3/g), while the pore volume of sample LX2-1 was the smallest (0.001398 cm3/g), with an average of 0.004737 cm3/g. Based on Figure 6, the specific surface area and pore volume have a good positive correlation for the micropores, mesopores, and macropores, which indicates that larger pore spaces in the shale reservoir result in a stronger ability to provide a specific surface area. This is consistent with the conclusions of Chalmers et al. [41]; that is, the total gas content of shale increases with an increase in the shale porosity. Whether R2 has statistical significance is judged and appropriately selected according to the criteria in Chatfield’s reference book [42].
3.3. Shale Pore Size Distribution
Images of the differential pore volume/pore size in Figure 7 can visually show the concentration range of the pores. The experimental results for the shale samples in the study area were analyzed using the differential pore volume/pore size diagrams. The results show that the pore size distribution in the shales is complex, with distributions of micropores to macropores, and there are often multiple peaks. Samples LX1-1, LX1-3, LX3-1, LX5-1, LX5-2, LX7-1, and LX7-2 in Figure 7 (the red/purplish red part) show that, within the micropore range, a significant steep rise occurs with the decrease in the pore size, and the peak value is not reached, indicating that the micropores are relatively well developed in this part of the formation. Samples LX1-2, LX2-1, LX4-1, LX6-1, and LX7-3 in Figure 4 (the wathet/navy blue part) have a complete peak morphology within the micropore range. The peak value is smaller than that of the mesopores and macropores, indicating that there are relatively fewer micropores. All samples showed an upward trend in the mesopore range, with a small decrease in the range from 30 to 40 nm. The peak of the curve mainly appeared at the boundary between the mesopore and macropore, where the main part of the curve showed a downward trend in the macropore range. This indicated that the pore size in the shale samples in the study area was mainly concentrated in the range of mesopores and macropores, while some of the samples showed micropores.
3.4. Significance of Shale Pores for Gas Storage
By calculating the specific surface area of different pore sizes, we observed that the average micropore specific surface area of the shale samples was 0.644 m2/g, the average mesopore specific surface area was 0.505 m2/g, and the average macropore specific surface area was 0.411 m2/g. Figure 8 shows a histogram of the shale specific surface area distribution. Micropores and mesopores are the major contributors to the shale specific surface area, accounting for 48.15% and 47.26%, respectively, for a total of 95.41%, whereas the macropores only accounted for 4.59%, indicating that micropores and mesopores with diameters less than 50 nm contribute to the majority of the specific surface area and are the main sites for gas adsorption in the shale. This is consistent with the conclusions of Zhong Lingwen et al. [43]. The pore-wall spacing of the micropore channel is small, and the adsorption energy is higher than that of the wider pore, such that the interaction between the surface and adsorbate molecule is stronger, and the adsorption capacity for the gas molecule is stronger than that of the macropores and mesopores [44]. By calculating the pore volume of different pore sizes, we observed that the average pore volume of the shale samples was 0.000453 cm3/g, the average mesopore volume was 0.002898 cm3/g, and the average pore volume was 0.001378 cm3/g. Figure 9 shows a histogram of the shale pore volume distribution, which indicates that mesopores and macropores provide the main pore volumes, accounting for 60.73% and 29.96%, respectively, for a total of 90.69%, whereas the micropores account for 9.31%. This indicates that the mesopores and macropores in the shale pores are the main locations for gas storage.
The above observations can be fully confirmed by the correlation curves in Figure 9. The micropore specific surface area has a good positive correlation with the total specific surface area (R2 = 0.8875); the mesopore specific surface area has a low positive correlation with the total specific surface area (R2 = 0.6479); and the macropore specific surface area has a poor correlation with the total specific surface area, indicating that the micropores, mesopores, and micropores provide the main specific surface area. The correlation between the micropore volume and total pore volume is poor, whereas there is an excellent positive correlation between the mesopore volume and total pore volume (R2 = 0.972). There is a low positive correlation between the macropore volume and total pore volume (R2 = 0.6796), indicating that the mesopores and macropores, especially the mesopores, provide the main pore volume. In summary, the micropores and mesopores are the main providers of specific surface area and pore volume, which is of significant importance to shale gas adsorption and storage in the Taiyuan Formation shale samples from the Lin-Xing area.
Analyzing Figure 10 based on the above results, we observed that sample LX4-1 has the largest total pore volume, but its total specific surface area is not the largest, indicating that sample LX4-1 has fewer micropores and mainly develops mesopores and macropores. Samples LX5-1, LX5-2, and LX7-2 have the largest total specific surface area and larger total pore volumes, indicating that these samples have relatively developed micropores and mesopores, relatively few macropores, and relatively developed overall pores. This phenomenon confirms the above analysis of sample pore development based on the differential pore volume/pore size. The total specific surface area and total pore volume of sample LX2-1 are both minimal, indicating that the pores are relatively undeveloped in this sample. The reason for the low specific surface area and total pore volume may be that a high content of organic shale will lead to a more easily compacted shale structure and worse pore development [45].
3.5. Controlling Factors of Shale Pore Development
Nuttall pointed out that the TOC is an important parameter for measuring the hydrocarbon generation potential of source rocks when investigating a large sandy gas field, for instance, the main shale gas-producing area in the Appalachian basin of Eastern Kentucky. As the core carrier of adsorption gas, the TOC value of organic matter will lead to a change in the adsorbed gas by an order of magnitude [46]. There is a strong positive correlation between the organic carbon content and the adsorbed gas content, which is mainly due to the fact that organic matter has micropore characteristics. With an increase in the organic carbon content, there is an increase in the various micropore types and microporosities [3]. Martin et al. concluded that there is a good positive linear correlation between the organic carbon content and methane adsorption capacity [47]. Chalmers et al. examined the Gordon Dale shale in Canada and obtained the same conclusions as our experimental results; that is, higher organic carbon contents lead to a stronger adsorption capacity in the shale [48]. Figure 11 shows the relationship among the nitrogen adsorption pore volume, specific surface area, and total TOC. There is no notable linear relationship among the TOC, total pore volume, and specific surface area. In other words, the increase in the organic matter abundance in the sample shale had no significant effect on the pore space, indicating that the proportion of organic matter pores in the shale in the study area is relatively small, and the degree of pore development is relatively poor. Organic matter was thus found to have a smaller influence on the pore size in the shale samples and is considered to be responsible for hydrocarbon generation rather than reservoir formation. Some scholars believe that the organic matter content and pore development are not simply positively correlated [49,50], indicating that shale pore types are diversified.
The relationship between maturity and pore development has been discussed in a number of studies [51,52,53]. The vitreous reflectance (Ro) is an internationally recognized independent index for determining the maturation stage of organic matter. Scientists have proposed various maturity criteria, such as the bitumen reflectance, vitreous reflectance, and relative fluorescence intensity of dental pricks [54]. Some studies suggest that thermal genetic shale gas reservoirs, such as the Lewis shale gas reservoir in the San Juan Basin [55] and the Barnett shale gas reservoir in the Forvos Basin [56], are highly mature shale gas reservoirs. Natural gas mainly originates from thermal maturation. Higher maturities yield more favorable shale gas production, indicating that shale gas reservoirs can be developed under high maturity [57]. Other studies suggest that the thermal maturity of the reservoir controls the degree of organic matter pore development. When Ro is higher than 0.60%, organic matter begins to form a large number of nanopores [58]. However, excessive maturity leads to the destruction of organic nanopores. When the maturity is greater than 3.6%, the organic pore size decreases with an increase in the thermal evolution of organic matter [12]. Xiangfeng et al. proposed that, with an increase in the Ro value, there is a gradual increase in the micropores. A large increase in the number of micropores during the evolution of organic matter provides a larger pore volume and specific surface area for shale gas adsorption, which significantly improves the shale gas adsorption capacity [59]. In addition to affecting the development of organic matter pores, shale maturity is also related to the mutual transformation of clay mineralization [60].
By analyzing the relationship between the vitrinite reflectance and pore structure parameters for nitrogen adsorption, we observed that there is no correlation between the total specific surface area and vitrinite reflectance. The relationship between the total pore volume and vitrinite reflectance is a “U” curve with a low correlation, indicating that the maturity of shale organic matter has little influence on pore development according to Figure 12. The factor related to the middle maturity of the shale samples in the study area is the small proportion of organic pores. Previous research results on the shale in North China show that when the maturity is small, affected by compaction, with the continuous settlement of the stratum and the increasing burial depth, the shale is gradually compacted, and the primary pores decrease, while there are fewer organic matter pores and secondary pores produced in the process of hydrocarbon generation [61]. These lack a large amount of pore reservoir space, and organic pores exist as hydrocarbon-generating pores. Based on the previous analysis of the Taiyuan Formation shale, we observed that there were both liquid and gaseous hydrocarbons in the Taiyuan Formation shale during its middle maturation stage. The existence of liquid hydrocarbons can cause deviations in the results of the nitrogen adsorption experiments because liquid hydrocarbons can block nanopores, thus blocking the entrance of nitrogen, followed by a change in the amount of nitrogen adsorption and the hysteresis loop. Most organic matter pores are mesopores, which increases the number of mesopores. In addition, due to the increase in the number of mesopores and the cracking of liquid hydrocarbons, the previously disconnected micropores and mesopores may evolve into mesopores and macropores, resulting in the increase in mesopore and macropore volume and total pore volume [61]. Therefore, the pore evolution of shale is formed by the superposition of the pore increasing process and pore decreasing process. At the same time, with the increasing maturity of organic matter, secondary organic pores also increase, causing to the change of shale pore heterogeneity, rendering the correlation between the total specific surface area and total pore volume difficult to distinguish. Therefore, some scholars propose that it is necessary to carry out a hydrocarbon extraction pretreatment experiment before the nitrogen adsorption experiment, and whether the experimental results conform to the objective law remains to be further tested [62].
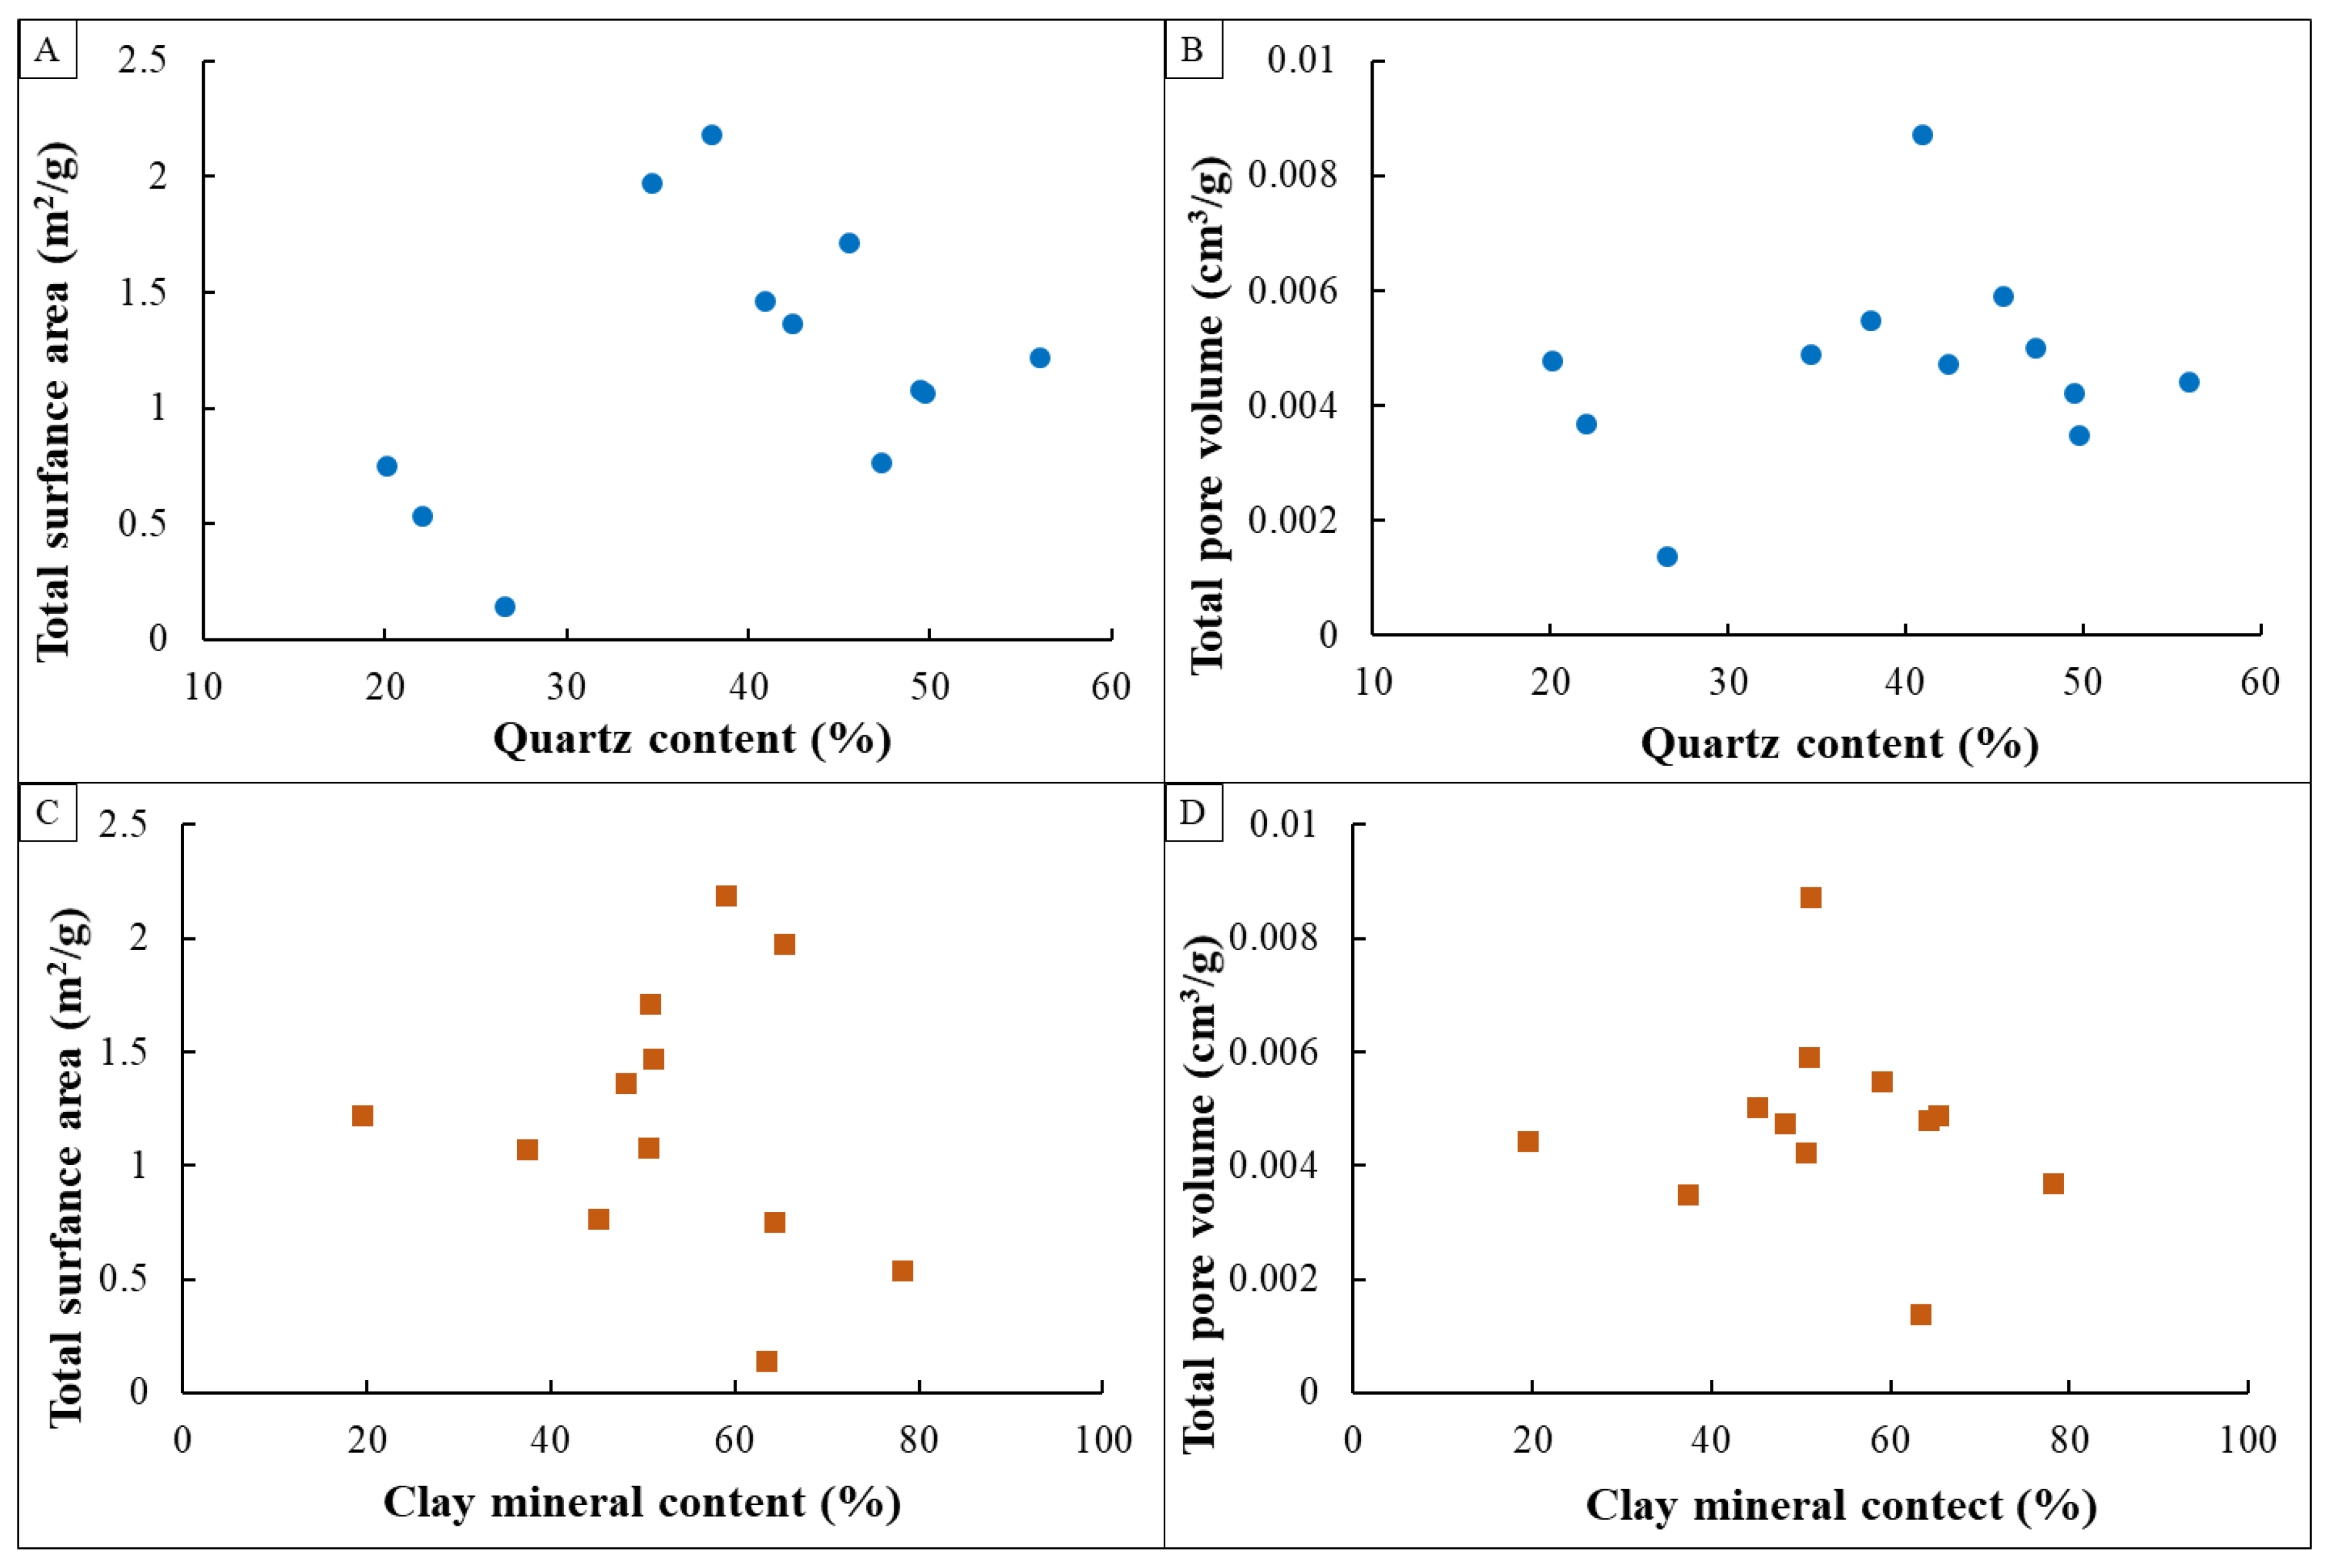
Mineral composition plays an important role in the shape, size, and development of shale reservoir pores. Quartz and clay minerals are the major mineral components in the Taiyuan Formation shale, as determined by X-ray diffraction. Nie Haikuan et al. studied the Lower Cambrian and Upper Ordovician-Lower Silurian marine shales in Southern China. The results show that the adsorbed gas content of black shale increases with the increase in quartz content, which is related to the sedimentary environment of marine shale [63]. Zeng Wei et al. studied the shale of Yanchang Formation in Ordos and considered that the quartz in Marine shale and continental shale were from different sources, leading to vast differences in the influence of quartz on the gas content of shale and the control results [64]. By analyzing the correlation between the specific surface area and pore volume, as measured by the quartz content and nitrogen adsorption experiments, we observed that the correlation between the quartz content and the specific surface area and total pore volume was poor. By analyzing the characteristics of the quartz minerals, we speculate that the main function of quartz is to construct a mineral framework to resist compaction due to overlying strata, thus retaining the organic pores and other pores. When the quartz content is excessively high, the dominance of quartz becomes prominent, such that the total pore content decreases owing to quartz’s poor ability to generate pores.
Based on Figure 13, there is no notable correlation between the clay mineral content and total specific surface area and total pore volume. This is consistent with the research conclusion of Zhao et al. on the shales of Longmaxi Formation in Southern Sichuan, China [65], and also consistent with previous studies on the Yanchang Formation shale in Ordos [66]. Some scholars have found that clay minerals are negatively correlated with pore volume and specific surface area [67]. We assumed that the actions of brittle minerals (dominated by quartz) and clay minerals on the pore size of the shale are related to each other, such that both should affect the specific surface area and total pore volume of the shale. The complex relationship between the specific surface area and total pore volume of the shale due to quartz indirectly affects the effect that clay minerals have on the specific surface area and total pore volume of the shale, rendering the relationship more complex and unclear. Further comparing mineral components with the correlation between the pore specific surface area and pore volume of different pore sizes, we found that mineral components have a greater influence on the micropores and mesopores, which confirms that the micropores and mesopores are the main contributors to the specific surface area and total pore volume in the shale.
4. Conclusions
- (1)
- The shale nitrogen adsorption curves of the Taiyuan Formation in the Lin-Xing area are similar to those of type IV(a) isotherms based on the IUPAC standard. The hysteresis loop type is mainly similar to types H3 and H4. The main pores are mesopores and macropores with a certain amount of micropores. The shale pores are mainly wedge-shaped and plate-shaped pores with good connectivity, which are conducive to the seepage and migration of shale gas.
- (2)
- The specific surface area of the shale samples ranged from 0.143 to 2.188 m2/g, and the pore volume ranged from 0.001398 to 0.008718 cm3/g. The correlation between the specific surface area and pore volume is good, which indicates that larger pore spaces result in a stronger ability to provide a specific surface area. Micropores and mesopores, especially micropores, provide most of the specific surface area of the pores, which are the main sites for gas adsorption in shale. Mesopores and macropores, especially mesopores, provide the main pore volume and are the main locations for gas storage in the shale pores.
- (3)
- The TOC has no notable linear relationship with the total pore volume, and also has no correlation with the specific surface area. There is no correlation between the total specific surface area and vitreous reflectance, whereas there is a low correlation between the total pore volume and vitreous reflectance with a “U” curve, perhaps due to the relatively small proportion of organic pores in the shale. The influence of organic matter and maturity on the pores of the shale samples is small; the role of organic matter is to generate hydrocarbons, not reservoirs. The quartz content has no relationship with the specific surface area or the total pore volume. We presumed that quartz plays a major role in building a mineral framework. There was no significant correlation between the clay mineral content and total specific surface area and total pore volume. The specific surface area and total pore volume of the shale may be influenced by both the clay minerals and quartz. The more complex relationship between the specific surface area and total pore volume of the shale due to quartz indirectly affects the role of clay minerals on the specific surface area and total pore volume of the shale, which renders the relationship more complex and unclear.
Author Contributions
Conceptualization, J.H. and X.Z.; methodology, J.H.; software, C.D.; validation, C.D., J.H. and H.W.; formal analysis, C.D.; investigation, H.W.; resources, H.W.; data curation, J.H.; writing—original draft preparation, C.D.; writing—review and editing, C.D.; visualization, C.D.; supervision, J.H.; project administration, J.H.; funding acquisition, J.H. All authors have read and agreed to the published version of the manuscript.
Funding
This research was funded by National Natural Science Foundation of China (No.41702170), the major national science and technology special projects (2016ZX05066001-004) and the basic scientific research business fee special fund project (2017QNA33) of the Central University of Mining and Technology of China.
Data Availability Statement
These studies have no published or reported data in any open databases.
Acknowledgments
This study is a contribution from the State Key Laboratory of Shale Oil and Gas Enrichment Mechanisms and Effective Development (Beijing, China) and School of Resources and Geoscience, China University of Mining and Technology (Jiangsu, China). The authors express their gratitude for the experimental test support of shale samples from the State Key Laboratory of Shale Oil and Gas Enrichment Mechanisms and Effective Development in Sinopec Petroleum Exploration and Production Research Institute. They also are grateful to Huang Cheng for the calculation and processing of experimental results.
Conflicts of Interest
The authors declare no conflict of interest.
References
- Li:, S.; Qiao, D.; Feng, Z.; Liu, L.; Wang, Q.; Nie, H. The status of worldwide shale gas exploration and its suggestion for China. Geol. Bull. China 2010, 29, 918–924. [Google Scholar]
- Dusseault, M.; McLennan, J.; Jiang, S. Massive Multi-Stage Hydraulic Fracturing for Oil and Gas Recovery from Low Mobility Reservoirs in China. Pet. Drill. Tech. 2011, 39, 6–16. [Google Scholar]
- Ross, D.J.K.; Bustin, R.M. Shale gas potential of the Lower Jurassic Gordondale Member northeastern British Columbia, Canada. Bull. Can. Pet. Geol. 2007, 55, 51–75. [Google Scholar] [CrossRef]
- Ross, D.J.K.; Bustin, R.M. Characterizing the shale gas resource potential of Devonian-Mississippian strata in the Western Canada sedimentary basin: Application of an integrated formation evaluation. AAPG Bull. 2008, 92, 87–125. [Google Scholar] [CrossRef]
- Wang, X.; Zhang, J.; Cao, J. A preliminary discussion on evaluation of continental shale gas resources: A case study of Chang 7 of Mesozoic Yanchang Formation in Zhiluo—Xiasiwan area of Yanchang. Earth Sci. Front. 2012, 19, 192–197. [Google Scholar]
- Ambrose, R.J.; Hartman, R.C.; Diaz-Campos, M. New pore-scale considerations for shale gas in place calculations. Soc. Petroleum Eng. 2010. [Google Scholar] [CrossRef]
- Zhang, J.; Xu, B.; Nie, H. Exploration potential of shale gas resources in China. Nat. Gas Ind. 2008, 28, 136–140. [Google Scholar]
- Curtis, J.B. Fractured shale-gas systems. AAPG Bull. 2002, 86, 1921–1938. [Google Scholar] [CrossRef]
- Javadpour, F. Nanopores and apparent permeability of gasflow in mudrocks (shales and siltstone). J. Cana Dian Pet. Technol. 2009, 48, 16–21. [Google Scholar] [CrossRef]
- Curtis, M.E.; Ambrose, R.J.; Sondergeld, C.H. Structural Characterization of Gas Shales on the Micro- and Nano-Scales. In Proceedings of the Canadian Unconventional Resources an International Petroleum Conference, Calgary, AB, Canada, 19–21 October 2010. [Google Scholar]
- Ross, D.J.; Bustin, R.M. The importance of shale composition and pore structure upon gas storage potential of shale gas reservoirs. Mar. Pet. Geol. 2009, 26, 916–927. [Google Scholar] [CrossRef]
- Curtis, M.E.; Cardott, B.J.; Sondergeld, C.H.; Rai, C.S. Development of organic porosity in the Woodford Shale with increasing thermal maturity. Int. J. Coal Geol. 2012, 103, 26–31. [Google Scholar] [CrossRef]
- Wang, Y.; Dong, D.; Li, J.; Wang, S.; Li, X.; Wang, L.; Cheng, K.; Huang, J. Reservoir characteristics of shale gas in Longmaxi Formation of the Lower Silurian, southern Sichuan. Acta Pet. Sin. 2012, 33, 551–561. [Google Scholar]
- Tian, H.; Zhang, S.; Liu, S.; Zhang, H. Determination of organic-rich shale pore features by mercury injection and gas adsorption methods. Acta Pet. Sin. 2012, 33, 419–427. [Google Scholar]
- Wang, P.; Jiang, Z.; Chen, L.; Yin, L.; Li, Z.; Zhang, C.; Tang, X.; Wang, G. Pore structure characterization for the Longmaxi and Niutitang shales in the Upper Yangtze Platform, South China: Evidence from focused ion beam–He ion microscopy, nano-computerized tomography and gas adsorption analysis. Mar. Pet. Geol. 2016, 77, 1323–1337. [Google Scholar] [CrossRef]
- Gou, Q.; Xu, S.; Hao, F.; Lu, Y.; Zhang, A.; Wang, Y.; Cheng, X.; Qing, J. Characterization method of shale pore structure based on nano-CT: A case study of Well JY-1. Acta Pet. Sin. 2018, 39, 1253–1261. [Google Scholar]
- Sondergeld, C.H.; Ambrose, R.J.; Rai, C.S. Micro-structural studies of gas shales; In Proceedings of the SPE Unconventional Gas Conference, Pittsburgh, PA, USA, 23–25 February 2010.
- Farshi, M.M.; Javadpour, F. Uncovering nanoscale issues in shale gas systems. Geol. Soc. Am. 2011, 43, 48. [Google Scholar]
- Gregg, S.J.; Sing, K.S.W.; Salzberg, H.W. Adsorption Surface Area and Porosity. J. Electrochem. Soc. 1967, 114, 279C. [Google Scholar] [CrossRef]
- Yang, F.; Ning, Z.; Kong, D.; Liu, H. Pore Structure of Shales from High Pressure Mercury Injection and Nitrogen Adsorption Method. Nat. Gas Geosci. 2013, 24, 450–455. [Google Scholar]
- Zhang, X.; Wu, C.; He, J.; Ren, Z.; Zhou, T. The Controlling Effects of Compositions on Nanopore Structure of Over-Mature Shale from the Longtan Formation in the Laochang Area, Eastern Yunnan, China. Minerals 2019, 9, 403. [Google Scholar] [CrossRef] [Green Version]
- Xue, H.; Wang, H.; Liu, H.; Yan, G.; Guo, W.; Li, X. Adsorption capability and aperture distribution characteristics of shales:taking the Longmaxi Formation shale of Sichuan Basin as an example. Acta Pet. Sin. 2013, 34, 826–832. [Google Scholar]
- Yang, W.; Chen, G.; Lv, C.; Zhong, J.; Xu, Y.; Yang, S.; Xue, L. Micropore Characteristics of the Organic-rich Shale in the 7th Member of the Yanchang Formation in the Southeast of Ordos Basin. Nat. Gas Geosci. 2015, 26, 418–426, 591. [Google Scholar]
- Giesche, H. Mercury Porosimetry: A General (Practical) Overview. Part. Part. Syst. Charact. 2006, 23, 9–19. [Google Scholar] [CrossRef]
- Bustin, A.M.M.; Bustin, R.M.; Cui, X. Importance of fabric on the production of gas shales. In Proceedings of the SPE Unconventional Reservoirs Conference, Keystone, CO, USA, 10–12 February 2008. [Google Scholar]
- Clarkson, C.R.; Freeman, M.; He, L.; Agamalian, M.; Melnichenko, Y.B.; Mastalerz, M.; Bustin, R.M.; Radlinski, A.P.; Blach, T.P. Characterization of tight gas reservoir pore structure using USANS /SANS and gas adsorption analysis. Fuel 2012, 95, 371–385. [Google Scholar] [CrossRef]
- Ruppert, L.F.; Sakurovs, R.; Blach, T.P.; He, L.; Melnichenko, Y.B.; Mildner, D.F.R.; Alcantar-Lopez, L. A USANS /SANS study of the accessibility of pores in the Barnett Shale to methane and water. Energy Fuels 2013, 27, 772–779. [Google Scholar] [CrossRef]
- Bustin, R.M.; Bustin, A.; Ross, D.; Chalmers, G.; Cui, X. Shale gas opportunities and challenges. In Proceedings of the AAPG Annual Convention, San Antonio, TX, USA, 20–23 April 2008. [Google Scholar]
- Barrett, E.P.; Joyner, L.G.; Halenda, P.P. The Determination of Pore Volume and Area Distributions in Porous Substances. I. Computations from Nitrogen Isotherms. J. Am. Chem. Soc. 1951, 73, 373. [Google Scholar] [CrossRef]
- Qin, Y.; Shen, J.; Shen, Y. Joint mining compatibility of superposed gas-bearing systems: A general geological problem for extraction of three natural gases and deep CBM in coal series. J. China Coal Soc. 2016, 41, 14–23. [Google Scholar]
- Burnaman, M.; Xia, W.; Shelton, J. Shale Gas Play Screening and Evaluation Criteria. China Pet. Explor. 2009, 14, 51–64. [Google Scholar]
- Kuuskraa, V.A.; Stevens, S.H. Worldwide gas shales and unconventional gas: A status report. In Proceedings of the United Nations Climate Change Conference, Copenhagen, Denmark, 7–19 December 2009. [Google Scholar]
- Chalmers, G.R.; Bustin, R.M.; Power, I.M. Characterization of gas shale pore systems by porosimetry, pycnometry, surface area, and field emission scanning electron microscopy/transmission electron microscopy image analyses: Examples from the Barnett, Woodford, Haynesville, Marcellus, and Doigunits. AAPG Bull. 2012, 96, 1099–1119. [Google Scholar] [CrossRef]
- Bowker, K.A. Barnett shale gas production, Fort Worth Basin: Issues and discussion. AAPG Bull. 2007, 91, 523–533. [Google Scholar] [CrossRef]
- Yang, F.; Ning, Z.; Hu, C.; Wang, B.; Peng, K.; Liu, H. Characterization of microscopic pore structures in shale reservoirs. Acta Pet. Sin. 2013, 34, 301–311. [Google Scholar]
- Thommes, M.; Kaneko, K.; Neimark, A.V.; Olivier, J.P.; Rodriguez-Reinoso, F.; Rouquerol, J.; Sing, K.S. Physisorption of gases, with special reference to the evaluation of surface area and pore size distribution (IUPAC Technical Report). Pure Appl. Chem. 2015, 87, 1051–1069. [Google Scholar] [CrossRef] [Green Version]
- Sing, K.S.W.; Everett, D.H.; Haul, R.A.W.; Moscou, L.; Pierotti, R.A.; Rouquerol, J.; Siemieniewska, T. Reporting physisorption data for gas/solid systems with special reference to the determination of surface area and porosity (Recommendations 1984). Pure Appl. Chem. 1985, 57, 603–619. [Google Scholar] [CrossRef]
- Burgess, C.G.V.; Everett, D.H.; Nuttall, S. Adsorption hysteresis in porous materials. Pure Appl. Chem. 1989, 61, 1845–1852. [Google Scholar] [CrossRef] [Green Version]
- Chen, Y.; Qin, Y.; Wei, C.; Huang, L.; Shi, Q.; Wu, C.; Zhang, X. Porosity changes in progressively pulverized anthracite subsamples: Implications for the study of closed pore distribution in coals. Fuel 2018, 225, 612–622. [Google Scholar] [CrossRef]
- Chen, S.; Zhu, Y.; Wang, H.; Liu, H.; Wei, W.; Fang, J. Structure characteristics and accumulation significance of nanopores in Longmaxi shale gas reservoir in the southern Sichuan Basin. J. China Coal Soc. 2012, 37, 438–444. [Google Scholar]
- Chalmers, G.R.L.; Bustin, R.M. Lower Cretaceous gas shales in northeastern British Columbia, Part II: Evaluation of regional potential gas resource. Bull. Can. Pet. Geol. 2008, 56, 22–61. [Google Scholar] [CrossRef]
- Chatfield, C. Statistics for Technology: A Course in Applied Statistics, 3rd ed.; Chapman and Hall: Boca Raton, FL, USA, 1983; pp. 166–171. [Google Scholar]
- Zhong, L.; Zhang, H.; Yuan, Z. Influence of specific pore area and pore volume of coal on adsorption capacity. Coal Geol. Explor. 2002, 30, 26–28. [Google Scholar]
- Bowker, K.A. Recent development of the Barnett Shale play, FortWorth Basin. West Tex. Geol. Soc. Bull. 2003, 42, 1–11. [Google Scholar]
- Cao, T.; Song, Z.; Liu, G.; Yin, Q.; Luo, H. Characteristics of shale pores, fractal dimension and their controlling factors determined by nitrogen adsorption and mercury injection methods. Pet. Geol. Recovery Effic. 2016, 23, 1–8. [Google Scholar]
- Nuttall, B.C.; Drahovzal, J.A.; Eble, C.F.; Bustin, R.M. Analysis of the Devonian black shale in Kentucky for potential carbon dioxide sequestration and enhanced natural gas production. Greenhouse Gas Control Technol. 2005, 7, 2225–2228. [Google Scholar]
- Martin, J.P.; Hill, D.G.; Lombardi, T.E. Fractured shale gas potential in New York. Northeastern Geology and Environmental. Sciences 2004, 26, 57–78. [Google Scholar]
- Chalmers, G.R.L.; Bustin, R.M. Lower Cretaceous gas shales in northeastern British Columbia, Part I: Geological controls on methane sorption capacity. Bull. Can. Pet. Geol. 2008, 56, 1–21. [Google Scholar] [CrossRef]
- Cao, T.; Deng, M.; Luo, H.; Liu, H.; Liu, G.; Hursthouse, A.S. Characteristics of organic pores in Middle and Upper Permian shale in the Lower Yangtze region. Pet. Geol. Exp. 2018, 40, 315–322, 396. [Google Scholar]
- Xue, C.; Wu, J.; Zhong, J.; Liu, Q.; Zhang, S.; Hou, M.; Li, F.; Peng, C. Characteristics of reservoir variability of transitional and continental shale, Shanxi Formation, Linxing and Shenfu area, Northeastern Ordos Basin. J. Cent. South Univ. 2020, 51, 998–1011. [Google Scholar]
- Cheng, P.; Xiao, X. Gas content of organic-rich shales with very high maturities. J. China Coal Soc. 2013, 38, 737–741. [Google Scholar]
- Baskin, D.K.; Liu, Q. Evaluation of Thermal Maturity and Hydrocarbon Generation Potential of Source Rocks Using kerogen H/C Ratio. Nat. Gas Geosci. 2002, Z3, 41–49. [Google Scholar]
- Zhang, J.; He, S.; Yan, X.; Hou, Y.; Chen, X. Structural characteristics and thermal evolution of nanoporosity in shales. J. China Univ. Pet. 2017, 41, 11–24. [Google Scholar]
- Jacob, H. Disperse solid bitumens as an indicator for migration and maturity in prospecting for oil and gas. Erdoel Kohle Erd Gas Petrochem. 1985, 38, 365. [Google Scholar]
- Jarvie, D.M.; Hill, R.J.; Ruble, T.E.; Pollastro, R.M. Unconventional shale-gas systems: The Mississippian Barnett shale of north-central Texas as one model for thermogenic shale-gas assessment. AAPG Bull. 2007, 91, 475–499. [Google Scholar] [CrossRef]
- Martineau, D.F. History of the Newark East field and the Barnett shale as a gas reservoir. AAPG Bull. 2007, 91, 399–403. [Google Scholar] [CrossRef]
- Milici, R.C.; Swezey, C.S. Assessment of Appalachian Basin Oil and Gas Resources: Devonian Shale Middle and Upper Paleozoic Total Petroleum System, 1st ed.; Geological Survey: Reston, VA, USA, 2006; pp. 1–70. [Google Scholar]
- Loucks, R.G.; Reed, R.M.; Ruppel, S.C. Spectrum of pore types and networks in mudrocks and a descriptive classification for matrix-related mudrock pores. AAPG Bull. 2012, 96, 1071–1098. [Google Scholar] [CrossRef] [Green Version]
- Wei, X.; Liu, R.; Zhang, T.; Liang, X. Micro-pores Structure Characteristics and Development Control Factors of Shale Gas Reservoir: A Case of Longmaxi Formation in XX Area of Southern Sichuan and Northern Guizhou. Nat. Gas Geosci. 2013, 24, 1048–1059. [Google Scholar]
- Li, Y.; Cai, J. Effect of smectite illitization on shale gas occurrence in argillaceous source rocks. Pet. Geol. Exp. 2014, 36, 352–358. [Google Scholar]
- Zhang, C.; Zhu, Y.; Liu, Y.; Chen, J.; Li, Z. Pore and fractal characteristics of shale in different maturity. Fault Block Oil Gas Field 2016, 23, 583–588. [Google Scholar]
- Liu, G.; Huang, Z.; Jiang, Z.; Chen, J.; Chen, F.; Xing, J. Effect of liquid hydrocarbons on gas adsorption in alacustrine shale: A case study of the Yanchang Formation, Ordos Basin. Pet. Geol. Exp. 2015, 37, 648–653+659. [Google Scholar]
- Nie, H.; Zhang, J. Shale Gas Accumulation Conditions and Gas Content Calculation: A Case Study of Sichuan Basin and Its Periphery in the Lower Paleozoic. Acta Geol. Sin. 2012, 86, 349–361. [Google Scholar]
- Zeng, W.; Zhang, J.; Ding, W.; Wang, X.; Zhu, D.; Liu, Z. The Gas Content of Continental Yanchang Shale and Its Main Controlling Factors: A Case Study of Liuping-171 Well in Ordos Basin. Nat. Gas Geosci. 2014, 25, 291–301. [Google Scholar]
- Zhao, P.; Li, X.; Tian, X.; Su, G.; Zhang, M.; Guo, M.; Dong, Z.; Sun, M.; Wang, F. Study on Micropore Structure Characteristics of Longmaxi Formation Shale Gas Reservoirs in the Southern Sichuan Basin. Nat. Gas Geosci. 2014, 25, 947–956. [Google Scholar]
- He, J.; Zhang, X.; Zhao, Y.; Wu, H.; Chen, J. Nanometer Pore Structure Characterization of Chang 7 Member Continental Shale in Northern Shaanxi Area, Ordos Basin Based on the Nitrogen Adsorption Experiment. J. Nanosci. Nanotechnol. 2017, 17, 6386–6394. [Google Scholar] [CrossRef]
- Guo, X.; Li, Y.; Liu, R.; Wang, Q. Characteristics and controlling factors of micro-pore structures of Longmaxi Shale Play in the Jiaoshiba area, Sichuan Basin. Nat. Gas Ind. 2014, 34, 9–16. [Google Scholar]
Figure 1.
Geological background map of Lin-Xing area and sampling point distribution map.
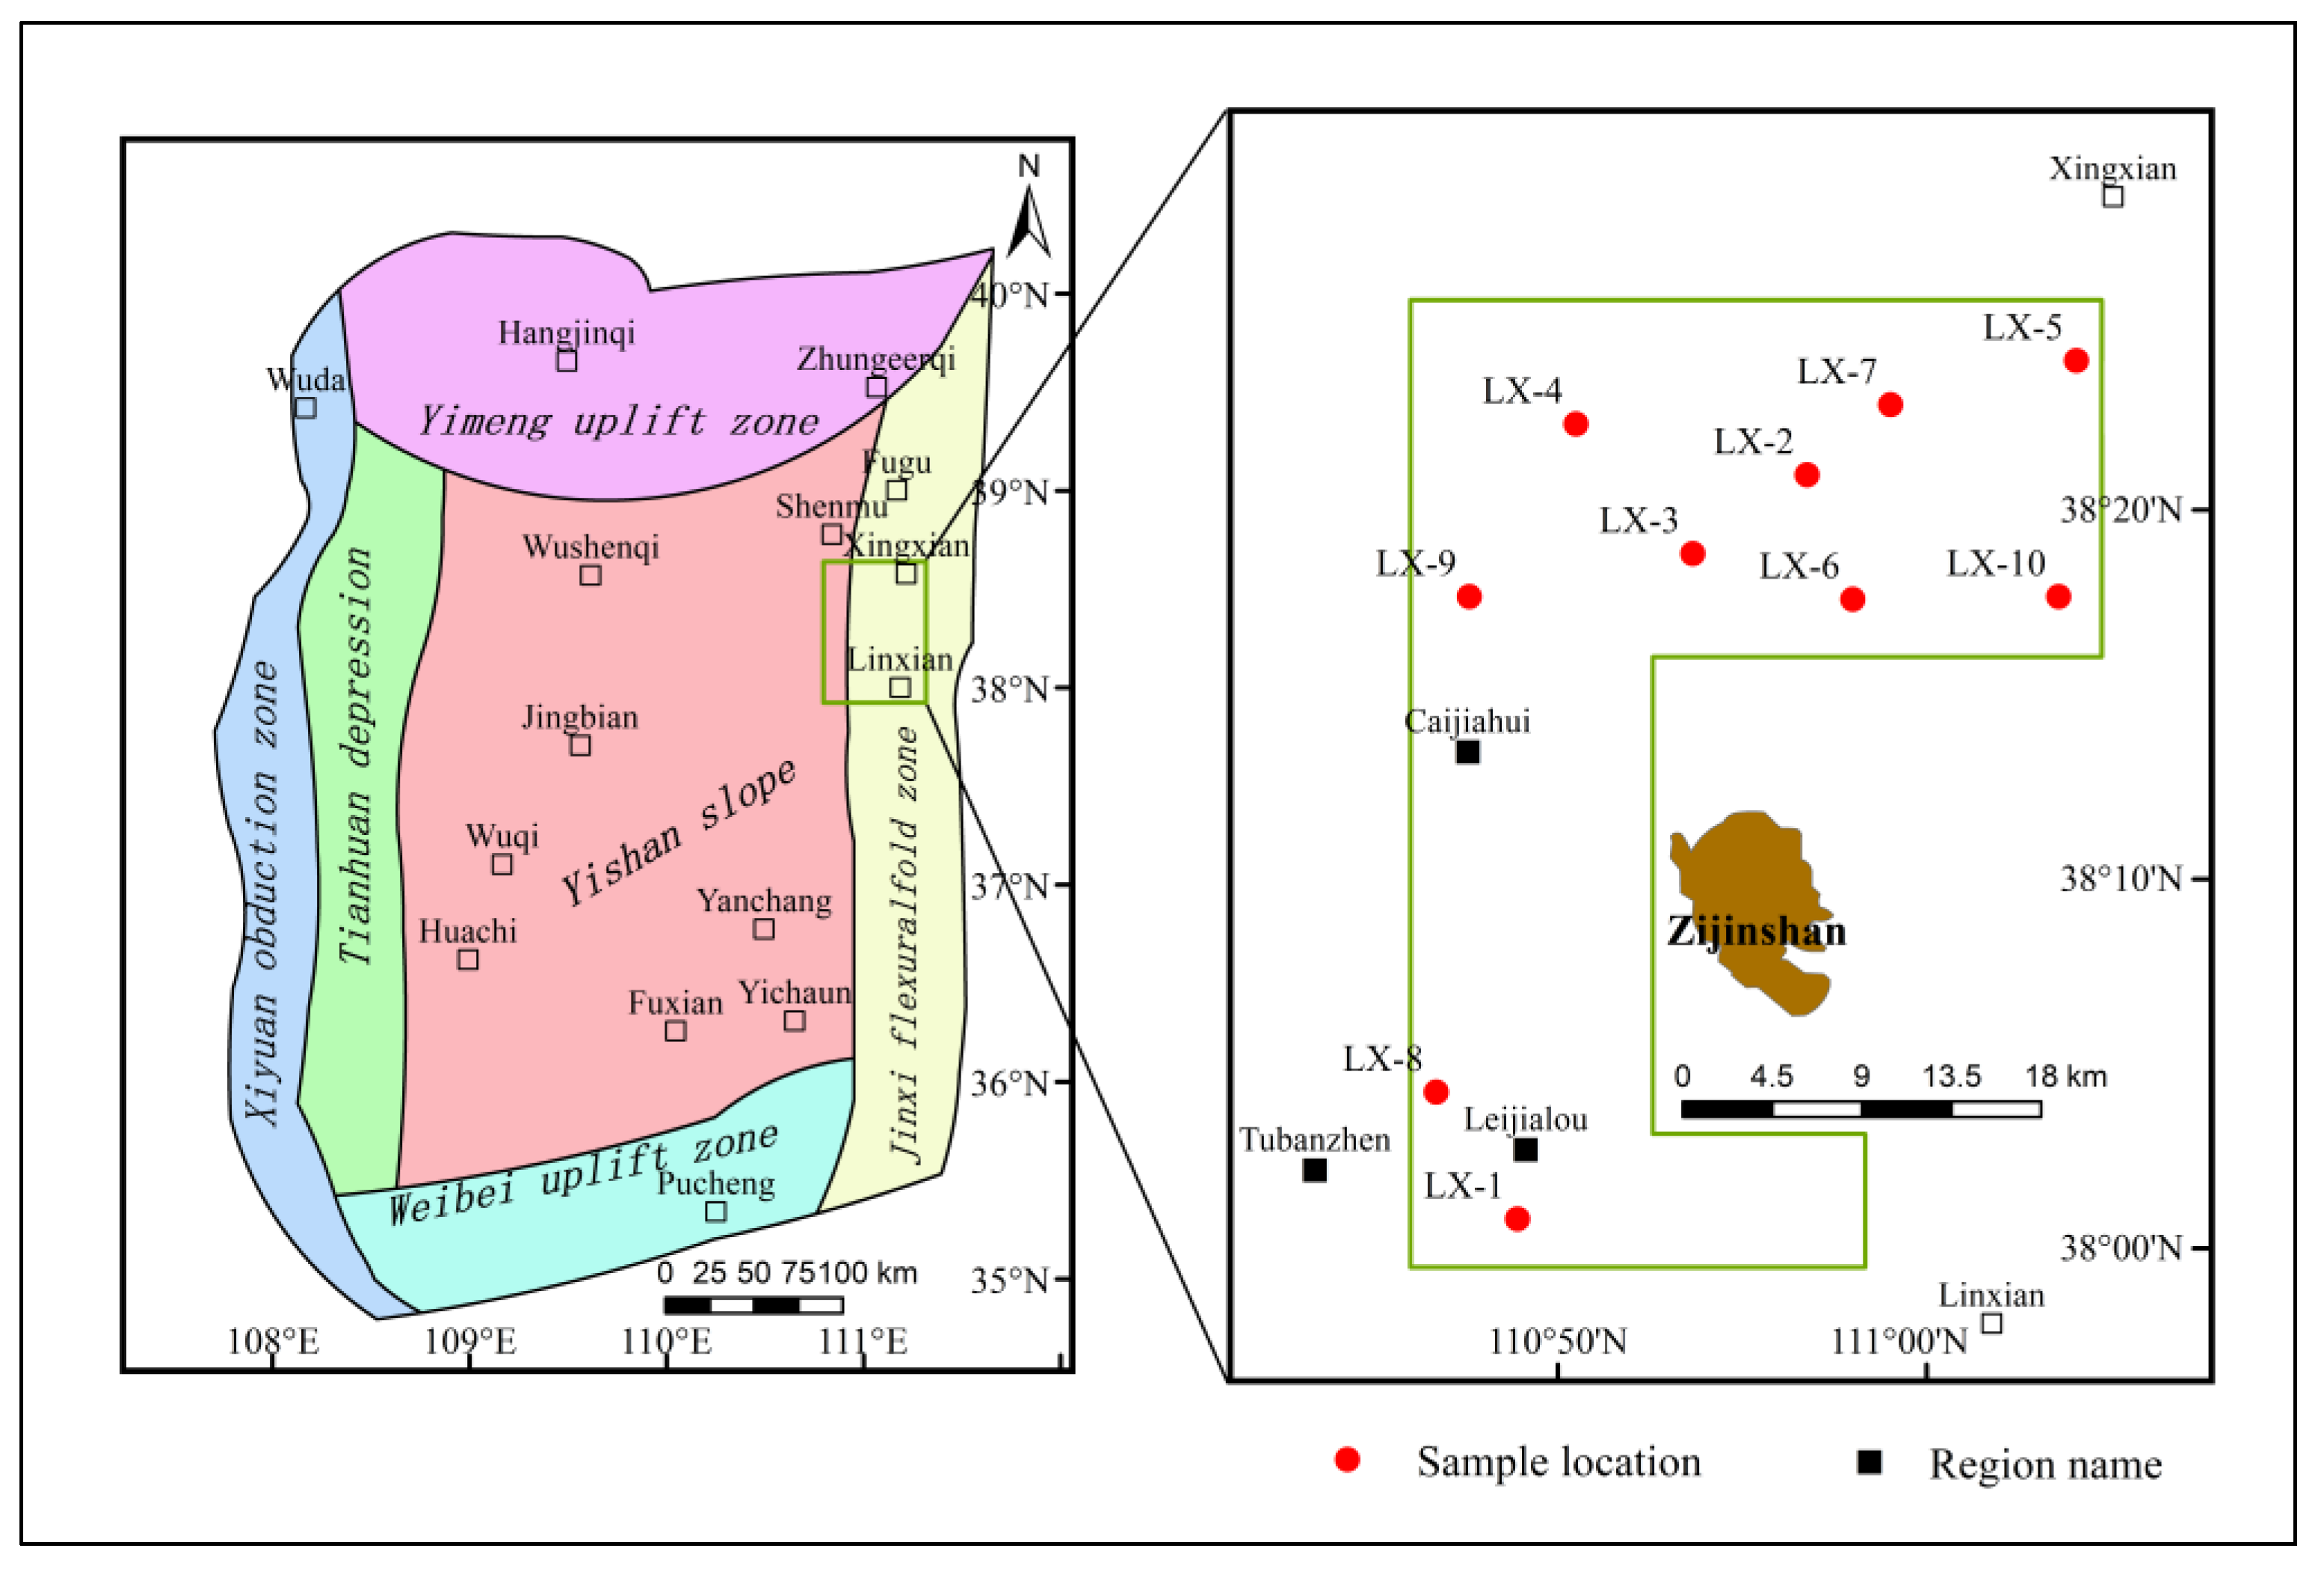
Figure 2.
Mineral compositions of the Taiyuan Formation shale.
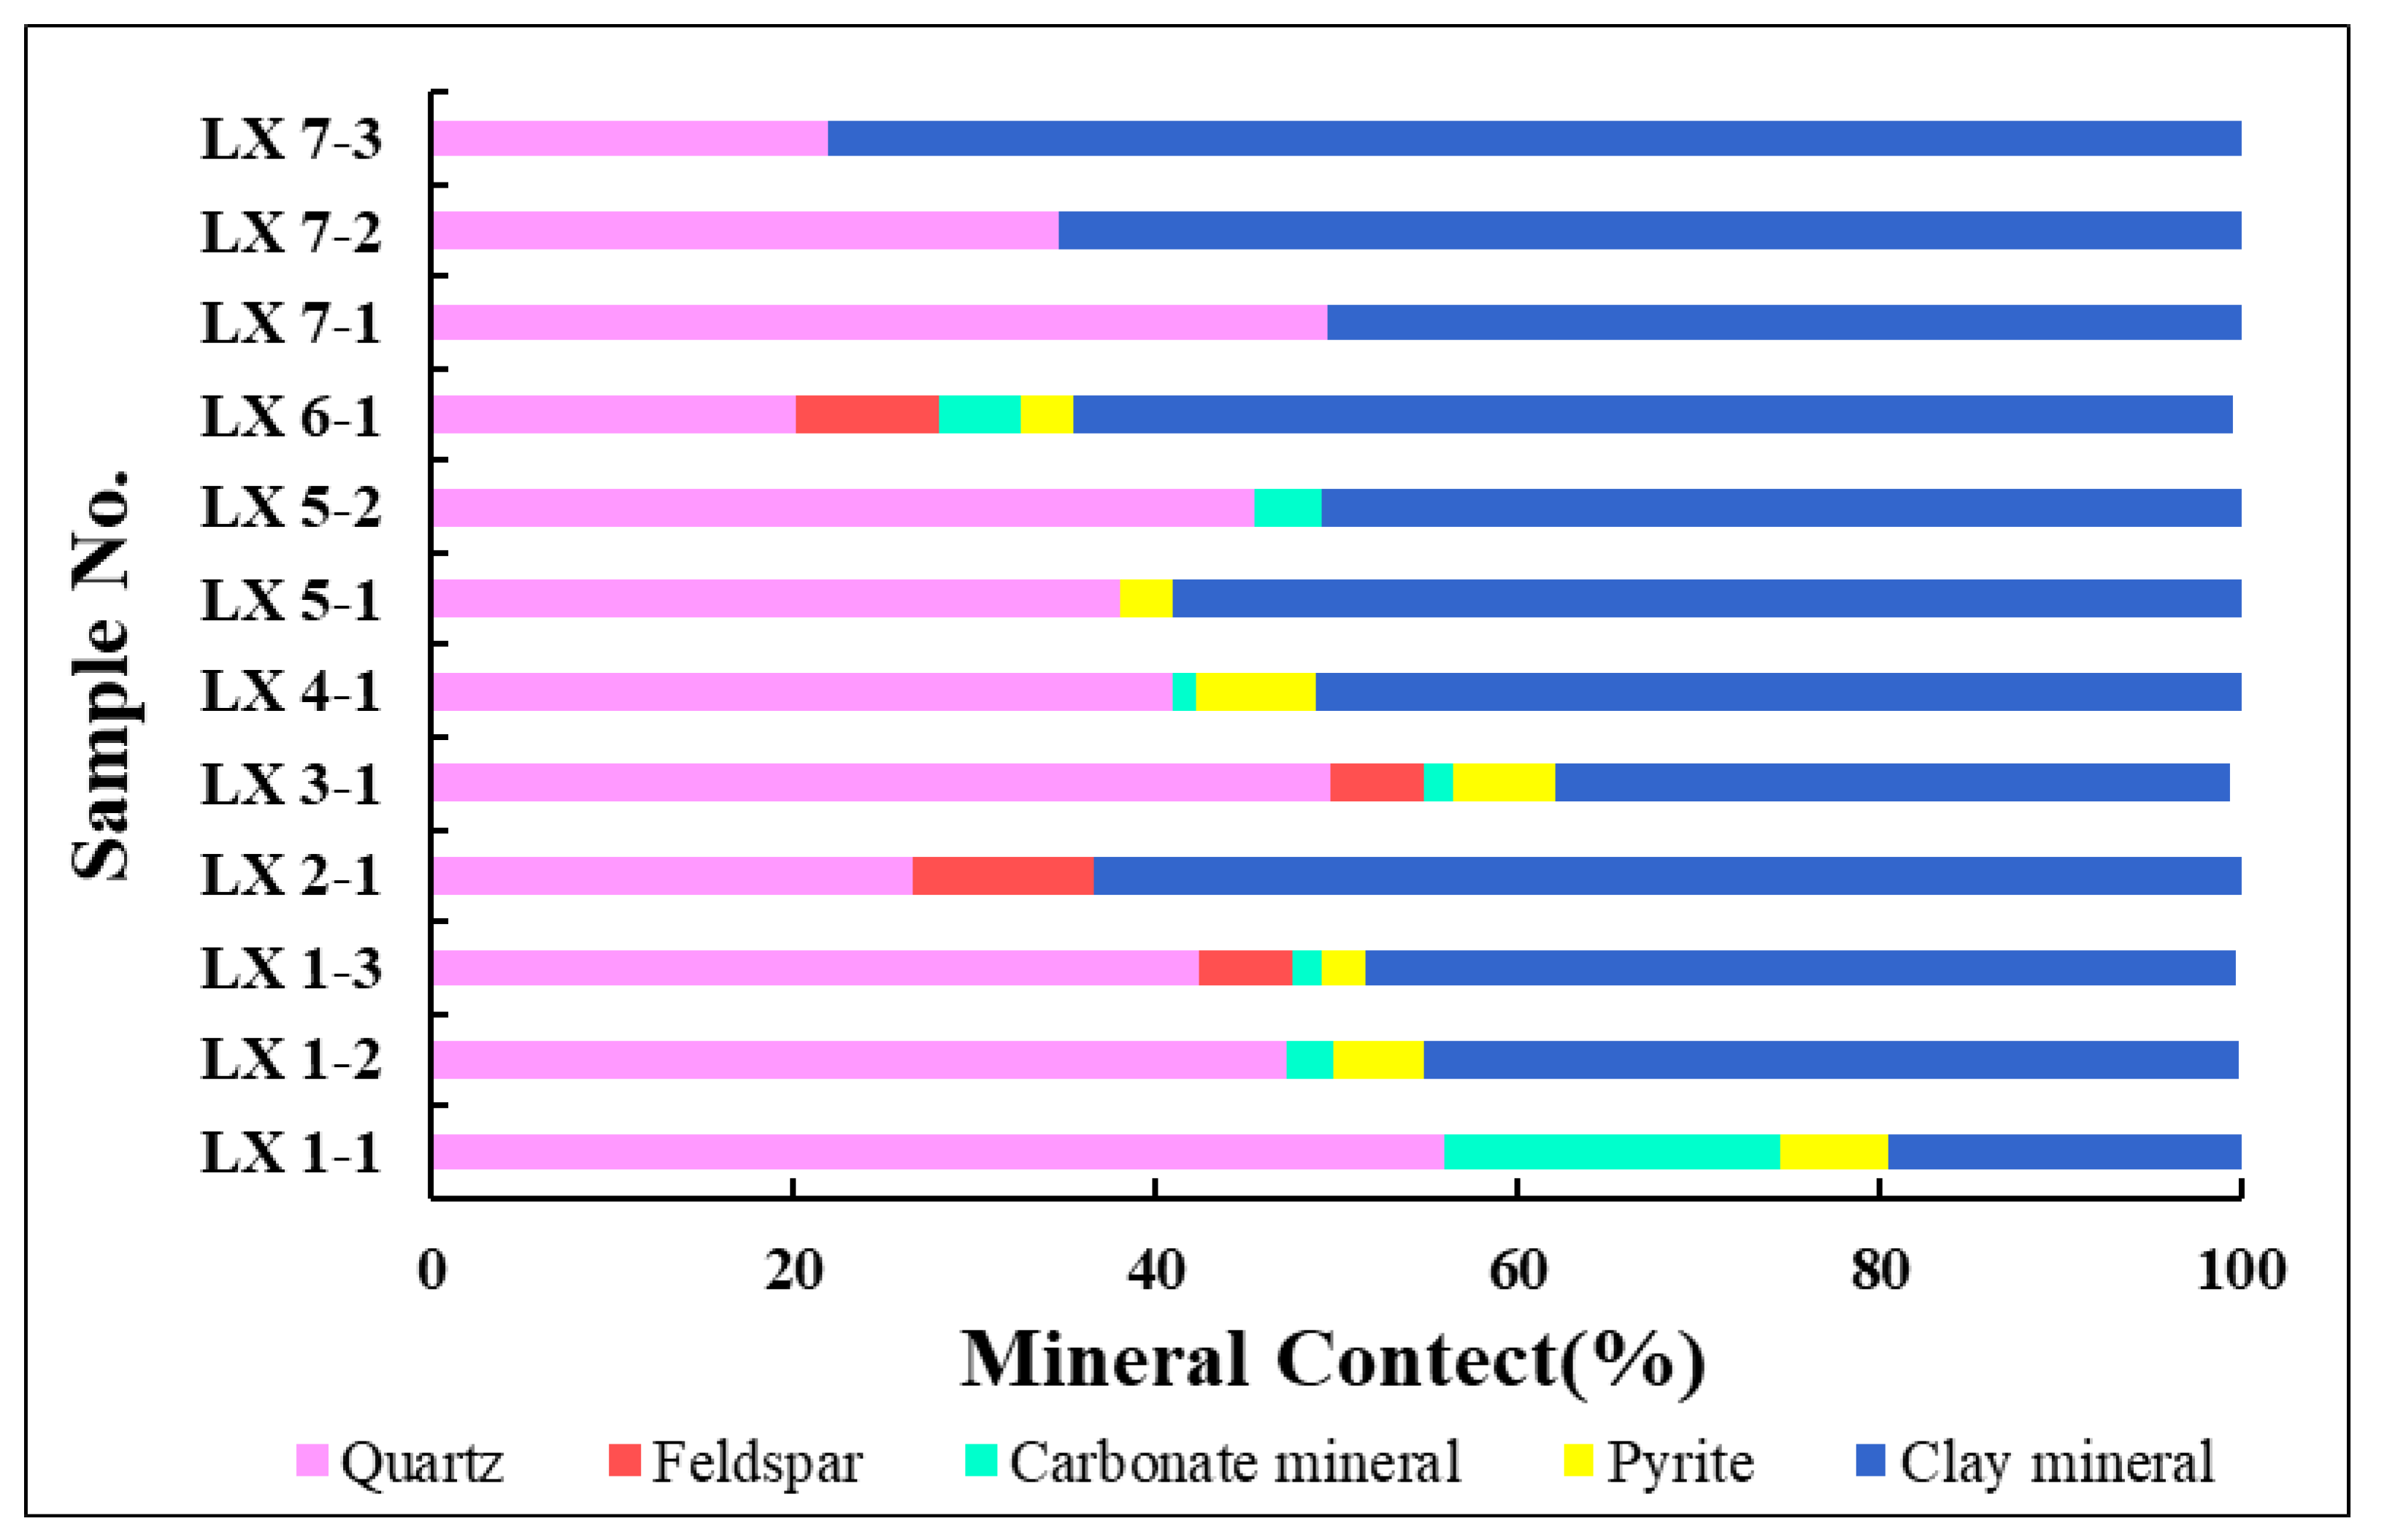
Figure 3.
Classification of physisorption isotherms [36]. Note: the quantity of gas adsorbed may be measured in any convenient units: moles, grams, and cubic centimeters et al were all used.
Figure 3.
Classification of physisorption isotherms [36]. Note: the quantity of gas adsorbed may be measured in any convenient units: moles, grams, and cubic centimeters et al were all used.
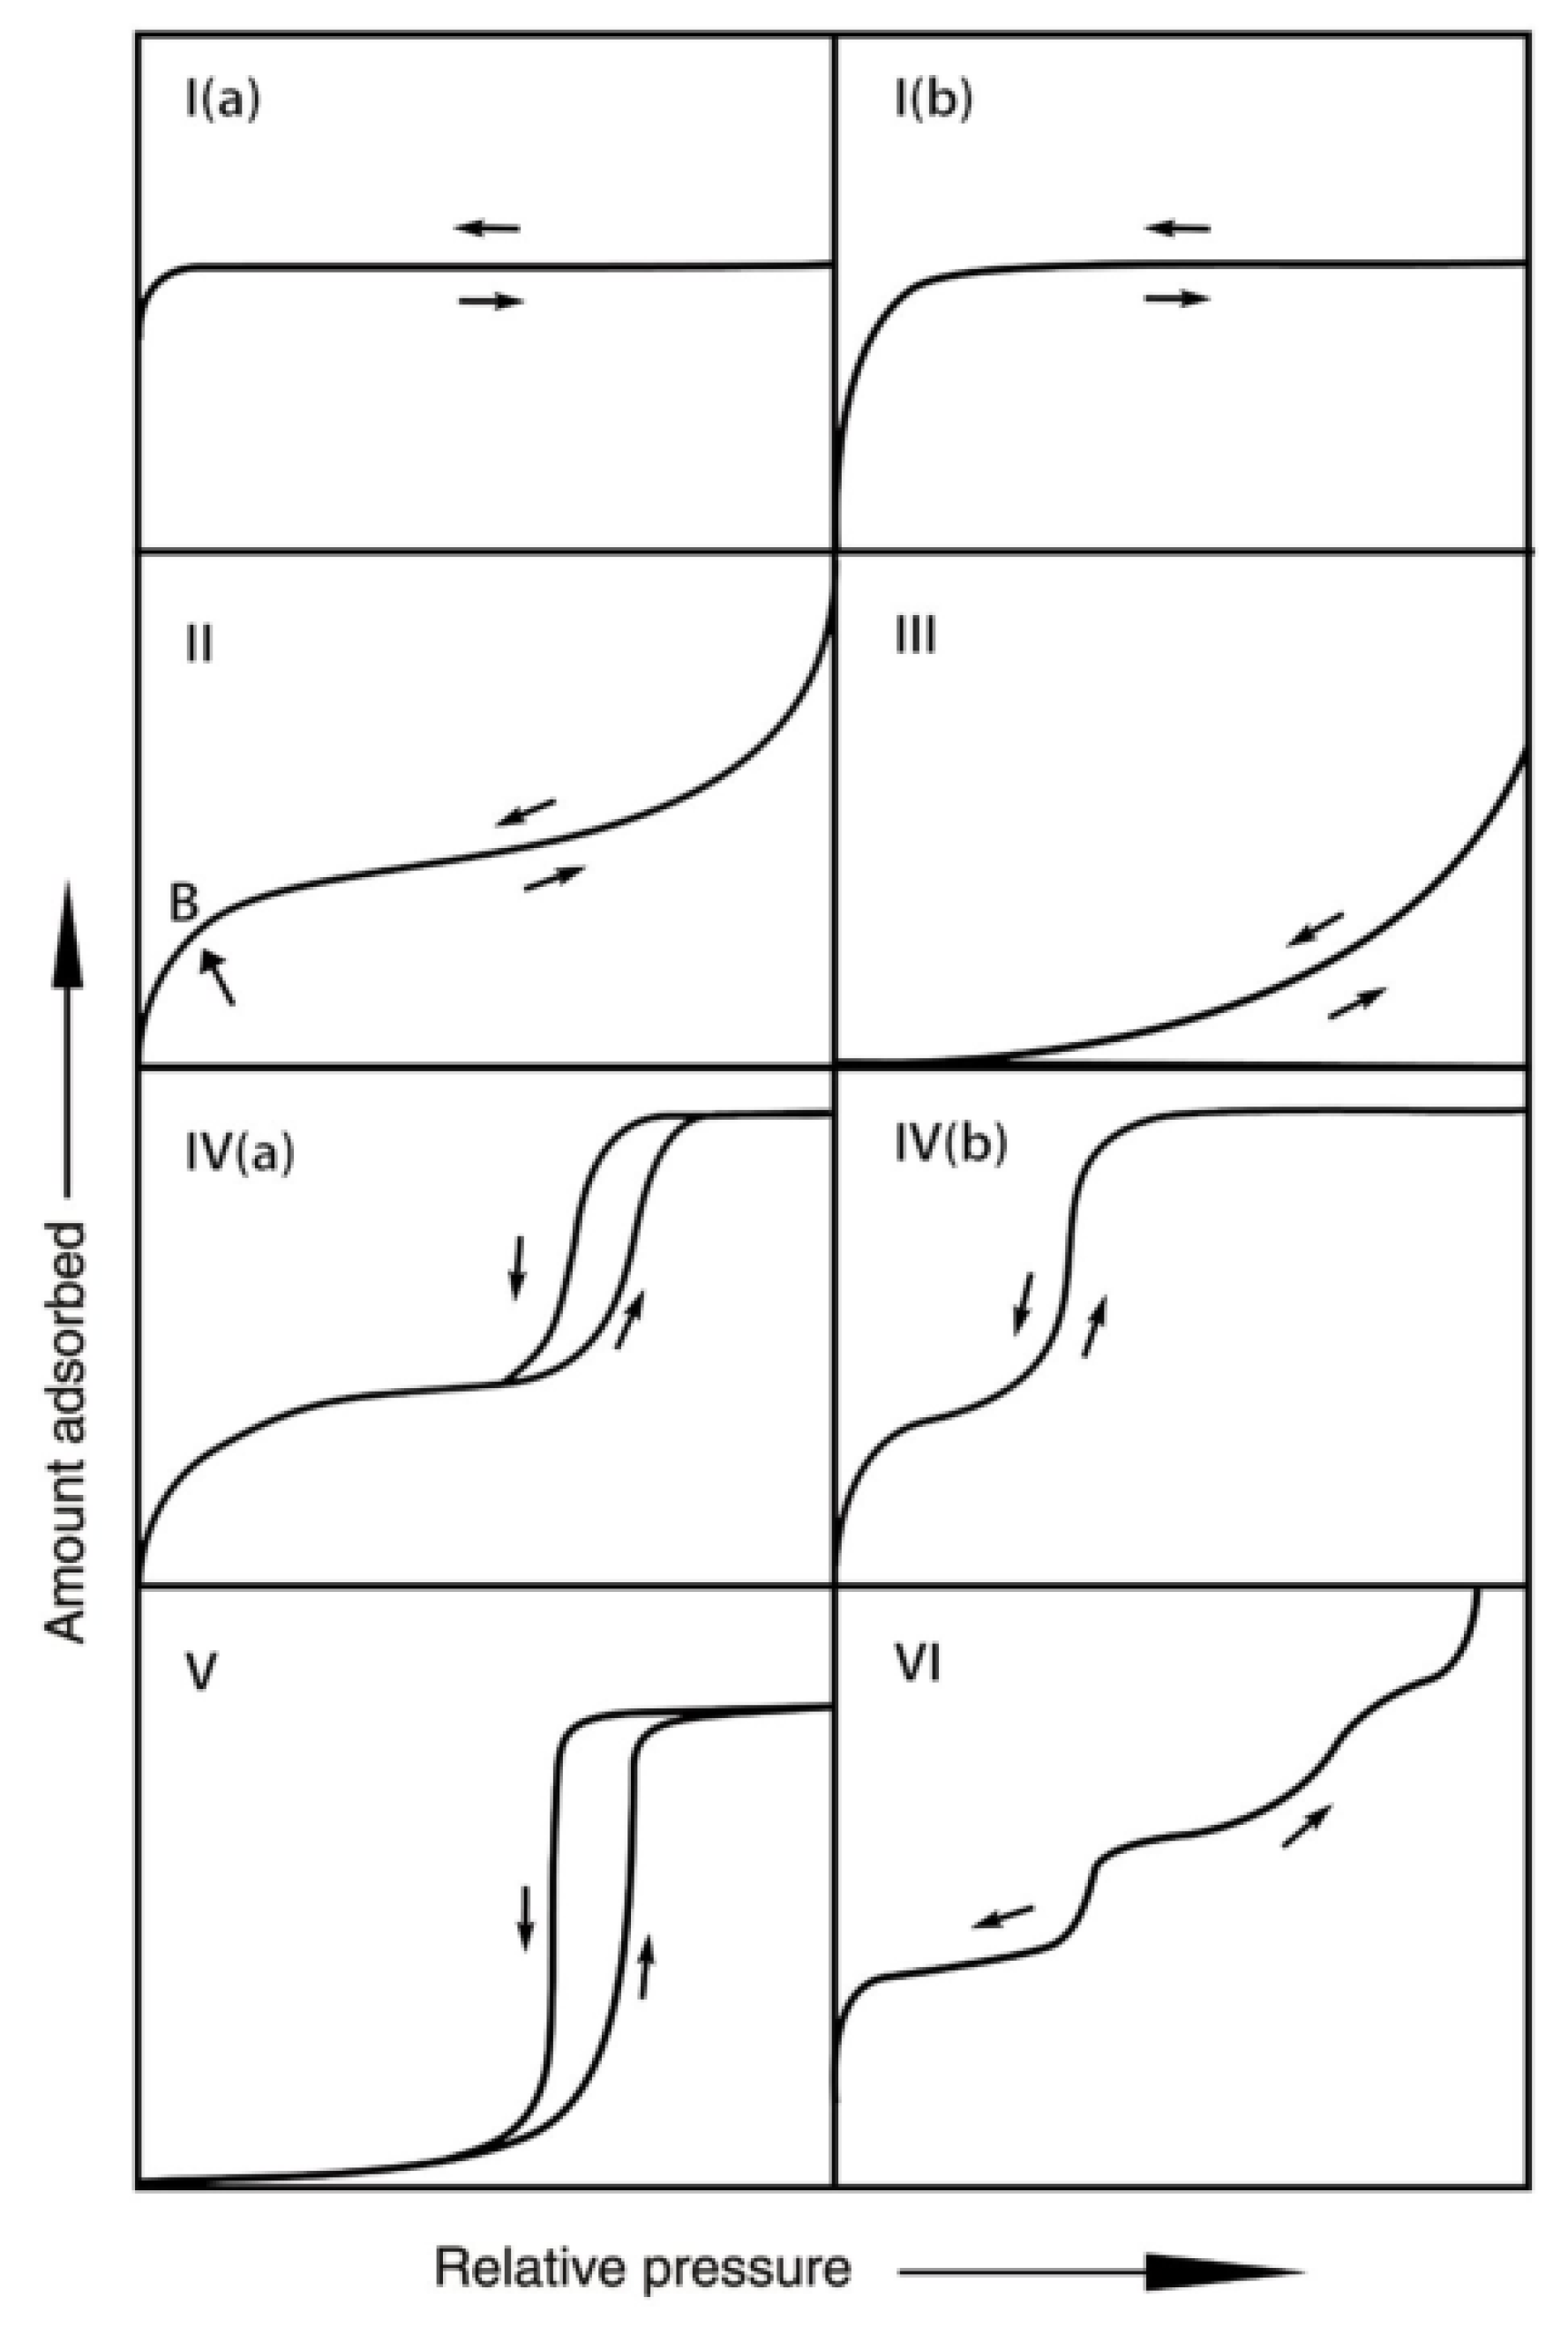
Figure 4.
Classification of hysteresis loops [36]. Note: the quantity of gas adsorbed may be measured in any convenient units: moles, grams, and cubic centimeters et al were all used.
Figure 4.
Classification of hysteresis loops [36]. Note: the quantity of gas adsorbed may be measured in any convenient units: moles, grams, and cubic centimeters et al were all used.
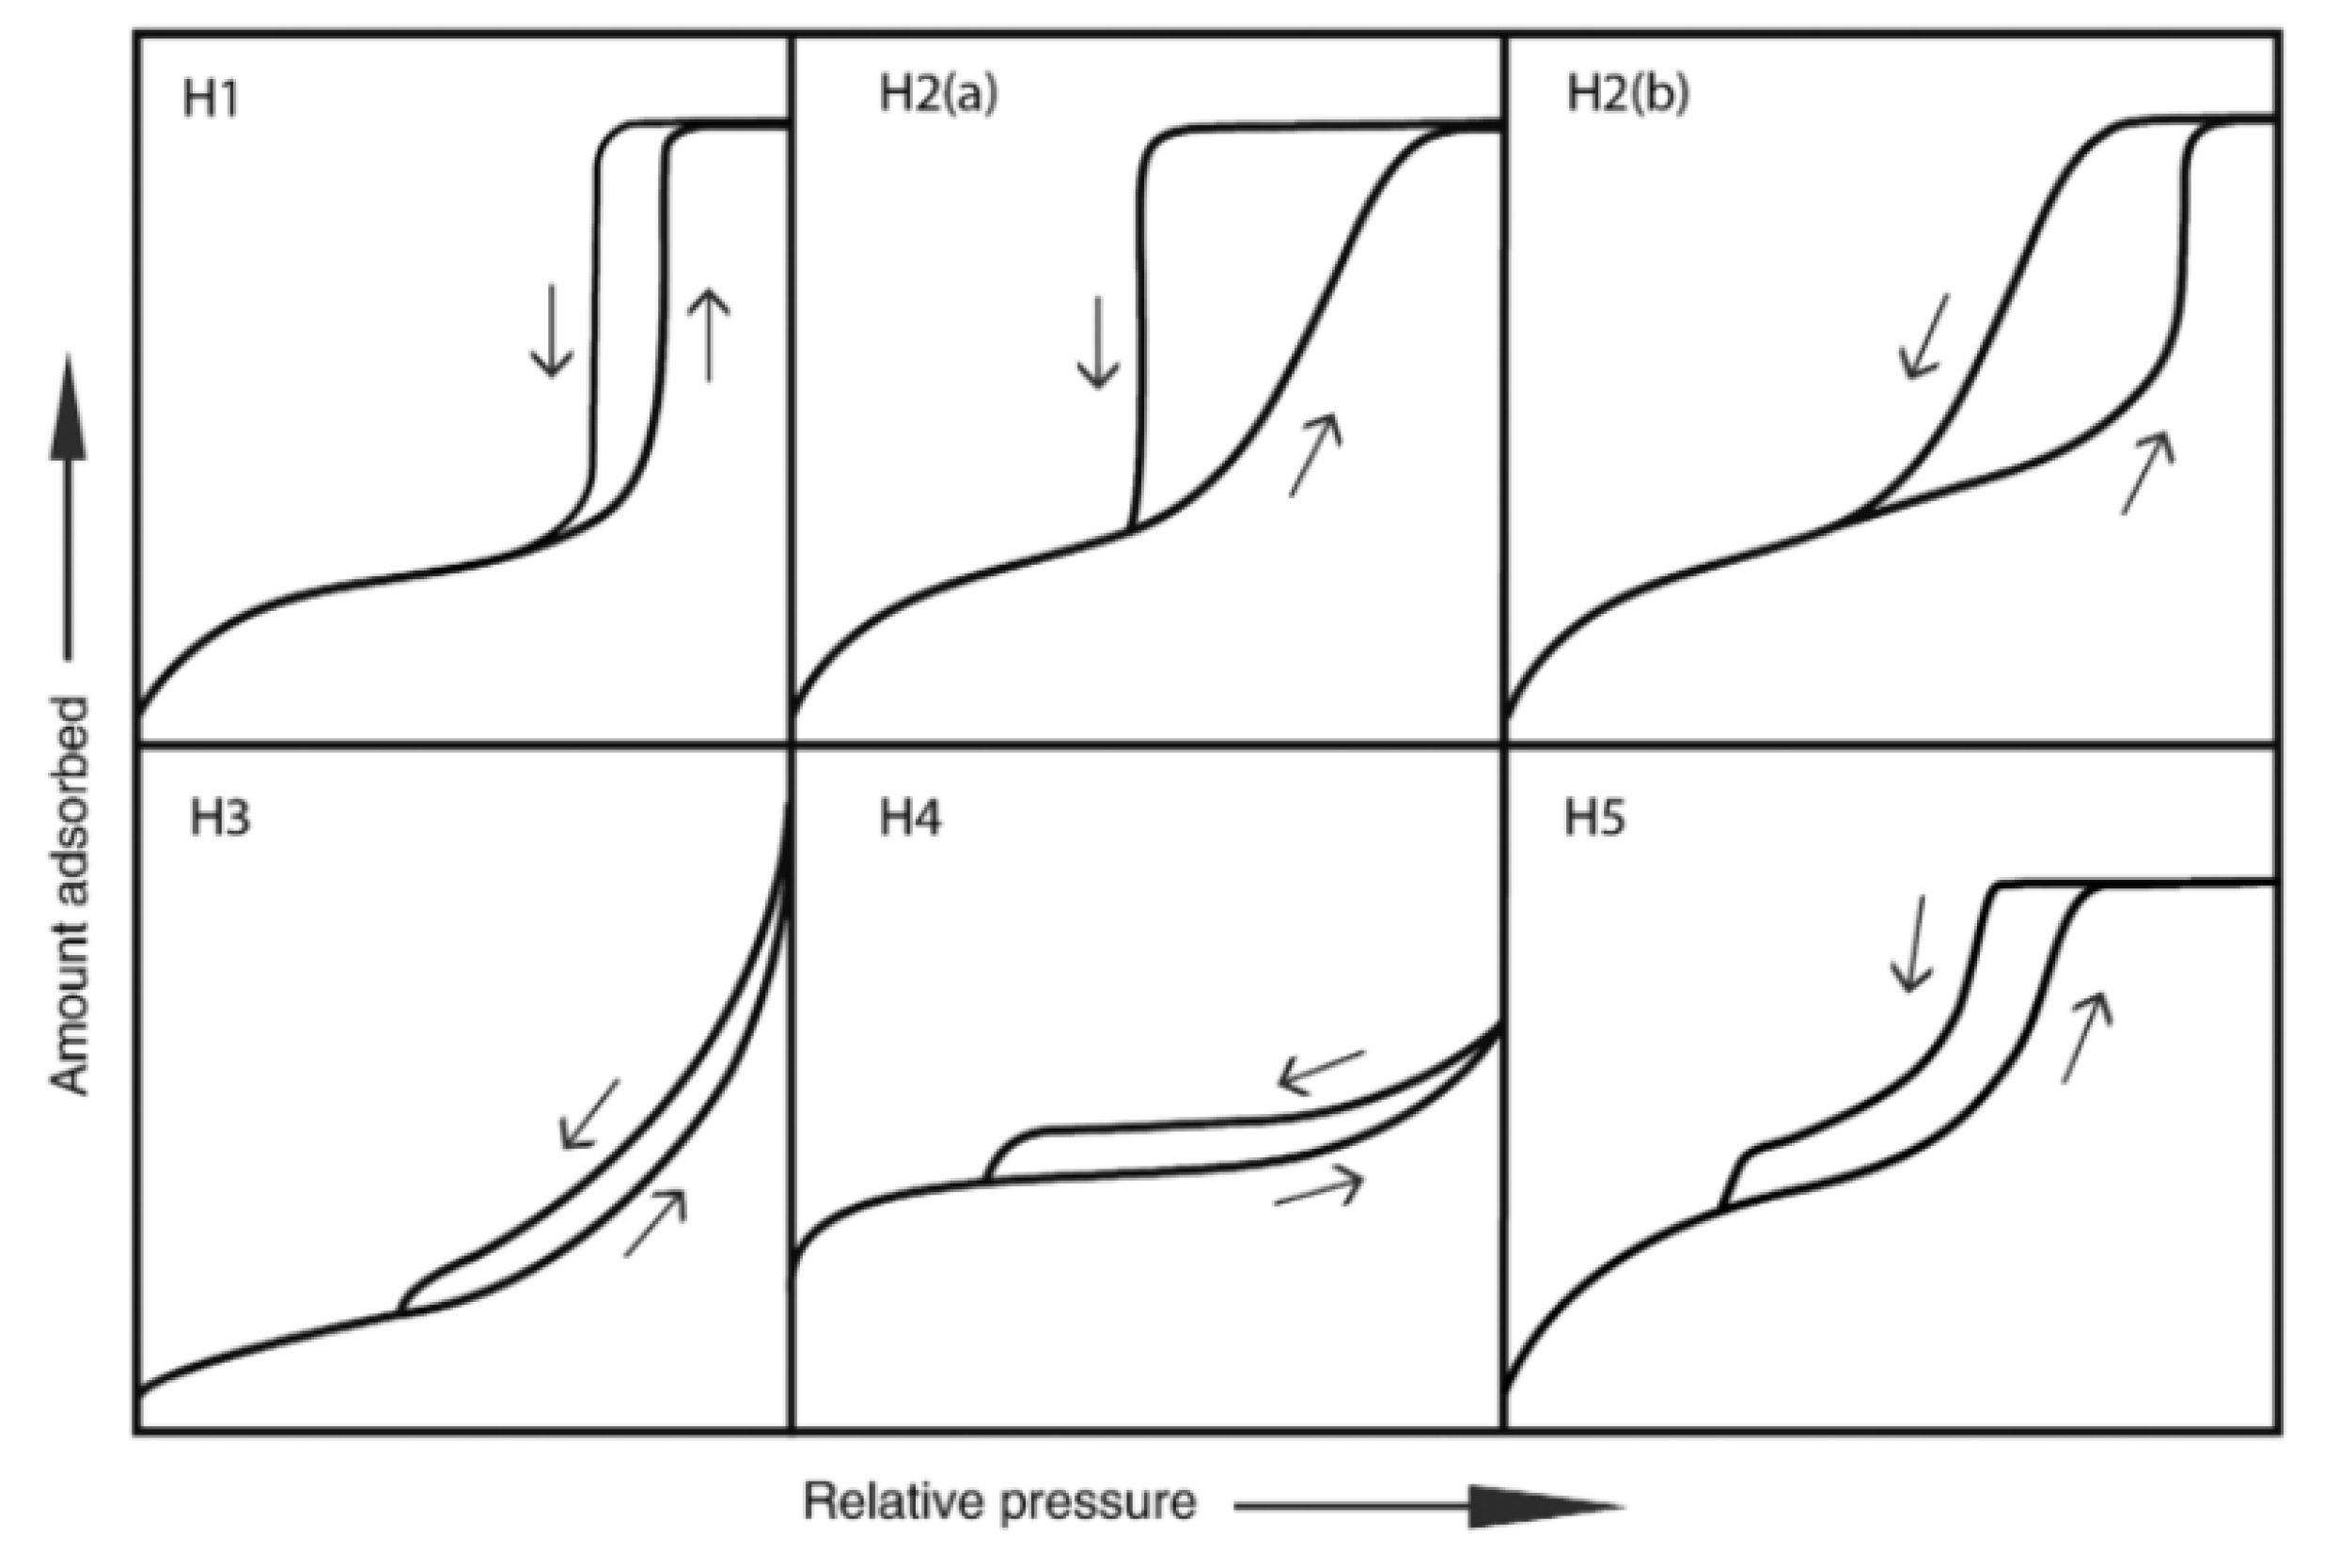
Figure 5.
Nitrogen adsorption and desorption isotherms of shale samples from the Taiyuan Formation in the study area: (A) LX1-1, (B) LX1-2, (C) LX1-3, (D) LX2-1, (E) LX3-1, (F) LX4-1, (G) LX5-1, (H) LX5-2, (I) LX6-1, (J) LX7-1, (K) LX7-2, and (L) LX7-3.
Figure 5.
Nitrogen adsorption and desorption isotherms of shale samples from the Taiyuan Formation in the study area: (A) LX1-1, (B) LX1-2, (C) LX1-3, (D) LX2-1, (E) LX3-1, (F) LX4-1, (G) LX5-1, (H) LX5-2, (I) LX6-1, (J) LX7-1, (K) LX7-2, and (L) LX7-3.
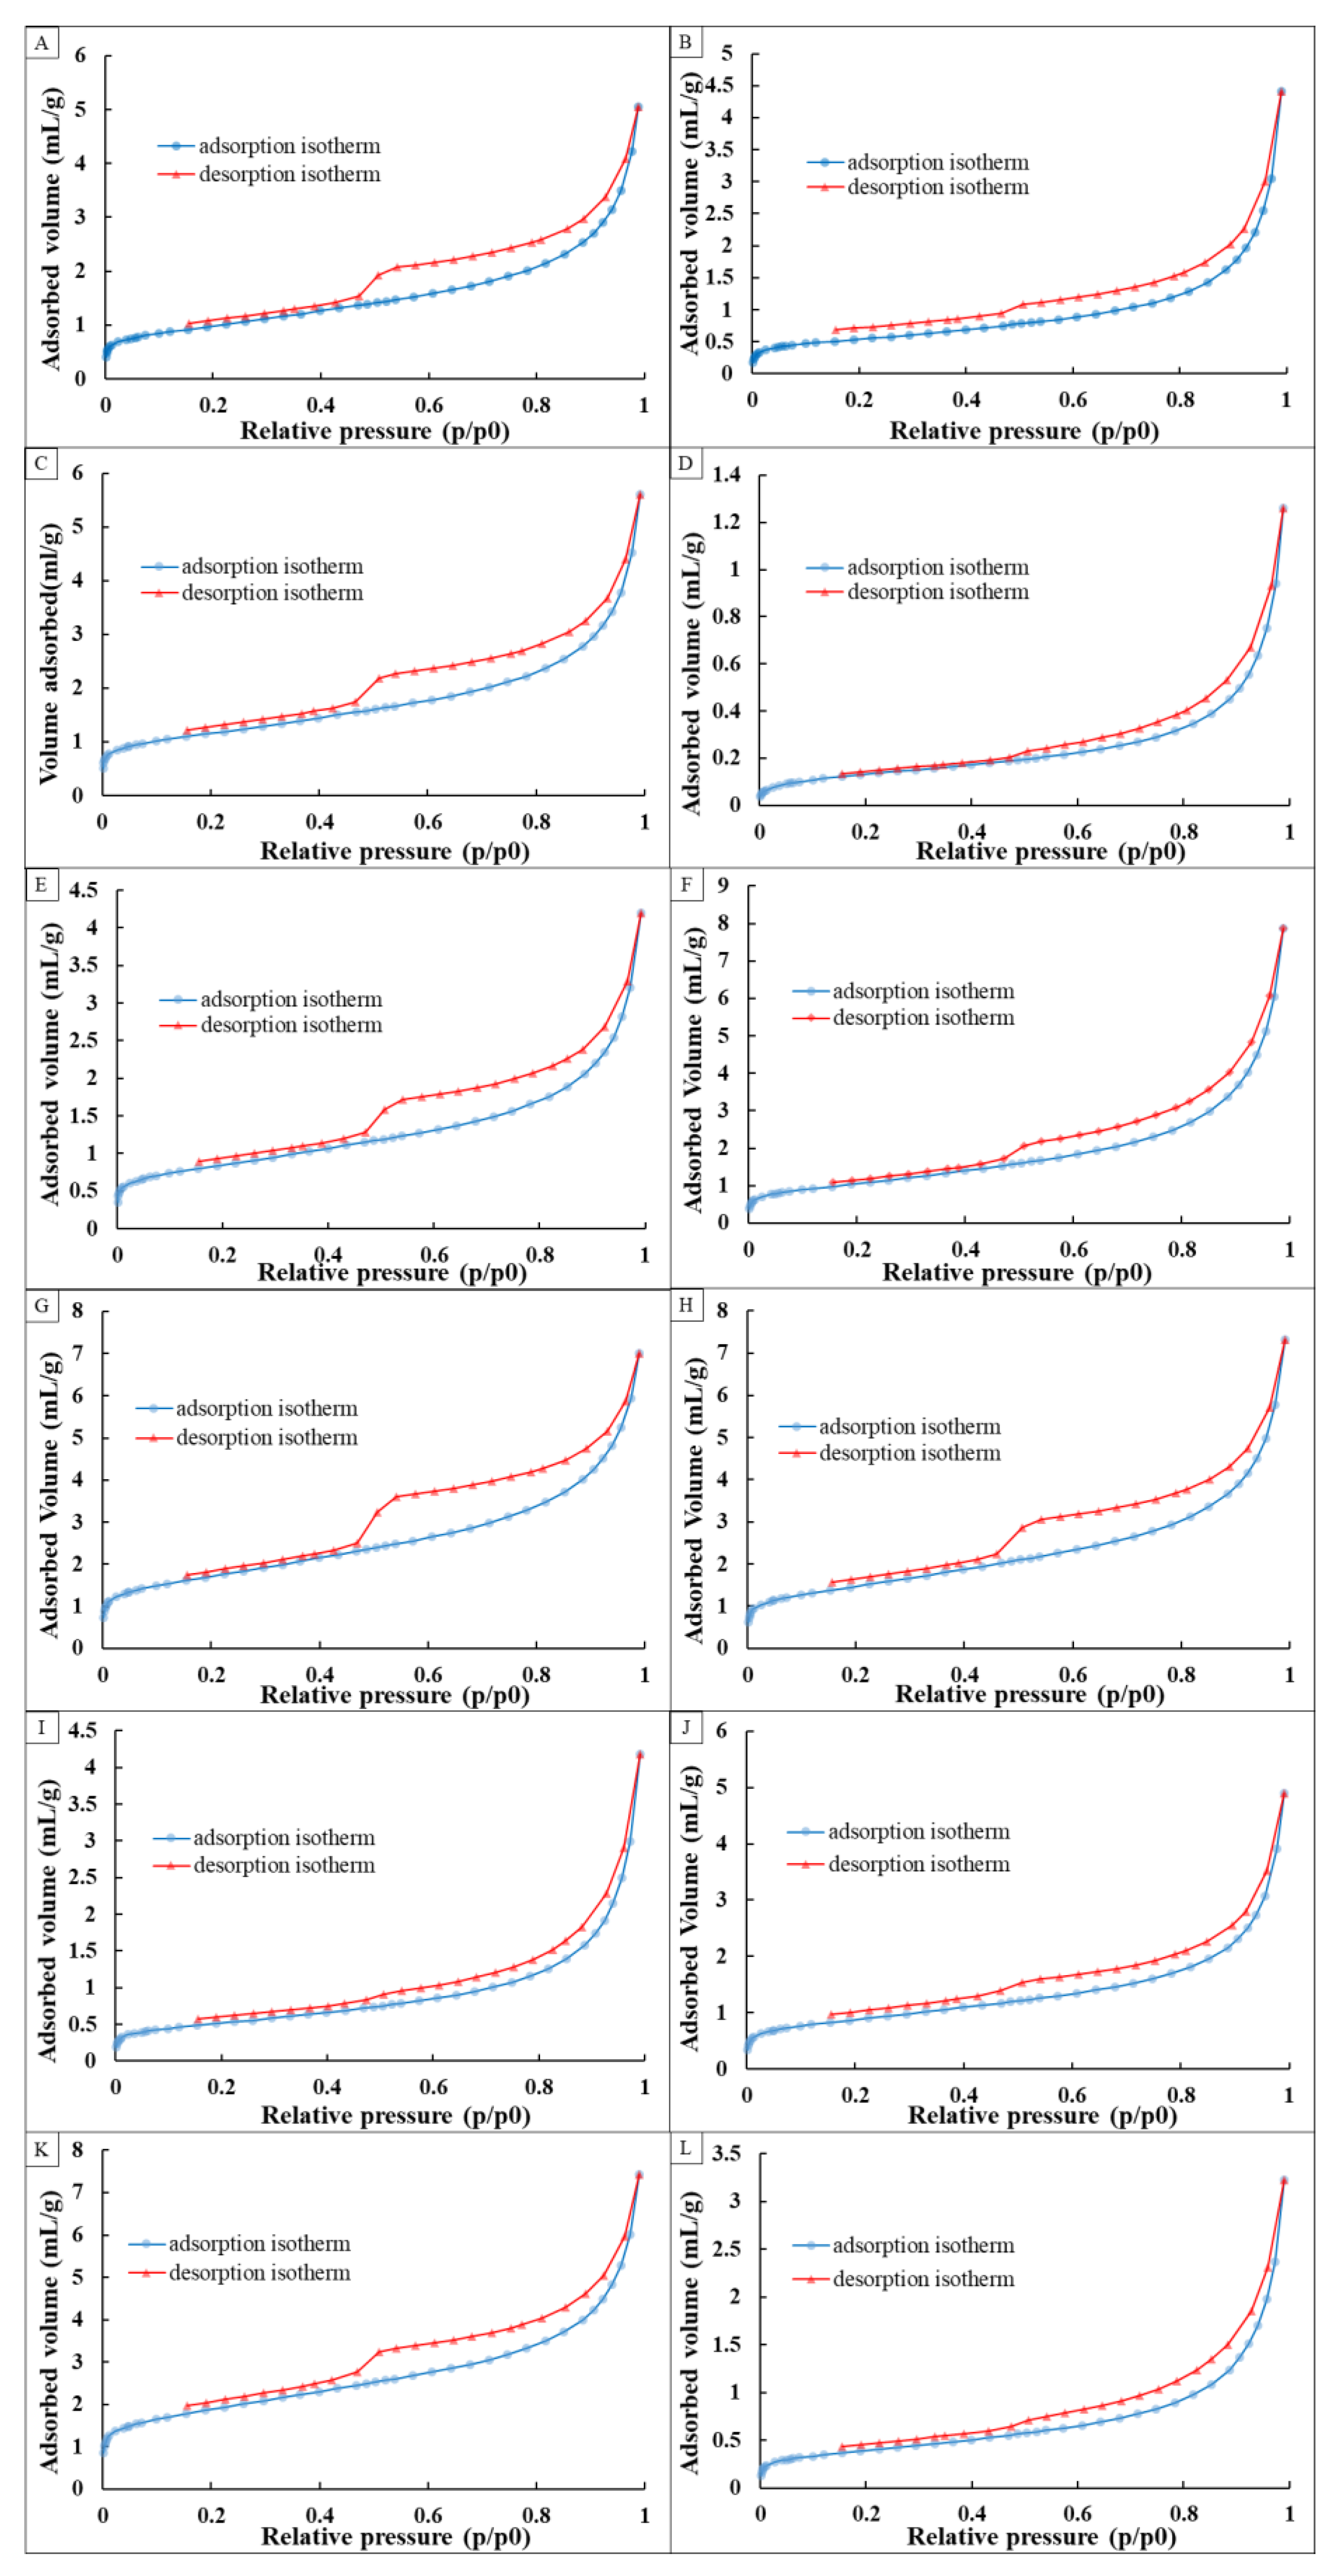
Figure 6.
Diagram of the correlations between the pore volume and surface area in different types of pores, as follows:(A) micropore, (B) mesopore, and (C) macropore.
Figure 6.
Diagram of the correlations between the pore volume and surface area in different types of pores, as follows:(A) micropore, (B) mesopore, and (C) macropore.

Figure 7.
Pore size distribution of the Taiyuan Formation shale: (A) LX1-1, LX1-2, LX1-3; (B) LX2-1, LX3-1, LX4-1; (C) LX5-1, LX5-2, LX6-1; (D) LX7-1, LX7-2, LX7-3 based on the nitrogen adsorption experiments.
Figure 7.
Pore size distribution of the Taiyuan Formation shale: (A) LX1-1, LX1-2, LX1-3; (B) LX2-1, LX3-1, LX4-1; (C) LX5-1, LX5-2, LX6-1; (D) LX7-1, LX7-2, LX7-3 based on the nitrogen adsorption experiments.

Figure 8.
(A) Histogram of total specific surface area under different pore sizes of the shales in the study area. (B) Histogram of total pore volume under different pore sizes of the shales in the study area.
Figure 8.
(A) Histogram of total specific surface area under different pore sizes of the shales in the study area. (B) Histogram of total pore volume under different pore sizes of the shales in the study area.

Figure 9.
(A) Correlations between total surface area and surface area of micropore in the study area. (B) Correlations between total pore volumes and volume of micropore in the study area. (C) Correlations between total surface area and surface area of mesopore in the study area. (D) Correlations between total pore volumes and volume of mesopore in the study area. (E) Correlations between total surface area and surface area of macropore in the study area. (F) Correlations between total pore volumes and volume of macropore in the study area.

Figure 10.
The total surface area and total pore volume of the shales.

Figure 11.
(A) Correlations between TOC and total surface area of the shales in the study area. (B) Correlations between TOC and pore volume of the shales in the study area.
Figure 11.
(A) Correlations between TOC and total surface area of the shales in the study area. (B) Correlations between TOC and pore volume of the shales in the study area.
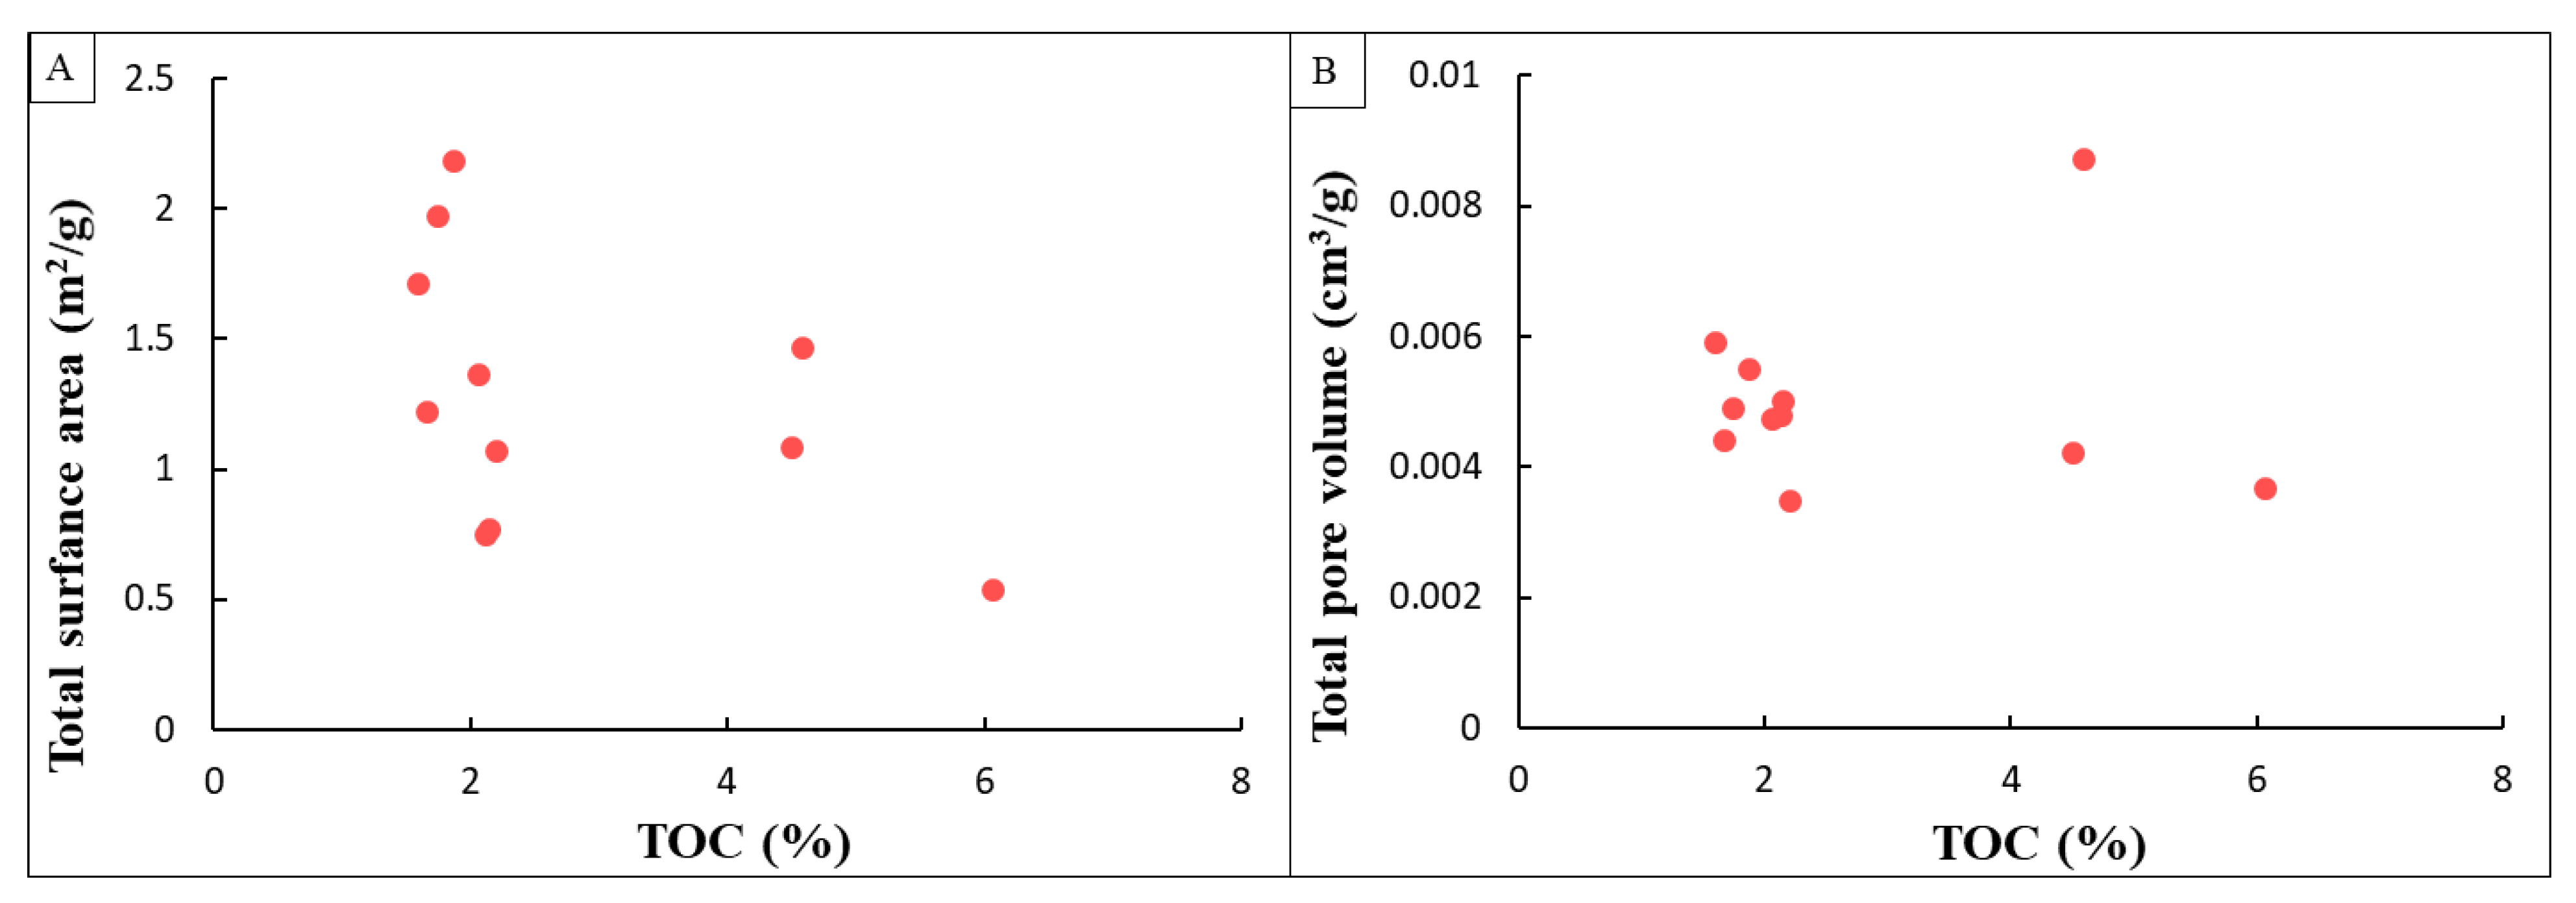
Figure 12.
(A) Correlations between vitrinite reflectance and total surface area of the shales in the study area. (B) Correlations between vitrinite reflectance and total pore volume of the shales in the study area.
Figure 12.
(A) Correlations between vitrinite reflectance and total surface area of the shales in the study area. (B) Correlations between vitrinite reflectance and total pore volume of the shales in the study area.
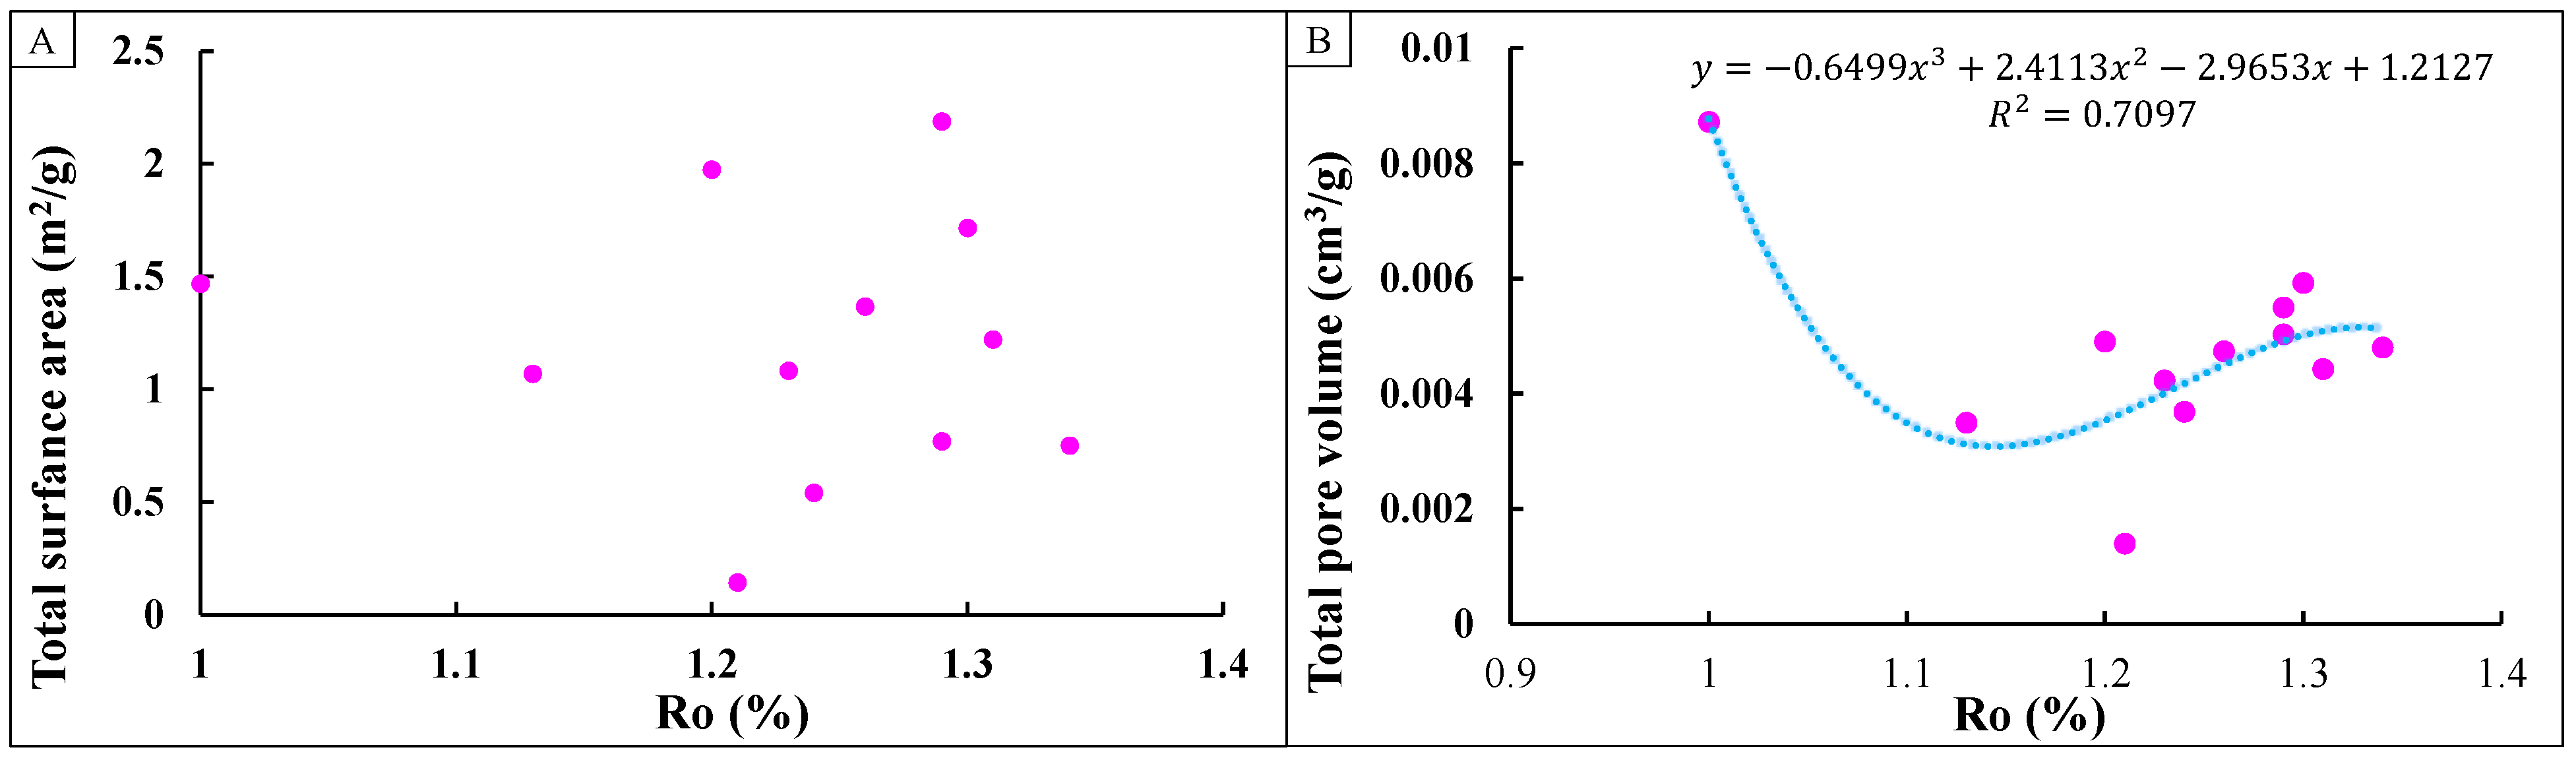
Figure 13.
(A) Correlations between quartz content and total surface area of the shale in the study area. (B) Correlations between quartz content and total pore volume of the shale in the study area. (C) Correlations between clay mineral content and total surface area of the shale in the study area. (D) Correlations between clay mineral content and total pore volume of the shale in the study area.

Table 1.
Organic matter types in shale from the Taiyuan Formation in the study area.
| Sample No. | Depth (m) | TOC (%) | Sapropelinite (%) | Vitrinite (%) | Inertinite (%) | Kerogen Type | Ro (%) |
|---|---|---|---|---|---|---|---|
| LX1-1 | 1991 | 1.66 | 54 | 8 | 38 | II2 | 1.31 |
| LX1-2 | 2037 | 2.14 | 55 | 5 | 40 | II2 | 1.29 |
| LX1-3 | 2067 | 2.06 | 71 | 5 | 25 | II1 | 1.26 |
| LX2-1 | 1736 | 22.58 | 45 | 29 | 26 | III | 1.21 |
| LX3-1 | 1722 | 2.2 | 56 | 9 | 35 | II2 | 1.13 |
| LX4-1 | 1659 | 4.58 | 56 | 12 | 32 | II2 | 1.00 |
| LX5-1 | 1952 | 1.87 | 66 | 5 | 29 | II2 | 1.29 |
| LX5-2 | 1993 | 1.59 | 71 | 6 | 23 | II1 | 1.30 |
| LX6-1 | 1947 | 2.12 | 72 | 7 | 21 | II1 | 1.34 |
| LX7-1 | 1714 | 4.5 | 72 | 4 | 24 | II1 | 1.23 |
| LX7-2 | 1716 | 1.74 | 75 | 5 | 20 | II1 | 1.20 |
| LX7-3 | 1717 | 6.06 | 65 | 8 | 27 | II2 | 1.24 |
Note: TOC stands for Total Organic Carbon.
Table 2.
Mineral compositions of the Taiyuan Formation shale.
| Sample No. | Mineral Content (%) | |||||
|---|---|---|---|---|---|---|
| Quartz | Feldspar | Carbonate Minerals | Pyrite | Clay Minerals | Brittle Minerals | |
| LX1-1 | 55.99 | 0 | 18.46 | 6.12 | 19.43 | 74.45 |
| LX1-2 | 47.30 | 0 | 2.56 | 4.96 | 45.12 | 49.86 |
| LX1-3 | 42.36 | 5.26 | 1.54 | 2.42 | 48.17 | 49.16 |
| LX2-1 | 26.55 | 10.11 | 0 | 0 | 63.34 | 36.66 |
| LX3-1 | 49.72 | 5.16 | 1.61 | 5.54 | 37.32 | 56.49 |
| LX4-1 | 40.92 | 0 | 1.30 | 6.69 | 51.07 | 42.22 |
| LX5-1 | 37.98 | 0 | 0 | 3.04 | 58.98 | 37.98 |
| LX5-2 | 45.50 | 0 | 3.73 | 0 | 50.77 | 49.23 |
| LX6-1 | 20.07 | 8.05 | 4.46 | 2.86 | 64.18 | 32.58 |
| LX7-1 | 49.45 | 0 | 0 | 0 | 50.55 | 49.45 |
| LX7-2 | 34.62 | 0 | 0 | 0 | 65.38 | 34.62 |
| LX7-3 | 21.992 | 0 | 0 | 0 | 78.08 | 21.92 |
Table 3.
Clay mineral compositions of the Taiyuan Formation shale, Lin-Xing area.
| Sample No. | Relative Percentage (%) | Proportion of Illite Smectite Mixed Layer (%) | |||
|---|---|---|---|---|---|
| Illite Smectite Mixed Layer | Illite | Kaolinite | Chlorite | ||
| LX1-1 | 43 | 18 | 28 | 11 | 23 |
| LX1-2 | 31 | 23 | 36 | 10 | 22 |
| LX1-3 | 39 | 18 | 31 | 12 | 15 |
| LX2-1 | 20 | 15 | 49 | 16 | 31 |
| LX3-1 | 34 | 25 | 28 | 13 | 26 |
| LX4-1 | 32 | 19 | 35 | 14 | 26 |
| LX5-1 | 36 | 22 | 29 | 12 | 18 |
| LX5-2 | 46 | 16 | 26 | 12 | 18 |
| LX6-1 | 37 | 13 | 36 | 14 | 12 |
| LX7-1 | 48 | 18 | 21 | 13 | 26 |
| LX7-2 | 24 | 12 | 46 | 18 | 25 |
| LX7-3 | 12 | 9 | 58 | 21 | 25 |
Table 4.
Pore structure parameters of the shale in the study area (surface area).
| Sample No. | Total Surface Area (m2/g) | Proportion of Respective Surface Area (%) | Respective Surface Area (m2/g) | ||||
|---|---|---|---|---|---|---|---|
| Micropore | Mesopore | Macropore | Micropore | Mesopore | Macropore | ||
| LX1-1 | 1.221 | 52.93 | 44.19 | 2.88 | 0.646 | 0.539 | 0.035 |
| LX1-2 | 0.769 | 39.76 | 53.11 | 7.13 | 0.306 | 0.409 | 0.055 |
| LX1-3 | 1.368 | 58.90 | 38.22 | 2.88 | 0.805 | 0.523 | 0.039 |
| LX2-1 | 0.143 | 11.62 | 77.55 | 10.84 | 0.017 | 0.111 | 0.016 |
| LX3-1 | 1.070 | 60.18 | 37.03 | 2.78 | 0.644 | 0.396 | 0.030 |
| LX4-1 | 1.469 | 30.54 | 64.36 | 5.10 | 0.448 | 0.944 | 0.075 |
| LX5-1 | 2.188 | 61.62 | 36.97 | 1.40 | 1.348 | 0.809 | 0.031 |
| LX5-2 | 1.716 | 55.62 | 41.57 | 2.81 | 0.954 | 0.713 | 0.048 |
| LX6-1 | 0.750 | 38.88 | 54.40 | 6.71 | 0.292 | 0.408 | 0.050 |
| LX7-1 | 1.083 | 63.60 | 32.46 | 3.94 | 0.689 | 0.351 | 0.043 |
| LX7-2 | 1.975 | 71.11 | 27.08 | 1.81 | 1.404 | 0.535 | 0.036 |
| LX7-3 | 0.540 | 33.06 | 60.22 | 6.72 | 0.179 | 0.325 | 0.036 |
| Average | 1.191 | 48.15 | 47.26 | 4.59 | 0.644 | 0.505 | 0.041 |
Table 5.
Pore structure parameters of the shale in the study area (pore volume).
| Sample No. | Total Pore Volume (cm3/g) | Proportion of the Respective Pore Volume (%) | Respective Pore Volume (cm3/g) | ||||
|---|---|---|---|---|---|---|---|
| Micropore | Mesopore | Macropore | Micropore | Mesopore | Macropore | ||
| LX1-1 | 0.004430 | 9.85 | 63.35 | 26.80 | 0.000436 | 0.002807 | 0.001187 |
| LX1-2 | 0.005029 | 4.00 | 58.18 | 37.82 | 0.000201 | 0.002926 | 0.001902 |
| LX1-3 | 0.004738 | 13.12 | 58.14 | 28.74 | 0.000622 | 0.002754 | 0.001362 |
| LX2-1 | 0.001398 | 0.93 | 62.09 | 36.98 | 0.000013 | 0.000868 | 0.000517 |
| LX3-1 | 0.003495 | 12.50 | 59.41 | 28.09 | 0.000437 | 0.002077 | 0.000982 |
| LX4-1 | 0.008718 | 3.31 | 68.64 | 28.05 | 0.000286 | 0.005917 | 0.002418 |
| LX5-1 | 0.005499 | 17.13 | 65.12 | 17.75 | 0.000942 | 0.003581 | 0.000976 |
| LX5-2 | 0.005926 | 11.46 | 61.77 | 26.77 | 0.000679 | 0.003661 | 0.001586 |
| LX6-1 | 0.004800 | 3.82 | 60.26 | 35.92 | 0.000183 | 0.002893 | 0.001724 |
| LX7-1 | 0.004228 | 10.06 | 54.13 | 35.81 | 0.000425 | 0.002289 | 0.001514 |
| LX7-2 | 0.004904 | 22.43 | 54.76 | 22.80 | 0.001100 | 0.002686 | 0.001118 |
| LX7-3 | 0.003682 | 3.17 | 62.86 | 33.98 | 0.000117 | 0.002314 | 0.001251 |
| Average | 0.004737 | 9.32 | 60.73 | 29.96 | 0.000453 | 0.002898 | 0.001378 |
Publisher’s Note: MDPI stays neutral with regard to jurisdictional claims in published maps and institutional affiliations. |
© 2021 by the authors. Licensee MDPI, Basel, Switzerland. This article is an open access article distributed under the terms and conditions of the Creative Commons Attribution (CC BY) license (http://creativecommons.org/licenses/by/4.0/).
Share and Cite
MDPI and ACS Style
Ding, C.; He, J.; Wu, H.; Zhang, X. Nanometer Pore Structure Characterization of Taiyuan Formation Shale in the Lin-Xing Area Based on Nitrogen Adsorption Experiments. Minerals 2021, 11, 298. https://doi.org/10.3390/min11030298
AMA Style
Ding C, He J, Wu H, Zhang X. Nanometer Pore Structure Characterization of Taiyuan Formation Shale in the Lin-Xing Area Based on Nitrogen Adsorption Experiments. Minerals. 2021; 11(3):298. https://doi.org/10.3390/min11030298
Chicago/Turabian StyleDing, Chenlong, Jinxian He, Hongchen Wu, and Xiaoli Zhang. 2021. "Nanometer Pore Structure Characterization of Taiyuan Formation Shale in the Lin-Xing Area Based on Nitrogen Adsorption Experiments" Minerals 11, no. 3: 298. https://doi.org/10.3390/min11030298
Note that from the first issue of 2016, this journal uses article numbers instead of page numbers. See further details here.