Article

Shear-Related Gold Ores in the Wadi Hodein Shear Belt, South Eastern Desert of Egypt: Analysis of Remote Sensing, Field and Structural Data

1
Geology Department, Faculty of Science, Tanta University, Tanta 31527, Egypt
2
Geology Department, Faculty of Science, Benha University, Benha 13518, Egypt
3
Institute of Geosciences, University of Kiel, 24118 Kiel, Germany
4
Institute of Oceanography and Environment (INOS), University Malaysia Terengganu (UMT), Kuala Nerus 21030, Terengganu, Malaysia
*
Author to whom correspondence should be addressed.
Minerals 2021, 11(5), 474; https://doi.org/10.3390/min11050474
Submission received: 23 February 2021 / Revised: 25 April 2021 / Accepted: 27 April 2021 / Published: 30 April 2021

Abstract

:
Space-borne multispectral and radar data were used to comprehensively map geological contacts, lithologies and structural elements controlling gold-bearing quartz veins in the Wadi Hodein area in Egypt. In this study, enhancement algorithms, band combinations, band math (BM), Principal Component Analysis (PCA), decorrelation stretch and mineralogical indices were applied to Landsat-8 OLI, ASTER and ALOS PALSAR following a pre-designed flow chart. Together with the field observations, the results of the image processing techniques were exported to the GIS environment and subsequently fused to generate a potentiality map. The Wadi Hodein shear belt is a ductile shear corridor developed in response to non-coaxial convergence and northward escape tectonics that accompanied the final stages of terrane accretion and cratonization (~680–600 Ma) in the northern part of the Arabian–Nubian Shield. The evolution of this shear belt encompassed a protracted ~E–W shortening and recurrent sinistral transpression as manifested by east-dipping thrusts and high-angle reverse shear zones. Gold-mineralized shear zones cut heterogeneously deformed ophiolites and metavolcaniclastic rocks and attenuate in and around granodioritic intrusions. The gold mineralization event was evidently epigenetic in the metamorphic rocks and was likely attributed to rejuvenated tectonism and circulation of hot fluids during transpressional deformation. The superposition of the NW–SE folds by NNW-trending, kilometer scale tight and reclined folds shaped the overall framework of the Wadi Hodein belt. Shallow NNW- or SSE-plunging mineral and stretching lineations on steeply dipping shear planes depict a considerable simple shear component. The results of image processing complying with field observations and structural analysis suggest that the coincidence of shear zones, hydrothermal alteration and crosscutting dikes in the study area could be considered as a model criterion in exploration for new gold targets.

1. Introduction

Remote sensing data are commonly used to identify geological structures associated with extensive shear belts, particularly in vast and rugged terrains. The innovative technologies in the remote sensing promoted the application of space-borne imagery data for detailed structural geology mapping [1,2,3,4,5,6]. The application of multisensor satellite imagery can be considered as a cost-efficient exploration strategy for prospecting orogenic gold mineralization in transpression and transtension zones, which are located in harsh regions around the world [7,8]. In Egypt, structural analysis aided by the interpretations of space-borne data has been efficiently employed to constrain the major structures in the South Eastern Desert [9,10,11,12]. Zoheir and Emam [7], Zoheir et al. [11,12] tested the effectiveness of processing space-borne multispectral and radar imagery data for the geological mapping, particularly to highlight elements controlling the distribution of gold occurrences in the south Eastern Desert of Egypt. Iron oxides, clay and carbonate ± sulfate mineral phases in the hydrothermal alteration zones have specific spectral signatures in the visible, near infrared, and shortwave infrared radiation regions [13]. The hydrous mineral phases with the OH groups (Mg-O-H, Al-O-H, Si-O-H) and CO3 acid group have diagnostic absorption features in the shortwave infrared region (SWIR) (2.0–2.50 μm) [14].
Landsat-8 OLI with high radiometric resolution (16 bits) is an effective remote sensing sensor for detailed lithological mapping [15]. Landsat-8 OLI imagery consists of nine spectral bands, from which seven bands measure the reflected VNIR and SWIR radiation with 30-m spatial resolution for bands 1–7 and 9, while the panchromatic band 8 has 15-m resolution. The ultra-blue band 1 is operative in coastal and aerosol targets, whereas band 9 is valued for cloud detection. The TIR bands collects two thermal bands (10 and 11) that measure the emitted radiation through the 10.6–12.5 µm wavelength region (TIR) with 100-m spatial resolution [16,17]. The Advanced Spaceborne Thermal Emission and Reflection Radiometer (ASTER) data showed high capabilities in discriminating lithological units and alteration zones associated with hydrothermal ore deposits [18,19,20,21,22]. The ASTER data cover a wide spectral range of 14 bands, measuring reflected radiation in three bands between 0.52 and 0.86 µm (visible-near infrared, VNIR) with 15-m resolution, and six bands from 1.6 to 2.43 µm (shortwave Infrared, SWIR) with 30-m resolution. The emitted radiation is measured at 90-m resolution in five bands through the 8.125-µm–11.65-µm wavelength region (thermal infrared; TIR) [23,24]. Synthetic Aperture Radar (SAR) remote sensing technology allows the application of space-borne imagery data for detailed structural geology mapping [1,2,3,4,5,6,11,12]. Phased Array type L-band Synthetic Aperture Radar (PALSAR) is a L-band synthetic aperture radar, which can penetrate sand and vegetation because of the radar’s longer wavelengths (15.0–30.0 cm) [5]. L-band SAR data can provide detailed geological structure information for desert and tropical environments [25]. PALSAR has multimode observation functions such as Fine mode, Direct downlink, ScanSar mode, and Polarimetric mode. Multipolarization configuration (HH, HV, VH, and VV), variable off-nadir angle (9.9–50.8°), and spatial resolution of 10 m for Fine mode, 30 m for Polarimetric mode, 100 m for ScanSar mode are designed. The swath width observation is 30 km for Polarimetric mode, 70 km for Fine mode, and 250–350 km for ScanSar modes [26]. The fusion of these multisensor imagery data can offer a wide-ranging means for tracing along the strike of structural elements and to investigate controls of the orogenic gold occurrences in well exposed and arid regions such as the Wadi Hodein shear belt, South Eastern Desert of Egypt.
The Eastern Desert of Egypt is part of the Arabian–Nubian Shield (ANS) [27]. The latter is made up mainly of three distinctive tectonostratigraphic units: (1) infracrustal gneisses, locally exposed as discrete core complexes [28,29,30,31]; (2) supracrustal dismembered ophiolites and island arc volcanic/ volcanosedimentary assemblages; and (3) intramountainous molasse sediments (Hammamat Group) and Cordilleran calc-alkaline volcanics (Dokhan Volcanics) [32]. Widespread granitoid intrusions of different ages cut both the infracrustal and supracrustal rocks. The South Eastern Desert experienced a history of superimposing compressional and transpressional deformation, manifested by extensive NW–SE trending high-angle thrusts, folds and transcurrent faults [12,28,30,31]. The Wadi Hodein shear belt is a major NW-oriented transcurrent shear zone in the southern Eastern Desert (Figure 1). It is suspected to have accommodated up to 300 km of sinistral displacement during the late stages of transpression [29,30,31,32,33,34]. Opinions differ about the tectonic character of this shear zone, where some authors consider it as the youngest major Najd-related shear in the Egyptian Eastern Desert [29,30,31,33] or even a transpressional corridor [34,35].
Gold bearing quartz veins and their alteration zones occur in different geologic and structural settings in the southern Eastern Desert [10] (Figure 1). These different settings include: (1) Au–quartz veins hosted by ductile shear zones at contacts between ophiolitic and island arc terranes (e.g., Um El-Tuyor El-Foqani, Betam, Seiga, Shashoba, Um Garayat, and Haimur deposits); (2) Au–quartz veins occurring along steeply dipping anastomosing shear zones wrapped around or cutting syn- or late-orogenic granitoid intrusions (e.g., Korbiai, Madari, Romite, Egat deposits); (3) Au–quartz-carbonate veins in association with brittle–ductile shear zones separating listvenized serpentinite from the underlying successions of intercalated metavolcanic and volcaniclastic metasediments (e.g., Hutit, El-Beida, and El-Anbat deposits). In the present study, structural analysis supported by remote sensing studies was aimed at revealing what controls the distribution of the scattered gold–quartz vein occurrences in the Wadi Hodein area. Multisensor satellite data were used to resolve the spatial relationship between gold mineralization and district-scale structures. The relative timing of the successive structural events was also envisaged to place the gold mineralization in the broader evolutionary framework of the South Eastern Desert.

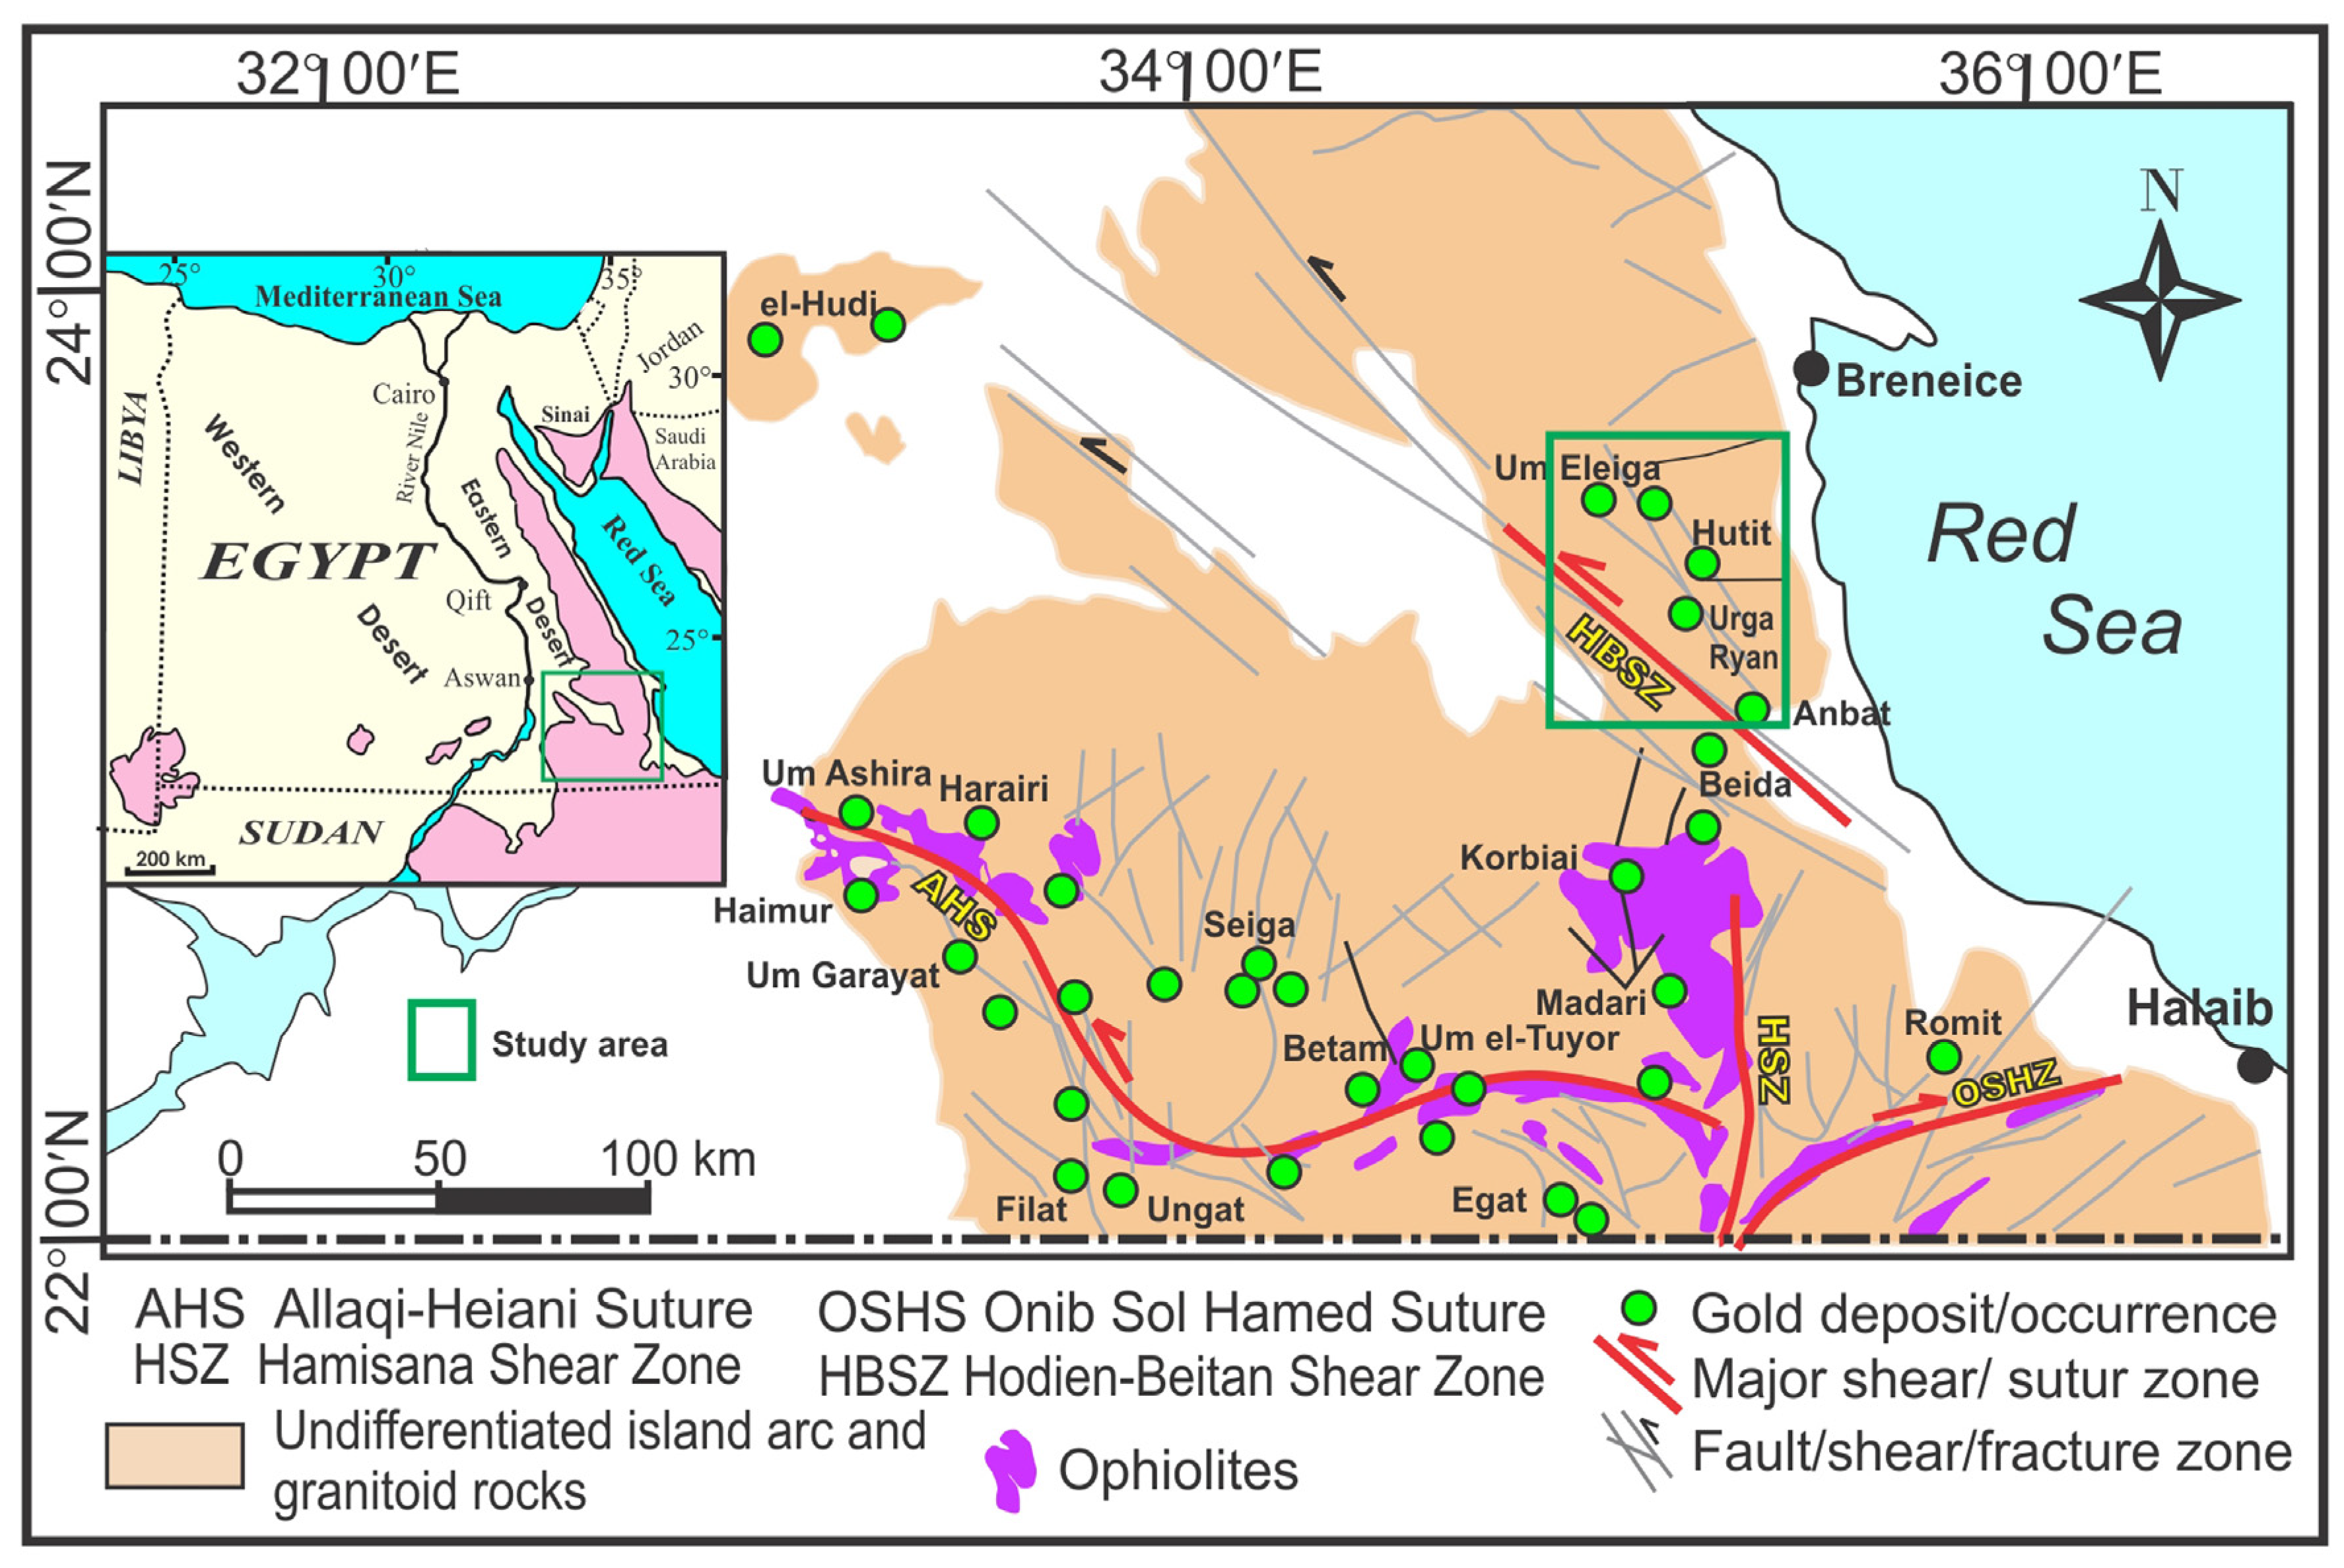
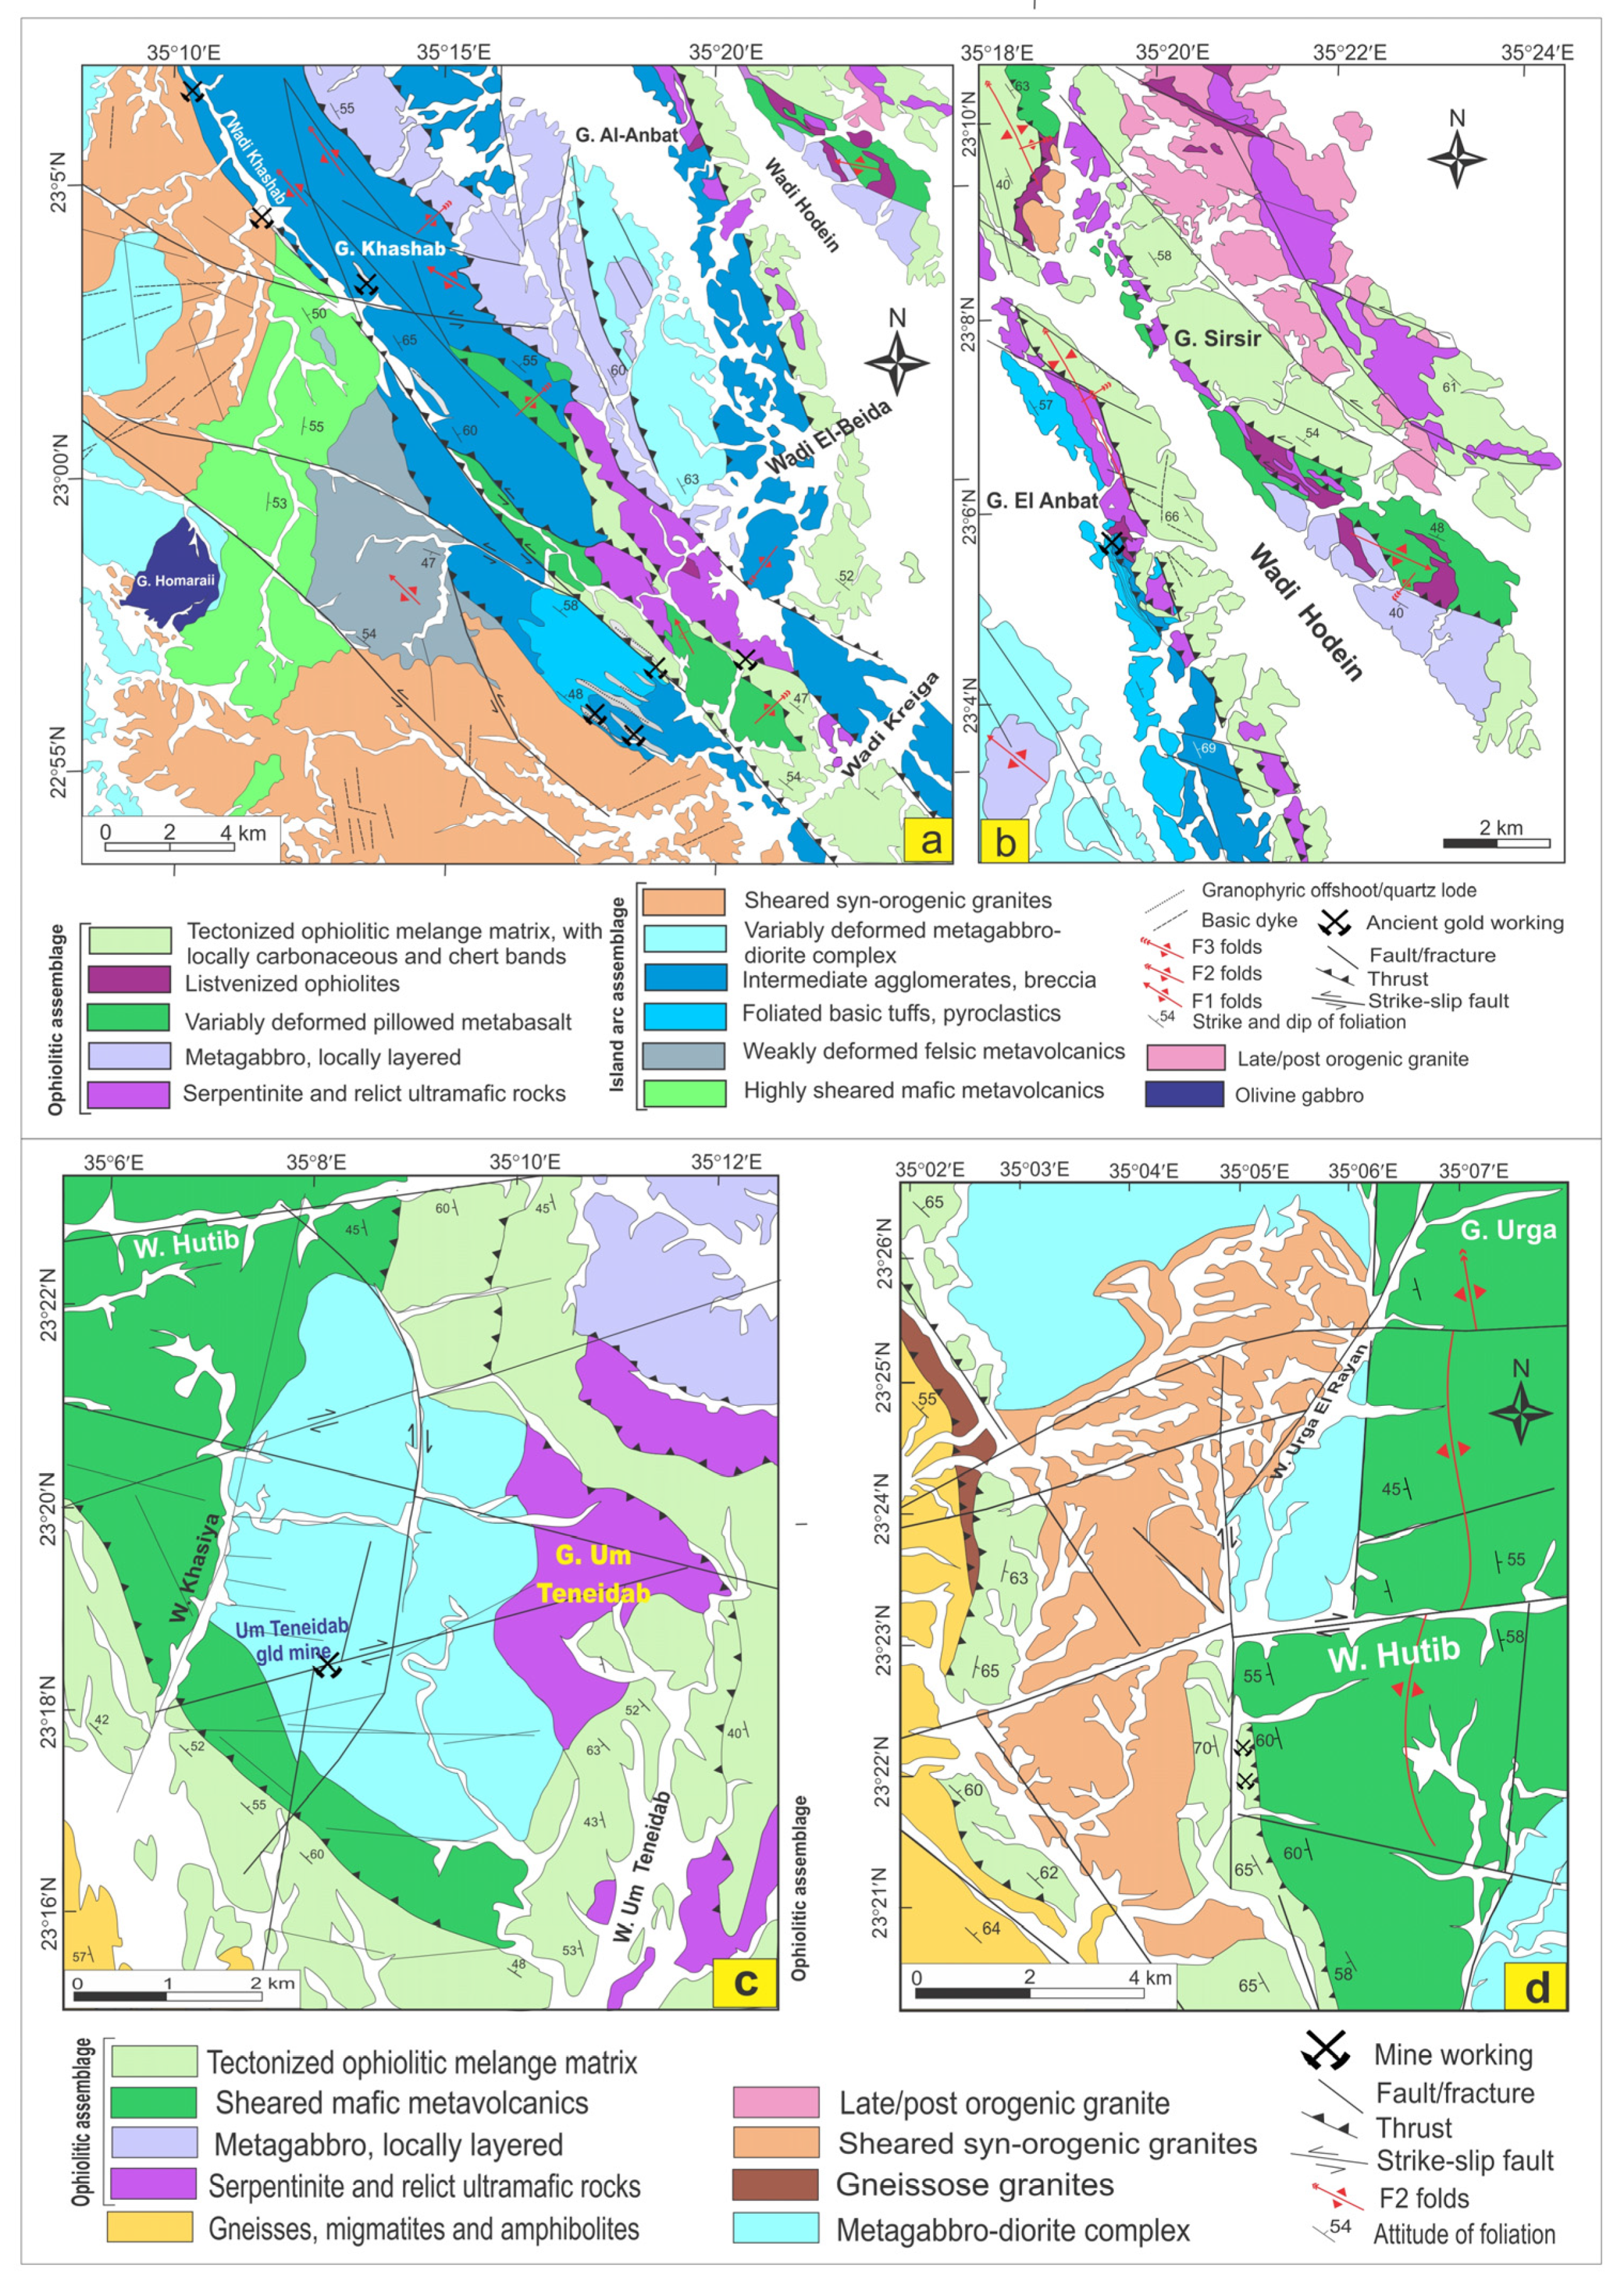
2. Geological Setting

The Neoproterozoic rocks exposed in Hodein shear belt comprises variably deformed ophiolitic mélange rocks, island-arc metavolcanic and metavolcaniclastic successions (Figure 2). These rocks are unconformably overlain by Cretaceous sandstone formations (Nubian Sandstone) and locally by Miocene marine turbidites and carbonate. Dioritic and granitic gneisses and migmatites are exposed around Wadi Beitan and Wadi Khuda, in the western part of the study area. Wadi Khuda gneisses occur as an ENE–WSW trending belt forming a major doubly plunging anticline (Figure S1a,b), amphibolite and migmatites [35]. It is intruded by syn-tectonic tonalite and diorite as well as late-to post-tectonic syenogranites and leucogranites. The gneissic rocks of Wadi Beitan form a major NW-trending belt in the northwestern part of the Wadi Hodein shear system [27] (Figure 2). This belt comprises fine-to coarse-grained biotite gneisses, biotite-hornblende gneisses and hornblende gneisses together with subordinate varieties of garnet–biotite–hornblende gneisses, augen gneiss, amphibolites (Figure S1c,d), migmatites and mylonites [11,27]. The contact between the Wadi Beitan gneisses belt and the volcaniclastic rocks is defined by a SW-verging thrust fault associated with discrete zones of mylonitized granites (Figure S1d).
The Wadi Khashab–Gabal Sirsir ophiolites form two discontinuous NNW–SSE oriented belts of mainly serpentinite, metabasalt, ophiolitic and metagabbro rocks [12,36,38,39]. Serpentinite and associated talc carbonate occur as masses elongated in a NW–SE direction (e.g., Gabal Sirsir and Wadi El-Beida) and tectonically emplaced within the foliated metavolcanics and volcaniclastic metasediments. Serpentinites and foliated metabasalts in the Gabal Sirsir–El-Anbat belt occur as elongate lenses along NW to NNW–SSE shear zones [37,38,39,40]. The mafic metavolcanics form NW-elongated belts bound by highly sheared rocks and mylonites. The metavolcanics rocks are intruded by metagabbro–diorite, granodiorite and granitoid intrusions. They are strongly foliated and exhibit well developed pencil cleavage and boudinage patterns. They comprise metaandesite/basaltic andesite and tuffaceous intercalations. The metasedimentary rocks include metagreywacke, bedded metamudstone, metaconglomerate and schists with minor calcareous beds. The Gabal Abu Dahr ophiolitic mélange in the central and eastern parts of the study area occur as elongate, fault-bounded blocks, tectonically admixtured with island arc metavolcanic and metavolcaniclastic rocks along Wadi Rahaba and around Gabal Abu Dahr. The ophiolitic and island arc rocks are cut by a metagabbro/diorite complex and granitic intrusions [41,42,43]. The Wadi Rahaba serpentinite occurs as NW-elongate masses and small isolated irregular lenses in the volcaniclastic metasediments (Figure S1e). The metagabbro–diorite intrusions of the Wadi Rahaba occur as isolated, irregular masses, cutting ophiolites, metavolcanic and metavolcaniclastic rocks. Contacts of the serpentinized ultramafic rocks with metagabbro–diorite complex are sharp and irregular. The serpentinized ultramafic rocks are dominated by a harzburgite, dunite veins, chromitite pods and talc-carbonate rocks [42]. The serpentinized ultramafic rocks contain large masses of dunite and concordant sills of wehrlite, pyroxenite and gabbro [43]. Ophiolitic metagabbro occurs as moderate relief masses of pyroxene metagabbro, hornblende metagabbro, and meta-anorthosite (Figure S1f).
The ophiolitic mafic metavolcanics to northeast of Gabal Abu Dahr are massive or pillowed (Figure S2a) metabasalt and metabasaltic andesite. Pillowed metabasalt bodies are exposed as ellipsoidal, globular and tabular shaped bodies, ranging between 10 cm and 1 m in diameter (Figure S2a,b). The mafic metavolcanics along Wadi Hutib and Wadi Urga El Rayan form a NNW-elongated belt and show variable degrees of shearing. The Wadi Arais ophiolites include masses of serpentinite, serpentinized peridotites (Figure S2c), metagabbro, dunite, pyroxenite, chlorite schist, metavolcanics rocks and listwaenite along the thrust and shear zones [43,44]. The serpentinized peridotite occurs as steep mountains along NW–SE striking thrust faults (Figure S2c). Irregular serpentinite masses are incorporated in the volcaniclastic metasediments. The ophiolitic metagabbro rocks form hills of moderate relief, which have tectonic contacts against the serpentinite and metavolcanic blocks. The Gabal Arais mass is composed chiefly of actinolite hornblende metagabbro and hornblende metagabbro and less commonly of appinitic metagabbro [45]. The arc metavolcanic rocks along Wadi Um Araka form an E–W elongate belt comprised mainly meta-andesite, metadacite, dacitic tuff and andesitic tuff with minor amounts of metabasalt [45]. The foliated varieties of the Um Araka metavolcanics are mainly schistose metatuffs. The ophiolitic mélange of Wadi Arais comprises volcaniclastic metasediments and exotic clasts of metagabbro and amphibolite.
The metagabbro–diorite–tonalite–granodiorite complex forms a large elongated belt in the Wadi Khuda area. These rocks intrude Wadi Khuda gneisses (Figure S2d) and the eastern parts of Wadi Rahaba–Gabal Abu Dahr ophiolitic mélange and intruded by late to post-tectonic biotite and muscovite granites (Figure S2e). Their contacts with Wadi Khuda gneisses are characterized by the strongly foliated diorite and amphibolite [46,47]. The gabbro–diorite complex forms variable degrees of deformation, from massive to strongly sheared or foliated. The metagabbro–diorite rocks of the Um Eleiga exhibit circular zonation where gabbro forms the core and the granodiorite occupies the margin [41].
The tonalite of Wadi Urga El Rayan form N–S trending, strongly weathered and weakly foliated plutons in the central part of the study area. Granodiorite forms a N–S trending pluton along the Wadi Hutib and E–W oriented small intrusions along the Wadi Beitan (Figure S2f). The granitoid intrusions that cut the ophiolitic mélange of the Wadi Khashab–Wadi Um Karaba range in composition from tonalite to granodiorite. The granitic rocks of Gabal El Maarafay and Gabal Al Farayid include monzogranite, granodiorite, and tonalite and are locally foliated [48]. At Wadi Khuda, leucogranite forms small stocklike and dikelike bodies intruding on the core of the Khuda gneisses and the granite pluton [46]. The ophiolitic rocks of Wadi Arais are cut by monzogranite and syenogranite of the Gabal El-Nukeiba and Gabal Handusa. A small circular intrusion of younger gabbro in the southwestern part of the study area (G. Homraii) cuts metavolcanic rocks and the older granitoid terranes. The gold-bearing quartz veins in the study area cut sheared metavolcanics, volcaniclastic metasediments and gabbro–diorite complex. The mineralized quartz veins are controlled consistently by NW- and NNW-trending shear zones, and are associated with extensive pervasive hydrothermal alteration. Gold occurrences in the study area include El-Beida, Khashab, El-Anbat, Um Teneidab, Urga Ryan, Hutit and Um Eleiga.

3. Remote Sensing Data Characteristics and Analysis

Iron oxides, clay and carbonate ± sulfate in the hydrothermal alteration zones have specific spectral signatures in the visible near infrared (VNIR), and shortwave infrared (SWIR) spectral regions, respectively [13,14]. False color composite (FCC) and band combination images are used in geological applications based on known spectral signatures of mineral phases in specific wavelength regions. Mapping the hydrothermal alteration zones is a prime focus of mineral exploration programs using the remote-sensing data [1,2,3,4,5,6,7,8,11,12]. Most of the hydrothermal alteration mineral species have distinctive features in the shortwave infrared (SWIR) region, making the Landsat-8 OLI and ASTER sensors suitable data sources for mineral mapping, particularly in arid regions. Moreover, considerable numbers of image processing techniques, such as band-rationing (BR), principal component analysis (PCA), and the spectral mineralogical indices, have been proven effective in lithological and hydrothermal alteration mapping if verified by the fieldwork [1,7,8,11,12]. The present study integrates Landsat-8 OLI/TIRS, ASTER and ALOS PALSAR data for comprehensive mapping of the lithological units and geological structures. Additionally, we aimed to detect the mineralized zones in the Wadi Hodein area. The characteristics of the used remote sensing data are presented in Table 1 and Table 2.

3.1. Data and Processing Techniques

Two cloud-free ASTER scenes′ AST_L1T00312252006082430 and 00312252006082422′ were acquired on 24 August 2006. The Landsat-8 OLIL/TIRS scene ‘LC08_L1TP1730442019073001_T1′ was acquired on 30 July 2019 with path/raw 173/44. Four ALOS PALSAR scenes, ALPSRP075090450, ALPSRP075090460, ALPSRP077570450 and ALPSRP077570460, of L-Band level 1.5 images. For detailed information on the preprocessing techniques of the remote sensing data, adopted software and methodology see the supplementary data file (Section S1 in supplementary material). The remote sensing data have been processed for lithological mapping, highlighting structural elements and delineating the alteration zones. Image processing techniques, i.e., enhancement algorithms, band combinations (FCC), band math (BM), Principal Component Analysis (PCA), decorrelation stretch and mineralogical indices were applied for outlining geological mapping and the hydrothermal alteration zones in the study area. Finally, multicriteria approach was applied to produce the potentiality gold mineralization map of the study area. Figure S3 shows the flow chart of the methodology adopted for the present study.

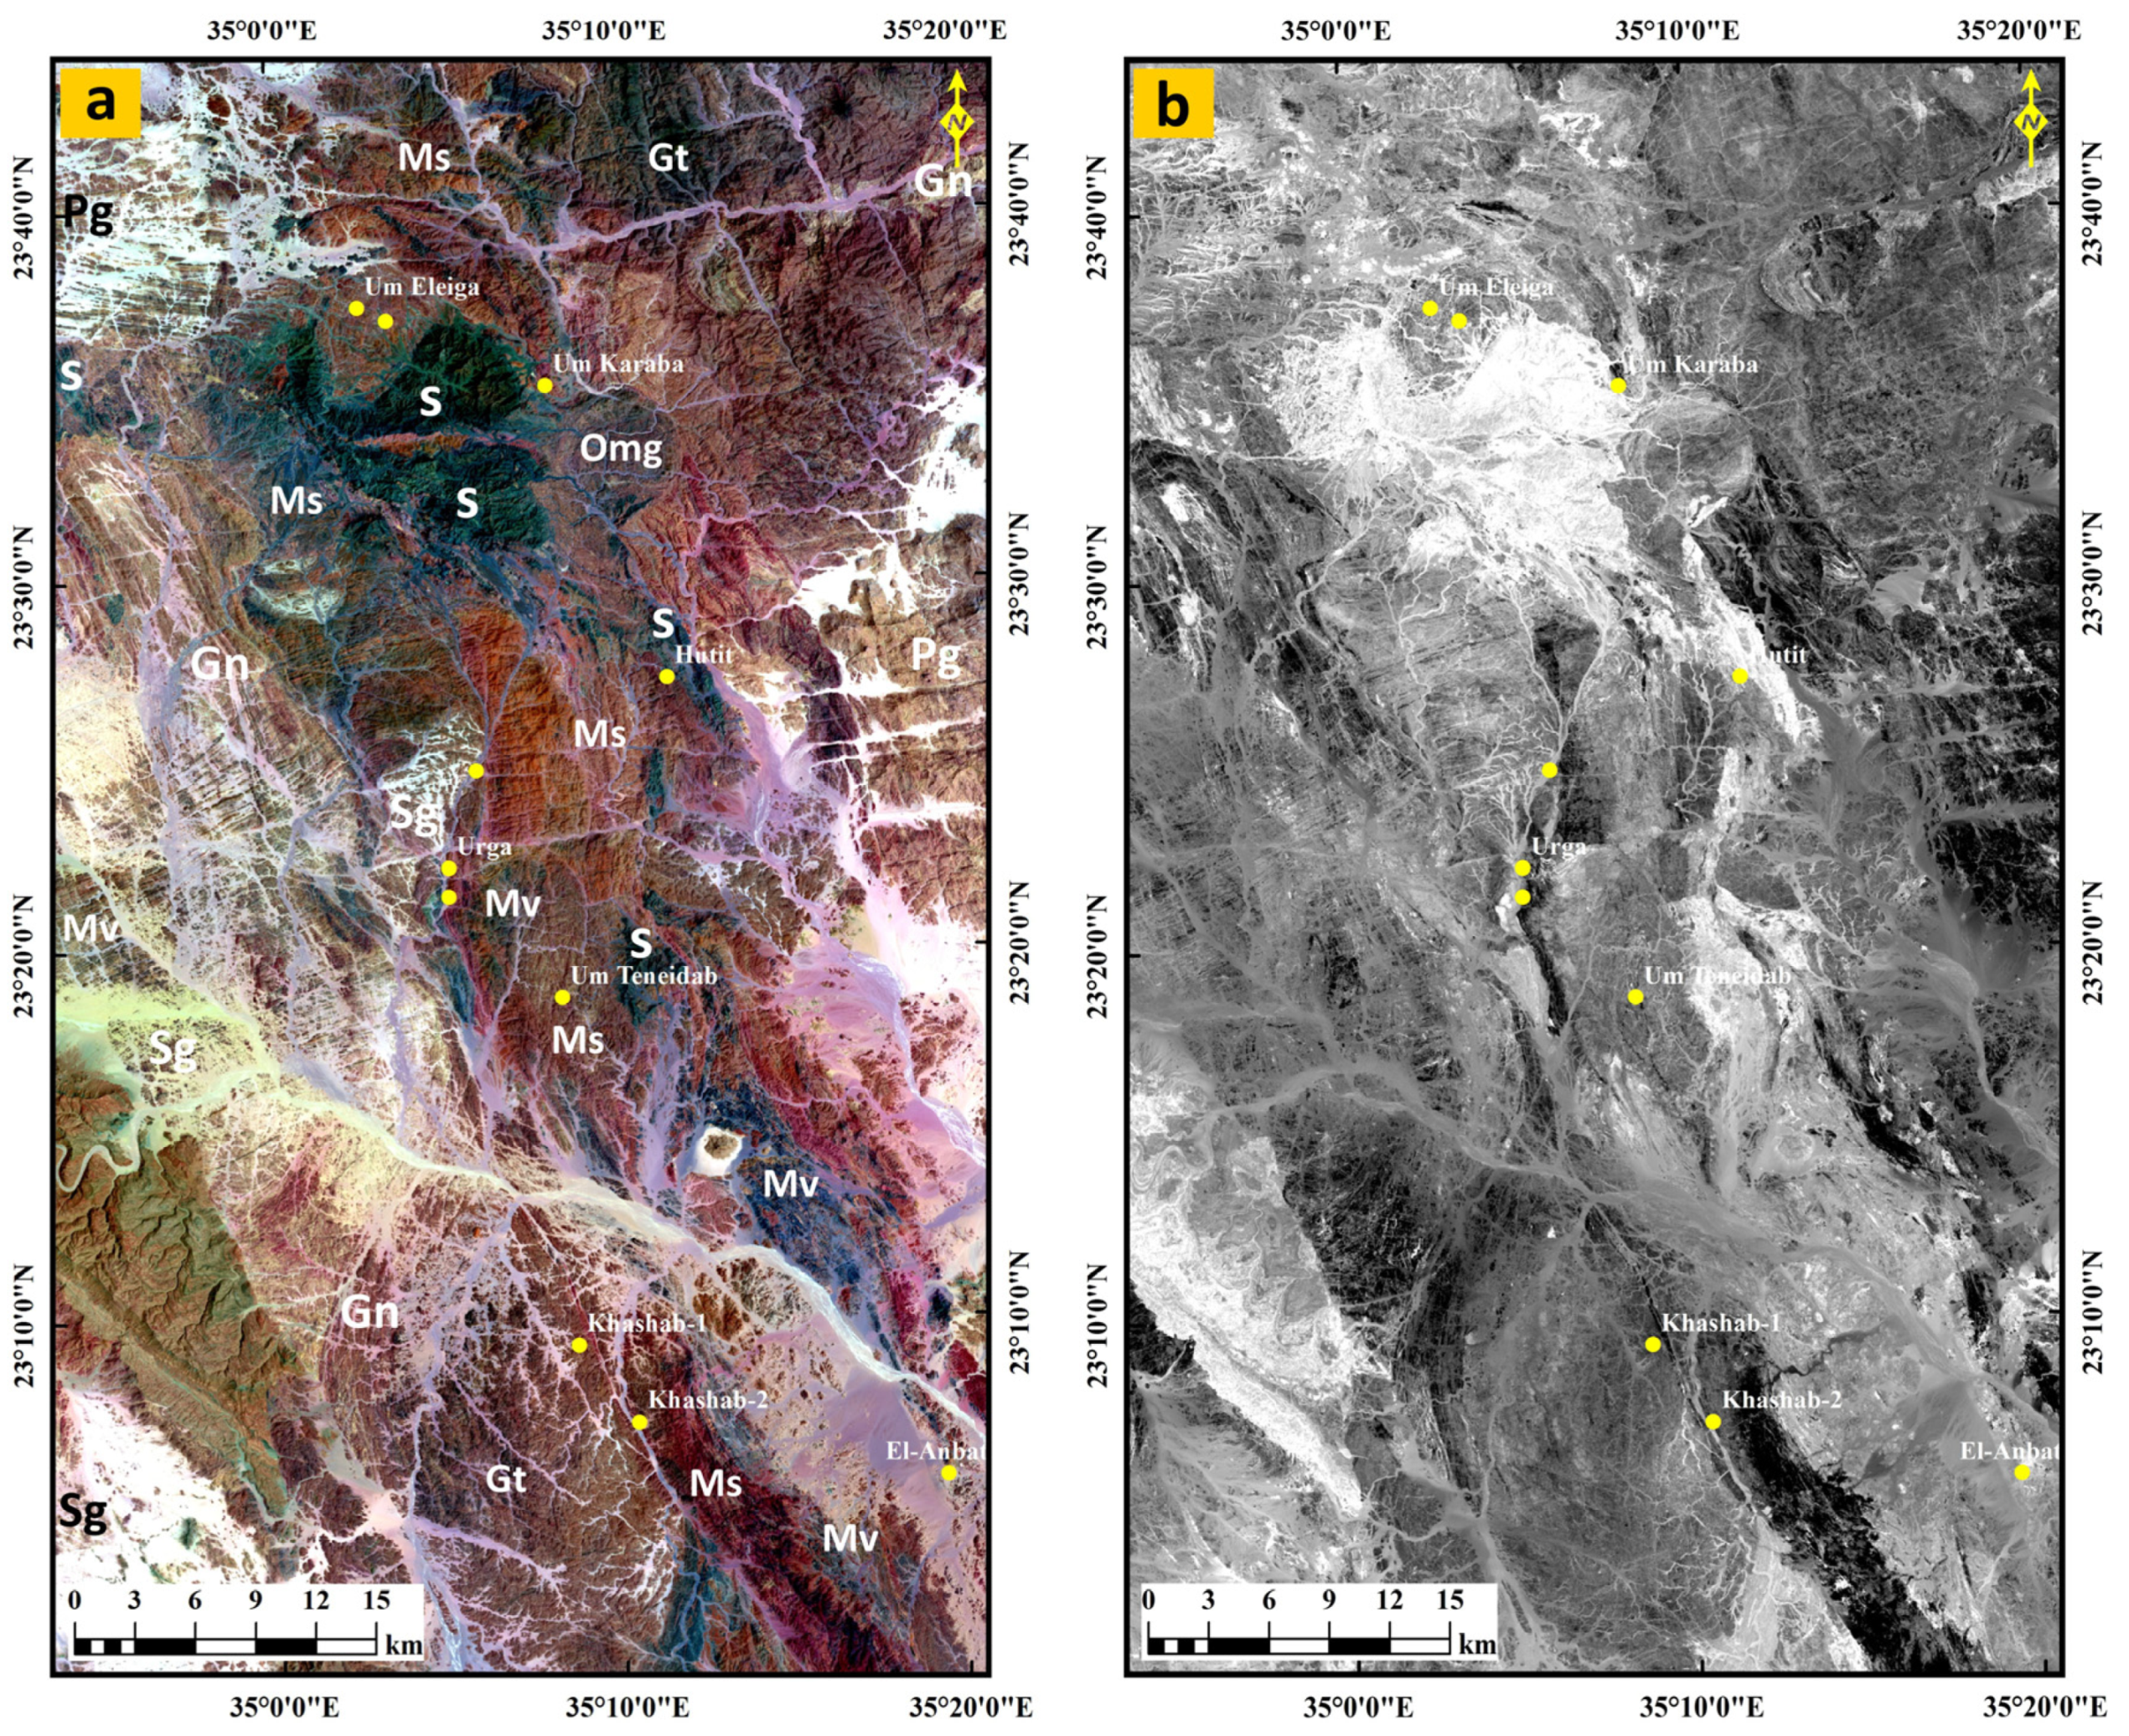
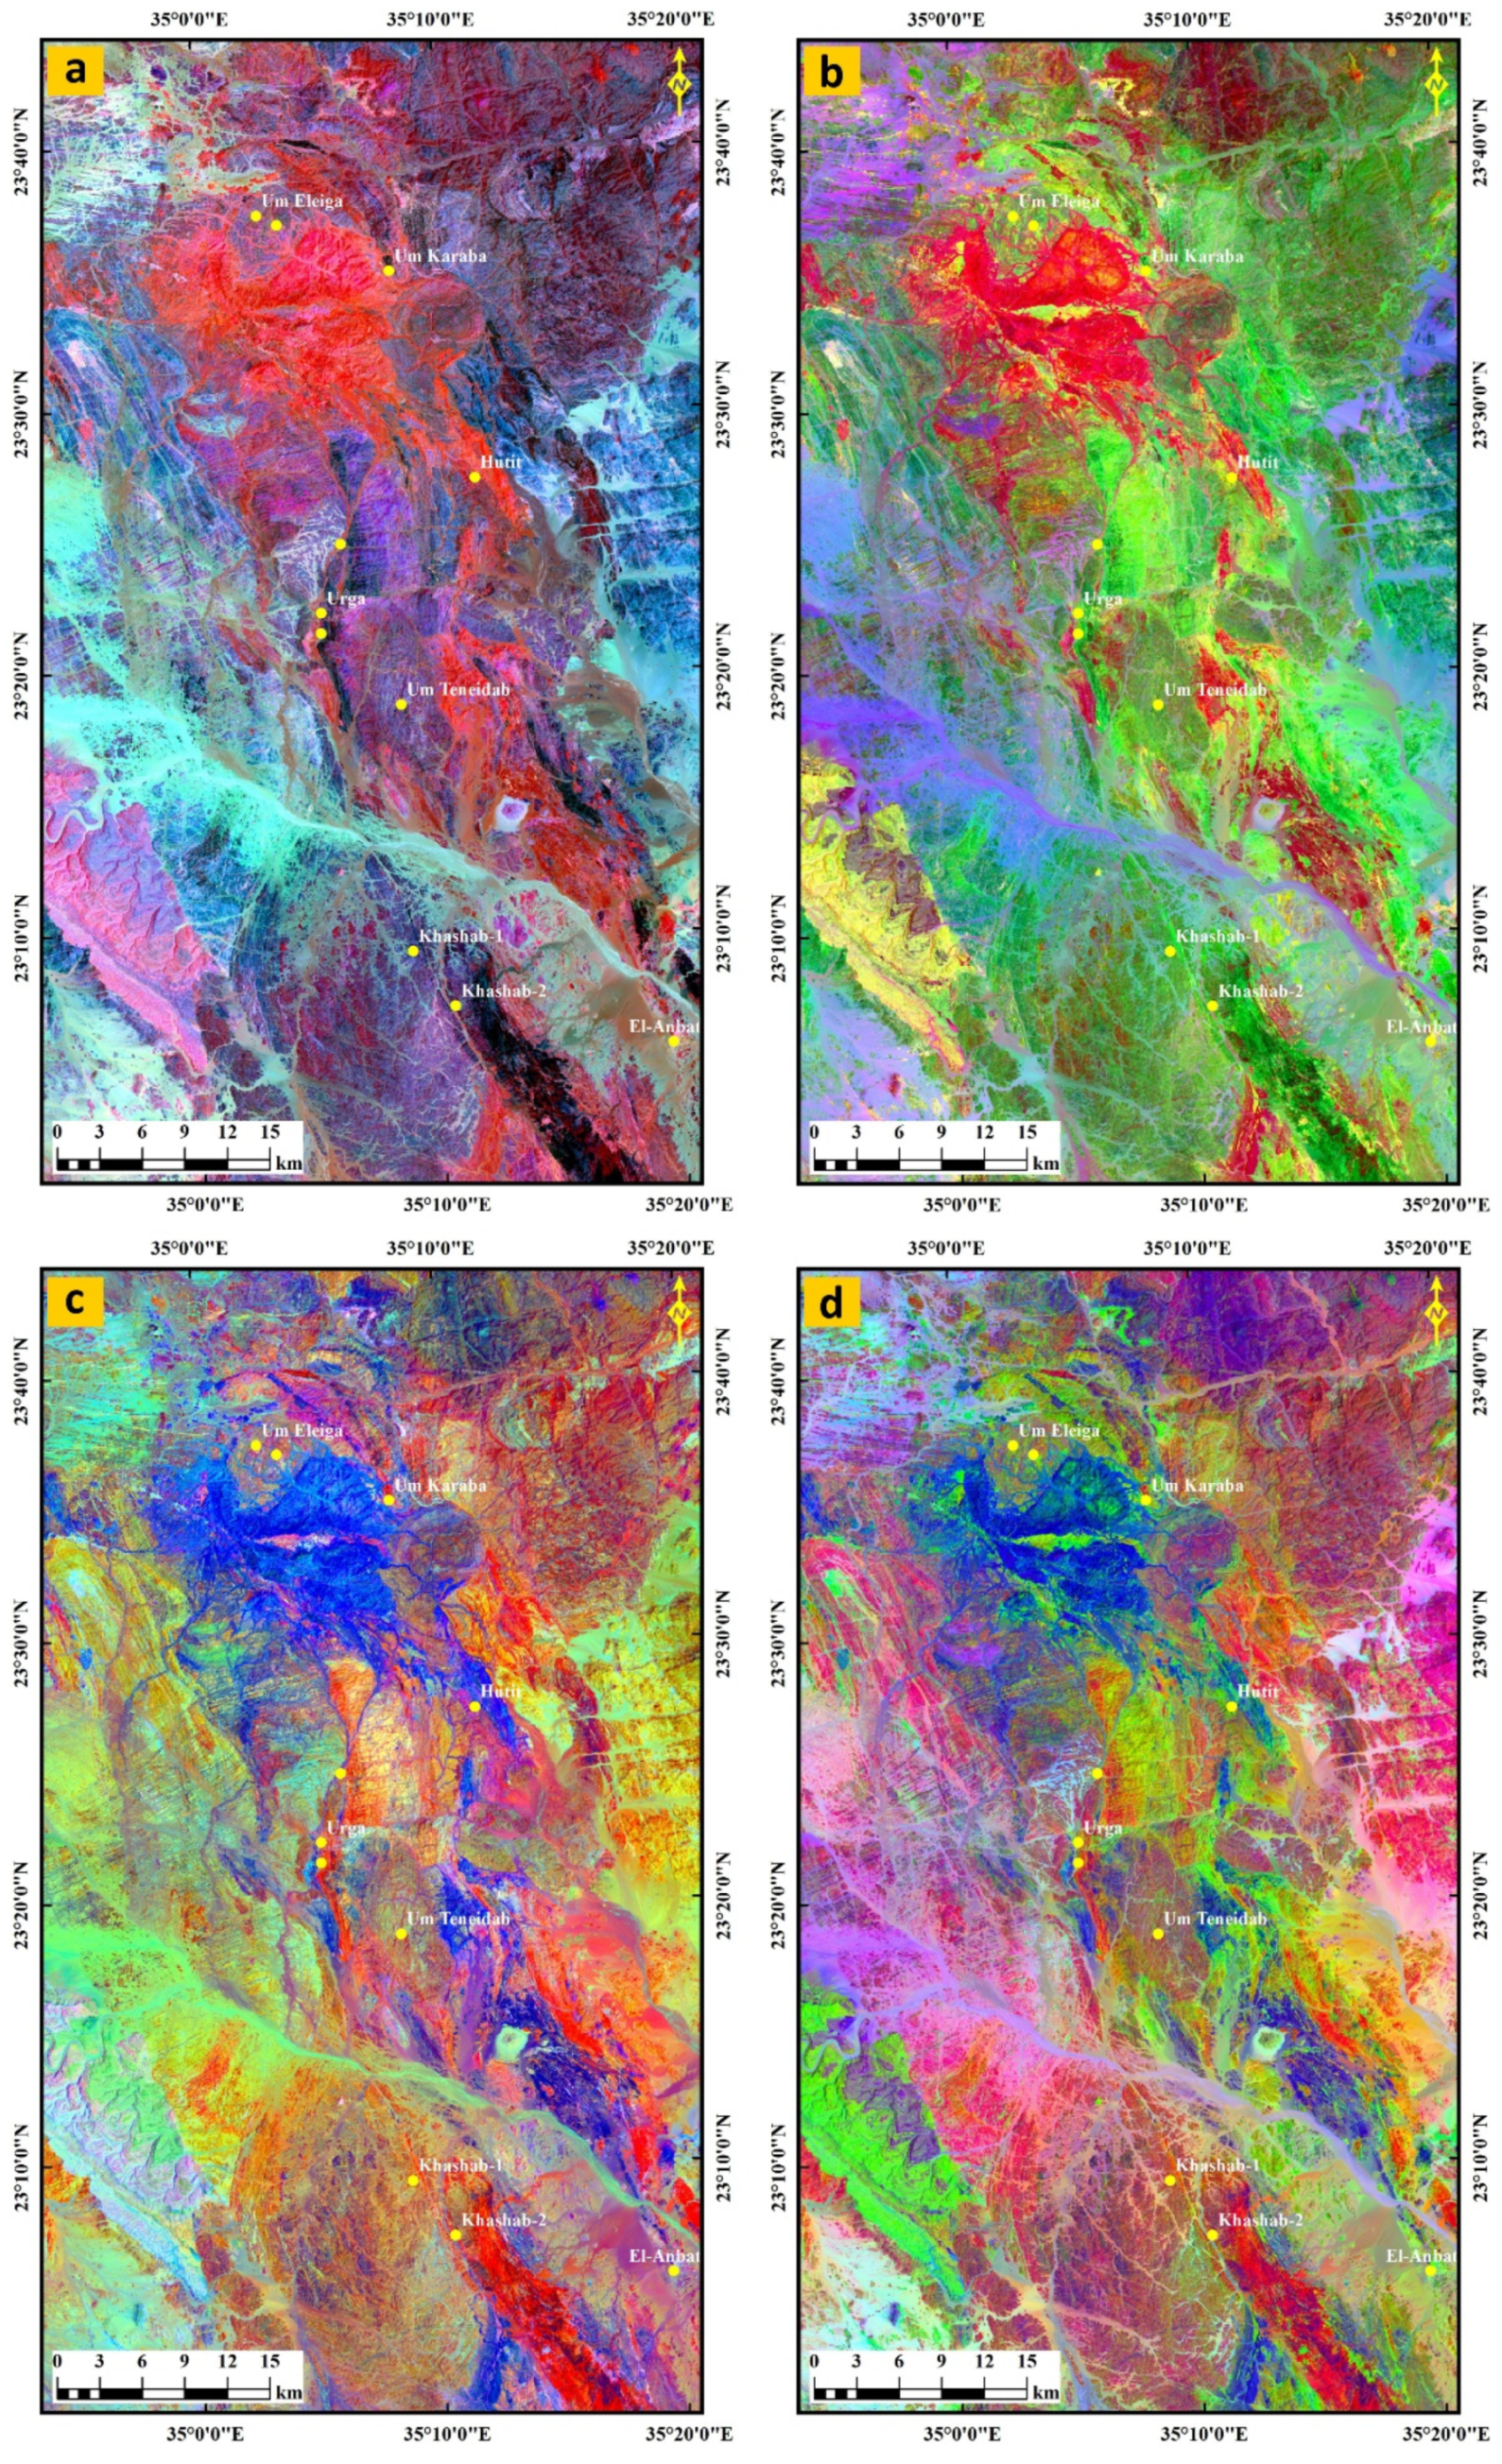
3.2. Landsat-8 OLI and ASTER-Based Lithological Mapping

The Landsat-8 OLI data have higher radiometric resolutions (16 bits) and lower spectral resolution compared with ASTER data. Several Landsat-8 OLI and ASTER band combinations images are employed for mapping lithological units and structural elements in the study area. The Landsat-8 band combination images (RGB-753; Figure 3a) and ASTER (RGB-431; Figure S4a) discriminate well between different lithologic units and highlight the structural elements. The ophiolitic rocks appear as dark green pixels, metavolcanics and metasediments are represented by dark to medium brown pixels while the highly weathered granitoids and gneisses exhibit light brown signature. The E–W, NW-, NE-trending faults/fractures that cut these rock outcrops are conspicuous. The band math technique, which is used for reducing the effects of topography and enhancing the spectral differences between bands, divides the digital number value of one band by the digital number value of another band [49]. Band math is a useful for highlighting hydrothermal alteration minerals, as it minimizes the illumination differences caused by the topographic features. Landsat-8 band math image (6/7) was generated to map CO3 and OH-bearing minerals. This image ratio highlights clay minerals, serpentine, and many alteration zones as bright pixels, where the metavolcanic–metasedimentary rocks are manifested by gray pixels (Figure 3b). On the other hand, the grey-scale image of ASTER band math (7 + 9/8) presented as carbonate/chlorite index. It highlights the highly sheared and carbonatized rocks (serpentinite and talc-carbonate) and metavolcanics with bright image signature (Figure S4b). Ophiolitic gabbros and metasedimentary rocks appear as medium grey pixels, while the gneisses and granitoid rocks have black spectral signatures. Hassan and Sadek [15] used this ratio to differentiate between talc-carbonate and ophiolitic basic metavolcanic rocks in the Gerf area south of the present study area.
Segal [50] used band ratio images for the enhancement of spectral contrasts among the bands considered in the ratio operation, and they have successfully been used in the mapping of alteration zones. Therefore, Landsat-8 FCC of the Abrams ratio (RGB-6/7, 4/3, 5/4), Chica-Olma ratio (RGB-6/7, 6/5, 4/2) and Kaufmann ratio (RGB-7/5, 5/4, 6/7) (Figure 4a–c, respectively) were generated to characterize iron-oxide, hydroxyl minerals, clay minerals and containing rocks. The Abrams ratio (RGB-6/7, 4/3, 5/4) image successfully delineated mafic mineral-rich rocks, including the ophiolitic serpentinite, and highly tectonized ophiolites, which are clearly demarcated as bright red color, and the highly tectonized mafic metavolcanic rocks appear as purple and dark blue pixels (Figure 4a). The Chica-Olma ratio (RGB-6/7, 6/5, 4/2; Figure 4b) image clearly delineates the serpentinite rocks and their sharp contacts with the surrounding rocks of metavolcanic–metasedimentary association and granitoids, where theses contacts are considered the favorable sites for gold mineralization. Serpentinite appear as bloody red pixels, metasedimentary rocks as dark green, whereas the metavolcanics and quartz–carbonate (listvenite) have a bright green signature. The altered materials and clay minerals appeared as olive green pixels. The ophiolite assemblage is highlighted successfully as bright blue and quartz-carbonate (listvenite) as violet pixels in the Kaufmann ratio (RGB-7/5, 5/4, 6/7; Figure 4c) image. The metasedimentary rocks are characterized by dark cyan color, whereas the metavolcanics appeared by reddish brown pixels. These distinctive spectral signatures helped in heightening the foliation trajectories of the highly deformed and tectonized rocks.
The NW-thrusted contacts and E–W strike slip faults can be detected from the three image ratios (Figure 4a–c). Moreover, decorrelation stretching is an important image enhancement method that is used to improve visual interpretation of satellite images [51]. For bands having the maximum variance, decorrelation stretching was applied to 7-6-5 of Landsat-8 bands (Figure 4d). The dark blue pixels of serpentinite can be differentiated from the greenish brown pixels of ophiolitc metagabbros. The metasedimentary rocks and metavolcanics attained greenish red and bright green colors, respectively. Kaolinite- and illite-bearing rocks show bright red signature, whereas the gneissic and granitoid rocks appear as light violet pixels (Figure 4d).
Principal Component Analysis (PCA), as one of the spectral enhancement techniques, has been used for lithological discrimination [15]. Principal component analysis (PCA) is a multivariate statistical technique that selects uncorrelated linear combinations (eigenvector loadings) of variables in such a way that each successively tracted linear combination, or principal component (PC), has a smaller variance [52]. The PCA transformation was carried out for the VNIR and SWIR bands of Landsat-8 and ASTER to extract lithological and alteration zones information, which related to gold mineralization. The eigenvector matrices of the Landsat-8 and ASTER data derived from the PCA are given in Tables S1 and S2, respectively). The three first PCA images (PC1, PC2 and PC3), containing the highest topographical and spectral information, are found suitable for lithological discrimination. The PCA images can bear crucial information related to the alteration minerals, which could be reflected in the eigenvector loading of the absorption and reflection bands [12]. Gupta et al. [53] suggested that when the eigenvector loading is strong (as positive or negative sign) in the reflection and absorption bands of the target mineral or mineral group, the enhanced pixels related to the mineral or mineral group will manifest as bright pixels when this loading is positive in the reflection band; conversely, the pixels will manifest as dark when the loading is negative in the reflection band.
According to the analysis of the eigenvector loadings of the seven bands of Landsat-8 PCA (Table S1), we produced the color composite images (RGB-PC2, PC1, PC4 and RGB-PC2, PC4, PC5; Figure S5a,b, respectively). Bands 2, 4, 5, 6, 7 of Landsat-8 contain valuable information for iron oxides and hydroxyl-bearing minerals’ mapping [54]. The rocks consisting of high contents of Al and/or Mg-OH-bearing minerals (ophiolites) were best delineated by bright lemon-yellow pixel signatures in Figure S5a and yellowish orange pixels in Figure 5a. The two images emphasize the contact between felsic and basic metavolcanics and volcaniclastic metasediments and gneisses along Wadi Hodein and Wadi Beitan. The areas with rich altered materials show cyan color tones. Based on the eigenvector loadings of the nine bands of ASTER PCA (Table S2), the color composite images (RGB- PC1, PC2, PC3 and RGB-PC6, PC3, PC1; Figure S5a,b, respectively) were prepared. Figure S5b shows bright magenta pixels for iron oxide/hydroxide minerals, which are mostly associated with ophiolitic serpentinite and metagabbros. The metasedimentary rocks are manifested by light magenta pixels, metavolcanics as bright green, and gneisses and granitoids as cyan pixels. Figure 5b shows the metavolcanic/metavolcaniclastic rocks appearing as reddish color pixels. The light cyan color domains within the ophiolitic mélange terranes whilst metasediments represent grass green and gneisses and granitoids are presented by yellow green pixels. The four images enhance the visualization of the E–W strike slip faults and foliation trajectories.

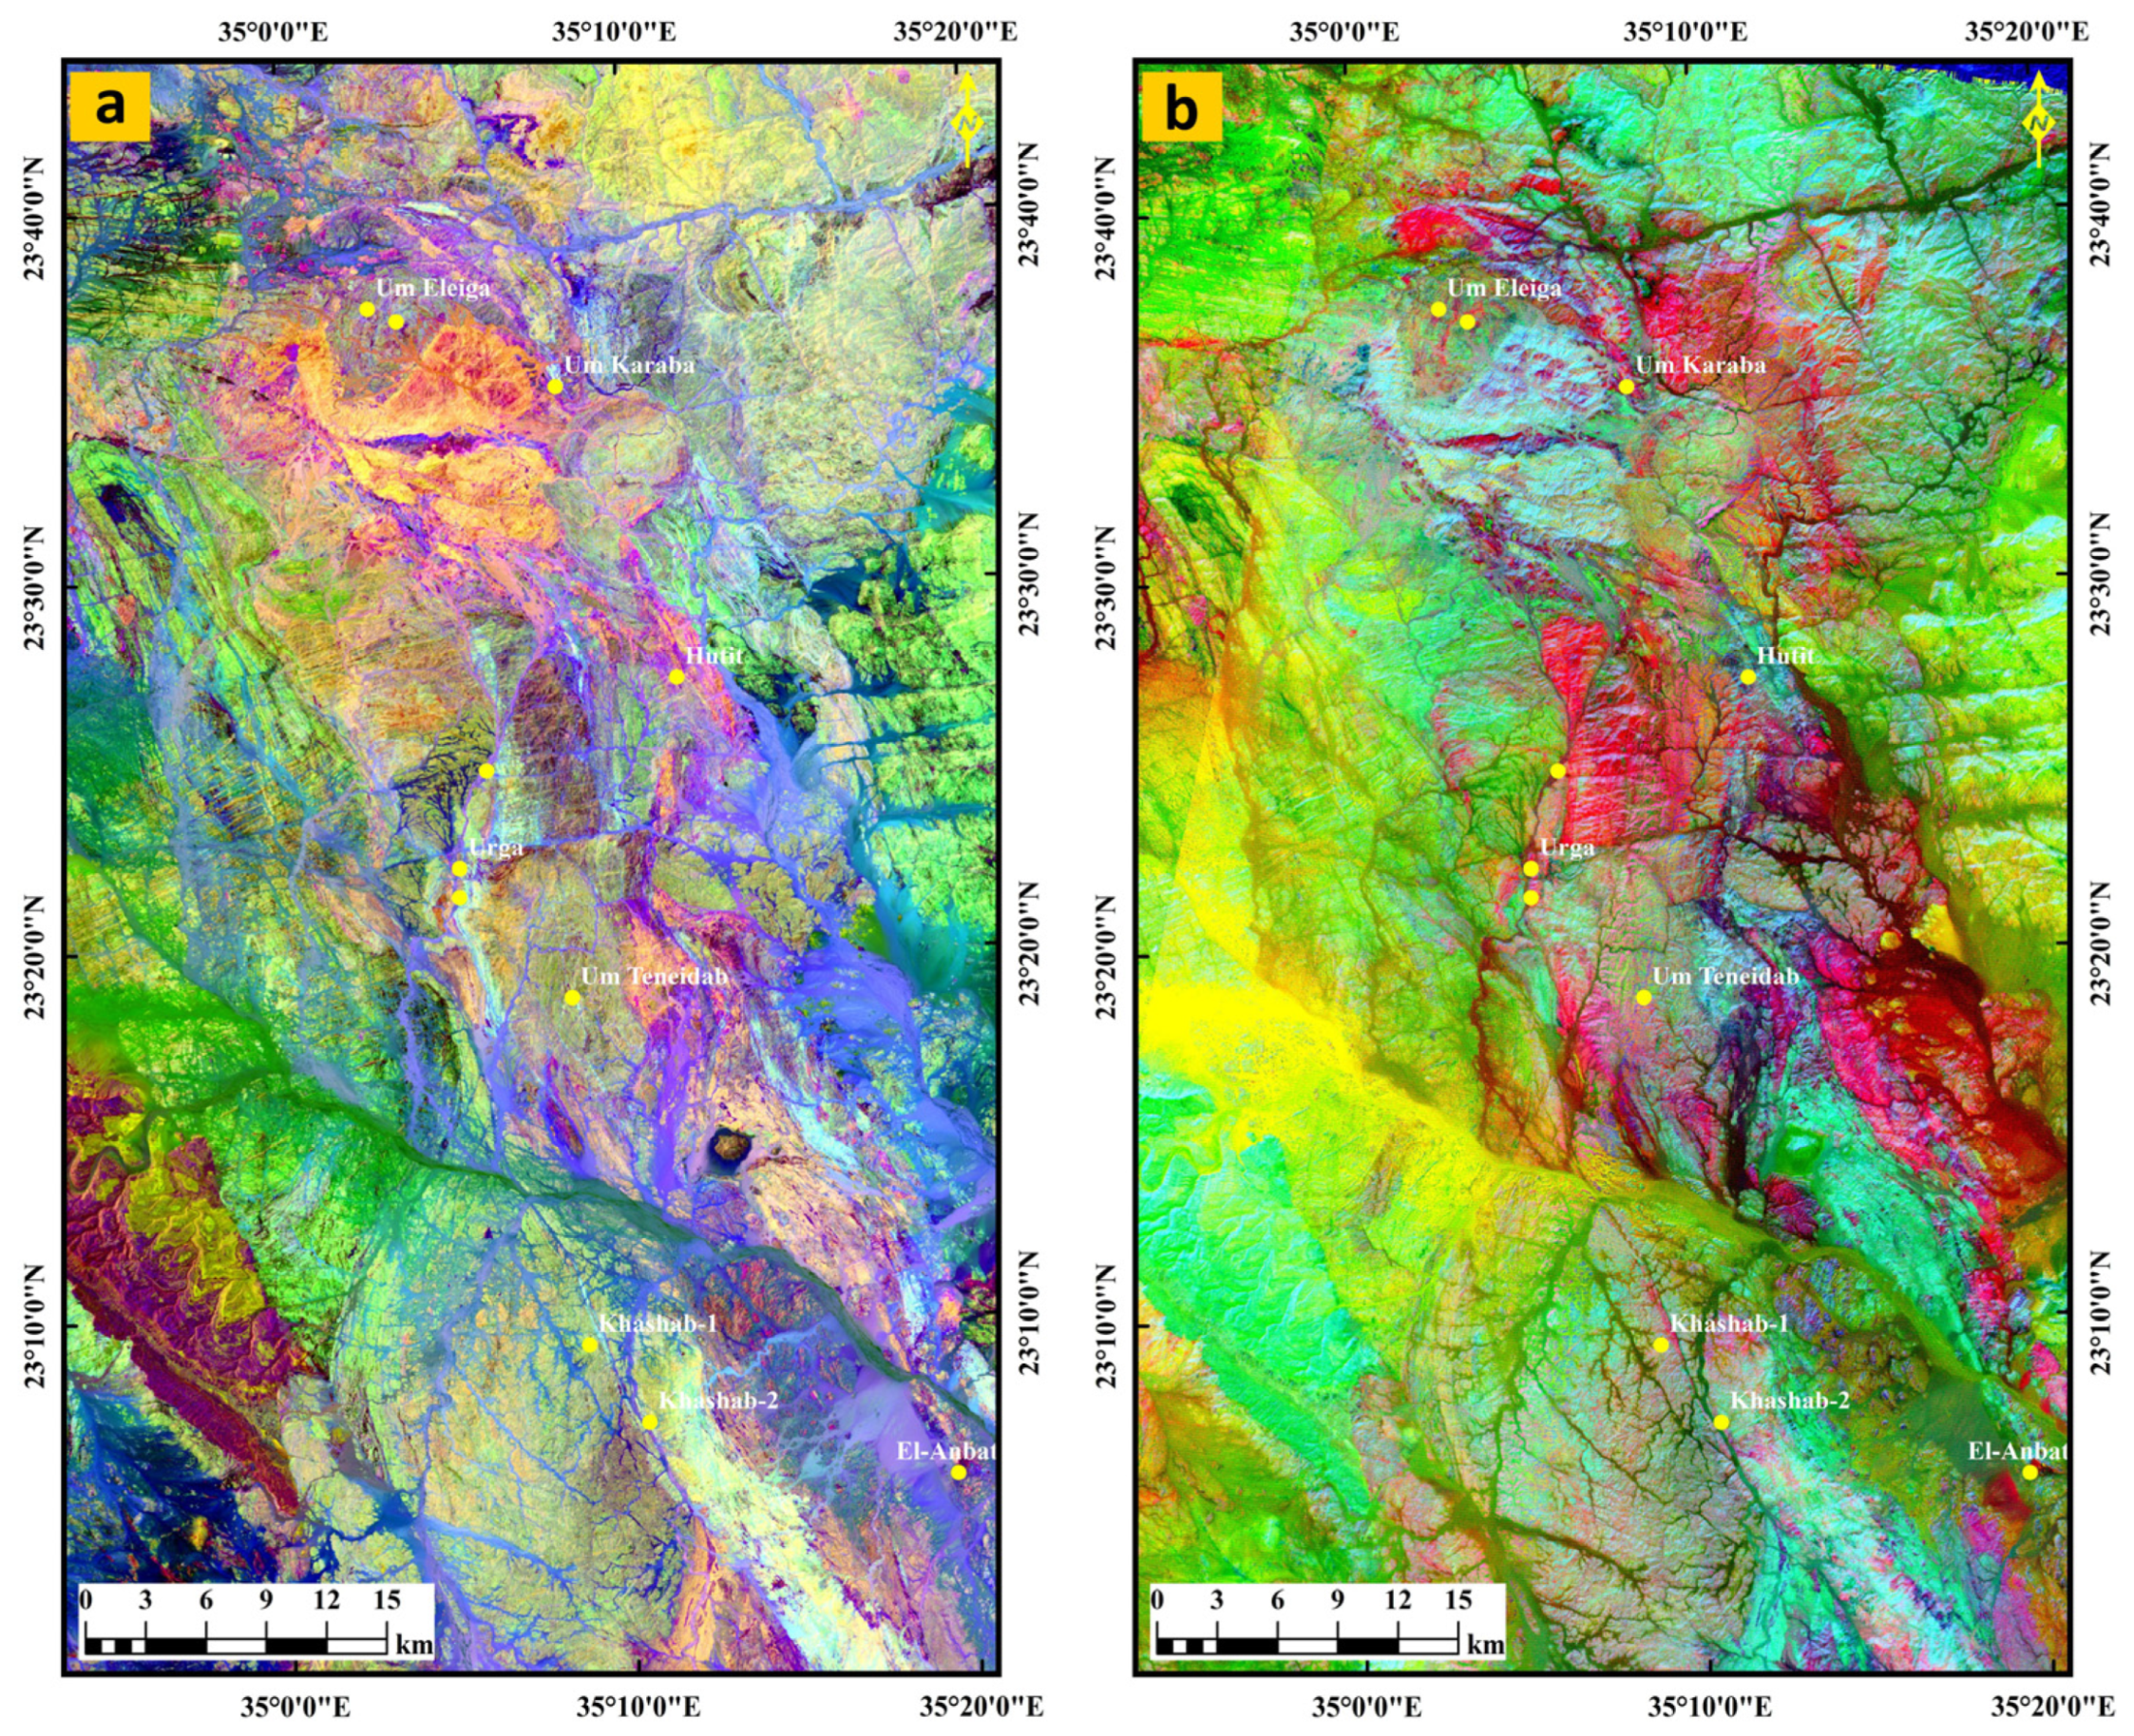
3.3. Hydrothermal Alteration Zones Detection

Shortwave infrared (SWIR) channels of ASTER can increase the accuracy of the spectral identification of minerals and rock units [55,56,57,58,59,60,61]. ASTER indices including kaolinite, clay and muscovite and carbonate alteration zones [12]. The mineralogical indices are reflectance combinations of two or more spectral bands signifying the relative abundance of the target objects. The application of mineralogical indices for the ASTER bands is efficient for lithological and hydrothermal alteration discrimination [62]. The six ASTER–SWIR bands were used to map the hydrothermal alteration minerals. Therefore, four spectral mineralogical indices (OH-bearing mineral index, OHI; kaolinite index, KLI; calcite index, CLI and alunite index, ALI) were used to characterize the alteration zone in the study area. The OHI is calculated as (band 7/band 6) × (band 4/band 6), the KLI is developed by way of (band 4/band 5) × (band 8/band 6), CLI is calculated as (band 6/band 8) × (band 9/band 8), while ALI is expressed as (band 7/band 5) × (band 7/band 8) [62]. The hydrothermal alteration zones are traced as bright pixels in the highly tectonized ophiolites, metasedimentary and island arc metavolcanic and metavolcaniclastic rocks (Figure 6a–d). The island arc rocks appear as bright pixels likely due to the abundant OH-minerals such as mica, amphiboles, chlorite and epidote (Figure 6a). It is noticed that the Urga, Um Teneidab, Khashab-1, Khashab-2 and El-Anbat gold mines overlap these alteration zones. Kaolinitic and clay minerals rich rocks such as granitoids, wadi deposits and altered ophiolitic rocks show bright pixels in Figure 6b, where Um Eleiga, Um Karaba and Hutit gold mines are seen. The calcite index grey image discriminates perfectly the calcite rich rocks zone of serpentinite, talc carbonate rocks, island arc metavolcanics and highly sheared metasediments as bright and gray image pixels.
The false-color composite (FCC) ratio image (OHI, KLI, CLI) was elaborated by combination of the three gray scale mineralogical indices images in the RGB channels (Figure 6d). This image characterizes the OH-bearing rocks (meta-ultramafic) as light blue pixels, metavolcanics and metasediments as dark blue and reddish blue pixels, respectively. The quartz-rich rocks have a reddish yellow image signature, whereas the clay minerals bearing rocks and stream sediments have lemon and bright green image signatures. The hydrothermal alteration zones in the study area are associated with the highly deformed ophiolitic and the ductile deformation zone. The results of alteration mapping derived from ASTER datasets reveal the spatial association of highly sheared rocks with gold occurrences.

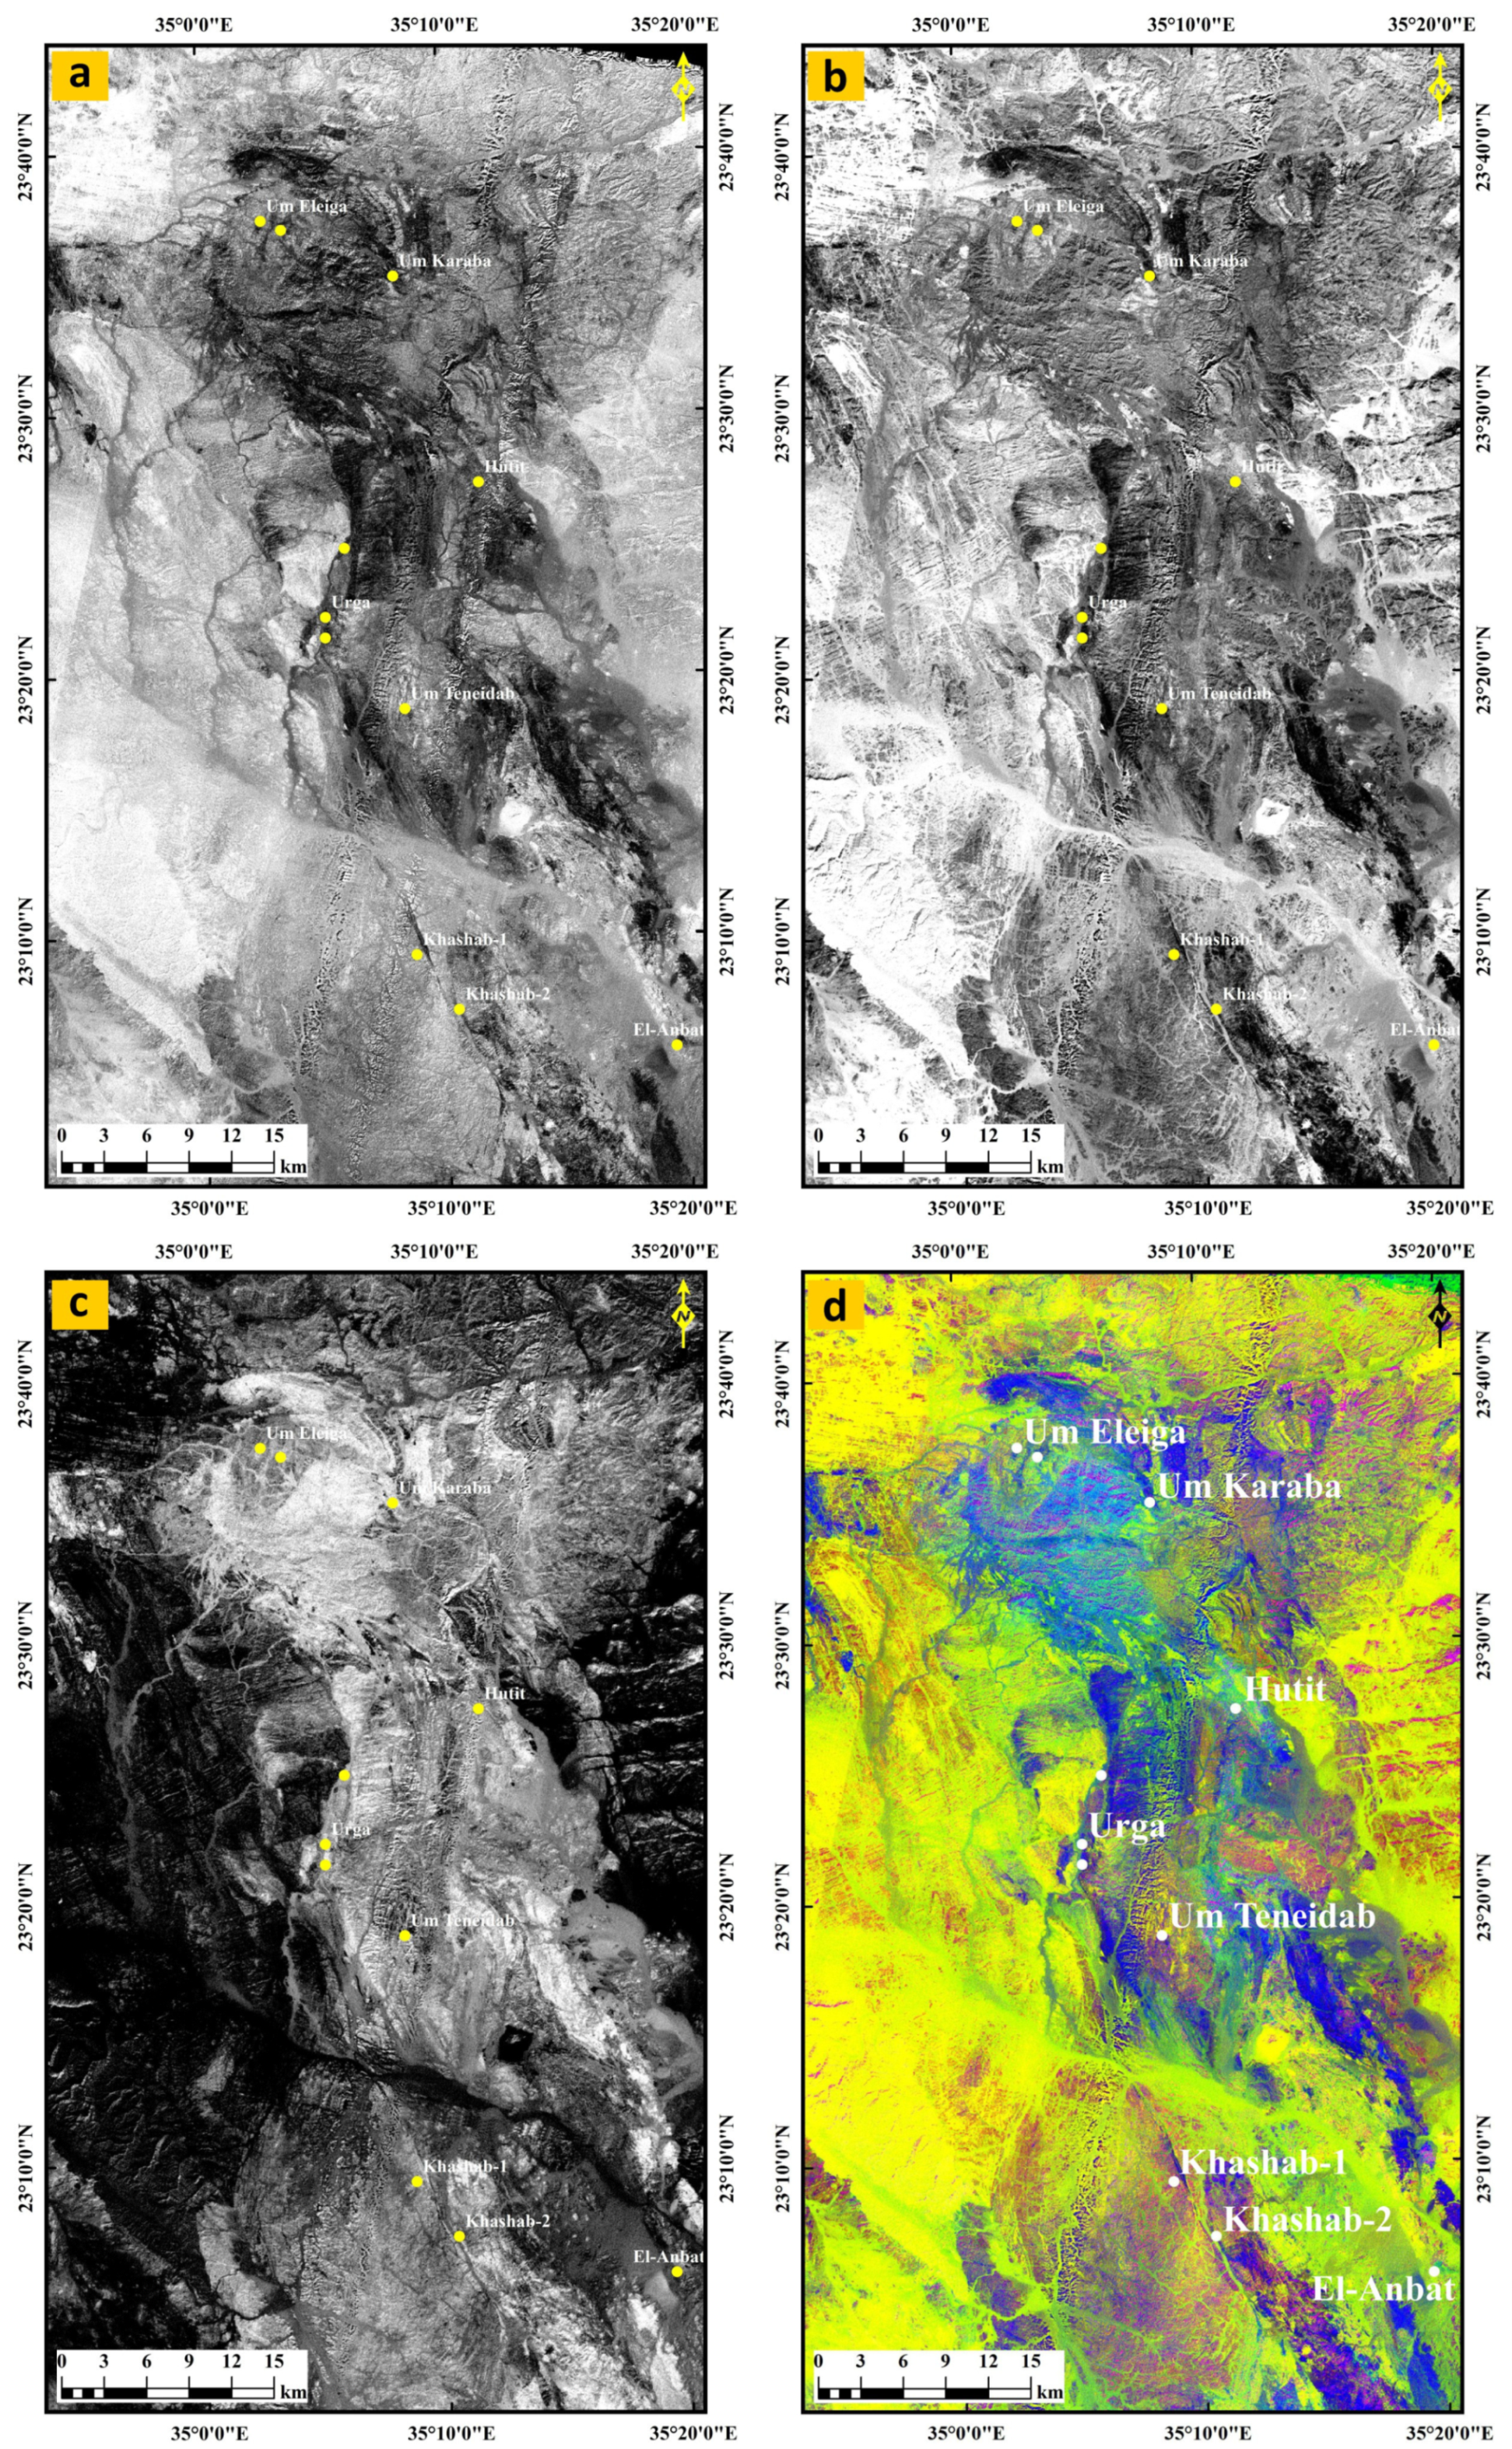
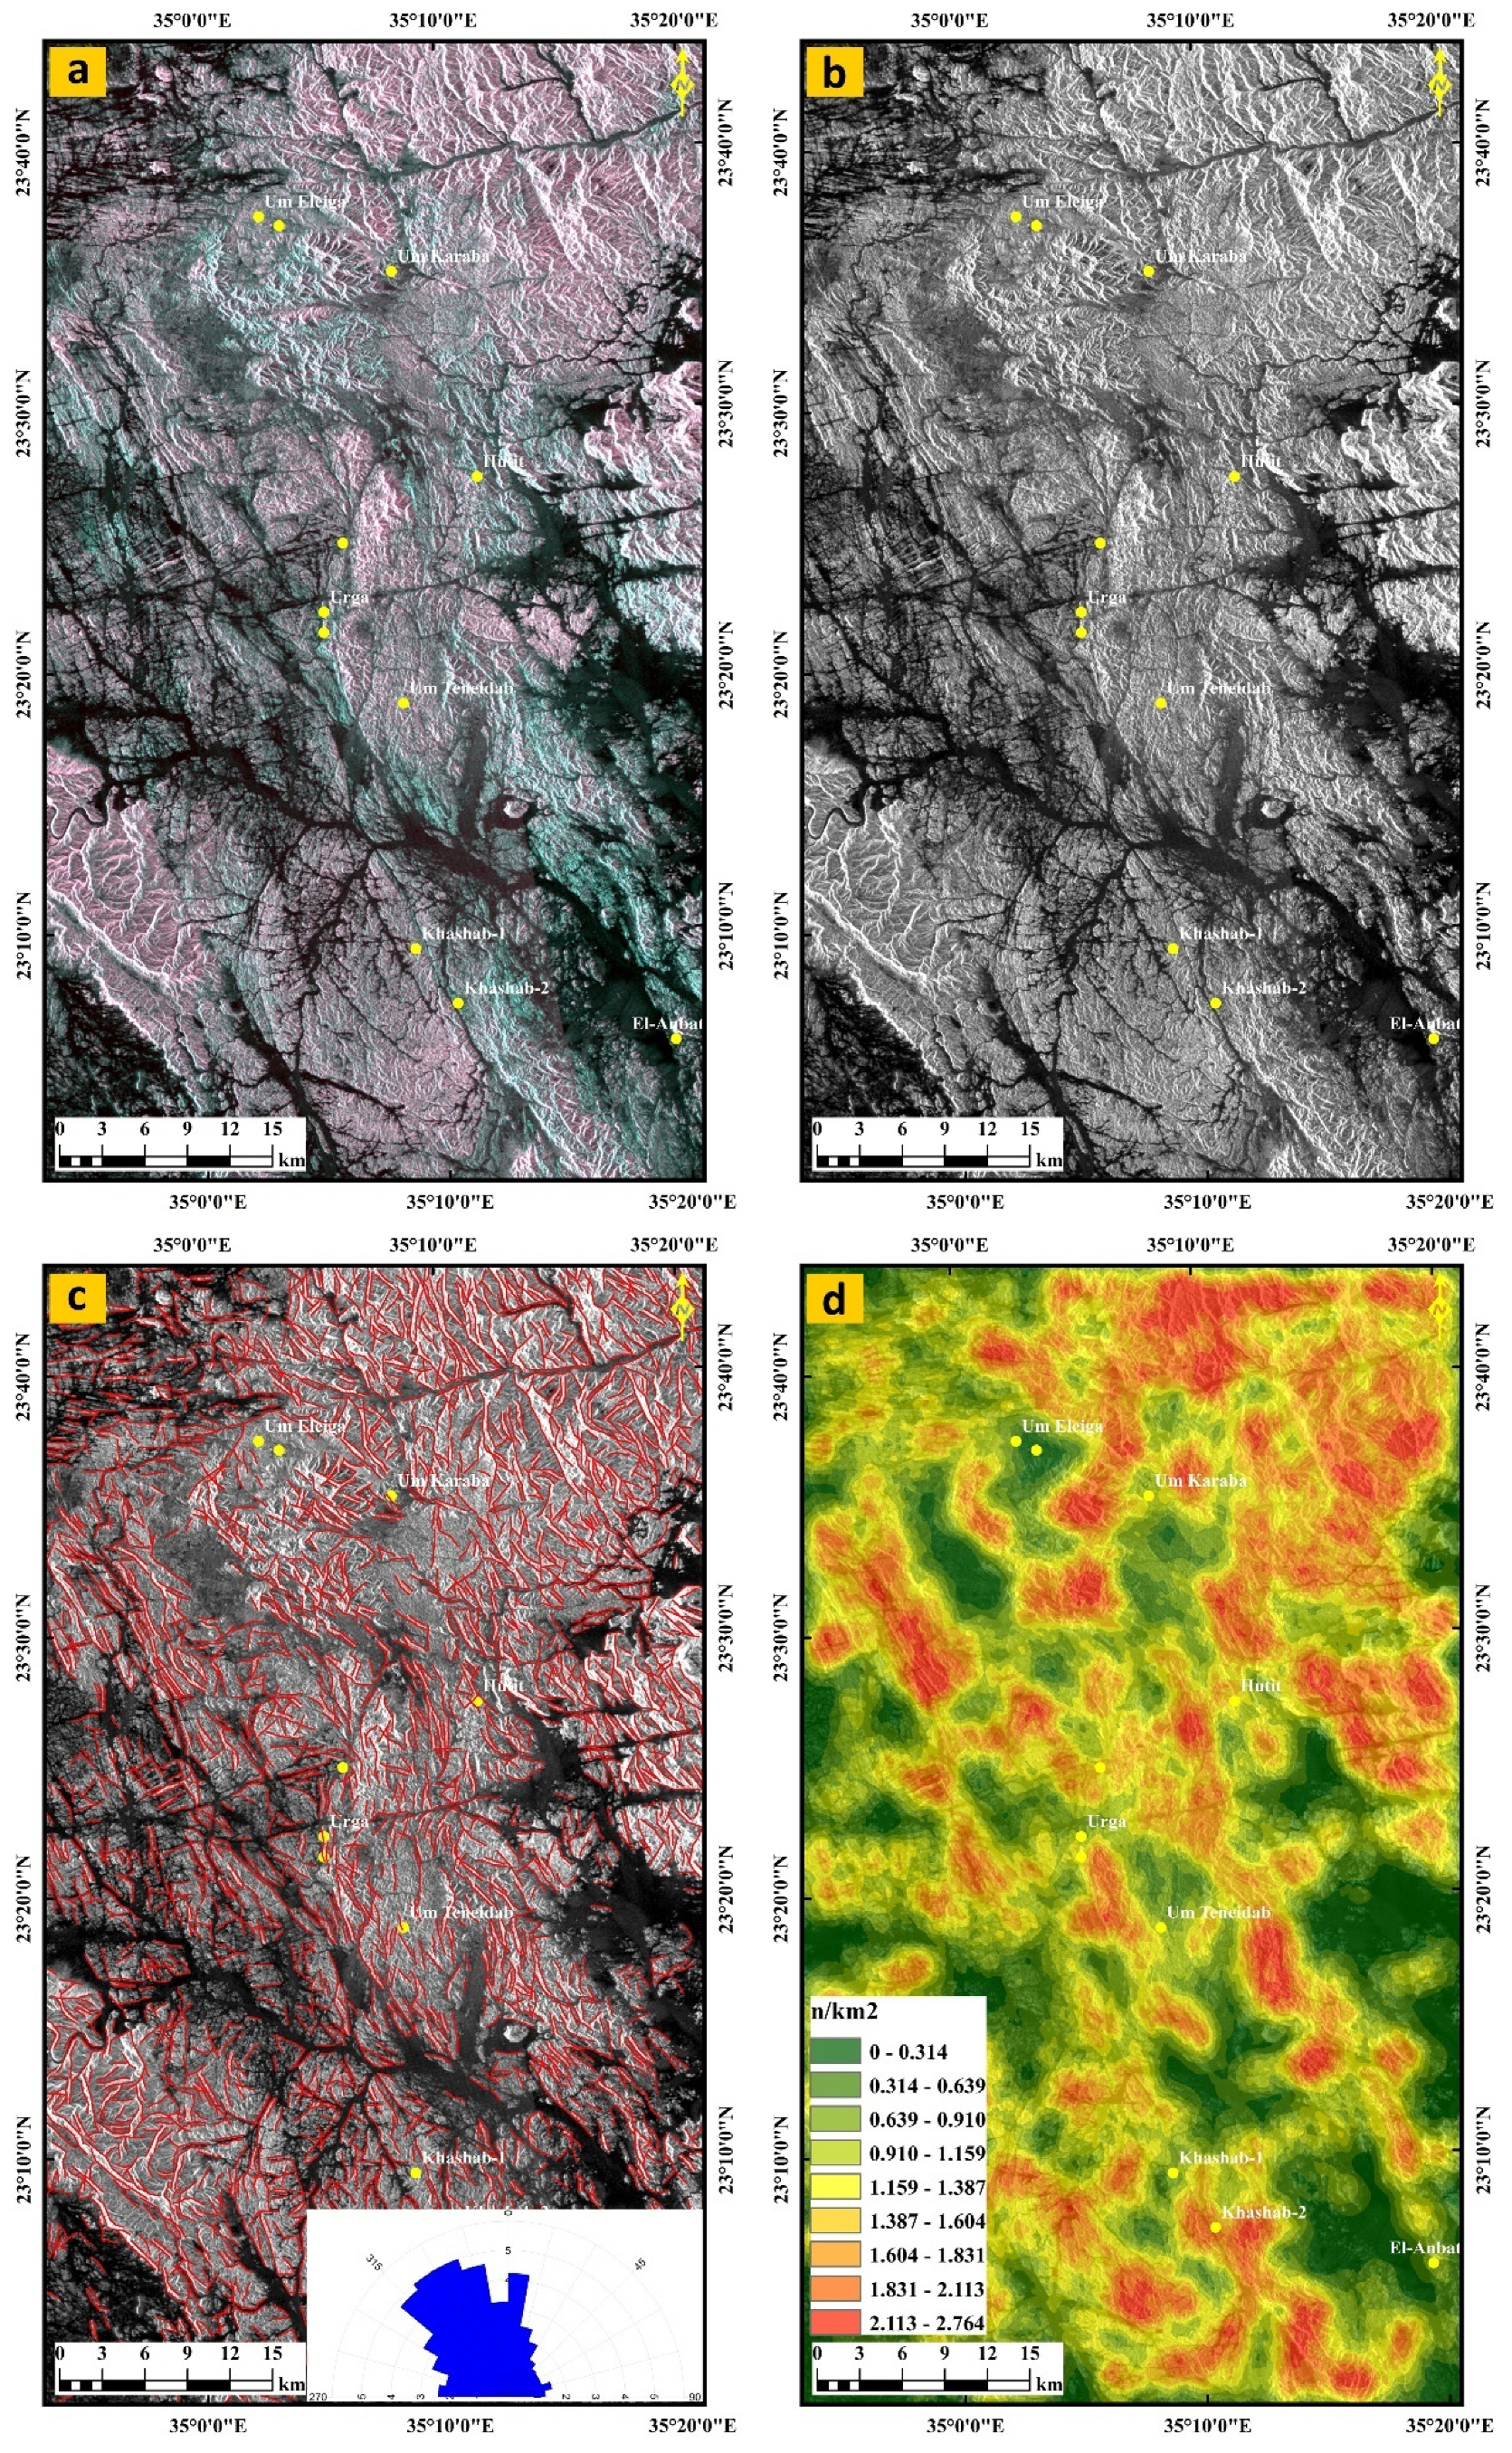
3.4. PALSAR-Based Lineaments Extraction

Lineaments’ extraction and analysis is considered a fast tool in geologic mapping and mineral exploration [63]. Hydrothermal ore deposits occur within or nearby fracture zones. Thus, lineament mapping is useful to infer locations of unexposed mineralization or dilatation sites [64]. High-resolution PALSAR data with full polarization and variable off-nadir angle have significantly enhanced the structural mapping and lineaments extraction. The adaptive Lee and Local Sigma filters can be applied to PALSAR to eliminate speckles and to enhance structural lineaments [6,65]. In the present study, four PALSAR scenes were orthorectified, mosaicked and enhanced by Lee filter to trace the linear features and major structures. The HH, HV, HH + HV bands were transformed by PCA method to PCA RGB images (PC1, PC2, PC3; Figure 7a). The automated lineament extraction was carried out using PC1 image (Figure 7b) by using LINE algorithm PCI Geomatica software. This algorithm is adopted with parameters, including radius of filter in pixels (RADI), threshold for edge gradient (GTHR), threshold for curve length (LTHR), threshold for line fitting error (FTHR), threshold for angular difference (ATHR), and threshold for linking distance (DTHR).
The extracted lineaments were overlaid on the PC1 image (Figure 7c) and exported to Rockworks software to generate the azimuth-frequency diagram (inset, Figure 7c). The lineaments layer was imported in the ArcMap (version 10.5, ESRI (Environmental Systems Research Institute, Redlands, CA, USA) environment to generate the lineament density map using the line density module in the spatial analyst toolbox (Figure 7d). The resultant lineaments layer shows predominantly NW–SE, N–S and E–W trending structural grain, which agrees mostly with the major thrusts and faults in Figure 2. Well-developed foliations, shear cleavages and strike slip faults offsets are also recognized (Figure 7a,b). The gold mining sites occur close to the high-density zones of the lineaments (Figure 7d), similar to conclusions reached by Zoheir and Emam [7], and Zoheir et al. [11,12] in the south Eastern Desert of Egypt.

3.5. Geospatial Modelling for Gold Mineralization Zones

Geographic Information System (GIS) is capable of manipulating, overlaying, integrating, and storing digital data in the geo-database as thematic layers. This approach plays an essential role in creating and integrating numerous geo-datasets from different geospatial data such as geology, structural density, etc. [66]. Remote sensing and (GIS) were integrated to identify new gold mineralization sites. For geospatial modelling of these mineralization zones, the evidence layers were integrated according to their relative contribution to the gold mineralization [67]. Where three main processes are recommended, including ranking processes for the evidence layers, weighting process are used for the classes of each layer, and data integration is used to assess gold mineralization potential zones [67,68]. Multisource datasets were obtained, analyzed and integrated to develop a geospatial model. Seven thematic maps for the study area were prepared and then converted into raster or vector form to be easily integrated with the GIS tools. A weight was assigned to each factor layer according to the different ranking methods [69,70,71,72,73] (Table 3). The weighted sum of all the factor layers was calculated (Figure S6). The layers were then processed using ArcGIS analysis tools to place the assigned gold occurrences on a knowledge-based hierarchy, utilizing the Spatial Analyst tool of ArcGIS (Figure S6). To perform this process three basic steps were followed: spatial database building, data analysis, and data integration. The created layers for the geospatial model were subjected to reclassification and assigned suitable weights (Figure S6 and Table 3). Moreover, the geospatial thematic maps of the gold mineralization model were ranked from 1 to 5 (where 5 is the most favorable and 1 is the least) based on their suitability to host gold mineralization.
Gold mineralization is associated with the ophiolitic rocks and their contacts, close to contacts, and mostly along shear zones. A mineralization potential map was created and classified the study area into five relatively zones, varying from very low to very high potential zones (Figure 8). The high potential zones are distributed mainly around ophiolitic rocks contacts (serpentinite, talc carbonate and ophiolitic metagabbros) and metavolcanic and metasediments association rocks, respectively. The new promising sites occur close to the already known gold mining sites (Figure 8). The integrated approach demarcates several potential zones along the NW-Hodein shear zone. Validation of this model was accomplished by testing ancient mining localities in the study area. Figure 8 shows that Um Eleiga, Um Karaba, Hutit and Urga occur in the very high potential zone, while Um Teneidab, Khashab 1, 2 and El-Anbat match the high potential zone. Additionally, as constrained by new fieldwork and the available literature [11,12], occurrences of gold-bearing quartz veins are mostly confined to thrust ophiolite/metavolcanic-metasediments contacts.

4. Structural Setting and Analysis

The Wadi Hodein shear belt (Figure 9) is a high angle NW-oriented transcurrent shear zone in the South Eastern Desert. It exhibits a sinistral sense of shear manifested by various kinematic indicators such as biotite fishes, asymmetric porphyroclasts, S-C structures and deflected markers [34,40,74]. Evidence for a dextral sense of shear superimposed on the main sinistral sense of shear was also reported within the W. Kharit–W. Hodein shear zone [74]. Abdel-Karim et al. [75] described high-grade regional metamorphism contemporaneous with the regional foliation and intrafolial folds. A later phase was mainly a dynamic metamorphism associated with the emplacement of ophiolites onto the gneissic rocks. The Wadi Rahaba–Gabal Abu Dahr and Gabal Arais ophiolites include imbricate thrust-bounded sheets and slices of serpentinized ultramafic rocks, amphibolite and metabasalt, embedded in a highly tectonized matrix of talc carbonate, schists and metasiltstones. According to several authors, the Wadi Hodein area has evolved throughout four phases of deformation, D1–D4 [11,37,38,39,40,61,76]. The D1 deformation phase was an early NNE–SSW crustal shortening related to arc–arc collision and is manifested by S1 axial planar foliations, WNW-trending tight intrafolial and overturned folds (F1) and SSE-verging thrusts [37,61]. D2 is expressed in NNW–SSE folds and NNW–SSE crenulation cleavage (S2). F2 folds have en-echelon geometry and verge towards the WSW [37,38,39,61]. The NNW–SSE crenulations and kink folds (F2) might have been developed through oblique non-coaxial deformation of cleaved rocks. D3 was a sinistral transpression along the NNW–SSE ductile shear zones due to NW-ward nappe stacking and thrusting [37]. D4 was a brittle deformation event that led to formation of the ENE–WSW dextral strike–slip faults that deformed the preexisting rocks and dislocated the earlier structures [37,61].

4.1. The Gold-Mineralized Shear Zones

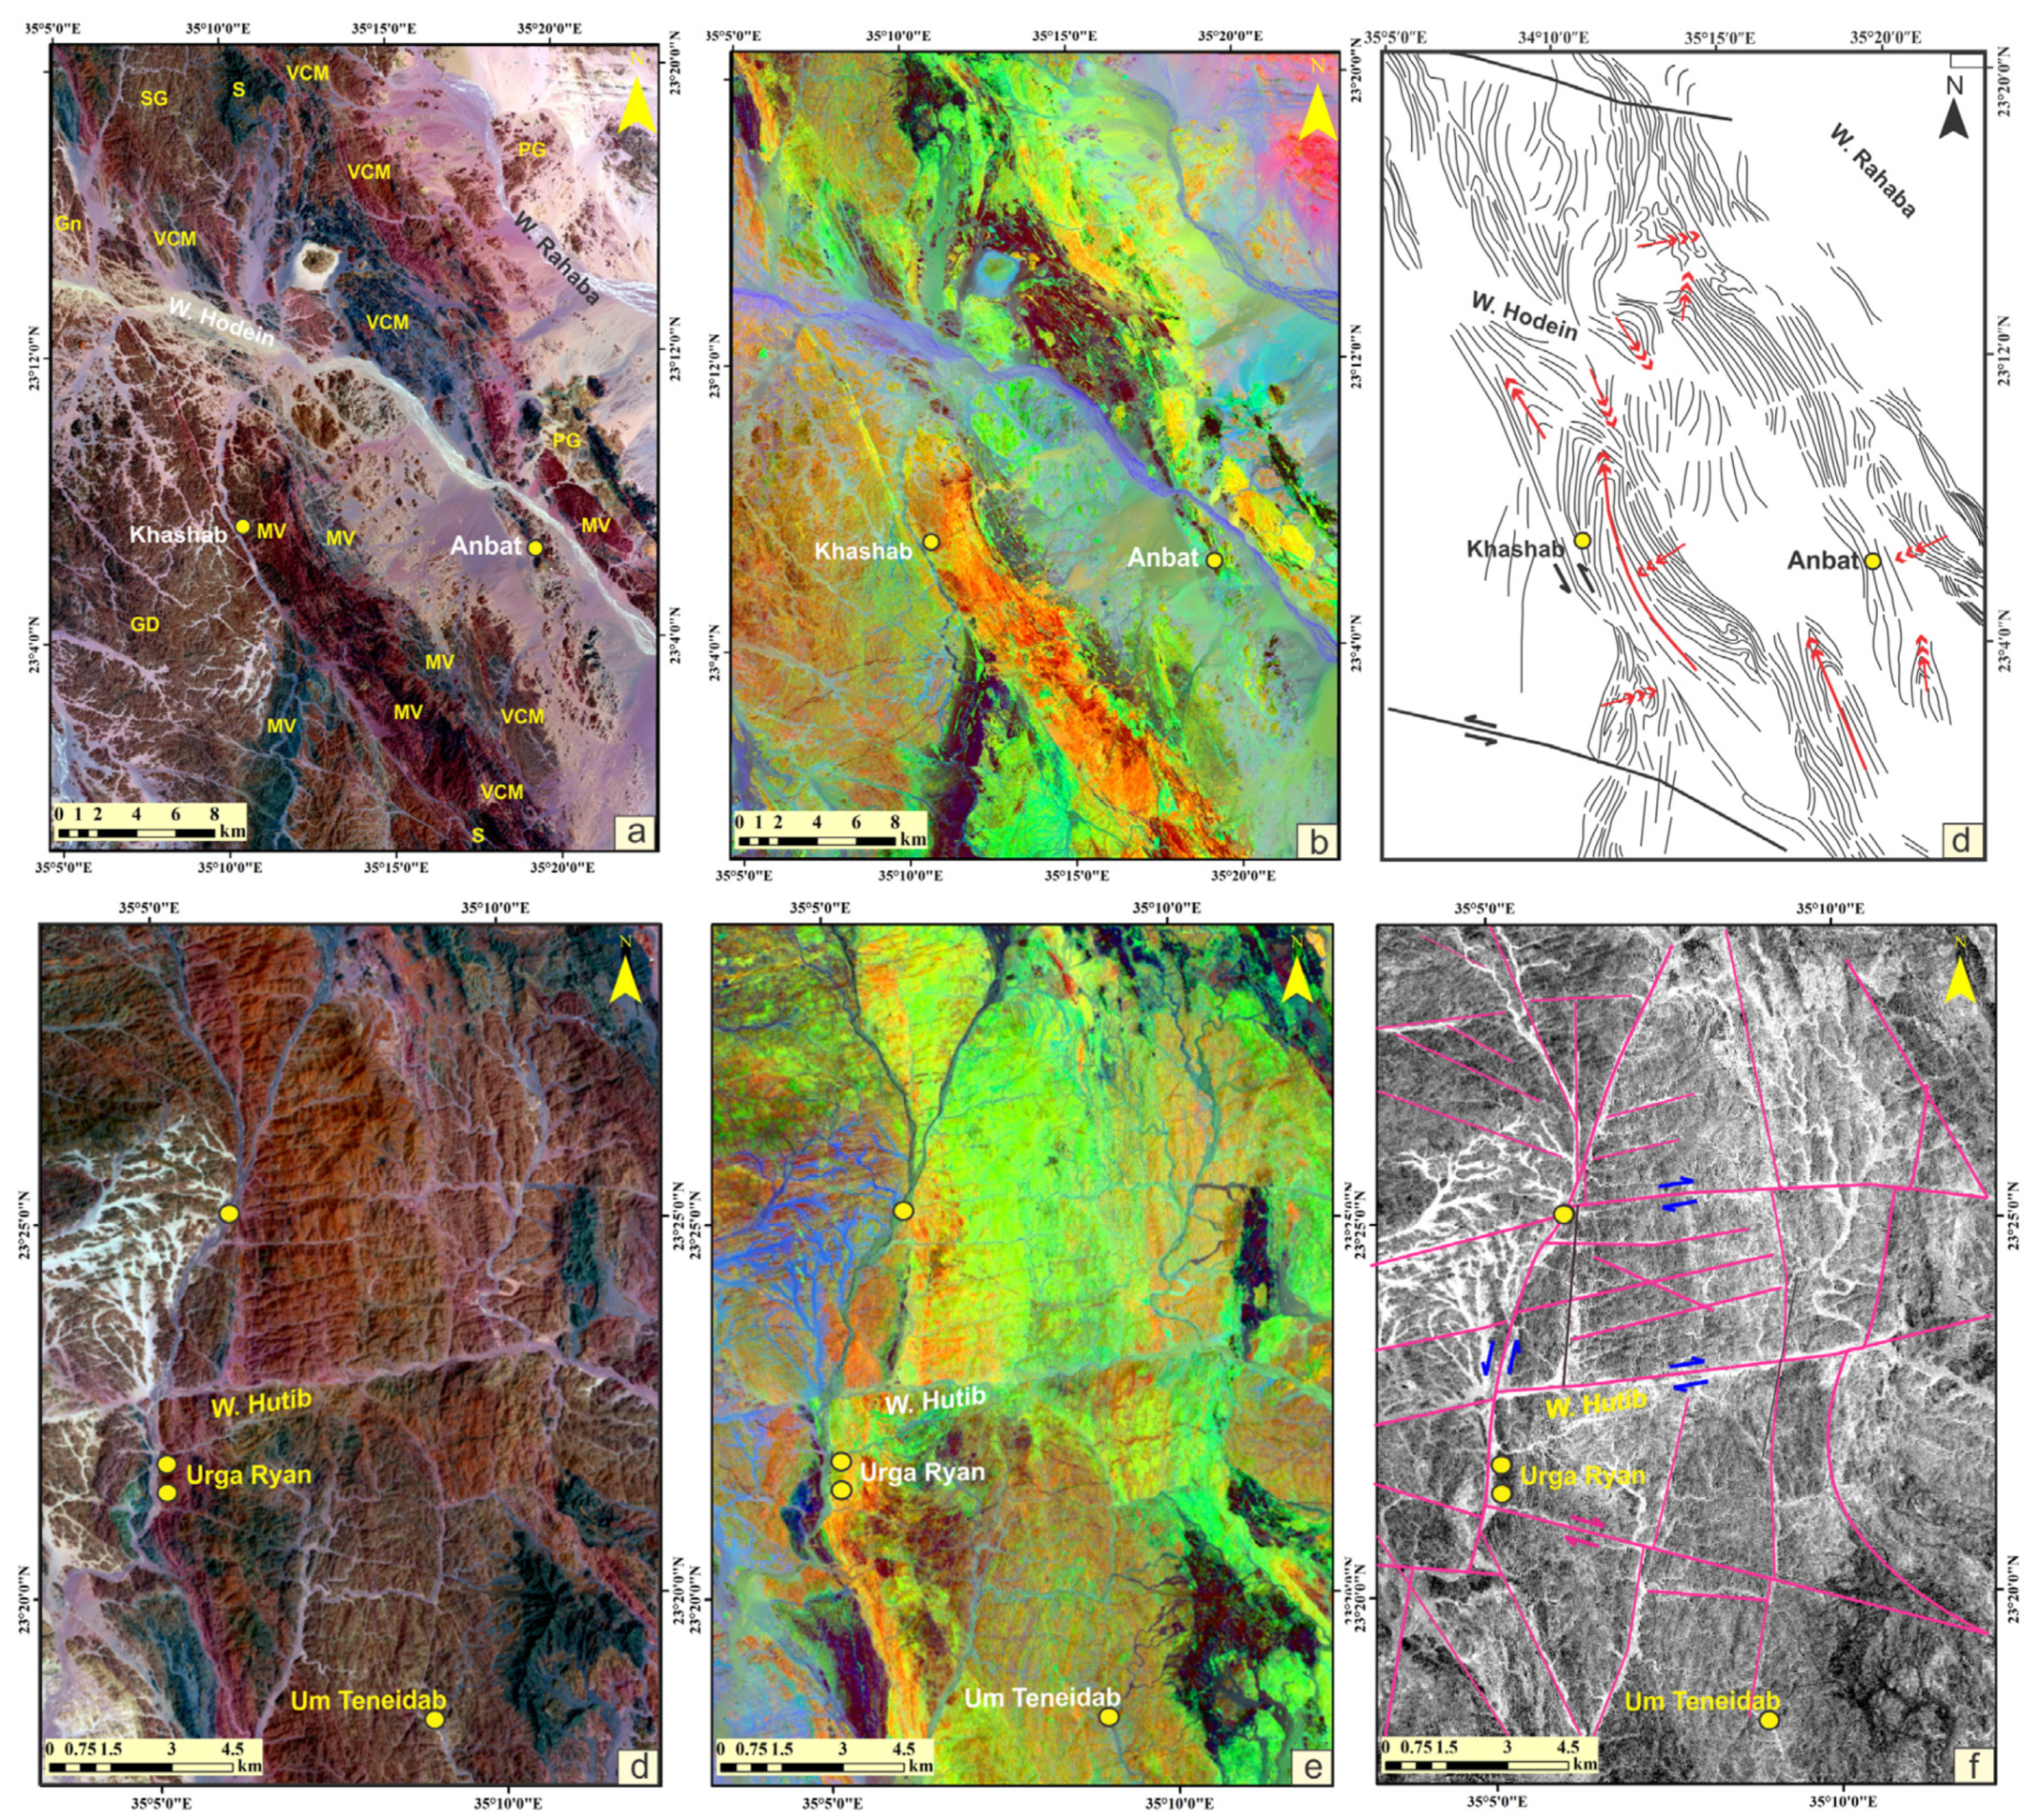
4.1.1. Wadi Khashab Shear Zone

The NNW-trending Wadi Khashab shear zone (Figure 9) and related splays cut across the southwest part of the area, and it dips moderately or steeply to the east. This shear zone is cut by WNW–ESE and ENE–WSW strike–slip faults. The Wadi Khashab shear zone hosts several occurrences of gold-bearing quartz veins that are commonly associated with sericitized and silicified rocks. Of these occurrences, the El-Beida and Wadi Khashab occurrences are heavily worked out by artisanal miners at present. The Wadi Urga occurrence is confined to highly sheared metavolcanic rocks with signs of hydrothermal alteration along their contacts with a large granodiorite–tonalite intrusion. The ~E–W Urga fault is a major, fault that dissects the Wadi Khashab shear zone and apparently displaces its trace ~1–2 km right-laterally. Similar parallel structures are abundant north and south of this major fault. A number of prospective targets, including Wadi Beitan, Wadi Urga Rayan, Um Teneidab and north Wadi Hutib, have been identified along similar, ~E–W trending faults, or where the main NNW structural trend is cut by WNW–ESE strike slip faults. To the north, it seems that this structure may host other unexplored occurrences, based on the widespread carbonate alteration in the footwalls of the ophiolitic blocks.

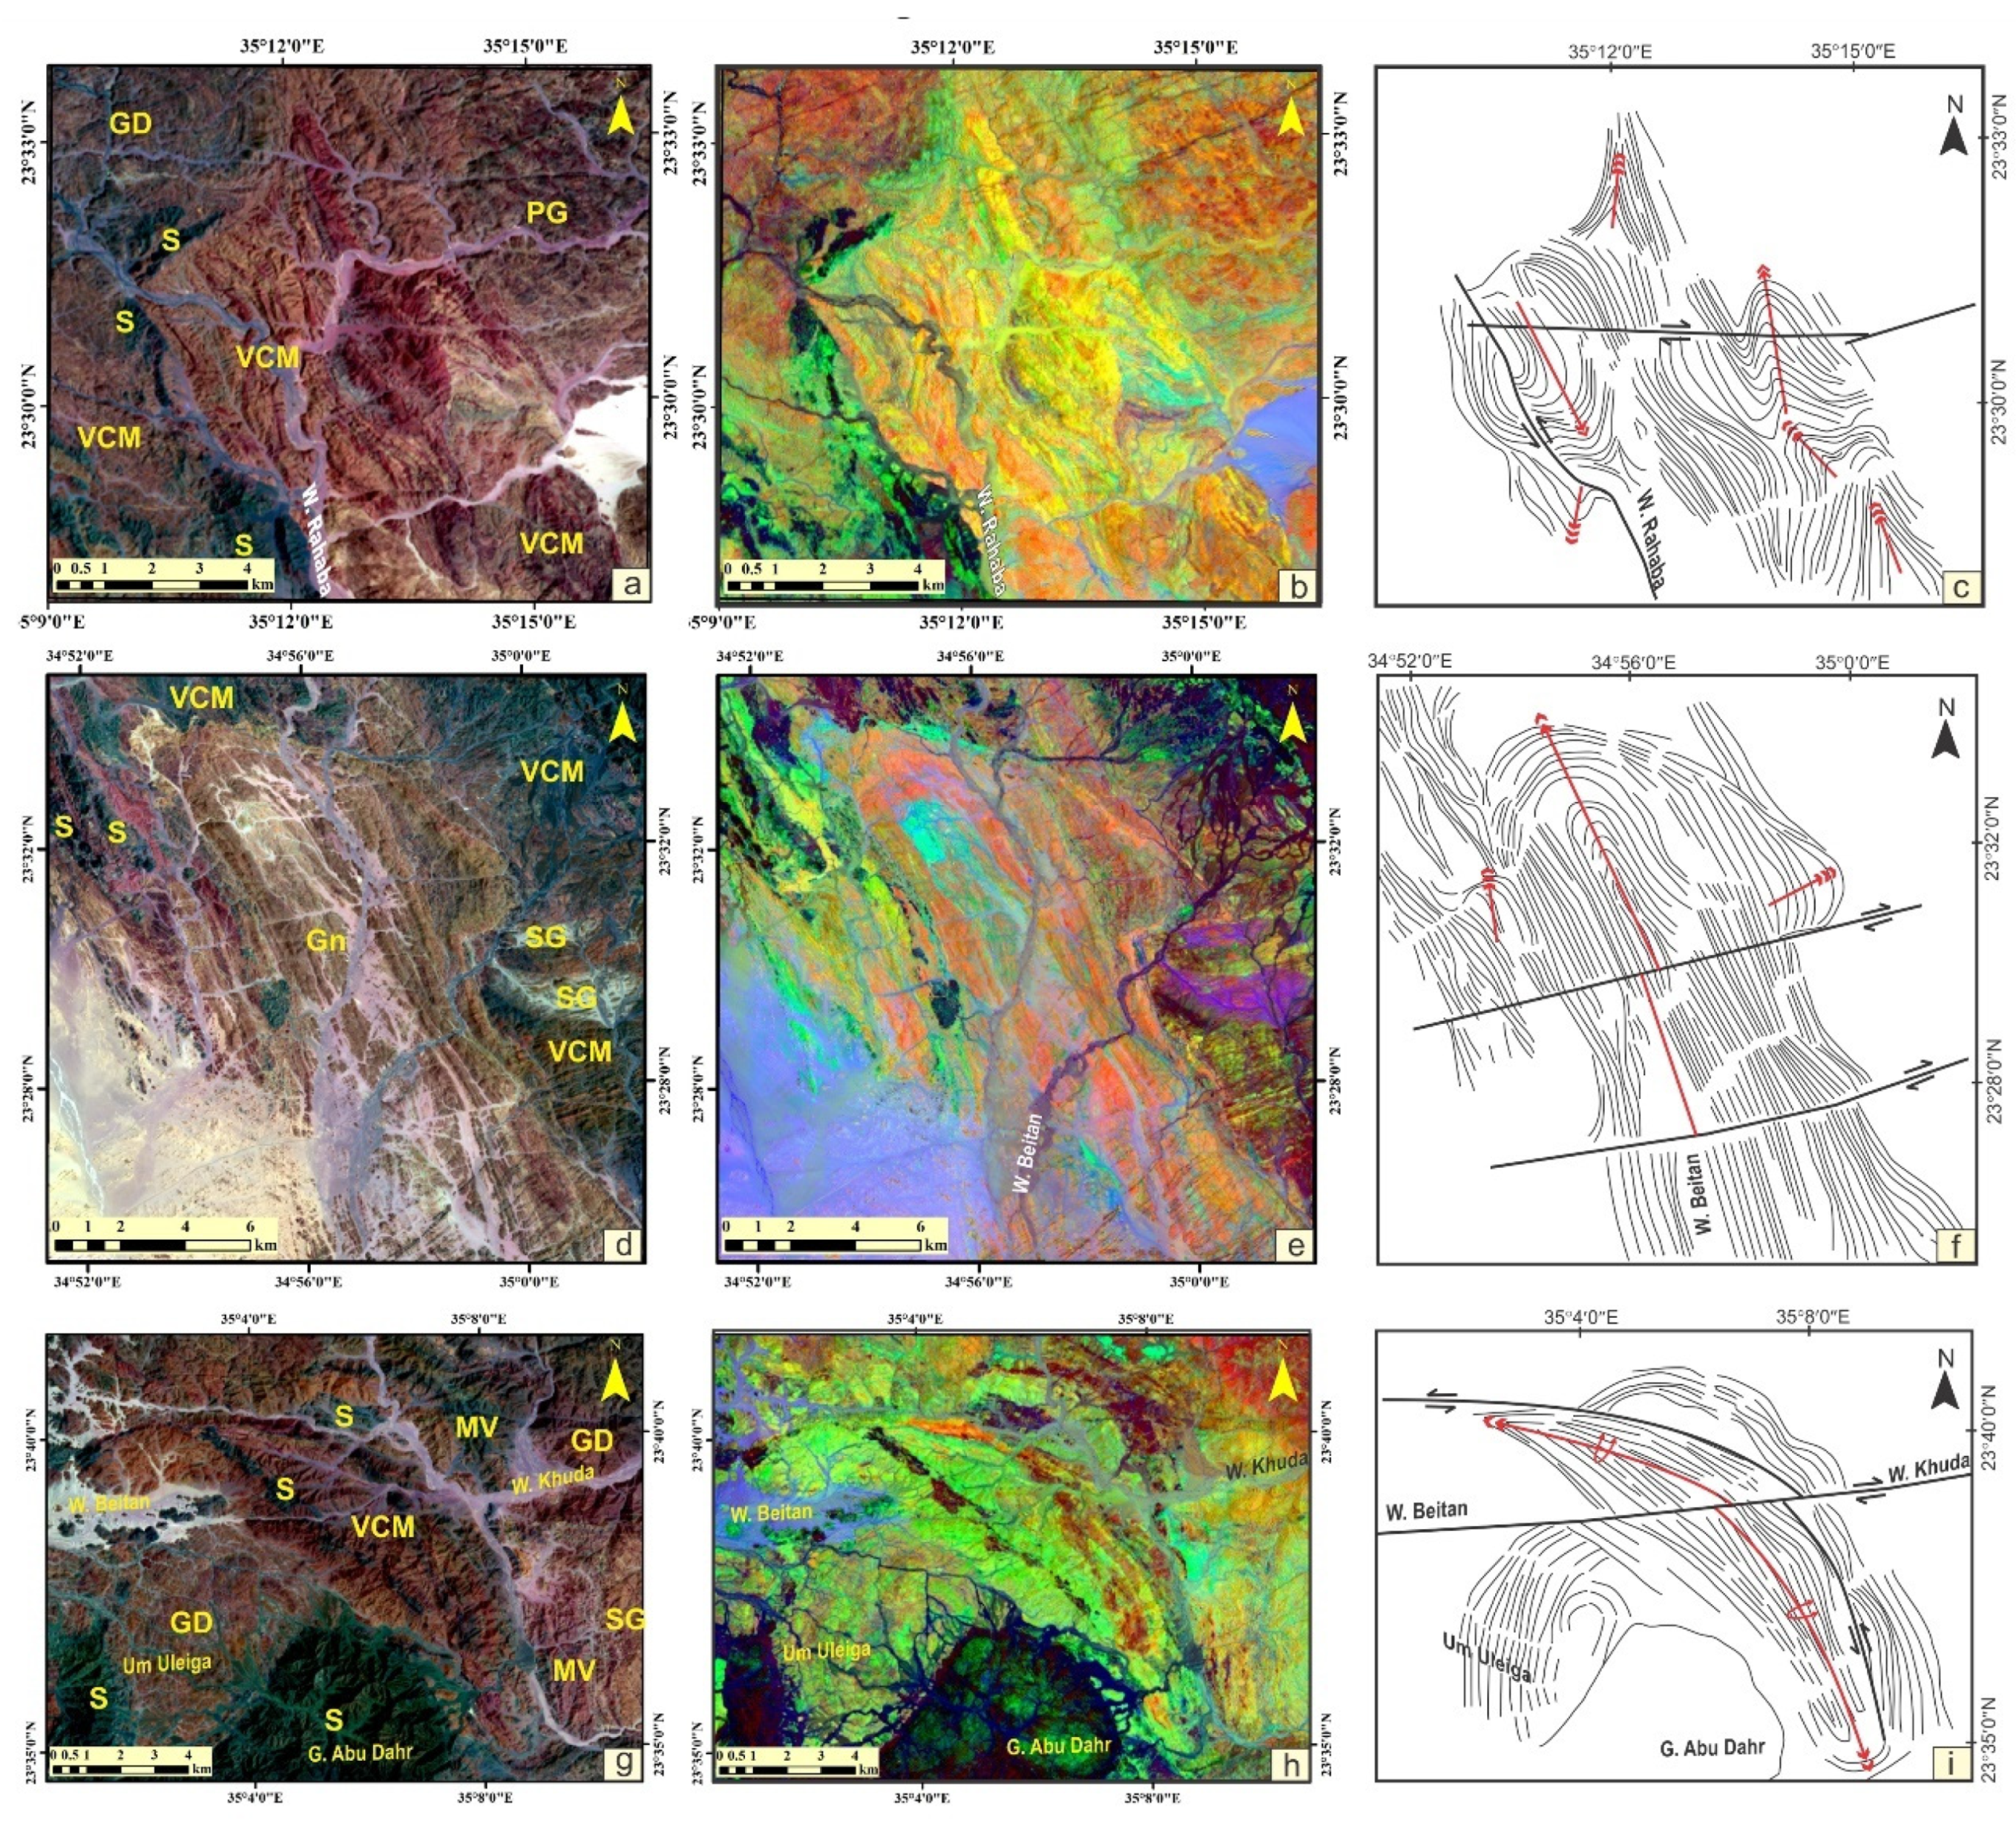
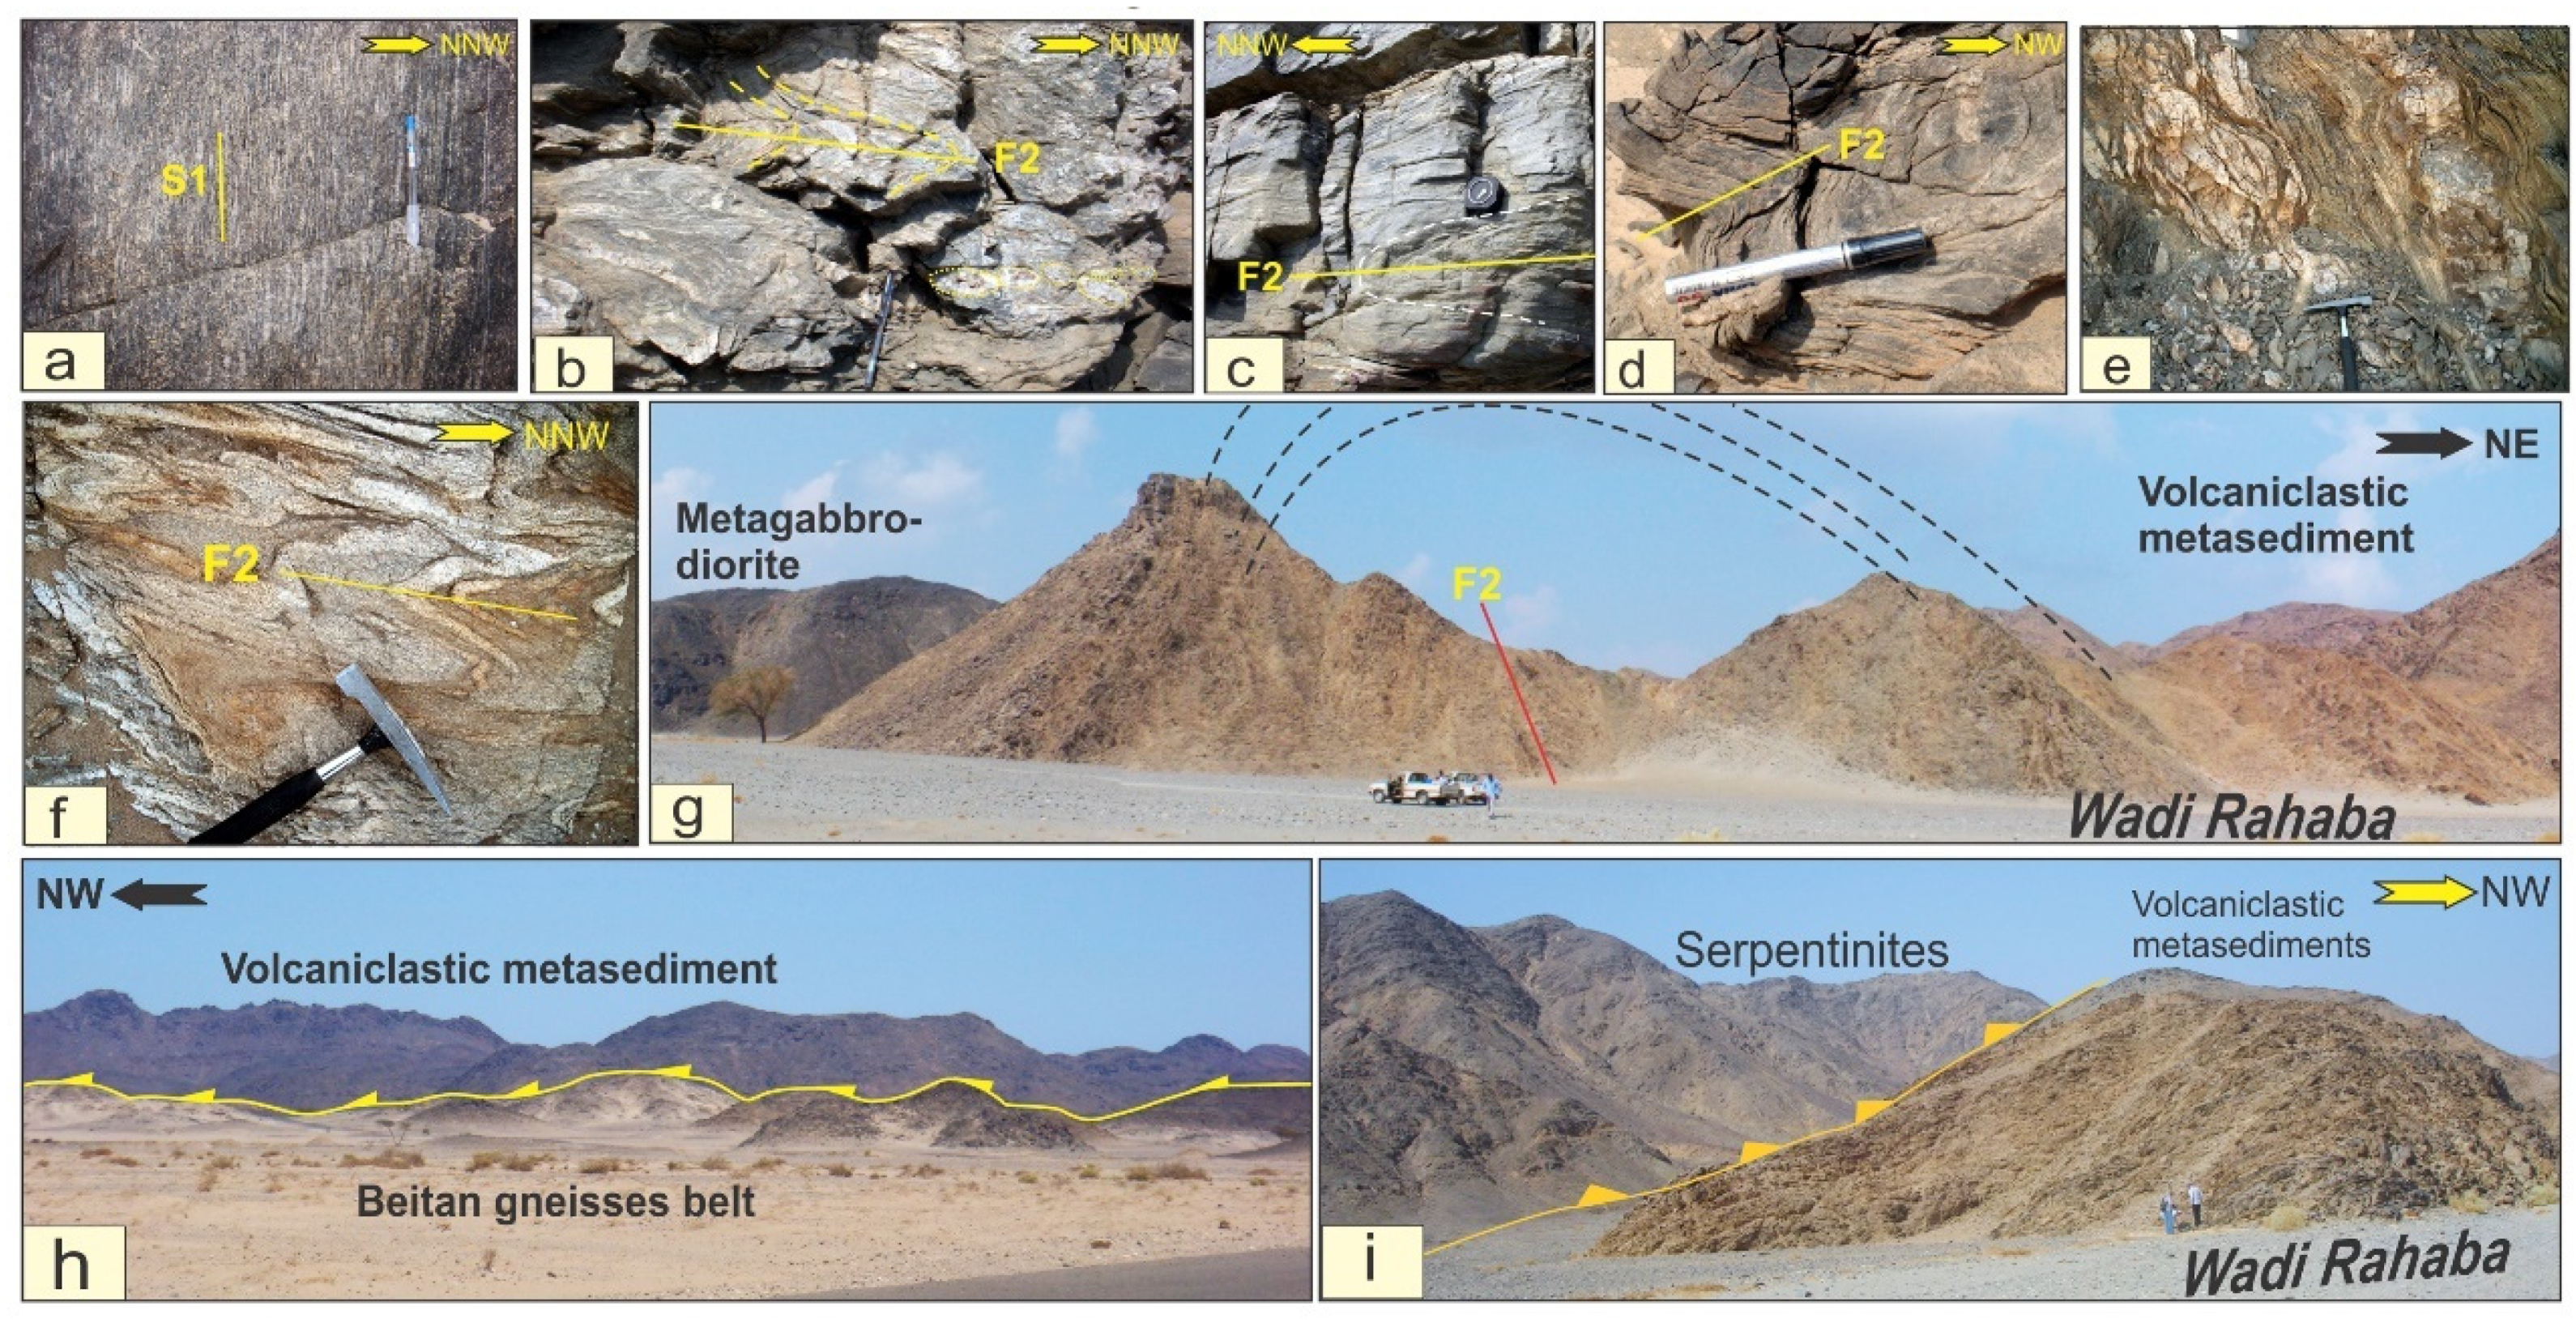
4.1.2. Wadi Rahaba Shear Zone

The Wadi Rahaba shear zone (Figure 9) represents an intense NNW-trending, steeply dipping, brittle-ductile shear zone cutting a generally carbonated mafic–ultramafic rocks and volcaniclastic successions in the central and northern parts of the study area. The shear zone also extends to the south, where it hosts the Anbat mine and other scattered surface mining sites. Towards the east of the Wadi Rahaba shear zone, a major thrust fault boundary marks the base of a hanging wall block of metagabbro and meta-granodiorite; and varies significantly from NW-trending and moderately steeply east-dipping in the central-east to shallow south-dipping and easterly trending in its northeastern part. A number of parallel, NW-trending, shallow to moderately easterly dipping thrust faults (or splays) occur immediately west of the Wadi Rahaba shear zone. These thrust faults mark the western boundary of the gneissic domains and are spatially associated with a number of prospective targets. Numerous significant, E–W to ENE trending late cross-faults appear to offset the major thrust-faults within this area.

4.1.3. Wadi Beitan Fault Zone

The Wadi Beitan fault zone (Figure 9) is a major, steeply dipping, WNW-trending silicified breccia zone with a strike length of some +25 km and is traced across the Um Eleiga mine area and eastwards. This structure cuts rocks of variable types in the area, including the Um Eleiga gabbro, Abu Dahr ophiolites and Rahaba gabbro–diorite complex. This zone converges with a NNW-SSE shear zone to the east and delineates the eastern structure contact of the island arc and ophiolitic rocks. Hydrothermal breccia and silica alteration of the host rocks are common along this structure, and abundant zones of sulfide mineralization with local malachite occurrences are observed. In the vicinity of the Um Eleiga gold mine, albitization of the gabbroic host rocks are pervasive. Iron oxides and copper hydro-carbonate are observed in some localities within the Um Eleiga mine area. Noteworthy, the Wadi Beitan fault zone could have been genetically linked with the extensive dike swarms spread over the large are between G. Handusa and G. Nukeiba northwest of the Abu Dahr ophiolitic massif. These dike swarms overprint the earlier NNW-SSE structural trend. Numerous basic dikes along the WNW–ESE direction cut the Um Eleiga gabbro–diorite intrusion and extend eastward to the Abu Dahr ophiolites.

4.2. Deformation Events

The Wadi Hodein shear belt (Figure 9) is a NNW-striking belt (~105 km-long), deformed greenschist metamorphosed ophiolites and island arc rocks. It was developed via four phases of deformation; (i) D1, NNE–SSW crustal shortening, (ii) D2: NE-SW oblique convergence and transpression, (iii) D3, E–W compressional regime and (iv) D4: extension tectonics. Lithological layering represents the primary bedding surface (S0) which is still locally recognizable in the ophiolitic metagabbros and bedded metamudstone as cm-scale alternating lighter and darker layers.

4.2.1. D1: NNE–SSW Crustal Shortening

N–S shortening and terrane accretion occurred as a result of a collision between the Gabgaba and Gerf terranes over a ~N-dipping subduction zone [77]. D1 structures are mainly preserved in the Wadi Khuda gneisses and in the Wadi Khashab–Gabal Sirsir ophiolitic mélange. Wadi Khuda gneisses represent a small structural window later cut by tonalite-granodiorite and biotite granite intrusions. In the Wadi Khuda gneisses, quartz–feldspar-micas gneissosity (S1) strikes ENE–WSW, and dips toward the NNW and SSE (Figure 10a). The axial plane gneissosity is only evident in the hinges of F1 folds which represented by metrewide, high-amplitude isoclinal, near recumbent to shallowly dipping folds. Boudins (B1) are developed on the quartzo-feldspathic layers in banded amphibolites. They have a symmetric shape and their long axes are parallel to the gneissosity (S1), suggesting a coaxial strain. The largest F1 fold is an asymmetric, doubly plunging anticline extending for up to 8 km in the Wadi Khuda gneisses (Figure 9). The axis of F1 major anticline is displaced by a NNW-striking sinistral strike–slip fault and the southern limb is superimposed by a NNW-tending anticline (F2). The early thrusts are SSE verging and are folded during the D2 event. These thrusts are preserved in the Arais ophiolitic mélange, marking the contacts between Beitan gneisses belt and the ophiolite blocks, as well as the contact between serpentinites and volcaniclastic metasediments (Figure 9). These thrusts converge downwards onto a basal S-dipping decollement.

4.2.2. D2: NE–SW Oblique Convergence and Transpression

The D2 deformation phase is manifested by regional foliation (S2), mylonitic foliation (S2m), major and minor folds (F2), stretching and intersection lineations (L2) and major thrusts (T2). The structures include small-scale, rootless intrafolial folds (Figure 10b), shearband boudins (Figure 10b), recumbent (Figure 10c,d), tight isoclinal and sheath folds along the first-generation ductile shear zone. These structures are largely preserved as decimetre-scale folds in a transposing and intrafolial foliation (S2) in the Beitan gneisses belt, schistose metavolcanics and volcaniclastic metasediments. The S2 in foliated metavolcanics and volcaniclastic metasediments is axial plane schistosity for the F2 folds and is defined by a strong preferred alignment of actinolite, chlorite and biotite. In the bedding-parallel quartz veins, asymmetrical “shearband-type” boudins (B2; Figure 10e) and asymmetrical “domino-boudinaged” quartz veins are common. The shearband boudins (B2) were only observed in shear zone close to the gold occurrences. Ptygmatic folding is widespread in the Beitan gneisses (Figure 10f). S2 planes have moderate to high dips predominantly toward the SW and NE. Around the synorogenic gneissose granites, ophioltic metagabbros and serpentinite mountainous blocks, the S2 foliations show important changes along strike or define different geometric patterns. In the central segment of Hodein shear belt, S1 traces strike NW–SE to NNW–SSE to NNE–SSW, whereas they curve back into a NW–SE orientation to the southwest of Gabal Dahr serpentinite’s peridotites.
The L2 lineation plunges have a N25–35° W or N40° E within the S2 gneissosity and schistosity and show all the characters of a mineral and stretching lineation. The hinge lines of microfolds in gneisses, schistose metavolcanics and volcaniclastic metasediments define a vertical crenulation lineation trending mainly NNW–SSW. A number of large-scale F2 folds have been mapped, and most of their axes are NNW- or NW-oriented (Figure 10g–i and Figure 11a–i). Other F2 axes may have resulted from later reworking by F3. Axial planar to these folds is a spaced crenulation cleavage (S2), which is commonly well developed. F2 folds range from centimeter- to kilometer-scale and are common in Beitan gneisses belt and the ophiloitic mélanges (Figure 11a–i). These folds are open, asymmetrical to isoclinal and their axes are nearly upright or plunge NNW or SSW. Some of the F2 fold axes plunge NNE or SSW, which may have resulted from later slight reorientation by the D3 open folding and/or the second-generation low-angle ductile shear zone. The axial traces of F2 folds strike mainly NW–SE or NNW–SSE. A doubly plunging asymmetric F2 anticline in the Wadi Khuda gneisses dips moderately to NW or SE. A series of WSW-verging thrust faults (T2) (Figure 9), parallel to the hinges of the largest F2 folds could have formed by progressive F2 folding in a compressional setting.
The ophiolitic mélanges in the Wadi Hodein–Wadi Beitan shear belt are thrusted over each other and over the Beitan gneisses belt (infracrustal rocks) along three major imbricate thrusts (T2). Three imbricate thrusts are named in this study: the Sirsir–Rahaba thrust, the Arais imbricate thrust and the Hodein–Beitan imbricate thrusts (Figure 9). The geometry of Wadi Khashab–Gabal Sirsir ophiolitic mélange is controlled by the oppositely dipping Sirsir–Rahaba and the southern extension of Wadi Hodein–Wadi Beitan sinistral reverse shear zone, respectively (Figure 12a–c). Gently to moderately ENE- and WSW-dipping foliation (S2) forms the dominant fabric that intensifies into belts of mylonites associated with D2 ductile thrusts. The Sirsir–Rahaba thrust dips ENE and separates ophiolitic blocks of Gabal Sirsir and the volcaniclastic metasediments of Gabal Anbat (Figure 9 and Figure 12a–c). The Wadi Hodein–Wadi Beitan imbricate thrust forms an imbricated fan (Figure 12a–c). Axial planar to tight-to-isoclinal, reclined F2 sheath folds have axes concentrated around the L2 mineral lineation. To the north of Gebel of Abu Dahr the thrusts mark the tectonic contacts between the ophiolitic slabs (serpentinites and talc carbonates) and the overlying metavolcanics and volcaniclastic metasediments. Additionally, Arais imbricate thrusts control the contact between Arais opoilitic mélange and the Beitan gneisses belt (Figure 9) and also mark the tectonic contacts between the ophiolitic slices. These NE-dipping thrusts constitute a backthrust to the WSW-dipping Hodein–Beitan imbricate thrusts.
Most of the small-scale, tight to isoclinal, asymmetric F2 folds in the Wadi Hodein- Wadi Beitan imbricate thrusts show top-to-the-ENE thrusting. Many shear sense indicators, including mineral lineations, asymmetric shear folds, asymmetric porphyroblasts, shearband boudins, S-C fabrics and shear bands indicate that the ophiolite blocks along Sirsir–Rahaba thrust and Arais thrusts are moved top to WSW and those along Hodein–Beitan thrusts are moved up to ENE (Figure 13a–c). Each thrust zone comprises several thrust segments showing anastomosing morphologies and form WSW-dipping tectonic duplexes. S2 gneissosity in the Wadi Beitan gneisses occur as asymmetrical folds around these boudins. Migmatitization is common in the shadows of the rotated boudins. The boudins do not display any foliations but are surrounded by the S2 gneissosity, suggesting that they formed during the D2 deformation. Shearband boudins show a top-to the-WSW movement.

4.2.3. D3: E–W Shortening and Sinistral Shearing

D3 structures are related to transposition and reorientation of the D2 structures. S3 schistosity overprinted the pre-existing S2 schistosity. S3 foliation strikes N20–30° W and dips 60–70° to the NE or SW (Figure 12d). Mylonitic foliation in C3 shear zones is superimposed on the S2 foliation (Figure 13d). The spacing of the strike slip shear zones varies from a few centimeters to some meters. Kilometer scale NNW-oriented strike–slip shear zones are commonly developed in the Wadi Khashab–Gabal Sirsir ophiolitic mélange, especially along Wadi Khashab, along the main planes of Hodein–Beitan shear zone and Sirsir–Rahaba shear zone (Figure 9). The ophiolitic and metavolcanic rocks on both sides of the shear zone show S-shaped fault–drag folds (F3), consistent with the sinistral movement. Quartz veins showing signs of ductile shearing are sulfide-bearing and are associated with green malachite alteration in places.
The strike–slip shear zones in Hodein shear belt separate the Wadi Beitan gneisses from the overlying ophiolitic mélange (Figure 9). The mylonitized rocks are characterized by stretched quartz ribbons with an anastomosing pattern of intervening variably deformed lenses. The angle between S3 and C3 is often clearly visible and can reach 5°, indicating strong shear values. Asymmetric boudins are developed in the Wadi Beitan banded gneisses and amphibolite. Mylonitic rocks exhibit subvertical to steeply dipping foliations (N20° W and N40° W) and dip steeply to the SW-dipping high-angle S3 foliations in the high strain zones along the main planes of the Beitan imbricate thrusts and Sirsir–Rahaba thrust. The S3 foliation is defined by kink bands or spaced cleavage that are parallel to the F3 axial planes. S3 kink bands are sharp deflections of S2. The high-strain zones with subvertical foliation planes are subparallel and are oriented NNW–SSW except in the central part of the Wadi Hodein–Wadi Beitan shear belt where they are deflected into NNE-SSW. In these high-strain zones, isoclinal and intrafolial folds with shallow plunging fold hinges and a subvertical axial planar foliation are abundant. Shallow NNW- or SSE-plunging mineral and stretching lineations are present on the steep foliation planes in the NNW–SSE striking high-strain zones.
Two distinct types of mineral lineations L3 on the S3 foliations have been recognized by the measurement of the minerals that grew during D3. The first type, here defined as L3a, is a SW and SE-plunging mineral stretching lineation along the ENE-verging thrust (T3). L3a is marked by platy quartz, amphibole fish and feldspar rods. The second type, here referred to as L3b, is a b-type lineation orientated subparallel to the F3 fold axes. The L3b is a crenulation lineation with a subhorizontal plunge to the NNW or SSE (Figure 13e). The D3 deformation produced regional-scale NNW-trending folds (F3) defined by open folds with nearly vertical axial planes. Superposition of F3 on F2 folds resulted in extensive NNW-trending tight and reclined folds and NE-trending open folds. The most common macroscopic shear sense indicators include asymmetric tight and reclined folds (Figure 13f), sigmoidal porphyroclasts (Figure 13g,h), S-C fabrics, folded and en-echelon quartz lenses (Figure 13i), shearband quartz boduins and pop up structures. The lineation indicates that the tectonic transport took place while far-field compression progressed and switched to oblique thrusting.

4.2.4. D4: Extension and Terrane Exhumation

D4 was a prolonged phase of brittle deformation associated with intrusion and emplacement of late-orogenic granitoid intrusions and terrane exhumation. During D4, the Wadi Hodein–Wadi Beitan shear belt was dissected by a number of dextral strike–slip faults, deformed the post-orogenic granites and the D1–D3 structures. These ENE–WSW right-lateral strike–slip faults occur in the central part of the Wadi Hodein–Wadi Beitan shear belt and along Wadi Khuda (Figure 9 and Figure 12d–f). Another major sinistral strike–slip fault striking NNE-SSW controls the course of Wadi Urga El-Rayan. NW–SE oriented gold-bearing quartz veins were originated during D2 and were subsequently deformed by D3–D4 events.

5. Gold Occurrences in the Wadi Hodein Shear Belt

A number of gold occurrences in the Wadi Hodein shear belt are mainly associated with the high strain zones. The latter are confined to fault-bounded imbricated thrust sheets of allochthonous ophiolitic blocks. The Roman and Ptolemaic gold occurrences are confined to deformed granitoid and metagabbro–diorite complexes in the northern and central parts of the Hodein shear belt. In the following sections, we describe the internal structures of the mineralized quartz veins and the structural controls of several occurrences, namely: Wadi Khashab, the El-Anbat mine, the Um Teneidab mine, the Urga El–Ryan occurrence, the Hutit mine and the Um Eleiga deposit.

5.1. The Wadi Khashab Occurrence

In the Wadi Khashab area (Figure 14a), the ophiolite slices are overthrust on the arc’s metavolcanic rocks and volcaniclastic metasediments. The serpentinites of Gabal El Beida form a NW-elongated large belt and slices of different sizes tectonically incorporated in the volcaniclastic metasediments. The serpentinites form dissected elongated massive masses with sheared and foliated peripheries. These serpentinite bodies are altered to talc–carbonate rocks along the shear zones. Blocks and masses of ophiolitic metagabbros usually occur within the volcaniclastic metasediments. They locally exhibit weakly developed foliation and compositional layering. Ultramafic rocks are commonly associated with pillow and amygdaloid metabasalts. The metavolcanic rocks are represented by strongly foliated metaandesite, metabasaltic andesite and intermediate to acidic metatuffs [39].
Gold-sulfide mineralization is confined to discrete shear zones of highly silicified, ferruginated metavolcanics and volcaniclastic metasediments commonly associated with sulfide-bearing granophyric dikes and quartz± carbonate veins [39]. The Wadi Khashab zone is a major sinistral strike–slip shear zone, striking NNW–SSE and dipping steeply (65–75°) towards the ENE. Rocks along this shear zone are carbonatized and consist mainly of highly sheared metavolcanics, serpentinites and volcaniclastic metasedimentary rocks. The wall rock alteration is present as strongly foliated flakes in quartz veins and is dominated by the silicification and chloritization associated with carbonate [39,78]. The silicified shear zone (SiO2 > 80%) of the pillow metabasalts is relatively enriched in Au (25–45 ppm) whereas the carbonatized shear zone (SiO2 < 50%) within the obducted area of the serpentinite rocks has a very low Au content (0.24–0.45 ppm) [78]. The samples analyzed by Zoheir [39] yielded 2.1–6.6 ppm Au, and the sulfidized granophyric dikes are also gold-bearing (0.2–2.1 ppm Au).

5.2. The El-Anbat Deposit

The Gabal El-Anbat–Gabal Sirsir belt consists mainly of heterogeneously sheared talc carbonate, carbonatized, serpentinite, ophiolitic metagabbro, pillow metabasalts, and arc metavolcanic and volcaniclastic rocks (Figure 14b). Syn-orogenic metagabbro–diorite, granodiorite and post-orogenic granitoid intrusions are widespread in the study area. The serpentinite occurs as large masses, forming the main body of Gabal Sirsir and small slices incorporated in the volcaniclastic metasedimentary rocks. The serpentinite is variably altered to talc-carbonate and its contacts with the neighboring volcaniclastic metasediments and ophiolitic metagabbro are highly sheared. The gold grade in the quartz-carbonate veins and hydrothermal alteration zones is ~0.3–46 g/t Au [79]. The metavolocanic succession of the Gabal El-Anbat–Gabal Sirsir area comprises variably sheared metabasalt, metabasaltic andesite, meta-andesite, metadacite, and metapyroclastic rocks [80].
In the El-Anbat mine area (23°17′01″ N, 35°09′21″ E), the alteration zones occur as sheets or lenses along the NW- and NNW-striking thrusts, between the carbonatized serpentinite and foliated intermediate metavolcanics (Figure 14b). S2 is a regional foliation in El-Anbat area striking NNW–SSW and dipping moderately or steeply to the ENE and less commonly to the WSW. The F1 folds are still preserved in ophiolitic metagabbros and mafic metavolocanics. The F2 folds are major NNW-trending asymmetric left-stepping folds in the volcaniclastic metasediments. Different styles of minor folds are recognized—open concentric folds, closed tight folds, symmetric and asymmetric folds, isoclinal folds and chevron folds. During D3, Conjugate sinistral and dextral strike–slip faults and shear zones are apparently developed as a component of a major transpression system.
The mineralized shear zones and the bleached sheared host rocks are confined to the steeply dipping thrusts between carbonatized serpentinites and the underlying volcaniclastic metasediments. These zones are characterized by arrays of recrystallized quartz pods, fracture-filling ankerite, sulfidized granitic offshoots, boudinage of the granitic bodies, silicified listvenite masses and intermingling carbonate sericite and malachite veinlets [38], suggesting significant gold grades in the hydrothermally altered, sheared host rocks. The analyses indicate that gold is related to mineralized quartz veins (with up to 7.5 g/t Au) and to pervasively altered wall rocks (with up to 5 g/t Au) [38].

5.3. The Um Teneidab Deposit

The Um Teneidab mine (23°17′01″ N, 35°09′21″ E) is located ~13 km to the southwest of the Hutit mine and to the west of Gabal Um Teneidab peak. The Um Teneidab area is underlain by gneisses and migmatites, serpentinite, volcaniclastic metasediments, and deformed mafic metavolcanic rocks. These rocks are cut by metagabbro–diorite complex (Figure 14c), as well as unmappable masses and offshoots of post-orogenic leucogranites [12,81]. Serpentinite constitutes the main mass of Gabal Um Teneidab and forms blocks and slices of variable sizes incorporated in the volcaniclastic metasediments. The mélange blocks are randomly distributed, varying from cobbles to mountain size and usually oriented in the NWSE or NNW–SSE directions. The gabbroic rocks in the Um Teneidab mine area were mapped as island arc, synorogenic metagabbro–diorite complex [12,82] and as post-orogenic younger gabbros [81]. In the present work, we agree with Hassan and El-Manakhly [82] and Zoheir et al. [12] and consider the gabbroic rocks in the Um Teneidab mine area as a variably foliated, metagabbro–diorite complex.
The Um Teneidab metagabbro–diorite complex is dissected by a number of ENE–WSW and N–S dextral strike–slip faults and WNW–ESE major fractures with no obvious lateral displacement. The zones in which the leucogranites send offshoots into the gabbroic rocks (Figure 14c) are characterized by intense shearing and alteration as well as the presence of abundant quartz veins and felsic dikes. Shearing in the area is predominantly brittle, with little ductile deformation being experienced, with alteration zones and quartz veins that are generally controlled by NW–SE shear/fault sets. The subvertical NW- and NNW-striking milky quartz veins extend up to 250 m with 8 cm to 45 cm thickness and lensoid morphology. These veins are in part or completely recrystallized. The main lode is a zone of stockwork of veinlets (70 cm wide) bordered by hydrothermally altered wall rocks forming together a ~2-m-wide mineralization zone [12]. The gold in these veinlets and the hydrothermally altered wall rocks occurs as fillings in the microfractures and is scattered as sliver in altered pyrite and galena. The gold content ranges from 1 to 30 g/t in quartz veins, whereas the altered wall rocks locally contain ~8 g/t Au [12].

5.4. The Urga El-Ryan Occurrence

The Urga Ryan gold deposit (35°5′0″ E and 23°21′23″ N) is located at ~3 km to the south of the intersection between Wadi Urga Ryan and Wadi Hutib. The area around Wadi Urga El-Ryan (Figure 14d) is underlain by gneisses, volcaniclastic metasediments and mafic to intermediate metavolcanic rocks. The volcaniclastic metasediments include wide varieties of metagreywacke, metamudstone, slate, pelitic schists and metaconglomerate in decreasing order of abundance. They are strongly NW–SE foliated and less commonly NNE–SSW cleaved [48].
The metavolcanics are composed of repeatedly alternating and interfingered successions of basaltic flows together with layered andesite and subordinate dacitic flows and their corresponding metatuffs [48] as well as chlorite schists. The metavolcanic rocks are variably deformed by km-scale shear zones that led to intense shearing in the NNW–SSE direction (S2 and S3), overprinting the WNW–ESE schistosity (S1). The metagabbro is emplaced into both metavolcanics from the northern and western parts and volcaniclastic metasediments from the southern part [48]. The metagabbroic rocks are foliated and sheared, particularly along the shear zones. The syn-orogenic granites are slightly foliated and form an elongated intrusion (10 m × 2.5 m width) trending roughly N–S, which forms discontinuous hills. It is mainly tonalite in composition and is bounded from the west by the Wadi Beitan gneisses, and by metagabbro from the north. Volcaniclastic metasediments and metavolcanics border these rocks from the southeastern side. Xenoliths and roof pendants from metagabbro are enclosed within the syn-orogenic tonalite.
In the Urga El-Ryan occurrence (Figure 14d), the old mining houses spread along the main Wadi Urga Ryan and their tributaries, possibly reflecting significant mine activities. The mineralized regions are limited only to NNW–SSE striking and westward dipping zones of intense shearing in metavolcanic rocks. The quartz vein strikes N–S (355°) concordantly with the shear zone system and dips at 80° E [83]. It was exploited in a deep mine down to a level of 15 m below the surface. These shear zones (up to 40 m in length and 5–30 cm in thickness) are strongly mylonitized and marked by recrystallized quartz lenses and asymmetric boudinaged quartz veins [12]. The narrow zones of sheared wall rocks are characterized variable degrees of hydrothermal alteration. The gold grade is 1 to 7g/t Au in the quartz veins from the Urga El-Ryan occurrence [84].

5.5. Hutit Deposit

The Hutit gold deposit occurs in the Wadi Huzama, which is a small tributary of the larger Wadi Rahaba (Figure 15a). The Hutit mine area is underlain by serpentinite, mafic metavolcanics, volcaniclastic metasediments, ophiolitic metagabbros, syn-orogenic metagabbros and post-orogenic granites (Figure 15a,b) [12,48,82,84,85]. Structurally, the Hutit deposit is controlled by the Rahaba–Sirsir sinistral shear zone and their kilometer-scale imbricate thrust system (Figure 15b). The SW-directed thrusts bound the ophioltic blocks and dip moderately or steeply to the NE. Imbricate slices and sheets of serpentinite are tectonically overlying metavolcanics and volcaniclastic metasediments. The oblique thrust planes accommodate sinistral displacement and asymmetrical anastomosing and kinked fabrics. Asymmetric quartz lenses and drag folds indicate a sinistral sense of shear, whereas subvertical slickensides along the quartz vein walls document the reverse slip of the hanging wall block. Joints and fractures are abundant in the rock units mainly with NE–SW and NW–SE directions. Mafic to felsic dikes (basalt, basaltic andesite, andesite, rhyodacite and dacite) as well as granodiorite dikelike bodies strike NW–SE and less commonly NE–SW.
Two main old mine workings (northern; 23°27′26″ N, 35°11′34″ E and southern; 23°27′16″ N, 35°11′41″ E) (Figure 15b) were mapped at the 1:1000 scale by Hassan and El-Manakhly [82]. The ruins of the separation and grinding plants are still observed in the northern old mine, whereas the loading station, leaching basins and crusher stages were observed in the southern mine. In both mines, a main entrance through a horizontal ~E–W adit leads to the veins at a distance of 20 m or 35 m [12]. The mineralized quartz veins occur along the thrust contact between the serpentinite masses and the mafic metavolcanics and volcaniclastic metasediments. Two types of anastomosing and undulating gold-bearing quartz veins were reported in the mine area, including bluish-gray (common in the northern mine) and milky quartz veins (dominant in the southern mine). Concerning the ore grade, Gabra [84] reported 1–36 g/t in samples from quartz veins the southern mine and 1–40 g/t in quartz veins from the northern mine. Takla et al. [85] reported an average of 20 g/t in samples from the two different types of quartz veins and 8 g/t Au on average in altered wall rocks.

5.6. The Um Eleiga Deposit

The Um Eleiga mine (24°36′44″ N, 35°03′19″ E) occurs ~50 km west of the Red Sea coast. Traces of placer gold workings during Roman–Byzantine and early Islamic times include hundreds of shallow pits, dumps, ancient mining camps, stone anvils, hammers, and grinding mills [12,41,83]. The geology of Um Eleiga area is dominated by a 7 km wide intrusive complex with a gabbroid core cutting the serpentinite-chromitite of Gabal Abu Dahr and the northern part of Wadi Rahaba–Gabal Abu Dahr ophiolitc mélange. The latter composed masses and blocks of serpentinized ultramafics, pillow metabasalts and mafic metavolcanics incorporated within highly tectonised matrix of pelitic and carbonaceous metasediments. The ophiolite fragments occur as NE-dipping slabs and sheets thrusted southwestward forming imbricate thrust system. Contacts of the serpentinized ultamfics with Um Eleiga metagabbros-diorite complex are sharp and irregular. In the upper part of the Abu Dahr massif, serpentinite contains large masses of serpentinized dunite, sills or layers of wehrlite, pyroxenite and gabbro [42,86].
The mafic metavolcanic rocks comprise blocks and thrusted slices of metabasalt and basaltic andesite [42,86]. These rocks structurally overlay the Um Eleiga intrusive metagabbros-diorite complex and Abu Dahr serpentinized ultramafics (Figure 15c). Pillow metabasalt occurs in the core of a major fault-propagation fold (Figure 15c) within the highly tectonized matrix with schists and sheared serpentinite. Pillow metabasalt forms ellipsoidal, globular and tabular shaped bodies, ranging between 10 cm to 1 m in diameter. The Um Eleiga intrusive metagabbro–diorite complex is approximately 7 km long and 4 km across, and encompasses a compositional continuum from gabbro to granodiorite through diorite and subordinate tonalite (Figure 15d). This complex exhibits a circular zonation, in which gabbro occupies the core and subordinate granodiorite forms the margin [41]. The Um Eleiga metagabbro and metabasalt have a tholeiitic to calc-alkaline affinity and are interpreted to have been formed in a forearc setting [42].
In the Um Eleiga mine, the mineralized quartz veins trend mainly NE–SW or ENE–WSW and cut the gabbroic rocks in the central part of the complex and extend beyond the gabbro–diorite boundary [12]. The fault/joint intersections are the main structural control of intensely hydrothermal alteration zones and high gold contents in the central part of the Um Eleiga complex [41]. Late barren quartz veins are confined to intersections of fault and tension gashes in the brecciated gabbro core and trend mainly N–S, NW–SE and E–W (Figure 15d). Sulfide-bearing quartz veins (5–40 cm thick) cut the metagabbro–diorite complex and are partially stopped out [12]. Analyses of quartz dumps in several pits gave gold values up to 28 g/t [82]. According to Takla et al. [85], most of the ancient workings in the mine area were confined to the old terraces (lithified wadi alluvium) within and adjacent to the intensely kaolinitised gabbro. Atomic absorption analyses of heavy concentrates of these old terraces indicated that gold contents were variable from barren to 10 g/t [85].

6. Discussion

6.1. Remote Sensing Targeting of New Gold Occurrences

The Nubian Shield is a typical example of well-exposed crystalline basement rocks, and mafic–carbonate–hydrous mineralogical indices were used to extract the representative pixels in the satellite images. Zoheir et al. [12] used Landsat-8 OLI and ASTER band ratio images and successfully benefited from the effective absorption features of the mafic rock-forming minerals and their metasomatic products. Therefore, Landsat-8 OLI and ASTER data with comprehensive fieldwork were used for mapping geological structures, lithological units and alteration zones associated with orogenic gold mineralization in the study area. The image processing techniques of these remotely sensed data maximize the relatively small differences in the spectral responses of rock forming minerals within a specific wavelength range [87]. The applied approach includes false band combination (FCC), band rationing, principal component and mineralogical indices to the Landsat-8 OLI and ASTER data. It is evident that the band math of Landsat-8 (6/7) distinguished clay minerals, serpentine, and many alteration zones, whereas ASTER (7 + 9/8) demarcated carbonatized rocks, metavolcanics and metasedimentary rocks.
Landsat-8 FCC of Abrams ratio (RGB-6/7, 4/3, 5/4), Kaufmann ratio (RGB-7/5, 5/4, 6/7) and Chica-Olma ratio (RGB-6/7, 6/5, 4/2) characterized the contacts between the different rock units in the study area and upgraded the exciting geologic maps (see Figure 4). Moreover, they deciphered the structural elements especially folding and thrusting in the Wadi Hodein–Beitan shear belt as well as the ENE-dextral strike slip faulting. The RGB of the principal component analysis of Landsat-8 (PC2, PC1, PC4 and PC2, PC4, PC5) and ASTER (PC1, PC2, PC3 and PC6, PC3, PC1) discriminated the rocks consisting of high contents of Al and/or Mg-OH-bearing minerals and emphasized the contact between felsic and basic metavolcanics and volcaniclastic metasediments and gneisses along Wadis Hodein and Beitan (see Figure 5).
The mineralogical indices of Ninomiya [62] (OHI, KLI, CLI and ALI) were used to characterize the alteration zone in the study area using ASTER data. The resultant images highlighted effectively the zone of the hydrothermal alterations. In addition, they stressed the fact that the alteration minerals zones are found in both ductile and brittle deformation zones where the integration between the structural segments (density and direction) associated with the presence of the altered minerals may help to localize and predict new occurrences of gold mineralization. A false-color composite (FCC) ratio image (OHI, KLI, CLI) was generated. This RGB FCC image shows the OH-bearing rocks (meta-ultramafic–mafic ophiolites and island arc meta-basic rocks) and the clay-minerals (see Figure 6). The evaluation of the remote sensing alteration mapping results with field data using an error matrix approach and Kappa Coefficient shows a very good match, which indicates the overall accuracy of 88.33% and the Kappa Coefficient of 0.77 for Landsat-8 data and the overall accuracy of 74.10% and the Kappa Coefficient of 0.65 for ASTER data, respectively (Table 4A,B). It is noticed that the old working gold occurrences are associated with the high deformation and fracturing zones bounding the sheared ophiolitic belt and faulted contacts such as El-Beida, Urga Ryan, Hutit and Um Eleiga gold mines. Multi-source datasets were selected to control factor layers indicating the distribution of gold mineralization potentiality zones such lithology, alteration zones, proximity to existing gold mines, proximity to favorable contacts, proximity to major structures (especially thrusts), faults density maps and lineaments density maps. The seven evidence layers were derived, analyzed, and integrated in a GIS platform to develop the gold mineralization model (see Figure 8).

6.2. Transpressional Tectonics in the Evolution of the Wadi Hodein Shear Belt

The Wadi Hodein shear belt has evolved throughout a multistage deformation history (D1–D4), in which D2 and D3 were the most dominant. NNE–SSW crustal shortening (D1) led to development of early ENE–WSW striking S1 gneissosity and F1 doubly plunging anticline in the Wadi Khuda gneisses. D1 structures in the Wadi Khashab, Wadi El Beida and Gabal Anbat and Gabal Arais areas exhibit WNW-striking S1 schistosity, F1 minor tight, recumbent and overturned folds and T1 thrusts. NE–SW oblique convergence and transpression (D2) led to the development of NW–SE striking S2 regional foliation, S2m mylonitic foliation, F2 major kilometer scale anticlines and synclines (see Figure 10, Figure 11, Figure 12 and Figure 13 and Figure 16a–d) and minor open, asymmetrical to isoclinal folds, NW-plunging stretching and mineral lineations (L2) and WSW-verging major thrusts (T2). The major D2 fabrics are represented by a series of large-scale folds (F2) associated with northwest-vergent foliation (S2), indicating that the F2 folds formed in response to a NW–SE-oriented stress field.
The Wadi Hodein–Beitan shear belt is cut by a suite of variably deformed granitic intrusions. Many of these intrusions occur in the vicinity of the major thrusts and are considered to have emplaced during the regional D2 deformation event. E–W shortening (D3) produced subvertical NNW-Striking foliation (S3), NNW–SSE thrust dominated strike slip shear zones (C3), NNW- and ENE-trending folds (F3). L3a is a SW and SE-plunging stretching lineation along the NNE–SSW T3 minor thrusts. L3b lineation is a crenulation lineation with a subhorizontal plunge. During D3, the major NNW-oriented shear zones rooted into a low-angle, deep crustal detachment, delineating the point at which oblique thrusting is partitioned into separate transpressional strike–slip and reverse-sense shear zones, i.e., Sirsir–Rahaba, Hodien–Beitan and Um Teneidab–Hutit shear zones. The sinistral porphyroclasts and NNW-plunging reclined and vertical folds as well as NE-trending open folds in sheared metavolcanics and volcaniclastic metasediments indicate a transpressive stress regime including both pure and simple compressional components. The latest extensional structures (D4) in Hodein shear belt include major brittle strike slip faults and microfaults and dikes associated with the intrusion of late to post-tectonic granites. Structures assigned to this deformation phase include ENE–WSW dextral and NNE–SSW sinistral strike–slip faults.
The newly produced structures map (see Figure 9) shows that the overall structural setting of the Wadi Hodein shear belt bears a resemblance to an asymmetric flower structures in which the ophiolitic mélange and the ophiolitie blocks are cut and bounded on both sides by reverse-slip faults, and strike–slip shear zones. The eastern (Sirsir–Rahaba and Um Teneidab–Hutit shear zones) and western boundary faults (Hodein–Beitan and Arais shear zones) correspond to a reverse-sinistral thrusts. The transpressional imbricate thrusts forming the Sirsir–Rahaba, Hodein–Beitan and Arais shear zones dip toward ENE, whereas those pertaining to the Um Teneidab-Hutit shear zones dip to WSW (see Figure 9 and Figure 16d). All the shear zones show a moderately sinuous trace in map-view, up to 2 km-thick band of fine-laminated mylonites, developed in the footwall gneisses and volcaniclastic metasediments. The high-angle, NNW-oriented thrust-dominated, strike slip shear zones marked a near-vertical ductile deformation zone rather than an imbricate structure [88,89,90]. The thrusts show a typical sequence of propagation in the footwall of the previous thrust in a piggy-back model. Many kinematic indicators, including asymmetric porphyroblasts such as “σ-type” augens, and pressure shadows, indicate a sinistral sense of shearing. The predominance of reverse slip movement over the along strike shearing suggests a thrust-dominated transpression along the Wadi Hodein shear zone. The NW–SE to NNW–SSE subparallel Sirsir–Rahaba, Hodein–Beitan, Um Teneidab-Hutit and Arais strike–slip shear zones exhibit a consistently sinistral sense of shear.

6.3. Structures Controlling Gold Occurrences

The distribution of the gold occurrences is confined to the margins of the Wadi Hodein shear belt (see Figure 9) especially along the thrust-dominated transpressional major zones and their splays formed during D3. Conjugate sinistral (N) NW–(S) SE and dextral (E)NE–(W)SW strike–slip faults and shear zones apparently developed During D3 as a component of a major transpression system. These conjugate shear zones control the occurrence of gold in Hodein shear belt. Twisting and anastomosing S2 and T2 thrusts led to NE-trending F3 open folds and oblique sinistral shear zones on the pre-existing NW-striking thrusts. The S-C fabrics and asymmetric quartz lenses replicate left-lateral shearing, which resulted in widespread NE–SW-striking dilation bents within and around the shear zones. At the Hutit and El-Anbat mine areas, the mineralized quartz veins and the alteration zones occur along the NW- and NNW-striking thrusts between the carbonatized serpentinite and foliated metavolcanics and the metavolcanics and volcaniclastic metasediments. In the Um Eleiga mine, the mineralized quartz veins trend mainly NE–SW or ENE–WSW mainly along the fault/joint intersections. In the Urga El-Ryan occurrence, the mineralized regions are limited only to NNW–SSE striking and westward dipping zones of intense shearing in metavolcanic rocks. In the Um Teneidab deposit alteration zones and quartz veins are generally controlled by NW–SE shear/fault sets. In the Wadi Khashab occurrence, the quartz veins occur as closely spaced swarms running parallel and subparallel to NNW-trending sinistral strike–slip shear zone of Wadi Khashab.

7. Conclusions

Detailed geological mapping of the Wadi Hodein area was successfully accomplished by employing different processing techniques, i.e., band combinations, band math (BM), Principal Component Analysis (PCA), decorrelation stretch and mineralogical indices, to Landsat-8 OLI, ASTER and ALOS PALSAR data. Field data were integrated with results of the remote sensing studies, which enabled an updated understanding of the structural evolution of the Wadi Hodein–Wadi Beitan shear belt. The structural framework of the Wadi Hodein–Wadi Beitan shear belt was shaped by the superposition of the NW–SE folds (F2) by the NNW-trending, km-scale tight and reclined folds (F3). The overall configuration of the investigated shear belt is identical to that of an asymmetrical flower structure in which the ophiolitic mélange and the ophiolitic blocks are cut and bounded on both sides by reverse slip and strike–slip shear zones. The field studies showed that most of the gold mineralization is mainly associated with quartz veins within extensive sinistral transpressional shear zones assigned to the last ductile deformation event (D3) in the evolution of the entire shear belt. This event was characterized by strong stretching and mylonitic lineation, abundant undulatory shear zones and shear foliation disturbance. The gold-bearing quartz veins are hosted by narrow, steeply SW- and NE-dipping NNW- and NW-trending mylonitic zones that are characterized by a steeply NNW-plunging mineral lineation. This may imply the important role of oblique convergence in the formation of the auriferous quartz veins.
The processing flow chart introduced in this study has identified areas with the potential for unexplored gold occurrences and helped to illustrate the controls of the distribution of gold mineralization sites. The processing results were classified into five categories, from very high to very low potentiality zones. Gold mineralization is here interpreted to show preferential distribution along the Wadi Hodein–Wadi Beitan shear belt. The most important conclusion of this study is that gold mineralization in the Wadi Hodein–Wadi Beitan shear belt was mostly confined to steeply dipping strike–slip shear zones in the marginal parts of the shear belt. The occurrence of gold-bearing quartz veins in central shear zone is not evident so far. A conceptual model for testing new and unexplored targets of gold–quartz veins in the region translates the coincidence of shear zones, alteration and acid dikes to highly potential zones for new and possibly important gold occurrences in the study area.

Supplementary Materials

The following are available online at https://www.mdpi.com/article/10.3390/min11050474/s1: Figure S1: Field photographs showing the different rock units in the study area; (a) and (b) hornblende gneiss alter-nating with bands of biotite gneiss forming ENE-trending ridges along Wadi Khuda, (c) banded amphibolite from Beitan gneisses belt, (d) contact between hornblende gneisses and gneissose granite from Beitan gneisses belt (e) car-bonated ophiolitic serpentinite enclosing small bodies of listivenitized ultramafites (dark ridges) from Wadi Rahaba, (f) small prophyroclast of ophiolitic metagabbro between volcaniclastic metasediment (lower) and serpentinite (up-per) from Wadi Rahaba; Figure S2: Field photographs showing the different rock units in the study area: (a) pillowed metabasalts from Wadi Khuda, northeast of Gabal Abu Dahr; (b) ellipsoidal Pillowed metabasalt from Wadi Hutib; (c) serpentinized peridotites of Gabal Arais thrusted over the Beitan gneisses belt and are intruded by a small mass of alkali feldspar granite; (d) syn-orogneic gabbro-diorite intruded the gneisses of Wadi Khuda; (e) post-orogenic biotite granite intrudes volcaniclastic metasediments along Wadi Rahaba; (f) syn-orogonic granodiorite intrudes volcaniclastic metasediments along Wadi Beitan, 3.1. Data and Processing Techniques; Figure S3: Flowchart of the remote sensing and GIS methodologies adopted in the present study; Figure S4: Lithological discrimination using (a) ASTER (RGB-431) and (b) grey scale ASTER band ratio (7 + 9/8); Figure S5: False-color composite of principal component analysis (PCA) of (a) Landsat-8 RGB-PC2, PC1, PC4 and (b) ASTER RGB-PC1, PC2, PC3; Figure S6: Model Builder of the geospatial thematic maps used to locate the high potential zones for gold mineralization in the study area; Table S1: Eigenvector loadings of principal component analysis for Landsat-8 OLI data; Table S2: Eigenvector loadings of principal component analysis for ASTER data; Section S1: Data and Processing Techniques

Author Contributions

Conceptualization, M.A.E.-W., S.K. and B.Z.; methodology, S.K. and A.B.P.; software, S.K.; validation, S.K., M.A.E.-W. and B.Z.; data curation, S.K.; writing—original draft preparation, M.A.E.-W. and S.K.; writing—review and editing, B.Z. and A.B.P.; supervision, M.A.E.-W.; fieldwork, S.K. and M.A.E.-W., shaping and fine-tuning the conclusions, B.Z. All authors have read and agreed to the published version of the manuscript.

Funding

The present work has received no funding or grant.

Data Availability Statement

The data presented in this study are available on request from the corresponding author.

Acknowledgments

The authors appreciate the help of Mohamed Hamdy and Ismail Thabet (Tanta University, Egypt) during the fieldwork. Additionally, the Institute of Oceanography and Environment (INOS), Universiti Malaysia Terengganu (UMT) is acknowledged.

Conflicts of Interest

The authors declare no conflict of interest.

References

  1. Pour, B.A.; Hashim, M.; van Genderen, J. Detection of hydrothermal alteration zones in a tropical region using satellite remote sensing data: Bau gold field, Sarawak, Malaysia. Ore Geol. Rev. 2013, 54, 181–196. [Google Scholar] [CrossRef]
  2. Pour, B.A.; Hashim, M. Structural geology mapping using PALSAR data in the Bau gold mining district, Sarawak, Malaysia. Adv. Space Res. 2014, 54, 644–654. [Google Scholar] [CrossRef]
  3. Pour, B.A.; Hashim, M.; Marghany, M. Exploration of gold mineralization in a tropical region using Earth Observing-1 (EO1) and JERS-1 SAR data: A case study from Bau gold field, Sarawak, Malaysia. Arab. J. Geosci. 2014, 7, 2393–2406. [Google Scholar] [CrossRef]
  4. Pour, A.B.; Hashim, M.; Makoundi, C.; Zaw, K. Structural Mapping of the Bentong-Raub Suture Zone Using PALSAR Remote Sensing Data, Peninsular Malaysia: Implications for Sedimenthosted/Orogenic Gold Mineral Systems Exploration. Resour. Geol. 2016, 66, 368–385. [Google Scholar] [CrossRef]
  5. Pour, B.A.; Hashim, M. Structural mapping using PALSAR data in the Central Gold Belt, Peninsular Malaysia. Ore Geol. Rev. 2015, 64, 13–22. [Google Scholar] [CrossRef] [Green Version]
  6. Pour, A.B.; Hashim, M. Application of Landsat-8 and ALOS-2 data for structural and landslide hazard mapping in Kelantan, Malaysia. Nat. Hazards Earth Syst. Sci. 2017, 17, 1285. [Google Scholar] [CrossRef] [Green Version]
  7. Zoheir, B.; Emam, A. Field and ASTER imagery data for the setting of gold mineralization in Western Allaqi–Heiani belt, Egypt: A case study from the Haimur deposit. J. Afr. Earth Sci. 2014, 99, 150–164. [Google Scholar] [CrossRef]
  8. Pour, A.B.; Park, T.-Y.; Park, Y.; Hong, J.K.; Muslim, A.M.; Läufer, A.; Crispini, L.; Pradhan, B.; Zoheir, B.; Rahmani, O.; et al. Landsat-8, Advanced Spaceborne Thermal Emission and Reflection Radiometer, and WorldView-3 Multispectral Satellite Imagery for Prospecting Copper-Gold Mineralization in the Northeastern Inglefield Mobile Belt (IMB), Northwest Greenland. Remote Sens. 2019, 11, 2430. [Google Scholar] [CrossRef] [Green Version]
  9. Kusky, T.M.; Ramadan, T.M. Structural controls on Neoproterozoic mineralization in the South Eastern Desert, Egypt: An integrated field, Landsat TM and SIR-C/X SAR approach. J. Afr. Earth Sci. 2002, 35, 107–121. [Google Scholar] [CrossRef]
  10. Zoheir, B.; Emam, A.; El-Amawy, M.; Abu-Alam, T. Auriferous shear zones in the central Allaqi-Heiani belt: Orogenic gold in post-accretionary structures, SE Egypt. J. Afr. Earth Sci. 2018, 146, 118–131. [Google Scholar] [CrossRef]
  11. Zoheir, B.A.; Emam, A.; Abd El-Wahed, M.; Soliman, N. Gold endowment in the evolution of the Allaqi-Heiani suture, Egypt: A synthesis of geological, structural, and space-borne imagery data. Ore Geol. Rev. 2019, 110, 102938. [Google Scholar] [CrossRef]
  12. Zoheir, B.; Emam, A.; Abdel-Wahed, M.; Soliman, N. Multispectral and Radar Data for the Setting of Gold Mineralization in the South Eastern Desert, Egypt. Remote Sens. 2019, 11, 1450. [Google Scholar] [CrossRef] [Green Version]
  13. Hunt, G.R. Spectral Signatures of Particulate Minerals in The Visible and Near Infrared. Geophysics 1977, 42, 501–513. [Google Scholar] [CrossRef] [Green Version]
  14. Clark, R.N.; King, T.V.V.; Klejwa, M.; Swayze, G.A.; Vergo, N. High spectral resolution reflectance spectroscopy of minerals. J. Geophys. Res. 1990, 95, 12653–12680. [Google Scholar] [CrossRef] [Green Version]
  15. Hassan, S.M.; Sadek, M.F. Geological mapping and spectral based classification of basement rocks using remote sensing data analysis: The Korbiai-Gerf nappe complex, South Eastern Desert, Egypt. J. Afr. Earth Sci. 2017, 134, 404–418. [Google Scholar] [CrossRef]
  16. Irons, J.R.; Dwyer, J.L.; Barsi, J.A. The next Landsat satellite: The Landsat Data Continuity Mission. Remote Sens. Environ. 2012, 145, 154–172. [Google Scholar] [CrossRef] [Green Version]
  17. Roy, D.P.; Wulder, M.A.; Loveland, T.A.; Woodcock, C.E.; Allen, R.G.; Anderson, M.C.; Helder, D.; Irons, J.R.; Johnson, D.M.; Kennedy, R.; et al. Landsat-8: Science and product vision for terrestrial global change research. Remote Seins. Environ. 2014, 145, 154–172. [Google Scholar] [CrossRef] [Green Version]
  18. Pour, A.B.; Sekandari, M.; Rahmani, O.; Crispini, L.; Läufer, A.; Park, Y.; Hong, J.K.; Pradhan, B.; Hashim, M.; Hossain, M.S.; et al. Identification of Phyllosilicates in the Antarctic Environment Using ASTER Satellite Data: Case Study from the Mesa Range, Campbell and Priestley Glaciers, Northern Victoria Land. Remote Sens. 2021, 13, 38. [Google Scholar] [CrossRef]
  19. Sekandari, M.; Masoumi, I.; Beiranvand Pour, A.; Muslim, A.M.; Rahmani, O.; Hashim, M.; Zoheir, B.; Pradhan, B.; Misra, A.; Aminpour, S.M. Application of Landsat-8, Sentinel-2, ASTER and WorldView-3 Spectral Imagery for Exploration of Carbonate-Hosted Pb-Zn Deposits in the Central Iranian Terrane (CIT). Remote Sens. 2020, 12, 1239. [Google Scholar] [CrossRef] [Green Version]
  20. Shirmard, H.; Farahbakhsh, E.; Beiranvand Pour, A.; Muslim, A.M.; Müller, R.D.; Chandra, R. Integration of Selective Dimensionality Reduction Techniques for Mineral Exploration Using ASTER Satellite Data. Remote Sens. 2020, 12, 1261. [Google Scholar] [CrossRef] [Green Version]
  21. Takodjou Wambo, J.D.; Pour, A.B.; Ganno, S.; Asimow, P.D.; Zoheir, B.; Reis Salles, R.D.; Nzenti, J.P.; Pradhan, B.; Muslim, A.M. Identifying high potential zones of gold mineralization in a sub-tropical region using Landsat-8 and ASTER remote sensing data: A case study of the Ngoura-Colomines goldfield, eastern Cameroon. Ore Geol. Rev. 2020, 122, 103530. [Google Scholar] [CrossRef]
  22. Pour, A.B.; Park, Y.; Crispini, L.; Läufer, A.; Kuk Hong, J.; Park, T.-Y.S.; Zoheir, B.; Pradhan, B.; Muslim, A.M.; Hossain, M.S.; et al. Mapping Listvenite Occurrences in the Damage Zones of Northern Victoria Land, Antarctica Using ASTER Satellite Remote Sensing Data. Remote Sens. 2019, 11, 1408. [Google Scholar] [CrossRef] [Green Version]
  23. Abrams, M.; Yamaguchi, Y. Twenty Years of ASTER Contributions to Lithologic Mapping and Mineral Exploration. Remote Sens. 2019, 11, 1394. [Google Scholar] [CrossRef] [Green Version]
  24. Abrams, M.; Tsu, H.; Hulley, G.; Iwao, K.; Pieri, D.; Cudahy, T.; Kargel, J. The Advanced Spaceborne Thermal Emission and Reflection Radiometer (ASTER) after Fifteen Years: Review of Global Products. Int. J. Appl. Earth Obs. Geoinf. 2015, 38, 292–301. [Google Scholar] [CrossRef]
  25. Paillou, P.; Lopez, S.; Farr, T.; Rosenqvist, A. Mapping subsurface geology in Sahara using L-Band SAR: First results from the ALOS/PALSAR imaging Radar. IEEE J. Sel. Top. Appl. Earth Obs. Remote Sens. 2010, 3, 632–636. [Google Scholar] [CrossRef]
  26. Rosenqvist, A.; Shimada, M.; Watanabe, M.; Tadono, T.; Yamauchi, K. Implementation of systematic data observation strategies for ALOS PALSAR, PRISM andAVNIR-2. In Proceedings of the 2004 IEEE International Geoscience and Remote Sensing Symposium, Anchorage, AK, USA, 20–24 September 2004. [Google Scholar]
  27. Abd El-Wahed, M.; Hamimi, Z. The Infracrustal Rocks in the Egyptian Nubian Shield: An Overview and Synthesis. In The Geology of the Egyptian Nubian Shield; Regional Geology, Reviews; Hamimi, Z., Arai, S., Fowler, A.R., El-Bialy, M.Z., Eds.; Springer: Berlin/Heidelberg, Germany, 2021. [Google Scholar] [CrossRef]
  28. Abd El-Wahed, M.A. Thrusting and transpressional shearing in the Pan-African nappe southwest El-Sibai core complex, Central Eastern Desert, Egypt. J. Afr. Earth Sci. 2008, 50, 16–36. [Google Scholar] [CrossRef]
  29. Abd El-Wahed, M.A.; Harraz, H.Z.; El-Behairy, M.H. Transpressional imbricate thrust zones controlling gold mineralization in the Central Eastern Desert of Egypt. Ore Geol. Rev. 2016, 78, 424–446. [Google Scholar] [CrossRef]
  30. Abd El-Wahed, M.A.; Kamh, S.Z.; Ashmway, M.; Shebl, A. Transpressive Structures in the Ghadir Shear Belt, Eastern Desert, Egypt: Evidence for Partitioning of Oblique Convergence in the Arabian Nubian Shield during Gondwana Agglutination. Acta Geol. Sin. 2019. [Google Scholar] [CrossRef]
  31. Hamimi, Z.; Abd El-Wahed, M.A. Suture(s) and Major Shear Zones in the Neoproterozoic Basement of Egypt. In The Geology of Egypt; Regional Geology Reviews; Hamimi, Z., El-Barkooky, A., Martínez Frías, J., Fritz, H., Abd El-Rahman, Y., Eds.; Springer: Berlin/Heidelberg, Germany, 2020; pp. 153–189. [Google Scholar] [CrossRef]
  32. Abd El-Wahed, M.A.; Kamh, S.Z. Pan-African dextral transpressive duplex and flower structure in the Central Eastern Desert of Egypt. Gondwana Res. 2010, 18, 315–336. [Google Scholar] [CrossRef]
  33. Fritz, H.; Wallbrecher, E.; Khudeir, A.A.; Abu El Ela, F.; Dallmeyer, D.R. Formation of Neoproterozoic core complexes during oblique convergence (Eastern Desert, Egypt). J. Afr. Earth Sci. 1996, 23, 311–329. [Google Scholar] [CrossRef]
  34. Greiling, R.O.; Abdeen, M.M.; Dardir, A.A.; El Akhal, H.; El Ramly, M.F.; Kamal El Din, G.M.; Osman, A.F.; Rashwan, A.A.; Rice, A.H.; Sadek, M.F. A structural synthesis of the Proteorozoic Arabian-Nubian Shield in Egypt. Geol. Rundsch. 1994, 83, 484–501. [Google Scholar] [CrossRef]
  35. Asran, A.M.H.; Kamal El-Din, G.M.; Akawy, A. Petrochemistry and tectonic significance of gneiss amphibolite-migmatite association of Khuda metamorphic core complex, Southeastern Desert, Egypt. In Proceedings of the 5th International Conference of the Arab World, Cairo University, Cairo, Egypt, 21–24 February 2000; pp. 15–34. [Google Scholar]
  36. El Amawy, M.A.; Wetait, M.A.; El Alfy, Z.S.; Shweel, A.S. Geology, geochemistry and structural evolution of Wadi Beida area, south Eastern Desert, Egypt. Egypt J. Geol. 2000, 44, 65–84. [Google Scholar]
  37. Abdeen, M.M.; Sadek, M.F.; Greiling, R.O. Thrusting and multiple folding in the Neoproterozoic Pan-African basement of Wadi Hodein area, south Eastern Desert, Egypt. J. Afr. Earth Sci. 2008, 52, 21–29. [Google Scholar] [CrossRef]
  38. Zoheir, B. Transpressional zones in ophiolitic mélange terranes: Potential exploration targets for gold in the South Eastern Desert, Egypt. J. Geochem. Explor. 2011, 111, 23–38. [Google Scholar] [CrossRef]
  39. Zoheir, B.A. Lode-gold mineralization in convergent wrench structures: Examples from South Eastern Desert, Egypt. J. Geochem. Explor. 2012, 114, 82–97. [Google Scholar] [CrossRef]
  40. Nano, L.; Kontny, A.; Sadek, M.F.; Greiling, R.O. Structural evolution of metavolcanics in the surrounding of the gold mineralization at El Beida, South Eastern Desert, Egypt. Ann. Geol. Surv. Egypt 2002, 25, 1122. [Google Scholar]
  41. Zoheir, B.A.; Qaoud, N.N. Hydrothermal alteration geochemistry of the Betam gold deposit, south Eastern Desert, Egypt: Mass-volume-mineralogical changes and stable isotope systematics. Appl. Earth Sci. 2008, 117, 55–76. [Google Scholar] [CrossRef]
  42. Gahlan, H.A.; Mokhles, K.; Azer, M.K.; Khalil, A.E.S. The Neoproterozoic Abu Dahr ophiolite, South Eastern Desert, Egypt: Petrological characteristics and tectonomagmatic evolution. Min. Pet. 2015, 109, 611–630. [Google Scholar] [CrossRef]
  43. Khedr, M.Z.; Arai, S. Chemical variations of mineral inclusions in Neoproterozoic high-Cr chromitites from Egypt: Evidence of fluids during chromitite genesis. Lithos 2016, 240–243, 309–326. [Google Scholar] [CrossRef]
  44. Ahmed, A.H. Highly depleted harzburgite-dunite-chromitite complexes from the Neoproterozoic ophiolite, south Eastern Desert, Egypt: A possible recycled upper mantle lithosphere. Precambrian Res. 2013, 233, 173–192. [Google Scholar] [CrossRef]
  45. Ghoneim, M.F.; Lebda, E.M.; Nasr, B.B.; Khedr, M.Z. Geology and Tectonic Evolution of the Area around Wadi Arais, Southern Eastern Desert, Egypt. In Proceedings of the Six International Conference on Geology of the Arab World, Cairo University, Cairo, Egypt, 11–14 February 2002; Volume 1, pp. 45–66. [Google Scholar]
  46. Raslan, M.F.; Ali, M.A.; El-Feky, M.G. Mineralogy and radioactivity of pegmatites from South Wadi Khuda area, Eastern Desert, Egypt. Chin. J. Geochem. 2010, 29, 343–354. [Google Scholar] [CrossRef]
  47. Asran, A.M.; Hassan, S. Remote sensing-based geological mapping and petrogenesis of Wadi Khuda Precambrian rocks, South Eastern Desert of Egypt with emphasis on leucogranite. Egypt. J. Remote Sens. Space Sci. 2021, 24, 15–27. [Google Scholar] [CrossRef]
  48. El-Baraga, M.H. Geological and Mineralogical and Geochemical Studies on the Precambrian Rocks around Wadi Rahaba, South Eastern Desert, Egypt. Ph.D. Thesis, Geology Department, Faculty of Science, Tanta University, Tanta, Egypt, 1993; 247p. [Google Scholar]
  49. Sabins, F.F. Remote Sensing Principles and Interpretation; W. H. Freeman Company: New York, NY, USA, 1997; pp. 366–371. [Google Scholar]
  50. Segal, D.B. Use of Landsat Multispectral Scanner Data for Definition of Limonitic Exposures in Heavily Vegetated Areas. Econ. Geol. 1983, 78, 711–722. [Google Scholar] [CrossRef]
  51. Canbaz, O.; Gürsoy, Ö.; Gökce, A. Detecting Clay Minerals in Hydrothermal Alteration Areas with Integration of ASTER Image and Spectral Data in Kösedag-Zara (Sivas), Turkey. J. Geol. Soc. India 2018, 91, 483–488. [Google Scholar] [CrossRef]
  52. Singh, A.; Harrison, A. Standardized principal components. Int. J. Remote Sens. 1985, 6, 883–896. [Google Scholar] [CrossRef]
  53. Gupta, R.P.; Tiwari, R.K.; Saini, V.; Srivastava, N.A. Simplified approach for interpreting principal component images. Adv. Remote Sens. 2013, 2, 111–119. [Google Scholar] [CrossRef] [Green Version]
  54. Loughlin, W.P. Principal components analysis for alteration mapping. Photogramm. Eng. Remote Sens. 1991, 57, 1163–1169. [Google Scholar]
  55. Crosta, A.P.; Souza Filho, C.R.; Azevedo, F.; Brodie, C. Targeting key alteration 648 minerals in epithermal deposits in Patagonia, Argentina, using ASTER imagery and principal component analysis. Inter. J. Remote Sens. 2003, 24, 4233–4240. [Google Scholar] [CrossRef]
  56. Ninomiya, Y.; Fu, B.; Cudhy, T.J. Detecting lithology with Advanced Spaceborne Thermal Emission and Refection Radiometer (ASTER) multispectral thermal infrared “radiance-at-sensor” data. Remote Sens. Environ. 2005, 99, 127–135. [Google Scholar] [CrossRef]
  57. Gad, S.; Kusky, T.M. ASTER spectral ratioing for lithological mapping in the Arabian-Nubian Shield, the Neoproterozoic Wadi Kid area, Sinai, Egypt. Gondwana Res. 2007, 11, 326–335. [Google Scholar] [CrossRef]
  58. Gad, S.; Kusky, T.M. Lithological mapping in the Eastern Desert of Egypt, the Barramiya area, using Landsat thematic mapper (TM). J. Afr. Earth Sci. 2006, 44, 196–202. [Google Scholar] [CrossRef]
  59. Hassan, S.M.; Sadek, M.F.; Greiling, R.O. Spectral analyses of basement rocks in El-Sibai-Umm Shaddad area, Central Eastern Desert, Egypt using ASTER thermal infrared data. Arab. J. Geosci. 2014, 8, 6853–6865. [Google Scholar] [CrossRef]
  60. Gabr, S.S.; Hassan, S.M.; Sadek, M.F. Prospecting for new gold-bearing alteration zones at El-Hoteib area, South Eastern Desert, Egypt, using remote sensing data analysis. Ore Geol. Rev. 2015, 71, 1–13. [Google Scholar] [CrossRef]
  61. Sadek, M.F.; Ali-Bik, M.W.; Hassan, S.M. Late Neoproterozoic basement rocks of Kadabora-Suwayqat area, Central Eastern Desert, Egypt: Geochemical and remote sensing characterization. Arab. J. Geosci. 2015, 8, 10459–10479. [Google Scholar] [CrossRef]
  62. Ninomiya, Y. A Stabilized Vegetation Index and Several Mineralogic Indices Defined for ASTER VNIR and SWIR Data. In Proceedings of the IEEE 2003 International Geosciences and Remote Sensing Symposium (IGARSS ’03), Toulouse, France, 21–25 July 2003; Volume 3, pp. 1552–1554. [Google Scholar]
  63. Bannari, A.; El-Battay, A.; Saquaque, A.; Miri, A. PALSAR-FBS L-HH Mode and Landsat-TM Data Fusion for Geological Mapping. Adv. Remote Sens. 2016, 5, 246–268. [Google Scholar] [CrossRef] [Green Version]
  64. Mars, J.C.; Rowan, L.C. Mapping Phyllic and Argillic-Altered Rocks in Southeastern Afghanistan Using Advanced Spaceborne Thermal Emission and Reflection Radiometer (ASTER) Data. USGS Open-File Rep. 2007. [Google Scholar] [CrossRef]
  65. Lang, F.; Yang, J.; Li, D. Adaptive-window polarimetric SAR image speckle filtering based on a homogeneity measurement. IEEE Trans. Geosci. Remote Sens. 2015, 53, 5435–5446. [Google Scholar] [CrossRef]
  66. Arnous, M.; El-Rayes, A.; Geriesh, M.; Ghodeif, K.; Al-Oshari, F. Groundwater potentiality mapping of tertiary volcanic aquifer in IBB basin, Yemen by using remote sensing and GIS tools. J. Coast. Conserv. 2020, 24–27. [Google Scholar] [CrossRef]
  67. Abuzied, S.; Kaiser, M.; Shendi, E.; Abdel-Fattah, M. Multi-criteria decision support for geothermal resources exploration based on remote sensing, GIS and geophysical techniques along the Gulf of Suez coastal area, Egypt. Geothermics 2020, 88, 101893. [Google Scholar] [CrossRef]
  68. Abuzied, S.M.; Alrefaee, H.A. Spatial prediction of landslide-susceptible zones in El-Qaá area, Egypt, using an integrated approach based on GIS statistical analysis. Bull. Int. Assoc. Eng. Geol. 2018, 78, 2169–2195. [Google Scholar] [CrossRef]
  69. Naghibi, S.A.; Pourghasemi, H.R.; Pourtaghi, Z.S.; Rezaei, A. Groundwater qanat potential mapping using frequency ratio and Shannon’s entropy models in the Moghan watershed, Iran. Earth Sci Inf. 2015, 8, 171–186. [Google Scholar] [CrossRef]
  70. Kirubakaran, M.; Johnny, J.C.; Ashokraj, C.; Arivazhagan, S. A geostatistical approach for delineating the potential groundwater recharge zones in the hard rock terrain of Tirunelveli taluk, Tamil Nadu, India. Arab J. Geosci. 2016, 9, 382. [Google Scholar] [CrossRef]
  71. Arnous, M.O. Groundwater potentiality papping of hard-rock terrain in arid regions using geospatial modelling: Example fromWadi Feiran basin, South Sinai, Egypt. Hydrogeol. J. 2016, 24, 1375–1392. [Google Scholar] [CrossRef]
  72. Das, S.; Gupta, A.; Ghosh, S. Exploring groundwater potential zones using MIF technique in semi-arid region: A case study of Hingoli district, Maharashtra. Spat. Inf. Res. 2018, 25, 749–756. [Google Scholar] [CrossRef]
  73. Mekki, O.A.E.; Laftouhi, N. Combination of a geographic system and remote sensing data to map groundwater recharge potential in arid and semi-arid areas: The Haouz plain, Morocco. Earth Sci. Inf. 2016, 9, 465–479. [Google Scholar] [CrossRef]
  74. Hamimi, Z.; Abd El-Wahed, M.; Gahlan, H.A.; Kamh, S.Z. Tectonics of the Eastern Desert of Egypt: Key to understanding the Neoproterozoic evolution of the Arabian-Nubian Shield (East African Orogen). In Geology of the Arab World—An Overview; Bendaoud, A., Hamimi, Z., Hamoudi, M., Djemai, S., Zoheir, B., Eds.; Springer Geology: Berlin/Heidelberg, Germany, 2019; pp. 1–81. [Google Scholar] [CrossRef]
  75. Abdel-Karim, A.M.; El-Mahallawi, M.M.; Finger, F. The ophiolite mélange of Wadi Dunqash and Arayis, Eastern Desert of Egypt: Petrogenesis and tectonic evolution. Acta Miner. Petrogr. Szeged 1996, 36, 129–141. [Google Scholar]
  76. Ramadan, T.M.; Kontny, A. Mineralogical and structural characterization of alteration zones detected by orbital remote sensing at Shalatein District, SE Desert, Egypt. J. Afr. Earth Sci. 2004, 40, 89–99. [Google Scholar] [CrossRef]
  77. Ren, D.; Abdelsalam, M.G. Tracing along-strike structural continuity in the Neoproterozoic Allaqi-Heiani Suture, southern Egypt using principal component analysis (PCA), fast Fourier transform (FFT), and redundant wavelet transform (RWT) of ASTER data. J. Afr. Earth Sci. 2006, 44, 181–195. [Google Scholar] [CrossRef]
  78. Obeid, M.A.; Hussein, A.M.; Abdallah, M.A. Shear zone-hosted goldmineralization in the Late Proterozoic rocks of El Beida area, south Eastern Desert, Egypt. Trans. Inst. Min. Metall. (Sect. B Appl. Earth Sci.) 2001, 110, 192–204. [Google Scholar] [CrossRef]
  79. Ramadan, T.M. Geological and Geochemical Studies on some Basement Rocks at Wadi Hodein Area, South Eastern Desert, Egypt. Ph.D. Thesis, Geology Department, Faculty of Science, Cairo, Egypt, 1994. [Google Scholar]
  80. Obeid, M.A. The Pan-African arc-related volcanism of the Wadi Hodein area, south Eastern Desert, Egypt: Petrological and geochemical constraints. J. Afr. Earth Sci. 2006, 44, 383–395. [Google Scholar] [CrossRef]
  81. Hamimi, Z.; Sakran, S. Boudinage structures in Um Teneidbah area, southern Eastern Desert, Egypt: Dynamic and paleostrain analysis. Egypt J. Geol. 2001, 45, 37–49. [Google Scholar]
  82. Hassan, O.A.; El-Manakhly, M.M. Gold deposits in the southern Eastern Desert, Egypt. In A Commodity Package; Egyptian Geological Survey and Mining Authority: Cairo, Egypt, 1986. [Google Scholar]
  83. Klemm, R.; Klemm, D. Gold and Gold Mining in Ancient Egypt and Nubia, Geoarchaeology of the Ancient Gold Mining Sites in the Egyptian and Sudanese Eastern Deserts; Springer: Berlin/Heidelberg, Germany, 2013; 663p. [Google Scholar]
  84. Gabra, S.Z. Gold in Egypt: A Commodity Package; Geological Survey of Egypt: Cairo, Egypt, 1986; 86p.
  85. Takla, M.A.; El Dougdoug, A.A.; Gad, M.A.; Rasmay, A.H.; El Tabbal, H.K. Gold-bearing quartz veins in mafic and ultramafic rocks, Hutite and Um Tenedba, south Eastern Desert, Egypt. Ann. Geol. Surv. Egypt 1995, 20, 411–432. [Google Scholar]
  86. Ashmawy, M.H. The Ophiolitic Me’lange of the South Eastern Desert of Egypt: Remote Sensing Fieldwork and Petrographic Investigations. Ph.D. Thesis, Berliner Geowiss. Abh., Berlin, Germany, 1987; 135p. [Google Scholar]
  87. Kokaly, R.F.; Clark, R.N.; Swayze, G.A.; Livo, K.E.; Hoefen, T.M.; Pearson, N.C.; Klein, A.J. USGS Spectral Library Version 7 (No. 1035); US Geological Survey: Washington, DC, USA, 2017.
  88. Tavarnellia, E.; Holdsworthb, R.E.; Cleggb, P.; Jonesc, R.R.; McCaffrey, K.J.W. The anatomy and evolution of a transpressional imbricate zone, Southern Uplands, Scotland. J. Struct. Geol. 2004, 26, 1341–1360. [Google Scholar] [CrossRef]
  89. Schreurs, G.; Giese, J.; Berger, A.; Gnos, E. A new perspective on the significance of the Ranotsara shear zone in Madagascar. Int. J. Earth Sci. 2009, 99, 1827–1847. [Google Scholar] [CrossRef]
  90. Peixoto, E.; Pedrosa-Soares, A.C.; Alkmim, F.F.; Dussin, I.A. A suture–related accretionary wedge formed in the Neoproterozoic Araçuaí orogen (SE Brazil) during Western Gondwanaland assembly. Gondwana Res. 2015, 27, 878–896. [Google Scholar] [CrossRef] [Green Version]
Figure 1. Distribution of the known gold mining sites and gold quartz vein occurrences relative to the major fault/shear structures and ophiolitic masses in the South Eastern Desert terrane (modified after [11]). Inset shows a location map of the study area.
Minerals 11 00474 g001
Figure 2. Geological map of Wadi Hodein–Beitan shear belt (complied and modified from [36,37,38,39]).
Minerals 11 00474 g002
Figure 3. Lithological discrimination using (a) Landsat-8 (RGB-753) and (b) grey scale Landsat-8 band ratio (6/7). Abbreviation: Gn = Gneisses and migmatites, S = Serpentinites, Omg = Ophiolitic metagabbros, Ms = Metasedimentary ophiolitic mélange matrix, Mv = Island arc association, Gt = gabbro-tonalite-granodiorite complex, Sg = Syn-tectonic granitoids, Pg = Post-tectonic granitoids.
Minerals 11 00474 g003
Figure 4. Spectral discrimination of ophiolites and related rocks using processed Landsat-8 (a) Abrams ratio (RGB-6/7, 4/3, 5/4), (b) Chica-Olma ratio (RGB-6/7, 6/5, 4/2) and (c) Kaufmann ratio (RGB-7/5, 5/4, 6/7). (d) Decorrelation stretching to (7-6-5).
Minerals 11 00474 g004
Figure 5. False-color composite of principal component analysis (PCA) of (a) Landsat-8 RGB-PC2, PC4, PC5 and (b) ASTER RGB-PC6, PC3, PC1.
Minerals 11 00474 g005
Figure 6. Grey scale ASTER band ratio images representing different mineral indices (a) OHI, (b) KLI (c) CLI and (d) Fused FCC RGB-OHI, KLI, CLI highlights the alteration zones.
Minerals 11 00474 g006
Figure 7. Lineaments extraction using processed PALSAR data (a) PCA of enhanced Lee filter of HH, HV, HH + HV in RGB-PC1, PC2, PC3, (b) PC1 highlights lineaments features, (c) the extracted lineaments dropped over PC1 with inset azimuth-frequency diagram and (d) lineament density map.
Minerals 11 00474 g007
Figure 8. Gold mineralization potential zones (G.M.P.Z) map of the study area.
Minerals 11 00474 g008
Figure 9. Structural map of the Wadi Hodein shear belt.
Minerals 11 00474 g009
Figure 10. Field photographs of structural elements in the study area: (a) gneissosity (S1) in Khuda gneisses defined by the graiN–Shape preferred orientation of quartz–feldspar aggregates, hornblende and biotite; (b–d) NNW-plunging, reclined and overturned and recumbent F2 folds and refolded quartz vein in volcaniclastic metasediments of Wadi Rahaba; (e) asymmetrical “shearband-type” boudinaged quartz veins in volcaniclastic metasediments around Urga gold occurrence; (f) Ptygmatic folds in Beitan gneisses; (g) Major F2 asymmteric anticline in volcaniclastic metasediments, Wadi Rahaba; (h) SW-verging volcaniclastic metasediments thrust over Beitan gneisses belt, south of Gabal Arais; (i) NE-verging serpentinite thrust over volcaniclastic metasediments, Wadi Rahaba.
Minerals 11 00474 g010
Figure 11. (a,d,g) Landsat-8 OLI band composites RGB-753, (b,e,h) Landsat-8 OLI band ratio RGB-7/6, 6/5, 4/2 highlighted the different folding types and trends, and (c,f,i) the resultant interpretation maps of the different fold generations (thin lines for foliation trajectories and red arrows lines are interpreted fold axial traces and major faults (black lines). Gn; gneisses, S; serpentinites, VCM; volcaniclastic metasediments, MV; metavolcanics, SG; syn-orogenic granites, GD; metagabbro–diorite complex, PG, post-tectonic granite.
Minerals 11 00474 g011
Figure 12. (a,d) Landsat-8 OLI band composites RGB-753, (b,e) Landsat-8 OLI band ratio RGB-7/6, 6/5, 4/2 highlighted ENE–WSW strike slip faults dissected the island arc metavolcanics, (c) the resultant interpretation maps of the different fold generations (thin lines for foliation trajectories and red arrows lines are interpreted fold axial traces and major faults (black lines) and (f) Landsat-8 PC3 shows the ENE–WSW dextral strike–slip faults cutting across pre-existing structures and controlling the drainage system. S; serpentinites, VCM; volcaniclastic metasediments, MV; metavolcanics, SG; syn-orogenic granites, GD; metagabbro–diorite complex, PG, post-tectonic granite.
Minerals 11 00474 g012
Figure 13. Field photographs of structural elements in the study area: (a) Foliation-parallel shearband boudins of quartz along S2 foliation in volcaniclastic metasediments,Wadi Rahaba, indicating sinistral transpressive shearing along thrust planes, (b) Metagabbro prophyroclast in volcaniclastic metasediments indicating top-to NE sense of movement along thrust planes, Wadi Beitan, (c) Asymmetrical folds and shearband boudins of quartz veins along S2 foliation in volcaniclastic metasediments, Wadi Rahaba, indicating top-to NE sense of movement along thrust planes, (d) Strike–slip shear zones appear as steep ductile zones in sheared metavolcanics which sheared the S2 foliation. S3 foliation strike N20–30° W with steep dip toward the SW, Wadi Beitan, (e) Crenulation lineation in metasedisment with a subhorizontal plunge to the NNW, (f) Asymmetric tight and reclined folds in volcaniclastic metasediments, south of Gabal Abu Darh, indicating sinistral sense of shearing, (g,h) Quartz and metagabbro asymmetric prophyroclast in volcaniclastic metasediments, Wadi Um Teneidab and Wadi Rahaba, (i) en-echelon folded quartz veins in schistose metavolcanics, Wadi Hutib, indicating sinistral sense of shearing.
Minerals 11 00474 g013
Figure 14. (a) Geological map of the Wadi El Beida–Wadi Khashab area (modified from Zoheir [39]); (b) geological map of Gabal El-Anbat–Wadi Hodein area (modified from [38]); (c) geological map of Um Teneidab area (modified from Hamimi and Sakran, [81]); and (d) geological map of Wadi Urga El Rayan area (modified from El Baraga, [48]).
Minerals 11 00474 g014
Figure 15. (a) Geological map of the Hutit gold mine and surroundings, (modified after from Hassan and El-Manakhly [82]; Zoheir et al. [12]), (b) Detailed geological map of the main lode in the northern mine and southern mine (modified after Zoheir et al. [12]). (c) Geological map of Abu Dahr ophiolite (modified from Ashmawy, [86]), and (d) Geological map of the Um Eleiga gold mine (modified from Zoheir et al. [41]).
Minerals 11 00474 g015
Figure 16. (ac) F2 folds superimposed by the upright open F3 folds in the Wadi Hodein shear belt (Wadi Hodein, Wadi El Beida and Wadi Khashab areas). (d) Sketch block diagram illustrating the structural evolution of the Wadi Hodein shear belt.
Minerals 11 00474 g016
Table 1. Characteristics of the Landsat-8 OLI/TIRS and ASTER data [16,17].
Landsat-8 (OLI/TIRS)Wavelength (µm)ASTERWavelength (µm)Band
BandResolution (m)Resolution (m)
Band 130 Costal/Aerosol0.435–0.451150.52–0.6Band1
Band 230 Blue0.452–0.512150.63–0.69Band 2
Band 330 Green0.533–0.590150.76–0.86Band 3
Band 430 Red0.636–0.673301.60–1.70Band 4
Band 530 NIR0.851–0.879302.145–2.185Band 5
Band 630 SWIR-11.566–1.651302.185–2.225Band 6
Band 730 SWIR-22.107–2.294302.235–2.285Band 7
Band 815 Pan0.503–0.676302.295–2.365Band 8
Band 930 Circus1.363–1.384302.360–2.430Band 9
band10100 TIR-110.60–11.19908.125–8.475Band 10
band11100 TIR-211.50–12.51908.475–8.825Band 11
---908.925–8.275Band 12
---9010.25–10.95Band 13
---9010.95–11.65Band 14
Table 2. Characteristics of the ALOS PALSAR data [26].
Fine ResolutionScanSARPolarimetric
Beam ModeFBS, DSNFBDWB1, WB2PLR
Center FrequencyL-Band (1.27 GHz)
PolarizationHH or VVHH + HV or VV + VHHH or VVHH + HV + VV + VH
Spatial Resolution10 m20 m100 m30 m
Swath Width70 km70 km250–350 km30 km
Off-Nadir Angle34.3° (default)27.1° (default)21.5° (default)
Abbreviation: DSN = Direct Downlink, FBD = Fine Resolution Mode, Dual polarization, PLR = Polarimetry, HH, VV, HV, VH = Polarization types.
Table 3. Weights assigned for different gold mineralization parameters in the study area.
Thematic LayerClass RangesLayer WeightInfluence (%)Class Rank
Lithology mapGn/Pgb/NSS/WD0.38381
Sg/Pg2
Gt3
Ms/Mv4
S/Omg5
Alteration Zone image (threshold)Clay minerals0.19195
OH-bearing rocks4
Calcite-bearing rocks3
Quartz-bearings rocks2
Sedimentary rocks1
Proximity to gold mines (km)<100.12123
10–202
>201
Proximity to favorable contacts (km)<20.10103
2–102
>101
Proximity to major faults (km)<10.0883
1–32
>31
Major faults density (km/km2)0–0.280.0771
0.29–0.562
0.57–0.843
0.85–1.124
1.13–1.45
Lineaments density (km/km2)0–0.550.0661
0.56–1.112
1.12–1.663
1.67–2.214
2.22–2.765
Abbreviation: Gn = Gneisses and migmatites, S = Serpentinites, Omg = Ophiolitic metagabbros, Ms = Metasedimentary ophiolitic mélange matrix, Mv = Island arc association, Gt = gabbro-tonalite-granodiorite complex, Sg = Syn-tectonic granitoids, Pg = Post-tectonic granitoids, Pgb = Post-tectonic gabbros, NSS = Nubian Sandstone, WD = Wadi deposits.
Table 4. Error matrix for alteration mapping derived from remote sensing data versus field data. (A) Landsat-8 data; (B) ASTER data.
(A) Landsat-8 Alteration MapField Data
ClassesIron Oxide/HydroxidesOH-Bearing and Carbonate MineralsTotals User’s Accuracy
Iron oxide/hydroxides52860–87%
OH-bearing and carbonate minerals65460–90%
Totals5862120
Producer’s accuracy89.65%87.10%-
Overall accuracy = 88.33%Kappa Coefficient = 0.77
(B)ASTER Alteration MapField Data
Iron Oxide/HydroxidesOHIKLICLITotalsUser’s Accuracy
Iron oxide/hydroxides226113073%
OHI320613067%
KLI142413080%
CLI142233077%
Totals27343326120-
Producer’s accuracy81%59%73%88%--
Overall accuracy = 74.10%Kappa Coefficient = 0.65
Publisher’s Note: MDPI stays neutral with regard to jurisdictional claims in published maps and institutional affiliations.

