Article

Use of Discrete Element Modelling to Evaluate the Parameters of the Sampling Theory in the Feed Grade Sampler of a Sulphide Gold Plant

by
Marcus Félix Magalhães
1,2,*,
Ana Carolina Chieregati
1,
Dusan Ilic
3,
Rodrigo Magalhães de Carvalho
4,
Mariana Gazire Lemos
2 and
Homero Delboni
1
1
Department of Mining and Petroleum Engineering, University of São Paulo, São Paulo 05508-060, Brazil
2
AngloGold Ashanti, Mining & Technical, Nova Lima 34000-000, Brazil
3
School of Engineering, University of Newcastle, Newcastle, NSW 2300, Australia
4
Department of Metallurgical and Materials Engineering, Universidade Federal do Rio de Janeiro-COPPE/UFRJ, Cx. Postal 68505, Rio de Janeiro 21941-972, Brazil
*
Author to whom correspondence should be addressed.
Minerals 2021, 11(9), 978; https://doi.org/10.3390/min11090978
Submission received: 15 August 2021 / Revised: 31 August 2021 / Accepted: 1 September 2021 / Published: 8 September 2021

Abstract

:
Cross-stream cutters are widely used in the mining and resources industry to obtain representative samples of particulate flows. Discrete element modelling (DEM) and analysis can be used to investigate influences of operational parameters, sampler design and material physical properties in the generation of the Increment Extraction Error (IEE), which when present, results in a frequently biased, non-representative sample. The study investigates the practicality of the rules and recommendations proposed by Dr. Pierre Gy that were developed and established as principles for the correct extraction of samples in industrial sampling equipment. Results validate Pierre Gy’s sampling theory using DEM in a cross-stream cutter of a sulphide gold plant. Importantly, the outcomes indicate that careful consideration must be given to physical ore properties and, consequently, that sampling systems should be developed specifically to each application.

1. Introduction

AngloGold Ashanti is a mining company and the third biggest gold producer in the world. In Brazil, AngloGold has business units in the states of Minas Gerais and Goias (Figure 1). The Corrego do Sitio Complex (CDS) is located in the city of Santa Bárbara in the state of Minas Gerais and has extracted gold from underground and open pit mines for over 187 years. The gold extracted from underground mines is mainly associated with sulphides, representing 75% of total production. The processing plant is composed of a comminution circuit, concentration by flotation, pre-treatment of the concentrate in autoclave, concentrate leaching and gold recovery by electrowinning.
The process of sampling is important in industrial circuits and is essential to obtain representative samples of grades, moisture, or size distribution of a lot. The theory of sampling (TOS), developed by the French chemical engineer Pierre Gy in the second half of the twentieth century, covers a range of mathematical and statistical principles, besides empirical and practical parameters [1]. This theory is highly used for modern studies in the field of gold sampling and reconciliation [2].
Based on Pierre Gy’s TOS, the process of gold grade estimation is divided basically into three main stages: (1) the primary sampling of a given lot, (2) the secondary sampling or preparation of the sample, and (3) the chemical analysis. Each stage generates errors, characterized by their variance, which can be added, resulting in the overall estimation error (OEE). Of these errors, the Increment Extraction Error (IEE) presents one of the biggest sources of sampling biases [3] and is directly influenced by material properties and cutter design [4].
From the work of Pierre Gy, a set of parameters are proposed as a guide for correct design of sampling equipment. Parameters for cutter aperture, angle and velocity are the most used in new or Greenfield projects and cover a set of specifications for best practice. However, Brownfield projects with layout or structural constraints present a challenge for designing equipment which can incorporate all of the recommended parameters.
Due to the high variability between material physical properties, the recommended parameters to design samplers need to be used carefully and cannot be taken as universal truths [5]. For this, a detailed study of the physical properties of the material to design custom equipment specific for each application is necessary. Based on the physical material properties obtained through characterization of the materials to be sampled and discrete element modelling (DEM) simulation, it is possible to evaluate sampling theory parameters and determine the optimal design and operational configurations.
The availability of experimental or industrial test work is often restricted, which leads to the search for appropriate computational methods to simulate the performance and behavior of the granular flows in samplers, allowing for evaluation of sampling theory parameters that determine the best design and operational configurations.
The discrete element method (DEM) has quickly grown as a tool to perform such a task. It calculates the motion of each individual particle within a simulation domain and their interaction using contact models. Model parameters include restitution and friction coefficients. One of the first applications of DEM in modeling samplers and cutters have dealt with cross-stream cutters, cross-belt and rotative samplers (vezin type) [6,7,8,9].
According to Cleary and Robinson [9], the use of DEM simulations to investigate samplers present an advantage over experimental procedures as simulations allow for the use of a reference sample that can be precisely the same as a sample of the stream of material, thus eliminating a significant part of variability and allowing for obtaining representative samples with fewer replicates.
Subsequently, a range of works were developed in the field of simulation for evaluating bias in different types of samplers for different particulate materials and plant pulp streams [6,7,8,10,11]. Unfortunately, aside from these studies, the investigation of sampling systems using DEM in academic literature is rather limited.
It is essential that the design of the sampling system is correct to extract accurate increments. Based on Pierre Gy’s TOS and on studies carried out by Pitard [5], Figure 2 shows the recommendations for a correct sampler design to mitigate the IEE.
It should be noted that these recommendations are based on the principles of the sampling theory to avoid high errors, but it is also worth noting that these parameters do not take into consideration the physical properties of the material to be sampled.
The work in this article aims to validate and recommend new parameters for the Pierre Gy sampling theory for a sulphide gold ore, using calibrated DEM simulations and analysis of a feed cross-stream cutter of a sulphide gold plant. The simulations will provide information to evaluate the increment extraction in the feed sampler at the plant.

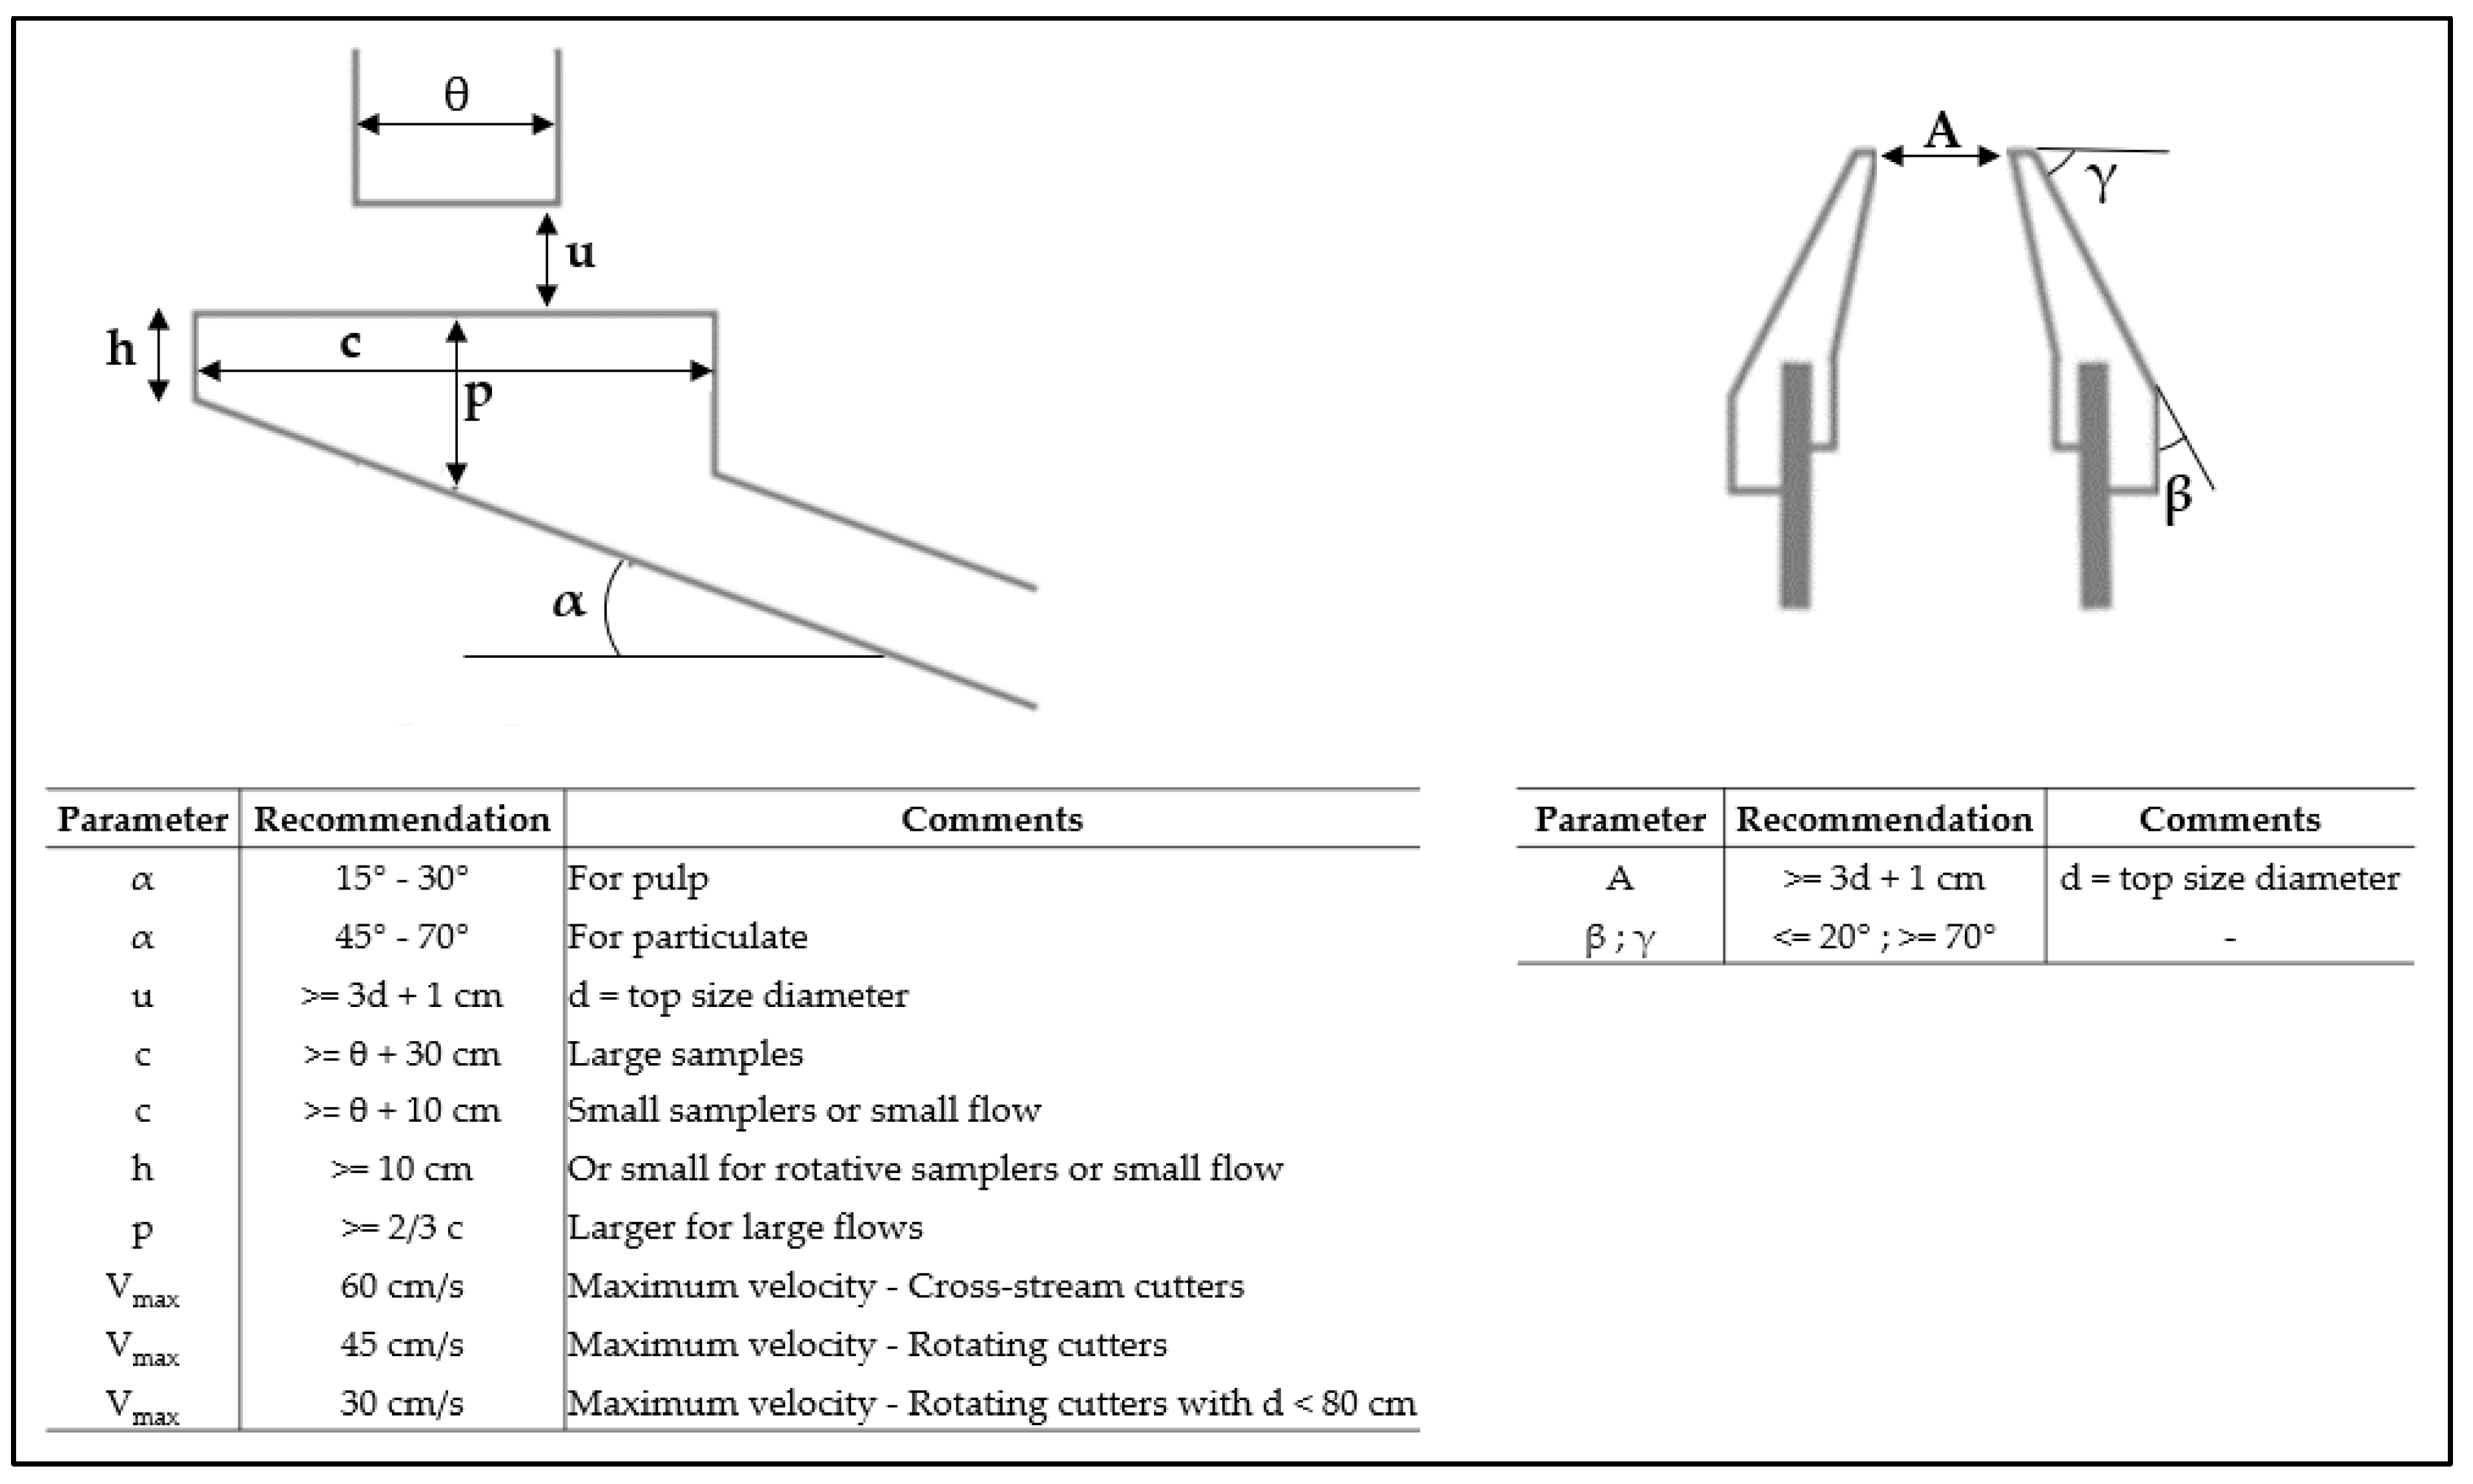
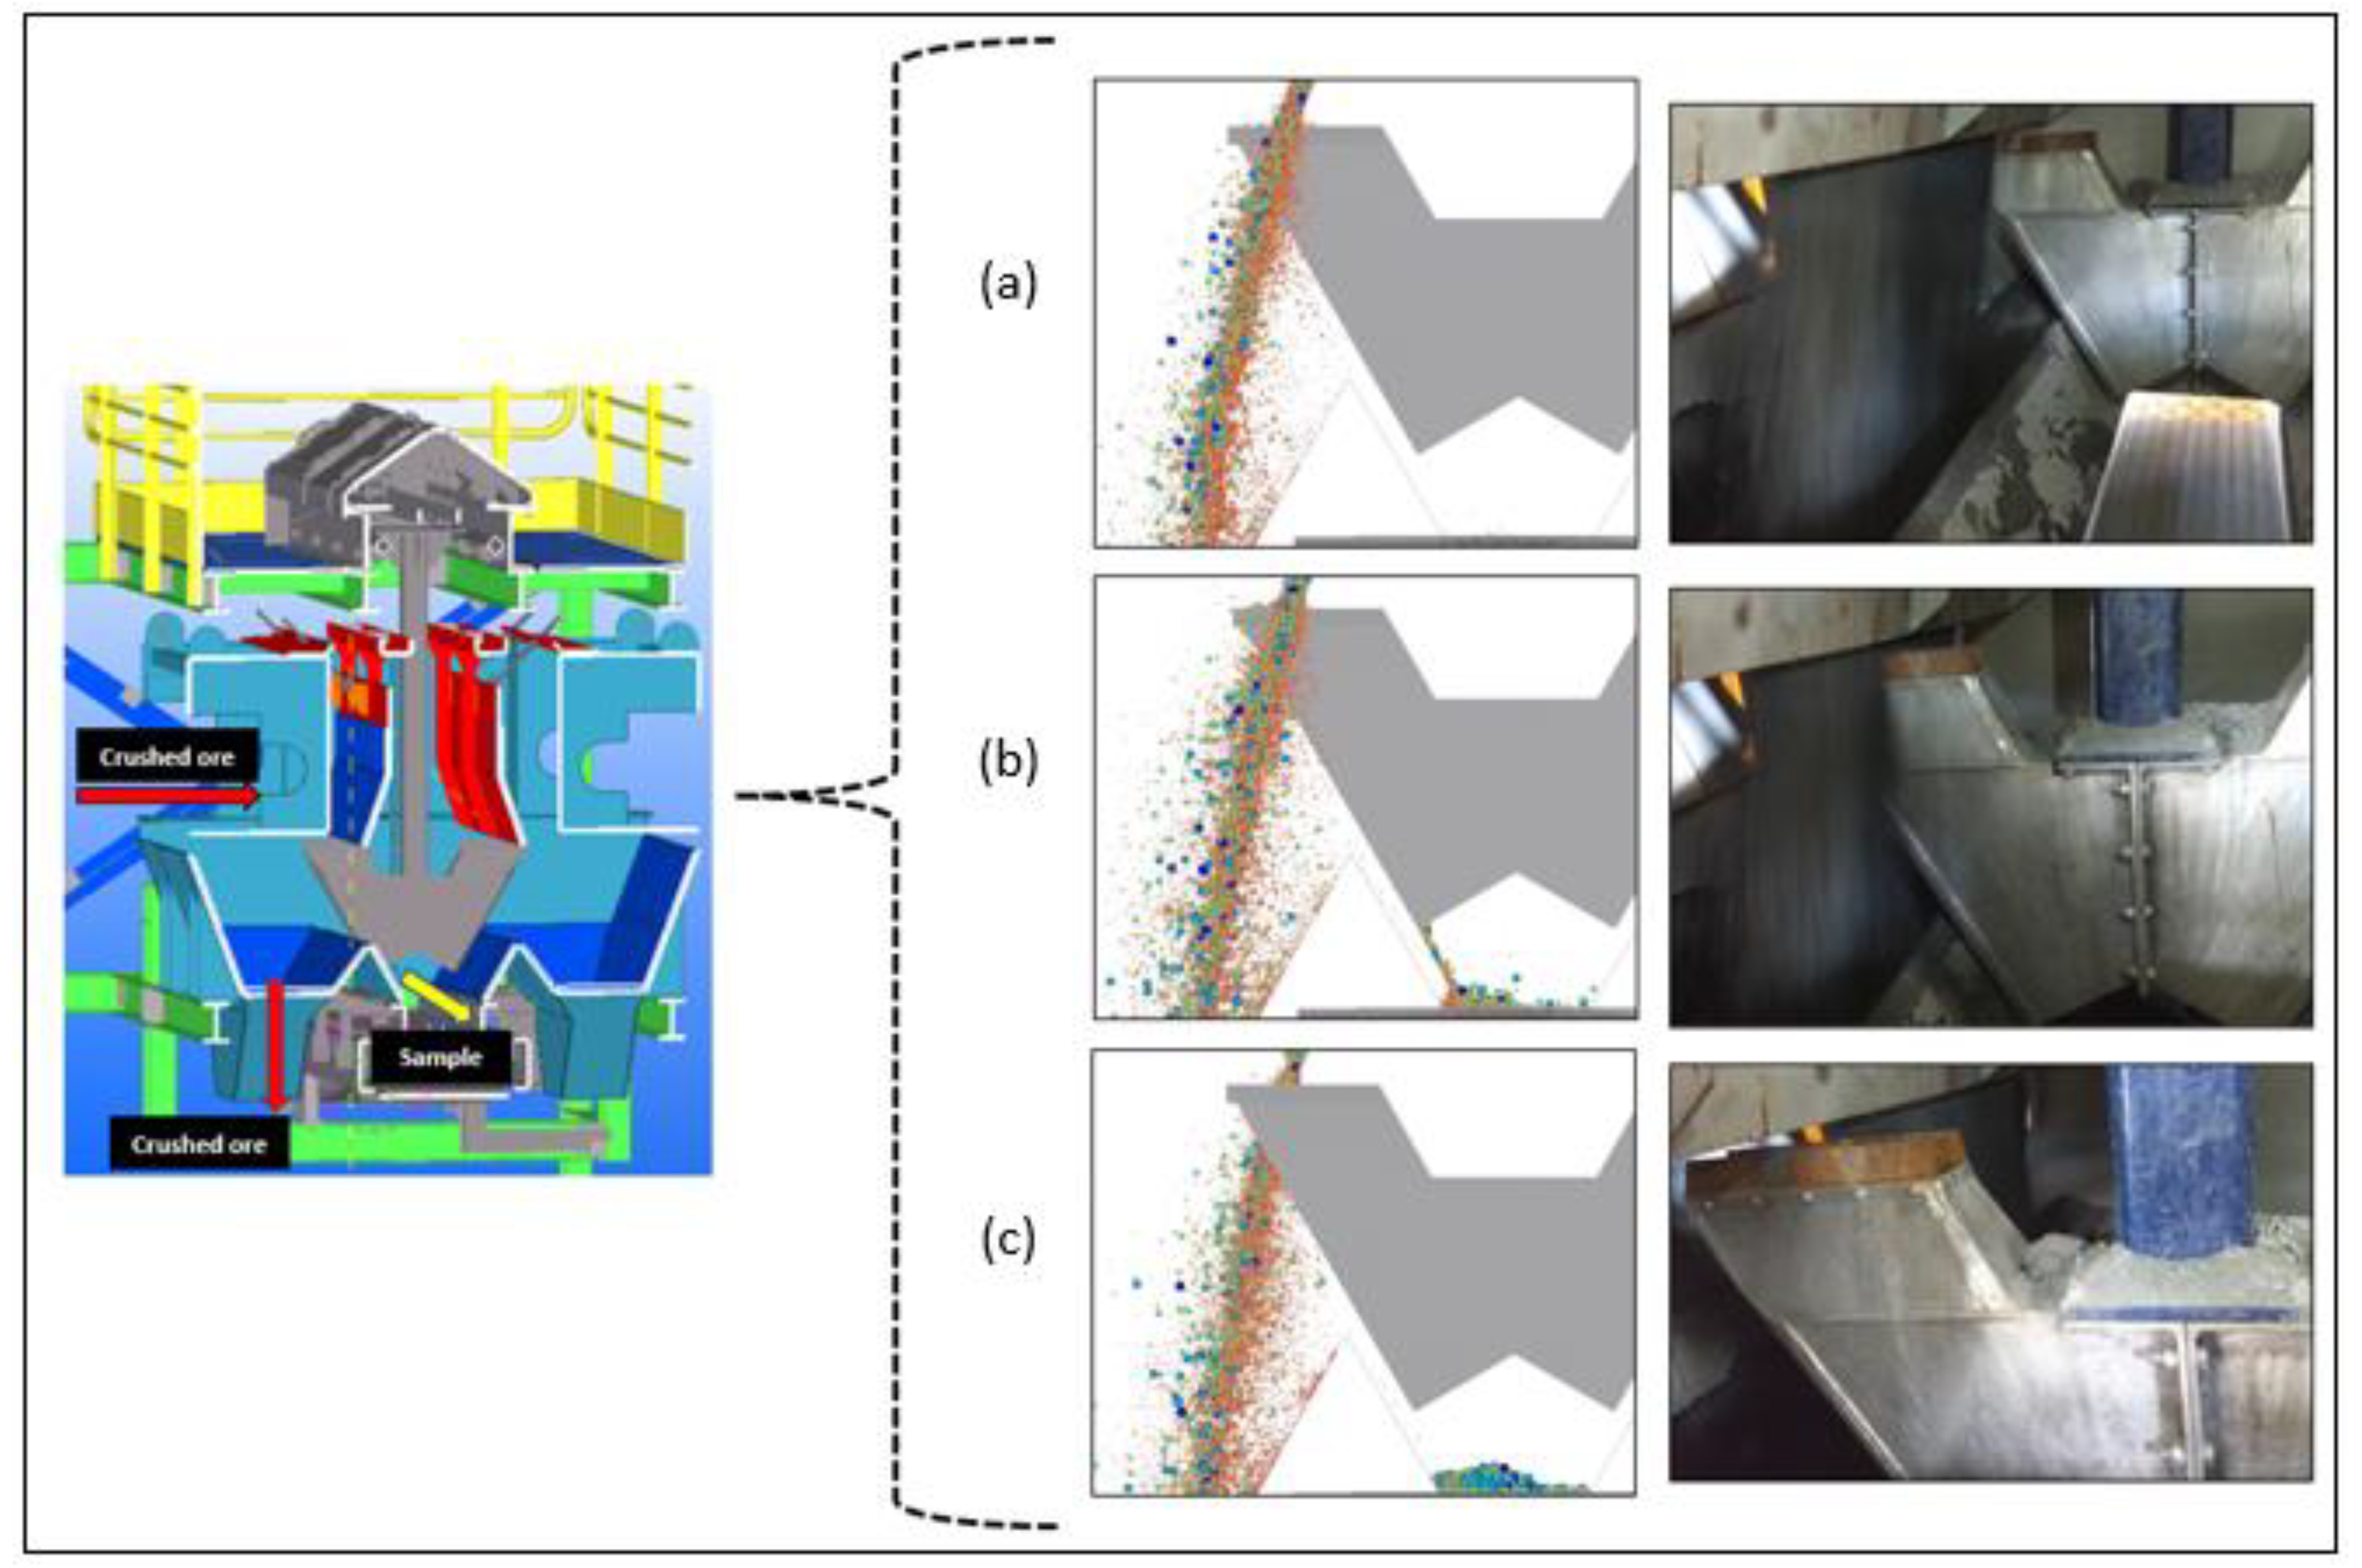
2. Configuration of the Sampler and Simulations

The DEM is a computational tool that involves the resolution of momentum equations for many particles. Initial concepts were developed in the field of rock mechanics in the mid-seventies for studies related to movement of rock masses [12]. Recently, in this burgeoning field, many different studies for a range of applications including transfer chutes [13], silos [14], feeders [15], sampling systems [6,7,8,9,10,11], blending and mixing [16], conveyor belts [17,18] and screens [19] have been undertaken.
The simulation consists of a numerical algorithm that resolves the movement and interactions between independent particles, calculating their position individually (particle per particle) in each time interval. One of the most widely used software programs is Rocky 4.3, provided by Engineering Simulation and Scientific Software (ESSS Company, Florianópolis, Brazil) [20], which has a user-friendly interface and several available particle interaction models, such as those used to calcite contact outcomes. In general, the simulations are based on the calculations of both normal and tangential forces originating from both particle and boundary interactions. In this work, the contact model used in the simulations was the hysteretic linear spring with rolling friction type C. Additionally, due to the characteristic cohesive behavior of the sample, a particle-to-particle adhesion model was used, which is calculated according to the distance between particles and a force of attraction that is dependent on the mass of the contacting particles [21,22]. Both models are implemented in Rocky 4.3.
The plant feed cross-stream cutter is constituted by a belt that receives crushed ore from a silo. The ore is fed in the sampler by a flap that orientates the ore for the cutter. The flow into the equipment is controlled by the grinding throughput and the cutter is triggered at 10-min intervals. Figure 3 shows the equipment design and the cutter at the time of sampling.
The sampler follows the specifications given below:
  • Movement direction: perpendicular to the flow;
  • Cutter aperture (A): 60 mm;
  • Cutter edge angle (γ): 70°;
  • Cutter angle (α): 60°;
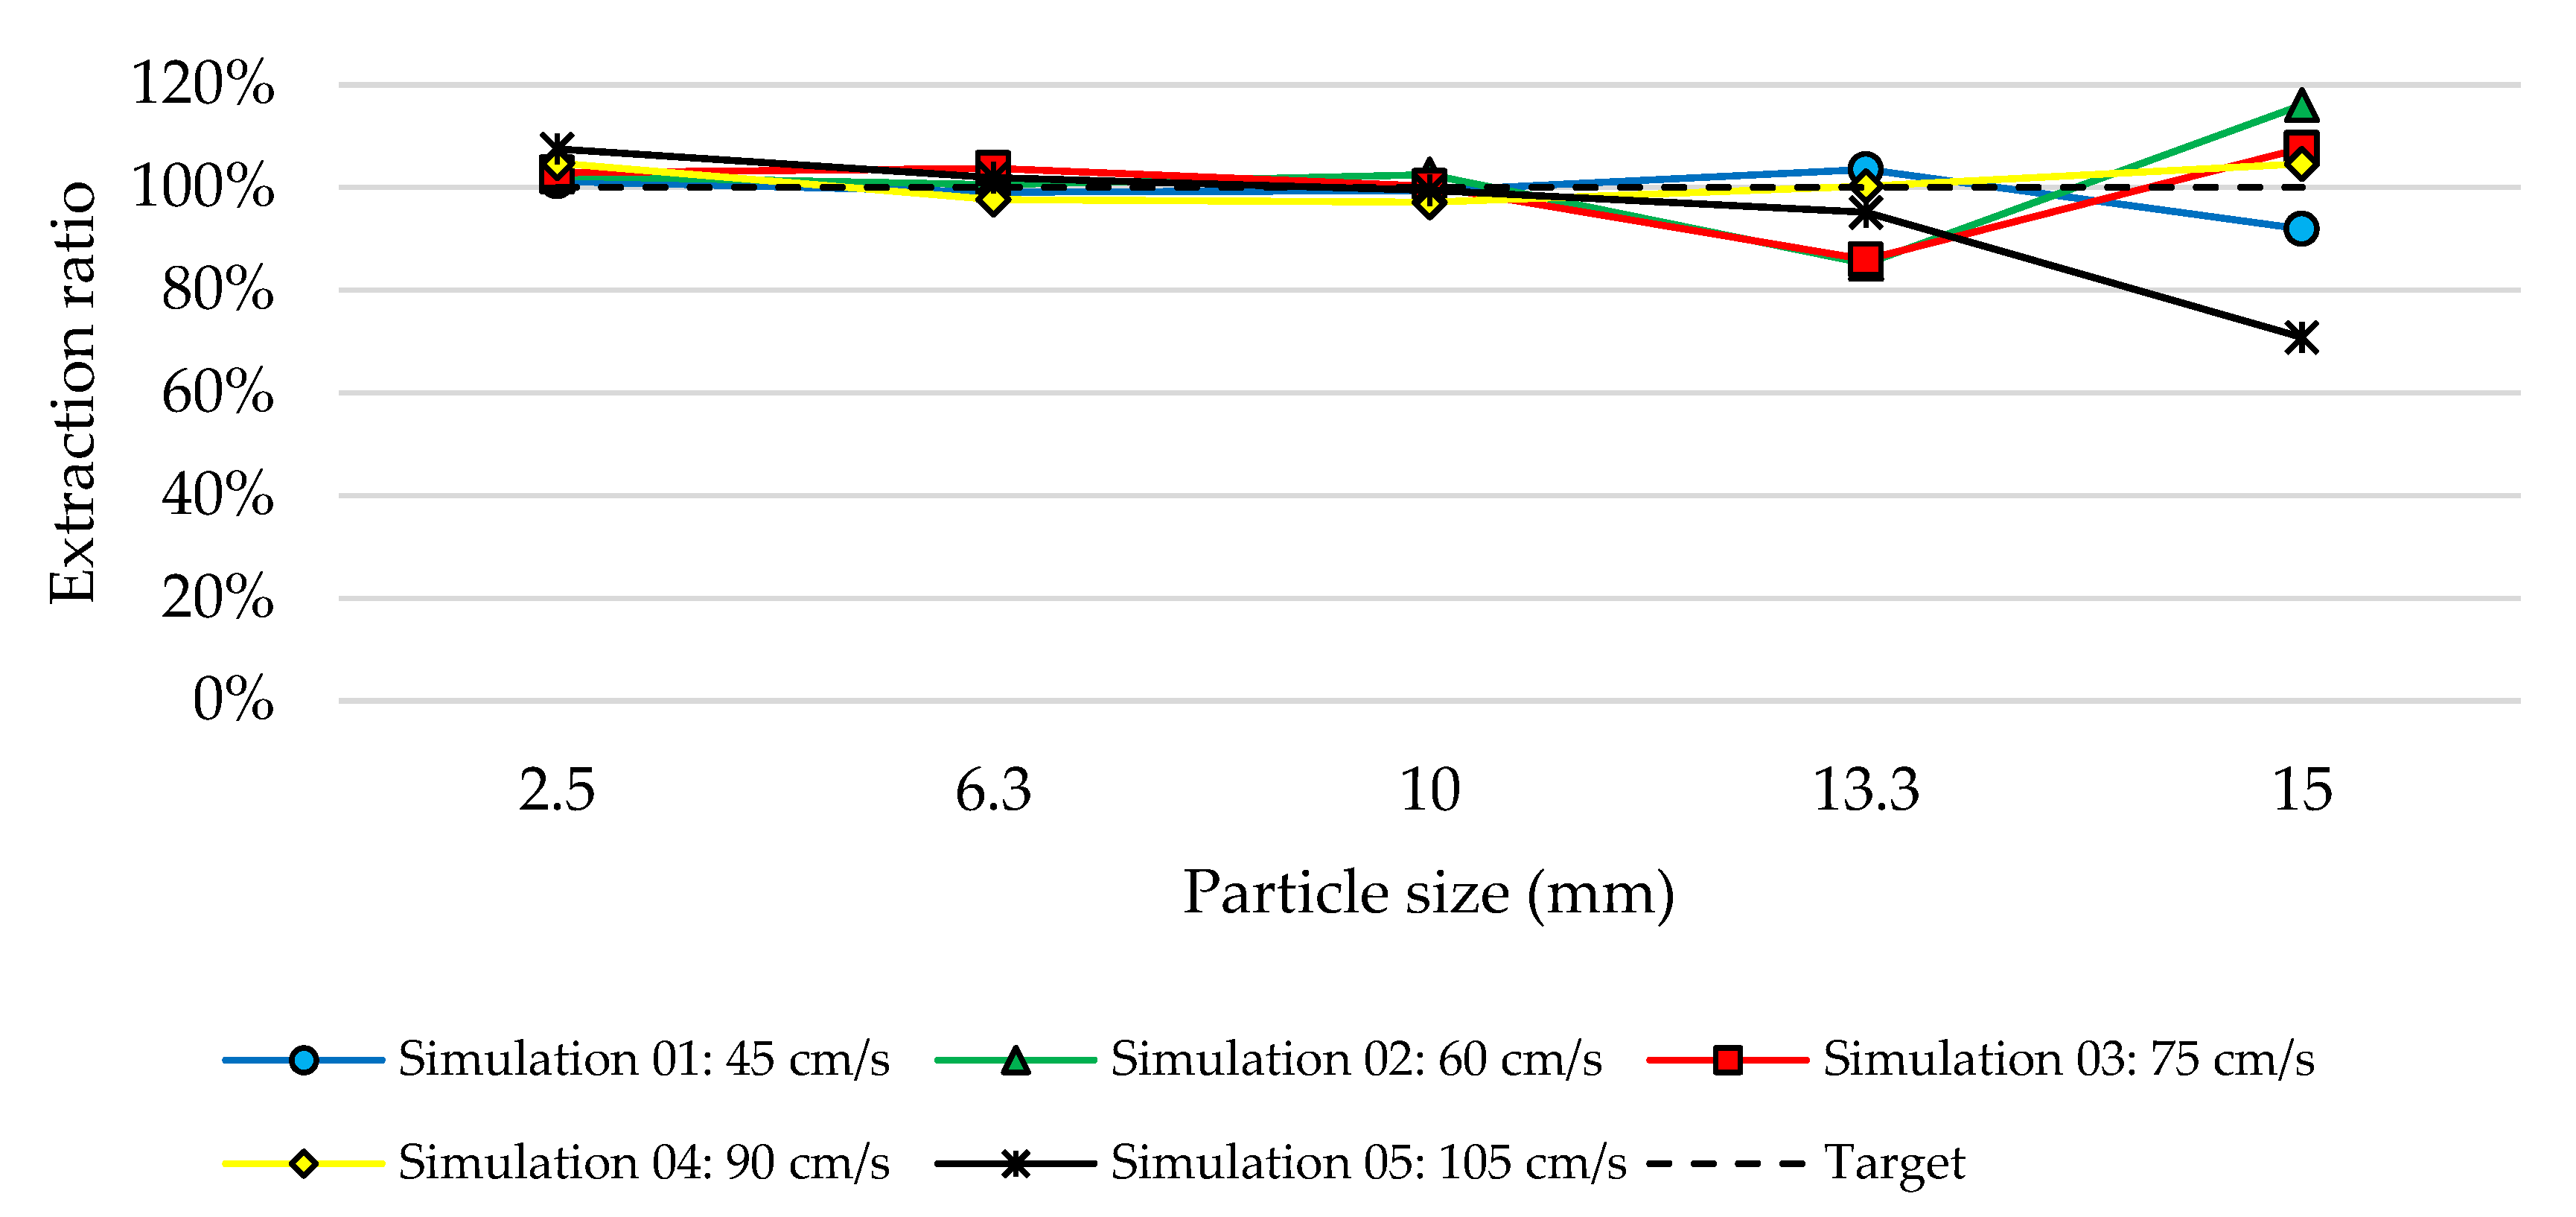
  • Cutter velocity (Vmax): 45 cm/s;
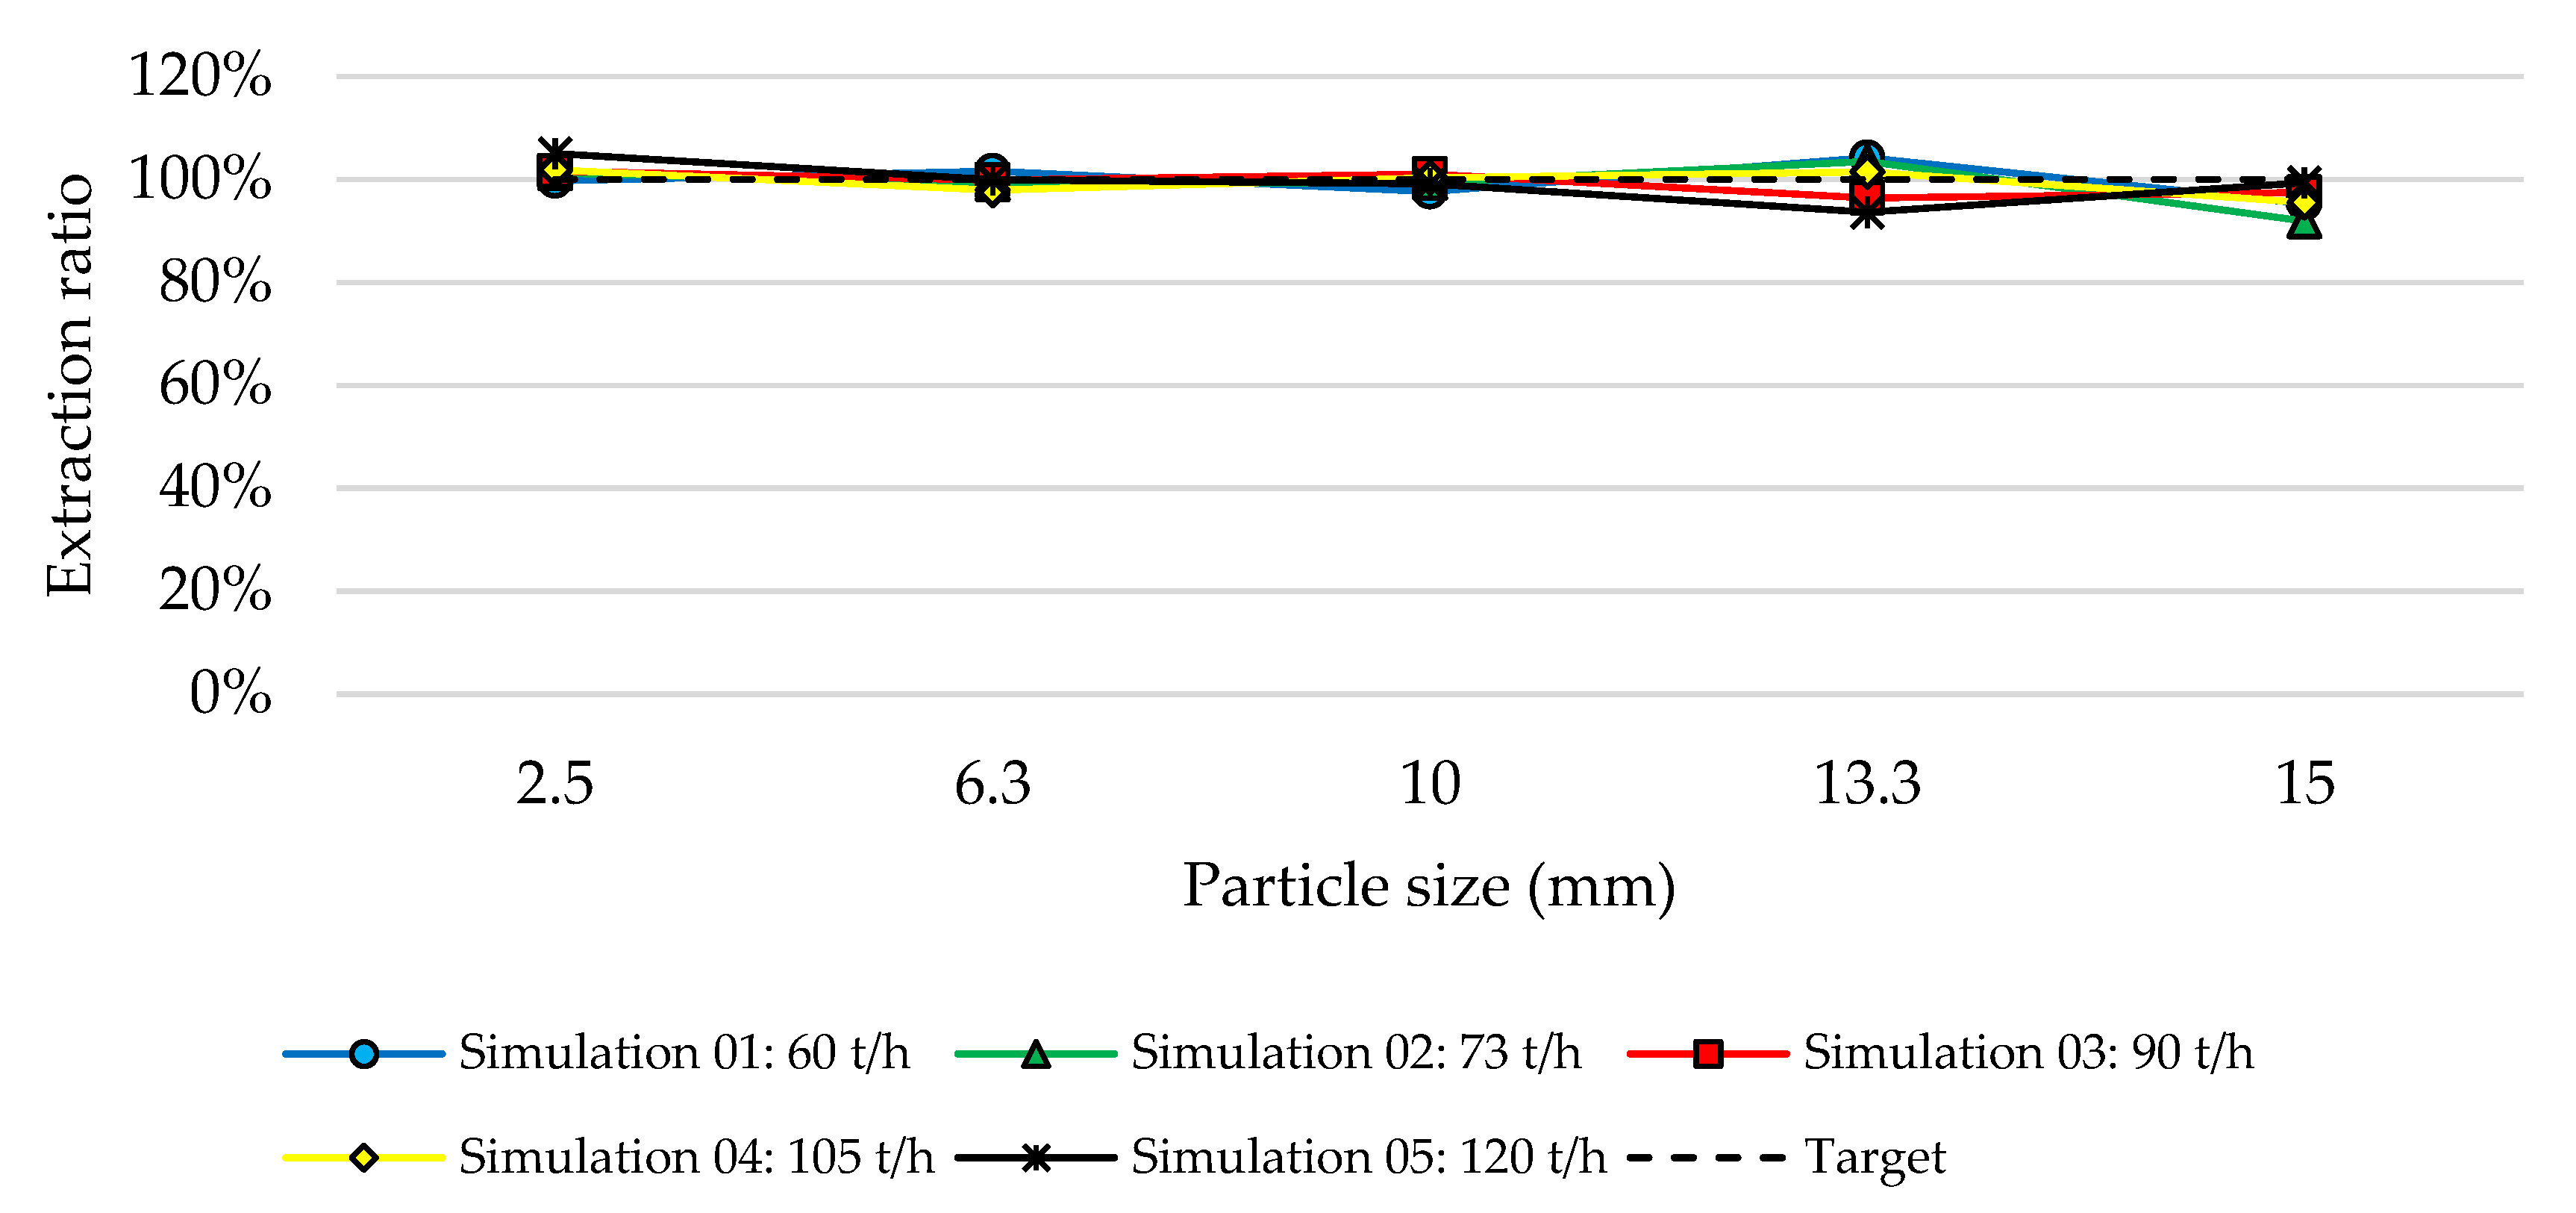
  • Solids feed rate: 73 t/h.
To perform the DEM simulations, a proper set of material and contact parameters must be specified [23] for both particles and the surfaces present in the simulated system. Based on DEM studies to detect bias in sampling equipment [9] and our own for particulate flows [13,21,22], the following modelling premises were used:
  • The Young’s Modulus (or Loading Stiffness) for particles was 1 × 10⁷ N/m2, and for boundaries, 1 × 10¹¹ N/m2;
  • The constant adhesive model was used, and the adhesive distance was based on 1/2 particle diameter of the smallest group of particles;
  • The restitution coefficient for all particles and all types of interactions was 0.3;
  • The friction coefficient for particle/belt interactions was 0.7;
  • The friction coefficient for particle/boundary interactions was 0.5.
The modelling between particle/particle interactions was obtained based on the calibration of the coefficient of sliding friction, rolling friction and attractive force, representing the physical parameters obtained in the laboratory tests.

3. Materials and Methods

The methodology applied included three major steps: (1) characterization of physical properties of the ore in the laboratory; (2) calibration of the particle/particle interactions model in Rocky 4.3 (ESSS), and (3) simulation and analysis.
The parameters from ore characterization include:
  • Bulk density;
  • Particle density;
  • Size distribution;
  • Gold analysis by size;
  • Internal friction angle;
  • Repose angle;
  • Moisture.
Approximately 100 kg of crushed ore in the plant feed sampler was collected for testing and calibration. Aiming for a challenging condition of sampling, the ore was collected during production at a time that moisture is considerably high (2–3% w.b.).
The bulk density of the ore was determined by utilizing a 2-L beaker and digital scale, based on internal standard procedure of AngloGold. For the particle density, a 100 mL pycnometer was utilized, and the size distribution was made by dry screening in a Tyler series of sieves between 15,000 and 74 µm. After separation of the fraction by screening, the masses were sent to the chemical laboratory for gold grade analysis.
To approximate the internal friction angle, a slump plane or shear box test was used [24]. The shear box is made of acrylic glass. The box has a length of 400 mm, a width of 300 mm and a height of 400 mm. The right-hand wall is a flap that can be opened to allow the bulk material to flow out of the box. As defined in [24], the internal friction angle is indicated by the angle of the formed slope. The test was undertaken three times for repeatability.
The angle of repose was obtained using a lifting cylinder test. The bulk material was poured into a hollow 100 mm diameter and 300 mm height cylinder until it was completely filled. After filling, the cylinder was raised at a constant velocity of approximately 200 mm/s and the bulk material flowed out of the cylinder bottom to form a bulk material pile. The repose angle is the angle measured between the cone and the plane. The test was undertaken three times for repeatability.
As an alternative to direct measurement of contact parameters [23], calibration best practices recommends that the DEM calibration is performed using different tests that explain different material properties [23,25]. In addition to the shear box test and the lifting cylinder test, a draw down [25] test was also performed. The apparatus length is 400 mm, width is 300 mm, and depth is 100 mm for the upper box. For the lower box the length is 450 mm, width is 350 mm, and depth is 150 mm. The upper box has a rectangular opening at the bottom center, which can be suddenly opened via flaps to allow the discharge of the bulk material sample. This aperture corresponds to 1/5 of the upper box width and is designed to have a minimum of 3 times the diameter of the biggest particle in the system [26]. The outflowing bulk material forms a pile in the lower box, while the remaining bulk material forms two slopes in the upper box. After the discharge, the measurements of the internal friction angle (angle of the slopes in upper box) and repose angle (angle of the slope in the lower box) are taken. The test was undertaken three times for repeatability.
All of the laboratory tests to obtain internal friction angle and repose angle are based on procedures previously described by Roessler et al., 2019 [25].
The DEM calibration effectively results in obtaining a set of parameters that represent the experimental laboratory tests results [27]. Similar to the application of DEM in practice, DEM calibration is also a topical and widely investigated field of research itself [23,28,29,30,31]; however, in this case it is not the focus of analysis. The main parameters for calibrating the interactions between particles in Rocky 4.3 for the purposes of this study are:
  • Sliding friction coefficient;
  • Rolling friction coefficient;
  • Attractive force;
  • Particle size;
  • Particle shape.
The particle size distribution used in the DEM simulations was exactly the same as the particle size distribution of the physical bulk solid material tested in the laboratory and handled in practice. Here, 5 groups of particles related to sizes 100%, 95%, 80%, 50%, and 25% mass passing (P100, P95, P80, P50, and P25) were defined. Due to computational time required and computer processing capability, particles below 2.5 mm were not modelled. Particle shape was considered spherical for all the simulations, both out of practicality to reduce computation time and since the TOS is based on studies that considered perfect spheres [3].
The sliding and rolling friction coefficients are the most impacting parameters in the physical behavior of non-cohesive material [32]. However, cohesion and adhesion are directly related to material moisture and the presence of fine particles [29,30].
To reduce the number of simulations for calibrating particle interactions, DoE (design of experiments) was used. The DoE is a statistical optimization method to determine relations between factors (variables). For this work, a full factorial design (FFD) was chosen, which is the most indicative when the analysis includes three or more variables [33]. This approach builds on previous academic research on the use of DoE in DEM calibration [34,35]. The experimental factorial analysis was generated and analyzed using the Minitab17 statistical software [36].
High and low levels were defined, based on previous studies conducted by Ilic [21], for each variable in analysis (sliding friction coefficient, rolling friction coefficient and attractive force) as shown in Table 1.
For each laboratory test, 16 tests were generated in the DoE matrix, resulting in a total of 48 DEM simulations in the calibration of the parameters within the particle interaction model. Following calibration, 75 DEM simulations were performed to evaluate the following 5 parameters of sampling theory as presented in Figure 2:
  • Cutter aperture (A);
  • Cutter angle (α);
  • Cutter edge angle (β);
  • Cutter velocity (Vmax);
  • Solids feed rate in the sampler.
For each of the above-mentioned variables, 5 levels, as shown in Table 2, were analyzed. Additionally, all the simulations were performed in triplicate, including the original project configuration (described previously in Section 2).
An equation was used to quantify the ratio of extraction for each particle group. It was defined as an initial mass group, the mass of particles in a specified diameter before sampling. In addition, the final mass group was defined as a final mass of particles in a specific diameter after sampling. The equation compares the percent of particle mass group collected in the sample and the original percent mass group of the lot. The equation is represented below.
Extraction (%) j = (Mfg/Mft)/(Mig/Mit) × 100,
where:
j = Index of particle group;
Mig = Initial group mass (lot);
Mit = initial total mass (lot);
Mfg = Final group mass (sample);
Mft = Final total mass (sample).
All test simulations were performed in triplicate, with the results presented as the average of the three tests.

4. Results

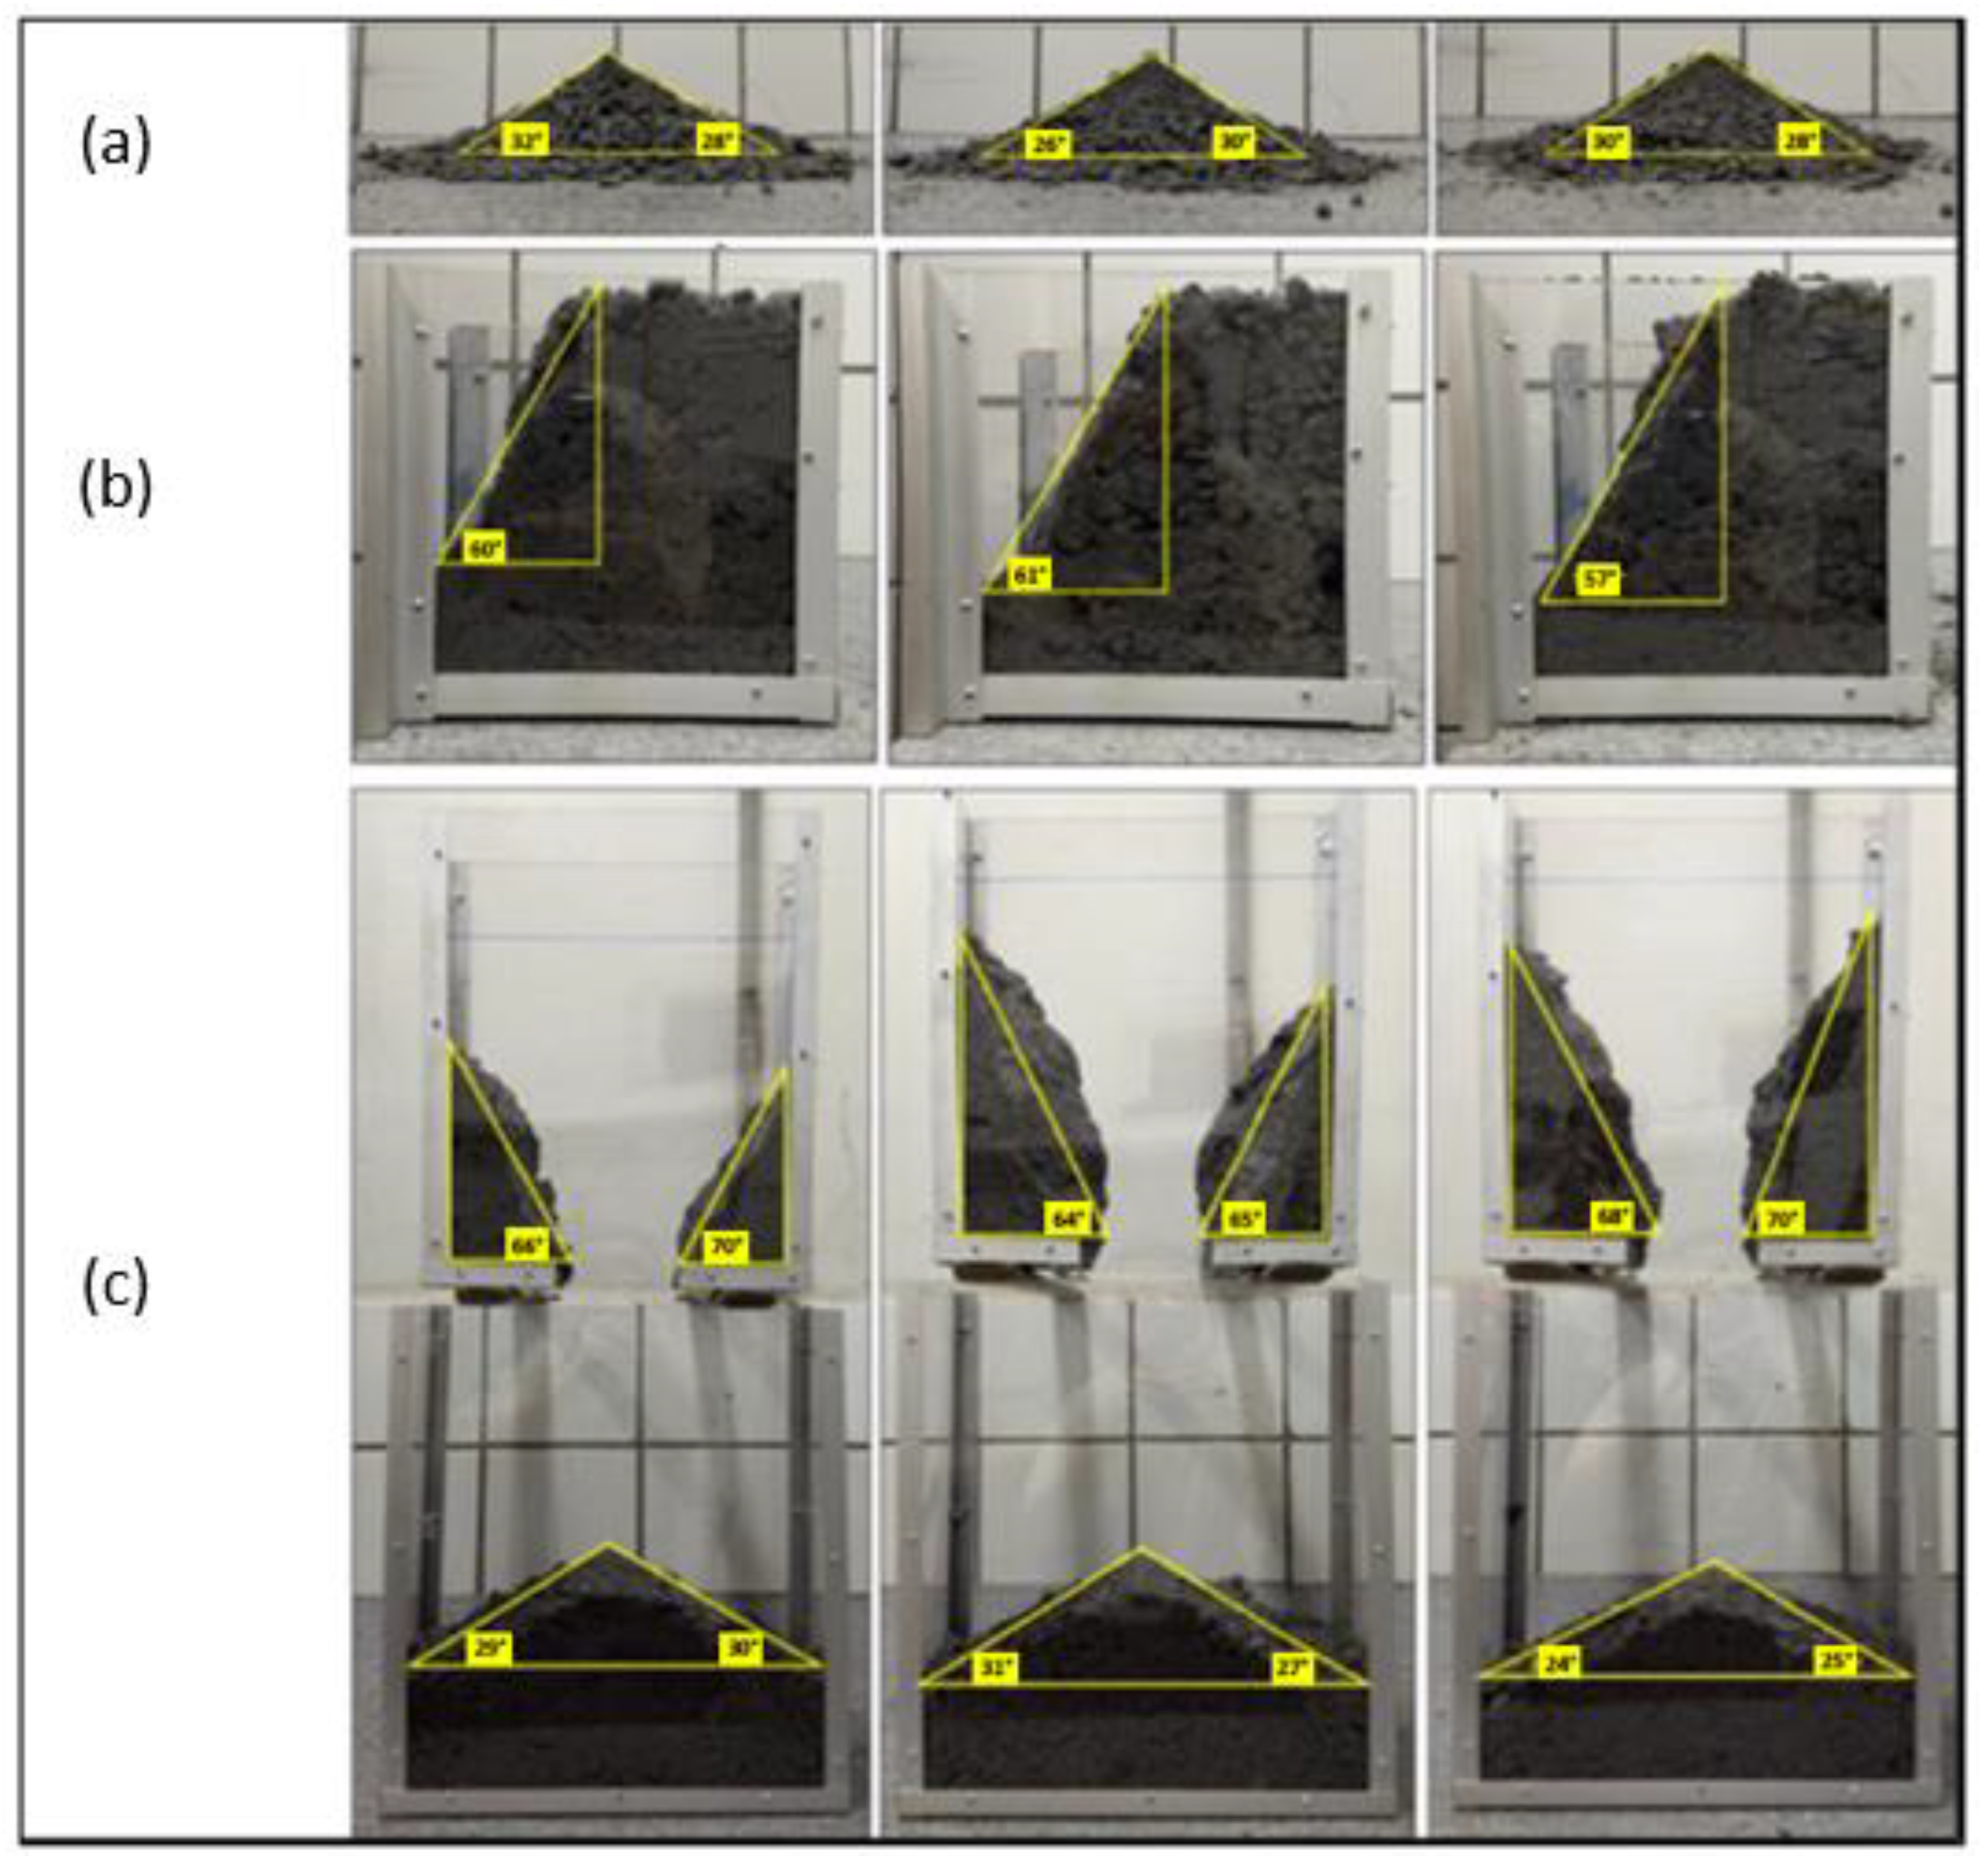
4.1. Physical Parameters Characterization

Figure 4 illustrates the laboratory tests to determine the internal friction angle and repose angle, while Table 3 represents the summary of test results. The repose angle test resulted in angles ranging from 26° up to 32°, while the shear box test resulted in internal friction angles of 57° up to 61° while presenting similar material profiles inside the apparatus. Finally, the draw down tests resulted in similarly reposed angles as obtained in the repose angle test, while the internal friction angle resulted in slightly higher angles (66°–70°) when compared to those obtained in the shear box test.
Gold grade analysis in each screening fraction showed a progressive increase in the concentration of gold with the decrease in the particle size (Table 4).

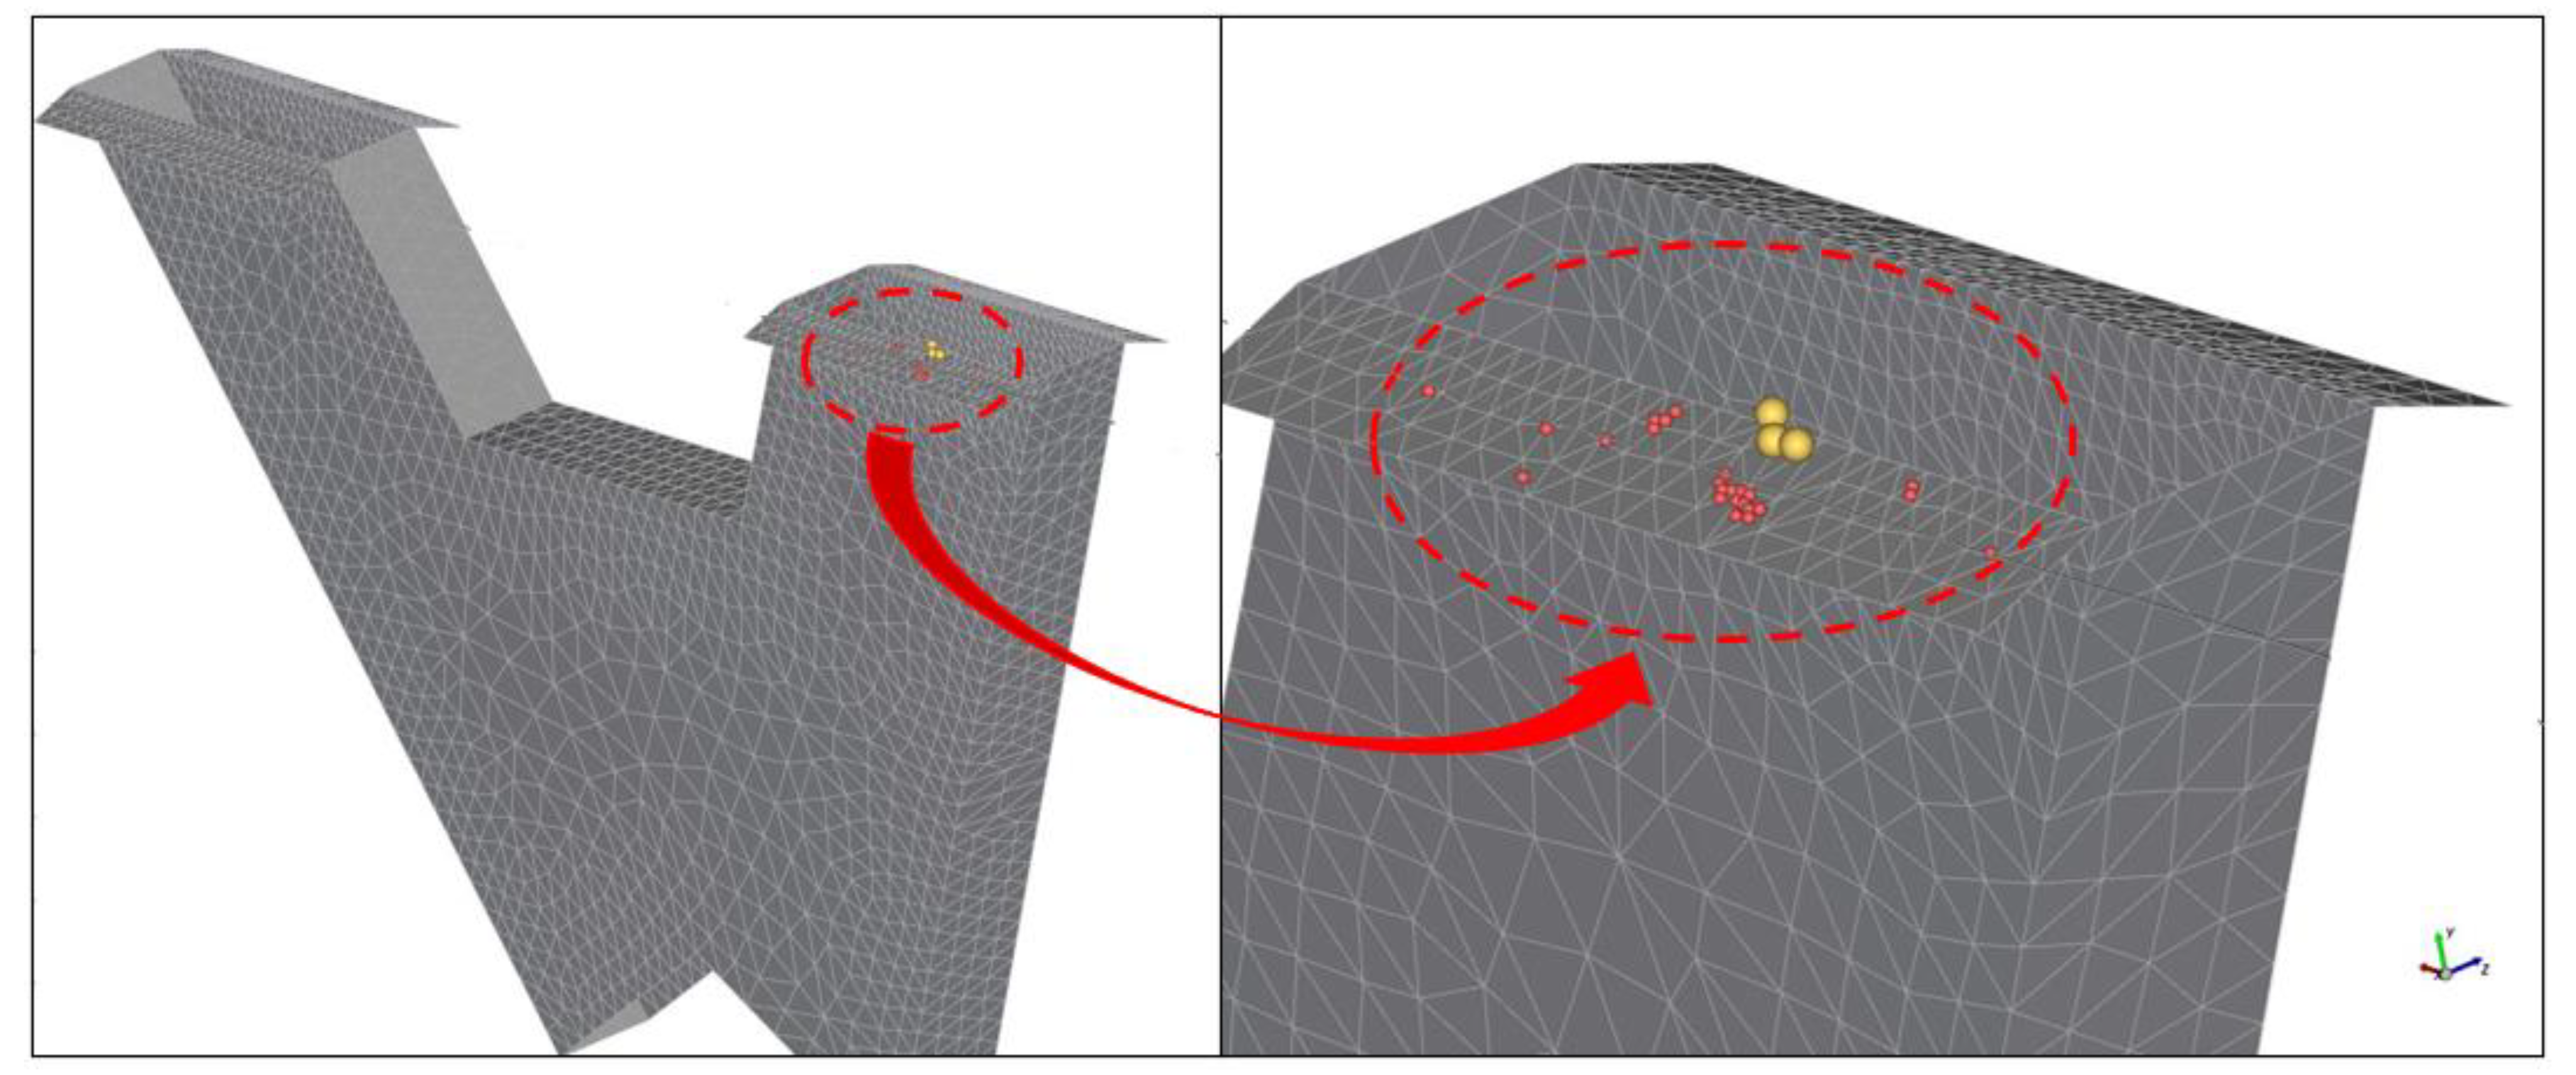
4.2. Particle Interactions Calibration

Based on particle size distribution, it is noted that 25% of the particles can be considered fines (<2.5 mm) for the DEM simulations. Simulating particles below 2.5 mm would result in a large number of particles generated within the system, which may make the performance of simulations unfeasible due to limited processing capacity and the long time demanded. Consequently, the smallest particle size was limited to 2.5 mm. To reduce the number of simulation tests and reduce the time required in the calibration steps even further, the DoE factorial experiment was used.
The factorial experiment was created using a 16 tests matrix with two replicates. The following equations show the regression obtained, which describes the relationship between the response and the terms in the model for each physical parameter.
Repose angle (lifting cylinder test: R2 = 96.61%) = 8.39 + 9.84 × A − 7.03 × B + 5.5 × C + 32.81 × A × B + 2.5 × A × C + 16.25 × B × C − 37.5 × A × B × C,
Internal friction angle (shear box test: R2 = 99.95%) = 20.79 + 8.98 × A + 13.36 × B + 6.42 × C − 2.34 × A × B − 11.72 × A × C − 10.47 × B × C + 79.69 × A × B × C,
Repose angle (draw down test: R2 = 98.14%) = 26.5 − 6.88 × A + 0.62 × B − 5.91 × C + 12.5 × A × B + 9.38 × A × C + 11.88 × B × C + 6.2 × A × B × C,
Internal friction angle (draw down test: R2 = 98.83%) = 25.39 + 1.72 × A + 17.34 × B + 3.97 × C + 20.3 × A × B + 2.81 × A × C − 3.44 × B × C + 9.4 × A × B × C,
where:
A = Rolling friction coefficient (-);
B = Sliding friction coefficient (-);
C = Attractive force (-).
The above regression equations describe the relationship between the response and the terms in the model. The constants were obtained based on a linear model fitted to this data set [37,38]. From the factorial experiment, it was possible to identify variable combinations to optimize the response. In this study, the response optimization from Minitab 17 was used to define a set of values that represents the results of the physical material parameters obtained from the laboratory tests. This process of optimization is based on the maximization of the composed desirability that represents a set of values that predict the targets defined in the optimization most accurately. Table 5 and Table 6 show, respectively, the targets to be attained in the optimization and the three possible sets of parameters (Solutions) that best replicate the target values.
From the list containing the best three solution candidates in Table 6 obtained from Equations (2)–(5), Solution 2 presents the best fit for the target values in Rocky simulations. Assuming high values of rolling friction and attractive force as proposed by Solution 1, the material did not flow in the draw down test, blocking the apparatus. DEM simulations of the three laboratory experiments were then performed using the three solution candidates. The comparison of the target values and the simulated values are presented in Table 7 and illustrated in Figure 5.
When comparing the simulation using the Solution 2 parameter set to the images of the experiments, one can notice that the calibrated DEM simulations were able to describe, with good accuracy, the material profile for each experiment, in particular for the tests that involved larger sample volumes as in the shear box and draw down tests.

4.3. Simulations

The simulations were performed varying one parameter per time based on the original project configuration of the sampler.

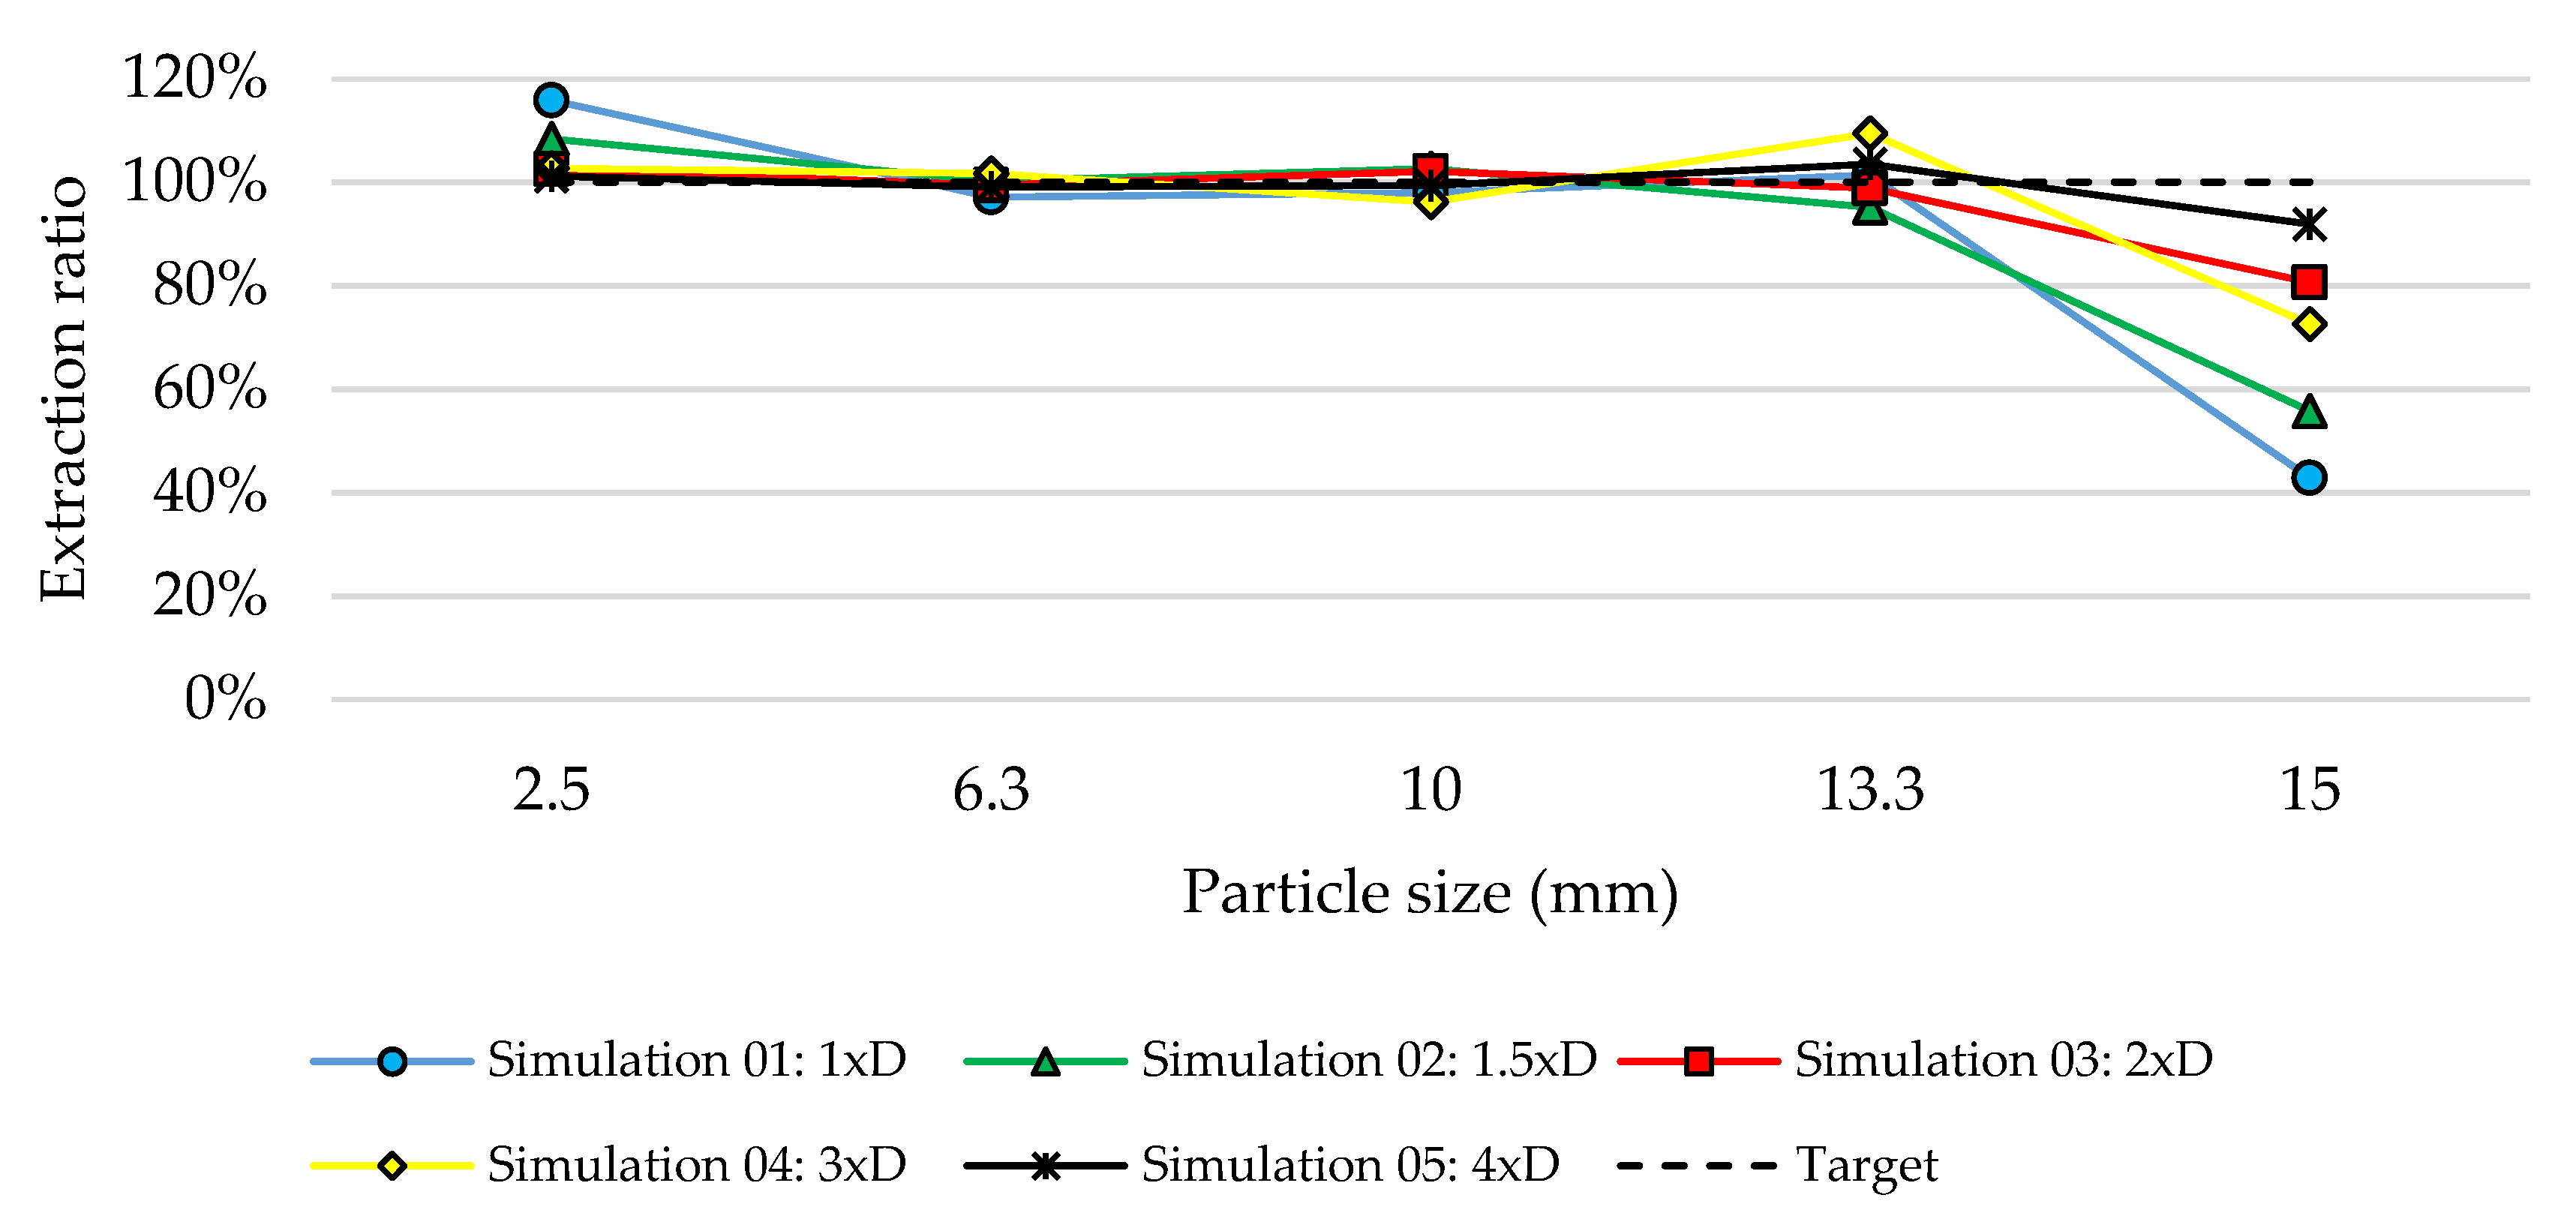
4.3.1. Cutter Aperture
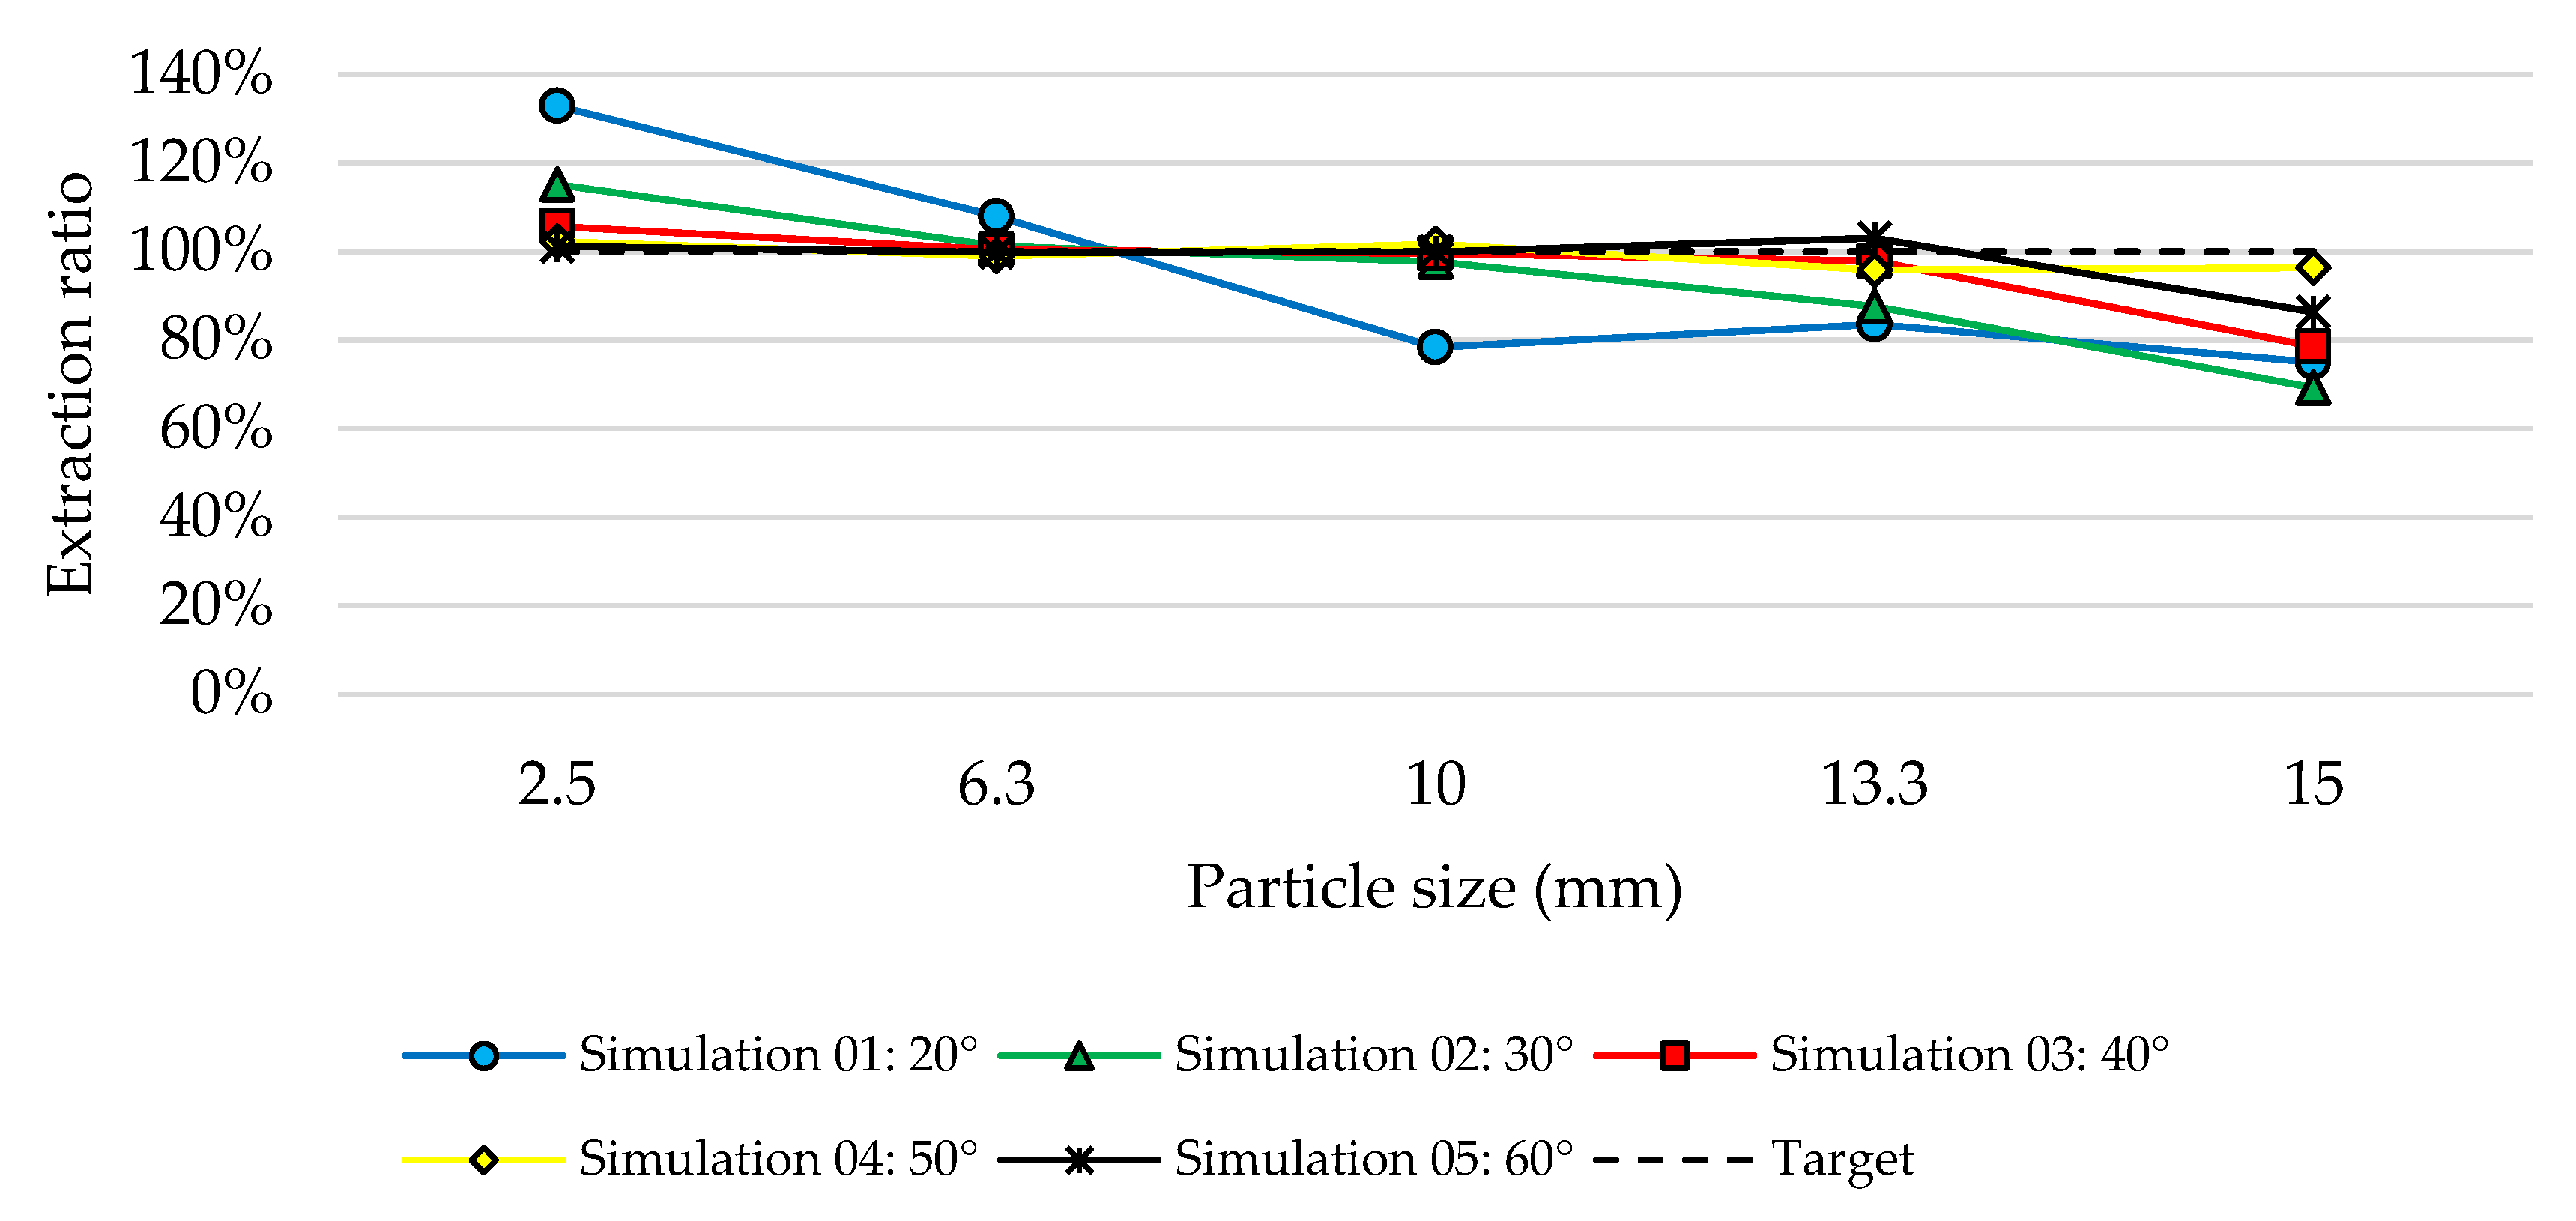
The sampling theory parametrized the cutter aperture for a minimum of 3 times the size of the largest particle (or d95) of a lot. Figure 6 shows the simulation results varying the cutter aperture for the cross-stream cutter.
It should be noted that a reduction in the extraction occurs as the aperture approximates the size of the coarsest group of particles. The coarsest group presents 42.9% extraction for cutter aperture equal to its diameter, represented by Simulation 1 (1D). The other point observed in Simulation 1 is the cutter’s obstruction for such a small aperture, as showed in Figure 7b. In addition, the reduction of the flow velocity due to the blockage of the cutter for narrowed apertures was also observed (Figure 7).
In this case, extractions above 90% were only observed when the cutter aperture simulated was 4 times the size of the largest particle (Simulation 5). This observation is directly comparable to the principles of mass flow geometry in bins and silos [39]. That is, to prevent a mechanical arch from forming, the opening dimension should be at least 4 times the maximum particle or lump size.

4.3.2. Cutter Angle

In these simulations, the main problem observed was the blockage of the cutter for cutter angles below 50° due to the reduction of the flow velocity (Figure 8). According to the experimental results, the internal angle of friction (draw down) and internal angle of friction (shear box) were both above 59 degrees. Therefore, these results show that the criteria for selecting the cutter angle could indeed be related to the internal angle of friction of the bulk material handled. This is an important finding that could be integrated within Pierre Gy’s theory of sampling recommendations, shown previously in Figure 2. This finding is also analogous to the design of minimum chute inclinations including dribble or fines chutes in the field of transfer chute design [13]. Figure 9 summarizes the calculated extraction ratio for these simulations.

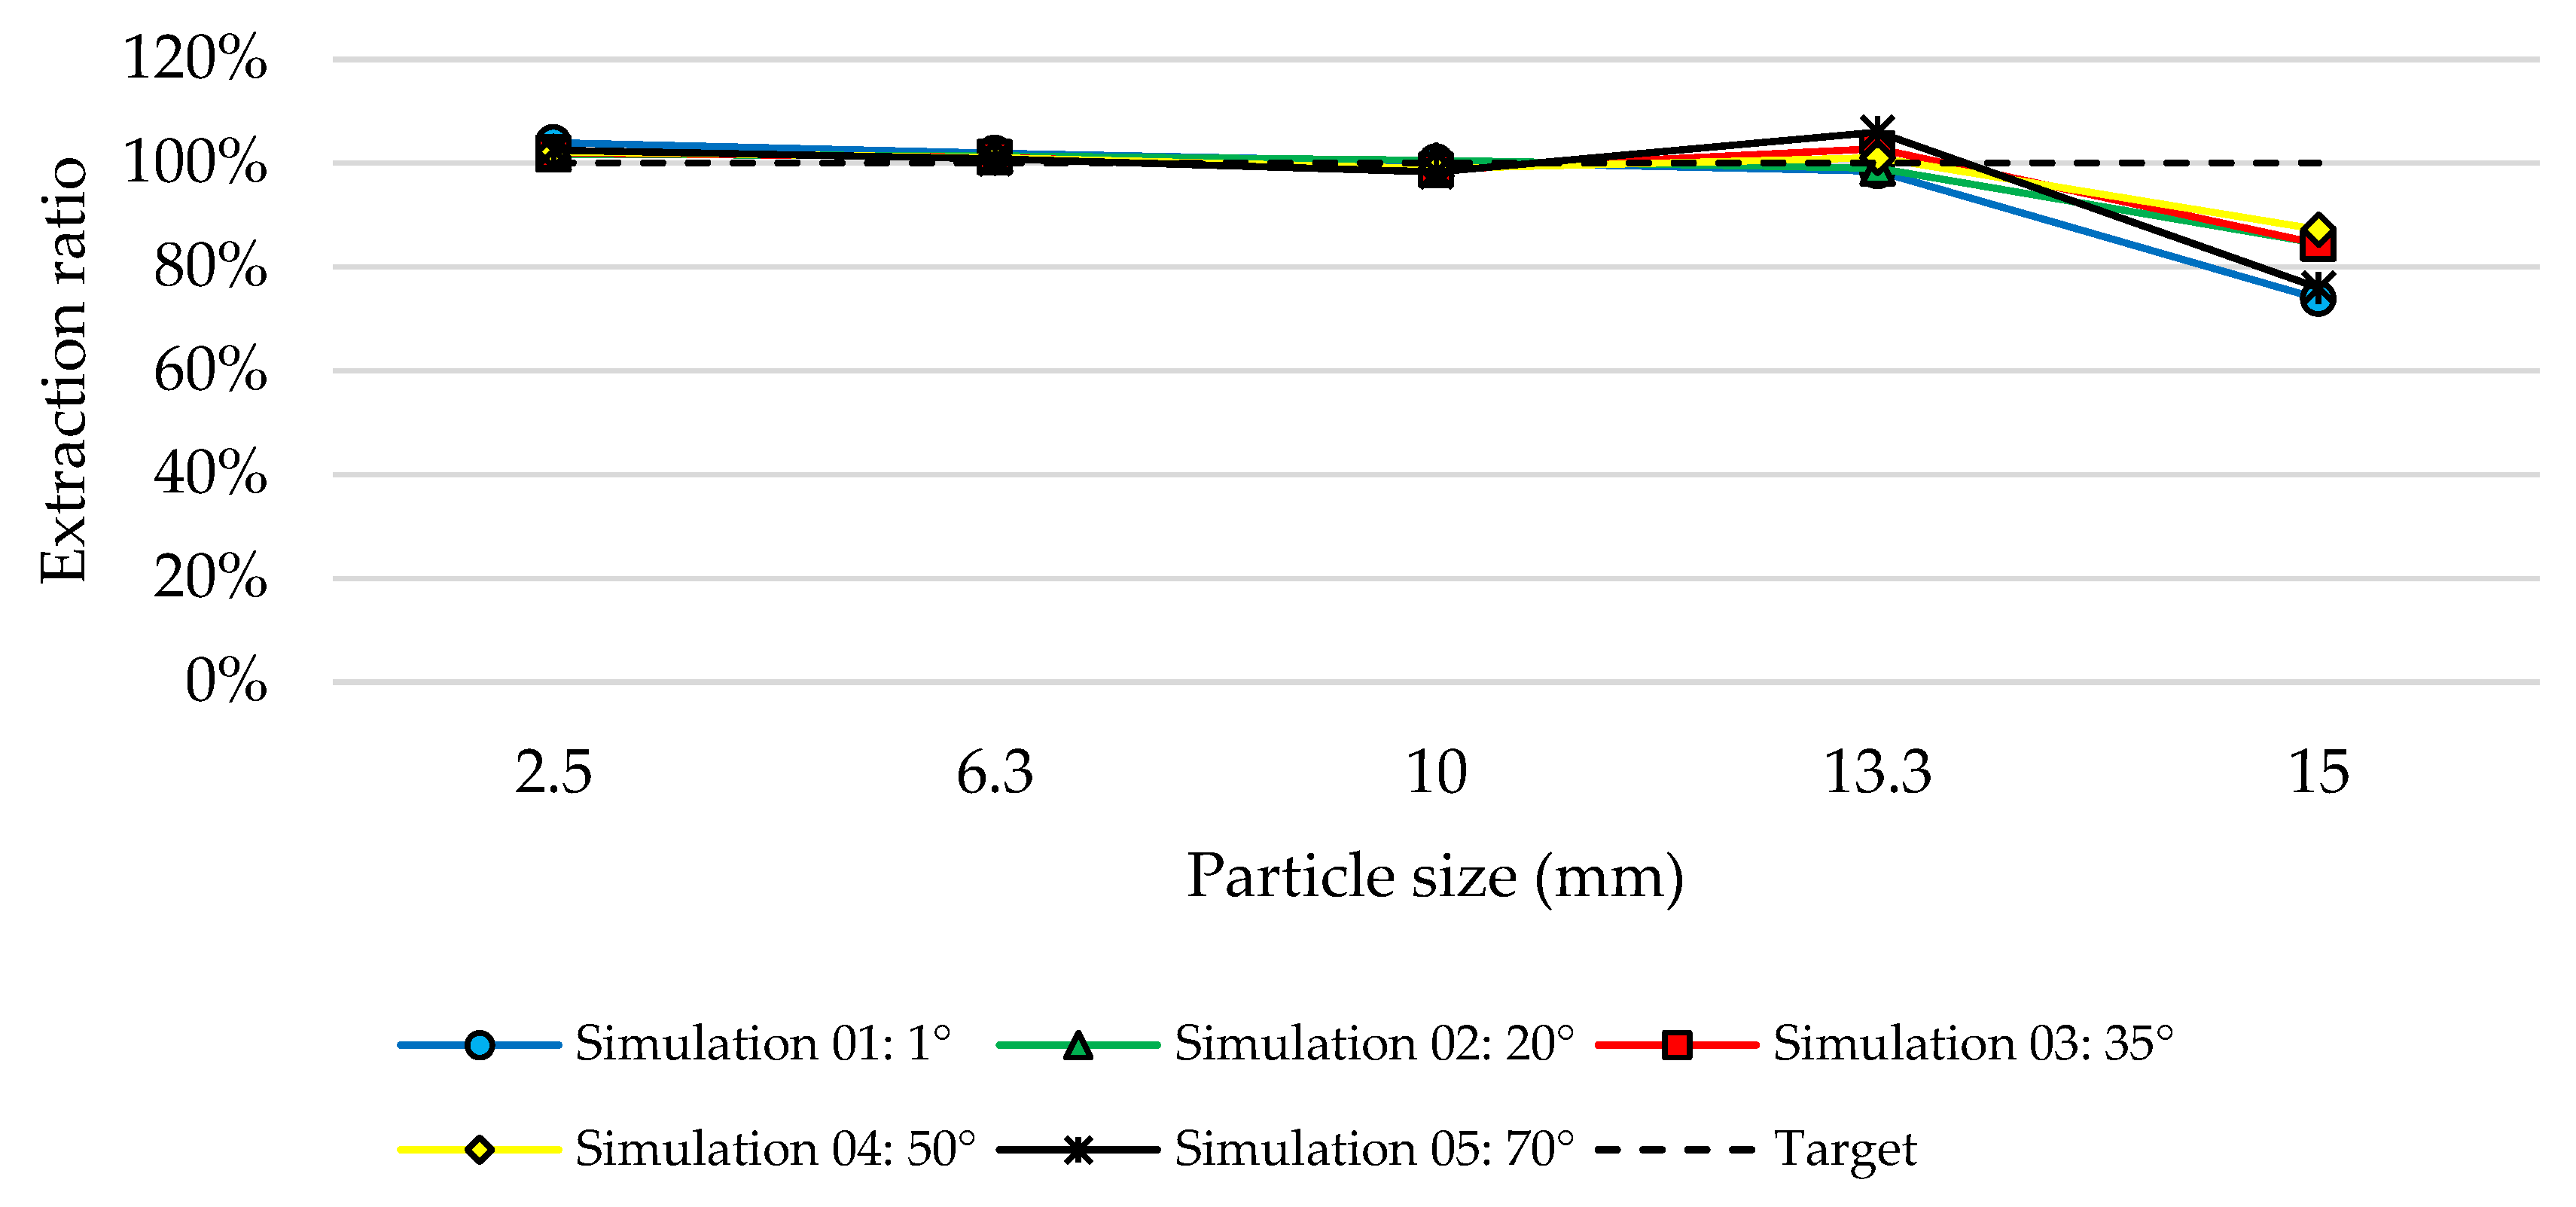
4.3.3. Cutter Edge Angle

Despite significant variations in the extraction ratio for size classes between 2.5 and 13.3 mm not being observed, a drop in the extraction ratio was observed for particles of the coarsest size group (15 mm), as can be seen in Figure 10. With the reduction of the cutter edge angle below 50°, an accumulation of fine material on the main sloping surface was also observed (Figure 11), showing an inadequate sampling condition in the simulation 3. This result compares well with discussion made in Section 4.3.2, which show that also the cutter edge angle could indeed be related to the internal angle of friction. Due to an increase in extraction of fines, low extraction ratios in the coarsest size were noted.

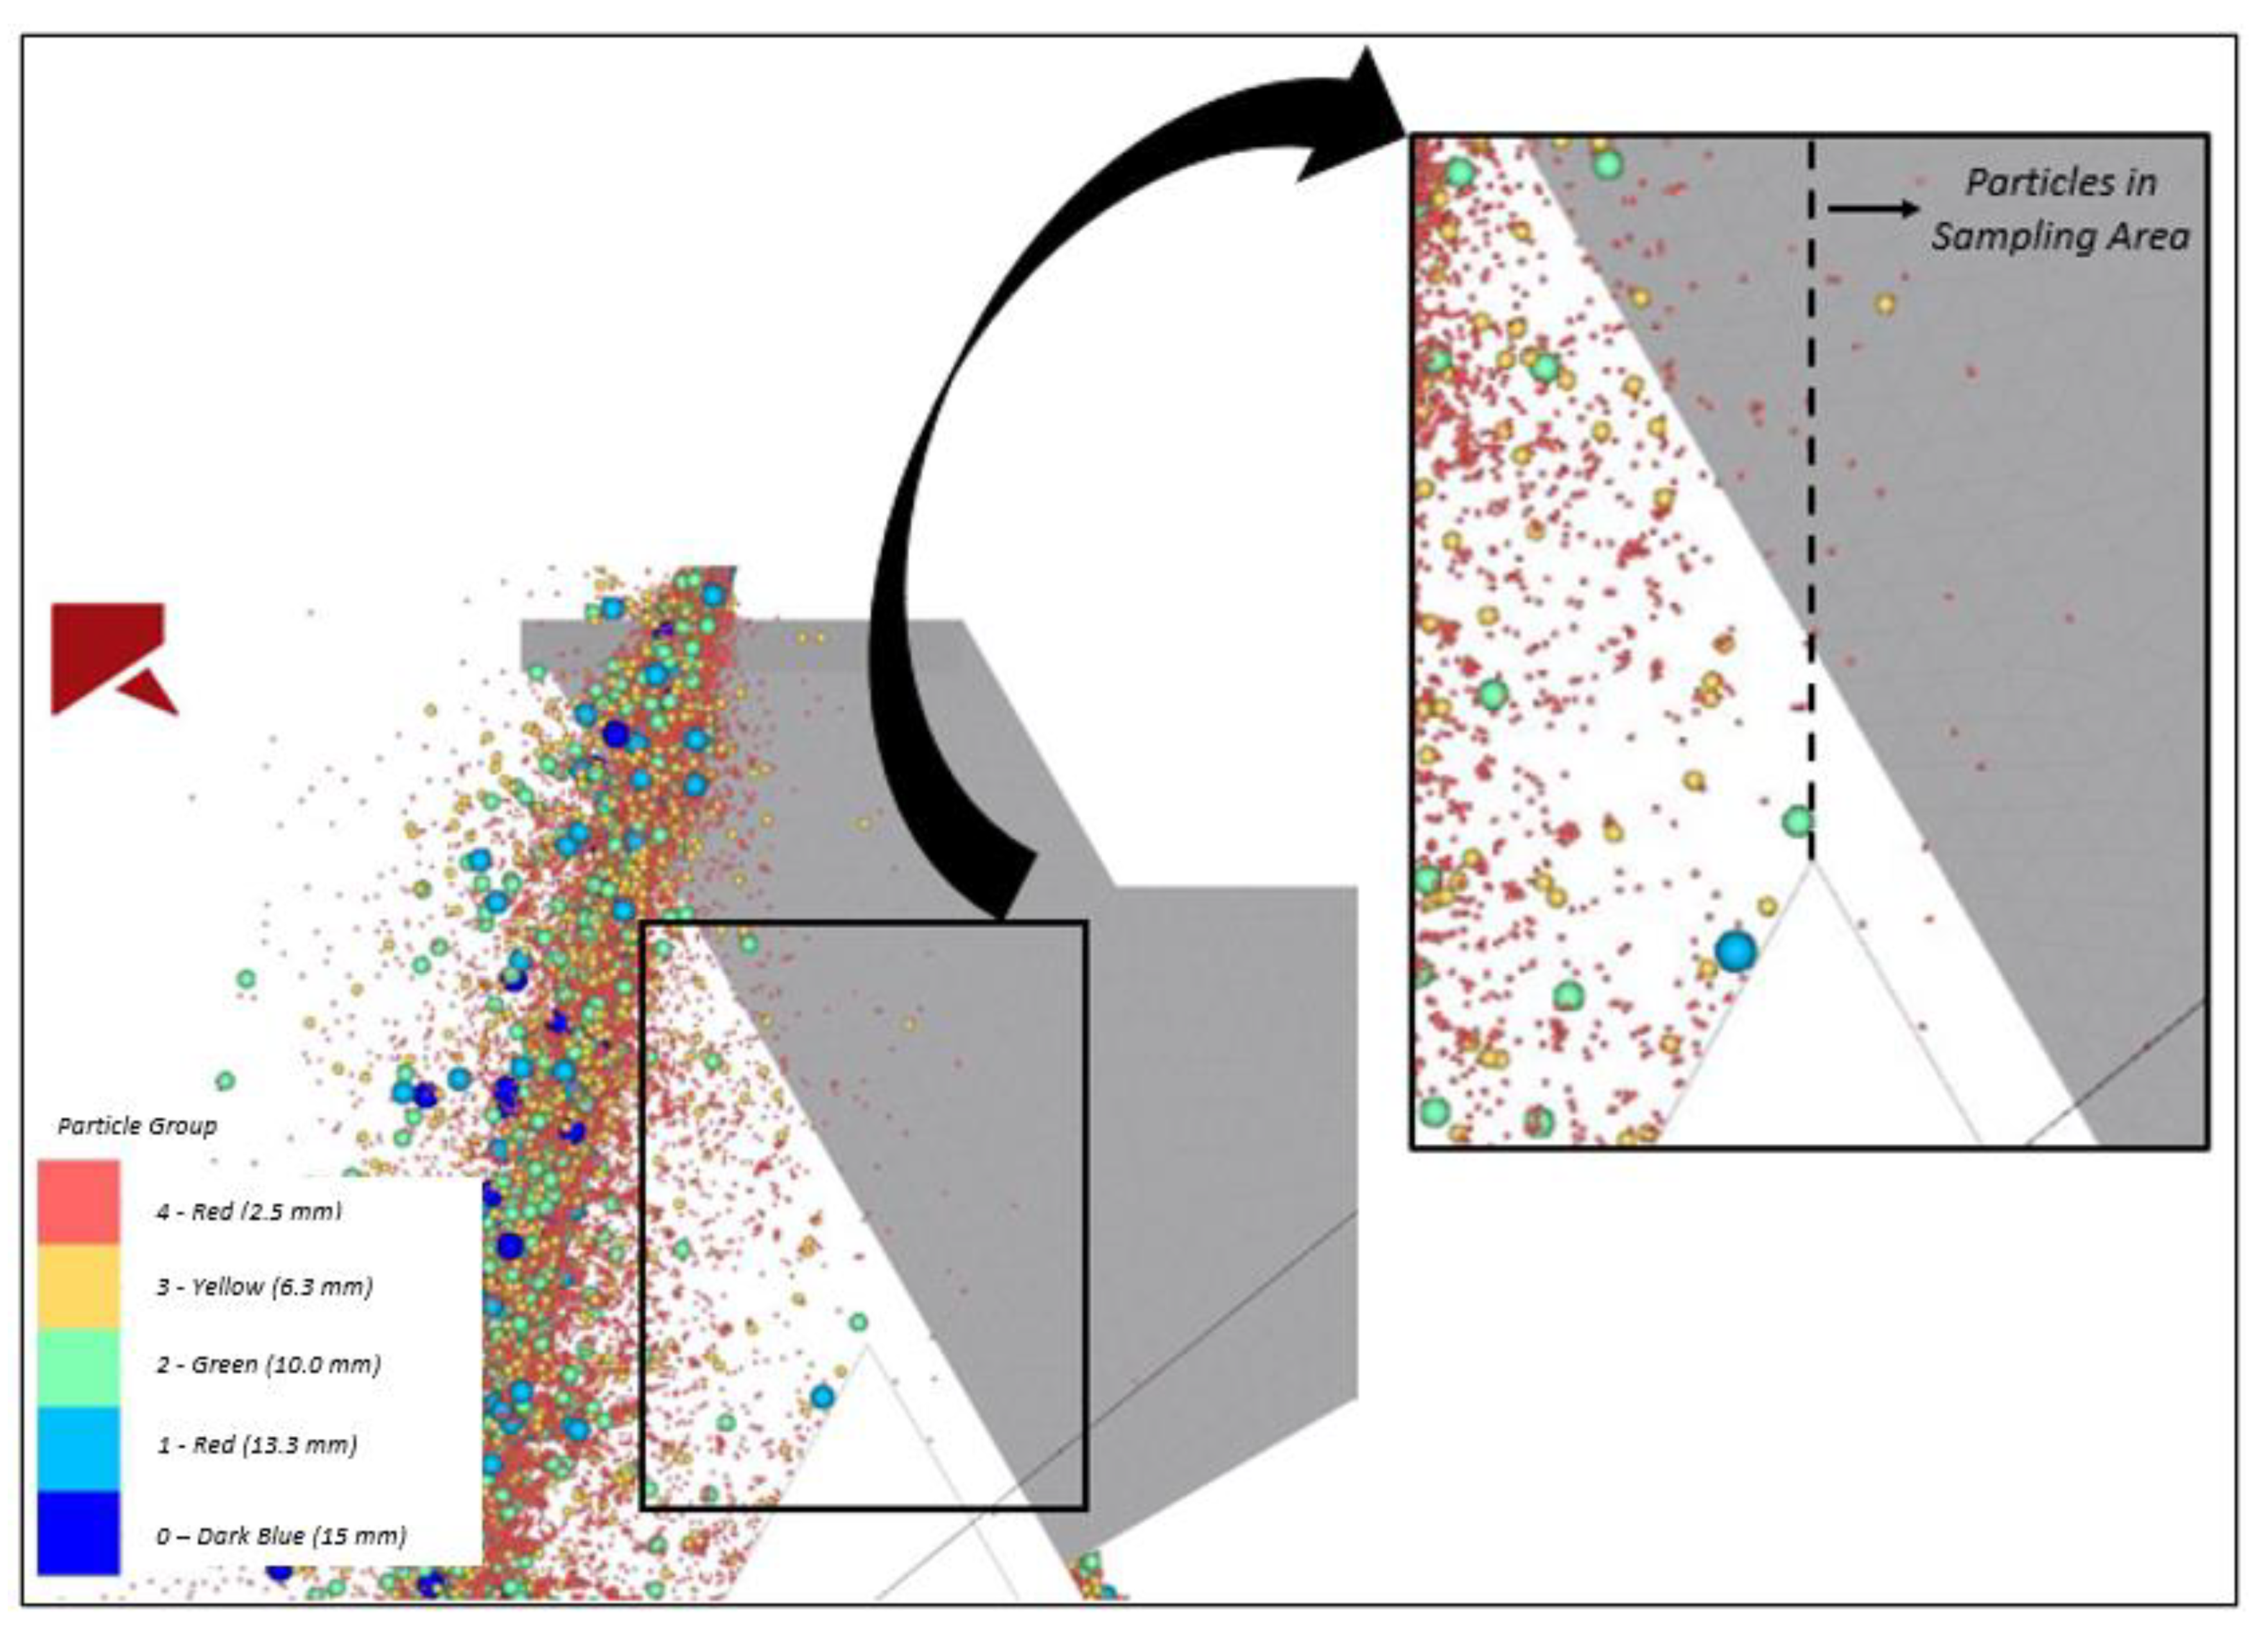
4.3.4. Cutter Velocity

With the increase in the cutter velocity, a projection of fine particles being dragged to the sample was observed. This systematic error represents a bias in the sampling process (shown in Figure 12) and must be mitigated to obtain an accurate sample. The bias manifests in the results presented in Figure 13 by an extraction ratio exceeding 100% for the finest particle group (2,5 mm). The results indicate that a cutter velocity of 45 cm/s (Simulation 1) showed the most consistent results for the five particle groups considered.
Analyzing the proportions of mass collected by each group and comparing the grades between the original lot and the sample, a bias in the gold content of +0.12% was identified, resulting from the contamination of fine particles in the sample. The grades for each particle group were obtained from laboratory tests as discussed in Section 4.1.
Based on historical data from the CDS site and confirmed by the gold grade analysis, the gold tends to concentrate in fine particles, showing the importance of having a representative sample for each particle group. Table 8 shows this comparison. Excellent agreement can be observed.

4.3.5. Solids Feed Rate

The solids feed rate is directly related to the velocity with which the particles enter the cutter. The extraction for the solids feed rate is shown in Figure 14.
Bias or significant variations were not observed in the extraction with the increase or reduction of the solids’ feed rate, showing that the system was well dimensioned. The main observation here is that, with the increase in the solids feed rate, the problem of fines dragging into the sample tends to increase. However, the problem seems to be much more influenced by the cutter speed (as discussed in the previous section).

5. Conclusions

The proposed methodology for simulating the cross-stream cutter was successfully applied, validating all simulations by the quality of the particle interactions calibration in DEM (Rocky 4.3 software provided by ESSS), obtaining values extremely close to those obtained in laboratory tests. Further, as an aside outcome, use of DoE factorial analysis to calibrate DEM parameters was also demonstrated.
The hybrid procedure for the parameter calibration of parameters used in DEM simulations, which combined the use of literature parameters for the particle–surface interactions with the experimental tests for the particle–particle interactions, showed itself to be adequate, as the results obtained in the laboratory were reproduced in the DEM environment with good accuracy in terms of repose and internal friction angles.
Based on the simulations and analysis carried out in this study, it is concluded that, for a high moisture gold ore, the main sampling problem is related to obstruction of the collectors and, therefore, a correctly dimensioned sampler is essential to ensure the mitigation of the IEE. The IEE is of great relevance to the overall sampling error, representing one of the biggest sources of sampling biases and directly influenced by material properties and cutter design.
A systematic error was identified in the sampler with contamination of fines into the sample, which generates a small bias. The bias found was +0.12%, reflecting a minimal and negligible impact on the sample grade. This result compares well with historical site data, corroborating with the gold concentration into fine particles, showing the importance of having a representative sample for each particle size group.
It is also concluded that the design of samplers must take into consideration the physical properties of the ore and, consequently, customized systems must be developed for each application. Highlighted in this study is the influence of the maximum particle size (or coarsest size fraction) and the internal angle of friction of the material handled. The ideal parameters found through this work were:
  • Cutter aperture (A): 4 times the diameter of the largest particle;
  • Cutter angle (α): ≥50°;
  • Cutter edge angle (γ): ≥50°;
  • Cutter velocity (Vmax): ≤45 cm/s;
  • Solids feed rate in the sampler: All the simulations presented acceptable results for extraction ratio.
It should, however, be noted that this study was carried out for a particular gold ore in Brazil and, therefore, its results may not be applicable to other types of gold ore. The recommendations for designing samplers according to the TOS developed by Pierre Gy is, in practice, a reference guide, but they must be used with caution and each new project must be analyzed very carefully.

Author Contributions

Conceptualization, M.F.M., A.C.C. and D.I.; Formal analysis, M.F.M. and M.G.L.; Investigation, M.F.M.; Methodology, M.F.M.; Project administration, M.F.M.; Supervision, A.C.C. and D.I.; Validation, D.I. and R.M.d.C.; Writing—original draft, M.F.M.; Writing—review and editing, A.C.C., D.I., R.M.d.C., M.G.L. and H.D.J. All authors have read and agreed to the published version of the manuscript.

Funding

This research received no external funding.

Acknowledgments

We thank our colleagues from the University of Newcastle—UoN/School of Engineer, and AngloGold Ashanti who provided insights and expertise that greatly assisted the research. The authors also are grateful to ESSS for granting the rights to use the Rocky 4.3 software to carry out this study.

Conflicts of Interest

Authors declare no conflict of interest.

References

  1. Gy, P.M. Sampling of Heterogeneous and Dynamic Material Systems: Theories of Heterogeneity, Sampling and Homogenizing; Elsevier: Amsterdam, The Netherlands, 1992; p. 653. [Google Scholar]
  2. Chieregati, A.C.; Delboni, H.; Pignatari, L.E.C.; Pitard, F.F. Proactive reconciliation as a tool for integrating mining and milling operations. Int. J. Min. Sci. Technol. 2019, 29, 239–244. [Google Scholar] [CrossRef]
  3. Pitard, F.F. Pierre Gy’s Sampling Theory and Sampling Practice: Heterogeneity, Sampling Correctness, and Statistical Process Control, 2nd ed.; CRC Press: Boca Raton, FL, USA, 1993; p. 488. [Google Scholar]
  4. Chieregati, A.C.; Pitard, F.F. Amostragem. In Tratamento de Minérios, 6th ed.; CETEM/MCTIC: Rio de Janeiro, Brazil, 2018; pp. 27–65. [Google Scholar]
  5. Pitard, F. Theory of Sampling and Sampling Practices, 3rd ed.; CRC Press: Boca Raton, FL, USA, 2019; p. 726. [Google Scholar]
  6. Cleary, P.W.; Robinson, G.K.; Sinnott, M.D. Use of Granular Flow Modelling to Investigate Possible Bias of Sample Cutters, Proceedings of the Second World Conference on Sampling and Blending, Twin Waters, QLD, Australia, 10–12 May 2005; Australasian Institute of Mining and Metallurgy: Melbourne, VIC, Australia, 2005; pp. 69–81. [Google Scholar]
  7. Cleary, P.W.; Robinson, G.K. Analysis of Vezin sampler performance. Chem. Eng. Sci. 2011, 66, 2385–2397. [Google Scholar] [CrossRef]
  8. Robinson, G.K.; Sinnott, M.D. Discrete element modelling of square cross-belt samplers with baffles. In Proceedings of the 5th World Congress on Sampling and Blending, Santiago, Chile, 25–28 October 2011. [Google Scholar]
  9. Cleary, P.W.; Robinson, G.K. Sampling of cohesive bulk materials by falling stream cutters. Chem. Eng. Sci. 2011, 66, 3991–4003. [Google Scholar] [CrossRef]
  10. Cleary, P.W.; Robinson, G.K. Evaluation of cross-stream sample cutters using three-dimensional discrete element modelling. Chem. Eng. Sci. 2008, 63, 2980–2993. [Google Scholar] [CrossRef]
  11. Cleary, P.W.; Robinson, G.K.; Golding, M.J.; Owen, P.J. Understanding factors leading to bias for falling-stream cutters using discrete element modelling with non-spherical particles. Chem. Eng. Sci. 2008, 63, 5681–5695. [Google Scholar] [CrossRef]
  12. Cundall, P.A.; Strack, O.D.L. A discrete numerical model for granular assemblies. Geotechnique 1979, 29, 47–65. [Google Scholar] [CrossRef]
  13. Ilic, D. Development of design criteria for reducing wear in iron ore transfer chutes. Wear 2019, 434–435, 202986. [Google Scholar] [CrossRef]
  14. Shen, J.; Roberts, A.; Wheeler, A. Dem simulations on gate loads and bin storage characteristics before discharge. Powder Technol. 2021, 383, 280–291. [Google Scholar] [CrossRef]
  15. Patinge, S.; Prasad, K. Screw feeder performance prediction using Discrete Element Method (DEM). Int. J. Sci. Eng. Res. 2017, 8, 48–51. [Google Scholar]
  16. Ilic, D.; Lavrinec, A.; Orozovic, O. Simulation and analysis of blending in a conveyor transfer system. Miner. Eng. 2020, 157, 106575. [Google Scholar] [CrossRef]
  17. Dallinger, N.; Hubler, J. Simulation of bottle conveyors—Opportunities of the Discrete Element Method (DEM). In Proceedings of the International Symposium Plastic-Slide-Chains and Tribology in Conveyor Systems, Chemnitz, Germany, 11–12 April 2017; Volume 3, pp. 78–86. [Google Scholar]
  18. Shen, J.; Wheeler, C.; Ilic, D.; Chen, J. Application of open source FEM and DEM simulations for dynamic belt deflection modelling. Powder Technol. 2019, 357, 171–185. [Google Scholar] [CrossRef]
  19. Silva, B.B.; Cunha, E.R.; Carvalho, R.M.; Tavares, L.M. Modeling and simulation of green iron ore pellet classification in a single deck roller screen using the discrete element method. Powder Technol. 2018, 332, 359–370. [Google Scholar] [CrossRef]
  20. Engineering Simulation and Scientific Software Rocky (ESSS-Rocky), version 4.3; Rocky-Dem Technical Manual; Engineering Simulation and Scientific Software (ESSS): Rio de Janeiro, Brazil, 2018.
  21. Ilic, D. Bulk Solid Interactions in Belt Conveying Systems. Ph.D. Thesis, The University of Newcastle, Callaghan, Australia, 2013; p. 274. [Google Scholar]
  22. Ilic, D.; Roberts, A.; Wheeler, C. Modelling bulk solid flow interactions in transfer chutes: Accelerated flow. Chem. Eng. Sci. 2019, 209, 115197. [Google Scholar] [CrossRef]
  23. Barrios, G.K.P.; Carvalho, R.M.; Kwade, A.; Tavares, L.M. Contact parameter estimation for DEM simulation of iron ore pellet handling. Powder Technol. 2013, 248, 84–93. [Google Scholar] [CrossRef]
  24. Ilic, D.; Roberts, A.; Wheeler, C.; Katterfeld, A. Modelling bulk solid flow interactions in transfer chutes: Shearing flow. Powder Technol. 2019, 354, 30–44. [Google Scholar] [CrossRef]
  25. Roessler, T.; Richter, C.; Katterfeld, A.; Will, F. Development of a standard calibration procedure for the DEM parameters of cohesionless bulk materials—Part I: Solving the problem of ambiguous parameter combinations. Powder Technol. 2019, 343, 803–812. [Google Scholar] [CrossRef]
  26. Zhou, Y.C.; Xu, B.H.; Yu, A.B.; Zulli, P. An experimental and numerical study of the angle of repose of coarse spheres. Powder Technol. 2002, 125, 45–54. [Google Scholar] [CrossRef]
  27. Grima, A.P.; Wypych, P.W. Discrete element simulations of granular pile formation: Method for calibrating discrete element models. Eng. Comput. 2011, 28, 314–339. [Google Scholar] [CrossRef]
  28. Coetzee, C.J. Review: Calibration of the discrete element method. Powder Technol. 2017, 310, 104–142. [Google Scholar] [CrossRef]
  29. Roessler, T.; Katterfeld, A. DEM parameter calibration of cohesive bulk materials using a simple angle of repose test. Particuology 2019, 45, 105–115. [Google Scholar] [CrossRef]
  30. Ajmal, M.; Roessler, T.; Richter, C.; Katterfeld, A. Calibration of cohesive DEM parameters under rapid flow conditions and low consolidation stresses. Powder Technol. 2020, 374, 22–32. [Google Scholar] [CrossRef]
  31. Cheng, H.; Shuku, T.; Thoeni, K.; Tempone, P.; Luding, S.; Magnanimo, V. An iterative Bayesian filtering framework for fast and automated calibration of DEM models. Comput. Methods Appl. Mech. Eng. 2019, 350, 268–294. [Google Scholar] [CrossRef]
  32. Wensrich, C.M.; Katterfeld, A. Rolling friction as a technique for modelling particle shape in DEM. Powder Technol. 2012, 217, 209–417. [Google Scholar] [CrossRef]
  33. Antony, J. Design of Experiments for Engineers and Scientists, 2nd ed.; Elsevier: Amsterdam, The Netherlands, 2014. [Google Scholar]
  34. Horn, E. The Calibration of Material Properties for Use in Discrete Element Models. Ph.D. Thesis, Stellenbosch University, Stellenbosch, South Africa, 2012. [Google Scholar]
  35. El Kassem, B.; Salloum, N.; Brinz, T.; Heider, Y.; Markert, B. A semi-automated DEM parameter calibration technique of powders based on different bulk responses extracted from Auger Dosing experiments. KONA Powder Part. J. 2021, 38, 235–250. [Google Scholar] [CrossRef]
  36. Example of Create General Full Factorial Design. 2018. Available online: https://support.minitab.com/en-us/minitab/18/help-and-how-to/modeling-statistics/doe/how-to/factorial/create-factorial-design/create-general-full-factorial/before-you-start/example/ (accessed on 27 July 2021).
  37. Kouiden, R. Residual Plots Revelations. 2017. Available online: http://blog.minitab.com/blog/statistics-for-lean-six-sigma/residual-revelations (accessed on 27 July 2021).
  38. Residual Analysis in Regression. 2017. Available online: https://stattrek.com/regression/residual-analysis.aspx?tutorial=reg (accessed on 27 July 2021).
  39. Katterfeld, A.; Roberts, A.; Wheeler, C.; Williams, K.; Wensrich, C.; Scholten, J.; Jones, M.; Kunze, G.; Strubelt, H.; Ilic, D.; et al. Conveying and construction machinery. In Springer Handbook of Mechanical Engineering; Grote, K.-H., Hefazi, H., Eds.; Springer: Cham, Switzerland, 2021; p. 957. [Google Scholar]
Figure 1. AngloGold Ashanti CDS—Geographical location of the plant in Brazil (illustrative without scale).
Minerals 11 00978 g001
Figure 2. Parameters for design samplers, adapted from [4].
Minerals 11 00978 g002
Figure 3. 3-D geometry of the of the cross-stream cutter installed plant feed stream (left). Side view of the cutter as implemented in Rocky and real pictures of the cutter (right): (a) beginning (b) middle (c) end of cut.
Minerals 11 00978 g003
Figure 4. (a) Lifting cylinder test, (b) Shear box test, and (c) Draw down test.
Minerals 11 00978 g004
Figure 5. Comparison between laboratory test and DEM simulatons using calibrated contact parameters (Solution 2): (a) Lifting cylinder test, (b) Shear box test, and (c) Draw down test.
Minerals 11 00978 g005
Figure 6. Extraction in cross-stream cutter as function of the cutter aperture.
Minerals 11 00978 g006
Figure 7. Close up view of the cutter in operation in two diferent DEM simulations. Particles’ velocity in cutter’s top: dark blue low velocity and light blue high velocity. (a) Simulation 05: 4D; (b) Simulation 01: 1D.
Minerals 11 00978 g007
Figure 8. Top view of the system showing particles inside the cutter. Particles are colored according to their velocity being: dark blue low velocity and light blue high velocity. (a) Simulation 05: 60°, (b) Simulation 04: 50°, (c) Simulation 03: 40°, (d) Simulation 02: 30°, (e) Simulation 01: 20°.
Minerals 11 00978 g008
Figure 9. Extraction in cross-stream cutter as function of the cutter angle.
Minerals 11 00978 g009
Figure 10. Extraction in cross-stream cutter as function of the cutter edge angle.
Minerals 11 00978 g010
Figure 11. Snapshots of the DEM simulation of the case 03 (35°) showing the fines stuck in the slope of the cutter, red represents 2.5 mm particles and yellow represents 6.3 mm particles.
Minerals 11 00978 g011
Figure 12. Snapshot of DEM simulations showing particles being dragged to the sample, coloured by particle size, with red being smallest (2.5 mm) and blue largest (15 mm).
Minerals 11 00978 g012
Figure 13. Extraction in cross-stream cutter as function of cutter velocity.
Minerals 11 00978 g013
Figure 14. Extraction in cross-stream cutter as function of solids feed rate.
Minerals 11 00978 g014
Table 1. Definition of high and low levels for the parameters considered in the calibration.
ParametersLevel
LowHigh
Sliding friction coefficient0.10.9
Rolling friction coefficient0.10.9
Attractive force0.51.0
Table 2. Determination of levels for each simulated parameter.
LevelsCutter ApertureCutter VelocityCutter AngleCutter Edge AngleSolids Feed Rate
mmcm/s°°t/h
115 (1D)4520160
222.5 (1.5D)60302073
330 (2D)75403590
445 (3D)905050105
560 (4D)1056070120
Table 3. Summary of Laboratory test results.
ParametersUnitValueStd.
Moisture (w.b.)%2.300.16
Bulk densityg/cm31.700.10
Particles densityg/cm32.830.01
Repose angle (lifting cylinder test)°291.91
Internal friction angle (shear box test)°592.08
Repose angle (draw down test)°282.80
Internal friction angle (draw down test)°672.56
Table 4. Summary of size distribution and gold grade based on particle group.
Group
Passing
%
Size
mm
Mass Distribution
%
Gold Grade
g/t
110015.05%1.98
29513.315%2.23
38010.030%2.77
4506.325%2.47
5252.525%3.54
Table 5. Definition of targets to response optimization.
ResponseLow ValueTargetHigh Value
Repose angle (lifting cylinder test)12°29°34°
Internal friction angle (shear box test)25°59°90°
Repose angle (draw down test)22°28°50°
Internal friction angle (draw down test)28°67°70°
Table 6. Optimization solutions.
SolutionVariablesComposed Desirability
Rolling Friction CoefficientSliding Friction CoefficientAttractive Force
10.890.610.720.79
20.690.900.580.78
30.620.900.600.76
Table 7. Simulated parameters, including the best fit given by Solution 2.
ResponseTargetSolution 1Solution 2Solution 3
Repose angle (lifting cylinder test)29323040
Internal friction angle (shear box test)59616058
Repose angle (draw down test)28Material didn’t flow2836
Internal friction angle (draw down test)676665
Table 8. Comparison between both grades lot x sample.
ParameterLotSample
Size (mm)2.56.310.013.315.02.56.310.013.315.0
Size distribution (%)25.025.030.015.05.025.324.829.815.54.6
Grade per group (g/t)3.542.472.772.231.983.542.472.772.231.98
Total grade (g/t)2.7672.770
Publisher’s Note: MDPI stays neutral with regard to jurisdictional claims in published maps and institutional affiliations.

