Article

Mineralization Based on CSAMT and SIP Sounding Data: A Case Study on the Hadamengou Gold Deposit in Inner Mongolia

1
Hohhot General Survey of Natural Resources Center of China Geological Survey, Hohhot 010020, China
2
School of Geophysics and Information Technology, China University of Geosciences, Beijing 100083, China
3
Xi’an Mineral Resources Research Center of China Geological Survey, Xi’an 710100, China
*
Author to whom correspondence should be addressed.
Minerals 2022, 12(11), 1404; https://doi.org/10.3390/min12111404
Submission received: 20 September 2022 / Revised: 29 October 2022 / Accepted: 31 October 2022 / Published: 3 November 2022

Abstract

:
The Hadamengou deposit is the largest gold deposit in Inner Mongolia. However, given that the sources of ore-forming alkaline magmatic hydrothermal solutions and ore-controlling structures are still controversial, the theories behind the genesis of the deposit have been controversial. In this study, four controlled-source audio magnetotellurics (CSAMT) and spectral induced polarization (SIP) profiles in the mining area were used to obtain the underground resistivity model and the pseudo section map of the apparent frequency dispersivity based on fine inversion. In the resistivity model, there are two high-resistivity blocks with resistivity greater than 3000 Ω m and three low-resistivity channels with resistivity less than 50 Ω m. Combined with the regional geological and drilling data, it is inferred that the high-resistance bodies, R4 and R5, may be alkaline magmatic intrusions related to multiple stages of magmatic hydrothermal activities, ranging from the Precambrian to Yanshanian periods. The highly conductive channels, C3, C5, and C4, may represent the Baotou-Hohhot fault, secondary faults, and ductile shear zone, respectively, which were formed in the Precambrian era and underwent multiple activations during the Hercynian to Yanshanian period. According to the spatial relationship, it is inferred that the ductile shear zone is an important ore-controlling and ore-hosting structure. However, the Baotou–Hohhot fault may be a pre-metallogenic fault rather than an ore-controlling fault. By comparing the resistivity model with the pseudo section of the apparent frequency dispersivity, it was found that all the known gold veins are located in the superimposed area of low resistivity and high-frequency dispersivity. It is speculated that the ductile shear zone outside the alkaline magmatic rock with the superimposed characteristics of low resistivity and high-frequency dispersivity is the favorable area for mineralization.

1. Introduction

The northern margin of the North China Craton (NCC) is one of the most important metallogenic belts in China, where around 900 gold deposits and dozens of molybdenum deposits have been discovered. It is the second largest gold belt and the third largest molybdenum belt in China [1,2,3]. The extremely large Hadamengou gold deposit, located in the metallogenic belt on the northern margin of the NCC, is the largest gold deposit in Inner Mongolia [4]. Owing to its large reserves and controversial deposit genesis, this deposit has received considerable research interest [4,5,6,7,8,9]. Over the past 30 years, numerous studies have been conducted on the Hadamengou deposit, with some fruitful results [4,6,10,11]. However, there is considerable controversy over the genesis of the deposit. Some of the proposed hypotheses include successive occurrence of metamorphism [12,13], migmatization [14], superimposed mineralization of multi-stage magmatic tectonic activities [15,16,17], moderate–high-temperature hydrothermal vein deposits [2,16,17], and pegmatite gold metallogenic theory [5].
The primary reasons for the above controversies are the unclear sources of ore-forming materials and ore-forming fluids, as well as the lack of understanding on the ore-controlling structures. Firstly, it is debated whether the ore-forming fluid is magmatic water, metamorphic water, meteoric water, or their mixture [2,4,18,19]. Secondly, it is controversial whether the metallogenic material is derived from the Archean Wulashan Group gneiss [14] or high-K alkaline magma [2,4,6,9,11,16,18,19]. In the latter case, the Hercynian Dahuabei alkaline pluton [1,10], Indosinian Shadegai and West Shadegai plutons [9,11,20], and pegmatites are widely distributed in the mining area [5], and it is unclear which of them is related to gold mineralization. In terms of metallogenic structure, there is a serious disagreement on which one of the following is the ore-controlling structure: the Baotou–Hohhot fault (piedmont fault) [17,21,22], secondary faults and folds [2,7], or ductile shear zones [12,22,23].
The primary reason for the above-mentioned issues is the lack of spatial and temporal understanding of the structures related to the Hadamengou gold deposit. These include alkaline magmatic intrusions, the Baotou–Hohhot fault and its secondary faults, and ductile shear zones. The use of geophysical prospecting technology to examine the spatial distribution characteristics of magmatic intrusions, faults, and ductile shear zones under the deposit can be extremely useful to constrain the metallogenic process of the Hadamengou gold deposit.
The controlled-source audio-frequency magnetotellurics method (CSAMT) is an artificial-source frequency-domain sounding method developed based on the magnetotellurics (MT) and audio-frequency magnetotellurics (AMT) methods [24]. The transmitting waves are approximately regarded as plane waves in the far field, and the definition of the Cagniard resistivity is followed from the MT method with a simplified electromagnetic response formula. Compared with electromagnetic methods that utilize natural sources, the CSAMT signal strength can be manually controlled and send alternating currents with a frequency range of 2−3~213 Hz underground to establish alternating electromagnetic fields in subterranean space [25]. Field polarization can be selected by adjusting the orientation of the transmitter antenna [25]. The CSAMT method has the advantages of higher resolution and greater exploration depths compared to other methods, and can effectively determine the underground mineralization-related structures in metallic deposits, such as faults, the distribution of ore bodies, and lithologic contact belts, playing an important role in the exploration of mining areas and the metallogenic mechanism [26,27]. Previous studies have demonstrated that granite bodies, such as alkaline magmatic bodies and pegmatite veins in the study area, have high resistivity, while the structural fracture zones, such as residual slope deposits, faults, and ductile shear zones, have low resistivity [28,29]. The spectral induced polarization (SIP) method, also known as the complex resistivity (CR) method, is a frequency-domain method that was developed on the basis of induced polarization (IP) [27,28]. Compared with IP, SIP can provide more spectrum information. It measures the complex apparent resistivity of the earth in a wide frequency band (10−2~n × 102 Hz) by transmitting alternating currents underground, which can reflect the geophysical characteristics with depth less than 300 m by analyzing and studying the relationship between the complex apparent resistivity and the morphological characteristics of phase anomaly and the underground polarized body, widely used in the exploration of mineral, oil, and gas resources nowadays [30]. However, due to its inefficiency and high cost, SIP is mostly used for precise surveying in the favorable areas for mineralization [30,31,32].
Previous studies have shown that CSAMT and SIP joint prospecting have achieved some useful results, such as the Pebble porphyry deposit in southwestern Alaska and the Daliuzhuang iron deposit in Shanxian County, as well as the molybdenum mining areas in Henan Province [33,34,35,36]. In this study, we collected CSAMT and SIP data simultaneously on four north–south profiles in the Hadamengou mining area and obtained high-precision resistivity and frequency dispersivity models. By comparing the results of CSAMT and SIP, we delineated some areas with both resistivity and polarizability (low resistivity and high-frequency dispersivity) anomalies in spatial, consequently providing geophysical constraints for the genesis of the Hadamengou deposit.

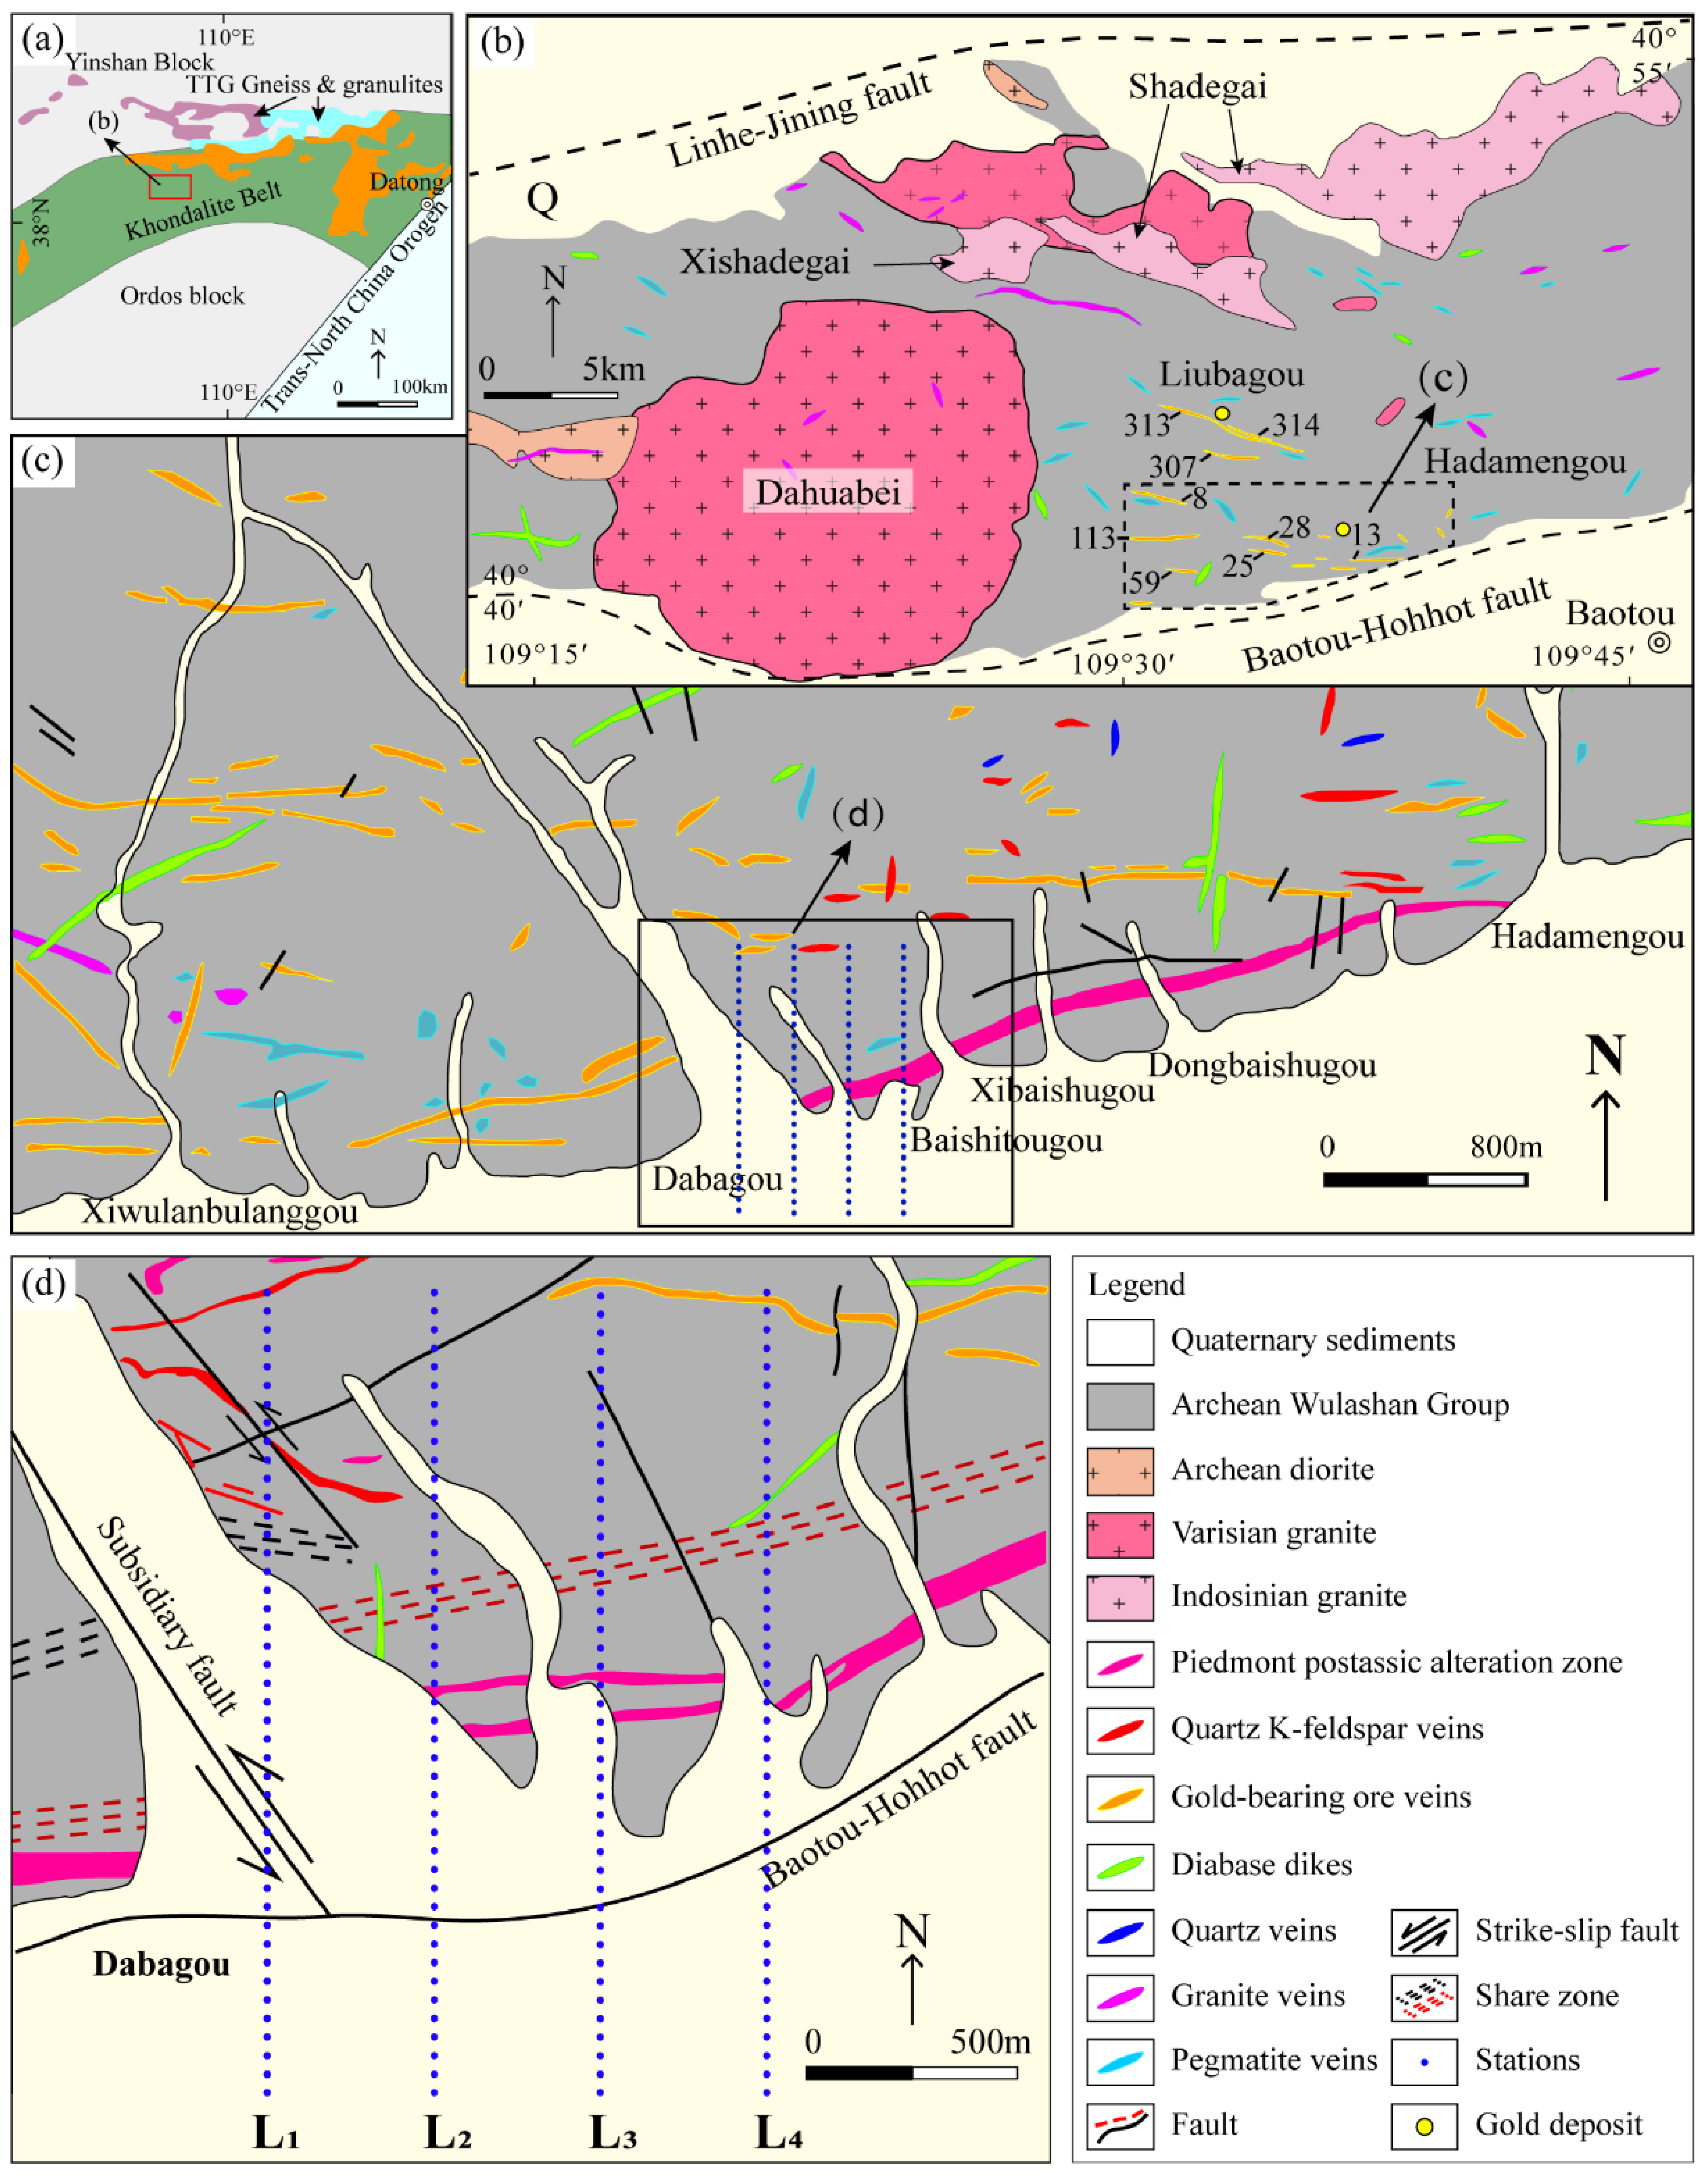
2. Regional Tectonics and Metallogenic Background

The gold belt at the NCC is located at the junction between the northern margin of the NCC and the eastern section of the Central Asian Orogenic Belt (CAOB) [4]. It is a superimposed composite zone of three giant tectonic domains of the NCC, Paleo-Asian Ocean, and Pacific Ocean, which has been subjected to complex magmatic and tectonic processes [37]. Since the Mesozoic era, with the closure of the Paleo-Asian Ocean and the westward subduction of the Paleo-Pacific plate, the NCC has entered the Circum-Pacific tectonic domain and experienced strong tectonic pattern transformation along with the destruction and reconstruction of the craton, which was coupled with regional tectonic evolution and magmatic activity, resulting in large-scale gold and other polymetallic mineralization [38,39,40].
The study area is in the western part of the Inner Mongolia Uplift in the middle and western part of the northern margin of NCC. The Inner Mongolia suture zone (IMSZ, also known as the Khondalite belt, Figure 1a) between the Yinshan block and the Ordos block belongs to the Wulashan–Daqingshan metallogenic belt [15]. The tectonic framework is primarily located in the approximate east–west direction, and the main structures include the Baotou–Hohhot fault extending in the approximate east–west direction, the Linhe–Jining deep fault (Shanhou fault), and some smaller northeast and northwest structures (Figure 1b) [6,7]. Ductile shear mylonite zones of different stages are developed in the Baotou–Hohhot fault zone, and the fault has been activated many times [5]. The Baotou–Hohhot fault and its secondary faults and ductile shear zones jointly control the distribution of the piedmont potassic alteration zone, potassic pegmatite vein, a small amount of granite vein, diabase vein, and auriferous quartz-pyrite vein [4,6,11]. Magmatic activities in the study area are frequent, with an obvious multi-stage nature, and intrusive rocks and vein rocks are well developed. There were magmatic activities from the end of Archean to the Yanshanian period. Among them, the Dahuabei alkaline granite body in the west of the mining area was formed during the Hercynian magmatic activity, which is the largest exposed granite body in the region and has silicon-rich, alkali-rich, and potassium-rich characteristics. Its east side is less than 5 km away from the No. 113 ore vein (Figure 1b), which is considered to be closely related to the gold deposit [2,15,41]. The Shadegai and Xishadegai rock bodies in the northern part of the mining area were formed by Indosinian alkaline magmatism, and it has high silicon content, high alkalinity, and strong oxidizability. The latter is nearly 8 km away from the No. 313 vein (Figure 1b), which is also considered to be related to the formation of the Hadamengou gold deposit [2,11,17,18,42]. Dike rocks are widely exposed in the area, most of which are potassic alkaline pegmatite dikes, mainly distributed in the east–west direction (Figure 1b, d), with a width ranging from 1 to 18 m and a length ranging from several meters to several kilometers. These rocks are often associated with gold-bearing quartz-pyrite veins [2,5,6]. In addition, there are a few diabase dikes and granite porphyry dikes [9].
The Hadamengou gold deposit, discovered in 1986, is localized in the metamorphic rocks of the Upper Wulashan Subgroup, and the main ore-bearing lithology is gneiss. Until now, the deposit has accumulated 170 tons of proven gold resources, with an average grade of 4.13 G/t [2,11]. More than 100 gold veins have been found in the mining area, and the ore bodies are mainly distributed in the approximate east–west direction in a parallel and equidistant manner. The ore bodies occur in the Archean Wulashan Group and are obviously controlled by the east–west Baotou–Hohhot fault and its secondary faults [4]. According to the spatial location, the deposit can be divided into seven mineral vein groups and three mining areas [7]. Each group contains dozens of gold veins. According to the occurrence of gold veins, most of the veins are in the approximate east–west direction, and a few are in the north–west direction [11,43]. The wall rock alteration of the deposit is widely developed, mainly including potash feldspathization, silicification, sericitization, chloritization, and carbonatization. Among them, potash feldspathization is the most common and main wall rock alteration in this area, with it mostly distributed in the gold-bearing mineralization zone and both sides. There is no obvious boundary between the ore body and the wall rock, showing a gradual transition relationship. Potash feldspathization is followed by silicification and sericitization, which are mostly associated with pyritization and closely related to gold mineralization.

3. Data Acquisition and Processing

3.1. Data Acquisition

The CSAMT data of the four survey lines used in this study were collected by the Hohhot General Survey of Natural Resources Center, China Geological Survey in 2019. The locations of the survey points are shown in Figure 1c,d. The GDP-32-∏ multi-functional electrical detection system (Zonge Engineering Company, Tucson, AZ, USA) was used. The emission source was an electric dipole source parallel to the direction of the survey line. The electrode distance was 1 km, and the distance between the transmitter and the receiver was 7 km. The horizontal electric field component and the orthogonal magnetic field component were acquired in the frequency range of 1–8192 Hz, including 22 frequency points. The original data curve of some points on the measurement line is shown in Figure 2, which indicates that the overall signal-to-noise ratio is good.
The SIP sounding data were acquired using a V8 multifunctional electrical detection system (Phoenix Geophysical Company, Toronto, ON, Canada). The system included four parts for transmission, receiving, positioning, and data recording and processing. A dipole–dipole device with three poles for receiving and transmitting was adopted. This implies that when the emitter ran three times, the farthest instrument at the receiving end was moved to the transmission end to become the closest instrument. The emitter spacing was AB = 80 m, and the receiver spacing was MN = 40 m. The observation frequency range was 0.0625–128 Hz, with 12 frequency points in total, and the single point observation time was more than 20 min.

3.2. Data Processing and Inversion

The collected data were preprocessed by the ASTATIC software (version 2.1, Zonge Engineering Company, Tucson, AZ, USA) to obtain the impedance values. The Italian data processing platform WinGlink (version 2.20.01, GEOSYSTEM, Inc., Viale Abruzzi, Milan, Italy) was used for two-dimensional (2D) inversion with topography. The pseudo-MT method was employed for the inversion with a nonlinear conjugate gradient inversion program as the core algorithm [44]. Seriously disturbed data were edited using near-field source interference. The frequencies of the data below the lowest far-field frequency of 32 Hz were deleted and the frequencies away from the smooth curve were eliminated. A fresh model was created and mesh-refinement was performed, combining topographic information. We conducted the 2D inversion of TM mode with a minimum frequency of 10, using the measured data instead of the smoothing data. According to the L-shaped curve of smoothness and root-mean-square (RMS) error, the best trade-off factor tau was 1. The error floors were set at 15 percent for resistivity and 10 percent for phase.
The validation and compensating computation of the observed data was performed using the data processing software of Zhonghaida HDS2003 (Zhonghaida, Guangzhou, China). The SIP PRO software (version 4.1.2, Phoenix Geophysical Company, Toronto, ON, Canada) was used for the pretreatment of the data, which included distorted point removal, data conversion, electrode coordinate deviation correction, and correction of the electromagnetic induction coupling effect in sequence. The measured spectra included a near-field electromagnetic spectrum (EM) caused by conductivity and IP caused by electrical susceptibility. These two kinds of spectra occupy the different positions in the frequency band, which can be separated by inversion of the measured video spectra with different models with the purpose of removing the electromagnetic spectrum response and calculating the SIP parameter of interest (frequency dispersivity), consequently obtaining the pseudo section map of the apparent frequency dispersivity.

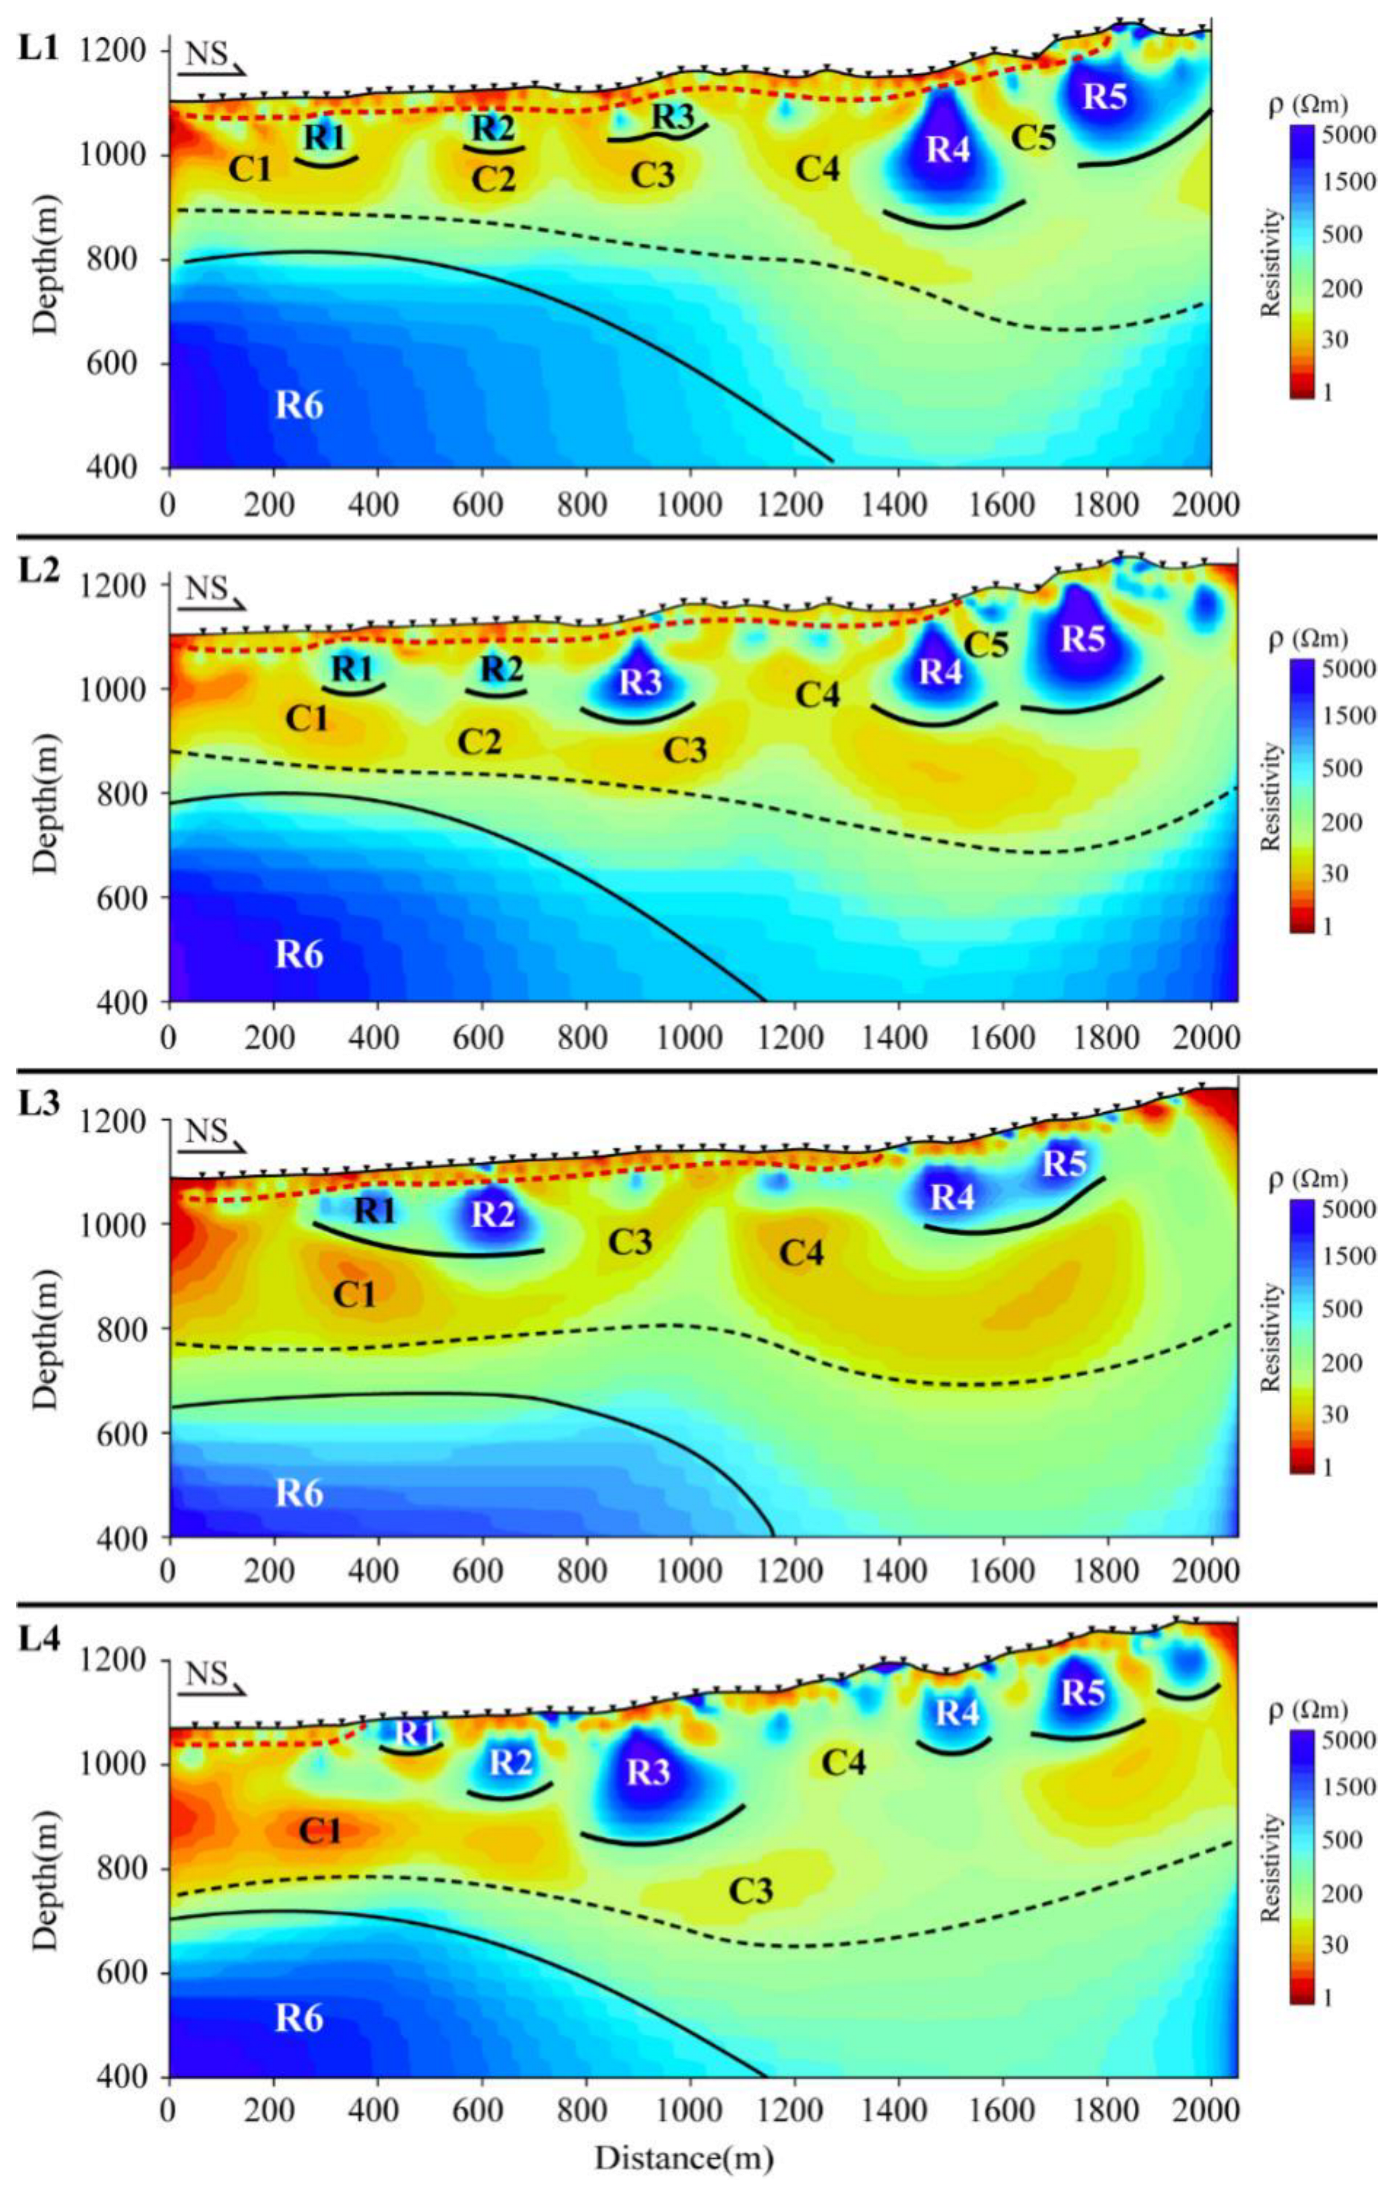
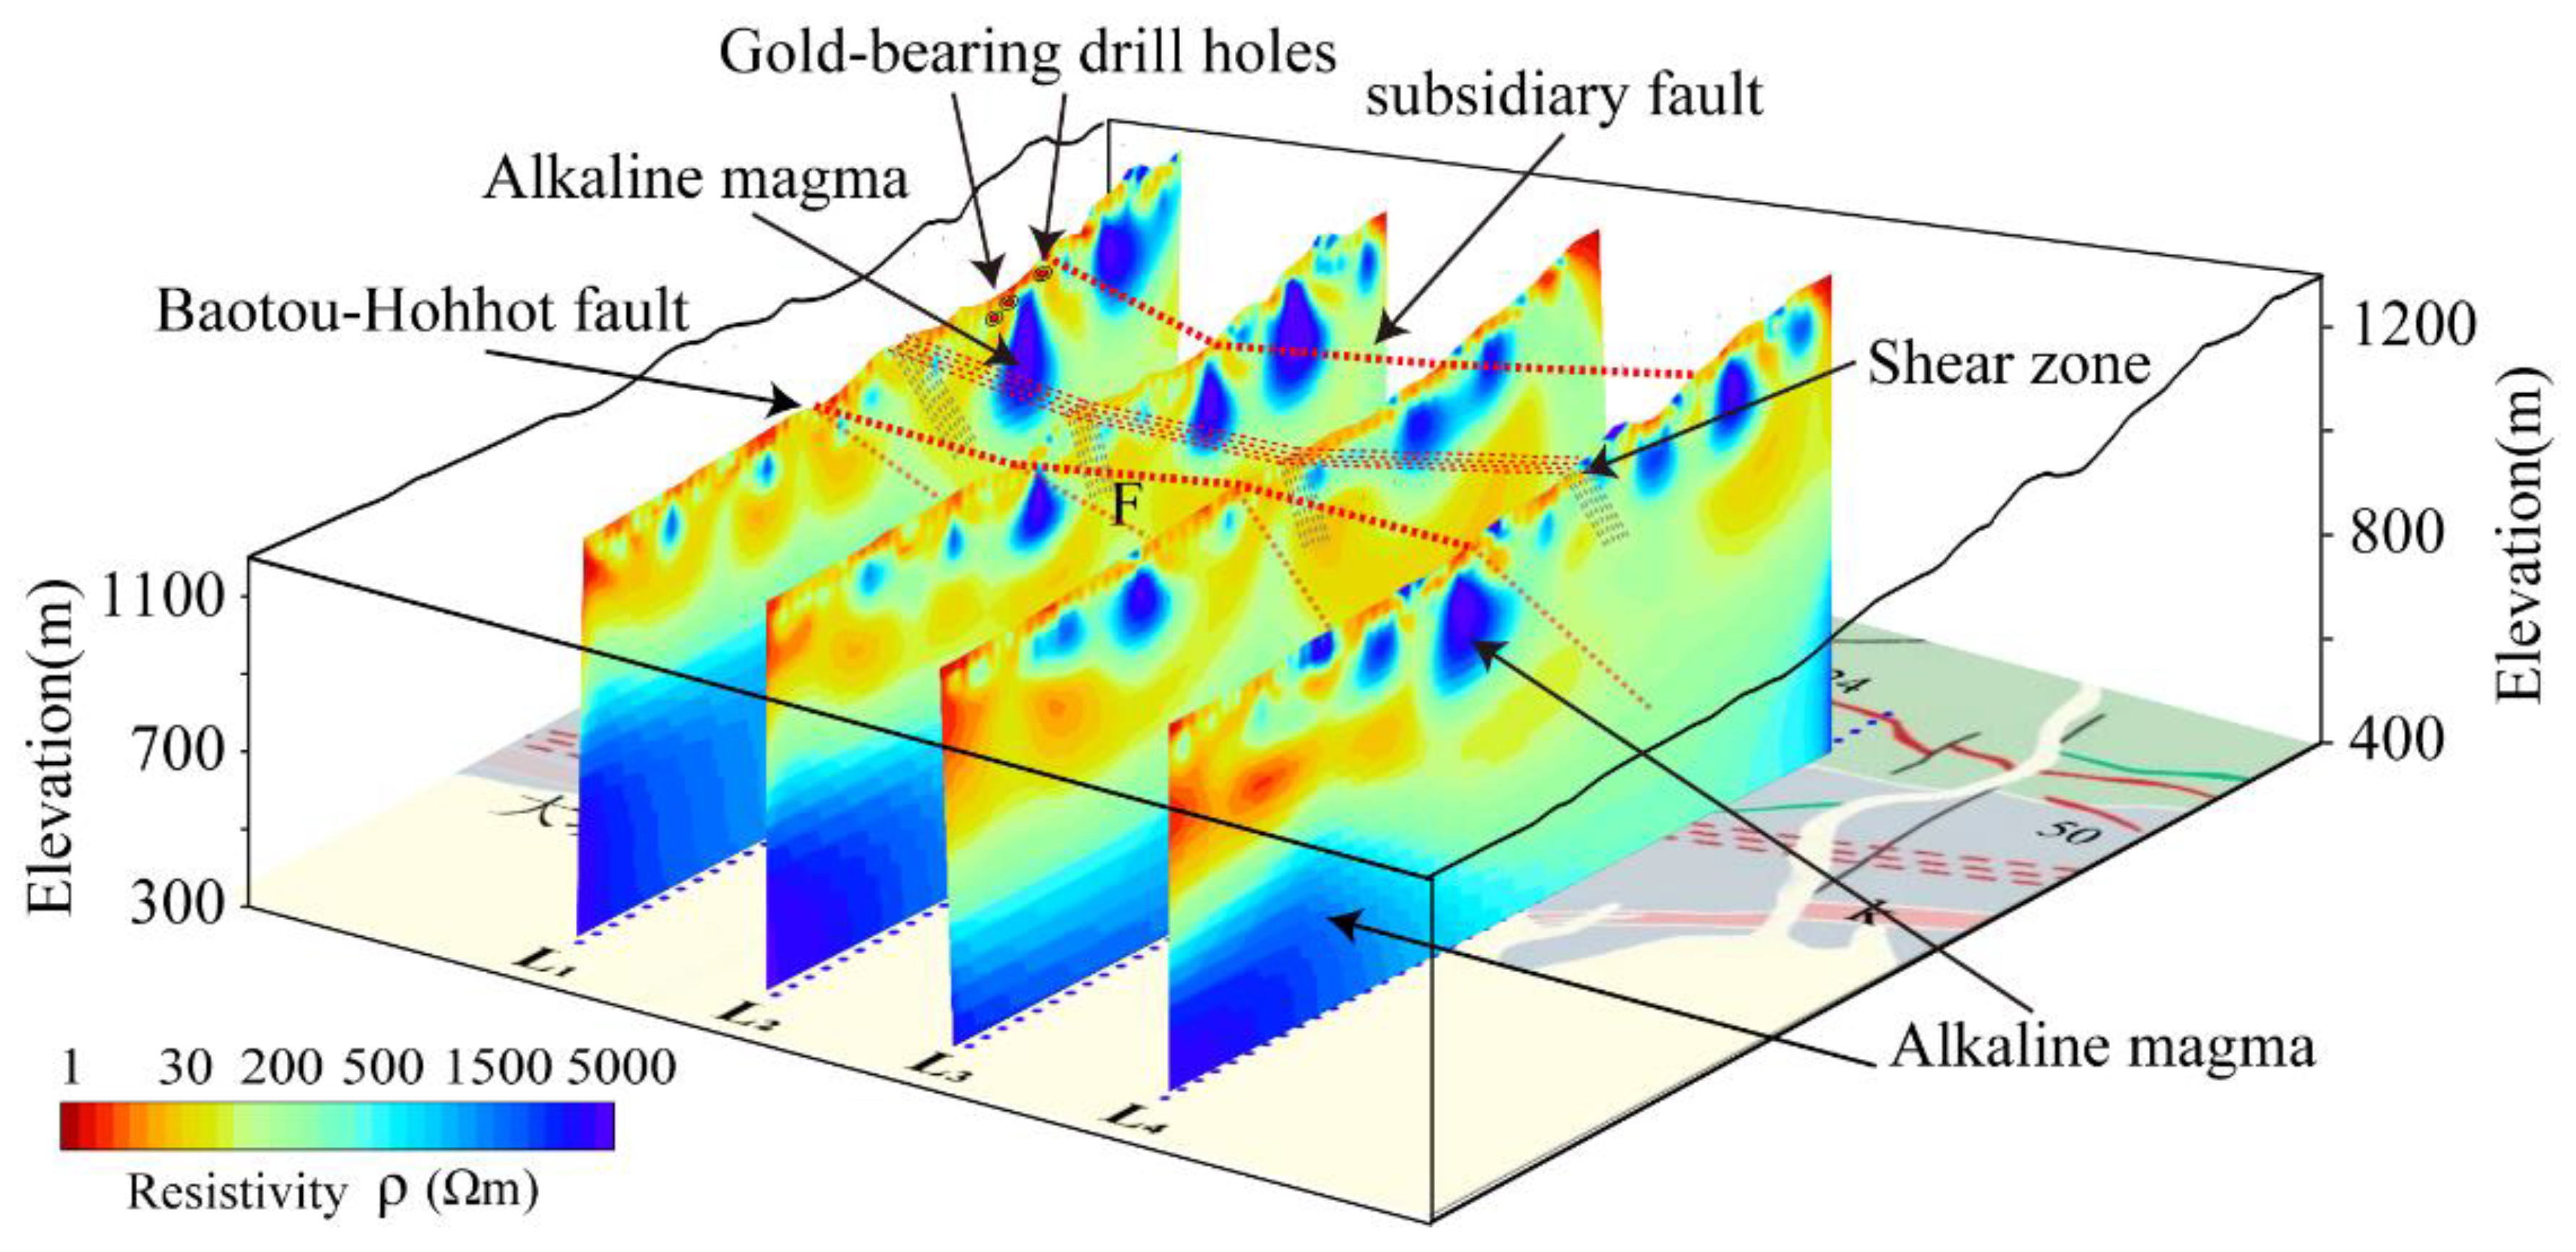
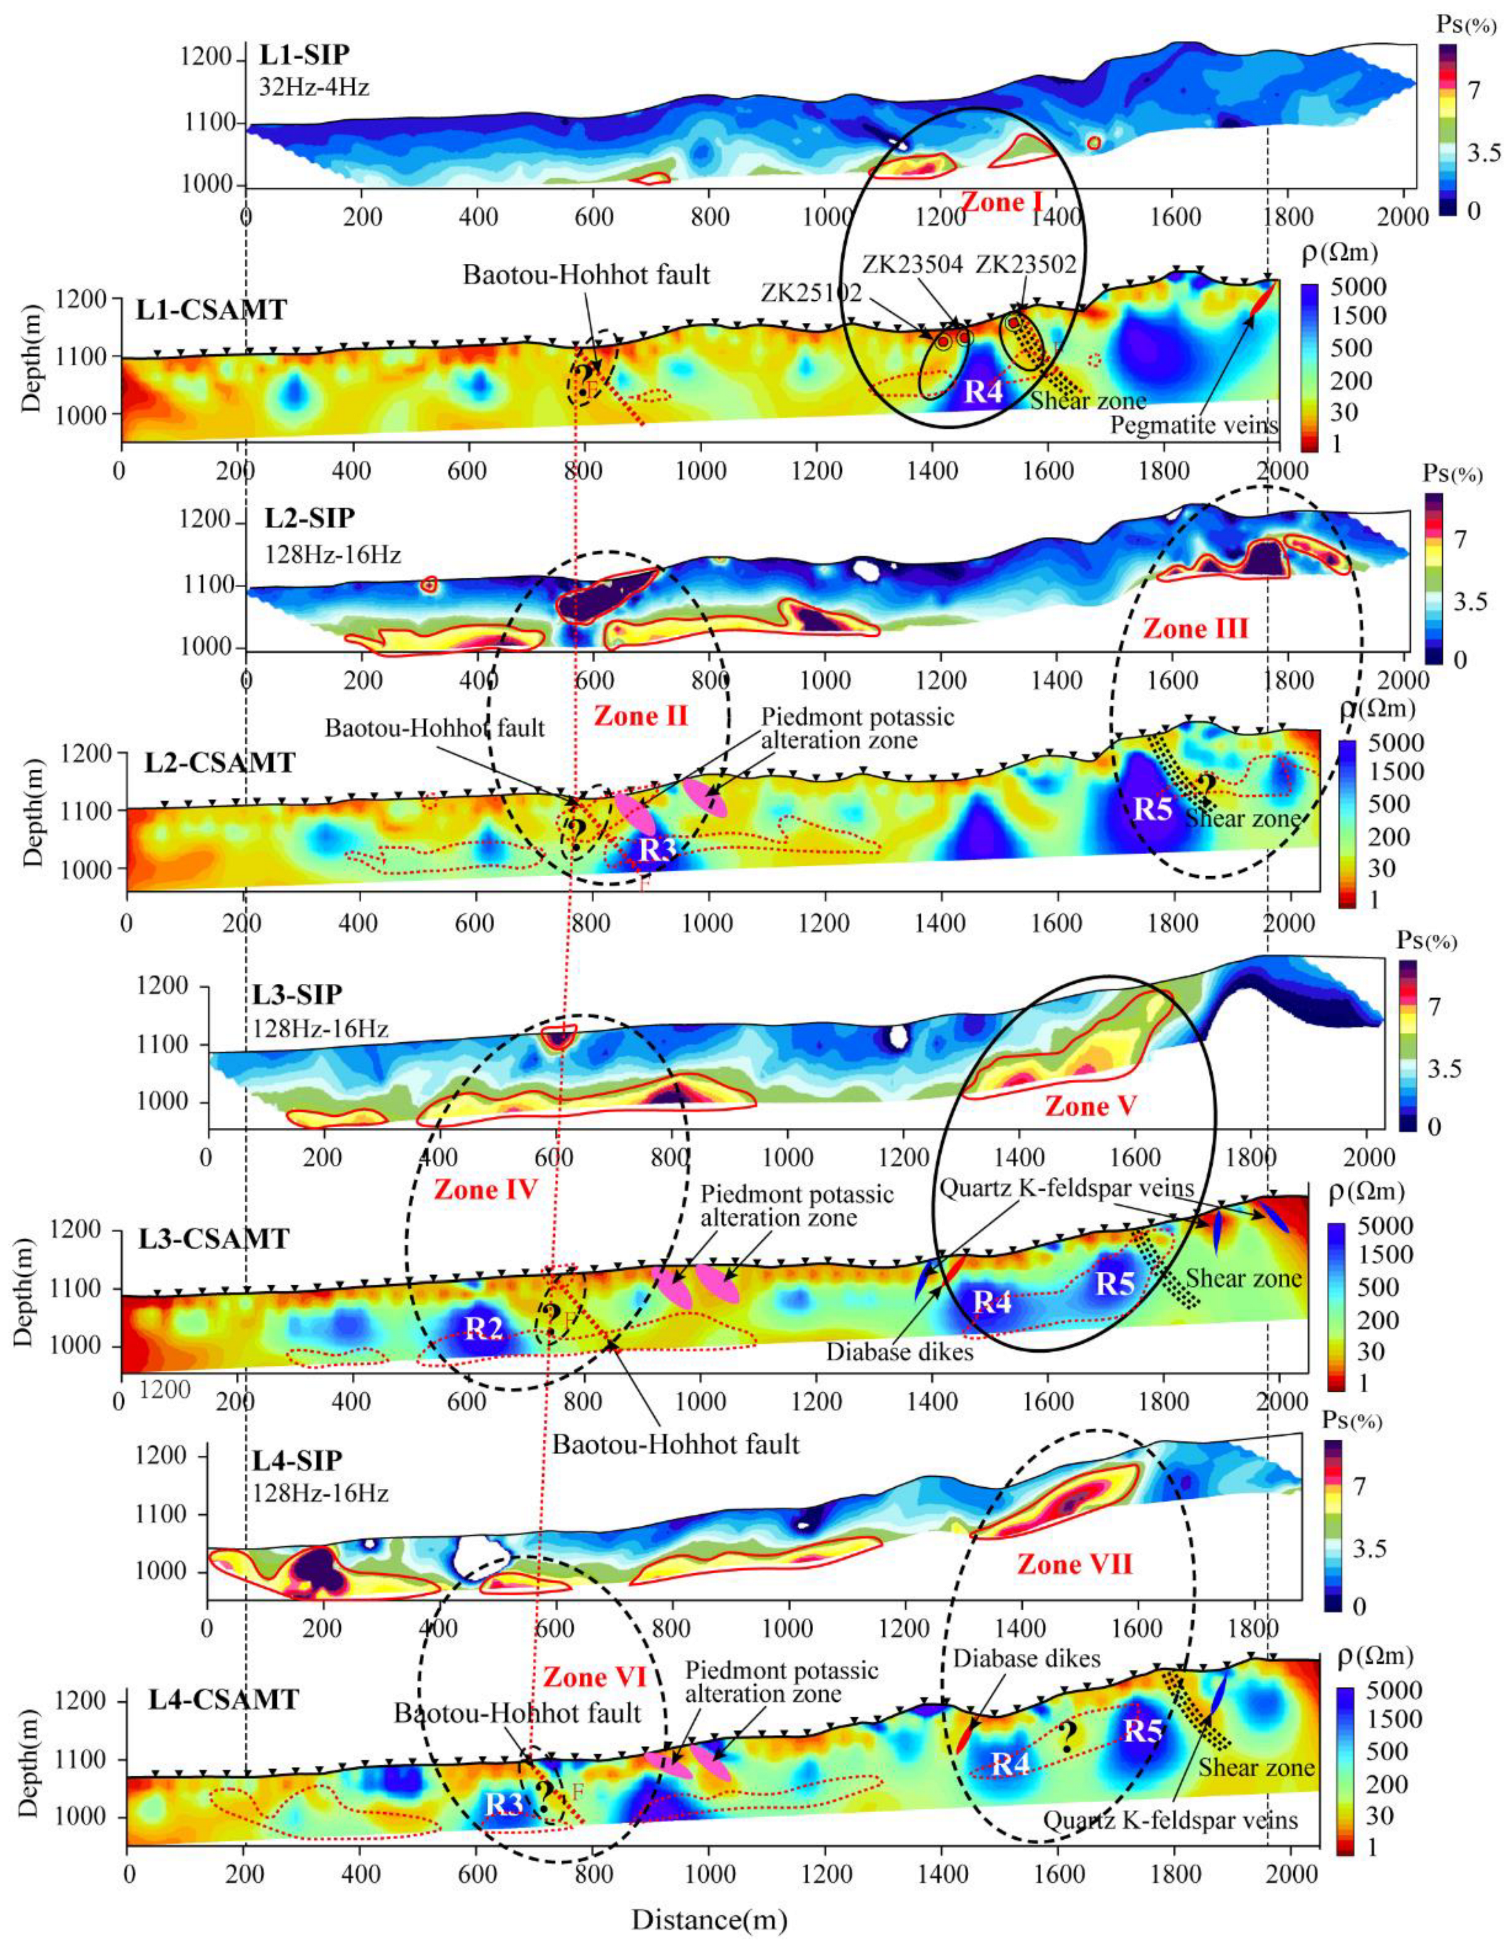
3.3. Electrical Characteristics of the Profile

The length of the four survey lines was 1940 m, and the survey line orientation was in the north–south direction. The four survey lines, L1, L2, L3, and L4, were arranged in parallel from west to east. The point spacing was 40 m; each measurement line had 49 measurement points, and the measurement line spacing was 400 m (Figure 1c).
The electrical response characteristics of the model were found to be standard. Longitudinally, a continuous low-resistivity overburden in the entire profile extending from the surface to an underground depth of approximately 20–30 m with a resistivity value of about 25 Ω m was observed. Some small-scale high-resistivity bodies (apparent resistivity value of more than 1000 Ω m) in some areas have been observed. These are characterized by obvious stratification and uniform thickness, and they change with the topographic relief (Figure 3). Spatially, the low-resistivity overburden in the southern segment is relatively continuous, while that in the northern segment is discontinuous and thinned. The resistivity value under the high resistivity layers increases rapidly, and the local resistivity value reaches more than 5000 Ω m. The high-resistivity body is discretely distributed along the direction of the measurement lines at the approximate depth (such as R1, R2, R3, R4, and R5 in Figure 3), and the thickness varies from 50 to 300 m. Under the high-resistivity layer, there is a thick medium–low-resistivity layer with a thickness ranging from 100–300 m and a resistivity value ranging from 10–50 Ω m. It is characterized by a strong layering, uniform thickness, and minor depth change along the profile direction. In the cross profile L1, the high conductors C1, C2, and C3 exist discretely, and in the cross-sections of L2, L3, and L4, the high conductors C1, C2, and C3 are connected to each other as a whole. In terms of the penetration depth, C4 and C5 have a large downward extension depth. C4 is in the range of 1000–1400 m along the southern end of the profile; it has a large scale, a resistivity value of approximately 30 Ω m, and a south dip of 45°. C5 is in the range of 1600–1700 m along the southern end of the profile; it has a small scale, a resistivity value of approximately 50 Ω m, and a south dip of 60°. Horizontally, the southern section of the shallow part is mainly characterized by high conductivity, while the northern section is primarily characterized by high resistivity. The deep south section is dominated by high resistivity, and the deep north section is dominated by medium–high conductivity. A high-resistivity body R6 (resistivity: 3000–5000 Ω m) exists along the south end of the profile in the range of 1000–1200 m, whose underground depth is 700 m along the bottom of the profile. Along the southern end of the profile, the resistivity value decreases rapidly in the range of 1200–2000 m, and the average resistivity value is 300–500 Ω m. The boundary between high-resistance and low-resistivity areas is clear.
By comparing the profile models and representing them as three-dimensional (3D) vertical slices (Figure 4), it can be found that the main resistivity anomalies in the four models are continuous along the strike direction of the overall structure.

4. Geological Interpretation and Discussion

4.1. Relationship between the Resistivity and Frequency Dispersivity

Generally, saline fluids, fault zones, graphite, and mineralization (gold ore, pyrite, and other metal sulfides) can result in low resistivity [36]. Measurements of physical properties in the study area indicate that the resistivity and frequency dispersivity of metamorphic rocks are low, while the frequency dispersivity value of cataclastic rocks and alteration zones is high, which increases with sulfides content [34]. As shown in Figure 5, there are two regions with high-frequency dispersivity in the middle and north of profiles L2, L3, and L4, from the near surface to a depth of 150 m, where the frequency dispersivity value is greater than 6%, reaching more than 10% locally. To visualize the relationship between resistivity and frequency dispersivity, the apparent resistivity model is compared with the apparent frequency dispersivity pseudo section in Figure 5. The apparent resistivity obtained via the CSAMT method combined with frequency dispersivity obtained via SIP can exclude the ambiguity of the gold mineralization low-resistivity anomaly [45]. There are two areas with the frequency dispersivity values greater than 5% at a depth of 100 m on the north side of profile L1, corresponding to the low resistivity area on both sides of R4 on the resistivity model, which is a typical low-resistivity, high-frequency dispersivity, high-correlation Zone I. Ore body generically has low resistivity and high-frequency dispersivity in the meantime. Gold veins are found in the three boreholes (ZK25102, ZK23504 and ZK23502) arranged in this area. The gold content of alteration-type gold deposits is often closely related to the content of polymetallic sulfide, showing a positive correlation. Accordingly, SIP can reveal polymetallic sulfide minerals in order to indirectly search for gold orebodies [45]. To summarize, the low-resistivity, high-frequency dispersivity, high-correlation area in contact with the high-resistivity body R4 (presumed to be an alkaline magmatic intrusion) on the profile L1 may be a favorable area for gold mineralization.
The coincidence of position between the high-frequency dispersivity and the low-resistivity regions formed several other typical low-resistivity, high-frequency dispersivity, high-correlation regions by comparing them with the resistivity model, as shown in Figure 5. For instance, it was inferred that the Zone II of low resistivity, high-frequency dispersion, and high correlation is in contact with the high-resistivity body R3 on the section L2, and the Zone III of low resistivity, high-frequency dispersivity, and high correlation is in contact with the high-resistivity body R5. The low-resistivity, high-frequency dispersivity, high-correlation Zone IV is in contact with the high-resistivity body R2 on the section L3, and the low-resistivity, high-frequency dispersivity, high-correlation Zone V is in contact with the high-resistivity body R5. The low-resistivity, high-frequency dispersivity, high-correlation Zone V is in contact with the high-resistivity body R2 and the low-resistivity, high-frequency dispersivity, high-correlation Zone VII is in contact with the high-resistivity body R5 on the L4 profile. To sum up, the contact regions of the high-correlation zone (low resistivity and high-frequency dispersivity) and the high-resistivity body are both favorable areas for mineralization, but these areas have not been verified by drilling. The diverse correlations of resistivity and frequency dispersivity of the above-mentioned different regions may demonstrate various intensities of gold mineralization [36]. Additionally, most of the discovered gold veins in Hadamengou mining area are controlled by EW- or approximate EW-trending structures, and the above speculated areas also have the characteristics of east–west distribution.

4.2. Geological Interpretation

Remarkably, there are several high-resistivity bodies, R1, R2, R3, R4, and R5, in the resistivity model, and their top interfaces are buried at the same depth, so it is inferred that they were initially part of a continuous high-resistivity layer, which was later truncated by the low-resistivity structures (Figure 3). The regional geological mapping results show that there are metamorphic rocks of Wulashan Group, Neoarchean in this area [7,11]. Such ancient metamorphic rocks and metasedimentary rocks usually show high-resistivity characteristics due to the high degree of compaction and low porosity [46,47,48]. Therefore, the high-resistivity bodies R1–R5 may be attributed to the presence of metasedimentary rocks.
Below the inferred metasedimentary rocks, the boundary between R2 and R3, R6, and the medium–high conductive region on its north side throughout the model formed a medium–high conductive region, C3, extending from the surface to the bottom of the profile. The low-resistivity region C3 has a good spatial relationship with the Baotou–Hohhot fault. By contrast, the highly conductive channels C4 and C5, located on the north side of the profile and distributed on both sides of the highly resistive body R4, extend to relatively shallow depths, and have spatial correspondence with the ductile shear zone and the secondary faults of the Baotou–Hohhot fault, respectively. Previous studies have shown that the brittle and ductile shear zones often perform low resistivity, which is caused by the filling of conductive materials, such as such as metal sulfides, graphite, or saline fluids in rock fracture zones or fissures [48]. It is inferred that the low-resistivity region C3 may be the reflection of the Baotou–Hohhot fault near the surface. C4 and C5 may, respectively, represent a part of the widely distributed secondary faults, ductile shear zones, and potassic alteration zones in the region. The secondary fault represented by C5 is connected to the gold-bearing quartz veins in the borehole ZK23502 and the ductile shear zones indicated by C4 have a close spatial relationship with diabase dikes.
The high-resistivity body, R6, in the model and the location of oxidized alkaline granite body suggested by the research results [4] are relatively consistent, so it can be inferred that R6 is an alkaline magmatic intrusion, which can also be proved by the research results [8,28]. There are multi-stage alkaline magma-tectonic activities in the study area, and the representative alkaline magmatic intrusions include the Dahuabei rock mass in the west of the mining area, the Shadegai and Xishadegai rock masses in the north, and the potassic alkaline pegmatite dikes and diabase dikes widely distributed in the mining area [2,11,18]. Therefore, it is reasonable to conclude that the high-resistivity bodies R4 and R5 are potassic alkaline magmatic bodies from the Proterozoic to Yanshanian periods [4,7,15].

4.3. Discussion

When the Paleoproterozoic cratons converged, suture lines or weak zones may have formed between different tectonic units in the crust, thus it experienced multiple tectonic movements, due to the fact that the study area is in the Inner Mongolia suture zone clamped by the Yinshan landmass and the Ordos landmass [20,49,50]. In the late Paleoproterozoic era, under the influence of the Lvliang tectonic movement, the North China paleocontinental nucleus was subjected to tensile fracture, and the most important ore-controlling structure in the mining area, i.e., the NEE-trending Baotou–Hohhot fault and a series of secondary faults were formed, which provided a channel for magma emplacement and the migration of ore-bearing fluids. At the same time, strong regional deformation and metamorphism processes (such as folding and ductile shearing) have resulted in large-scale structural weakness zones (10–100 km in length and 50–500 m in width). The Baotou–Hohhot fault and ductile shear zones may jointly provide conditions for multi-stage mineralization of gold deposits [17,43,51]. The low-resistivity regions of C3, C4, and C5 may represent the Baotou–Hohhot fault, its secondary faults, and ductile shear zones, respectively (Figure 6). According to the distribution of known gold veins, the gold veins are generally far away from the Baotou–Hohhot fault, and they are associated with the secondary faults, ductile shear zones, and alkaline pegmatite veins of the Baotou–Hohhot fault and are approximately parallelly distributed [4,5,7,16,41].
From the late Neoproterozoic to the early Late Paleozoic era, the North China Plate, and the Siberian Plate on both sides of the Mongolian–Okhotsk Ocean subducted and closed, and the NCC collided with the Siberian Plate [52,53]. Further, since the Late Mesozoic era, under the regional tectonic background of the subduction and retracement of the paleo-Pacific plate [54], the region has experienced multiple strong extensional tectonic movements [55,56], leading to the reactivation of the early formed east–west-trending Baotou–Hohhot fault and its secondary faults [2,6,42]. The alkaline magmatic rocks were emplaced to the shallow part of the crust along the fracture due to stress relaxation after compression, and the Dahuabei rock mass, Shadegai rock mass, and Xishadegai rock mass were formed successively, which were accompanied with numerous pegmatite veins [11,57,58]. Although controversial, several pieces of evidence point to the fact that the Hadamengou gold deposit is the result of multi-stage mineralization [7,18,59], and multi-stage magmatism is accompanied with multi-stage gold mineralization [6,9]. Combined with the SIP model, we speculate that the low-resistivity regions between C4 and R4, and C5 and R4, may be the location of quartz-vein-type gold veins. Three boreholes: ZK25102, ZK23504, and ZK23502, were drilled on both sides of R4, and gold veins were found (Figure 6), which verified our inference. Therefore, the highly resistive bodies R4 and R5, which are closely related to the gold veins, may represent potassic alkaline pegmatite veins, quartz-K-feldspar veins, and/or diabase veins [5,9,50]. It is inferred that it is also the product of multi-stage alkaline magmatism [11,18]. The structural weak zone on both sides of the high-resistivity body R4 (i.e., the brittle and ductile shear zones represented by C4 and C5), as the ascending channel of the ore-bearing fluid, is an important ore-controlling and ore-hosting structure [2,7,11,14]. On the contrary, the Baotou–Hohhot fault (C3), which is relatively far away from the gold vein, may not be an ore-controlling fault but a pre-metallogenic fault [25,60].

5. Conclusions

(1)
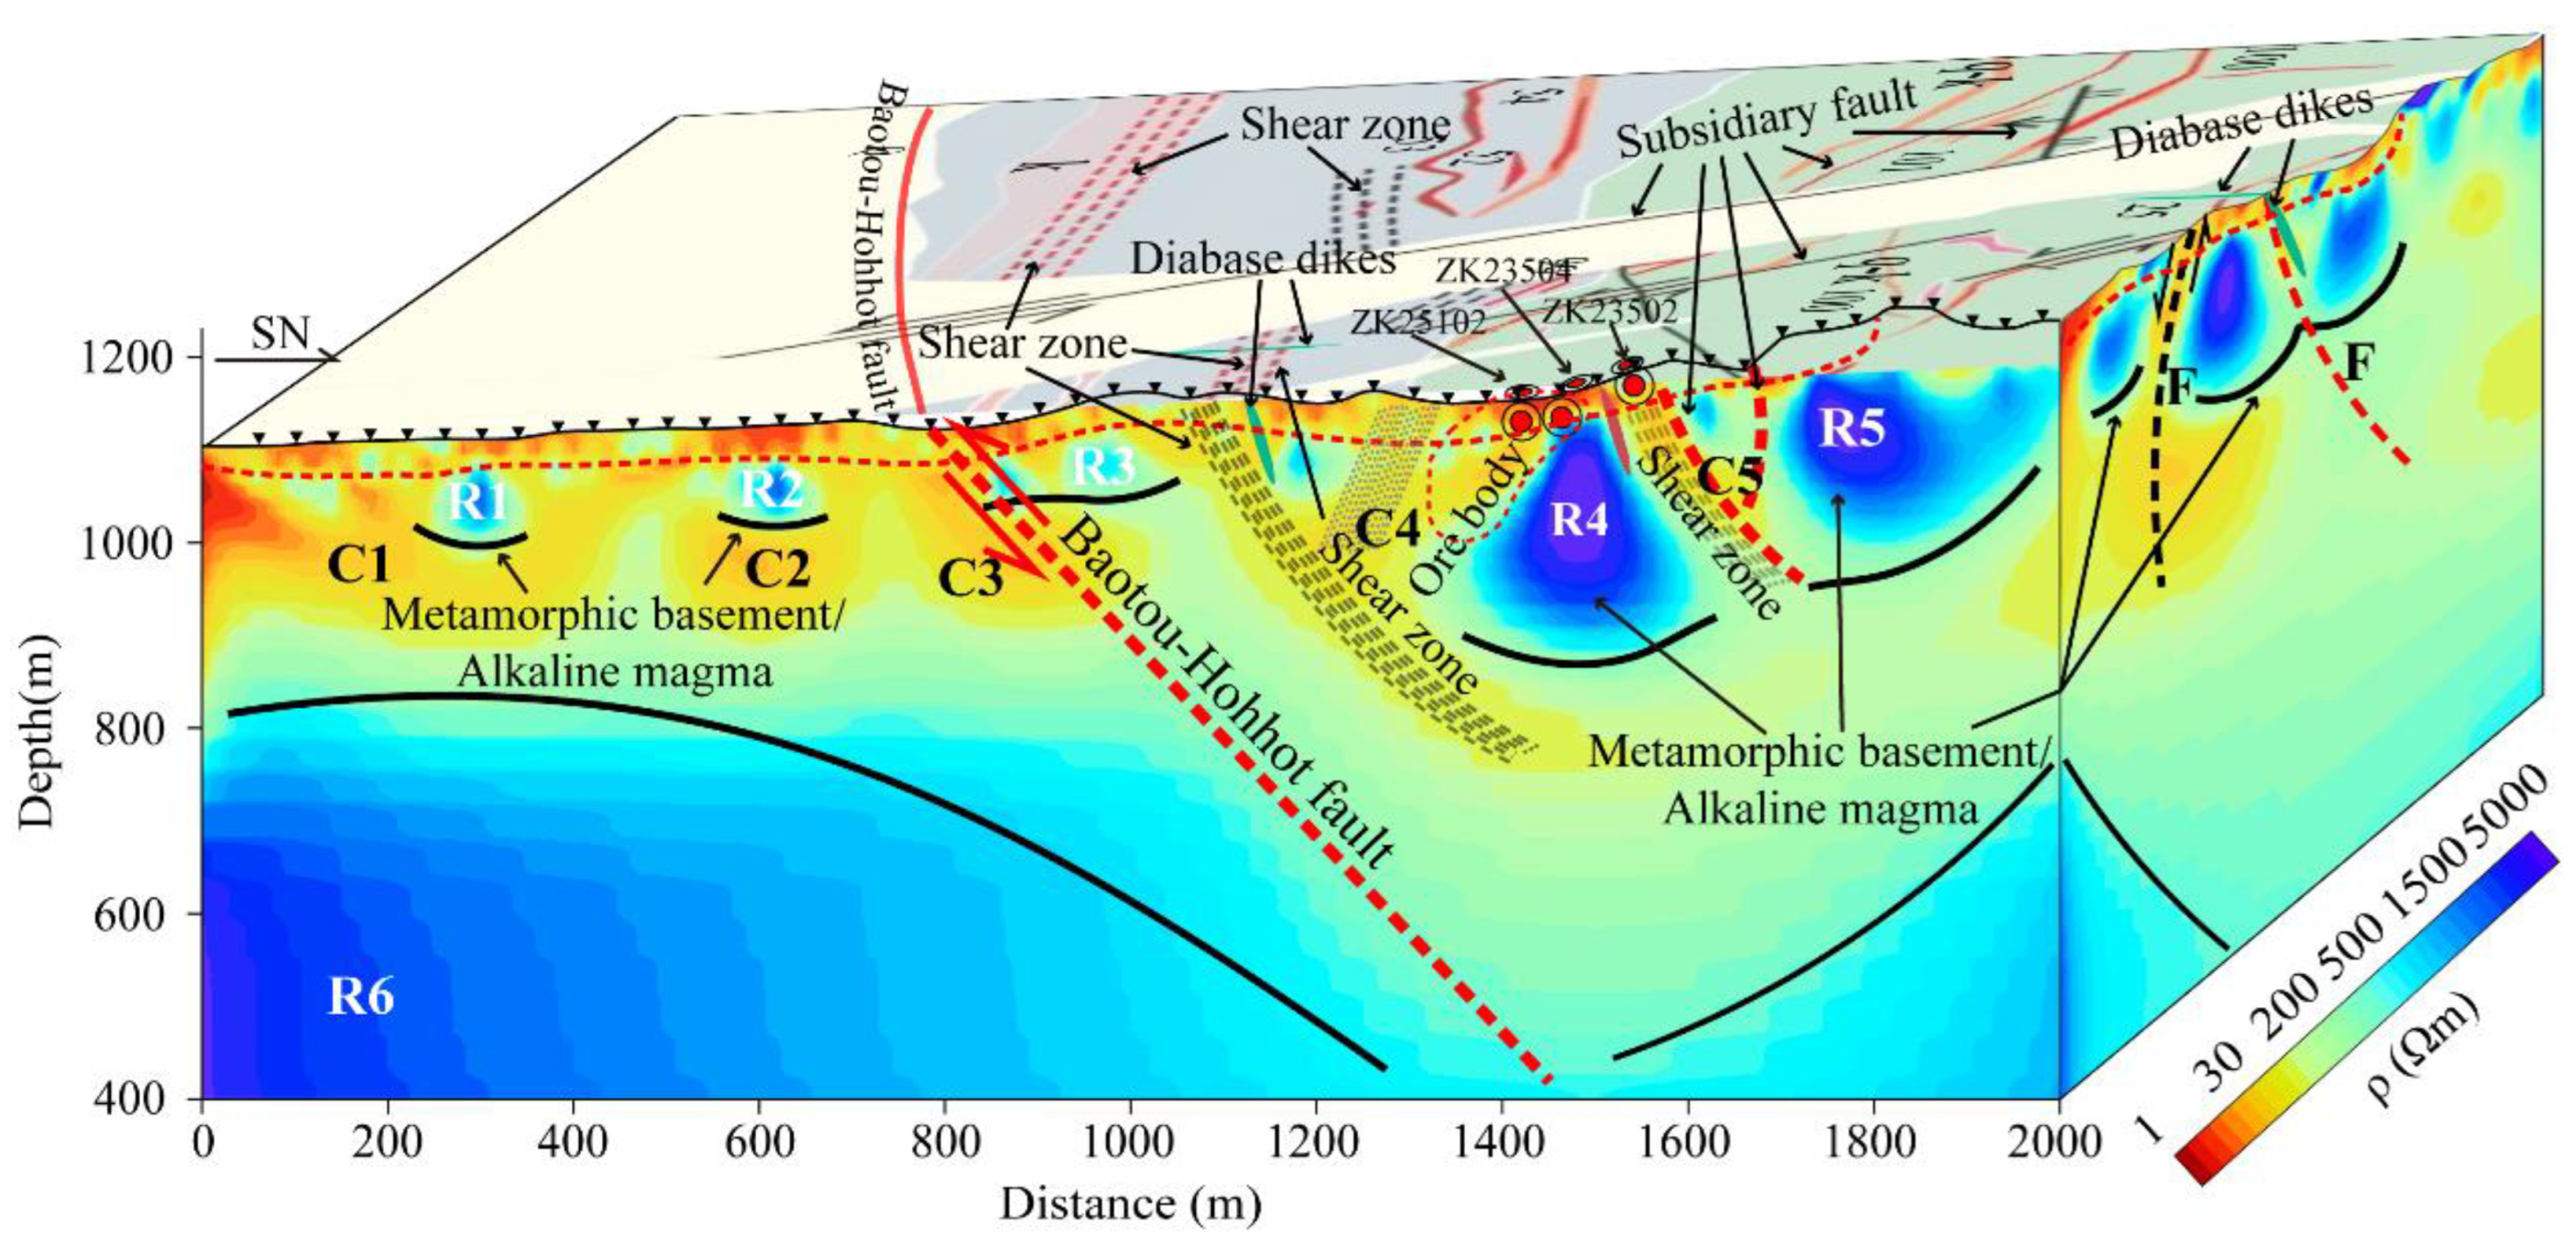
Using the data of four CSAMT and SIP profiles in the Hadamengou mining area, the underground resistivity model and the pseudo-section map of the apparent frequency dispersivity were obtained by fine inversion.
(2)
In the resistivity model, there were two high-resistivity blocks with resistivity values greater than 3000 Ω m and three low-resistivity channels with resistivity values less than 50 Ω m. Combined with regional geological and drilling data, it was inferred that the high-resistivity bodies R4 and R5 are alkaline magmatic intrusions, which are related to multiple stages of magmatic hydrothermal activities from the Precambrian to Yanshanian periods. The low-resistivity channels, C3, C5, and C4, might represent the Baotou–Hohhot fault, its secondary faults, and ductile shear zones and potassic alteration zones, respectively, which were formed in the Precambrian era and underwent multiple activation from the Hercynian to the Yanshanian periods. According to the spatial relationship, we hypothesize that the ductile shear zone is an important ore-controlling and ore-hosting structure. The Baotou–Hohhot fault may not be an ore-controlling fault, but a pre-metallogenic fault.
(3)
Comparing the resistivity model with the pseudo-section map of the apparent frequency dispersivity, it was found that all the known gold veins were located in the superimposed area of low resistivity and high-frequency dispersivity, and the ductile shear zone in the outer contact of alkaline magmatic rock body with the superimposed characteristics of low resistivity and high-frequency dispersivity was considered to be the favorable area for mineralization.

Author Contributions

Conceptualization, H.L. and L.X.; methodology, L.X.; software, B.Y. and P.S. (Peng Su).; validation, H.W. and H.X.; formal analysis, P.S. (Panyun Su) and C.Y.; investigation, B.Y. and C.Y.; resources, H.L.; data curation, H.W. and H.X.; writing—original draft preparation, H.L. and L.X.; writing—review and editing, H.L. and L.X.; project administration, H.L. All authors have read and agreed to the published version of the manuscript.

Funding

The research involved in this paper is mainly supported by the project of gold polymetallic resources exploration in the southern ore belt of Hadamengou, Inner Mongolia (No. ZD20220312) and the general Survey of Rock Gold in Hadamengou Gold Mine, Inner Mongolia (No. DD20191017), undertaken by Hohhot General Survey of Natural Resources Center of China Geological Survey and the subject of “Alkali Metasomatism Constraints on Gold Mineralization Mechanism: Taking Hadamengou Gold Mine in Inner Mongolia as an Example”(No. SDK202209) undertaken by the Institute of Mineral Resources, Chinese Academy of Geological Sciences.

Data Availability Statement

Not applicable.

Conflicts of Interest

The authors declare no conflict of interest.

References

  1. Hart, C.J.; Goldfarb, R.J.; Qiu, Y.; Snee, L.; Miller, L.D.; Miller, M.L. Gold deposits of the northern margin of the North China Craton: Multiple late Paleozoic–Mesozoic mineralizing events. Miner. Depos. 2002, 37, 326–351. [Google Scholar] [CrossRef]
  2. Zhang, Y.M.; Gu, X.X.; Xiang, Z.L.; Liu, R.P.; Cheng, W.B.; Wang, X.L. Magmatic hydrothermal origin of the Hadamengou-Liubagou Au-Mo deposit, Inner Mongolia, China: Constrains on geology, stable and Re-Os isotopes. Ore Geol. 2017, 86, 172–195. [Google Scholar] [CrossRef]
  3. Zeng, Q.; Wang, Y.; Yang, J.; Guo, Y.; Yu, B.; Zhou, L.; Qiu, H. Spatial–temporal distribution and tectonic setting of gold deposits in the Northern margin gold belt of the North China Craton. Int. Geol. Rev. 2020, 63, 941–972. [Google Scholar] [CrossRef]
  4. Li, Z.; Liu, J.; Zhang, H.; Fan, K.; Zhang, X.; Deng, J.; Zhang, J. Multistage gold mineralization in the Hadamengou gold deposit in the northern margin of the North China Craton: Insights from in-situ trace element contents and sulfur isotope analyses of pyrite. Ore Geol. Rev. 2021, 134, 104135. [Google Scholar] [CrossRef]
  5. Gold Headquarter of Chinese Armed Police Force (GHCAPF). Geology of the Hadamengou Pegmatitic gold Deposit Occurring in Inner Mongolia Autonomous Region; Seismological Press: Beijing, China, 1995; pp. 1–227, (In Chinese with English Abstract). [Google Scholar]
  6. Zhang, Y.M.; Gu, X.X.; Cheng, W.B.; Dong, S.Y.; Huang, Z.Q.; Li, F.L.; Yang, W.L. Stable Isotopic Geochemistry of the Liubagou-Hadamengou Gold Deposit in Inner Mongolia. Acta Mineral. Sin. 2011, 31, 530–540, (In Chinese with English Abstract). [Google Scholar]
  7. Niu, S.Y.; Sun, A.Q.; Ma, B.J.; Jiang, S.H.; Nie, F.J.; Zhang, J.Z.; Wang, B.D.; Xia, D. Tectonic evolution and metallogenic ore-controlling tectonic characteristics of Hadamengou gold deposit in Inner Mongolia. Earth Sci. Front. 2015, 22, 223–237. [Google Scholar]
  8. Zhang, H.Y. Study on the Characterisitics of Ore-Controlling Structures in the Hadamengou Mining Area, Inner Mongolia. Master’s Thesis, Chinese Academy of Geological Sciences, Beijing, China, 2017; pp. 1–97, (In Chinese with English Abstract). [Google Scholar]
  9. Jia, S.H.; Wang, E.D.; Fu, J.F.; Wu, L.; Zhao, C.F. Indosinian gold mineralization and magmatic-hydrothermal evolution of the Hadamengou gold deposit at the northern margin of the North China Craton: Constraints from K-feldspar laser 40Ar/39Ar dating. J. Geochem. Explor. 2018, 190, 314–324. [Google Scholar] [CrossRef]
  10. Nie, F.J.; Bjorlykke, A. Lead and sulfur isotope studies of the Wulashan quartz-K feldspar and quartz vein gold deposit, southwestern Inner Mongolia, People’s Republic of China. Min. Depos. 1994, 89, 1289–1305. [Google Scholar] [CrossRef]
  11. Jia, S.H.; Fu, J.F.; Wang, E.D.; Men, Y.K. The Hadamengou K-feldspar–quartz vein-type Au mineralization in the northern margin of the North China Craton (China): An Indosinian oxidized intrusion-related Au–(Mo) system. Geochem. Explor. Environ. Anal. 2020, 20, 14–34. [Google Scholar] [CrossRef]
  12. Xu, X.C. Relation between the ductile shear retrogressive metamorphism and gold deposit in wulashan region, inner Mongolia. Miner. Resour. Geol. 1991, 5, 107–114. [Google Scholar]
  13. Zheng, F.S.; Xu, G.Q.; Feng, Z.; Zhang, Z.F.; Cai, H.J. Geological Characteristics and Prospective Value of Greenstone Type Gold Deposits of Central Part of Inner Mongolia Autonomous Area. Acta Geol. Sin. 2005, 79, 232–248, (In Chinese with English Abstract). [Google Scholar]
  14. Gan, S.F.; Qiu, Y.M.; Yang, H.Y.; Reenen, D.D.V. The Hadamengou Mine: A Typical Gold Deposit in the Archean Granulite Facies Terrane of the North China Craton. Int. Geol. Rev. 1994, 36, 850–866. [Google Scholar] [CrossRef]
  15. Zhang, Y.M. Metallogenesis, Ore-Controlling Factors and Prospecting Direction of the Liubagou-Hadamengou Gold Deposit, Inner Mongolia. Ph.D. Thesis, Chinese Academy of Geological Sciences, Beijing, China, 2012; pp. 1–253, (In Chinese with English Abstract). [Google Scholar]
  16. Hou, W.R.; Nie, F.J.; Zhao, G.M.; Chen, H.J.; Lei, S.B.; Wang, L. Sulfur and Lead Isotope Geochemistry Characters of the Hadamengou Gold Deposit in Inner Mongolia. Acta Geol. Sin. 2014, 88 (Suppl. S2), 1509–1510. [Google Scholar] [CrossRef]
  17. Zhang, Y.; Liu, J.C.; Zhang, H.D.; Zhang, S.P. Geological characteristics, and origin of the Hadamengou gold deposit in Inner Mongolia, China. Arab J Geosci. 2016, 9, 311–320. [Google Scholar] [CrossRef]
  18. Nie, F.J.; Jiang, S.H.; Liu, Y.; Hu, P. Re-discussions on the time limitation of gold mineralization occurring within the Hadamengou deposit, south-central Inner Mongolia autonomous region. Acta Petrol. Sin. 2005, 21, 1719–1728, (In Chinese with English Abstract). [Google Scholar]
  19. Wang, L.; Wang, G.H.; Lei, S.B.; Wei, G.F.; Jia, L.Q.; Chang, C.X. Re-Os dating of molybdenite from Hadamengou gold ore field in Inner Mongolia and its geological significance. Acta Geol. Sin. 2014, 88, 1017–1018. [Google Scholar] [CrossRef]
  20. Zhao, G.; Zhai, M. Lithotectonic elements of Precambrian basement in the North China Craton, review and tectonic implications. Gondwana Res. 2013, 23, 1207–1240. [Google Scholar] [CrossRef]
  21. Ma, B.J.; Niu, S.Y.; Chen, C.; Wang, B.D.; Sun, A.Q.; Zhang, J.Z. Evolution of the Tectonic Stress Field and Structural Controls on Ore Mineralization of the Hadamengou Gold Deposit in Inner Mongolia. Geotecton. Metallog. 2012, 36, 530–540, (In Chinese with English Abstract). [Google Scholar]
  22. Liu, D.W. Study on the characteristics of structural deformation and ore-controlling structure in Hadamengou gold mining area, Inner Mongolia. Ph.D. Thesis, Chinese Academy of Geological Sciences, Beijing, China, 2014; pp. 1–166, (In Chinese with English Abstract). [Google Scholar]
  23. Li, J.M.; Cai, S.B.; Zhu, D.F.; Guan, L.X. Geological characteristics and prospecting prediction of gold deposits in Wulashan area, Inner Mongolia. Gold Geol. 1993, 2, 14–20. (In Chinese) [Google Scholar]
  24. Goldstein, M.A.; Strangway, D.W. Audio frequency magnetotelluric with a grounded dipole source. Geophysics 1975, 40, 669–683. [Google Scholar] [CrossRef]
  25. Zonge, K.L.; Hughes, L.J. Controlled Source Audio-Frequency Magnetotelluric; Central South University Press: Changsha, China, 1990; pp. 5–59. (In Chinese) [Google Scholar]
  26. Hu, X.Y.; Peng, R.H.; Wu, G.J.; Wang, W.P.; Huo, G.P.; Han, B. Mineral exploration using CSAMT data: Application to Longmen region metallogenic belt, Guangdong Province, China. Geophysics 2013, 78, B111–B119. [Google Scholar] [CrossRef]
  27. Martin, T.; Günther, T.; Weller, A.; Kuhn, K. Classification of slag material by spectral induced polarization laboratory and field measurements. J. Appl. Geophys. 2021, 194, 104439. [Google Scholar] [CrossRef]
  28. Yang, W.; Chen, J.P.; Gu, X.X.; Xiang, J.; Zhang, Y.M. Application of 3D geological modelling based on geophysical data in the Hadamengou gold deposit in Inner Mongolia. J. Geol. 2016, 40, 501–506, (In Chinese with English Abstract). [Google Scholar]
  29. Chen, F.B. CSAMT Two-Dimensional OCCAM Inversion and Application. Master’s Thesis, Chinese Academy of Geological Sciences, Beijing, China, 2016; pp. 1–66, (In Chinese with English Abstract). [Google Scholar]
  30. Yang, Z.W.; Zheng, W.; Li, X.B.; Wang, H.F. The development and prospect of the spectral induced polarization method. Geophys. Geochem. Explor. 2015, 39, 22–28, (In Chinese with English Abstract). [Google Scholar]
  31. Wang, H.; Li, T.L.; Chen, H.B.; Wang, Y. 2D magnetotelluric forward modeling with induced polarization. Glob. Geol. 2018, 37, 1226–1230, (In Chinese with English Abstract). [Google Scholar]
  32. Zheng, B. Application of Spectral Induced Polarization to one Pb-Zn-Ag deposit. Chin. J. Eng. Geophys. 2015, 12, 750–754, (In Chinese with English Abstract). [Google Scholar]
  33. Shah, A.K.; Bedrosian, P.A.; Anderson, E.D.; Kelley, K.D.; Lang, J. Integrated geophysical imaging of a concealed mineral deposit: A case study of the world-class Pebble porphyry deposit in southwestern Alaska. Geophysics 2013, 78, B317–B328. [Google Scholar] [CrossRef]
  34. Ma, Z.B.; Yan, C.H.; Song, Y.W.; Wang, J.Z.; Si, F.Z.; Yang, R.X. Application of Combined Geophysical Methods CSAMT and SIP to the Survey of Concealed Metal Deposits in the Luanchuan Mountainous Area, Henan Province. Geol. Explor. 2011, 47, 654–662, (In Chinese with English Abstract). [Google Scholar]
  35. Peng, Y.; He, Y.L.; Zeng, T.; Zhong, J.W.; Xu, G.L.; Sun, X.J.; Chen, J.; Peng, S.M.; Li, Z. Regional Metallogenic and Synthetic Information Prediction Models of Mo Deposits in Henan Province, China. J. Jilin Univ. 2013, 43, 1262–1275, (In Chinese with English Abstract). [Google Scholar]
  36. Hao, X.Z.; Yang, Y.H.; Li, Y.P.; Wang, Q.Y.; Wang, Y.P.; Wang, L.G. Application of Integrated Ore Prognosis Method in Covered Area: A Case Study of Shanxian Iron Deposit in Shandong Province, China. J. Jilin Univ. 2013, 43, 641–648, (In Chinese with English Abstract). [Google Scholar]
  37. Zhang, H.T.; So, C.S.; Yun, S.T. Regional geologic setting and metallogenesis of central Inner Mongolia, China: Guides for exploration of mesothermal gold deposits. Ore Geol. Rev. 1999, 14, 129–146. [Google Scholar] [CrossRef]
  38. Liu, W.; Deng, J.; Chu, X.L.; Zhai, Y.S.; Xu, G.Z.; Li, X.J. Characteristics and geological background of formation of the large and giant ore deposits within the northern margin of the China platform. Prog. Geophys. 2000, 15, 67–78, (In Chinese with English Abstract). [Google Scholar]
  39. Zhai, M.G. Tectonic evolution and metallogenesis of North China Craton. Miner. Depos. 2010, 29, 24–36, (In Chinese with English Abstract). [Google Scholar]
  40. Zhang, S.H.; Zhao, Y.; Liu, J.M.; Hu, J.M.; Song, B.; Liu, J.; Wu, H. Geochronology, geochemistry, and tectonic setting of the Late Paleozoic-Early Mesozoic magmatism in the northern margin of the North China Block: A preliminary review. Acta Petrol. Mineral. 2010, 29, 824–842, (In Chinese with English Abstract). [Google Scholar]
  41. Wang, L.; Wang, G.H.; Lei, S.B.; Chang, C.J.; Hou, W.R.; Jia, L.Q.; Zhao, G.M.; Chen, H.J. Petrogenesis of Dahuabei pluton from Wulashan, Inner Mongolia: Constraints from geochemistry, zircon U-Pb dating and Sr-Nd-Hf isotopes. Acta Petrol. Sin. 2015, 31, 1977–1994, (In Chinese with English Abstract). [Google Scholar]
  42. Hou, W.R. Contrast Study on the Hadamengou Gold Deposit and Jinchanggouliang Gold Deposit, Inner Mongolia. Ph.D. Thesis, Chinese Academy of Geological Sciences, Beijing, China, 2011; pp. 1–213, (In Chinese with English Abstract). [Google Scholar]
  43. Li, Z.D.; Li, X.G.; Duan, C.; Chen, J.Q.; Wang, J.Y.; Yu, R.A.; Zhang, Q.; Wan, S.B.; Zhang, C. Helium and argon isotopic tracing for sources of ore- forming fluid in Hadamen’gou gold deposit, Inner Mongolia. Miner. Depos. 2018, 37, 521–534, (In Chinese with English Abstract). [Google Scholar]
  44. Rodi, W.; Mackie, R.L. Nonlinear conjugate gradients algorithm for 2-D magnetotelluric inversion. Geophysics 2001, 66, 174–187. [Google Scholar] [CrossRef]
  45. Zhang, Q.J.; Yang, J. The application of integrated electrical methods to the esploration of deep concealed ore bodies. Geophys. Geochem. Explor. 2010, 34, 40–43, (In Chinese with English Abstract). [Google Scholar]
  46. Storz, H.; Storz, W.; Jacobs, F. Electrical resistivity tomography to investigate geological structures of the earth’s upper crust. Geophys. Prospect. 2000, 48, 455–471. [Google Scholar] [CrossRef]
  47. Yin, Y.T.; Unsworth, M.; Liddell, M.; Pana, D.; Craven, J.A. Electrical resistivity structure of the great slave lake shear zone, Northwest Canada: Implications for tectonic history. Geophys. J. Int. 2014, 199, 178–199. [Google Scholar] [CrossRef] [Green Version]
  48. Unsworth, M.; Bedrosian, P.A. On the geoelectric structure of major strike-slip faults and shear zones. Earth Planets Space 2004, 56, 1177–1184. [Google Scholar] [CrossRef] [Green Version]
  49. Li, Z.; Liu, J.C.; Zhang, H.D.; Chen, J.S.; Zhang, Y.N.; Zhang, G.X.; Yang, J.K.; Fan, K. Geochemistry, geochronology, and geodynamic implications of mafic-felsic dykes from the Hadamengou area, north-western North China Craton. Geol. J. 2020, 55, 7080–7100. [Google Scholar] [CrossRef]
  50. Zhao, G.C.; Cawood, P.A. Precambrian geology of China. Precambrian Res. 2012, 222–223, 13–54. [Google Scholar] [CrossRef]
  51. Muirhead, J.D.; Fischer, T.P.; Oliva, S.J.; Laizer, A.; van Wijk, J.; Currie, C.A.; Lee, H.; Judd, E.J.; Kazimoto, E.; Sano, Y.; et al. Displaced cratonic mantle concentrates deep carbon during continental rifting. Nature 2020, 582, 67–72. [Google Scholar] [CrossRef]
  52. Xiao, W.; Santosh, M. The western Central Asian Orogenic Belt, A window to accretionary orogenesis and continental growth. Gondwana Res. 2014, 25, 1429–1444. [Google Scholar] [CrossRef]
  53. Chen, Y.J.; Zhang, C.; Wang, P.; Pirajno, F.; Li, N. The Mo deposits of Northeast China: A powerful indicator of tectonic settings and associated evolutionary trends. Ore Geol. Rev. 2017, 81, 602–640. [Google Scholar] [CrossRef]
  54. Li, S.Z.; Zhao, G.C.; Dai, L.M.; Liu, X.; Zhou, L.H.; Santosh, M.; Suo, Y.H. Mesozoic basins in eastern China and their bearing on the deconstruction of the North China Craton. J. Asian Earth Sci. 2012, 47, 64–79. [Google Scholar] [CrossRef]
  55. Xiao, W.J.; Windley, B.F.; Hao, J.; Zhai, M.G. Accretion leading to collision and the Permian Solonker suture, Inner Mongolia, China: Termination of the central Asian orogenic belt. Tectonics 2003, 22, 1069–1077. [Google Scholar] [CrossRef] [Green Version]
  56. Windley, B.F.; Alexeiev, D.; Xiao, W.; Kroner, A.; Badarch, G. Tectonic models for the accretion of the Central Asian orogenic belt. J. Geol. Soc. 2007, 164, 31–47. [Google Scholar] [CrossRef] [Green Version]
  57. Chen, J.M.; Liu, G.; Li, C.C. Geology of Greenstone-Type Gold Deposits in the Wula-Daqing Mt., Inner Mongolia; China Geological Publishing House: Beijing, China, 1996. (In Chinese) [Google Scholar]
  58. Nie, F.J.; Jiang, S.H.; Su, X.X.; Wang, X.L. Geological features and origin of gold deposits occurring in the Baotou-Bayan Obo district, south-central Inner Mongolia, People’s Republic of China. Ore Geol. Rev. 2002, 20, 139–169. [Google Scholar] [CrossRef]
  59. Hou, W.R.; Nie, F.J.; Hu, J.M.; Liu, Y.F.; Xiao, W.; Liu, Y.; Zhang, K. Geochronology and Geochemistry of Shadegai Granite in Wulashan Area, Inner Mongolia and Its Geological Significance. J. Jilin Univ. 2011, 41, 1914–1927, (In Chinese with English Abstract). [Google Scholar]
  60. Guan, L.X. Metallogenic mechanism of Wulashan gold deposit, Inner Mongolia. Gold Geol. 1993, 3, 1–5. [Google Scholar]
Figure 1. Regional tectonic geological map and CSAMT profile locations. (a) Tectonic subdivisions of the NCC (modified from [20]). (b) Regional geological structure and intrusive rocks distribution map in the study area (modified from [9]). (c) Geological map of the Hadamengou gold deposit and its adjacent areas (simplified from [2]). (d) Geological map of the Hadamengou gold deposit (simplified from [2]) and the locations of CSAMT profiles.
Minerals 12 01404 g001
Figure 2. Pseudo−sections of resistivity and phase before and after two-dimensional (2D) inversion. The comparison between the observed data and responses of inversion models. (a) The apparent resistivity and phase curves for four selected sites. (b) Pseudo-sections of apparent resistivity and phase for the profile L3.
Minerals 12 01404 g002
Figure 3. The 2D inversion models of the four profiles in this research. R1, R2, R3, R4, R5, and R6 refer to high-resistivity blocks with different scales and embedded depths. The same high-resistivity block has different shapes in different profiles, which represents the lateral changes of the high-resistivity block. For example, R3 is obvious in sections L2 and L4, but indistinctive in profiles L1 and L3, while R5 is obvious in profiles L1 and L2, but inapparent in profiles L3 and L4. C1, C2, C3, C4, and C5 refer to low-resistivity blocks with various scales and embedded depths. The short solid lines beneath the high-resistivity blocks represent the boundary between high resistivity and low resistivity.
Minerals 12 01404 g003
Figure 4. The comprehensive three-dimensional sketch of the 2D models of the four profiles. The layout of the four profiles on the geological map is based on their real spacing. These red dashed lines are the connection lines of the faults/subsidiary faults/shear zones in different profiles.
Minerals 12 01404 g004
Figure 5. Comparison between the resistivity model and SIP pseudo-section. The profile numbers of the resistivity models and SIP pseudo-sections correspond to each other, as well as the longitudinal position of the profiles. Both with topography and the same depth.
Minerals 12 01404 g005
Figure 6. The schematic plot of metallogenic model of the Hadamengou gold deposit inferred by resistivity models combined with SIP sounding. The geological bodies on the geological map correspond well with their position inferred from the resistivity model, such as the Baotou–Hohhot fault, subsidiary fault, shear zone, and diabase vein, etc.
Minerals 12 01404 g006
Publisher’s Note: MDPI stays neutral with regard to jurisdictional claims in published maps and institutional affiliations.

