Article

Three-Dimensional Fault-Fold Growth Deciphered from Combined Seismic and Geological Data: A Case Study from the Xiongpo Anticline, Longmen Shan Piedmont

1
Guangdong Provincial Key Laboratory of Geodynamics and Geohazards, School of Earth Sciences and Engineering, Sun Yat-sen University, Zhuhai 519082, China
2
Zhuhai Orbita Aerospace Science & Technology Co., Ltd., Zhuhai 519082, China
3
Chengdu Centre of Hydrogeology and Engineering Geology, Sichuan Bureau of Geology & Mineral Resources, Chengdu 610084, China
4
Sichuan Huadi Construction Engineering Co., Ltd., Chengdu 610084, China
5
Department of Geological Sciences, San Diego State University, San Diego, CA 92182, USA
*
Authors to whom correspondence should be addressed.
Minerals 2022, 12(11), 1405; https://doi.org/10.3390/min12111405
Submission received: 3 September 2022 / Revised: 28 October 2022 / Accepted: 31 October 2022 / Published: 3 November 2022

Abstract

:

Highlights

What are the main findings?
  • The Xiongpo anticline is characterized by a superimposed fault-fold belt in the central seg-ment, with a simple shallow fault-related fold in its two plunging edge zones.
  • A three-stage growth of the Xiongpo anticline has been proposed on the basis of a 3D fault model.
What is the implication of the main finding?
  • Three stress fields have been deduced for the Xiongpo anticline evolution.

Abstract

The Xiongpo fault-fold belt shows prominent NE, ENE- and ~N–S-trending relief, which resulted from multi-stage upper crustal shortening in the Longmen Shan piedmont during the eastward growth of the eastern Tibetan Plateau. Previous studies have determined its 2D structural configurations from seismic profiles and field-based geological cross-sections. Here, we extend this analysis into the entire belt to explore the 3D structural evolution of this complex fault-fold belt and have built a 3D regional fault model. The results reveal along-strike variation of subsurface structural architecture of the Xiongpo fault-fold belt, which is characterized by transformation from a complex superimposition of a deep fault-bend fold beneath a shallow structural wedge in the center segment to a simple shallow fault-bend fold on both ends of the structure, and then to a trishear fault propagation fold on the plunging edges. This structural transformation determines the contrast between the NE-striking relief of the central segment, and the ENE- and ~N-S-striking relief in the two plunging zones. We combine our results with published low-temperature thermochronology and growth strata results to propose a three-stage evolution for the Xiongpo fault-fold belt that closely relates with regional stress field changes, including a NE-striking fault under the NW–SE compression between 40–25 Ma and 15–10 Ma, lateral propagation of the NE-striking fault and initiation of ENE-striking fault by WNW–ESE compression from ~5–2 Ma, ~N–S fault under ~E–W compression until the present. This work enhances our understanding of the stress field changes of eastern Tibet since the Late Eocene. It also can serve as a typical case study deciphering 3D fault-fold growth using seismic and geological imaging, which is helpful to understand 3D structural and landscape evolutions of other complex fault-fold belts worldwide.

1. Introduction

Mountain building processes have been intensively studied using critical taper theory [1,2,3] and field evidence [4,5,6,7] over the past three decades. These pioneering scientists pointed out that mountain building processes are attained by tectonic deformation that progressively involves the foreland basins from orogenic hinterland areas. Under the dynamic control of the hinterland orogenic wedge, a series of new thrusts nucleate, propagating both forwardly and laterally, producing topography that stands above the foreland basin. Consequently, understanding the nature and three-dimensional (3D) tempo-spatial evolution of foreland fault-fold belts provides critical information that can be used to resolve hinterland and foreland deformation [8].
The relationship between foreland fault-fold growth and surface uplift and its effects on landscape evolution have been extensively studied, using theoretical studies [9,10], numerical simulations [11,12,13,14], analogue models [1,15,16], and geomorphological studies [17,18,19,20,21]. Aided by more and more seismic imaging and/or geological cross sections, different structural styles of fault-related folds [22] occur in subsurface structures within contractional tectonic regions have been identified. In fault-bend fold theory, three end-member kinematic models (e.g., fault-bend fold, fault propagation fold, and detachment fold) have been raised to sketch relationships between subsurface geometry, deformation, cumulative fault slip, and surface uplift [22]. However, deciphering the detailed subsurface structural architecture especially when complex 3D fault-folds growth occurs, is still difficult. Moreover, a lack of high-resolution seismic data reaching enough depth has additionally limited the precise constraints on subsurface structural architecture and interactions among different structural levels [23,24,25,26,27].
The Xiongpo anticline is an east vergent, asymmetric, doubly plunging complex fault-fold belt in the Longmen Shan fold-and-thrust belt, located on the eastern margin of the Tibetan Plateau (Figure 1). The occurrence of the 2008 Mw 7.9 Wenchuan and 2013 Mw 6.6 Lushan earthquakes in this thrust fold belt demonstrates that there is ongoing upper crustal shortening. Previous works have proposed two-dimensional structural styles of the Xiongpo structure at specific locations using field investigations, seismic data, and balanced cross-section method [28,29,30,31,32], but the regional 3D structural architecture and evolution of the structure are still unclear. The Xiongpo anticline has undergone a multiphase evolutionary history [32,33,34] and recorded ~7 km upper crustal shortening [30,32]. Moreover, it shows significant along-strike difference in its axis direction [29], and therefore can serve as a unique case to enhance our knowledge about 3D fault-fold growth.
The detailed goals of this study are to (1) explore the along-strike variation of structural architecture of the Xiongpo fault-fold belt, (2) reconstruct 3D tempo-spatial evolution of the Xiongpo fault-fold belt since the Late Eocene, and (3) determine the related stress field conditions of eastern Tibet. To achieve these, we first constrain the structural architecture of the Xiongpo structure using four seismic reflection profiles and four geological sections. Then, we build a 3D fault model of the Xiongpo anticline to determine the geometry of the underlying fault. Finally, based on the above results and combining with published analyses of ages [33,34] and growth strata [31], we reconstruct the 3D tempo-spatial evolution and stress field changes of the Xiongpo fault-fold belt and stress field changes, since the Late Eocene.

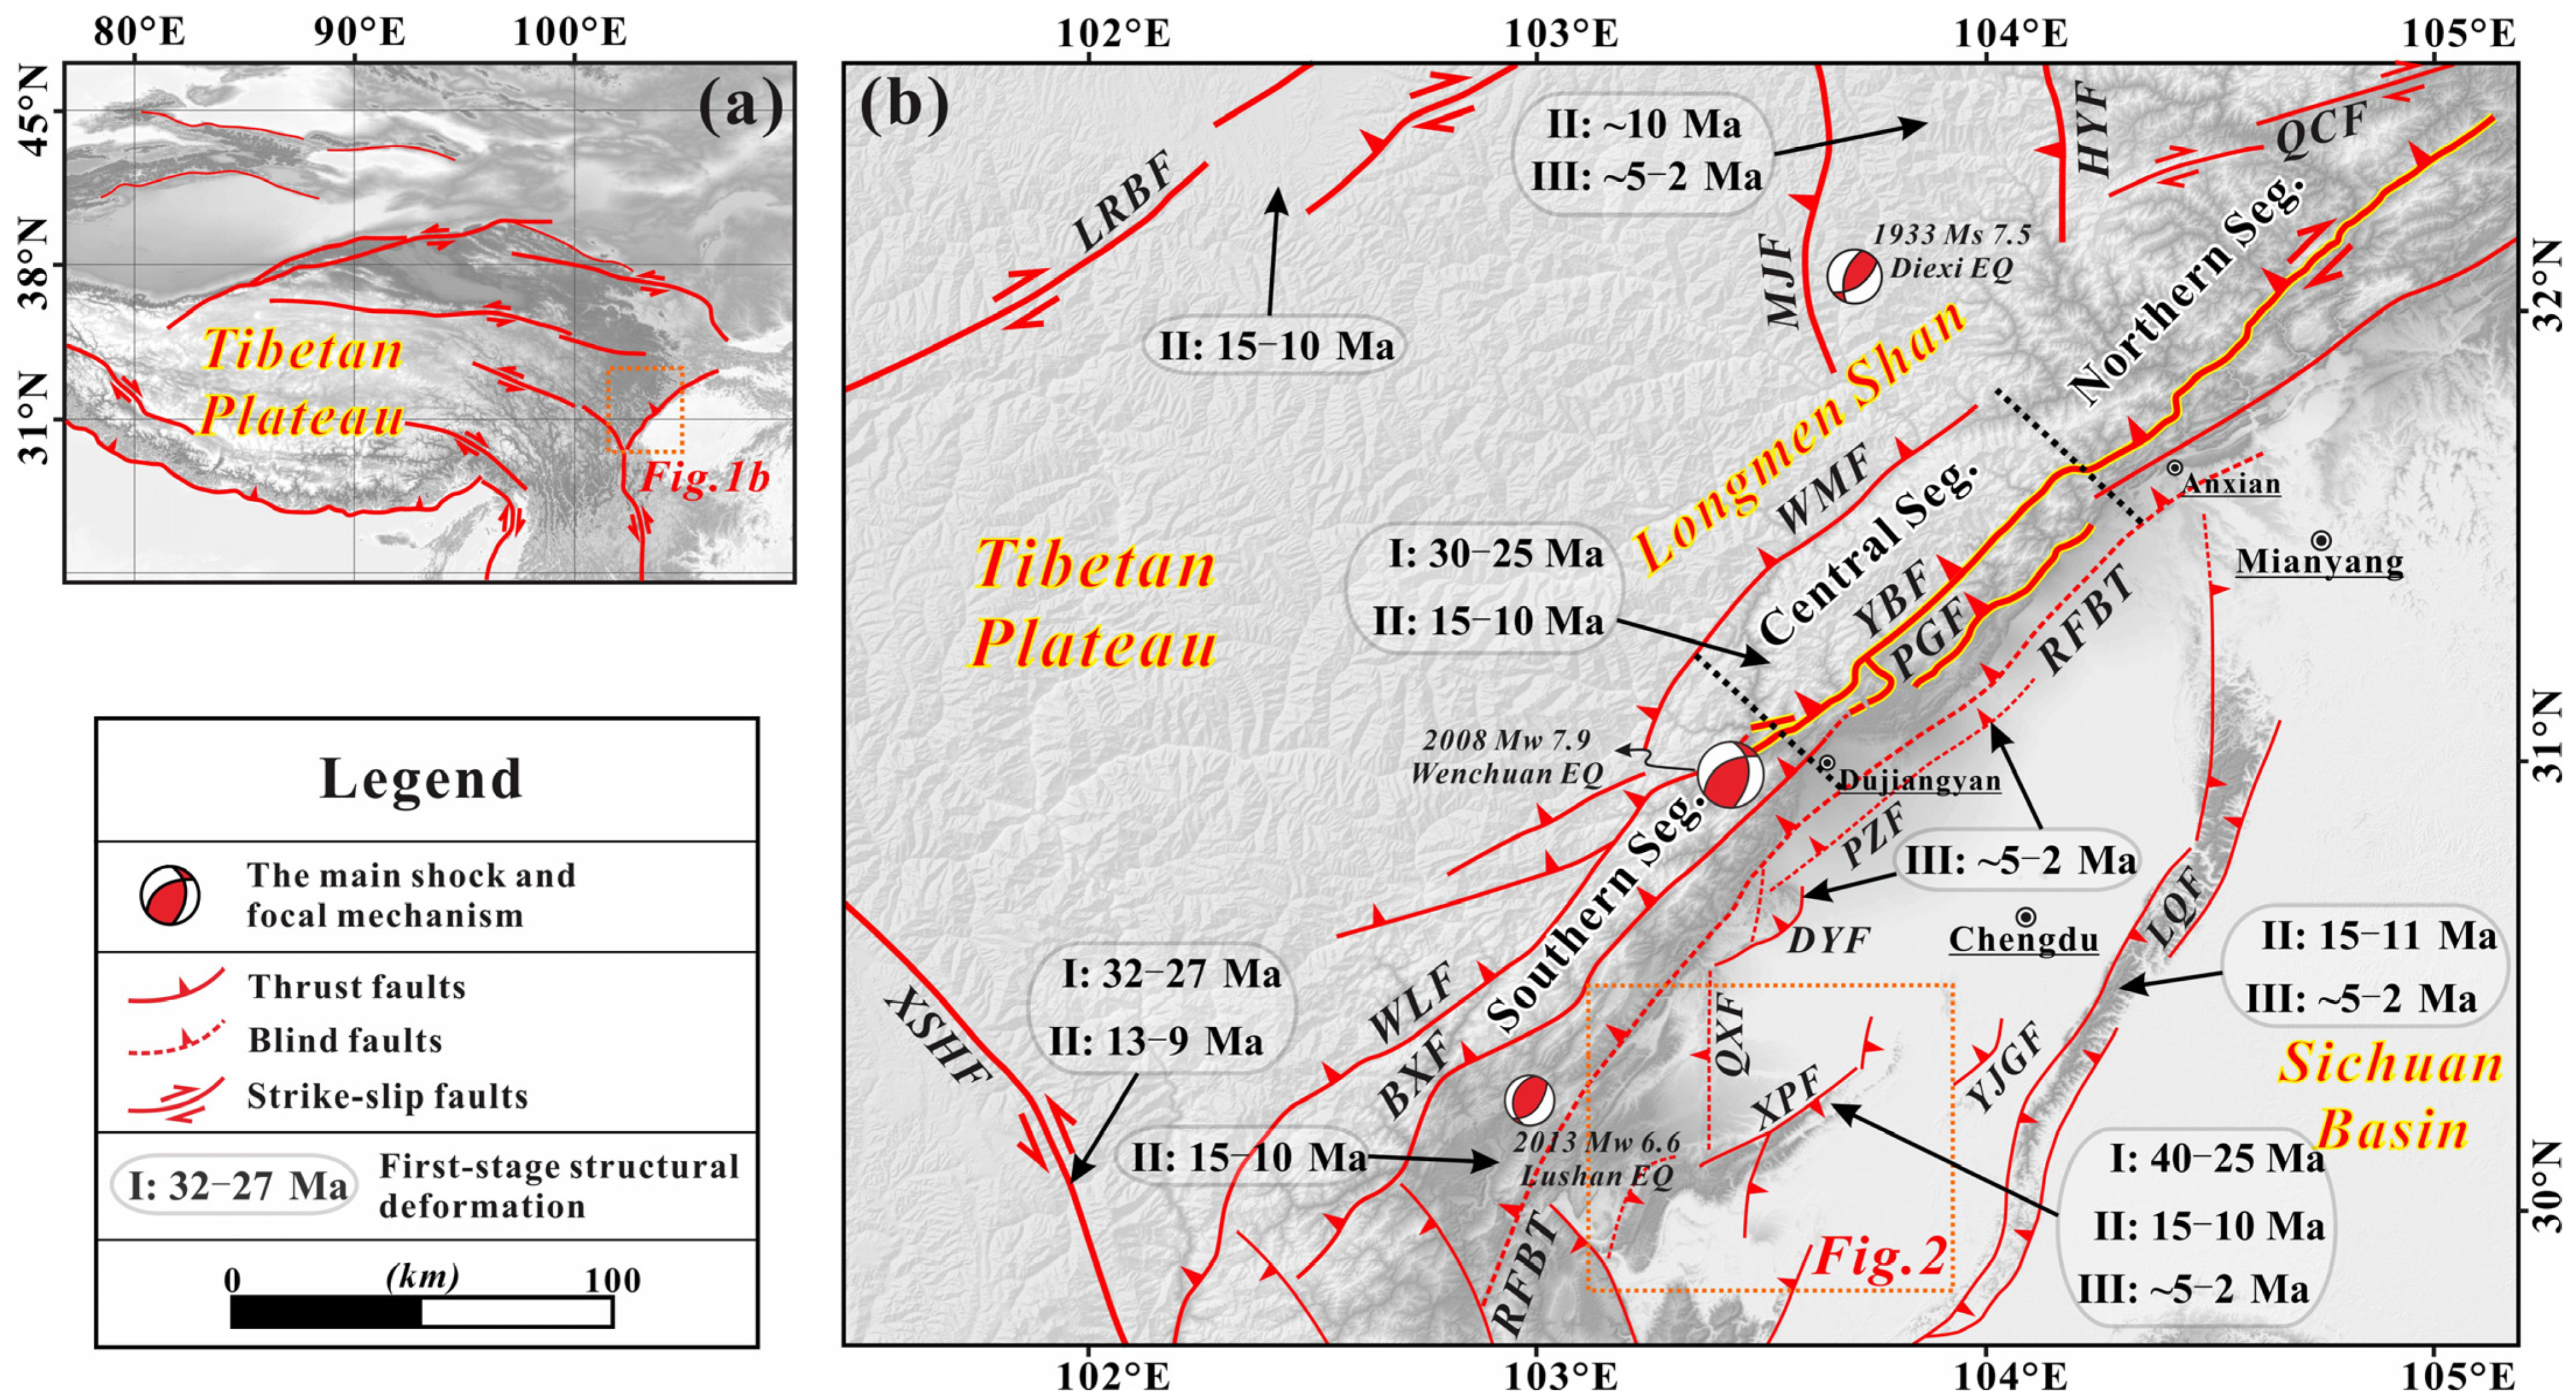
2. Geological Setting

2.1. Cenozoic Crustal Deformation of the Eastern Tibet

The eastern Tibetan Plateau is characterized by one of the steepest topographic gradients on Earth’s surface, partly because of the continuous convergence between the Indian and Eurasian plates and subsequent eastward extrusion of the Tibetan Plateau in the Cenozoic [35]. The lateral crustal extrusion in eastern Tibet is mainly accommodated by the Longmen Shan fold-and-thrust belt to the east, the Xianshuihe fault to the south, and the Kunlun and Min Shan faults to the north (Figure 1). Since the Late Eocene, three regional rapid rock exhumation episodes have been determined from thermochronology, geology, and geophysics around the eastern Tibetan Plateau ([31,36], and references therein).
The Longmen Shan fold-and-thrust belt, about 500 km long and 50–120 km wide, characterized by four major parallel NE-striking right-lateral reverse and pure-thrusting faults (from NW to SE, the Wenchuan–Maowen, Yingxiu–Beichuan, and Pengguan faults, and the Range Front blind thrust) in the hinterland areas, and some shallow thrust fault-fold belts in the foreland (including Longquan, Pengzhou, Dayi, Qiongxi, and Xiongpo structure) (Figure 1). The Cenozoic deformation has been documented by growth strata in seismic imaging [28,31] and rapid exhumation from low-temperature thermochronological results (30–25 Ma and 15–10 Ma) [37,38,39,40,41]. The Xiongpo fault-fold belt is the only structure in the entire Longmen Shan fold-and-thrust belt to record three phases of structural deformations (40–25 Ma, 15–10 Ma, and ~5–2 Ma) [32]. This study will focus on this structure (Figure 1).
To the south of the Longmen Shan, many U-Pb ages and thermochronologic results along the Xianshuihe fault reveal that high temperature metamorphism and rock rapid exhumations occurred after 32–27 Ma and/or 13–9 Ma [42,43,44]. In the Min Shan, to the north of the Longmen Shan, thermochronological ages constrain the initiation of exhumation to ~10 Ma [45] with a second stage between 5 and 3 Ma [37], consistent with the records of growth strata (~5–2 Ma, [31]). However, the differential exhumation history suggests that the Longriba fault has experienced a rapid cooling since ~15–10 Ma [46] (Figure 1).

2.2. Geomorphological and Geological Settings of the Xiongpo Structure

The Xiongpo structure, about 90 km long and 12 to 15 km wide, consists of three segments, including prominent NE-trending relief in the central segment, as well as an ENE- and ~N–S-trending relief in the two plunging zones (Figure 2). According to the geological mapping, each set of relief corresponds to a west verging NE-striking thrust fault (F2) in the central segment, and two NEE- and ~N–S-striking blind thrust faults (F3 and F4, respectively) in the two plunging zones (Figure 2).
Late Mesozoic sedimentary rocks, including upper Triassic, Jurassic, and Cretaceous fluvial and lacustrine sandstones, which are exposed in the core of the fault-fold belt. In the eastern limb, a continuous lower Jurassic to Eocene section is well exposed (Figure 2 and Figure 3). Moreover, unconsolidated middle Pleistocene sediments are exposed around the Xiongpo structure. Note that there are some secondary thrust faults emerged as well, including the longer NNE- and/or ~N–S-striking fault (~20 km in length) (Figure 2) and two NE-striking faults with 1.7 ± 0.2 m slip (Figure 4d) in the central segment, as well as several ~N–S-striking faults with 0.8 m to 10.8 m minimum-accumulated slip (Figure 4a–c).
Hubbard and Shaw [30] and Li et al. [32] have quantified the accumulated crustal shortening of the Xiongpo structure, and found that during its three phases of deformation it accommodated more than 7 km, the maximum value in the Longmen Shan piedmont (summarized by [31,32]). Thus, the Xiongpo structure is a unique structure in that it has accommodated the maximum upper crustal shortening and experienced complex structural evolution in the foreland of the Longmen Shan.

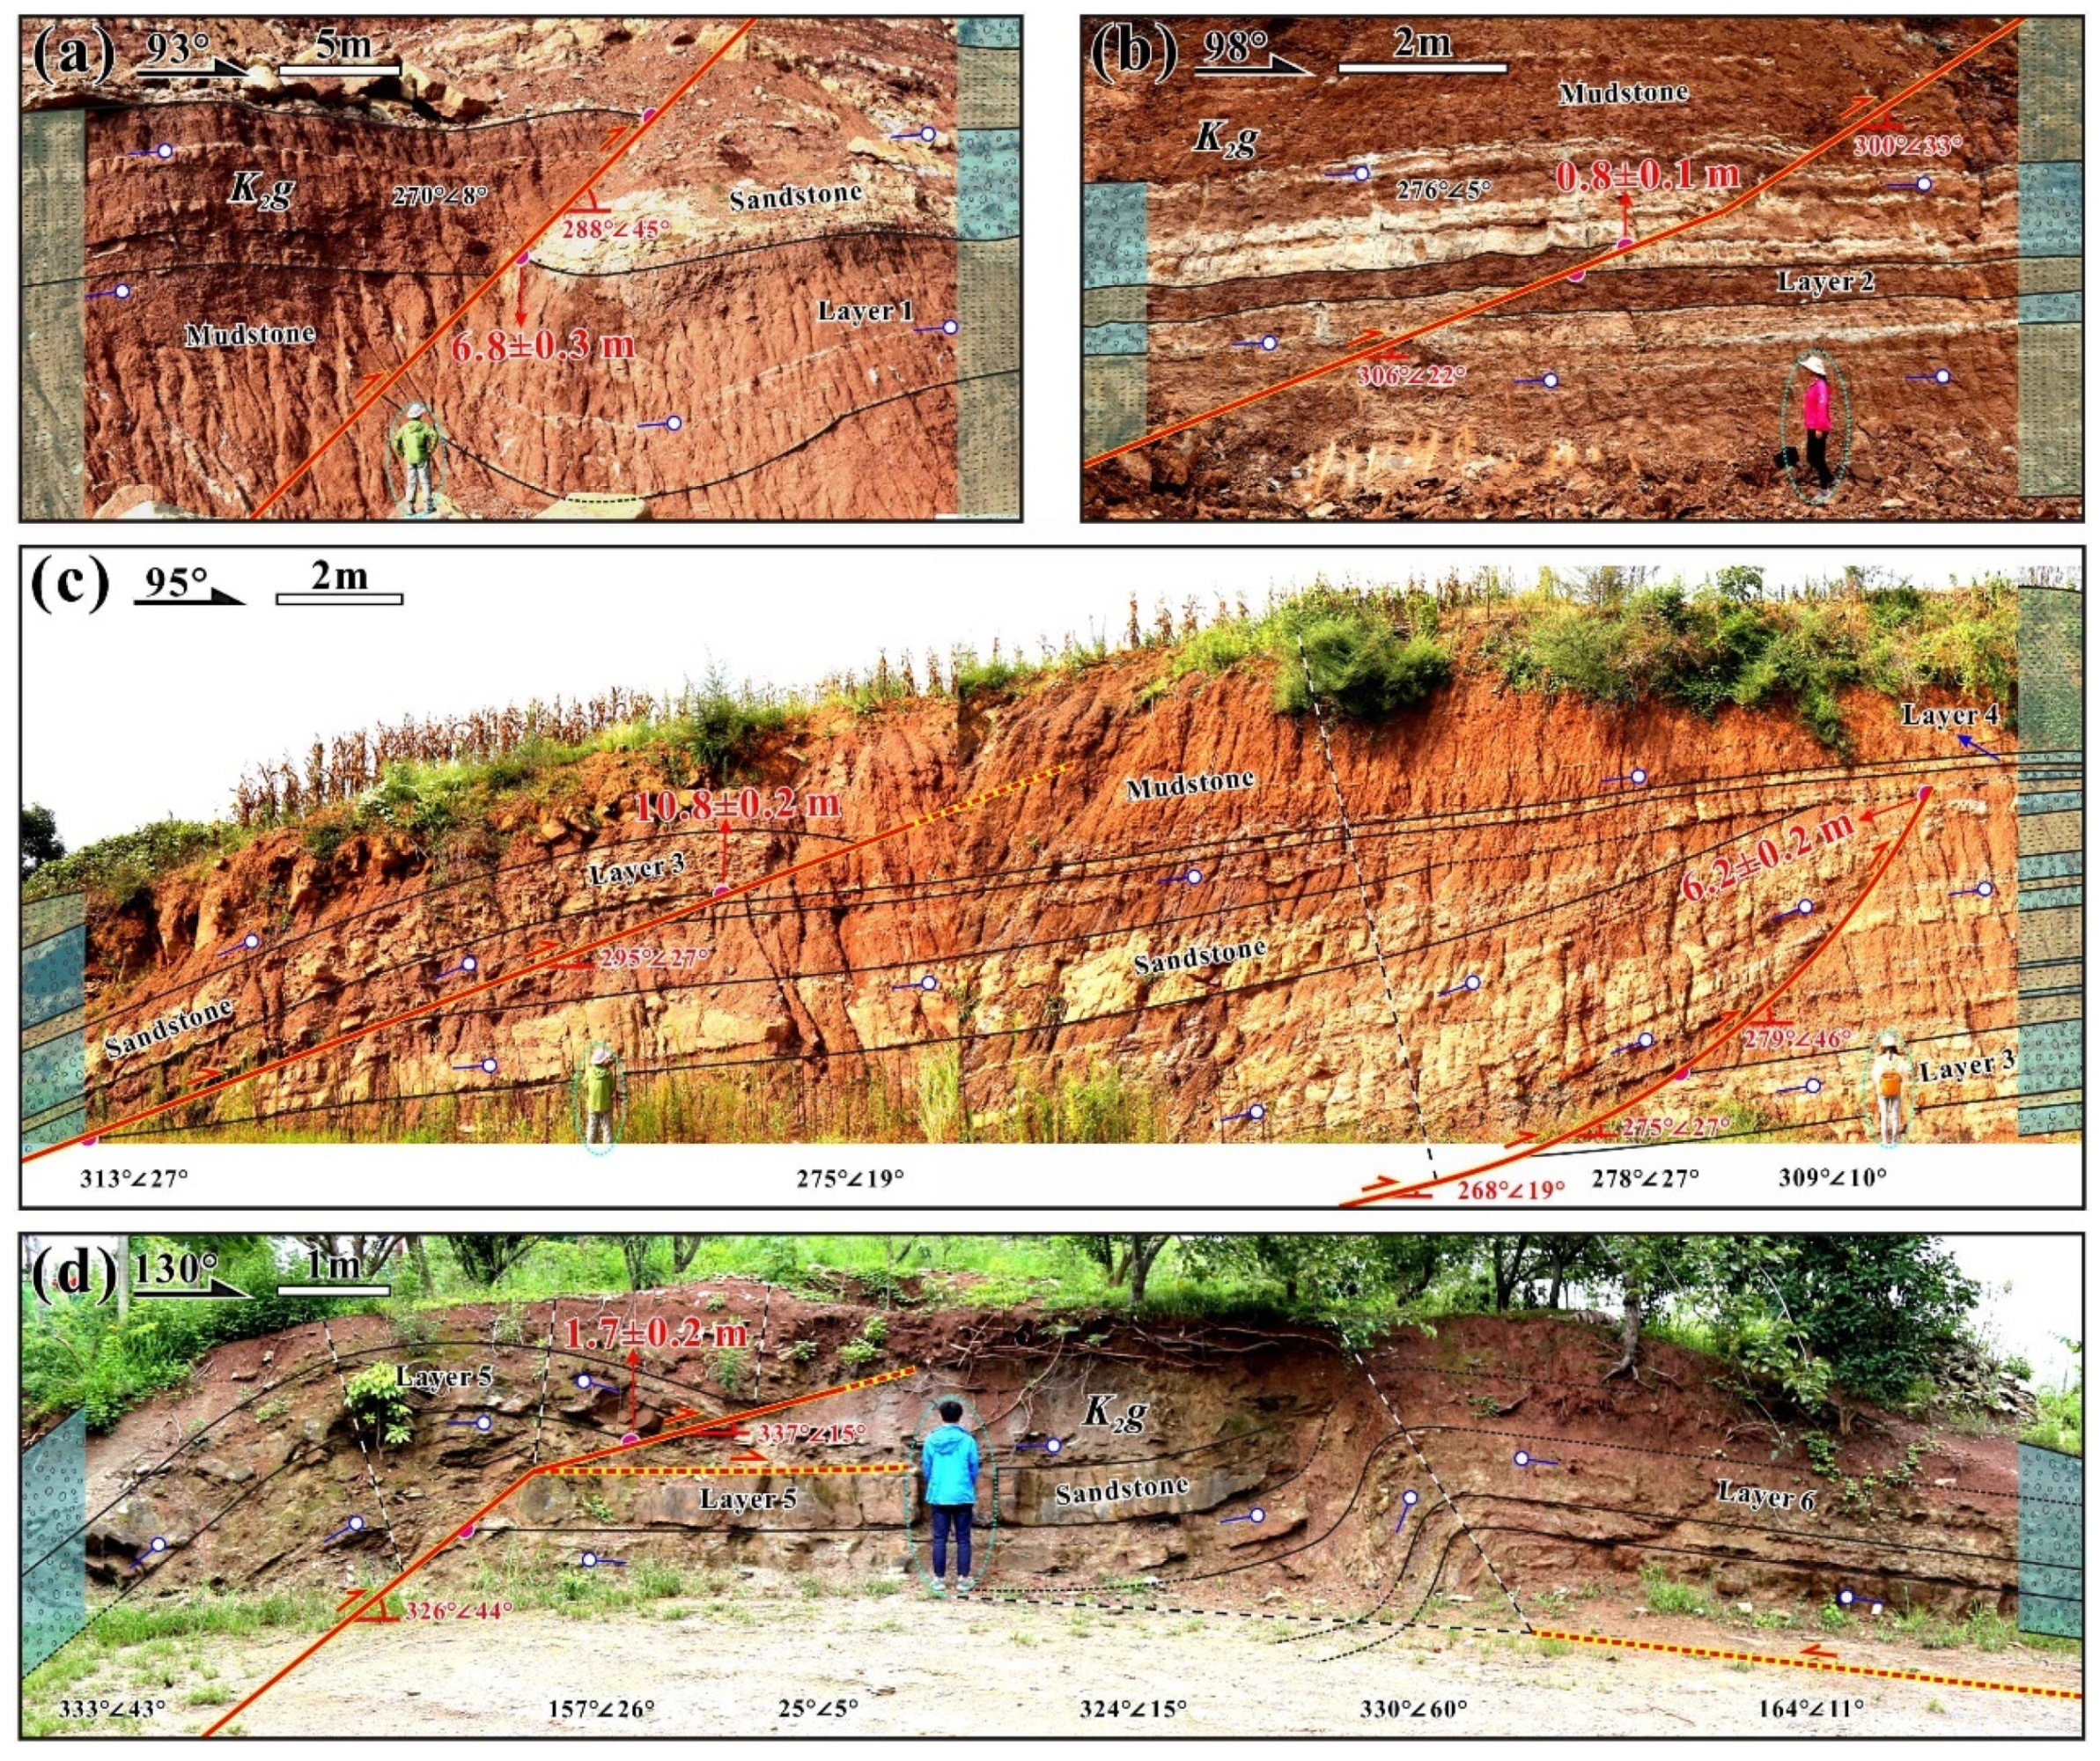
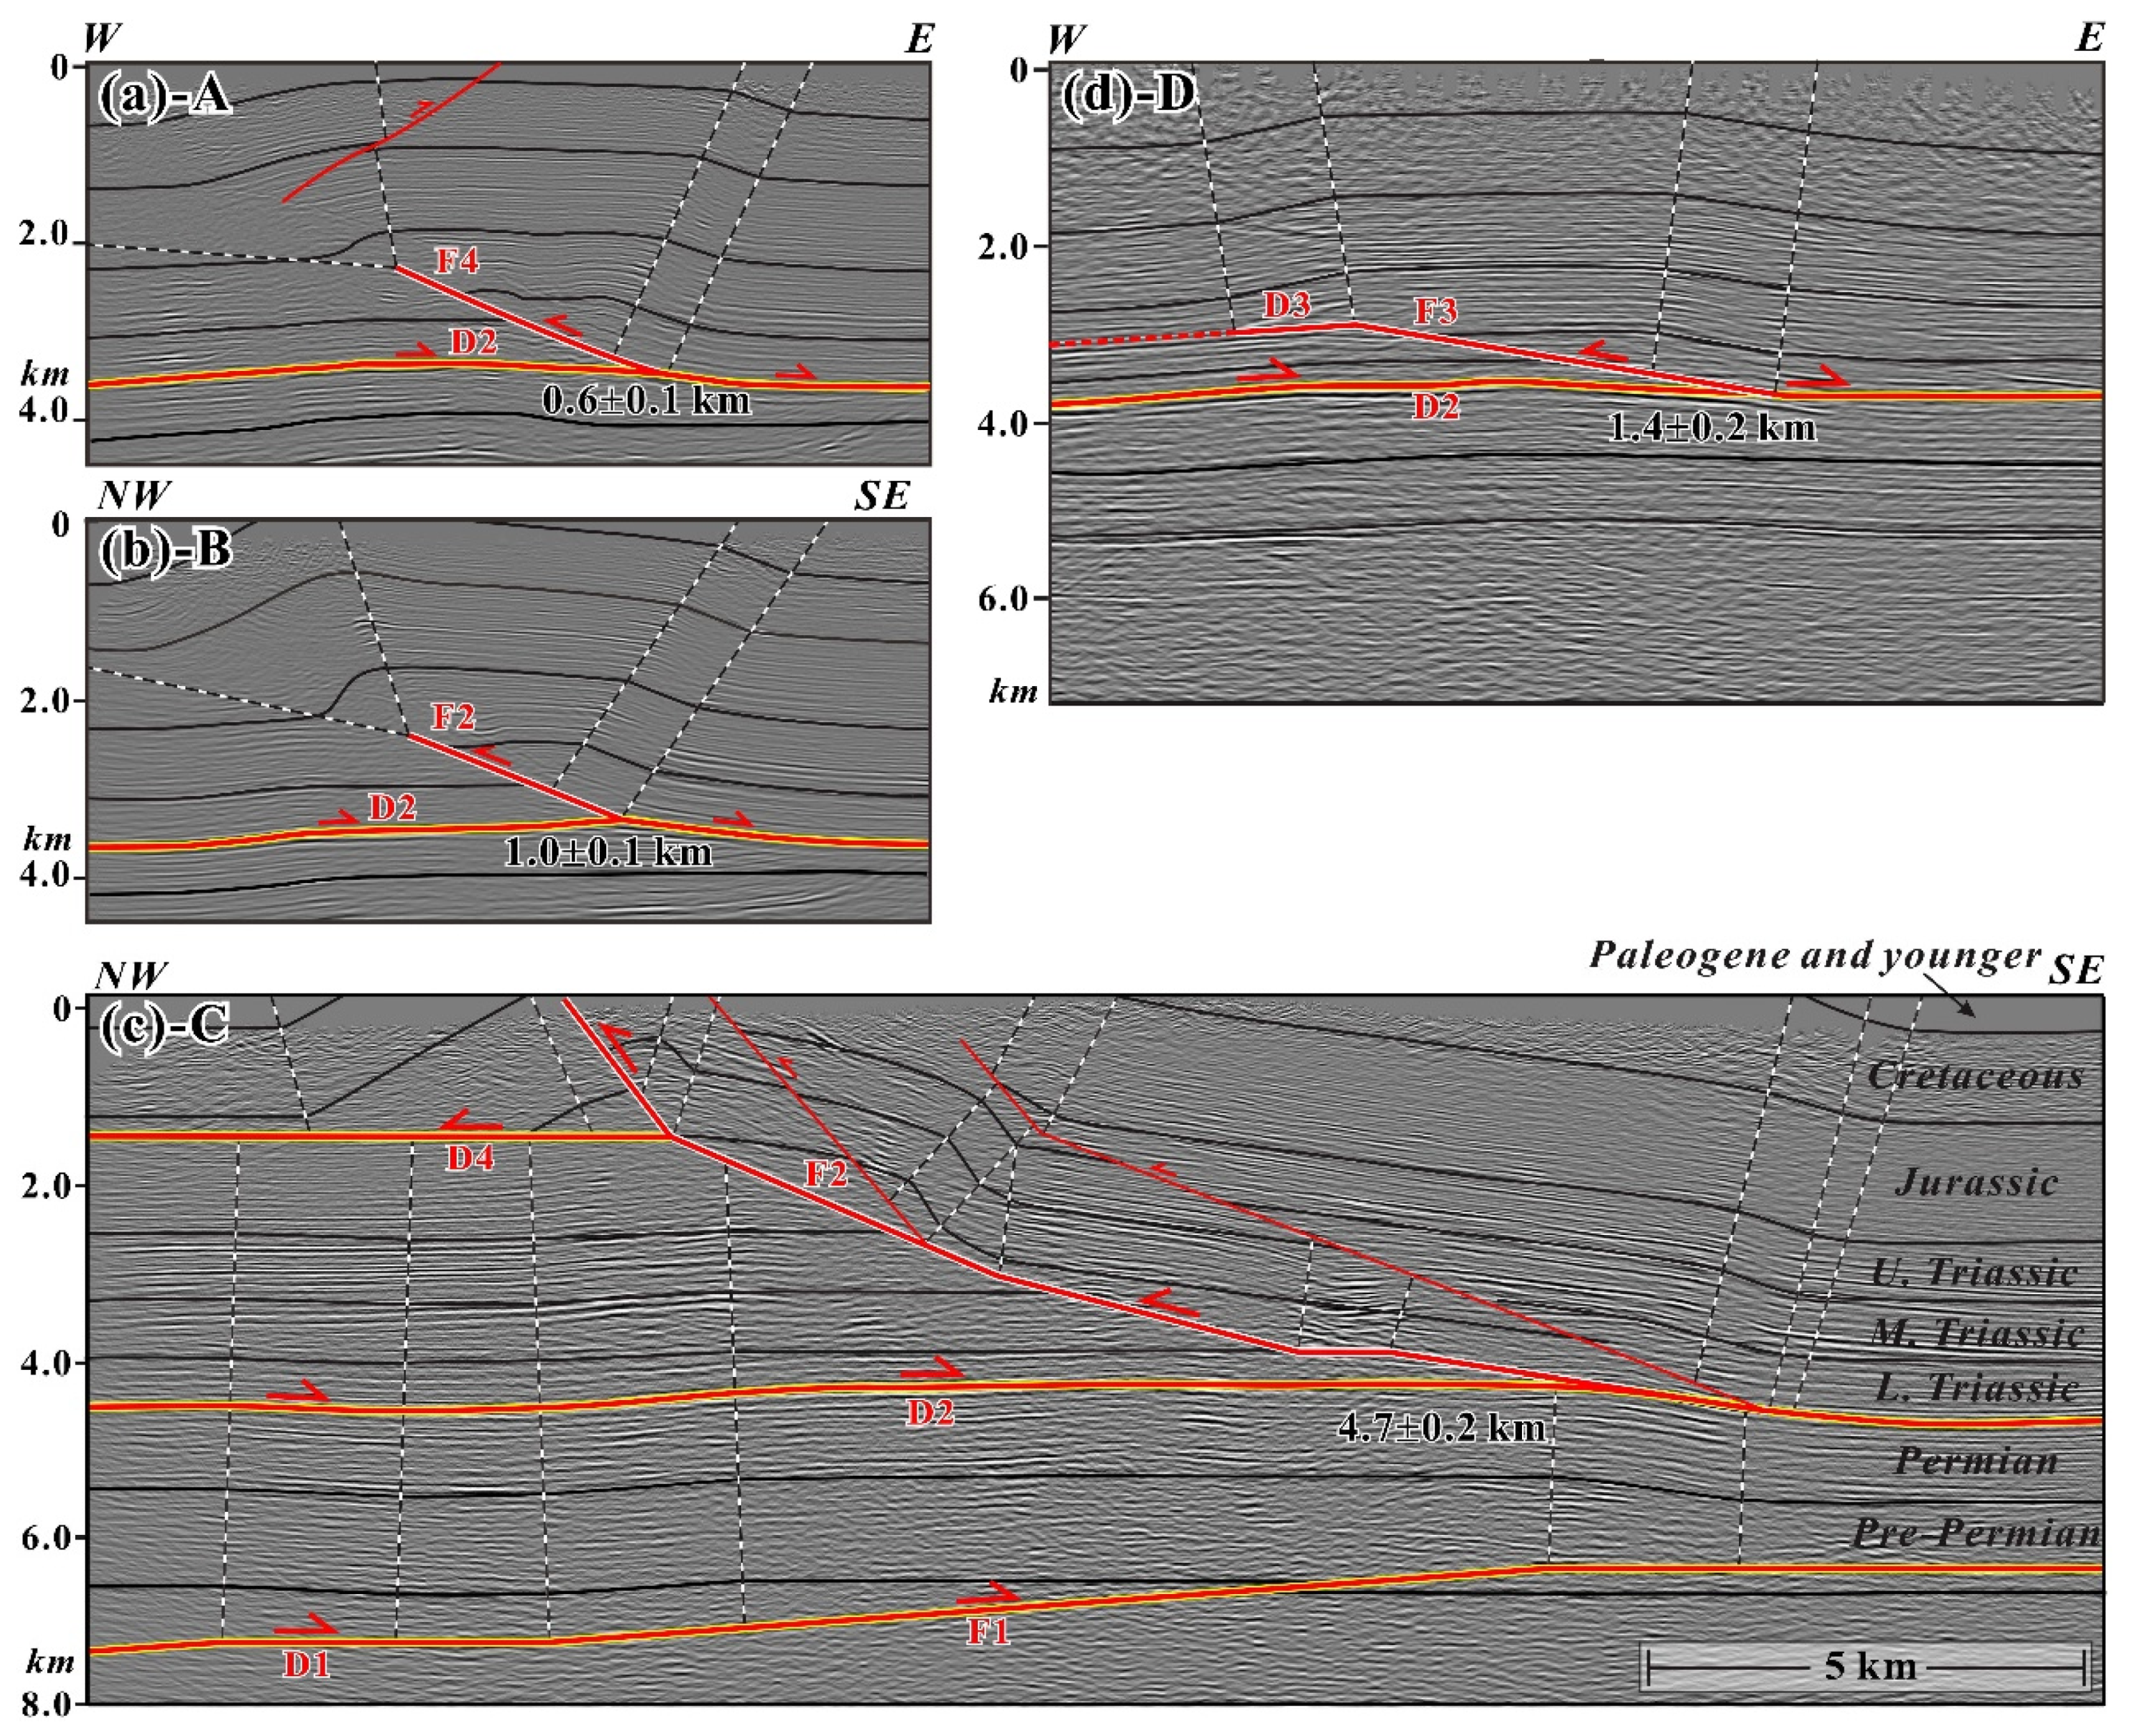
3. The Structural Architecture of the Xiongpo Structure

In order to study the along-strike structural architecture of the Xiongpo structure, we present here four seismic reflection profiles (A–D in Figure 2 and Figure 5) and four geological sections (1–4 in Figure 2 and Figure 6), oriented nearly perpendicular to the fold strikes. These seismic data were collected and processed by PetroChina using the post-stack time-migration technique. Then, we convert the seismic data with time domain into depth utilizing layered velocity model [47].
Horizon calibrations on these profiles are associated with stratigraphic constraints of petroleum wells and surface geological maps. These geological sections are drawn integrating the field investigations (Figure 3 and Figure 4), seismic profiles, and geological mapping (Figure 2). Interpreted thrust fault and related folds are based on the theory of contractional fault-related folds [22]. According to their structural style, as well as strikes of thrust faults and related folds, we divided the structure into southern, central, and northern segments.

3.1. Central Segment

Two representative seismic reflection profiles (B and C in Figure 2), and three geological sections (1–3 in Figure 2) are used to illustrate the structural architecture of the central segment of the Xiongpo fault-fold belt. Profile C cuts across the highest point of the topography of the entire structure, and shows a superimposed deeper contractional fault-bend fold [48] above F1 and shallower multi-bend back-thrust fault (F2) with two splay thrust faults, separated by the middle detachment layer (D2) (Figure 5C). Moreover, profile C records the maximum fault slip with 4.7 ± 0.2 km (approximate to the width of the backlimb kink band, 0.2 km represents measurement error) of the F2. Section 2, about ~10 km to the northeast, displays a similar structural architecture at depth to profile C, with two fault bends and 2.4 ± 0.2 km slip of the F2 and without splay thrust fault (Figure 6b). Section 3, about ~10 km to the southwest to profile C, only shows a fault bend fold above the D2, which is controlled by the back-thrust fault (F2) with 2.8 ± 0.2 km slip (Figure 6c).
To the north of the central segment of the Xiongpo structure, profile B displays an asymmetric fold characterized by a steeply dipping forelimb, a gently dipping backlimb, and a forelimb trishear zone. Thus, we consider the structure to be mainly characterized by a trishear fault propagation fold [49] above the D2, which is controlled by the back-thrust fault (F2) with 1.0 ± 0.1 km slip (Figure 5b). Section 1, about ~10 km to the southwest of profile B, presents a similar structural architecture at the depth of profile B, with 2.0 ± 0.2 km slip of the F2 and without a splay thrust fault (Figure 6b).
In general, the structural architecture of the central segment of the Xiongpo structure displays along-strike differences, which transfers a complex superimposed deep fault-bend fold above F1 and a shallower structural wedge to a simple shallow fault-bend fold, and then to a trishear fault propagation fold. Moreover, the total amount of slip on the fault F2 also shows along-strike variations, decreasing toward northeast and southwest from a maximum in profile C (4.7 ± 0.2 km) (Figure 5 and Figure 6).

3.2. Southern Segment

In contrast to the central segment, the southern segment of the Xiongpo structure shows a relatively simple geometry at depth. Profile D displays a gentler, wider fault bend fold above the D2, which is controlled by the back-thrust fault (F3) with 1.4 ± 0.2 km slip (Figure 5d). Section 4, about ~15 km to the southwest, displays a similar structural architecture at depth to profile D, with 1.5 ± 0.2 km slip of the F2 (Figure 6d).

3.3. Northern Segment

The northern segment has a coherent structural architecture at a depth that is different from the northern central segment (i.e., profile B and Section 1). Profile A displays an asymmetric fold characterized by a steeply dipping forelimb, a gently dipping backlimb, and a forelimb trishear zone. Thus, we consider the structure to be mainly characterized by a trishear fault propagation fold above the D2, which is controlled by the back-thrust fault (F4) with 0.6 ± 0.1 km slip (Figure 5a).
Overall, the cumulative fault slip reached the maximum value of 4.7 ± 0.2 km in profile C, decreasing toward southwest to one-third in the south segment, and then northeast to one-eighth in the northern segment, suggesting a complex fault-fold growth in the entire Xiongpo structure (Figure 5 and Figure 6).

4. The 3D Fault Model of Xiongpo Structure

4.1. The 3D Structural Modeling Method

We interpreted four seismic reflection profiles (Figure 5) and four geological sections (Figure 6), and integrated field observations (Figure 3 and Figure 4), geological mapping ([28], Figure 2), and a 30 m digital elevation model to build a complete 3D fault model of the Xiongpo structure (Figure 7) using GoCAD software [50]. There are three steps to reconstructing the geometric relationships of the complex faults and detachments. First, the data points (x, y, and z) of the faults and detachments were extracted from the interpreted seismic and geological imaging using the WGS 1984 UTM Zone 48. Then, the faults and detachments are interpolated as irregular triangulated surfaces. Last, the surfaces of the faults and detachments were smoothed by a Kriging interpolation. Thus, the 3D fault model provides a visual perspective for understanding the subsurface 3D structural architecture of Xiongpo fold-fault belt (Figure 7).

4.2. Model Results

The completed 3D fault model (Figure 7) consists of a topographic model, three main thrust faults (F2, F3, and F4), four detachment layers (D1, D2, D3, and D4), and a number of fault scarps of F2. The 3D model clearly revealed the spatial relationship between the deep (D1) and shallow along-strike differences in fault-plane geometries (i.e., F2) of the three thrust faults (F2, F3 and F4). The 3D fault model reveals more detailed along-strike variations of subsurface structural architecture of Xiongpo fold-fault belt. First of all, the structure comprises the deep and shallow thrust faults (F2 F3, and F4), which are separated by the regional detachment layer (D2), rooted in the Permian–Triassic boundary (Figure 5 and Figure 6). The deeper NE-striking fault and detachment (D1) is only observed in the middle part of the central segment (possibly because this is the only location with deep seismic lines). In the central segment, a ~45 km-long NE-striking fault F2 developed above the D2 and propagated upward to the surface or near surface. To the south of central segment, a ~25 km-long NNE-striking fault F3 nucleated and grew above the D2 in the southern segment, whereas to the north, a ~15 km-long ~N–S-striking fault F4 developed (Figure 5, Figure 6 and Figure 7).

5. Discussion

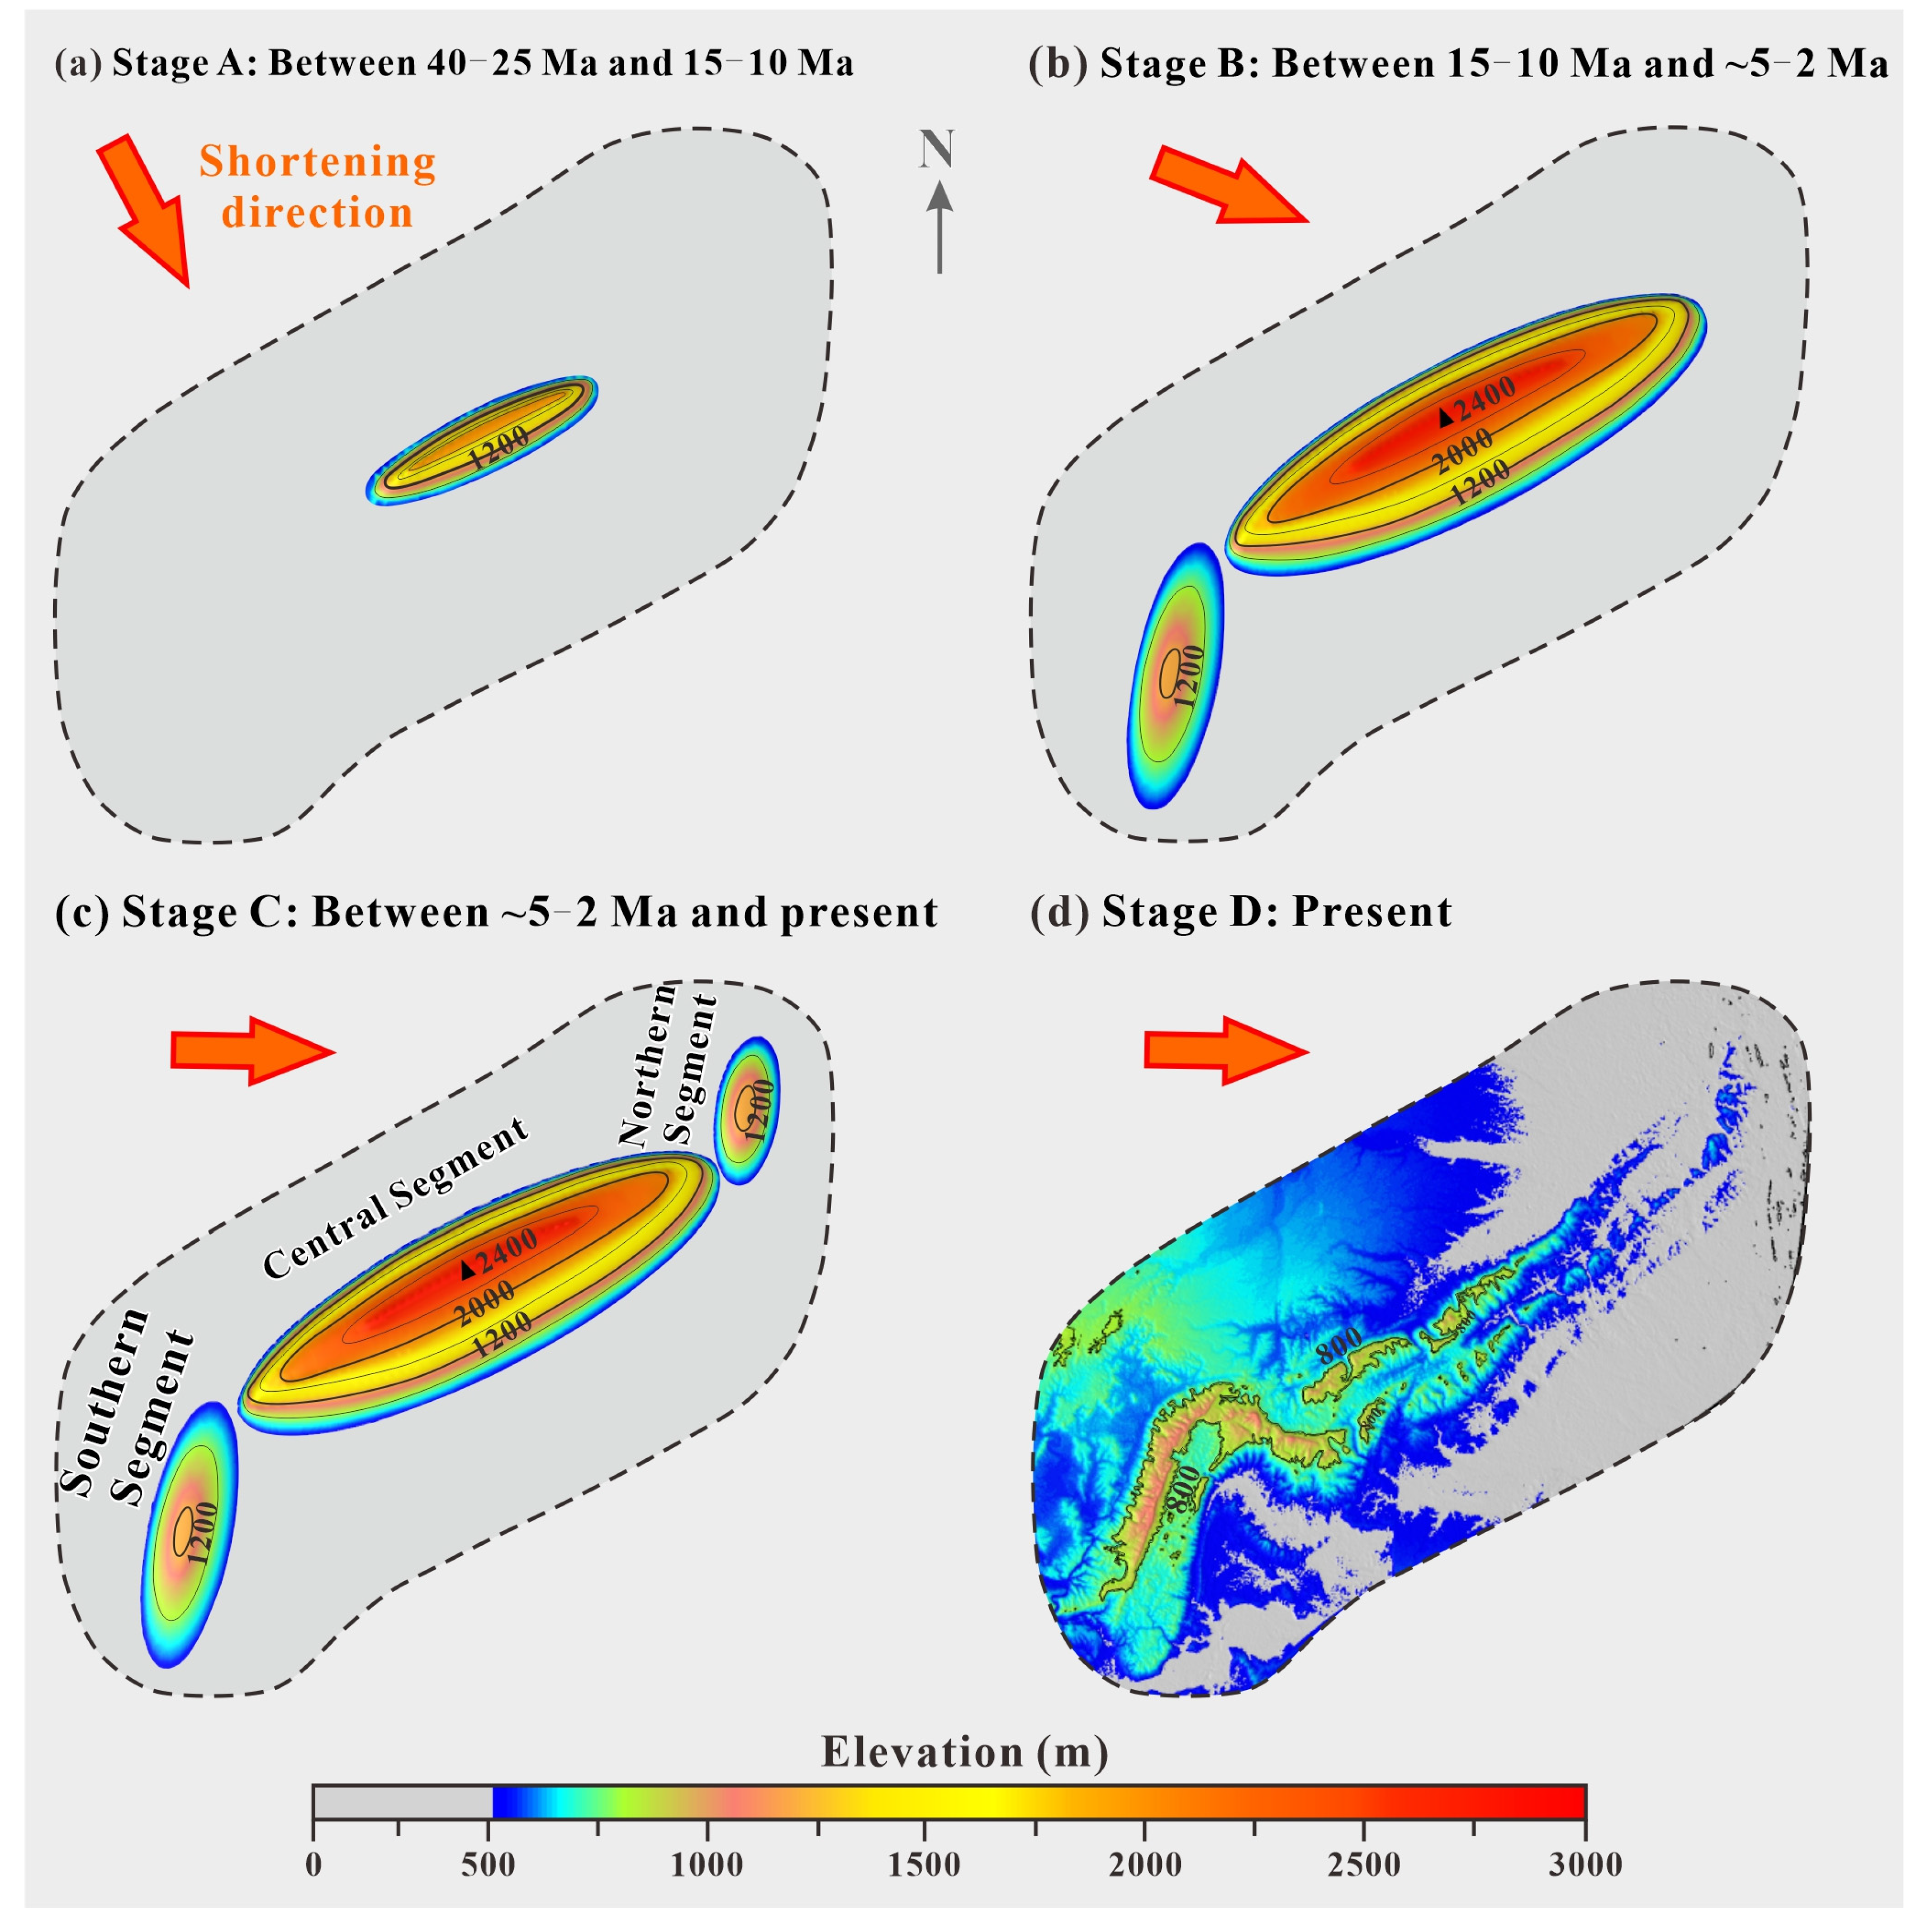
5.1. 3D Structural and Landscape Evolutions of the Xiongpo Structure

The combination of field investigations, seismic profiles, structural sections, 3D fault model, as well as published low-temperature thermochronology [33,34] and growth strata [31] results, allow us to refine the three-stage structural and landscape evolutions of the Xiongpo structure since the Late Eocene [32].
Stage A is between 40–25 Ma and 15–10 Ma, characterized by NE-striking F1 and F2 active. In this stage, the initial Xiongpo structure was developed, about 25 km long, ~10 wide, and ~2 km in height (Figure 8a), which was primarily controlled by a superimposed deeper NE-striking fault-bend fold (F1) and shallower east-verging NE-striking multi-bend back-thrust fault (F2) (Figure 5c). The F2 and detachment fault D2 together form a structural wedge (Figure 5c).
The second stage B is between 15–10 Ma and ~5–2 Ma, characterized by active NE-striking F2 and NNE-striking F3. The Xiongpo structure underwent lateral and bi-directional growth along the NE-striking F2, and developed a 45 km long, ~15 wide, and 2.8 km high anticlinal structure in the central segment (Figure 8b). At that time, a new shallower east-verging NNE-striking back thrust fault (F3), and developed a gentler, wider fault bend fold in the southern segment, about 25 km long, ~10 wide, and ~1.2 km high (Figure 8b). This complex thrust-fold pattern is consistent with the geological mapping, which also shows that the older NE-striking fault-fold is cut by the younger NNE-striking secondary fault in the central segment (Figure 2).
The third stage C is characterized by ~N–S-striking F4 active after ~5–2 Ma. In the last stage, another new shallower east-verging ~N–S-striking back thrust fault (F4) initiated, and developed a trishear fault-propagation fold with much steeper and narrower forelimb than backlimb in the northern segment, about 15 km long, ~10 wide, and ~1.2 km high (Figure 8c). The F4 and detachment fault D2 together form a structural wedge (Figure 5a). The younger NNE-striking secondary fault rotates to a ~N–S-striking and cut the older NE-striking fault-fold (Figure 2). Moreover, the ~N–S-striking fault-fold belt absorbed less shortening than the NE-striking fault-fold (Figure 4 and Figure 5), suggesting that it acts as the youngest structure in the region. When comparing the present topography (the highest point of ~1.0 km, Figure 8d) of the Xiongpo structure with the three complete anticlines (the maximum uplift of ~2.8 km, [32]) in the stage C (Figure 8c), we reveal that the maximum elevation has been eroded by ~1.8 km. This value is consistent with 1–4 km of regional-scale denudation within the western Sichuan Basin constrained by low-temperature thermochronology [33].

5.2. What Causes Triple-Stage Fault-Fold Growth of the Xiongpo Structure?

Along-strike differences of fault-fold belts in contractional tectonic settings have been interpreted by two contrasting models: local stress field change or rotation [51], and regional block rotation. Our 3D fault model of the Xiongpo fault-fold belt reveals along-strike difference of the fault strikes, characterized by NE-striking faults in the central segment, whereas NEE- and ~N–S-striking faults in the two plunging zones (Figure 7), reflect a rather complex evolution processes developed as a result of the changes of stress directions during the fault-fold belt growth.
Here, we show a compilation of new and previously published data to discuss the controlling factor of three-stage fault-fold growths of the Xiongpo structure, and consider the local stress field change may be the primary controlling factor due to the following reasons:
Field investigations and subsurface structural architecture studies reveal that these thrust faults and fault-fold belts (including Longquan, Pengzhou, Dayi, Qiongxi, and Xiongpo structure) in the Longmen Shan fold-and-thrust belt share comparable kinematics, reflecting two stress field changes in the eastern Tibet since late Eocene [31], and references therein, Figure 8). The first change corresponds to NNE-striking thrust fault developed and truncated both limbs of the NE-striking fault-fold belts, likely the Xiongpo, Dayi, Longquan structures [31], which imply WNW-directed crustal shortening between 15–10 Ma and ~5–2 Ma (Figure 8b). The second change is consistent with ~N–S striking thrust fault growth that cuts both limbs of the NE- and/or NNE-striking fault-fold belts, which suggests an ~E–W orientation of the maximum compressive stress after ~5–2 Ma [31,52] (Figure 8c).
It should be noted that there is non-synchronous crustal deformation and movement of the Sichuan Basin and neighboring regions during the Cenozoic, reflecting that the basin undergoes negligible clockwise or anticlockwise rotation, similarly to the Ordos Basin to the north [53]. There are three stages of structural deformations (40–25 Ma, 15–10 Ma, and ~5–2 Ma) in the eastward extrusion zone of the eastern Tibet, including Longmen Shan fold-and-thrust belts, Min Shan, Xianshuihe fault, and Longriba fault. However, only the Late Eocene–Oligocene (~35–28 Ma) stage of crustal shortening has been recorded in the eastern Sichuan Basin, suggesting a non-synchronous crustal deformation occurred around the Sichuan Basin [54,55]. Moreover, paleomagnetic studies reveal that the Sichuan Basin and its margins suffered un-matched crustal movement during the Cenozoic ([53,54], and references therein). Wang [56] proposed that the Sichuan Basin suffered counterclockwise rotation since ~13 Ma, dragged by the left-lateral movement along the Xianshuihe fault. However, this outcome does not coincide with the other paleomagnetic results of the Cretaceous and Paleogene within the western Sichuan Basin. Furthermore, Tong [57] suggested that the basin experienced clockwise rotational deformation at early Miocene, caused by the combination of northeastward escaping of the Songpan–Ganzi block and the counterclockwise rotation of the south China block. These contradictory conclusions show that the amount and direction of rotation of the Sichuan Block is still an ongoing matter of debate.
Thus, we propose that the three-stage fault-fold growths in the Longmen Shan piedmont is due to two stress field changes in the eastern Tibet since Late Eocene with little/no rigidly rotation of the Sichuan basin at this period. The complex crustal deformation and dynamic background may be related to the combination of the southeastward growth of the Tibetan Plateau along the Xianshuihe fault and northeastward escape of the Songpan–Ganzi block, but this model needs more data to be confirmed.

6. Conclusions

Based on interpreted seismic profiles and geological sections, combined with field investigations and a 3D fault model, we provide a case study that displays the along-strike variation of structural architecture and 3D tempo-spatial evolution of the Xiongpo fault-fold belt, and we draw the following conclusions:
(1)
The Xiongpo anticline is characterized by a transition from a structural superposition of deep fault-bend fold and shallow structural wedge in the central segment to a simple shallow fault-bend fold, and then to a trishear fault propagation fold in two plunging zones.
(2)
The Xiongpo anticline experiences a three-stage evolution processes, beginning with a NE-striking fault that was active under the NW–SE compression between 40–25 Ma and 15–10 Ma, followed by lateral propagation of NE-striking fault and the initiation of ENE-striking fault till ~5–2 Ma, and finally ~N–S fault active under ~E–W compression until present.
(3)
The presented fault-fold growth history of the Xiongpo structure reveals two stress field changes in the eastern Tibet since Late Eocene, which may be related to the combination of the southeastward growth of the Tibetan Plateau along the Xianshuihe fault and northeastward escape of the Songpan–Ganzi block.

Author Contributions

Conceptualization, X.L. and C.S.; methodology, X.Z.; software, X.D.; validation, R.A.; data curation, C.S.; writing—original draft preparation, X.L.; writing—review and editing, R.A.; supervision, C.S.; funding acquisition, C.S. All authors have read and agreed to the published version of the manuscript.

Funding

This study was jointly funded by the National Natural Science Foundation of China (42172233, 41772209, 41902201) and Guangdong Province Introduced Innovative R&D Team of Geological Processes and Natural Disasters around the South China Sea (2016ZT06N331).

Conflicts of Interest

The authors declare no conflict of interest.

References

  1. Davis, D.; Suppe, J.; Dahlen, F.A. Mechanics of fold-and-thrust belts and accretionary wedges. J. Geophys. Geol. 1983, 88, 1153–1172. [Google Scholar] [CrossRef]
  2. Dahlen, F.A. Noncohesive Critical Coulomb wedges: An exact solution. J. Geophys. Res. 1984, 89, 10125–10133. [Google Scholar] [CrossRef]
  3. Dahlen, F.A. Critical taper model of fold-and-thrust belts and accretionary wedges. Annu. Rev. Earth Planet. Sci. 1990, 18, 55–99. [Google Scholar] [CrossRef]
  4. Whipple, K.X. The influence of climate on the tectonic evolution of mountain belts. Nat. Geosci. 2009, 2, 97–104. [Google Scholar] [CrossRef]
  5. Wolf, S.G.; Huismans, R.S.; Braun, J.; Yuan, X.P. Topography of mountain belts controlled by rheology and surface processes. Nature 2022, 606, 516–521. [Google Scholar] [CrossRef]
  6. Di Paolo, L.; Aldega, L.; Corrado, C.; Mastalerz, M. Maximum burial and unloosing of Mt. Judica recess area in Sicily: Implication for the Apenninic–Maghrebian wedge dynamics. Tectonophysics 2012, 530–531, 193–207. [Google Scholar] [CrossRef]
  7. Di Paolo, L.; Olivetti, V.; Corrado, S.; Aldega, L.; Balestrieri, M.L.; Maniscalco, R. Detecting the stepwise propagation of the Eastern Sicily thrust belt (Italy): Insight from thermal and thermochronological constraints. Terra Nova 2014, 26, 363–371. [Google Scholar] [CrossRef]
  8. Balestra, M.; Corrado, S.; Aldega, L.; Rudkiewicz, J.L.; Gasparo Morticelli, M.; Sulli, A.; Sassi, W. 3D structural modeling and restoration of the Apennine-Maghrebian chain in Sicily: Application for non-cylindrical fold-and-thrust belts. Tectonophysics 2019, 761, 86–107. [Google Scholar] [CrossRef]
  9. Fletcher, R.C. Three-dimensional folding of an embedded viscous layer in pure shear. J. Struct. Geol. 1991, 13, 87–96. [Google Scholar] [CrossRef]
  10. Schmid, D.W.; Dabrowski, M.; Krotkiewski, M. Evolution of large amplitude 3D fold patterns: A FEM study. Phys. Earth Planet. Inter. 2008, 171, 400–408. [Google Scholar] [CrossRef]
  11. Yamato, P.; Kaus, B.J.P.; Mouthereau, F.; Castelltort, S. Dynamic constraints on the crustal-scale rheology of the Zagros fold belt, Iran. Geology 2011, 39, 815–818. [Google Scholar] [CrossRef]
  12. Grasemann, B.; Schmalholz, S.M. Lateral fold growth and fold linkage. Geology 2012, 40, 1039–1042. [Google Scholar] [CrossRef]
  13. Collignon, M.; Fernandez, N.; Kaus, B.J.P. Influence of surface processes and initial topography on lateral fold growth and fold linkage mode. Tectonics 2015, 34, 1622–1645. [Google Scholar] [CrossRef]
  14. Collignon, M.; Yamato, P.; Castelltort, S.; Kaus, B.J.P. Modeling of wind gap formation and development of sedimentary basins during fold growth: Application to the Zagros Fold Belt, Iran. Earth Surf. Process. Landforms 2016, 41, 1521–1535. [Google Scholar] [CrossRef] [Green Version]
  15. Cotton, J.; Koyi, H. Modelling of thrust fronts above ductile and frictional decollements; examples from The Salt Range and Potwar Plateau, Pakistan. Geol. Soc. Am. Bull. 2000, 112, 351–363. [Google Scholar] [CrossRef]
  16. McClay, K.; Whitehouse, P. Analogue modelling of thrust belts formed by oblique subduction. In Thrust Tectonics and Petroleum Systems; McClay, K., Ed.; American Association of Petroleum Geologist Memoir: Tulsa, OK, USA, 2004; p. 82. [Google Scholar]
  17. Keller, E.A.; Zepeda, R.L.; Rockwell, T.K.; Ku, T.L.; Dinklage, W.S. Active tectonics at Wheeler Ridge, southern San Joaquin Valley, California. Geol. Soc. Am. Bull. 1998, 110, 298–310. [Google Scholar] [CrossRef]
  18. Burbank, D.W.; McLean, J.K.; Bullen, M.; Abdrakhmatov, K.Y.; Miller, M.M. Partitioning of intermontane basins by thrust-related folding, Tien Shan, Kyrgyzstan. Basin Res. 1999, 11, 75–92. [Google Scholar] [CrossRef] [Green Version]
  19. Champel, B.; van der Beek, P.; Mugnier, J.L.; Leturmy, P. Growth and lateral propagation of fault-related folds in the Siwaliks of western Nepal: Rates, mechanisms, and geomorphic signature. J. Geophys. Res. 2002, 107, 2–18. [Google Scholar] [CrossRef]
  20. Ramsey, L.A.; Walker, R.T.; Jackson, J. Fold evolution and drainage development in the Zagros mountains of Fars province, SE Iran. Basin Res. 2008, 20, 23–48. [Google Scholar] [CrossRef]
  21. Bretis, B.; Bartl, N.; Grasemann, B. Lateral fold growth and linkage in the Zagros fold and thrust belt (Kurdistan, NE Iraq). Basin Res. 2011, 23, 615–630. [Google Scholar] [CrossRef]
  22. Shaw, J.H.; Connors, C.; Suppe, J. Seismic interpretation of contractional fault-related folds. Am. Assoc. Pet. Geol. 2005, 53, 1–58. [Google Scholar]
  23. Delcaillau, B.; Carozza, J.M.; Laville, E. Recent fold growth and drainage development: The Janauri and Chandigarh anticlines in the Siwalik foothills, northwest India. Geomorphology 2006, 76, 241–256. [Google Scholar] [CrossRef] [Green Version]
  24. Chen, J.; Heermance, R.; Burbank, D.W.; Scharer, K.M.; Miao, J.J.; Wang, C.S. Quantification of growth and lateral propagation of the Kashi anticline, southwest Chinese Tian Shan. J. Geophys. Res. 2007, 112. [Google Scholar] [CrossRef] [Green Version]
  25. Hubert-Ferrari, A.; Suppe, J.; Gonzalez-Mieres, R.; Wang, X. Mechanisms of active folding of the landscape (southern Tian Shan, China). J. Geophys. Res. 2007, 112. [Google Scholar] [CrossRef] [Green Version]
  26. Higgins, S.; Clarke, B.; Davies, R.J.; Cartwright, J. Internal geometry and growth history of a thrust-related anticline in a deep water fold belt. J. Struct. Geol. 2009, 31, 1597–1611. [Google Scholar] [CrossRef]
  27. Tang, P.C.; Rao, G.; Li, S.Q.; Yu, Y.L.; Pei, Y.W.; Wang, X.; Shen, Z.Y.; Chen, N.H.; Zhao, B. Lateral structural variations and drainage response along the Misikantage anticline in the western Kuqa fold-and-thrust belt, southern Tianshan, NW China. Tectonophysics 2017, 721, 196–210. [Google Scholar] [CrossRef]
  28. Jia, D.; Wei, G.Q.; Chen, Z.X.; Li, B.L.; Zeng, Q.; Yang, G. Longmen Shan fold-thrust belt and its relation to the western Basin in Central China: New insights from hydrocarbon exploration. AAPG Bull. 2006, 90, 1425–1447. [Google Scholar] [CrossRef]
  29. Zheng, W.J.; Wang, W.T.; Li, C.Y.; Wei, Z.Y.; Gao, X. The deformation of the Xiongpo anticline and the activity of Pujiang-Xinjin fault. Seism. Geol. 2008, 30, 957–967. [Google Scholar]
  30. Hubbard, J.; Shaw, J.H. Uplift of the Longmen Shan and Tibetan plateau, and the 2008 Wenchuan (M=7.9) earthquake. Nature 2009, 458, 194–197. [Google Scholar] [CrossRef]
  31. Li, Z.G.; Zhang, P.Z.; Zheng, W.J.; Jia, D.; Hubbard, J.; Almeida, R.; Sun, C.; Shi, X.H.; Li, T. Oblique thrusting and strain partitioning in the Longmen Shan fold-and-thrust belt, eastern Tibetan Plateau. J. Geophys. Res. Solid Earth 2018, 123, 4431–4453. [Google Scholar] [CrossRef]
  32. Li, Z.G.; Zheng, W.J.; Zhang, P.Z.; Almeida, R.; Jia, D.; Sun, C.; Wang, W.T.; Li, T. Evidence for three Cenozoic phases of upper crustal shortening of the Xiongpo structure in the Longmen Shan fold-and-thrust belt, China: Implications for the eastward growth of the eastern Tibetan Plateau. J. Asian Earth Sci. 2019, 179, 138–148. [Google Scholar] [CrossRef]
  33. Richardson, N.J.; Densmore, A.L.; Seward, D.; Fowler, A.; Wipf, M.; Ellis, M.A.; Li, Y.; Zhang, Y. Extraordinary denudation in the Sichuan Basin: Insights from low temperature thermochronology adjacent to the eastern margin of the Tibetan Plateau. J. Geophys. Res. 2008, 113, B04409. [Google Scholar] [CrossRef]
  34. Jia, D.; Li, Y.Q.; Yan, B.; Li, Z.G.; Wang, M.M.; Chen, C.X.; Zhang, Y. The Cenozoic thrusting sequence of the Longmen Shan fold-and-thrust belt, eastern margin of the Tibetan plateau: Insights from low-temperature thermochronology. J. Asian Earth Sci. 2020, 198, 104381. [Google Scholar] [CrossRef]
  35. Tapponnier, P.; Xu, Z.Q.; Roger, F.; Meyer, B.; Arnaud, N.; Wittlinger, G.; Yang, J.S. Oblique, Stepwise Rise and Growth of the Tibet Plateau. Science 2001, 294, 1671–1677. [Google Scholar] [CrossRef]
  36. Zhang, G.H.; Tian, Y.T.; Li, R.; Shen, X.M.; Zhang, Z.J.; Sun, X.L.; Chen, D.X. Progressive tectonic evolution from crustal shortening to mid-lower crustal expansion in the southeast Tibetan Plateau: A synthesis of structural and thermochronological insights. Earth-Sci. Rev. 2022, 226, 103951. [Google Scholar] [CrossRef]
  37. Kirby, E.; Reiners, P.W.; Krol, M.A.; Whipple, K.X.; Hodges, K.V.; Farley, K.A.; Tang, W.; Chen, Z.L. Late Cenozoic evolution of the eastern margin of the Tibetan Plateau: Inferences from 40Ar/39Ar and (U–Th)/He thermochronolgy. Tectonics 2002, 21, 1-1-1-20. [Google Scholar] [CrossRef] [Green Version]
  38. Clark, M.K.; House, M.A.; Royden, L.H.; Whipple, K.X.; Burchfiel, B.C.; Zhang, X.; Tang, W. Late Cenozoic uplift of southeastern Tibet. Geology 2005, 33, 525–528. [Google Scholar] [CrossRef] [Green Version]
  39. Godard, V.; Pik, R.; Lavé, J.; Cattin, R.; Tibari, B.; de Sigoyer, J.; Pubellier, M.; Zhu, J. Late Cenozoic evolution of the central Longmen Shan, eastern Tibet: Insight from (U-Th)/He thermochronometry. Tectonics 2009, 28. [Google Scholar] [CrossRef] [Green Version]
  40. Wang, E.; Kirby, E.; Furlong, K.P.; van Soest, M.; Xu, G.; Shi, X.; Kamp, P.J.J.; Hodges, K.V. Two-phase growth of high topography in eastern Tibet during the Cenozoic. Nat. Geosci. 2012, 5, 640–645. [Google Scholar] [CrossRef]
  41. Tian, Y.; Kohn, B.P.; Gleadow, A.J.W.; Hu, S. Constructing the Longmen Shan eastern Tibetan Plateau margin: Insights from lowtemperature thermochronology. Tectonics 2013, 32, 576–592. [Google Scholar] [CrossRef]
  42. Roger, F.; Calassou, S.; Lancelot, J.; Malavieille, J.; Mattauer, M.; Zhiqin, X.; Ziwen, H.; Liwei, H. Miocene emplacement and deformation of the Konga Shan granite (Xianshui He fault zone, west Sichuan, China): Geodynamic implications. Earth Planet. Sci. Lett. 1995, 130, 201–216. [Google Scholar] [CrossRef]
  43. Li, H.; Zhang, Y. Zircon U–Pb geochronology of the Konggar granitoid and migmatite: Constraints on the Oligo-Miocene tectono-thermal evolution of the Xianshuihe fault zone, East Tibet. Tectonophysics 2013, 606, 127–139. [Google Scholar] [CrossRef]
  44. Zhang, Y.Z.; Replumaz, A.; Leloup, P.H.; Wang, G.C.; Bernet, M.; van der Beek, P.; Paquette, J.L.; Chevalier, M.L. Cooling history of the Gongga batholith: Implications for the Xianshuihe Fault and Miocene kinematics of SE Tibet. Earth Planet. Sci. Lett. 2017, 465, 1–15. [Google Scholar] [CrossRef]
  45. Tian, Y.T.; Li, R.; Tang, Y.; Xu, X.; Wang, Y.J.; Zhang, P.Z. Thermochronological constraints on the late Cenozoic morphotectonic evolution of the Min Shan, the eastern margin of the Tibetan Plateau. Tectonics 2018, 37, 1733–1749. [Google Scholar] [CrossRef]
  46. Ansberque, C.; Godard, V.; Olivetti, V.; Bellier, O.; de Sigoyer, J.; Bernet, M.; Stübner, K.; Tan, X.B.; Xu, X.W.; Ehlers, T.A. Differential exhumation across the Longriba fault system: Implications for the eastern Tibetan Plateau. Tectonics 2018, 37, 663–679. [Google Scholar] [CrossRef]
  47. Li, Z.G.; Liu-Zeng, J.; Jia, D.; Sun, C.; Wang, W.; Yuan, Z.D.; Liu, B.J. Quaternary activity of the range front thrust system in the Longmen Shan piedmont, China, revealed by seismic imaging and growth strata. Tectonics 2016, 35, 2807–2827. [Google Scholar] [CrossRef] [Green Version]
  48. Suppe, J. Geometry and kinematics of fault-bend folding. Am. J. Sci. 1983, 283, 684–721. [Google Scholar] [CrossRef]
  49. Erslev, E.A. Trishear fault-propagation folding. Geology 1991, 19, 617–620. [Google Scholar] [CrossRef]
  50. Mallet, J.L. Discrete smooth interpolation in geometric modeling. Comput. Aided Des. 1992, 24, 178–191. [Google Scholar] [CrossRef]
  51. Fischer, M.P.; Wilkerson, M.S. Predicting the orientation of joints from fold shape: Results of pseudo-three-dimensional modeling and curvature analysis. Geology 2000, 28, 15–18. [Google Scholar] [CrossRef]
  52. Li, Z.G.; Jia, D.; Chen, W.; Yin, H.W.; Shen, L.; Sun, C.; Zhang, Y.; Li, Y.Q.; Li, S.Q.; Zhou, X.J.; et al. Late Cenozoic east-west crustal shortening in the southern Longmen Shan, eastern Tibet: Implications for regional stress field changes. Tectonophysics 2014, 623, 169–186. [Google Scholar] [CrossRef]
  53. Hao, M.; Wang, Q.L.; Zhang, P.Z.; Li, Z.J.; Li, Y.H.; Zhuang, W.Q. “Frame wobbling” causing crustal deformation around the Ordos block. Geophys. Res. Lett. 2021, 48, e2020GL091008. [Google Scholar] [CrossRef]
  54. Tian, Y.T.; Kohn, B.P.; Qiu, N.S.; Yuan, Y.S.; Hu, S.B.; Gleadow, A.J.W.; Zhang, P.Z. Eocene to Miocene out-of-sequence deformation in the eastern Tibetan Plateau: Insights from shortening structures in the Sichuan Basin. J. Geophys. Res. Solid Earth 2018, 123, 1840–1855. [Google Scholar] [CrossRef]
  55. Li, J.; Li, H.; Yang, C.; Wu, Y.J.; Gao, Z.; Jiang, S.L. Geological characteristics and controlling factors of deep shale gas enrichment of the Wufeng-Longmaxi Formation in the southern Sichuan Basin, China. Lithosphere 2022, 2022, 4737801. [Google Scholar] [CrossRef]
  56. Wang, E.; Meng, K.; Su, Z.; Meng, Q.Q.; Chu, J.J.; Chen, Z.L.; Wang, G.; Shi, X.H.; Liang, X.Q. Block rotation: Tectonic response of the Sichuan basin to the southeastward growth of the Tibetan Plateau along the Xianshuihe-Xiaojiang fault. Tectonics 2014, 33, 686–718. [Google Scholar] [CrossRef]
  57. Tong, Y.B.; Sun, Y.J.; Wu, Z.H.; Mao, C.P.; Pei, J.L.; Yang, Z.Y.; Pu, Z.W.; Zhao, Y.; Xu, H. Passive crustal clockwise rotational deformation of the Sichuan Basin since the Miocene and its relationship with the tectonic evolution of the fault systems on the eastern edge of the Tibetan Plateau. GSA Bull. 2019, 131, 175–190. [Google Scholar] [CrossRef]
Figure 1. (a) Topography and main faults in and around the Tibetan Plateau. (b) Topography hillshade map of eastern Tibet and the Longmen Shan showing its geologic setting, main faults, and three phases of crustal deformations. Fault names: XSHF = Xianshuihe fault; LRBF = Longriba fault; MJF = Minjiang fault; HYF = Huya fault; QCF = Qingchuan fault; WMF =Wenchuan–Maowen fault; YBF = Yingxiu–Beichuan fault; PGF = Pengguan fault; WLF = Wulong fault; BXF = Baoxing fault; RFBT = Range Front blind fault; PZF = Pengzhou fault; DYF = Dayi fault; QXF = Qiongxi fault; XPF = Xiongpo fault; LQF = Longquan fault.
Minerals 12 01405 g001
Figure 2. Geological map of the Xiongpo structure and adjacent regions (location shown in Figure 1). The map is modified from [31]. The seismic reflection profiles and geological sections used in this study are shown as black and blue lines, respectively. The emerged and blind thrust faults are shown as red solid and dotted lines, respectively. XPA = Xiongpo anticline; QXA = Qiongxi anticline; SSCA = Sansuchang anticline. T3 = Upper Triassic; J1, J2, and J3 = Lower, Middle, and Upper Jurassic; K1 and K2 = Lower and Upper Cretaceous; E = Eocene; Q = Pleistocene and Holocene.
Minerals 12 01405 g002
Figure 3. Field photos show Middle and Upper Jurassic, as well as Upper Cretaceous strata in different positions of Xiongpo structure from NE to SW (locations are shown in Figure 2).
Minerals 12 01405 g003
Figure 4. Field photos show outcropping secondary thrust faults in the intersection between the central and northern segments of the Xiongpo structure (locations are shown in Figure 2). The fault geometry and minimum-accumulated slip are interpreted by the directly observed dip domains and fault cutoffs.
Minerals 12 01405 g004
Figure 5. Interpreted seismic reflection profiles using the quantitative theory of fault-related folding [22] (locations are shown in Figure 2). The minimum total slips are indicated, which approximate to the width of the backlimb kink band. The number of the main thrust faults (F1–F4) and four detachment layers (D1–D4) are shown in these profiles, corresponding to the geological mapping (Figure 2).
Minerals 12 01405 g005
Figure 6. Interpreted geological sections based on field investigations, neighboring seismic profiles (Figure 5), and the quantitative theory of fault-related folding [22] (locations are shown in Figure 2). The minimum total slips are indicated, which approximate to the width of the backlimb kink band. The number of the main thrust faults and detachment layers are shown in the profile, corresponding to the geological mapping (Figure 2).
Minerals 12 01405 g006
Figure 7. Interpreted 3D fault model of the Xiongpo structure. The model is extrapolated laterally from four seismic profiles, four geological sections, a 90 m-resolution SRTM digital elevation, and field observations, to build a 3D fault model using GoCAD [50]. The model shows the top topographic model, three main thrust faults (F2 F3, and F4), four detachment layers (D1, and D2), and a number of pointsets (fault scarps of the F2). The topographic model displays the calculated dip angle. See the text for details. Abbreviations: F, fault; D, detachment.
Minerals 12 01405 g007
Figure 8. Reconstructed three-stage structural and landscape evolution processes of the Xiongpo structure since the Late Eocene. (a) Stage A (between 40–25 Ma and 15–10 Ma): NE-striking F1 and F2 active. (b) Stage B (between 15–10 Ma and ~5–2 Ma): NE-striking F2 and NNE-striking F3 active. (c) Stage C (between ~5–2 Ma and present) ~N–S-striking F4 active. (d) Present topography of the eroded Xiongpo structure. See the text for details.
Minerals 12 01405 g008
Publisher’s Note: MDPI stays neutral with regard to jurisdictional claims in published maps and institutional affiliations.

