
Petrography, Geochemical Features and Absolute Dating of the Mesozoic Igneous Rocks of Medvedev and Taezhniy Massifs (Southeast Russia, Aldan Shield)

Abstract
:1. Introduction
2. Geological Setting

3. Materials and Methods
4. Results
4.1. Petrography
4.2. Geochemical Composition
4.3. Geochronology
4.4. Formation Conditions
5. Discussion
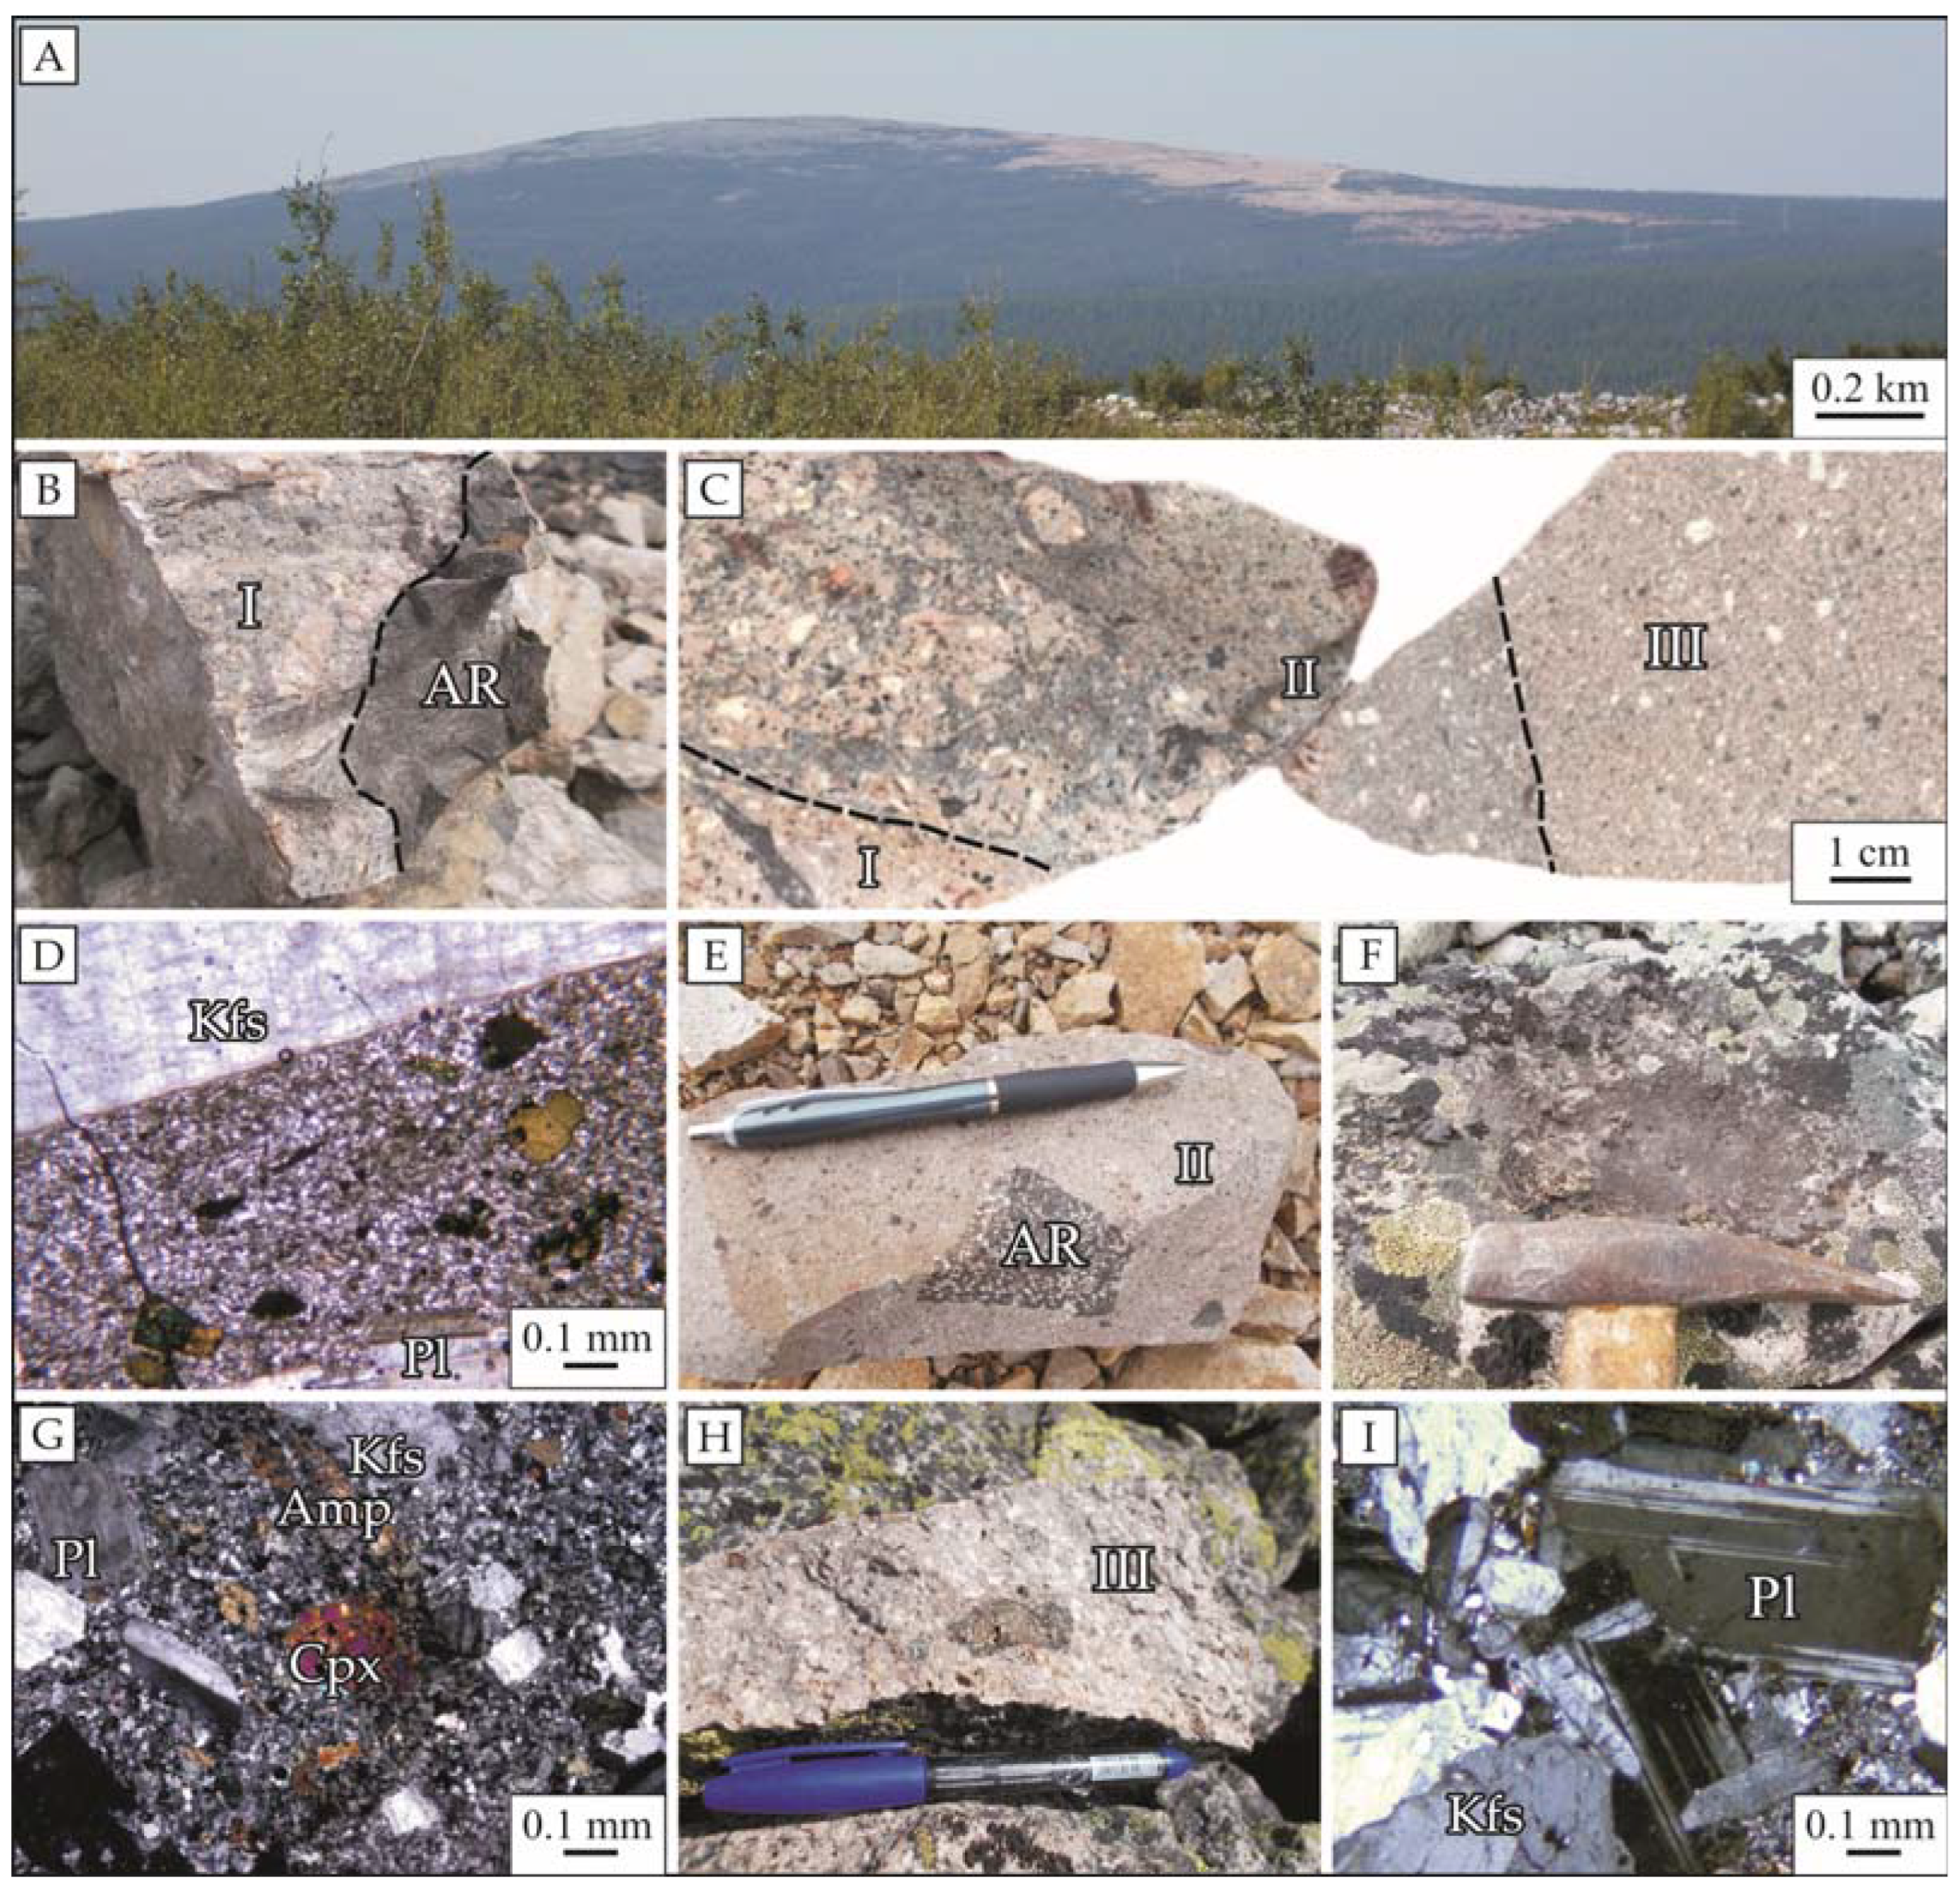
5.1. Petrography of Rocks of Medvedev Massif
5.2. Geochemical Composition of Rocks of Medvedev Massif
5.3. Geochronology of Rocks of Medvedev Massif
5.4. Formation Conditions of Rocks of Medvedev Massif
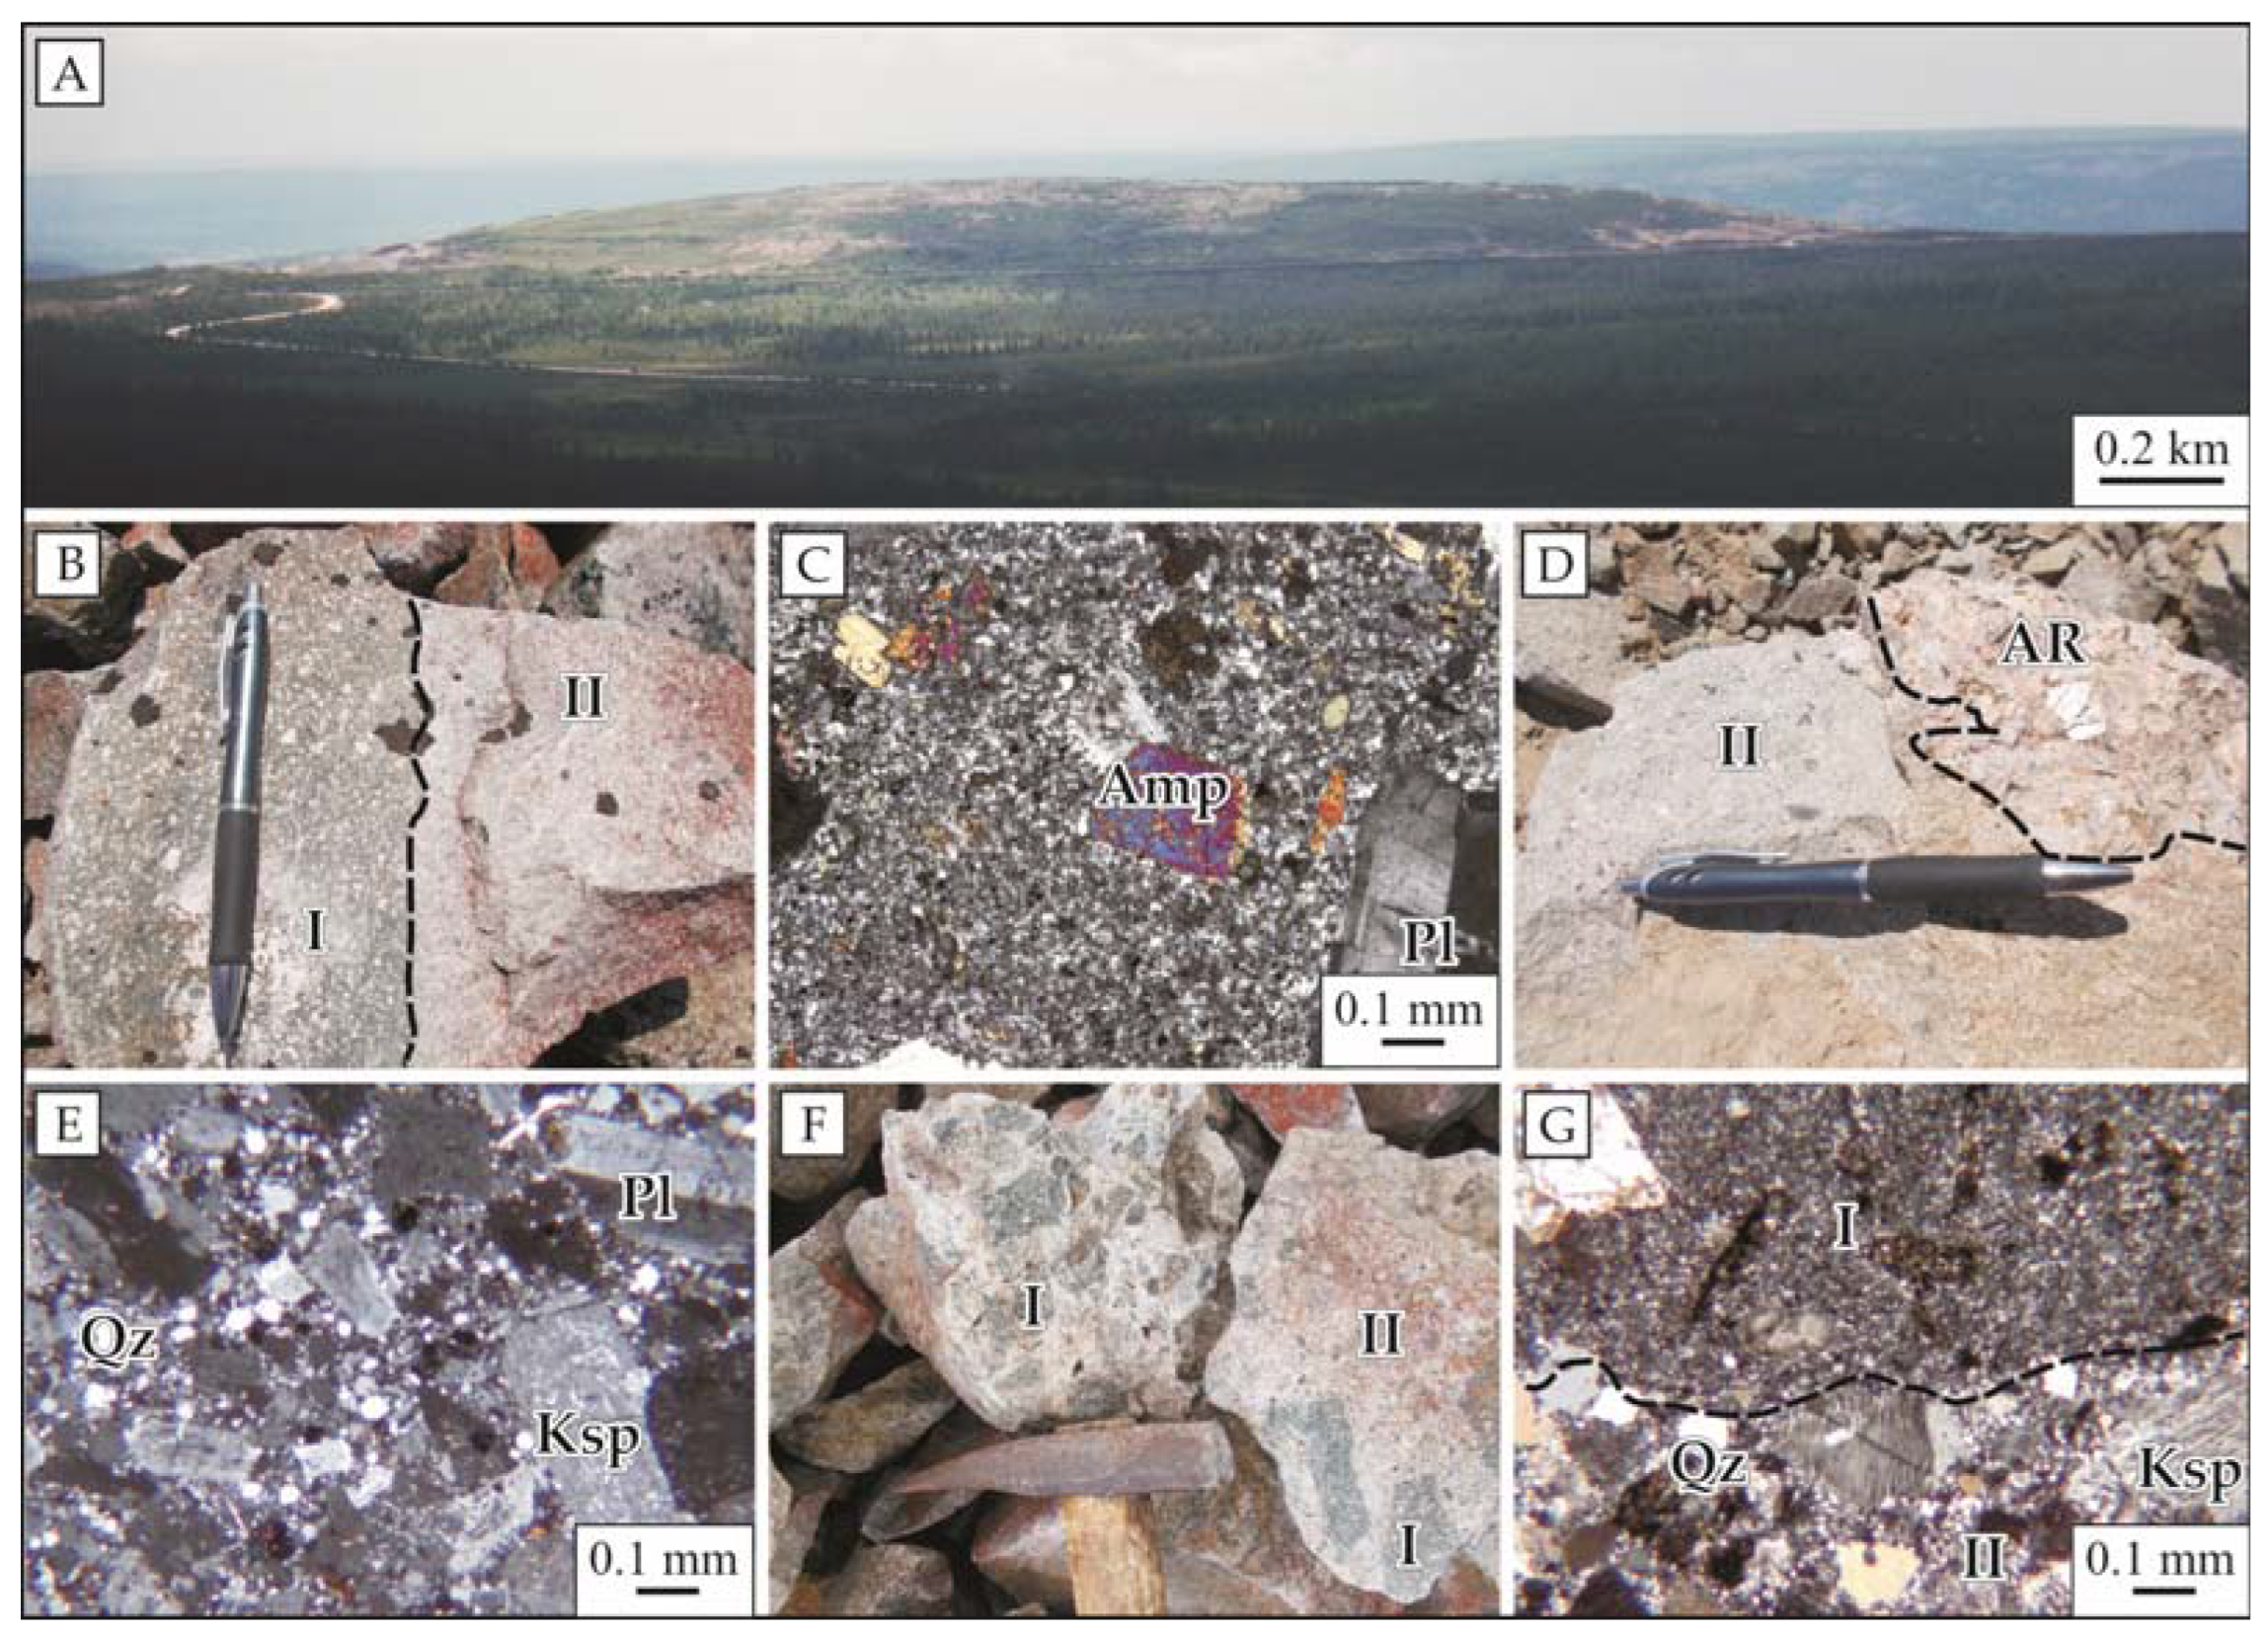
5.5. Petrography of Rocks of Taezhniy Massif
5.6. Geochemical Composition of Rocks of Taezhniy Massif
5.7. Geochronology of Rocks of Taezhniy Massif
5.8. Formation Conditions of Rocks of Taezhniy Massif
6. Conclusions
- According to field, petrographic and geochemical observations, it was revealed that the formation of the Medvedev massif occurred in three phases of rock intrusion and are presented in the following sequence: quartz syenites, pyroxene-amphibole syenites, quartz monzonites. According to the results of the same studies, two phases of rocks are defined in the structure of the Taezhniy massif: quartz monzonites and syenites.
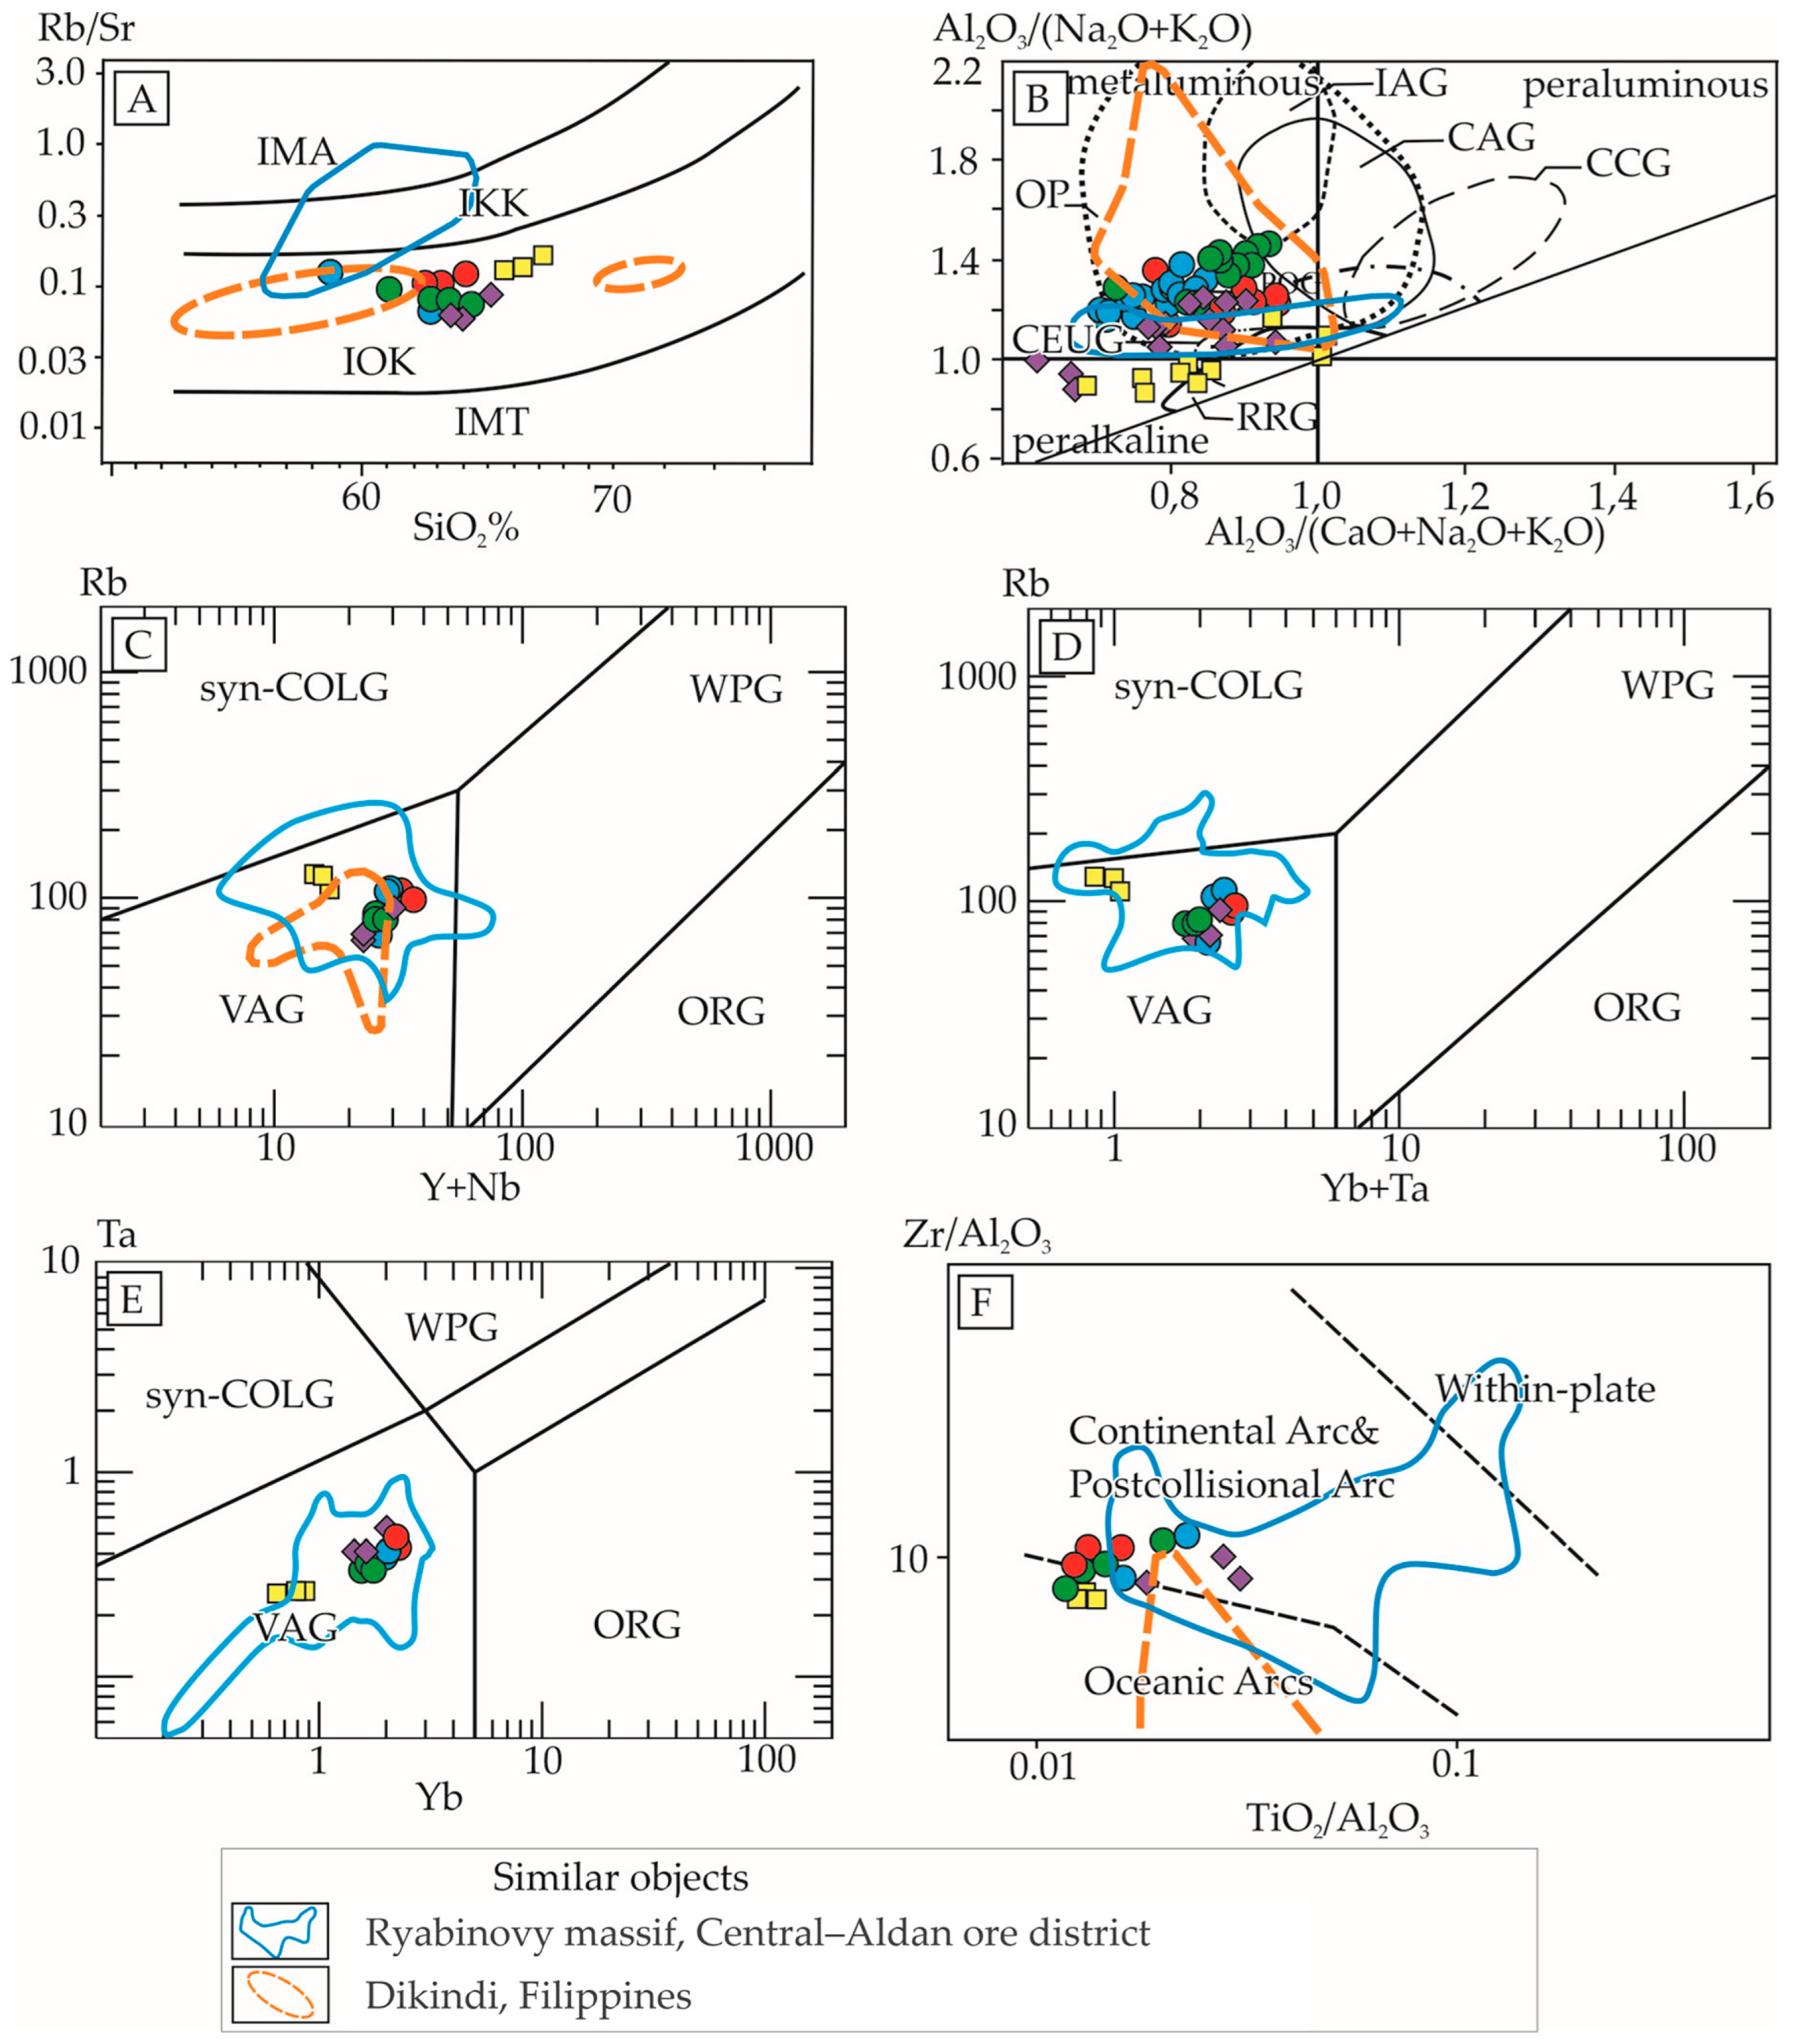
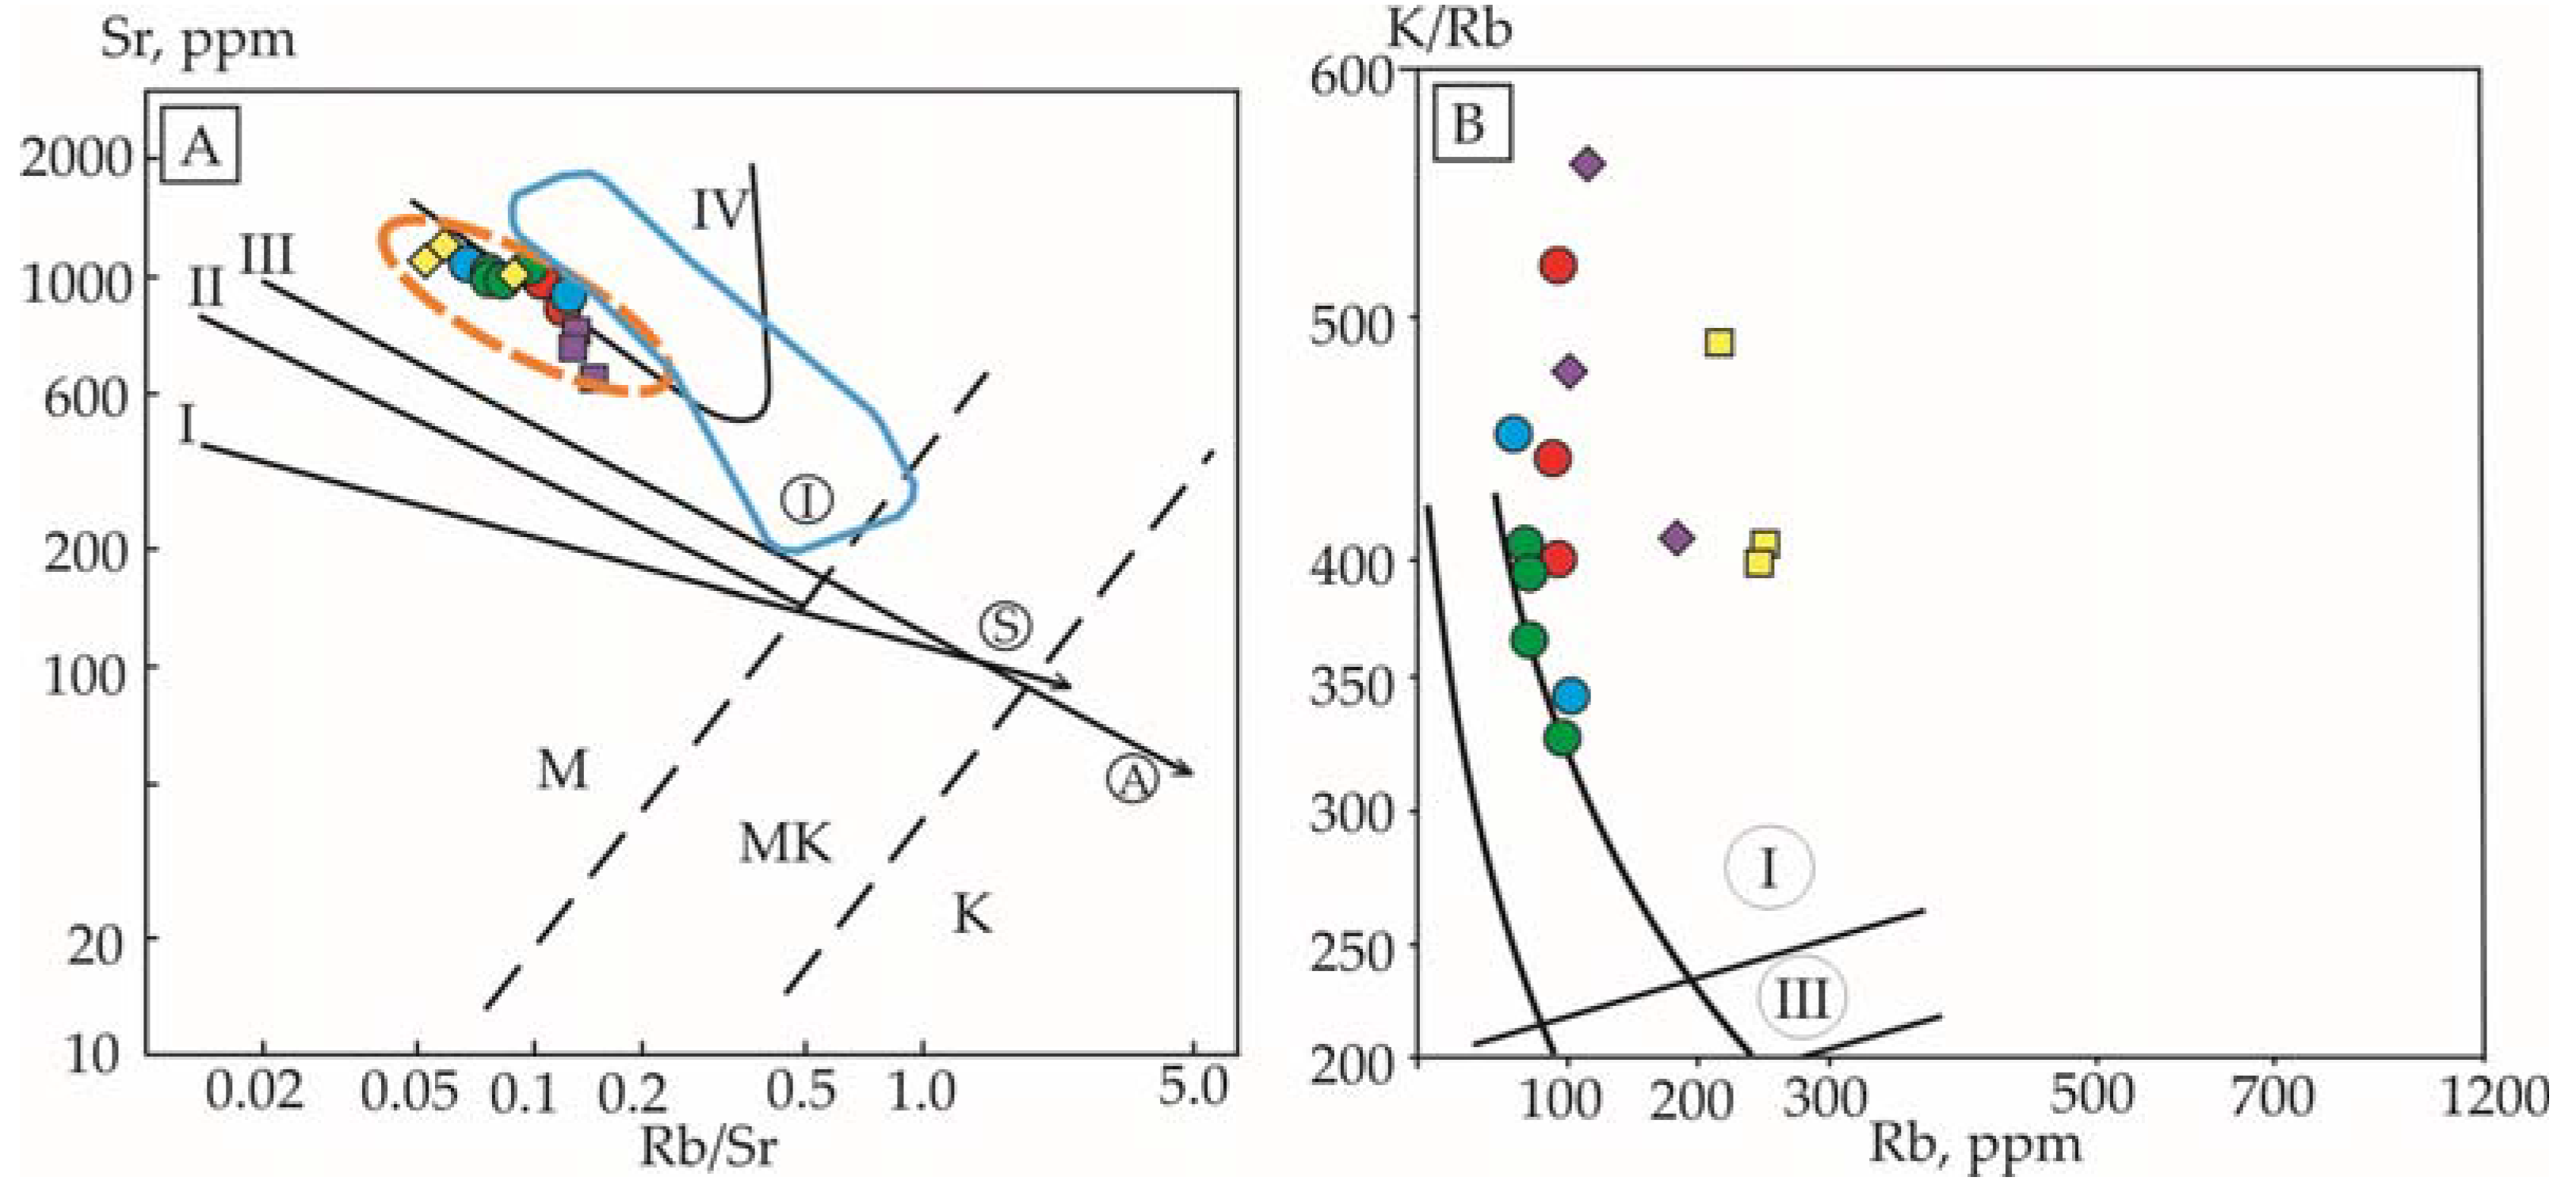
- In terms of geochemical characteristics, the igneous formations of the Medvedev and Taezhniy massifs are similar to rocks derived from the latite and shoshonite series and can be considered as part of the monzonite–syenite formation type.
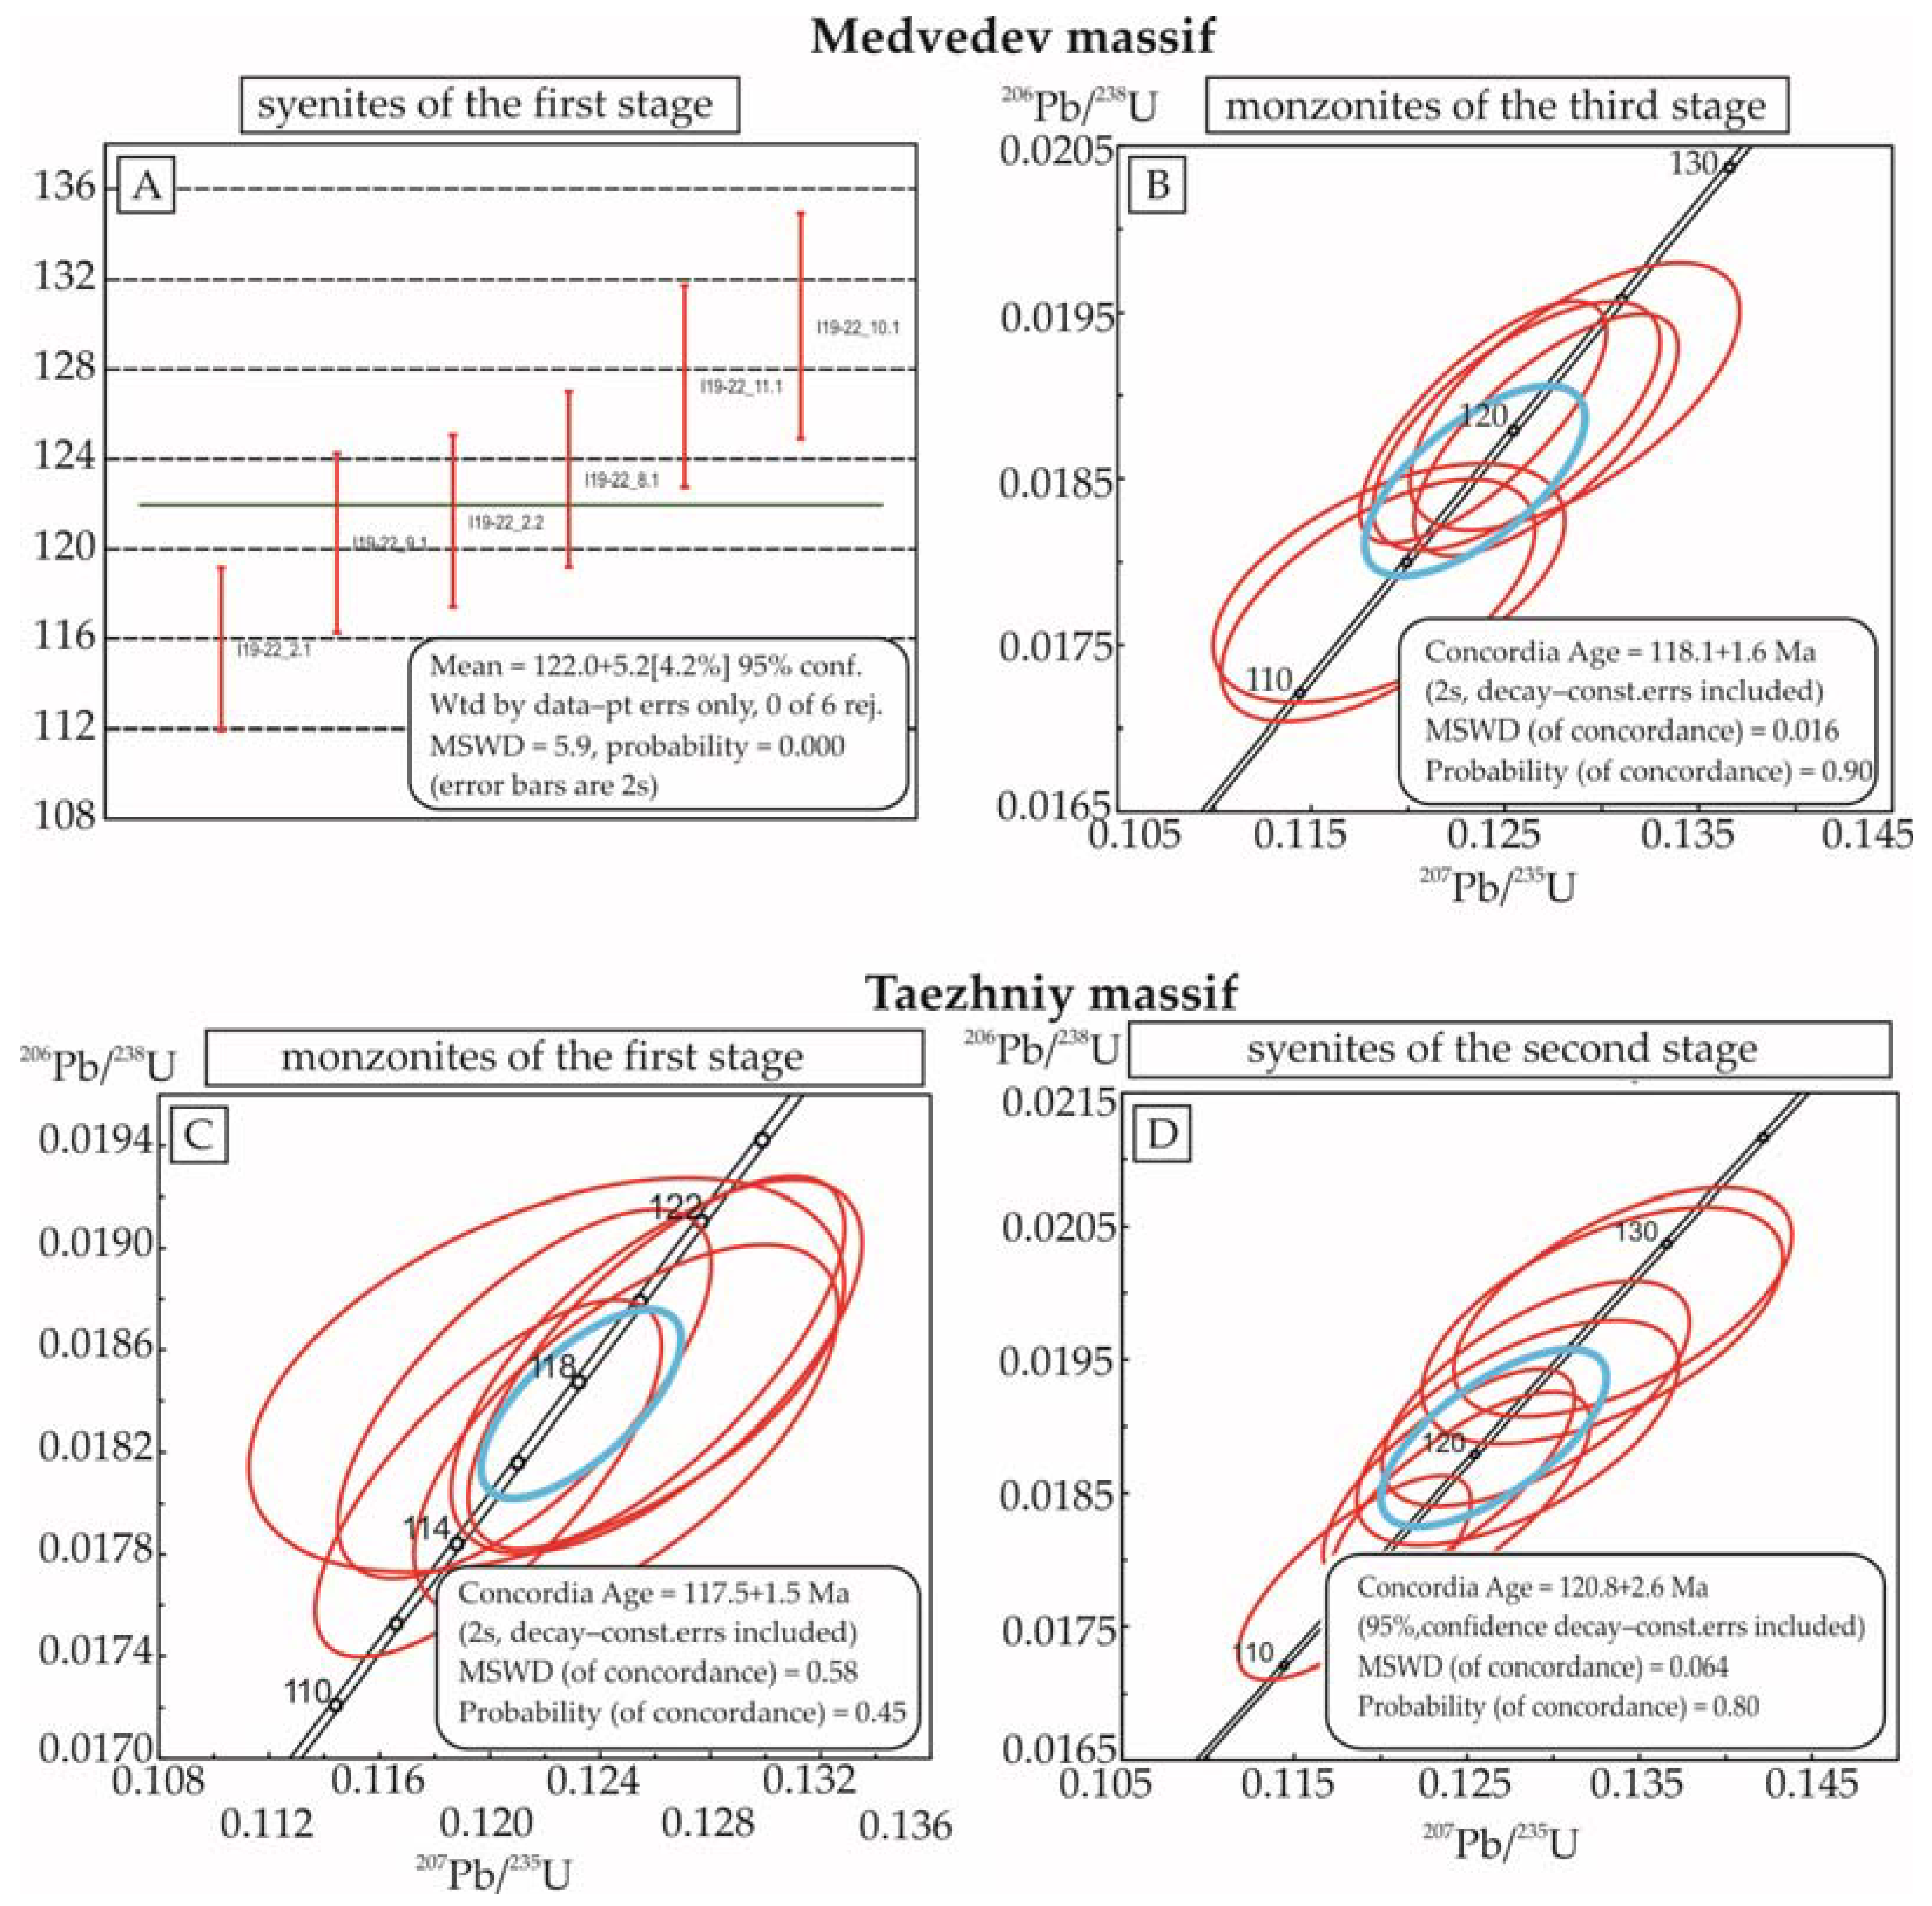
- The periods of formation of igneous rocks of the massifs were identified (Medvedev—122.0–118.0 Ma and Taezhniy—117.5–114.5 Ma) which correspond to the Early Cretaceous age of the Aptian.
- The opinion expressed previously regarding the participation of the subducted oceanic crust of the Mongolian–Okhotsk basin in the formation of all parent igneous chambers of the Aldan Complex, as well as the geochemical proximity of the rocks of the Mesozoic igneous formations with island arc volcanics, in general, is confirmed by our obtained geochemical data of the rocks of the Medvedev and Taezhniy massifs.
- The defined duality of the geochemical compositions of the igneous rocks of the massifs may be due to the presence of both mantle and crustal sources; however, it is most likely that these rocks resulted from the melting of a mixed mantle source or the latter contaminated by the crust with further the differentiation of melts in intermediate crust chambers.
Author Contributions
Funding
Data Availability Statement
Conflicts of Interest
Appendix A

| Sample | Massif | Phase | SiO2 | TiO2 | Al2O3 | Fe2O3 | FeO | MnO | MgO | CaO | Na2O | K2O | H2O- | H2O+ | P2O5 | CO2 | S | F | Total | Na + K | Na/K | al’ | AG | ASI |
|---|---|---|---|---|---|---|---|---|---|---|---|---|---|---|---|---|---|---|---|---|---|---|---|---|
| I19–19/3 | Medvedev | 1 | 61.55 | 0.56 | 15.74 | 3.39 | 2.56 | 0.13 | 2.09 | 4.44 | 4.24 | 4.35 | 0.20 | 0.03 | 0.36 | 0.27 | nd | 0.04 | 99.95 | 8.59 | 0.97 | 1.42 | 0.74 | 0.80 |
| I19–19/4 | 63.61 | 0.53 | 17.00 | 2.01 | 2.28 | 0.13 | 0.83 | 3.32 | 4.38 | 5.20 | 0.36 | 0.15 | 0.18 | 0.49 | nd | 0.03 | 100.50 | 9.58 | 0.84 | 2.57 | 0.75 | 0.90 | ||
| I19–19/6 | 63.69 | 0.48 | 17.40 | 1.83 | 2.37 | 0.12 | 2.36 | 0.43 | 4.62 | 5.98 | 0.40 | 0.45 | 0.17 | 0.11 | 0.01 | 0.04 | 100.46 | 10.60 | 0.77 | 1.66 | 0.81 | 1.17 | ||
| I19–19/7 | 63.68 | 0.53 | 16.63 | 3.03 | 1.87 | 0.09 | 1.02 | 2.45 | 4.59 | 5.12 | 0.58 | 0.32 | 0.18 | 0.27 | nd | 0.10 | 100.46 | 9.71 | 0.90 | 2.32 | 0.79 | 0.95 | ||
| I19–19 2 | 61.41 | 0.24 | 16.30 | 2.25 | 1.68 | 0.08 | 4.08 | 2.51 | 4.52 | 5.32 | 0.40 | 0.69 | 0.17 | 0.86 | nd | 0.03 | 100.54 | 9.84 | 0.85 | 1.15 | 0.81 | 0.92 | ||
| I19–22 | 63.50 | 0.52 | 16.34 | 2.45 | 1.81 | 0.09 | 0.87 | 2.87 | 4.69 | 5.32 | 0.34 | 0.51 | 0.20 | nd | nd | 0.05 | 99.56 | 10.01 | 0.88 | 2.58 | 0.82 | 0.87 | ||
| I19–22/2 | 63.73 | 0.49 | 16.57 | 2.84 | 1.68 | 0.08 | 0.82 | 2.78 | 4.83 | 5.42 | 0.40 | 0.05 | 0.18 | 0.05 | nd | 0.05 | 99.97 | 10.25 | 0.89 | 2.64 | 0.83 | 0.88 | ||
| I19–22/3 | 63.21 | 0.43 | 16.72 | 2.35 | 2.01 | 0.06 | 1.05 | 2.32 | 3.80 | 6.59 | 0.52 | 0.23 | 0.17 | 0.27 | 0.01 | 0.05 | 99.79 | 10.39 | 0.58 | 2.39 | 0.80 | 0.95 | ||
| I19–22/4 | 64.00 | 0.41 | 16.56 | 2.35 | 1.86 | 0.10 | 0.80 | 3.04 | 4.96 | 5.12 | 0.38 | nd | 0.21 | 0.22 | nd | 0.05 | 100.06 | 10.08 | 0.97 | 2.69 | 0.83 | 0.86 | ||
| I19–22/5 | 62.57 | 0.46 | 16.49 | 2.13 | 2.23 | 0.09 | 0.89 | 3.42 | 5.29 | 5.04 | 0.34 | 0.06 | 0.18 | 0.38 | nd | 0.06 | 99.63 | 10.33 | 1.05 | 2.44 | 0.86 | 0.81 | ||
| I19–9 | 2 | 63.06 | 0.51 | 16.41 | 2.27 | 2.62 | 0.13 | 1.10 | 3.59 | 4.38 | 4.42 | 0.48 | 0.88 | 0.33 | 0.53 | 0.02 | 0.08 | 100.81 | 8.80 | 0.99 | 2.06 | 0.73 | 0.89 | |
| M18–6 | 62.8 | 0.55 | 15.74 | 2.41 | 2.60 | 0.13 | 1.56 | 4.06 | 4.64 | 3.95 | 0.28 | 0.40 | 0.33 | 0.14 | nd | 0.06 | 99.65 | 8.59 | 1.17 | 0.37 | 0.75 | 0.86 | ||
| I19–9/3 | 60.17 | 0.53 | 15.28 | 3.32 | 2.06 | 0.11 | 1.42 | 3.47 | 4.25 | 4.13 | 0.22 | 1.69 | 0.39 | 2.65 | 0.01 | 0.08 | 99.78 | 8.38 | 1.03 | 1.42 | 0.71 | 0.89 | ||
| I19–9/5 | 61.20 | 0.62 | 15.27 | 3.65 | 2.73 | 0.12 | 1.86 | 3.34 | 3.77 | 4.45 | 0.58 | 1.28 | 0.45 | 1.03 | nd | 0.10 | 100.45 | 8.22 | 0.85 | 1.46 | 0.79 | 0.77 | ||
| I19–9/6 | 60.15 | 0.59 | 15.20 | 3.49 | 2.77 | 0.14 | 1.68 | 4.26 | 4.43 | 4.36 | 0.56 | 1.18 | 0.44 | 1.45 | nd | 0.08 | 100.78 | 8.79 | 1.02 | 1.40 | 0.83 | 0.74 | ||
| I19–9/7 | 60.11 | 0.61 | 15.35 | 3.66 | 2.69 | 0.15 | 1.92 | 4.48 | 4.49 | 4.91 | 0.24 | 0.27 | 0.53 | 0.40 | nd | 0.10 | 99.91 | 9.40 | 0.91 | 1.44 | 0.82 | 0.72 | ||
| I19–10 | 59.97 | 0.78 | 15.21 | 3.82 | 2.59 | 0.15 | 1.77 | 4.71 | 4.49 | 4.71 | 0.34 | 0.22 | 0.53 | 0.33 | nd | 0.10 | 99.72 | 9.20 | 0.95 | 1.68 | 0.79 | 0.76 | ||
| I19–11 | 60.28 | 0.66 | 15.68 | 4.06 | 2.36 | 0.16 | 1.34 | 4.54 | 4.50 | 4.66 | 0.40 | 0.46 | 0.48 | 0.38 | nd | 0.08 | 100.04 | 9.16 | 0.97 | 1.59 | 0.79 | 0.76 | ||
| I19–11/2 | 61.29 | 0.67 | 15.49 | 4.12 | 2.01 | 0.14 | 1.69 | 4.48 | 4.52 | 4.40 | 0.30 | 0.42 | 0.48 | 0.63 | 0.02 | 0.08 | 100.74 | 8.92 | 1.03 | 1.65 | 0.80 | 0.84 | ||
| I19–11/4 | 61.58 | 0.57 | 15.82 | 3.73 | 2.05 | 0.16 | 1.70 | 3.42 | 4.78 | 4.44 | 0.54 | 0.70 | 0.51 | 0.59 | 0.03 | 0.08 | 100.70 | 9.22 | 1.08 | 1.40 | 0.81 | 0.81 | ||
| I19–11/5 | 61.51 | 0.63 | 15.67 | 3.71 | 2.33 | 0.13 | 2.19 | 3.66 | 4.68 | 4.56 | 0.34 | 0.25 | 0.48 | 0.57 | 0.01 | 0.09 | 100.81 | 9.24 | 1.03 | 1.49 | 0.84 | 0.77 | ||
| I19–11/6 | 61.92 | 0.63 | 15.15 | 3.75 | 2.47 | 0.12 | 1.68 | 3.92 | 4.72 | 4.53 | 0.34 | 0.34 | 0.47 | 0.56 | 0.01 | 0.09 | 100.70 | 9.25 | 1.04 | 1.38 | 0.78 | 0.82 | ||
| I19–12 | 61.54 | 0.62 | 15.54 | 3.52 | 2.29 | 0.14 | 2.29 | 3.79 | 4.48 | 4.36 | 0.48 | 0.33 | 0.44 | 0.58 | nd | 0.09 | 100.49 | 8.84 | 1.03 | 1.24 | 0.76 | 0.80 | ||
| I19–21/2 | 60.47 | 0.73 | 15.48 | 3.99 | 2.72 | 0.13 | 2.39 | 4.12 | 4.14 | 4.56 | 0.38 | 0.78 | 0.37 | 0.16 | nd | 0.03 | 100.45 | 8.70 | 0.91 | 1.42 | 0.72 | 0.83 | ||
| I19–21/3 | 60.44 | 0.74 | 15.90 | 4.18 | 2.30 | 0.11 | 2.09 | 4.25 | 4.02 | 4.46 | 0.54 | 0.86 | 0.39 | 0.32 | nd | 0.04 | 100.64 | 8.48 | 0.90 | 1.06 | 0.84 | 0.73 | ||
| I19–21/5 | 58.81 | 0.69 | 14.81 | 3.62 | 3.41 | 0.13 | 2.68 | 4.26 | 4.45 | 4.77 | 0.34 | 0.54 | 0.57 | 0.22 | 0.03 | 0.1 | 99.43 | 9.22 | 0.93 | 1.72 | 0.76 | 0.82 | ||
| I19–7 | 3 | 64.43 | 0.47 | 16.43 | 2.09 | 2.29 | 0.12 | 0.88 | 3.49 | 4.89 | 3.93 | 0.34 | 0.22 | 0.24 | 0.21 | nd | 0.08 | 100.11 | 8.82 | 1.24 | 2.41 | 0.75 | 0.88 | |
| I19–13 | 62.77 | 0.58 | 15.20 | 2.88 | 3.39 | 0.10 | 1.75 | 3.27 | 4.96 | 3.71 | 0.30 | 0.39 | 0.44 | 0.59 | nd | 0.09 | 100.42 | 8.67 | 1.34 | 1.37 | 0.80 | 0.84 | ||
| I19–14 | 63.14 | 0.55 | 16.39 | 2.64 | 2.49 | 0.09 | 1.37 | 3.75 | 4.56 | 4.01 | 0.36 | 0.40 | 0.26 | 0.11 | 0.01 | 0.01 | 100.14 | 8.57 | 1.14 | 1.89 | 0.72 | 0.88 | ||
| I19–15 | 63.56 | 0.45 | 16.68 | 2.65 | 1.96 | 0.10 | 1.22 | 3.55 | 4.61 | 3.99 | 0.26 | 0.55 | 0.24 | 0.17 | nd | 0.02 | 100.01 | 8.60 | 1.16 | 2.21 | 0.71 | 0.91 | ||
| I19–16 | 64.10 | 0.44 | 16.81 | 4.54 | 0.21 | 0.09 | 0.97 | 3.78 | 4.57 | 3.90 | 0.20 | 0.24 | 0.22 | nd | 0.01 | 0.03 | 100.11 | 8.47 | 1.17 | 2.98 | 0.70 | 0.90 | ||
| I19–17 | 62.90 | 0.51 | 16.53 | 2.32 | 2.79 | 0.10 | 1.36 | 3.58 | 4.71 | 3.80 | 0.30 | 0.33 | 0.28 | 0.11 | nd | 0.03 | 99.65 | 8.51 | 1.24 | 1.86 | 0.72 | 0.90 | ||
| I19–18 | 65.41 | 0.28 | 15.72 | 1.56 | 0.99 | 0.08 | 0.05 | 2.47 | 4.97 | 6.23 | 0.22 | 0.44 | 0.11 | 1.37 | 0.01 | 0.02 | 99.93 | 11.20 | 0.80 | 1.12 | 0.68 | 0.94 | ||
| I19–20 | 62.00 | 0.53 | 16.22 | 2.13 | 3.30 | 0.12 | 3.33 | 3.47 | 4.41 | 3.46 | 0.28 | 0.41 | 0.30 | 0.44 | nd | 0.03 | 100.43 | 7.87 | 1.27 | 1.41 | 0.71 | 0.86 | ||
| I19–20/2 | 62.79 | 0.40 | 16.27 | 1.54 | 3.21 | 0.13 | 2.39 | 4.06 | 4.61 | 3.59 | 0.30 | 0.20 | 0.30 | 0.70 | nd | 0.03 | 100.52 | 8.20 | 1.28 | 1.64 | 0.70 | 0.87 | ||
| I19–20/3 | 63.27 | 0.46 | 16.54 | 1.32 | 3.24 | 0.13 | 1.85 | 4.04 | 4.68 | 3.63 | 0.28 | 0.05 | 0.26 | 0.49 | nd | 0.03 | 100.27 | 8.31 | 1.29 | 2.08 | 0.72 | 0.89 | ||
| I19–20/4 | 63.66 | 0.44 | 16.43 | 2.13 | 2.16 | 0.12 | 1.37 | 3.61 | 4.68 | 3.80 | 0.34 | 0.49 | 0.22 | 0.16 | 0.01 | 0.03 | 99.65 | 8.48 | 1.23 | 1.79 | 0.71 | 0.86 | ||
| I19–20/5 | 63.08 | 0.55 | 16.03 | 2.39 | 2.27 | 0.10 | 1.66 | 3.94 | 4.34 | 3.98 | 0.56 | 0.31 | 0.25 | 0.38 | 0.02 | 0.03 | 99.89 | 8.32 | 1.09 | 2.24 | 0.72 | 0.91 | ||
| I19–21/6 | 62.85 | 0.44 | 16.67 | 2.72 | 1.99 | 0.10 | 1.14 | 3.43 | 4.72 | 3.98 | 0.50 | 0.40 | 0.26 | nd | nd | 0.08 | 99.28 | 8.70 | 1.19 | 2.35 | 0.69 | 0.92 | ||
| I19–21/7 | 63.85 | 0.40 | 16.33 | 2.37 | 1.87 | 0.09 | 1.11 | 3.60 | 4.30 | 3.80 | 0.68 | 0.31 | 0.26 | nd | nd | 0.05 | 99.02 | 8.10 | 1.13 | 2.44 | 0.74 | 0.90 | ||
| I19–21/8 | 64.04 | 0.38 | 16.74 | 2.45 | 1.95 | 0.09 | 1.00 | 3.36 | 4.99 | 3.90 | 0.28 | 0.22 | 0.27 | 0.05 | nd | 0.05 | 99.77 | 8.89 | 1.28 | 1.12 | 0.68 | 0.75 | ||
| I19–24/2 | Taezhniy | 1 | 63.97 | 0.36 | 16.14 | 2.87 | 1.26 | 0.08 | 1.21 | 3.53 | 5.53 | 3.79 | 0.12 | 0.20 | 0.23 | 0.27 | nd | 0.08 | 99.67 | 9.32 | 1.46 | 2.42 | 0.82 | 0.82 |
| I19–24/4 | 63.54 | 0.30 | 16.33 | 2.47 | 1.29 | 0.03 | 1.22 | 3.56 | 5.56 | 4.72 | 0.32 | nd | 0.24 | 0.17 | nd | 0.05 | 99.8 | 10.28 | 1.18 | 2.51 | 0.87 | 0.79 | ||
| I19–26 | 63.92 | 0.42 | 15.93 | 2.62 | 1.37 | 0.07 | 1.15 | 2.8 | 6.15 | 4.79 | 0.14 | 0.03 | 0.24 | 0.27 | 0.01 | 0.05 | 99.96 | 10.94 | 1.28 | 2.44 | 0.96 | 0.78 | ||
| I19–26/2 | 63.29 | 0.34 | 16.13 | 2.64 | 1.29 | 0.08 | 1.23 | 3.62 | 5.65 | 4.61 | 0.22 | 0.22 | 0.24 | 0.27 | nd | 0.08 | 99.91 | 10.26 | 1.23 | 2.43 | 0.89 | 0.77 | ||
| I19–26/3 | 62.17 | 0.48 | 13.88 | 1.85 | 2.67 | 0.05 | 2.46 | 3.51 | 4.18 | 7.29 | 0.16 | 0.04 | 0.44 | 0.16 | nd | 0.08 | 99.42 | 11.47 | 0.57 | 1.24 | 1.06 | 0.66 | ||
| I19–26/4 | 66.00 | 0.31 | 15.74 | 2.03 | 0.99 | 0.06 | 0.97 | 2.29 | 4.71 | 5.75 | 0.26 | nd | 0.19 | 0.28 | nd | 0.05 | 99.64 | 10.46 | 0.82 | 3.06 | 0.89 | 0.87 | ||
| I19–26/5 | 59.71 | 0.57 | 14.03 | 3.23 | 2.15 | 0.09 | 2.86 | 4.75 | 3.93 | 7.12 | 0.24 | nd | 0.50 | 0.44 | 0.02 | 0.12 | 99.76 | 11.05 | 0.55 | 1.14 | 1.01 | 0.62 | ||
| I19–29 | 62.28 | 0.52 | 15.03 | 3.19 | 1.65 | 0.11 | 1.06 | 2.91 | 5.61 | 7.22 | 0.26 | 0.04 | 0.24 | 0.34 | 0.03 | 0.09 | 100.58 | 12.83 | 0.78 | 2.13 | 1.13 | 0.67 | ||
| I19–29/2 | 61.24 | 0.53 | 16.00 | 3.50 | 2.11 | 0.11 | 1.18 | 3.68 | 5.10 | 5.37 | 0.46 | 0.28 | 0.28 | 0.55 | 0.01 | 0.01 | 100.41 | 10.47 | 0.95 | 1.95 | 0.89 | 0.77 | ||
| I19–29/4 | 65.06 | 0.20 | 16.47 | 1.68 | 1.00 | 0.06 | 0.61 | 1.74 | 5.49 | 6.19 | 0.10 | 0.27 | 0.09 | 0.52 | 0.01 | 0.03 | 99.52 | 11.68 | 0.89 | 4.09 | 0.95 | 0.87 | ||
| I19–29/5 | 66.78 | 0.22 | 16.25 | 1.39 | 1.15 | 0.05 | 0.56 | 1.17 | 5.20 | nd | 0.30 | 0.21 | 0.06 | 0.25 | 0.01 | 0.01 | 99.73 | 11.32 | 0.85 | 4.13 | 0.93 | 0.94 | ||
| I19–30/2 | 64.42 | 0.44 | 16.38 | 2.69 | 1.43 | 0.06 | 0.79 | 2.83 | 4.95 | 4.59 | 0.32 | 0.26 | 0.20 | 0.25 | nd | 0.01 | 99.62 | 9.54 | 1.08 | 2.85 | 0.80 | 0.90 | ||
| I19–30/3 | 65.14 | 0.45 | 15.92 | 2.53 | 1.37 | 0.06 | 0.84 | 2.91 | 4.82 | 4.63 | 0.18 | 0.21 | 0.21 | 0.33 | nd | 0.04 | 99.64 | 9.45 | 1.04 | 2.8 | 0.81 | 0.87 | ||
| I19–30/4 | 64.90 | 0.41 | 15.37 | 2.90 | 1.66 | 0.06 | 1.14 | 2.63 | 4.76 | 5.04 | 0.30 | 0.28 | 0.31 | 0.4 | 0.01 | 0.06 | 100.23 | 9.80 | 0.94 | 2.17 | 0.86 | 0.85 | ||
| I19–30/5 | 61.91 | 0.47 | 15.96 | 2.18 | 3.75 | 0.09 | 1.02 | 3.50 | 4.80 | 4.43 | 0.30 | 0.05 | 0.26 | 0.58 | 0.02 | 0.07 | 99.39 | 9.23 | 1.08 | 1.72 | 0.79 | 0.84 | ||
| I19–27/2 | 2 | 67.48 | 0.19 | 15.97 | 1.68 | 1.00 | 0.05 | 0.75 | 1.85 | 5.09 | 4.91 | 0.26 | 0.14 | 0.13 | 0.49 | 0.02 | 0.05 | 100.06 | 10.00 | 1.04 | 3.64 | 0.86 | 0.94 | |
| I19–27/4 | 67.69 | 0.14 | 16.06 | 1.75 | 0.70 | 0.04 | 0.80 | 0.66 | 5.61 | 5.06 | 0.28 | 0.13 | 0.13 | 0.55 | nd | 0.04 | 99.68 | 10.67 | 1.11 | 3.89 | 1.00 | 1.01 | ||
| I19–27/5 | 66.43 | 0.22 | 15.85 | 2.67 | 0.17 | 0.08 | 0.33 | 1.74 | 5.94 | 5.90 | 0.08 | 0.42 | 0.12 | 0.14 | 0.02 | 0.01 | 100.12 | 11.84 | 1.01 | 3.89 | 0.92 | 0.82 | ||
| T19–27/6 | 67.22 | 0.20 | 15.82 | 1.21 | 1.39 | 0.05 | 0.24 | 1.13 | 6.00 | 6.12 | 0.58 | 0.34 | 0.11 | 0.29 | 0.01 | 0.01 | 100.72 | 12.12 | 0.98 | 5.70 | 1.02 | 0.85 | ||
| I19–27/7 | 65.66 | 0.20 | 15.63 | 1.88 | 1.00 | 0.09 | 0.42 | 1.91 | 6.28 | 6.33 | 0.26 | 0.01 | 0.13 | 0.11 | 0.02 | 0.01 | 99.95 | 12.61 | 0.99 | 4.73 | 1.04 | 0.76 | ||
| I19–28 | 64.71 | 0.14 | 16.50 | 1.22 | 1.11 | 0.06 | 0.57 | 1.64 | 6.25 | 6.59 | 0.10 | 0.32 | 0.07 | 0.18 | nd | 0.01 | 99.47 | 12.84 | 0.95 | 4.24 | 1.10 | 0.81 | ||
| I19–28/2 | 66.26 | 0.18 | 16.23 | 1.68 | 0.57 | 0.06 | 0.40 | 0.83 | 5.75 | 7.86 | 0.26 | 0.18 | 0.06 | 0.28 | nd | 0.09 | 100.69 | 13.61 | 0.73 | 4.35 | 1.06 | 0.83 | ||
| I19–28/3 | 62.32 | 0.44 | 15.45 | 2.86 | 1.41 | 0.10 | 0.92 | 2.91 | 5.83 | 7.2 | 0.18 | 0.31 | 0.20 | 0.17 | 0.01 | 0.04 | 100.35 | 13.03 | 0.81 | 5.63 | 1.11 | 0.68 | ||
| I19–28/4 | 66.05 | 0.20 | 15.35 | 1.42 | 1.23 | 0.06 | 0.50 | 1.27 | 5.55 | 8.12 | 0.18 | 0.08 | 0.07 | 0.24 | nd | 0.03 | 100.35 | 13.67 | 0.68 | 2.51 | 1.12 | 0.76 |
| Sample | Massif | Phase | Cu | Sn | Zn | Pb | Ge | Cr | V | Sc | Ba | Sr | Rb | Nb | Zr | B | Ni | Co | K/Rb | Rb/Sr | Ba/Rb |
|---|---|---|---|---|---|---|---|---|---|---|---|---|---|---|---|---|---|---|---|---|---|
| I19–19/3 | Medvedev | 1 | 9.02 | bdl | 100 | 39.2 | bdl | 71.6 | 88 | 8.35 | 1260 | 870 | 102.6 | 11.5 | 200 | 8.8 | 11.2 | 5.3 | 175.98 | 0.12 | 12.28 |
| I19–19/4 | 8.27 | bdl | 61.5 | 48.9 | bdl | 160 | 84.2 | 7.93 | 1780 | 990 | 107.1 | 8.44 | 210 | 7.92 | 11.3 | 5.1 | 201.53 | 0.11 | 16.62 | ||
| I19–19/6 | 81.9 | bdl | 53.2 | 32.2 | bdl | 300 | 89 | 7.83 | 3100 | 770 | 85.5 | 5.22 | 140 | bdl | 23.3 | 4.96 | 290.31 | 0.11 | 36.26 | ||
| I19–19/7 | 21.6 | bdl | 60.8 | 49.4 | bdl | 110 | 99.1 | 9.16 | 2030 | 840 | 104.4 | 8.52 | 170 | 8.28 | 8.64 | 5.62 | 203.56 | 0.12 | 19.44 | ||
| I19–19 12 | 7.54 | bdl | bdl | 40.7 | bdl | 140 | 77.3 | 8.12 | 2000 | 780 | 87.3 | 7.24 | 130 | bdl | 10.5 | 4.51 | 252.94 | 0.11 | 22.91 | ||
| I19–22 | 14.9 | bdl | 73 | 21.2 | bdl | 110 | 94.1 | 10.3 | 1700 | 760 | 89.1 | 9.3 | 110 | bdl | 11.9 | 6.54 | 247.83 | 0.12 | 19.08 | ||
| I19–22/2 | 21.4 | bdl | bdl | 20.8 | bdl | 25.4 | 89.1 | 8.67 | 2000 | 820 | 89.1 | 8.69 | 140 | bdl | 8.31 | 6.35 | 252.49 | 0.11 | 22.45 | ||
| I19–22/3 | 36.7 | bdl | bdl | 20.5 | bdl | 57.8 | 93.2 | 6.33 | 2600 | 1010 | 103.2 | 9 | 157 | 8.83 | 14 | 5.8 | 264.93 | 0.1 | 25.18 | ||
| I19–22/4 | 5.63 | bdl | 67.6 | 27.8 | bdl | 31.5 | 96.6 | 7.8 | 2100 | 860 | 87.3 | 10.4 | 120 | bdl | 8.82 | 4.67 | 243.43 | 0.1 | 24.05 | ||
| I19–22/5 | 6.03 | bdl | −58 | 22.4 | bdl | 29 | 93.3 | 7.27 | 2300 | 1000 | 103 | 9.9 | 171 | bdl | 8.57 | 5.62 | 203.02 | 0.1 | 22.32 | ||
| I19–9 | 2 | 18.6 | bdl | 51 | 31.7 | bdl | 380 | 120 | 16 | 2100 | 920 | 85.5 | 5.32 | 260 | 8.11 | 27.6 | 12.5 | 214.58 | 0.09 | 24.56 | |
| I19–9/3 | bdl | bdl | 77.6 | 13.8 | bdl | 40 | 93.2 | 13.3 | 1500 | 590 | 79.2 | 10.6 | 200 | 10.9 | 18 | 12.2 | 216.45 | 0.13 | 18.94 | ||
| I19–9/5 | 8.09 | bdl | 56.3 | 15.4 | bdl | 320 | 120 | 17.4 | 1500 | 940 | 89.1 | 4.73 | 270 | bdl | 29.3 | 11.7 | 207.3 | 0.09 | 16.84 | ||
| I19–9/6 | 30.3 | bdl | 70.9 | 31.3 | bdl | 260 | 97.7 | 15.4 | 1000 | 750 | 81.9 | 7.84 | 210 | 8.89 | 34.7 | 13.3 | 220.97 | 0.11 | 12.21 | ||
| I19–9/7 | 16.5 | bdl | 77.7 | 32.8 | bdl | 69.3 | 130 | 18.5 | 2800 | 1000 | 94.5 | 7.97 | 180 | 6.16 | 26 | 18.1 | 215.66 | 0.09 | 29.63 | ||
| I19–10 | 25.5 | bdl | 66.5 | 27.3 | bdl | 50.3 | 120 | 18.1 | 2200 | 1000 | 93.6 | 4.12 | 190 | 8.99 | 22.6 | 16.2 | 208.87 | 0.09 | 23.5 | ||
| I19–11 | 27.9 | bdl | 95.3 | 54.8 | bdl | 200 | 140 | 16.7 | 2100 | 900 | 93.6 | 4.96 | 200 | 8.41 | 26.8 | 16.6 | 206.65 | 0.1 | 22.44 | ||
| I19–11/2 | 25.7 | bdl | 67.6 | 22.8 | bdl | 110 | 130 | 18.2 | 1600 | 950 | 83.7 | 8.28 | 210 | bdl | 26.8 | 17.4 | 218.2 | 0.09 | 19.12 | ||
| I19–11/4 | 15.5 | bdl | 68.3 | 20.2 | bdl | 44.9 | 110 | 15.8 | 1500 | 770 | 86.4 | 7.94 | 210 | bdl | 22.3 | 12.9 | 213.3 | 0.11 | 17.36 | ||
| I19–11/5 | 82 | bdl | 99 | 25.5 | bdl | 152 | 120 | 16.5 | 2300 | 1000 | 85.5 | 9.52 | 180 | bdl | 24.1 | 15.5 | 221.37 | 0.09 | 26.9 | ||
| I19–11/6 | 100 | bdl | 81.9 | 28.3 | bdl | 103 | 120 | 16.8 | 1600 | 870 | 81.9 | 3.66 | 140 | bdl | 20 | 14 | 229.58 | 0.09 | 19.54 | ||
| I19–12 | 30.4 | bdl | 110 | 27.1 | bdl | 132 | 110 | 15.3 | 1700 | 820 | 82.8 | 3.94 | 170 | 10.1 | 21.5 | 13.8 | 218.57 | 0.1 | 20.53 | ||
| I19–21/2 | 29.1 | bdl | 100 | 29.2 | bdl | 180 | 130 | 17.9 | 1700 | 900 | 101.7 | 8.73 | 170 | bdl | 29.9 | 15.4 | 186.11 | 0.11 | 16.72 | ||
| I19–21/3 | 15.3 | bdl | 88.5 | 27.7 | bdl | 130 | 120 | 17.3 | 1600 | 890 | 108 | 7.57 | 210 | bdl | 23.8 | 14.1 | 171.41 | 0.12 | 14.81 | ||
| I19–21/5 | 65 | bdl | 100 | 33.3 | bdl | 94 | 130 | 20.2 | 2000 | 917 | 113.4 | 6.8 | 220 | bdl | 35 | 20 | 174.65 | 0.12 | 17.64 | ||
| M18–6 | 13.9 | bdl | 68.6 | 26 | bdl | 150 | 85.6 | 9.55 | 2120 | 1100 | 71.5 | 7.87 | 120 | bdl | 11.8 | 9.15 | 229.38 | 0.06 | 29.66 | ||
| I19–7 | 3 | 9.44 | bdl | 68.9 | 30.7 | bdl | 27.6 | 63.8 | 8.39 | 1600 | 1030.2 | 78.9 | 10.1 | 150 | bdl | 9.54 | 7.42 | 206.81 | 0.08 | 20.29 | |
| I19–13 | 24.1 | bdl | 82.5 | 27 | bdl | 43.5 | 68.9 | 10.3 | 1700 | 850 | 61.2 | 7.65 | 150 | 8.54 | 13.6 | 9.07 | 251.62 | 0.07 | 27.78 | ||
| I19–14 | 14.6 | bdl | 66 | 35.4 | bdl | 54.6 | 69.5 | 10.4 | 1700 | 1000 | 91.8 | 10.8 | 190 | bdl | 14 | 8.51 | 181.31 | 0.09 | 18.52 | ||
| I19–15 | 10 | bdl | bdl | 26.1 | bdl | 47.6 | 66.1 | 9.03 | 1900 | 1030 | 82 | 8.6 | 170 | bdl | 11.8 | 6.71 | 201.92 | 0.08 | 23.16 | ||
| I19–16 | 10.3 | bdl | 65.1 | 34.5 | bdl | 32.1 | 72.5 | 8.45 | 1800 | 1000 | 87.3 | 6.68 | 160 | 8.2 | 9.63 | 7.31 | 185.43 | 0.09 | 20.62 | ||
| I19–17 | 17.4 | bdl | 71.5 | 29.6 | bdl | 110 | 73.5 | 9.84 | 2000 | 1000 | 73.8 | 6.39 | 160 | 8.88 | 14 | 7.93 | 213.72 | 0.07 | 27.1 | ||
| I19–20 | 36.4 | bdl | 79.8 | 34 | bdl | 51.1 | 80.6 | 10.5 | 1600 | 780 | 66.6 | 9.35 | 150 | bdl | 12.2 | 10.1 | 215.64 | 0.09 | 24.02 | ||
| I19–20/2 | 23.9 | bdl | 74.6 | 36.4 | bdl | 260 | 72.7 | 11.3 | 2000 | 1060 | 79.5 | 6.15 | 140 | bdl | 13.3 | 8.27 | 187.32 | 0.08 | 25.14 | ||
| I19–20/3 | 19.4 | bdl | 64 | 28.4 | bdl | 61.1 | 66.7 | 9.73 | 1900 | 1000 | 77.4 | 5.32 | 130 | bdl | 11.9 | 8.99 | 194.67 | 0.08 | 24.55 | ||
| I19–20/4 | 10.5 | bdl | 57.8 | 25.7 | bdl | 36.1 | 64.4 | 8.36 | 1600 | 900 | 80.1 | 10.5 | 150 | bdl | 9.64 | 7.35 | 196.91 | 0.09 | 19.98 | ||
| I19–20/5 | 17.8 | bdl | 78.7 | 32.2 | bdl | 36.5 | 65.1 | 7.86 | 1900 | 880 | 91.8 | 8.02 | 120 | bdl | 12.3 | 9.95 | 179.96 | 0.1 | 20.7 | ||
| I19–21/6 | 17.3 | bdl | 61.7 | 35.8 | bdl | 110 | 74.7 | 8.92 | 1600 | 820 | 71.1 | 7.63 | 150 | 66.2 | 11.5 | 8.28 | 232.35 | 0.09 | 22.5 | ||
| I19–21/7 | 41.9 | bdl | 82.2 | 26.8 | bdl | 27.6 | 66.9 | 8.92 | 1500 | 940 | 67.5 | 8.78 | 190 | 9.49 | 7.99 | 7.35 | 233.67 | 0.07 | 22.22 | ||
| I19–21/8 | 19.7 | bdl | bdl | 23.9 | bdl | 33.8 | 65.9 | 8.55 | 1500 | 960 | 69.3 | 8.75 | 160 | bdl | 10.6 | 6.74 | 233.59 | 0.07 | 21.65 | ||
| I19–24/2 | Taezhniy | 1 | 20 | bdl | bdl | 16 | bdl | 180 | 85 | 7.7 | 2000 | 860 | 66 | 8.9 | 98 | bdl | 17 | 8.2 | 476.7 | 0.08 | 30.3 |
| I19–24/4 | 11 | bdl | bdl | 16 | bdl | 48 | 85 | 7.8 | 2100 | 1000 | 70 | 6.5 | 120 | bdl | 14 | 7.2 | 559.74 | 0.07 | 30 | ||
| I19–26 | 7.5 | bdl | bdl | 15 | bdl | 37 | 79 | 9.2 | 2500 | 940 | 82.8 | 9.1 | 130 | bdl | 11 | 6.9 | 480.23 | 0.09 | 30.19 | ||
| I19–26/2 | 7.4 | bdl | bdl | 15 | bdl | 140 | 75 | 7.6 | 2500 | 910 | 76.5 | 11 | 95 | bdl | 16 | 6.9 | 500.25 | 0.08 | 32.68 | ||
| I19–26/3 | 20 | bdl | bdl | 10 | 2.4 | 160 | 120 | 16 | 1200 | 330 | 223.2 | 6.2 | 120 | bdl | 35 | 9.1 | 271.13 | 0.68 | 5.38 | ||
| I19–26/4 | bdl | bdl | bdl | 30 | bdl | 92 | 66 | 5.8 | 2000 | 790 | 93.6 | 8.8 | 120 | bdl | 12 | 4.5 | 509.96 | 0.12 | 21.37 | ||
| I19–26/5 | 8 | bdl | bdl | 13 | bdl | 220 | 170 | 18 | 1900 | 640 | 139.5 | 6.9 | 150 | bdl | 34 | 15 | 423.69 | 0.22 | 13.62 | ||
| I19–29 | 5.6 | bdl | bdl | 19 | bdl | 220 | 150 | 12 | 1800 | 670 | 117 | 6.3 | 150 | bdl | 17 | 8.4 | 512.27 | 0.17 | 15.38 | ||
| I19–29/2 | 17 | bdl | bdl | 20 | bdl | 87 | 110 | 13 | 2300 | 950 | 82.8 | 6.7 | 160 | bdl | 18 | 10 | 538.38 | 0.09 | 27.78 | ||
| I19–29/4 | 8.1 | bdl | bdl | 29 | bdl | 45 | 71 | 4.9 | 2300 | 720 | 108 | 6.1 | 81 | bdl | 11 | 5.2 | 475.79 | 0.15 | 21.3 | ||
| I19–29/5 | 6.1 | bdl | bdl | 38 | bdl | 190 | 58 | 3.3 | 2700 | 640 | 117 | 11 | 91 | bdl | 16 | 3.7 | 434.22 | 0.18 | 23.08 | ||
| I19–30/2 | 16 | bdl | bdl | 22 | bdl | 28 | 76 | 8.2 | 2200 | 910 | 72 | 11 | 130 | bdl | 12 | 6.7 | 529.21 | 0.08 | 30.56 | ||
| I19–30/3 | 38 | bdl | bdl | 17 | bdl | 37 | 75 | 8.7 | 2300 | 900 | 94 | 7.5 | 120 | bdl | 12 | 7 | 408.88 | 0.1 | 24.47 | ||
| I19–30/4 | 32 | bdl | bdl | 21 | bdl | 230 | 100 | 12 | 2200 | 980 | 83.7 | 6.4 | 130 | bdl | 19 | 8.7 | 499.86 | 0.09 | 26.28 | ||
| I19–30/5 | 28 | bdl | bdl | 19 | bdl | 140 | 90 | 12 | 2200 | 1100 | 73.8 | 10 | 160 | bdl | 32 | 9 | 498.3 | 0.07 | 29.81 | ||
| I19–27/2 | 2 | 5.1 | bdl | bdl | 31 | bdl | 190 | 42 | 4.6 | 1600 | 770 | 108 | 8.7 | 88 | bdl | 9.4 | 3.4 | 377.4 | 0.14 | 14.81 | |
| I19–27/7 | 10 | bdl | bdl | 17 | bdl | 48 | 65 | 4.4 | 1900 | 710 | 107 | 8.4 | 110 | bdl | 10 | 4.4 | 488.85 | 0.15 | 17.68 | ||
| I19–27/3 | 5.5 | bdl | bdl | 18 | bdl | 27 | 37 | 2.6 | 450 | 230 | 90 | 11 | 190 | bdl | 7 | bdl | 473.17 | 0.39 | 5 | ||
| I19–27/4 | bdl | bdl | bdl | 25 | bdl | 130 | 47 | 4.9 | 1800 | 790 | 117 | 7.4 | 110 | bdl | 7.6 | bdl | 359.01 | 0.15 | 15.38 | ||
| I19–27/5 | 5 | bdl | bdl | 30 | bdl | 230 | 45 | 4.4 | 1800 | 730 | 123 | 7.1 | 110 | bdl | 11 | 3.2 | 399.73 | 0.17 | 14.69 | ||
| I19–27/6 | 5.8 | bdl | bdl | 31 | bdl | 280 | 44 | −3.3 | 1700 | 610 | 125 | 9 | 100 | bdl | 11 | bdl | 407.24 | 0.2 | 13.63 | ||
| I19–28 | 7.7 | bdl | bdl | 28 | bdl | 48 | 66 | 4.4 | 3000 | 1000 | 126 | 12 | 81 | bdl | 13 | 4.7 | 434.17 | 0.13 | 23.81 | ||
| I19–28/2 | bdl | bdl | bdl | 30 | bdl | 47 | 68 | 4.1 | 2200 | 770 | 117 | 7 | 80 | bdl | 8.5 | bdl | 557.68 | 0.15 | 18.8 | ||
| I19–28/3 | 7.9 | bdl | bdl | 24 | bdl | 44 | 130 | 9 | 2300 | 780 | 117 | 5.9 | 120 | bdl | 14 | 7.8 | 510.85 | 0.15 | 19.66 | ||
| I19–28/4 | 14 | bdl | bdl | 19 | bdl | 67 | 73 | 3.6 | 1700 | 570 | 91.8 | 8 | 100 | bdl | 13 | 3.7 | 734.28 | 0.16 | 18.52 |
| Sample | I19–22/3 | I19–22/5 | M18–9 | M18–6 | I19–21/5 | I-19–7 | I19–20/2 | M18–7 | I19–15 | I19–24/2 | I19–24/4 | I19–30/3 | I19–27/5 | I19–27/6 | I19–27/7 |
|---|---|---|---|---|---|---|---|---|---|---|---|---|---|---|---|
| Massif | Medvedev | Taezhniy | |||||||||||||
| Phase | 1 | 2 | 3 | 1 | 2 | ||||||||||
| Rb | 103 | 103 | 100 | 71 | 113 | 79 | 80 | 106 | 82 | 66 | 70 | 94 | 123 | 125 | 107 |
| Sr | 1010 | 1000 | 841 | 1100 | 917 | 1030 | 1060 | 1100 | 1030 | 1110 | 1150 | 1080 | 894 | 759 | 828 |
| Y | 22 | 23 | 24 | 18.7 | 22 | 17.2 | 18.7 | 22 | 18.5 | 16.2 | 17 | 22 | 9.3 | 8.3 | 10.5 |
| Zr | 157 | 171 | 175 | 138 | 169 | 157 | 130 | 166 | 155 | 130 | 142 | 164 | 119 | 125 | 124 |
| Nb | 9 | 9.9 | 10.1 | 7.3 | 8.1 | 7.4 | 7.1 | 7.8 | 7.3 | 7 | 7 | 8.9 | 6.5 | 6.3 | 6.2 |
| Cs | 2.7 | 4 | 1.99 | 4 | 3.3 | 3.8 | 2.7 | 6.8 | 5.3 | 0.85 | 0.4 | 0.88 | 1.25 | 0.96 | 0.89 |
| Ba | 3130 | 1970 | 2150 | 1880 | 2050 | 1860 | 1810 | 2060 | 1980 | 1910 | 2060 | 2220 | 1830 | 1660 | 1590 |
| La | 33 | 40 | 39 | 24 | 35 | 22 | 24 | 32 | 25 | 22 | 23 | 33 | 12.7 | 13.4 | 14.6 |
| Ce | 64 | 74 | 71 | 49 | 68 | 46 | 47 | 65 | 52 | 43 | 45 | 64 | 24 | 23 | 28 |
| Pr | 7.5 | 8.7 | 8.9 | 6.1 | 8.4 | 5.7 | 6.1 | 8 | 6.2 | 5.3 | 5.7 | 7.9 | 2.9 | 2.9 | 3.3 |
| Nd | 28 | 34 | 33 | 26 | 33 | 23 | 25 | 32 | 25 | 21 | 22 | 30 | 11.5 | 10.8 | 12.9 |
| Sm | 5.6 | 6.3 | 6.4 | 5.3 | 6.8 | 4.4 | 5.1 | 6.3 | 4.8 | 4.3 | 4.5 | 5.6 | 2.4 | 2.3 | 2.5 |
| Eu | 1.52 | 1.73 | 1.78 | 1.43 | 1.9 | 1.29 | 1.37 | 1.68 | 1.32 | 1.11 | 1.19 | 1.61 | 0.66 | 0.57 | 0.73 |
| Gd | 4.8 | 5.4 | 5.7 | 4.3 | 5.5 | 3.9 | 4.2 | 5.3 | 4.3 | 3.3 | 3.7 | 5.2 | 2.1 | 1.79 | 2.2 |
| Tb | 0.68 | 0.71 | 0.75 | 0.59 | 0.76 | 0.53 | 0.57 | 0.7 | 0.6 | 0.45 | 0.52 | 0.65 | 0.27 | 0.24 | 0.3 |
| Dy | 3.7 | 4.1 | 4.2 | 3.3 | 3.9 | 2.9 | 3.3 | 3.7 | 3.2 | 2.7 | 2.7 | 3.7 | 1.44 | 1.23 | 1.68 |
| Ho | 0.74 | 0.78 | 0.84 | 0.68 | 0.81 | 0.6 | 0.65 | 0.77 | 0.65 | 0.52 | 0.58 | 0.7 | 0.29 | 0.26 | 0.33 |
| Er | 2 | 2.2 | 2.4 | 1.9 | 2.2 | 1.64 | 1.84 | 2.1 | 1.85 | 1.53 | 1.61 | 2.1 | 0.89 | 0.78 | 0.98 |
| Tm | 0.33 | 0.33 | 0.34 | 0.27 | 0.33 | 0.24 | 0.27 | 0.3 | 0.27 | 0.23 | 0.24 | 0.3 | 0.14 | 0.12 | 0.15 |
| Yb | 2 | 2.2 | 2.2 | 1.74 | 2 | 1.57 | 1.74 | 1.88 | 1.7 | 1.5 | 1.58 | 1.92 | 0.94 | 0.78 | 1 |
| Lu | 0.32 | 0.32 | 0.32 | 0.26 | 0.31 | 0.24 | 0.26 | 0.28 | 0.26 | 0.23 | 0.23 | 0.28 | 0.14 | 0.12 | 0.15 |
| Hf | 4 | 4.1 | 4.3 | 3.6 | 4.2 | 3.9 | 3.3 | 4.1 | 3.8 | 3.3 | 3.4 | 4 | 3.3 | 3.3 | 3.5 |
| Ta | 0.4 | 0.43 | 0.46 | 0.34 | 0.43 | 0.37 | 0.34 | 0.39 | 0.37 | 0.34 | 0.34 | 0.4 | 0.28 | 0.27 | 0.28 |
| Th | 10.3 | 12.4 | 12 | 7.1 | 9.7 | 7.4 | 6.8 | 8.7 | 7.7 | 5.5 | 6.2 | 8.9 | 7.1 | 5.5 | 8.6 |
| U | 3.2 | 3.2 | 3.1 | 1.65 | 1.64 | 1.67 | 1.84 | 2.3 | 1.78 | 2.2 | 2.8 | 3.3 | 1.65 | 1.5 | 1.84 |
| La/Yb | 16.01 | 18 | 17.84 | 13.86 | 17.08 | 14.17 | 13.97 | 17.1 | 14.98 | 14.42 | 14.84 | 16.93 | 13.5 | 17.14 | 14.58 |
| Ce/Yb | 31.57 | 33.44 | 32.07 | 28.39 | 33.74 | 28.97 | 27.16 | 34.61 | 30.32 | 28.9 | 28.71 | 33.21 | 25.83 | 29.67 | 28.48 |
| Rb/Sr | 0.10 | 0.10 | 0.12 | 0.06 | 0.12 | 0.08 | 0.08 | 0.10 | 0.08 | 0.06 | 0.06 | 0.09 | 0.14 | 0.16 | 0.13 |
| Nb/La | 0.27 | 0.25 | 0.26 | 0.3 | 0.23 | 0.33 | 0.29 | 0.24 | 0.29 | 0.32 | 0.3 | 0.27 | 0.51 | 0.47 | 0.42 |
| Th/U | 3.2 | 3.83 | 3.93 | 4.31 | 5.89 | 4.43 | 3.69 | 3.73 | 4.34 | 2.46 | 2.19 | 2.66 | 4.29 | 3.66 | 4.69 |
| Y/Nb | 2.41 | 2.33 | 2.43 | 2.54 | 2.77 | 2.32 | 2.64 | 2.78 | 2.52 | 2.31 | 2.43 | 2.43 | 1.43 | 1.33 | 1.7 |
| Eu/Eu* | 0.9 | 0.91 | 0.9 | 0.92 | 0.95 | 0.95 | 0.9 | 0.88 | 0.89 | 0.9 | 0.88 | 0.91 | 0.89 | 0.85 | 0.95 |
| ∑REE | 154.19 | 180.77 | 176.83 | 124.87 | 168.91 | 114.01 | 121.4 | 160.01 | 127.15 | 123.65 | 130.25 | 177.95 | 69.97 | 66.89 | 79.69 |
| Spot Name | Massif | % comm 206 | ppm U | Ppm Th | 232Th/238U | ppm Rad 206Pb | 204corr 206Pb/238U Age | 1s err | % Discordant | Total238/206 | % err | Total207/206 | % err | 238/206r | % err | 207r/206r | % err | 207r/235 | % err | 206r/238 | % err | err corr |
|---|---|---|---|---|---|---|---|---|---|---|---|---|---|---|---|---|---|---|---|---|---|---|
| I19–22 2.1 | Medv. | 0.06 | 919 | 147 | 0.17 | 14.3 | 115.6 | 1.8 | 62 | 55.25 | 1.6 | 0.0503 | 1.4 | 55.29 | 1.6 | 0.050 | 1.6 | 0.12 | 2.2 | 0.018 | 1.6 | 0.704 |
| I19–22 2.2 | 0.00 | 1052 | 148 | 0.15 | 17.2 | 121.2 | 1.9 | −22 | 52.68 | 1.6 | 0.0479 | 1.3 | 52.68 | 1.6 | 0.048 | 1.3 | 0.13 | 2.1 | 0.019 | 1.6 | 0.765 | |
| I19–22 8.1 | 0.13 | 665 | 114 | 0.18 | 11.0 | 123.1 | 2.0 | −39 | 51.80 | 1.6 | 0.0486 | 1.7 | 51.87 | 1.6 | 0.048 | 2.1 | 0.13 | 2.6 | 0.019 | 1.6 | 0.614 | |
| I19–22 9.2 | 0.21 | 437 | 175 | 0.41 | 7.1 | 120.3 | 2.0 | −32 | 53.00 | 1.7 | 0.0493 | 2.1 | 53.11 | 1.7 | 0.048 | 2.8 | 0.12 | 3.2 | 0.019 | 1.7 | 0.519 | |
| I19–22 10.1 | 7.71 | 298 | 96 | 0.33 | 5.6 | 129.9 | 2.5 | 310 | 45.34 | 1.7 | 0.1181 | 1.8 | 49.13 | 1.9 | 0.058 | 13.6 | 0.16 | 13.8 | 0.020 | 1.9 | 0.142 | |
| I19–22 11.1 | nd | 170 | 65 | 0.40 | 2.9 | 127.2 | 2.2 | 38 | 50.16 | 1.8 | 0.0496 | 3.3 | 50.16 | 1.8 | 0.050 | 3.3 | 0.14 | 3.7 | 0.020 | 1.8 | 0.476 | |
| I19–15 2.1 | Medv. | 0.06 | 698 | 7 | 0.01 | 11.3 | 120.2 | 1.9 | −1 | 53.10 | 1.6 | 0.0489 | 1.7 | 53.14 | 1.6 | 0.048 | 1.8 | 1.13 | 2.4 | 0.019 | 1.6 | 0.672 |
| I19–15 3.1 | 0.16 | 447 | 4 | 0.01 | 6.9 | 114.2 | 1.9 | nd | 55.87 | 1.6 | 0.0495 | 2.1 | 55.96 | 1.6 | 0.048 | 2.6 | 0.12 | 3.1 | 0.018 | 1.6 | 0.527 | |
| I19–15 4.1 | 0.08 | 542 | 6 | 0.01 | 8.9 | 121.3 | 2.1 | 26 | 52.60 | 1.7 | 0.0498 | 1.9 | 52.64 | 1.7 | 0.049 | 2.1 | 0.13 | 2.7 | 0.019 | 1.7 | 0.640 | |
| I19–15 5.1 | nd | 1020 | 20 | 0.02 | 16.5 | 120.3 | 1.9 | −31 | 53.07 | 1.6 | 0.0477 | 1.4 | 53.07 | 1.6 | 0.048 | 1.4 | 0.12 | 2.1 | 0.019 | 1.6 | 0.750 | |
| I19–15 6.1 | 0.13 | 1237 | 20 | 0.02 | 20.0 | 119.8 | 1.9 | 28 | 53.22 | 1.6 | 0.0501 | 1.2 | 53.29 | 1.6 | 0.049 | 1.5 | 0.13 | 2.2 | 0.019 | 1.6 | 0.723 | |
| I19–15 8.1 | 0.07 | 478 | 4 | 0.01 | 7.3 | 113.5 | 1.9 | 3 | 56.25 | 1.7 | 0.0489 | 2.1 | 56.29 | 1.7 | 0.048 | 2.2 | 0.12 | 2.8 | 0.018 | 1.7 | 0.599 | |
| I19–24 3.1 | Taezh. | nd | 647 | 38 | 0.06 | 10.3 | 118.4 | 1.9 | 38 | 53.95 | 1.6 | 0.0493 | 1.8 | 53.95 | 1.6 | 0.049 | 1.8 | 0.13 | 2.4 | 0.019 | 1.6 | 0.667 |
| I19–24 4.1 | 0.05 | 948 | 345 | 0.38 | 15.0 | 117.7 | 1.9 | −27 | 54.23 | 1.6 | 0.0481 | 1.5 | 54.26 | 1.6 | 0.048 | 1.6 | 0.12 | 2.3 | 0.018 | 1.6 | 0.703 | |
| I19–24 5.1 | 0.16 | 304 | 122 | 0.41 | 4.8 | 118.2 | 2.0 | −22 | 53.96 | 1.7 | 0.0491 | 2.6 | 54.05 | 1.7 | 0.048 | 3.2 | 0.12 | 3.6 | 0.019 | 1.7 | 0.471 | |
| I19–24 6.1 | nd | 898 | 344 | 0.40 | 14.3 | 118.5 | 1.9 | 36 | 53.91 | 1.6 | 0.0493 | 1.5 | 53.91 | 1.6 | 0.049 | 1.5 | 0.13 | 2.2 | 0.019 | 1.6 | 0.726 | |
| I19–24 8.1 | 0.08 | 1481 | 101 | 0.07 | 23.0 | 115.6 | 1.8 | −11 | 55.22 | 1.6 | 0.0487 | 1.2 | 55.26 | .16 | 0.048 | 1.4 | 0.12 | 2.1 | 0.018 | 1.6 | 0.740 | |
| I19–24 9.1 | 0.06 | 674 | 117 | 0.18 | 10.6 | 116.8 | 1.9 | 50 | 54.67 | 1.6 | 0.0500 | 1.8 | 54.71 | 1.6 | 0.050 | 1.9 | 0.12 | 2.5 | 0.018 | 1.6 | 0.652 | |
| I19–27–7 3.2 | Taezh. | 1.85 | 1678 | 547 | 0.34 | 25.7 | 114.2 | 2.0 | −9 | 55.97 | 1.7 | 0.0481 | 1.5 | 55.97 | 1.7 | 0.048 | 1.5 | 0.12 | 2.3 | 0.018 | 1.7 | 0.750 |
| I19–27–7 4.1 | 0.04 | 1289 | 226 | 0.18 | 20.4 | 117.9 | 2.1 | 24 | 54.17 | 1.8 | 0.0493 | 1.7 | 54.19 | 1.8 | 0.049 | 1.7 | 0.12 | 2.5 | 0.018 | 1.8 | 0.716 | |
| I19–27–7 7.1 | 0.13 | 1926 | 563 | 0.30 | 30.9 | 119.0 | 2.1 | −6 | 53.61 | 1.7 | 0.0493 | 1.3 | 53.68 | 1.8 | 0.048 | 1.6 | 0.12 | 2.4 | 0.019 | 1.8 | 0.729 | |
| I19–27–7 1.1 | 0.08 | 486 | 2 | 0.01 | 7.9 | 121.0 | 2.2 | 20 | 52.72 | 1.8 | 0.0496 | 2.2 | 52.76 | 1.8 | 0.049 | 2.4 | 0.13 | 3.0 | 0.019 | 1.8 | 0.609 | |
| I19–27–7 1.2 | 1.85 | 533 | 14 | 0.03 | 8.8 | 122.9 | 2.2 | 5 | 51.95 | 1.8 | 0.0486 | 2.2 | 51.95 | 1.8 | 0.049 | 2.2 | 0.13 | 2.8 | 0.019 | 1.8 | 0.633 | |
| I19–27–7 6.1 | 0.10 | 491 | 27 | 0.06 | 8.3 | 126.1 | 2.3 | 8 | 50.56 | 1.8 | 0.0496 | 2.4 | 50.61 | 1.8 | 0.049 | 2.6 | 0.13 | 3.2 | 0.020 | 1.8 | 0.570 | |
| I19–27–7 2.1 | 0.49 | 1462 | 406 | 0.29 | 25.1 | 127.2 | 2.2 | 8 | 49.93 | 1.8 | 0.0527 | 1.4 | 50.18 | 1.8 | 0.049 | 2.4 | 0.13 | 3.0 | 0.020 | 1.8 | 0.590 |
| Sample | Massif | Rock | m, gr | Rb, ppm | Sr, ppm | 87Rb/86Sr | 2σ, % | 87Sr/86Sr | 2σ, % | 2σ, abs. |
|---|---|---|---|---|---|---|---|---|---|---|
| I19–22/5 | Medvedev | Syenite-porphyry | 0.10023 | 100 | 974 | 0.29718 | 0.2 | 0.708031 | 0.002 | 0.000011 |
| I19–21/5 | Pyroxene-amphibole syenite | 0.10384 | 113 | 933 | 0.34970 | 0.2 | 0.707812 | 0.001 | 0.000007 | |
| I19–15 | Quartz monzonite | 0.10113 | 79.4 | 1338 | 0.17170 | 0.2 | 0.706221 | 0.001 | 0.000006 | |
| I19–24/2 | Taezhniy | Quartz monzonite | 0.10628 | 65.2 | 1129 | 0.16710 | 0.2 | 0.706457 | 0.001 | 0.000008 |
| I19–27/7 | Syenite | 0.10624 | 103 | 851 | 0.34893 | 0.2 | 0.707184 | 0.001 | 0.000005 |
References
- Bilibin, U.A. Post-Jurassic Intrusions of the Aldan Region. In Petrography of USSR; AN USSR: Moscow, Russia, 1941; p. 119. (In Russian) [Google Scholar]
- Bilibin, U.A. Mesozoic Igneous Rocks. In Geology of USSR; Nedra: Moscow, Russia, 1972; pp. 330–391. (In Russian) [Google Scholar]
- Müller, D.; Groves, D.I. Direct and Indirect Associations between Potassic Igneous Rocks, Shoshonites and Gold-Copper Deposits. Ore Geol. Rev. 1993, 8, 383–406. [Google Scholar] [CrossRef]
- Sillitoe, R.H. Characteristics and Controls of the Largest Porphyry Copper-gold and Epithermal Gold Deposits in the Circum—Pacific Region. Aust. J. Earth Sci. 1997, 44, 373–388. [Google Scholar] [CrossRef]
- Müller, D. Gold-Copper Mineralization in Alkaline Rocks. Miner. Depos. 2002, 37, 1–3. [Google Scholar] [CrossRef]
- Sillitoe, R. Some Metallogenic Features of Gold and Copper Deposits Related to Alkaline Rocks and Consequences for Exploration. Miner. Depos. 2002, 37, 4–13. [Google Scholar] [CrossRef]
- Bissig, T.; Cooke, D.R. Introduction to the Special Issue Devoted to Alkalic Porphyry Cu-Au and Epithermal Au Deposits. Econ. Geol. 2014, 109, 819–825. [Google Scholar] [CrossRef]
- Soloviev, S.G. Metallogeny of Shoshonite Magmatism. v.1,2.; Science World: Moscow, Russia, 2014. [Google Scholar]
- Müller, D.; Groves, D.I. Mineral Resource Reviews. In Potassic Igneous Rocks and Associated Gold-Copper Mineralization; Springer International Publishing: Cham, Switzerland, 2019; ISBN 978-3-319-92978-1. [Google Scholar]
- Wolfe, R.C.; Cooke, D.R. Geology of the Didipio Region and Genesis of the Dinkidi Alkalic Porphyry Cu-Au Deposit and Related Pegmatites, Northern Luzon, Philippines. Econ. Geol. 2011, 106, 1279–1315. [Google Scholar] [CrossRef]
- Zhang, Y.; Qiu, E.; Dong, S.; Li, J.; Shi, W. Late Mesozoic Intracontinental Deformation and Magmatism in North and NE China in Response to Multi-Plate Convergence in NE Asia: An Overview and New View. Tectonophysics 2022, 835, 229377. [Google Scholar] [CrossRef]
- Belyaev, G.M.; Rudnick, V.A. Formation-Genetic Types of Granitoids; Nedra: St. Petersburg, Russia, 1978. (In Russian) [Google Scholar]
- Kuznetcov, V.A. Ore-Formation Analysis and Metallogeny Problems; Nauka: Novosibirsk, Russia, 1988. (In Russian) [Google Scholar]
- Ponomarchuk, A.V.; Prokopyev, I.R.; Doroshkevich, A.G.; Semenova, D.V.; Kravchenko, A.A.; Ivanov, A.I. Geochronology of the Mesozoic Alkaline Magmatism of Tyrkanda and Amga Tectonic Zones (Aldan Shield): New U-Pb and Ar-Ar Data. Geosfernye Issled 2020, 4, 6–24. (In Russian) [Google Scholar] [CrossRef]
- Maksimov, E.P.; Uytov, V.I.; Nikitin, V.M. Central-Aldan Gold-Uranium Ore Magmatogenic System (Aldano-Stanovoy Shield, Russia). Pac. Geol. 2010, 29, 3–26. (In Russian) [Google Scholar]
- Trunilina, V.A.; Roev, S.P.; Et, A. Magmatism of Various Geodynamic Settings (the Joint Zone of the Verkhoyansk Margin of the Siberian Continent and the Kolyma-Omolon Microcontinent); YSC SB RAS: Yakutsk, Russia, 1999. (In Russian) [Google Scholar]
- Parfenov, L.M.; Kuzmin, M.I. (Eds.) Tectonics, Geodynamics, and Metallogeny of the Territory of the Sakha Republic (Yakutia) (in Russian); Nauka/Inte.; MAIK “Nauka”/ Interperiodika: Moscow, Russia, 2001. (In Russian) [Google Scholar]
- Ivanov, A.; Ivanov, M.; Zhuravlev, A. Petrography of the Mesozoic Alkaline Rocks of the Medvedev Massif (South Yakutia, Aldan-Stanovoy Shield, Leglier Ore Cluster). IOP Conf. Ser. Earth Environ. Sci. 2020, 609, 012003. [Google Scholar] [CrossRef]
- Bilibin, U.A. Favorite Publications; AN USSR: Moscow, Russia, 1958; Volume 1. (In Russian) [Google Scholar]
- Vetluzhskikh, V.G.; Kazanskii, V.I.; Kochetkov, A.Y.; Yanovskii, V.M. Gold-ore deposits of the Central Aldan. Geol. ore Depos. 2002, 44, 467–499. (In Russian) [Google Scholar]
- Kochetkov, A.Y. Mesozoic Gold-Bearing Ore-Magmatic Systems of Central Aldan. Russ. Geol. Geofiz. 2006, 47, 850–864. (In Russian) [Google Scholar]
- Dvornick, G.P. Gold-Ore Metasomatic Formations of the Central-Aldan Region. Lithosphere 2012, 2, 90–105. (In Russian) [Google Scholar]
- Terekhov, A.V. Ore Potential of Hydrothermal-Metasomatic Formations of the E’kon Gold-and-Uranium Ore Cluster (South Yakutia); VSEGEI: St. Petersburg, Russia, 27 September 2012. (In Russian) [Google Scholar]
- Shatova, N.V. Ore Potential of Hydrothermal-Metasomatic Formations of the Ryabinovoe Ore Field (South Yakutia); VSEGEI: St. Petersburg, Russia, 2018. (In Russian) [Google Scholar]
- Molchanov, A.V.; Terekhov, A.V.; Shatov, V.V.; Petrov, O.V.; Kukushkin, K.A.; Kozlov, D.S.; Shatova, N.V. Gold Ore Districts and Ore Clusters of the Aldanian Metallogenic Province. Reg. Geol. Metallog. 2017, 71, 93–111. (In Russian) [Google Scholar]
- Ivanov, M.; Ivanov, A.; Zhuravlev, A. Petrography of the Mesozoic Alkaline Rocks of the Taezhniy Massif (South Yakutia, Aldan-Stanovoy Shield, Leglier Ore Cluster). IOP Conf. Ser. Earth Environ. Sci. 2021, 906, 012115. [Google Scholar] [CrossRef]
- Rad’kov, A.V.; Molchanov, A.V.; Artemiev, D.S.; Belenko, E.V. State Geological Map of the Russian Federation; Cartographic factory of VSEGEI: St. Petersburg, Russia, 2015. (In Russian) [Google Scholar]
- Schuth, S.; Gornyy, V.I.; Berndt, J.; Shevchenko, S.S.; Karpuzov, A.F.; Mansfeldt, T. Early Proterozoic U-Pb Zircon Ages from Basement Gneiss at the Solovetsky Archipelago, White Sea, Russia. Int. J. Geosci. 2012, 03, 289–296. [Google Scholar] [CrossRef] [Green Version]
- Williams, I.S. U-Th-Pb Geochronology by Ion Microprobe ABOUT TIME. Rev. Econ. Geol. 1998, 7, 1–35. [Google Scholar]
- Ludwig, K.R. SQUID 1.02, a User Manual, a Geochronological Toolkit for Microsoft Excel; Berkeley Geochronology Center Special Publication: Berkeley, CA, USA, 2001. [Google Scholar]
- Black, L.P.; Kamo, S.L.; Allen, C.M.; Aleinikoff, J.N.; Davis, D.W.; Korsch, R.J.; Foudoulis, C. TEMORA 1: A New Zircon Standard for Phanerozoic U-Pb Geochronology. Chem. Geol. 2003, 200, 155–170. [Google Scholar] [CrossRef]
- Wiedenbeck, M.; Alle, P.; Corfu, F.; Griffin, W.L.; Meier, M.; Oberli, F.; Von Quadt, A.; Roddick, J.C.; Spiegel, W. Three natural zircon standarts for U-Th-Pb, Lu-Hf, trace element and REE analyses. Geostand. Newsl. 1995, 19, 1–23. [Google Scholar] [CrossRef]
- Wetherill, G.W. Discordant Uranium—Lead Ages, I. Eos Trans. Am. Geophys. Union 1956, 37, 320–326. [Google Scholar] [CrossRef]
- Ludwig, K.R. Berkeley Geochronology Center Special Publication No.4. Components. In User’s Manual for Isoplot 3.00, a Geochronological Toolkit for Microsoft Excel; Berkeley Geochronology Center Special Publication: Berkeley, CA, USA, 2003. [Google Scholar]
- Stacey, J.S.; Kramers, J.D. Approximation of Terrestrial Lead Isotope Evolution by a Two-Stage Model. Earth Planet. Sci. Lett. 1975, 26, 207–221. [Google Scholar] [CrossRef]
- Le Maitre, R.W.; Streckeisen, A.; Zanettin, B.; Le Bas, M.J.; Bonin, B.; Bateman, P. (Eds.) Igneous Rocks: A Classification and Glossary of Terms, 2nd ed.; Cambridge University Press: Cambridge, UK, 2002; ISBN 9780511535581. [Google Scholar]
- Wilson, M. Review of igneous petrogenesis: Aglobal tectonic approach. Terra Nov. 1989, 1, 218–222. [Google Scholar] [CrossRef]
- De la Roche, H.; Leterrier, J.; Grandclaude, P.; Marchal, M. A Classification of Volcanic and Plutonic Rocks Using R1R2-Diagram and Major-Element Analyses—Its Relationships with Current Nomenclature. Chem. Geol. 1980, 29, 183–210. [Google Scholar] [CrossRef]
- Whitford, D.J.; Nicholls, I.A.; Taylor, S.R. Spatial Variations in the Geochemistry of Quaternary Lavas across the Sunda Arc in Java and Bali. Contrib. Mineral. Petrol. 1979, 70, 341–356. [Google Scholar] [CrossRef]
- Tauson, L.V.; Gundobin, G.M.; Zorina, L.D. Geochemical Fields of Ore-Magmatic Systems; Nauka: Novosibirsk, Russia, 1987. (In Russian) [Google Scholar]
- Sun, S.S.; McDonough, W.F. Chemical and Isotopic Systematics of Oceanic Basalts: Implications for Mantle Composition and Processes. Geol. Soc. Spec. Publ. 1989, 42, 313–345. [Google Scholar] [CrossRef]
- Cox, K.G.; Bell, J.D.; Pankhurst, R.J. The Interpretation of Igneous Rocks; Springer: Dordrecht, The Netherlands, 1979; ISBN 978-0-412-53410-2. [Google Scholar]
- Tischendorf, G.; Palchen, W. Zur Klassification von Granitoiden. Z. Fuer Geol. Wiss. 1985, 13, 615–627. [Google Scholar]
- Frost, B.R.; Barnes, C.G.; Collins, W.J.; Arculus, R.J.; Ellis, D.J.; Frost, C.D. A Geochemical Classification for Granitic Rocks. J. Petrol. 2001, 42, 2033–2048. [Google Scholar] [CrossRef] [Green Version]
- Pearce, J.A.; Harris, N.B.W.; Tindle, A.G. Trace Element Discrimination Diagrams for the Tectonic Interpretation of Granitic Rocks. J. Petrol. 1984, 25, 956–983. [Google Scholar] [CrossRef] [Green Version]
- Maniar, P.D.; Piccoli, P.M. Tectonic Discrimination of Granitoids. Geol. Soc. Am. Bull. 1989, 101, 635–643. [Google Scholar] [CrossRef]
- Müller, D.; Rock, N.M.S.; Groves, D.I. Geochemical Discrimination between Shoshonitic and Potassic Volcanic Rocks in Different Tectonic Settings: A Pilot Study. Mineral. Petrol. 1992, 46, 259–289. [Google Scholar] [CrossRef]
- Datsenko, V.M. Petrogeochemical Typification of Granitoids of the Southwestern Framing of the Siberian Platform. In Proceedings of the II Whole-Russia Petrographic Symposium, 2000, Syktyvkar, Russia, 27–30 June 2000; pp. 270–274. (In Russian). [Google Scholar]
- Sergeev, S.A.; Pushkarev, Y.D.; Lohov, K.I.; Sergeev, D.S. Obzor Sovremennykh Metodov Izotopnoy Geokhronologii (Sostavnaya Chast’ Geokhronologicheskogo Atlasa) 95/5 000 Peɜyλьmamы Пeрeвoдa Review of Modern Methods of Isotope Geochronology (Part of the Geochronological Atlas); VSEGEI: St. Petersburg, Russia, 2015. (In Russian) [Google Scholar]
- Rub, M.G.; Gladkov, N.G.; Pavlov, V.A.; Rub, A.K.; Troneva, N.V. Alkaline Elements and Strontium in Ore-Bearing (Sn, W, Ta) Differentiated Igneous Associations. Dokl. Earth Sci. 1984, 268, 1463–1466. (In Russian) [Google Scholar]
- Lightfoot, P.C.; Howkesworth, C.J.; Hergt, J.; Et, A. Remobilisation of the Continental Lithosphere by a Mantle Plume: Major Trace-Element, and Sr-, Nd-, and Pb-Isotopic Evidence from Picritic and Tholeiitic Lavas of the Noril’sk District, Siberian Trap, Russia. Contrib. Mineral. Petrol. 1993, 114, 171–188. [Google Scholar]
- Taylor, S.R.; McLennan, S.M. The Continental Crust: Its Composition and Evolution; Blackwell Scientific Publications: Oxford, MS, USA, 1985. [Google Scholar]
- Balashov, Y.A. Geochemistry of Rare-Earth Elements; Nauka: Moscow, Russia, 1976. (In Russian) [Google Scholar]
- Rudnick, R.L.; Gao, S. Composition of the Continental Crust. In Treatise on Geochemistry; Elsevier Inc.: Amsterdam, The Netherlands, 2003; Volume 3–9, pp. 1–64. ISBN 9780080548074. [Google Scholar] [CrossRef]
- Sasim, S.A. Shoshonite-Latite and Trachybasalt Series of Eastern Transbaikalia: Isotope-Geochemical Features and Genesis of Igneous Rocks of the Alexander-Zavodsk Depression; Institute of Geochemistry: Irkutsk, Russia, 2012. [Google Scholar]
- Gusev, A.I. Petrology of Gold-Forming Magmatism; Natural Sciences Academy: Moscow, Russia, 2012. (In Russian) [Google Scholar]
- Mair, J.L.; Farmer, G.L.; Groves, D.I.; Hart, C.J.R.; Goldfarb, R.J. Petrogenesis of Postcollisional Magmatism at Scheelite Dome, Yukon, Canada: Evidence for a Lithospheric Mantle Source for Magmas Associated with Intrusion-Related Gold Systems. Econ. Geol. 2011, 106, 451–480. [Google Scholar] [CrossRef]
- Stepanov, V.A. Bamskoe Gold-Ore Deposit (Stanovoy Ridge, Russia). Geol. ore Depos. 2001, 43, 38–51. (In Russian) [Google Scholar]
- Djenshuraeva, R. Middle Tien-Shan Backarc Magmatic Belt and Gold Deposits. In Understanding the Genesis of Ore Deposits to Melt the Demands of the 21-st Quadrennial IAGOD Symposium; Informpoligraph: Moscow, Russia, 2006; pp. 147–148. (In Russian) [Google Scholar]
- Maksimov, E.P. Mesozoic Ore-Bearing Magmatogenic Systems of Aldan-Stanovoy Shield; Neryungri Printing House: Neryungri, Russia, 2003. (In Russian) [Google Scholar]
- Kochetkov, A.Y.; Lazebnick, K.A. Alkaline Ultrabasic and Basic Rocks of Yakokut Massif (Central Aldan). In Geochemistry and Mineralogy of Basalts and Ultrabasites of Siberian Platform; SBASUSSR: Yakutsk, Russia, 1984; pp. 62–82. (In Russian) [Google Scholar]
- Kononova, V.A.; Pervov, V.A.; Bogatikov, O.A.; Myus-Shumaher, U.; Keller, I. Mesozoic Potassium Mamatism of Central Aldan: Geodynamics and Genesis. Geotectonics 1995, 3, 35–45. (In Russian) [Google Scholar]
- Rokosova, E.U. Composition and Characteristics of Melt Crystallization during the Formation of Potassium Mafic Rocks of the Central Aldan (on the Example of the Yllimakh, Ryabinovskii and Inagli Massifs); IGM: Novosibirsk, Russia, 2014. (In Russian) [Google Scholar]
- Donskaya, T.V.; Gladkochub, D.P.; Mazukabzov, A.M.; Ivanov, A.V. Late Paleozoic—Mesozoic Subduction-Related Magmatism at the Southern Margin of the Siberian Continent and the 150 Million-Year History of the Mongol-Okhotsk Ocean. J. Asian Earth Sci. 2013, 62, 79–97. (In Russian) [Google Scholar] [CrossRef]
- Leeman, W.; Worner, G.; Churikova, T.; Tonarini, S.; Heuser, A. Boron and Fluid-Mobile Element (FME) Fluxes Across Kamchatka. J. Conf. Abstr. EUG 11 2001, 6, 391. [Google Scholar]
- Kudrin, M.V.; Fridovsky, V.Y.; Polufuntikova, L.I.; Kryuchkova, L.Y. Disseminated Gold–Sulfide Mineralization in Metasomatites of the Khangalas Deposit, Yana–Kolyma Metallogenic Belt (Northeast Russia): Analysis of the Texture, Geochemistry, and S Isotopic Composition of Pyrite and Arsenopyrite. Minerals 2021, 11, 403. [Google Scholar] [CrossRef]
- Ivanov, M.S.; Ivanov, A.I.; Loskutov, E.E.; Zhuravlev, A.I. Mafic Minerals of the Medvedev Massif (South Yakutia). In Proceedings of the X international siberian early career geoscientists conference, Novosibirsk, Russia, 13–17 June 2022; pp. 93–94. (In Russian). [Google Scholar]

Publisher’s Note: MDPI stays neutral with regard to jurisdictional claims in published maps and institutional affiliations. |
© 2022 by the authors. Licensee MDPI, Basel, Switzerland. This article is an open access article distributed under the terms and conditions of the Creative Commons Attribution (CC BY) license (https://creativecommons.org/licenses/by/4.0/).
Share and Cite
Ivanov, A.; Loskutov, E.; Ivanov, M.; Zhuravlev, A. Petrography, Geochemical Features and Absolute Dating of the Mesozoic Igneous Rocks of Medvedev and Taezhniy Massifs (Southeast Russia, Aldan Shield). Minerals 2022, 12, 1516. https://doi.org/10.3390/min12121516
Ivanov A, Loskutov E, Ivanov M, Zhuravlev A. Petrography, Geochemical Features and Absolute Dating of the Mesozoic Igneous Rocks of Medvedev and Taezhniy Massifs (Southeast Russia, Aldan Shield). Minerals. 2022; 12(12):1516. https://doi.org/10.3390/min12121516
Chicago/Turabian StyleIvanov, Alexey, Evgeny Loskutov, Michil Ivanov, and Anatolii Zhuravlev. 2022. "Petrography, Geochemical Features and Absolute Dating of the Mesozoic Igneous Rocks of Medvedev and Taezhniy Massifs (Southeast Russia, Aldan Shield)" Minerals 12, no. 12: 1516. https://doi.org/10.3390/min12121516