
Effect of Slurry Concentration on the Ceramic Ball Grinding Characteristics of Magnetite

1
Jiangxi Key Laboratory of Mining Engineering, Jiangxi University of Science and Technology, Ganzhou 341000, China
2
School of Resources and Environmental Engineering, Jiangxi University of Science and Technology, Ganzhou 341000, China
*
Author to whom correspondence should be addressed.
Minerals 2022, 12(12), 1569; https://doi.org/10.3390/min12121569
Submission received: 28 October 2022
/
Revised: 30 November 2022
/
Accepted: 1 December 2022
/
Published: 6 December 2022
(This article belongs to the Special Issue Experimental and Numerical Studies of Mineral Comminution)
Abstract
:Ceramic grinding, which in this paper is defined as a method of using ceramic materials as grinding media, is favored by many processing plants as an emerging high-efficiency and energy-saving grinding method. This paper investigates the effect of slurry mass concentration on the grinding characteristics of magnetite by taking the feed of the secondary ball mill for processing magnetite as the research object. The study results show that the slurry mass concentration significantly affects the ceramic ball grinding characteristics of magnetite, especially for coarse particles. When the grinding concentration is higher than 50%, the breakage rate of magnetite plummets to 1/3 of the value at low mass concentrations. The standard deviation of the breakage rate relative to the concentration gradually decreases as the feed size falls, indicating that the coarser the feed size, the more sensitive the ceramic ball grinding is to the concentration, and thus industrial secondary ceramic ball mills need to avoid grinding under high-quality concentrations. The change in the consistency parameter of distribution function and zero-order output characteristics signals a radical variation in the grinding characteristics of magnetite using the ceramic ball grinding method compared to conventional grinding. Because the ceramic ball grinding method can greatly reduce energy consumption while lowering the chance of overgrinding, this grinding method deserves more attention as the world works to reach carbon neutrality and emissions peak.
1. Introduction
Comminution is a crucial part of mineral processing, and the operating cost of the ball mill accounts for more than 50% of the entire mineral processing plant [1]. At the same time, the grinding operation is necessary to pretreat ores before a series of subsequent separation operations to achieve the dissociation of mineral monomers [2], so it determines the quality of the final product. Nowadays, the grinding operation of mineral processing plants usually adopts two-stage grinding (two-stage ball mill) [3]. The primary ball mill is used for coarse grinding and crushes the large pieces of ore to the size suitable for the secondary ball mill [4,5]. The secondary ball mill is used for fine grinding to reduce the size of ore to the size that shows the monomer dissociation degree suitable for the separation operation [6]. Primary ball mills determine the processing throughput of the concentrator plant [7], so there is a great deal of research on its dynamics [8,9], scale-up models [4,10], energy distribution [11,12], and optimization of various parameters [13,14]. In contrast, there is very little research on secondary ball mills.
As an important parameter for grinding operations, the slurry concentration will determine the viscous resistance of the pulp and thus affect the grinding process [15,16,17,18,19]. As early as 1984, Tucker [20] (P. Tucker, 1984) demonstrated that at high pulp densities, the decrease in the overall grinding rate correlated well with the increase in pulp viscosity. The solids concentration of the slurry has always been a crucial parameter in the grinding process [21,22], and we usually add water to the ball mill to achieve a suitable solids concentration in practice.
Nano ceramic balls have been widely used in stirred mills as an emerging media [12,23], but due to their lighter specific gravity, researchers believe they cannot be used in conventional two-stage ball mills. However, with the breakthroughs in key technologies, Chinese scholars [24,25] have successfully applied nanocomposite ceramic balls to industrial two-stage ball mills and achieved remarkable results of energy saving and consumption reduction. Nanomaterials are materials in which at least one dimension in a three-dimensional space is in the nanometer size (1–100 nm) or composed of them as the basic unit, with this being approximately equivalent to a scale of 10 to 1000 atoms closely aligned together [26]. Ceramic ball grinding is the mainstream for the future grinding industry, so it merits more attention. In this paper, we will investigate the effect of slurry concentration on the ceramic ball grinding characteristics of magnetite by taking the new feed of the secondary ball mill as the research object.
2. Theoretical Background
2.1. Slurry Rheology
The rheological phenomena of ore slurry are very complex, and their factors that are closely related to grinding are independent of time. According to the different ways of shear stress variation with shear rate in the fluid, the slurry can be divided into four fluid states: Newtonian fluid, Dilatant fluid [27], Pseudoplastic fluid, and Bingham plastic fluid [28]. The empirical equations corresponding to each fluid state are shown below:
where τ is the shear stress, r is the shear rate, μ is the apparent viscosity, τy is the yield stress [29], and n is a constant parameter.
The viscosity of Newtonian fluids does not change with shear rate, and it differs from that of Bingham fluids in that Bingham fluids require a very small initial shear stress before the motion (yield stress). The viscosity of the Dilatant fluid increases with the shear rate, while that of the Pseudoplastic fluid is the exact opposite. The relationship of the four is shown in Figure 1.
2.2. Population Balance Model
The population balance model is a predictive model for exploring the variation of mineral size composition with different grinding times [30]. The population balance model considers that the mass fraction of a given particle size class after grinding time t is equal to the sum of the broken ore after the coarse particle size classes being ground to that specific size and its own crushing residue [2,31,32]:
where:
mi(t): the mass fraction in size class i at grinding time t;
Si(t): the breakage rate function of the size class i at grinding time t;
bij: the breakage distribution function that describes the daughter fraction in size class i formed when the unit mass of size class j is broken (j ≧ i);
Essentially, the population balance model is an expression on the breakage rate function and the distribution function [33,34], with the breakage rate function Si(t) being:
When the minerals being ground are of a narrow size class, they usually conform to first-order grinding kinetics and the breakage rate function is independent of time:
ln[m1(t)/m1(0)] = −S1t
The breakage rate function is used to characterize the disappearance speed of the top size class, which is an important parameter to measure the breakage speed of minerals. With the breakage rate function being time-independent, it can likewise be expressed as the reduction in top size per unit time:
where SC denotes the breakage rate of the top size at a specific mass concentration. The standard deviation of SC is used to express the degree of dispersion of the breakage rate of the top size at different concentrations, which can also be interpreted as the degree of influence of concentration on the breakage rate:
where is the standard deviation of SC, and SCi is the breakage rate at mass concentration Ci. At the same time the parameter used to characterize the new mass fraction of the remaining particle size is called the distribution function. For ease of calculation, breakage distribution function (bij) is often denoted by cumulative breakage distribution function (Bij):
When only a single size class is ground, the cumulative distribution function (Bi1) is usually calculated in two ways:
- (1)
- G-H algorithm created by Kapur [32]:
- (2)
- BII algorithm created by Austin [35]:
Since the Austin empirical formula is the most widely used, the results for Bi1 are expressed using this formula [36]:
where φ, γ, and β are constant parameters.
φ: the fraction of the relatively coarser particles that are produced in a single fracture step, dependent on the mineral used and ranging from 0 to 1 [37];
γ: the characteristic of the mineral used;
β: mineral dependent parameter, the values of which are typically found to be greater than 0.6.
2.3. Zero-Order Output Characteristics
When the minerals are over-ground, the very fine particles will cover the surface of the target minerals and interfere with the adsorption of the trapping agent on the one hand [38], and they compete with the target minerals for adsorption on the other hand, thus affecting the quality of the final concentrate [39,40,41]. For grinding operations, in addition to the breakage rate function and distribution function, the output characteristics of the fine particles are equally important [42,43,44]. The output of the fines in the discharge is consistent with zero-order output if the minerals are ground for a shorter period of time (no more than 65% fragmentation of the single or coarsest size class):
where P(d,t) is the cumulative yield under the sieve for size d at time t. F(x) denotes the zero-order cumulative yield rate constant for size d, which varies with size, and F(x) and size x usually have the following relationship:
where k and a are constants, the value of a is related to the grinding characteristics of the material itself, and the correlation with the ball mill state is weak.
3. Materials and Methods
3.1. Materials
The samples used in the experiments were from the feed of the secondary ball mill of Longqiao Mining, Anhui Province, China. Longqiao Mining adopts the stage grinding-stage separation process, that is, the product of primary grinding and the classifying system enters the magnetic separation operation and then the concentrate is fed into the secondary grinding and classifying system. Their particle size composition characteristics are shown in Table 1; the grade represents the amount of Fe3O4 in the size class and iron content indicates the percentage of Fe3O4 in this size class overall. The feed has already gone through a magnetic separation and its main mineral is magnetite, with a mass fraction of +0.075 mm reaching 65.47%, so the main task of the secondary grinding and classifying system is to dissociate this part of the feed fully monolithically. The bulk density of the magnetite was 2980 kg/m3, measured by the helium replacement method. In this experiment, the standard sieve was used to divide the +0.075 mm size class of the feed into −0.500 + 0.300 mm, −0.300 + 0.150 mm, and −0.150 + 0.075 mm, and each size class was divided into 500 g portions for the experiment. The ball mill used for the experiment is a XBM270 × 90 mm conical ball mill, and the comparison between the parameters of ceramic balls used for the experiment and those of conventional wear-resistant steel balls used is shown in Table 2.
Figure 2 shows the XRD test results of the test sample and calculating crystallites size and strain from XRD data using the Williamson–Hall plot method [45]. The structural properties of the magnetite nanostructures were analyzed using data from a Rigaku Ultimate IV powder X-ray diffractometer (λ = 0.15408 nm, acceleration voltage of 40 kV, scanning rate of 0.02°/s, and 2θ scanning range of 10° to 90°). From the Williamson–Hall plot method, we know that there is a relationship between the grain size and microscopic strain as follows:
where is the broadening of the peaks, is the peak position in radians, is the strain, K = 0.9 is the shape factor, and D is the crystallites size. In Williamson–Hall plot, is the slope of the line and is the y-intercept. The strain of magnetite used in this test was 3.01 × 10⁻⁴ and the crystallite size was 52.2 nm, calculated by linear regression.
3.2. Methods
Laboratory batch grinding experiments were conducted at mass concentrations (solids by mass in the slurry) of 40%, 50%, 60%, 70%, and 80% for −0.500 + 0.300 mm, −0.300 + 0.150 mm, and −0.150 + 0.075 mm size classes, respectively. At the same time, the batch grinding kinetics experiments were performed for each size class, that is, for −0.500 + 0.300 mm, −0.300 + 0.150 mm, and −0.150 + 0.075 mm size class at grinding times of 1 min, 2 min, 3 min, 4 min, and 5 min, respectively.
The experimental sample mass for all batch grinding was 500 g with a mass concentration of 70% (only applied in batch grinding for grinding kinetics) and a ceramic ball filling of 35%. The volume of the ball mill is 6.25 L and the speed is 98 r/min. The diameter and ratio of ceramic balls are φ 30 mm: φ 25 mm: φ 20 mm = 20%: 20%: 60%. All the grinding products were screened using a standard set of sieves of 0.300 mm, 0.150 mm, 0.075 mm, and 0.038 mm, and the sieving operation ended when the quality of the new undersize product was less than 1% of the mass fraction of the product on the sieve after 1 min of sieving.
4. Results
4.1. −0.500 + 0.300 mm Size Class
Figure 3 shows the particle size characteristics of the −0.500 + 0.300 mm size class after grinding for 3 min at different mass concentrations. For the −0.500 + 0.300 mm size class, the breakage capacity of low mass concentration grinding (40%, 50%) is significantly higher than that of high mass concentration grinding (60%, 70%, 80%). With increasing product particle size, the difference between the undersize cumulative yield at 40% mass concentration and 60% mass concentration increased from 9.16 percentage points to 46.68 percentage points. Figure 4 demonstrates the difference in breakage rate at different mass concentrations, where the linear fit is the breakage rate function (S1) of −0.500 + 0.300 mm magnetite at 70% mass concentration, and the histogram shows the breakage rate (SCi(−0.500 + 0.300)) corresponding to different mass concentrations. The breakage rates are 0.457 min−1 and 0.343 min−1 when the mass concentrations are 40% and 50%, respectively, but the breakage rate dropped precipitously to below 0.128 min−1 when the mass concentration increased further.
Figure 5 shows the calculated results of the cumulative breakage distribution function of the −0.500 + 0.300 mm size class. The BII algorithm used the data at the 2 min grinding time as the basis for calculating Bi1, and the GH algorithm used the intercept of the function with as the dependent variable and grinding time t as the independent variable on the vertical axis as the basis for calculating Bi1. The results calculated by these two methods were brought into the Austin empirical formula to obtain the final empirical expressions for Bi1 as:
Figure 6 illustrates the zero-order output characteristics of the fine product after ceramic ball grinding of −0.500 + 0.300 mm. The linear fit results of the cumulative undersize yield and the grinding time are highly correlated, indicating that the generation of the fines is fully consistent with the zero-order output characteristics.
4.2. −0.300 + 0.150 mm Size Class
Figure 7 shows the particle size characteristics of the −0.300 + 0.150 mm size class after grinding for 3 min at different mass concentrations. Unlike the −0.500 + 0.300 mm size class, the particle size characteristics of the −0.300 + 0.150 mm particle size class do not vary significantly with the mass concentration of the grinding slurry, and the size characteristic curves basically coincide with one another at each mass concentration. Figure 8 demonstrates the difference in breakage rate at different mass concentrations, where the linear fit is the breakage rate function (S2) of −0.300 + 0.150 mm magnetite at 70% mass concentration, and the histogram shows the breakage rate (SCi(−0.300 + 0.150)) corresponding to different mass concentrations. When the mass concentration of the slurry is above 60%, the breakage rate exceeds 0.550 min−1, about 30% higher than when the mass concentration is less than 60%.
Figure 9 shows the calculated results of the cumulative breakage distribution function of the −0.300 + 0.150 mm size class. The BII algorithm used the data at the 1 min grinding time as the basis for calculating Bi1, and the results calculated by these two methods were brought into the Austin empirical formula to obtain the final empirical expressions for Bi1:
Figure 10 illustrates the zero-order output characteristics of the fine particle after ceramic ball grinding of −0.300 + 0.150 mm. The −0.300 + 0.150 mm size class magnetite also has a fairly significant zero-order output characteristic of the fines within a short grinding time.
4.3. −0.150 + 0.075 mm Size Class
Figure 11 shows the particle size characteristics of the −0.1500 + 0.075 mm size class magnetite ground using ceramic balls for 3 min at different mass concentrations. The results differ from the two previous size classes; the particle size characteristics of the −0.150 + 0.075 mm size class are largely unaffected by the slurry mass concentration. Figure 12 demonstrates the difference in breakage rate at different mass concentrations, where the linear fit is the breakage rate function (S3) of −0.150 + 0.075 mm magnetite at 70% mass concentration, and the histogram shows the breakage rate (SCi(−0.150 + 0.075)) corresponding to different mass concentrations. In the range of common slurry mass concentrations, the breakage rate of top size ranges from 0.204 min−1 to 0.227 min−1 with a very small difference, not exceeding 0.03 min−1.
Because of the lack of data used to fit the calculated cumulative breakage distribution function for the −0.150 + 0.075 mm size class, the uncertainty and error of the fit are huge, so the analysis of the distribution function is not performed for this size class. Figure 13 illustrates the zero-order output characteristics of the fine product after ceramic grinding of −0.150 + 0.075 mm. Theoretically, the fitted straight line should pass through the origin of the coordinates (t = 0) but it usually deviates, which is due to the incomplete sieving process. Because it does not affect the slope of the linear fit but only the analysis-independent intercept, it does not have an impact on the final analysis results.
5. Comparison and Discussion
Compared with steel balls, ceramic balls as grinding media cannot effectively crush particles with greater strength in that the difference in the quality of the individual medium will lead to a fundamental distinction in the instantaneous force during impact breakage. The feed of the primary ball mill is usually larger in size and greater in strength, so there have been no cases of successful applications of ceramic balls in a primary ball mill so far. With the smaller size of the feed of the secondary ball mill, the effective collision probability of impact breakage decreases, and the abrasion breakage with tangential stress begins to dominate. Ceramic balls as media can reach twice the specific surface area of steel balls with the same total weight, which provides a strong theoretical support for the application of ceramic balls in secondary ball mills. Most magnetite processing plants use high concentration grinding to increase the processing capacity as much as possible. However, for ceramic ball milling, the mass concentration affects the viscosity of the slurry, which in turn influences the shear stress and ultimately the grinding effect. In this section, the effect of mass concentrations on the ceramic ball grinding will be compared and discussed from two aspects.
5.1. Breakage Rate Function and Distribution Function
The breakage rate function is the most representative parameter to characterize the grinding speed. In addition, breakage rate functions for different size classes are shown in Figure 14. Based on the results of the linear fit to the breakage rate function, the kinetic equations can be derived for the three size classes In addition, for the −0.500 + 0.300 mm size class, the kinetic equation is:
For the −0.300 + 0.150 mm size class, the kinetic equation is:
For the −0.150 + 0.075 mm size class, the kinetic equation is:
The coarsest size class (−0.500 + 0.300 mm) has the lowest breakage rate (0.104 min−1), which is about 1/5 of the −0.300 + 0.150 mm size class and about 1/2 of the −0.150 + 0.075 mm size class, respectively, indicating that ceramic ball milling does have some limitations for coarse particles. Since the smaller the particle size, the higher the specific energy required for breakage is, the breakage rate of the finest particle size is not as high as that of the −0.300 + 0.150 mm size class, which is the main size class in the feed of the secondary ball mill.
The concentration of solids has a strong influence on the apparent viscosity of the slurry, and this effect is particularly significant at high solids concentrations. An increase in solid concentration also causes a change in the rheological characteristics of the slurry, which changes from Dilatant plastic to Pseudoplastic to Bingham plastic as the solids concentration increases. Figure 15 illustrates the difference in breakage rates of different particle grades at different mass concentrations. The sensitivity of the breakage rate of the three size classes to the mass concentration of the slurry is completely different. The breakage rate of the −0.500 + 0.300 mm size class drops significantly with increasing concentrations, the breakage rate of the −0.300 + 0.150 mm size class tends to increase with the rise in concentration, and the breakage rate of the −0.150 + 0.075 mm size class basically varies with the concentration.
For the −0.500 + 0.300 mm size class, the increase in the mass concentration turns the slurry from Dilatant plastic into Pseudoplastic where the shear stress will decrease with the increase in the shear rate. When the shear stress does not reach the critical breakage stress of the magnetite size classes, it will not be able to obtain effective breakage, leading to a plunge in the breakage rate.
For the −0.300 + 0.150 mm size class, the reduction in particle size leads to an increase in pulp viscosity, and when the concentration increases, most of the magnetite will be adsorbed onto the surface of the ceramic ball, and thus the abrasion breakage efficiency increases [46], so the breakage rate tends to rise as the concentration increases.
For the −0.150 + 0.075 mm size class, the grinding effect is not sensitive to the mass concentration of the slurry because the size of the solid particles in the slurry has reached the limit that the magnetite can adsorb onto the surface of the ceramic ball at the conventional concentration [27,47].
At the same time, the sensitivity of the breakage rate to mass concentration is calculated for the three size classes. For the −0.500 + 0.300 mm size class, the standard deviation of the breakage rate is:
For the −0.300 + 0.150 mm size class, the standard deviation of the breakage rate is:
For the −0.150 + 0.075 mm size class, the standard deviation of the breakage rate is:
From the above results, the breakage rate of magnetite using ceramic ball grinding is gradually insensitive to the slurry concentration as the feed size decreases. For coarse magnetite ceramic grinding, attention should always be paid to the slurry mass concentration to avoid the reduction in the grinding effect caused by unsuitable concentration.
The parameters of the cumulative breakage distribution function for different size classes are shown in Table 3. Because they are different size classes of magnetite, their φ values are closer; however, because the main breakage method of these two size classes—ceramic grinding—has been changed, the difference between the two parameters of γ and β is larger.
5.2. Zero-Order Output Characteristics
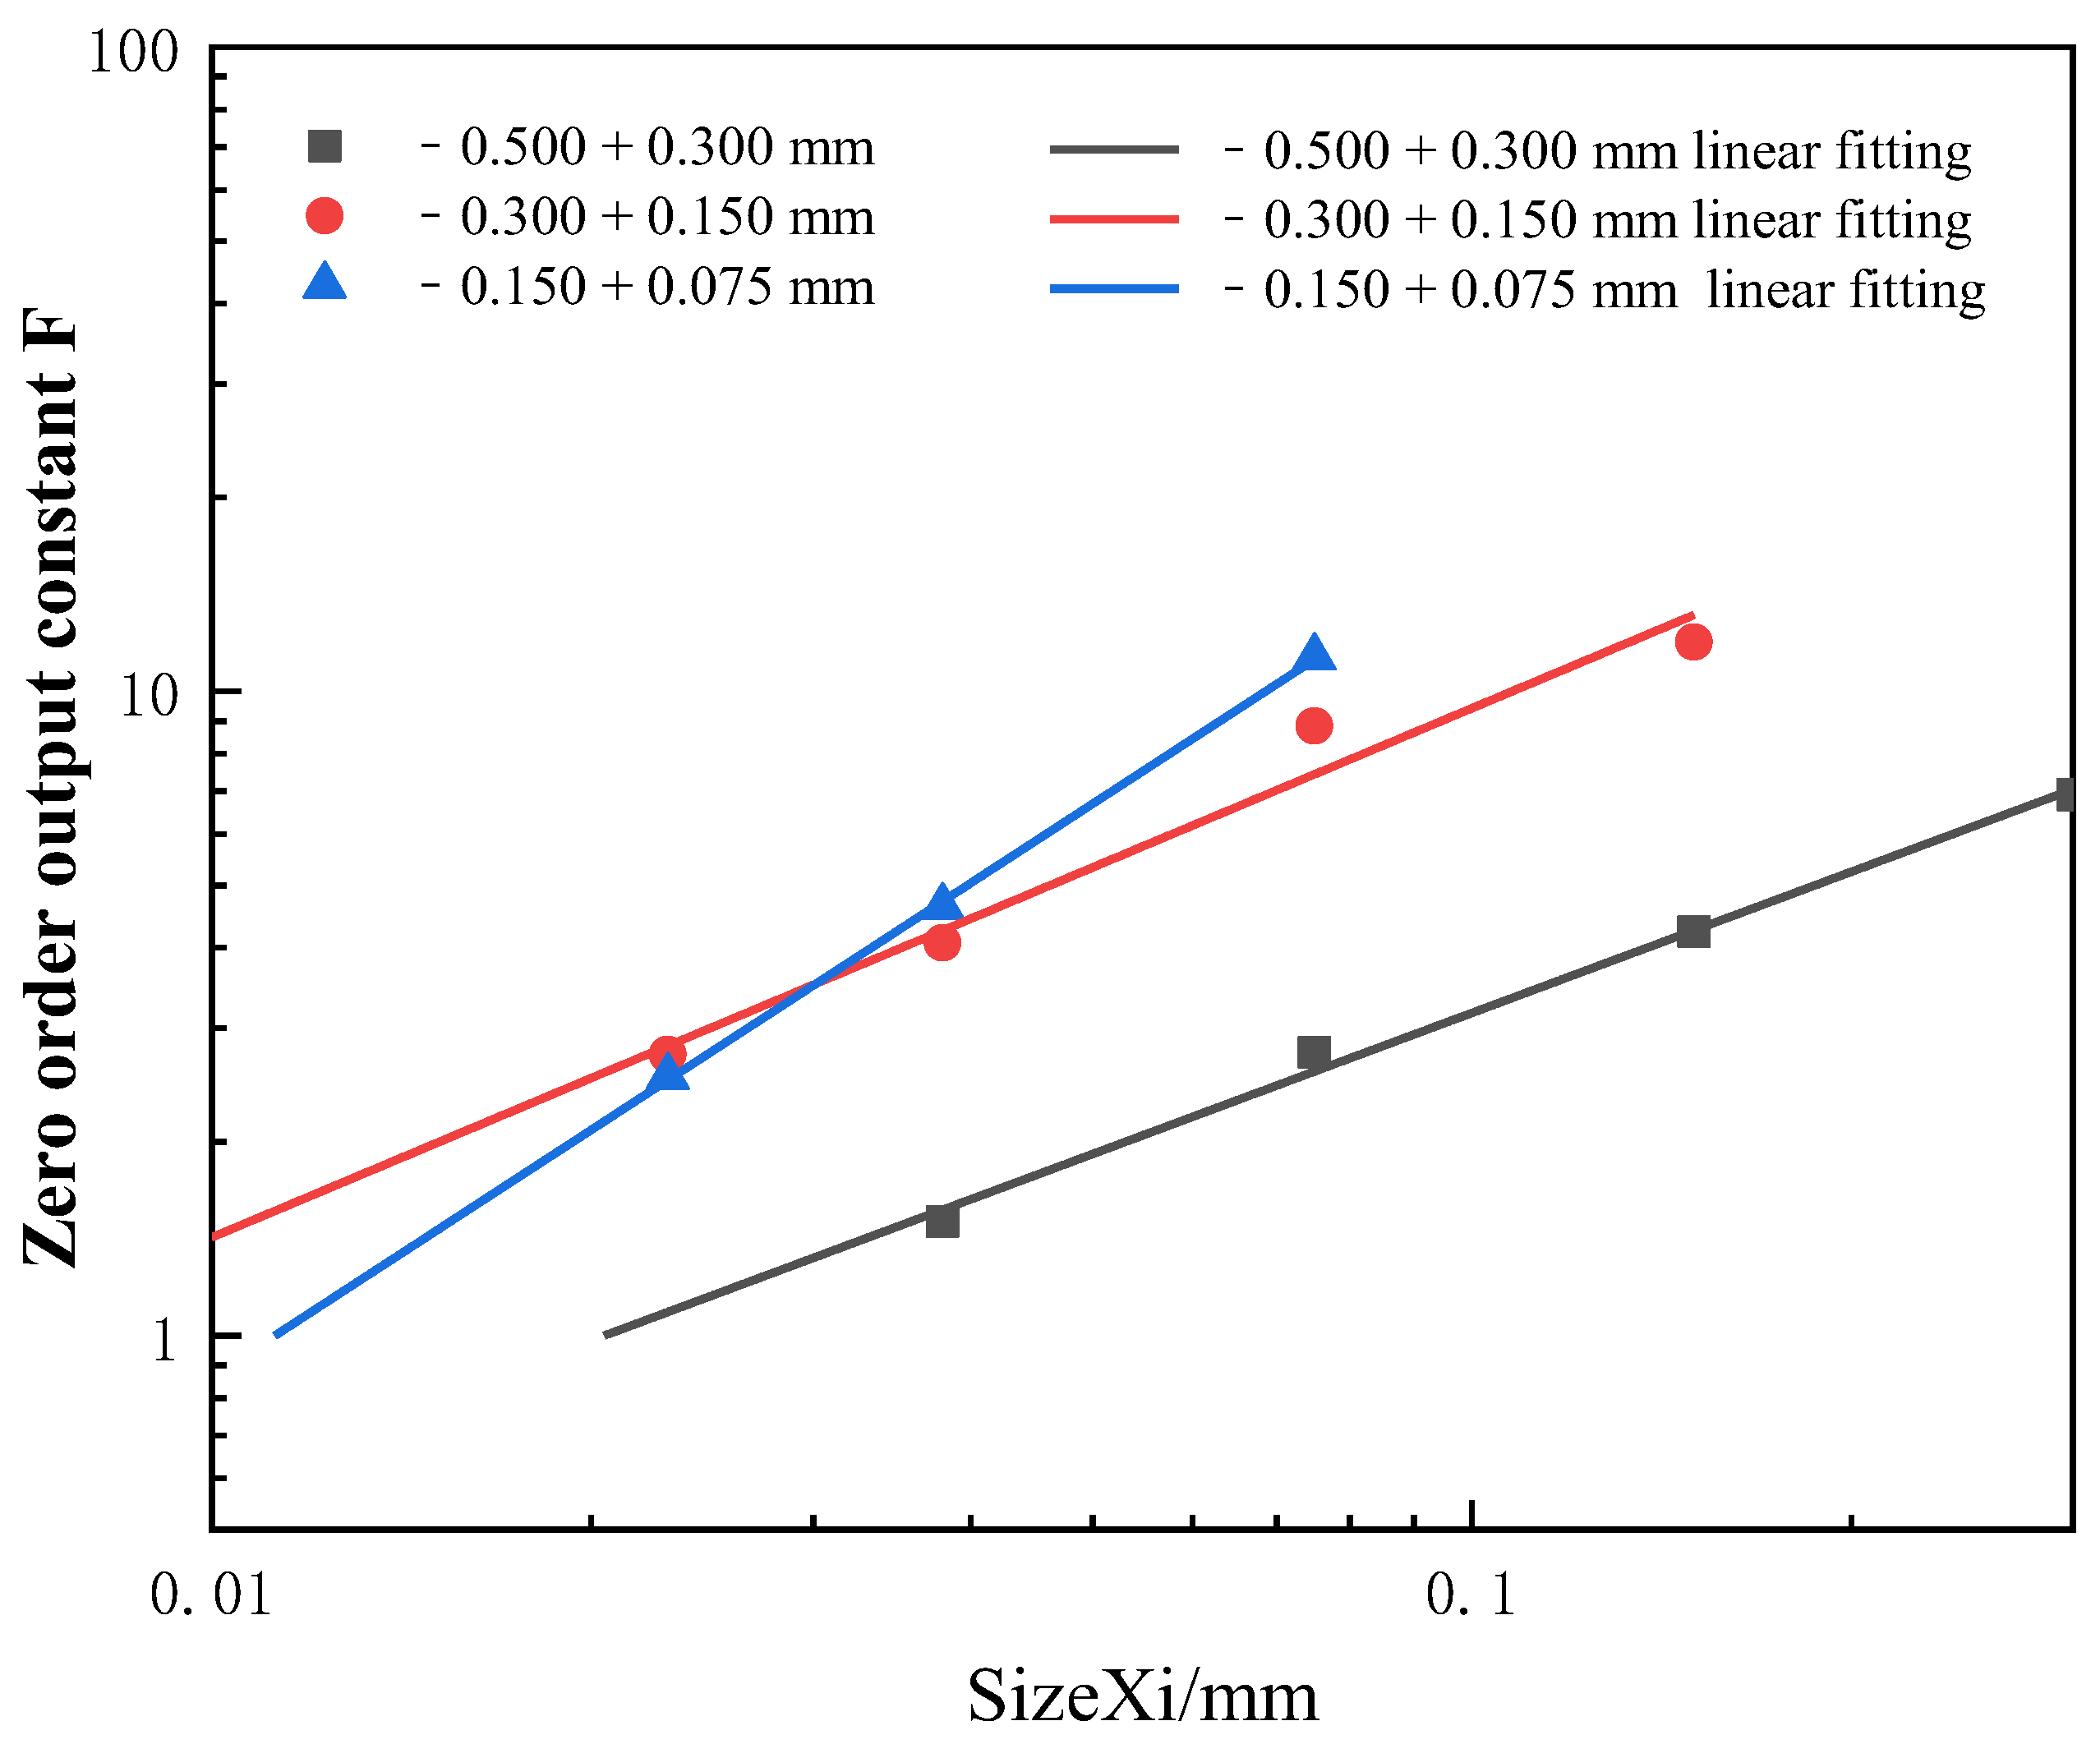
The disappearance rate of the top size determines the rate of mineral breakage, and the generation rate of the fine particle determines the degree of mineral overgrinding, both of which are very important for the grinding process. Figure 16 shows the linear regression of each size class on the exponential constant a. In general a is only related to the fragmentation characteristics of the mineral itself and not to the ball mill size and grinding conditions. However, the values of parameter a for −0.500 + 0.300 mm, −0.300 + 0.150 mm, and −0.150 + 0.075 mm in this experiment are 0.73, 0.82, and 1.27, respectively. This difference is mainly due to the fact that the main force of mineral breakage is no longer the normal impact force but the tangential shear stress in ceramic ball grinding compared to steel grinding. As the mineral size decreases, the viscosity of the slurry gradually increases, which affects the corresponding shear stress and ultimately causes the difference in the a-value. The a-value of −0.150 + 0.075 mm is much higher than the other two size classes because it is a fine size class, and the output characteristics of the fines are disturbed by the crushing rate of the top size. The a-value of magnetite in steel grinding is usually around 0.50, and the a-value of ceramic ball grinding is significantly larger, which indicates that the generation rate of the “muddificated” particle size (the finest particle size) is smaller in ceramic ball grinding compared to steel grinding. This also corresponds to the penetration crushing that occurs during the grinding of steel balls.
6. Conclusions
From the study of the differences in the ceramic ball grinding characteristics of −0.500 + 0.300 mm, −0.300 + 0.150 mm, and −0.150 + 0.075 mm magnetite at different slurry mass concentrations, several conclusions were drawn as follows:
- In ceramic ball grinding of magnetite, the mass concentration of the slurry is a pivotal indicator of the rate of breakage, especially for coarse particles. When the grinding concentration is higher than 50%, the breakage rate of magnetite nosedives to 1/3 of the value at low mass concentrations.
- The standard deviations of the breakage rates of the three size classes with respect to the grinding concentration are 0.1491, 0.071, and 0.0086, respectively, indicating that the sensitivity of the grinding effect to the concentration gradually drops as the feed size decreases.
- In ceramic ball grinding of magnetite, the breakage rate of −0.300 + 0.150 mm reached 0.558 min−1, higher than 0.104 min−1 for −0.500 + 0.300 mm and 0.204 min−1 for −0.150 + 0.075 mm. Because magnetite of this size class does not have the mechanical strength of −0.500 + 0.300 mm, it does require the specific energy needed to crush −0.150 + 0.075 mm.
- The parameter changes in both the distribution function and the zero-order output characteristics indicate that the primary mode of fragmentation in ceramic ball grinding has changed compared to steel grinding.
As a significant energy-saving grinding method, ceramic milling will certainly become a hot spot for future mining research. But the conclusion that conventional grinding is more consistent no longer applies to ceramic milling, and the grinding characteristics of ceramic ball grinding deserve more attention.
Author Contributions
Conceptualization, C.Y. (Chengfang Yuan) and C.W.; methodology, X.F.; validation, C.Y. (Chao Yu) and X.F.; formal analysis, N.L.; investigation, C.Y. (Chengfang Yuan); resources, J.T.; data curation, X.F.; writing—original draft preparation, C.Y. (Chengfang Yuan); writing—review and editing, C.Y. (Chengfang Yuan); visualization, J.T.; supervision, N.L.; project administration, C.W.; funding acquisition, C.W. All authors have read and agreed to the published version of the manuscript.
Funding
This research was funded by National Natural Science Foundation of China: 51764015.
Data Availability Statement
Not applicable.
Conflicts of Interest
The authors declare no conflict of interest.
References
- Norgate, T.; Haque, N. Energy and greenhouse gas impacts of mining and mineral processing operations. J. Clean. Prod. 2010, 18, 266–274. [Google Scholar] [CrossRef]
- Austin, L.G. A Review: Introduction to the MathmaticaI Description of Grinding as a Rate Process. Powder Technol. 1971, 5, 1–17. [Google Scholar] [CrossRef]
- Kwon, J.; Jeong, J.; Cho, H. Simulation and optimization of a two-stage ball mill grinding circuit of molybdenum ore. Adv. Powder Technol. 2016, 27, 1073–1085. [Google Scholar] [CrossRef]
- Herbst, J.A. Scale-up procedure for continuous grinding mill design using population balance models. Int. J. Miner. Process. 1980, 7, 1–31. [Google Scholar] [CrossRef]
- Wei, H.; He, Y.; Wang, S.; Xie, W.; Zuo, W.; Shi, F. Effects of circulating load and grinding feed on the grinding kinetics of cement clinker in an industrial CKP mill. Powder Technol. 2014, 253, 193–197. [Google Scholar] [CrossRef]
- Prziwara, P.; Kwade, A. Grinding aid additives for dry fine grinding processes—Part II: Continuous and industrial grinding. Powder Technol. 2021, 394, 207–213. [Google Scholar] [CrossRef]
- Shahbazi, B.; Jafari, M.; Parian, M.; Rosenkranz, J.; Chehreh Chelgani, S. Study on the impacts of media shapes on the performance of tumbling mills—A review. Miner. Eng. 2020, 157, 106490. [Google Scholar] [CrossRef]
- Gupta, V.K. Effect of particulate environment on the grinding kinetics of mixtures of minerals in ball mills. Powder Technol. 2020, 375, 549–558. [Google Scholar] [CrossRef]
- Liu, S.; Li, Q.; Song, J. Study on the grinding kinetics of copper tailing powder. Powder Technol. 2018, 330, 105–113. [Google Scholar] [CrossRef]
- Genç, Ö.; Ergün, Ş.L.; Benzer, A.H. The dependence of specific discharge and breakage rate functions on feed size distributions, operational and design parameters of industrial scale multi-compartment cement ball mills. Powder Technol. 2013, 239, 137–146. [Google Scholar] [CrossRef]
- Gupta, V.K. Energy absorption and specific breakage rate of particles under different operating conditions in dry ball milling. Powder Technol. 2020, 361, 827–835. [Google Scholar] [CrossRef]
- Zhang, X.; Qin, Y.; Jin, J.; Li, Y.; Gao, P. High-efficiency and energy-conservation grinding technology using a special ceramic-medium stirred mill: A pilot-scale study. Powder Technol. 2022, 396, 354–365. [Google Scholar] [CrossRef]
- Faria, P.M.C.; Rajamani, R.K.; Tavares, L.M. Optimization of Solids Concentration in Iron Ore Ball Milling through Modeling and Simulation. Minerals 2019, 9, 366. [Google Scholar] [CrossRef] [Green Version]
- Li, C.; Gao, Z. Effect of grinding media on the surface property and flotation behavior of scheelite particles. Powder Technol. 2017, 322, 386–392. [Google Scholar] [CrossRef]
- Bu, X.; Chen, Y.; Ma, G.; Sun, Y.; Ni, C.; Xie, G. Differences in dry and wet grinding with a high solid concentration of coking coal using a laboratory conical ball mill: Breakage rate, morphological characterization, and induction time. Adv. Powder Technol. 2019, 30, 2703–2711. [Google Scholar] [CrossRef]
- Ding, Z.; Yin, Z.; Liu, L.; Chen, Q. Effect of grinding parameters on the rheology of pyrite–heptane slurry in a laboratory stirred media mill. Miner. Eng. 2007, 20, 701–709. [Google Scholar] [CrossRef]
- He, M.; Wang, Y.; Forssberg, E. Parameter effects on wet ultrafine grinding of limestone through slurry rheology in a stirred media mill. Powder Technol. 2006, 161, 10–21. [Google Scholar] [CrossRef]
- Inam, M.A.; Ouattara, S.; Frances, C. Effects of concentration of dispersions on particle sizing during production of fine particles in wet grinding process. Powder Technol. 2011, 208, 329–336. [Google Scholar] [CrossRef] [Green Version]
- Tan, H.; Skinner, W.; Addai-Mensah, J. Influence of fluorite on the isothermal leaching and rheological behaviours of chlorite mineral pulps at low pH. Int. J. Miner. Process. 2013, 123, 1–8. [Google Scholar] [CrossRef]
- Tucker, P. The influence of pulp density on the selective grinding of ores. Miner. Eng. Int. J. Miner. Process. 1984, 12, 273–284. [Google Scholar] [CrossRef]
- Merrill, J.; Voisin, L.; Montenegro, V.; Ihle, C.F.; McFarlane, A. Slurry rheology prediction based on hyperspectral characterization models for minerals quantification. Miner. Eng. 2017, 109, 126–134. [Google Scholar] [CrossRef]
- Moys, M.H. Grinding to nano-sizes: Effect of media size and slurry viscosity. Miner. Eng. 2015, 74, 64–67. [Google Scholar] [CrossRef]
- Zhang, X.; Han, Y.; Gao, P.; Li, Y. Effects of grinding media on grinding products and flotation performance of chalcopyrite. Miner. Eng. 2020, 145, 106070. [Google Scholar] [CrossRef]
- Fang, X.; Wu, C.; Liao, N.; Yuan, C.; Xie, B.; Tong, J. The first attempt of applying ceramic balls in industrial tumbling mill: A case study. Miner. Eng. 2022, 180, 107504. [Google Scholar] [CrossRef]
- Fang, X.; Wu, C.; Yuan, C.; Liao, N.; Chen, Z.; Li, Y.; Lai, J.; Zhang, Z. Can ceramic balls and steel balls be combined in an industrial tumbling mill? Powder Technol. 2022, 412, 118020. [Google Scholar] [CrossRef]
- Kumar Inwati, G.; Kumar, P.; Roos, W.D.; Swart, H.C. Thermally induced structural metamorphosis of ZnO:Rb nanostructures for antibacterial impacts. Colloids Surf B Biointerfaces 2020, 188, 110821. [Google Scholar] [CrossRef] [PubMed]
- Klimpel, R.R. The Influence of Material Breakage Properties and Associated Slurry Rheology on Breakage Rates in the Wet Grinding of Coal/Ores in Tumbling Media Mills. Part. Sci. Technol. 2007, 2, 147–156. [Google Scholar] [CrossRef]
- KAWATRA, S.K. Rheological Effects in Grinding Circuits. Int. J. Miner. Process. 1988, 22, 251–259. [Google Scholar] [CrossRef]
- Shi, F.N. Estimation of shear rates inside a ball mill. Int. J. Miner. Process. 1999, 57, 167–183. [Google Scholar] [CrossRef]
- Reid, K.J. A solution to the batch grinding equation. Chem. Eng. Sci. 1965, 20, 953–963. [Google Scholar] [CrossRef]
- Austin, L.G. Methods for Determination of Breakage Distribution Parameters. Powder Technol. 1971, 72, 215–222. [Google Scholar] [CrossRef]
- Kapur, P.C. Appropriate solutions to the discretized batch grinding equation. Chem. Eng. Sci. 1970, 25, 1111–1113. [Google Scholar] [CrossRef]
- Epstein, B. The mathematical description of certain breakagemechanisms leading to the logarithmiconormal distribution. Certain. Break. Mechanisms. 1947, 471–477. [Google Scholar]
- Epstein, B. Logarithmico-Normal Distribution in Breakage of Solids. Ind. Eng. Chem. 1948, 40, 2289–2291. [Google Scholar] [CrossRef]
- Austin, L.G. Note on influence of interval size on the first-order hypothesis of grlndlng. Powder Technol. 1971, 71, 109–110. [Google Scholar] [CrossRef]
- Austin, L.G. A discussion of equations for the analysis of batch grinding data. Powder Technol. 1999, 106, 71–77. [Google Scholar] [CrossRef]
- Chimwani, N.; Glasser, D.; Hildebrandt, D.; Metzger, M.J.; Mulenga, F.K. Determination of the milling parameters of a platinum group minerals ore to optimize product size distribution for flotation purposes. Miner. Eng. 2013, 43–44, 67–78. [Google Scholar] [CrossRef]
- Cruz, N.; Peng, Y. Rheology measurements for flotation slurries with high clay contents—A critical review. Miner. Eng. 2016, 98, 137–150. [Google Scholar] [CrossRef]
- Basnayaka, L.; Subasinghe, N.; Albijanic, B. Influence of clays on the slurry rheology and flotation of a pyritic gold ore. Appl. Clay Sci. 2017, 136, 230–238. [Google Scholar] [CrossRef]
- Liao, N.; Wu, C.; Xu, J.; Feng, B.; Wu, J.; Gong, Y. Effect of Grinding Media on Grinding-Flotation Behavior of Chalcopyrite and Pyrite. Front. Mater. 2020, 7, 176. [Google Scholar] [CrossRef]
- Mathe, E.; Cruz, C.; Lucay, F.A.; Gálvez, E.D.; Cisternas, L.A. Development of a grinding model based on flotation performance. Miner. Eng. 2021, 166, 106890. [Google Scholar] [CrossRef]
- Austin, L.G. An analysis of fine grinding in ball mill. Powder Technol. 1981, 28, 83–90. [Google Scholar] [CrossRef]
- Gupta, V.K. The Estimation of Bate and Breakage Distribution P ammeters from Batch Grinding Data for a Complex Pyritic Ore Using a Back-Calculation Method. Powder Technol. 1981, 28, 97–106. [Google Scholar] [CrossRef]
- Venkataraman, K.S. Application of the Population Balance Model to the Grinding of Mixtures of Minerals. Powder Technol. 1984, 39, 133–142. [Google Scholar] [CrossRef]
- Kumar, P.; Inwati, G.K.; Mathpal, M.C.; Ghosh, S.; Roos, W.D.; Swart, H.C. Defects induced enhancement of antifungal activities of Zn doped CuO nanostructures. Appl. Surf. Sci. 2021, 560, 150026. [Google Scholar] [CrossRef]
- Hennart, S.L.A.; Wildeboer, W.J.; van Hee, P.; Meesters, G.M.H. Identification of the grinding mechanisms and their origin in a stirred ball mill using population balances. Chem. Eng. Sci. 2009, 64, 4123–4130. [Google Scholar] [CrossRef]
- Sato, A.C.K.; Cunha, R.L. Effect of particle size on rheological properties of jaboticaba pulp. J. Food Eng. 2009, 91, 566–570. [Google Scholar] [CrossRef]
Figure 1.
Time-independent slurry rheology curve.
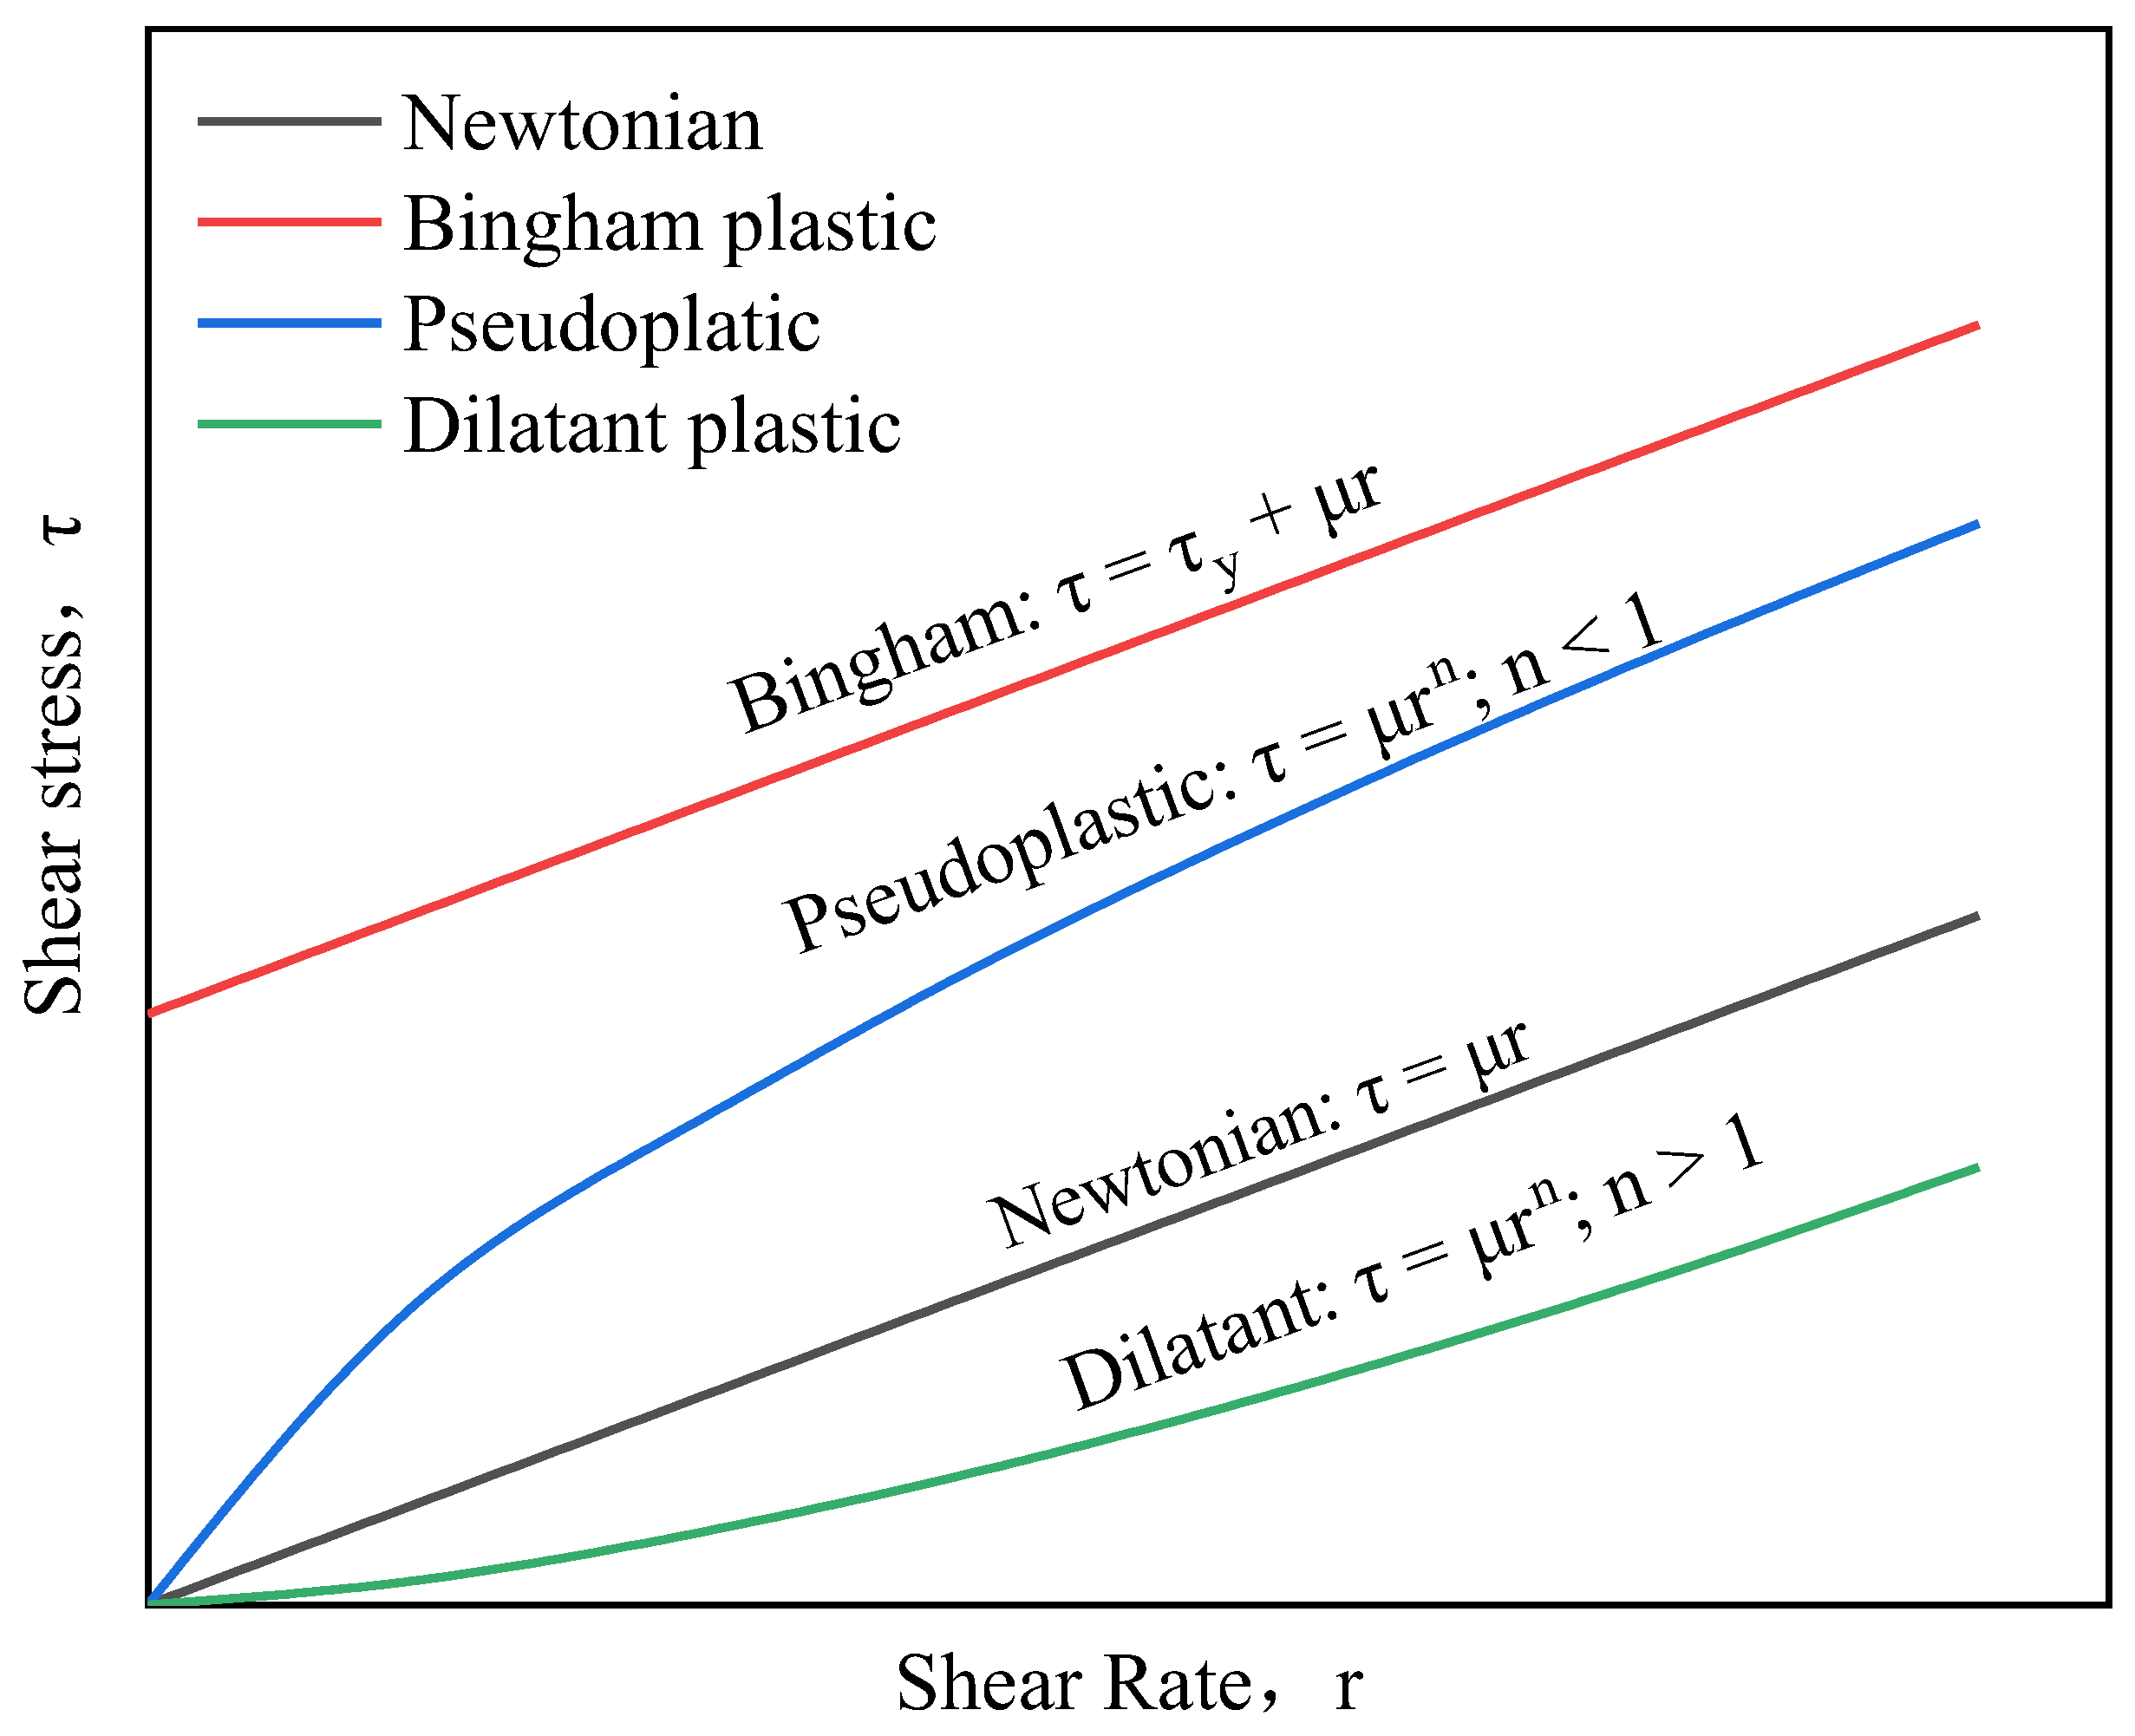
Figure 2.
XRD test results of test samples.

Figure 3.
Particle size characteristics of −0.500 + 0.300 mm after being ground for 3 min at different mass concentrations.
Figure 3.
Particle size characteristics of −0.500 + 0.300 mm after being ground for 3 min at different mass concentrations.
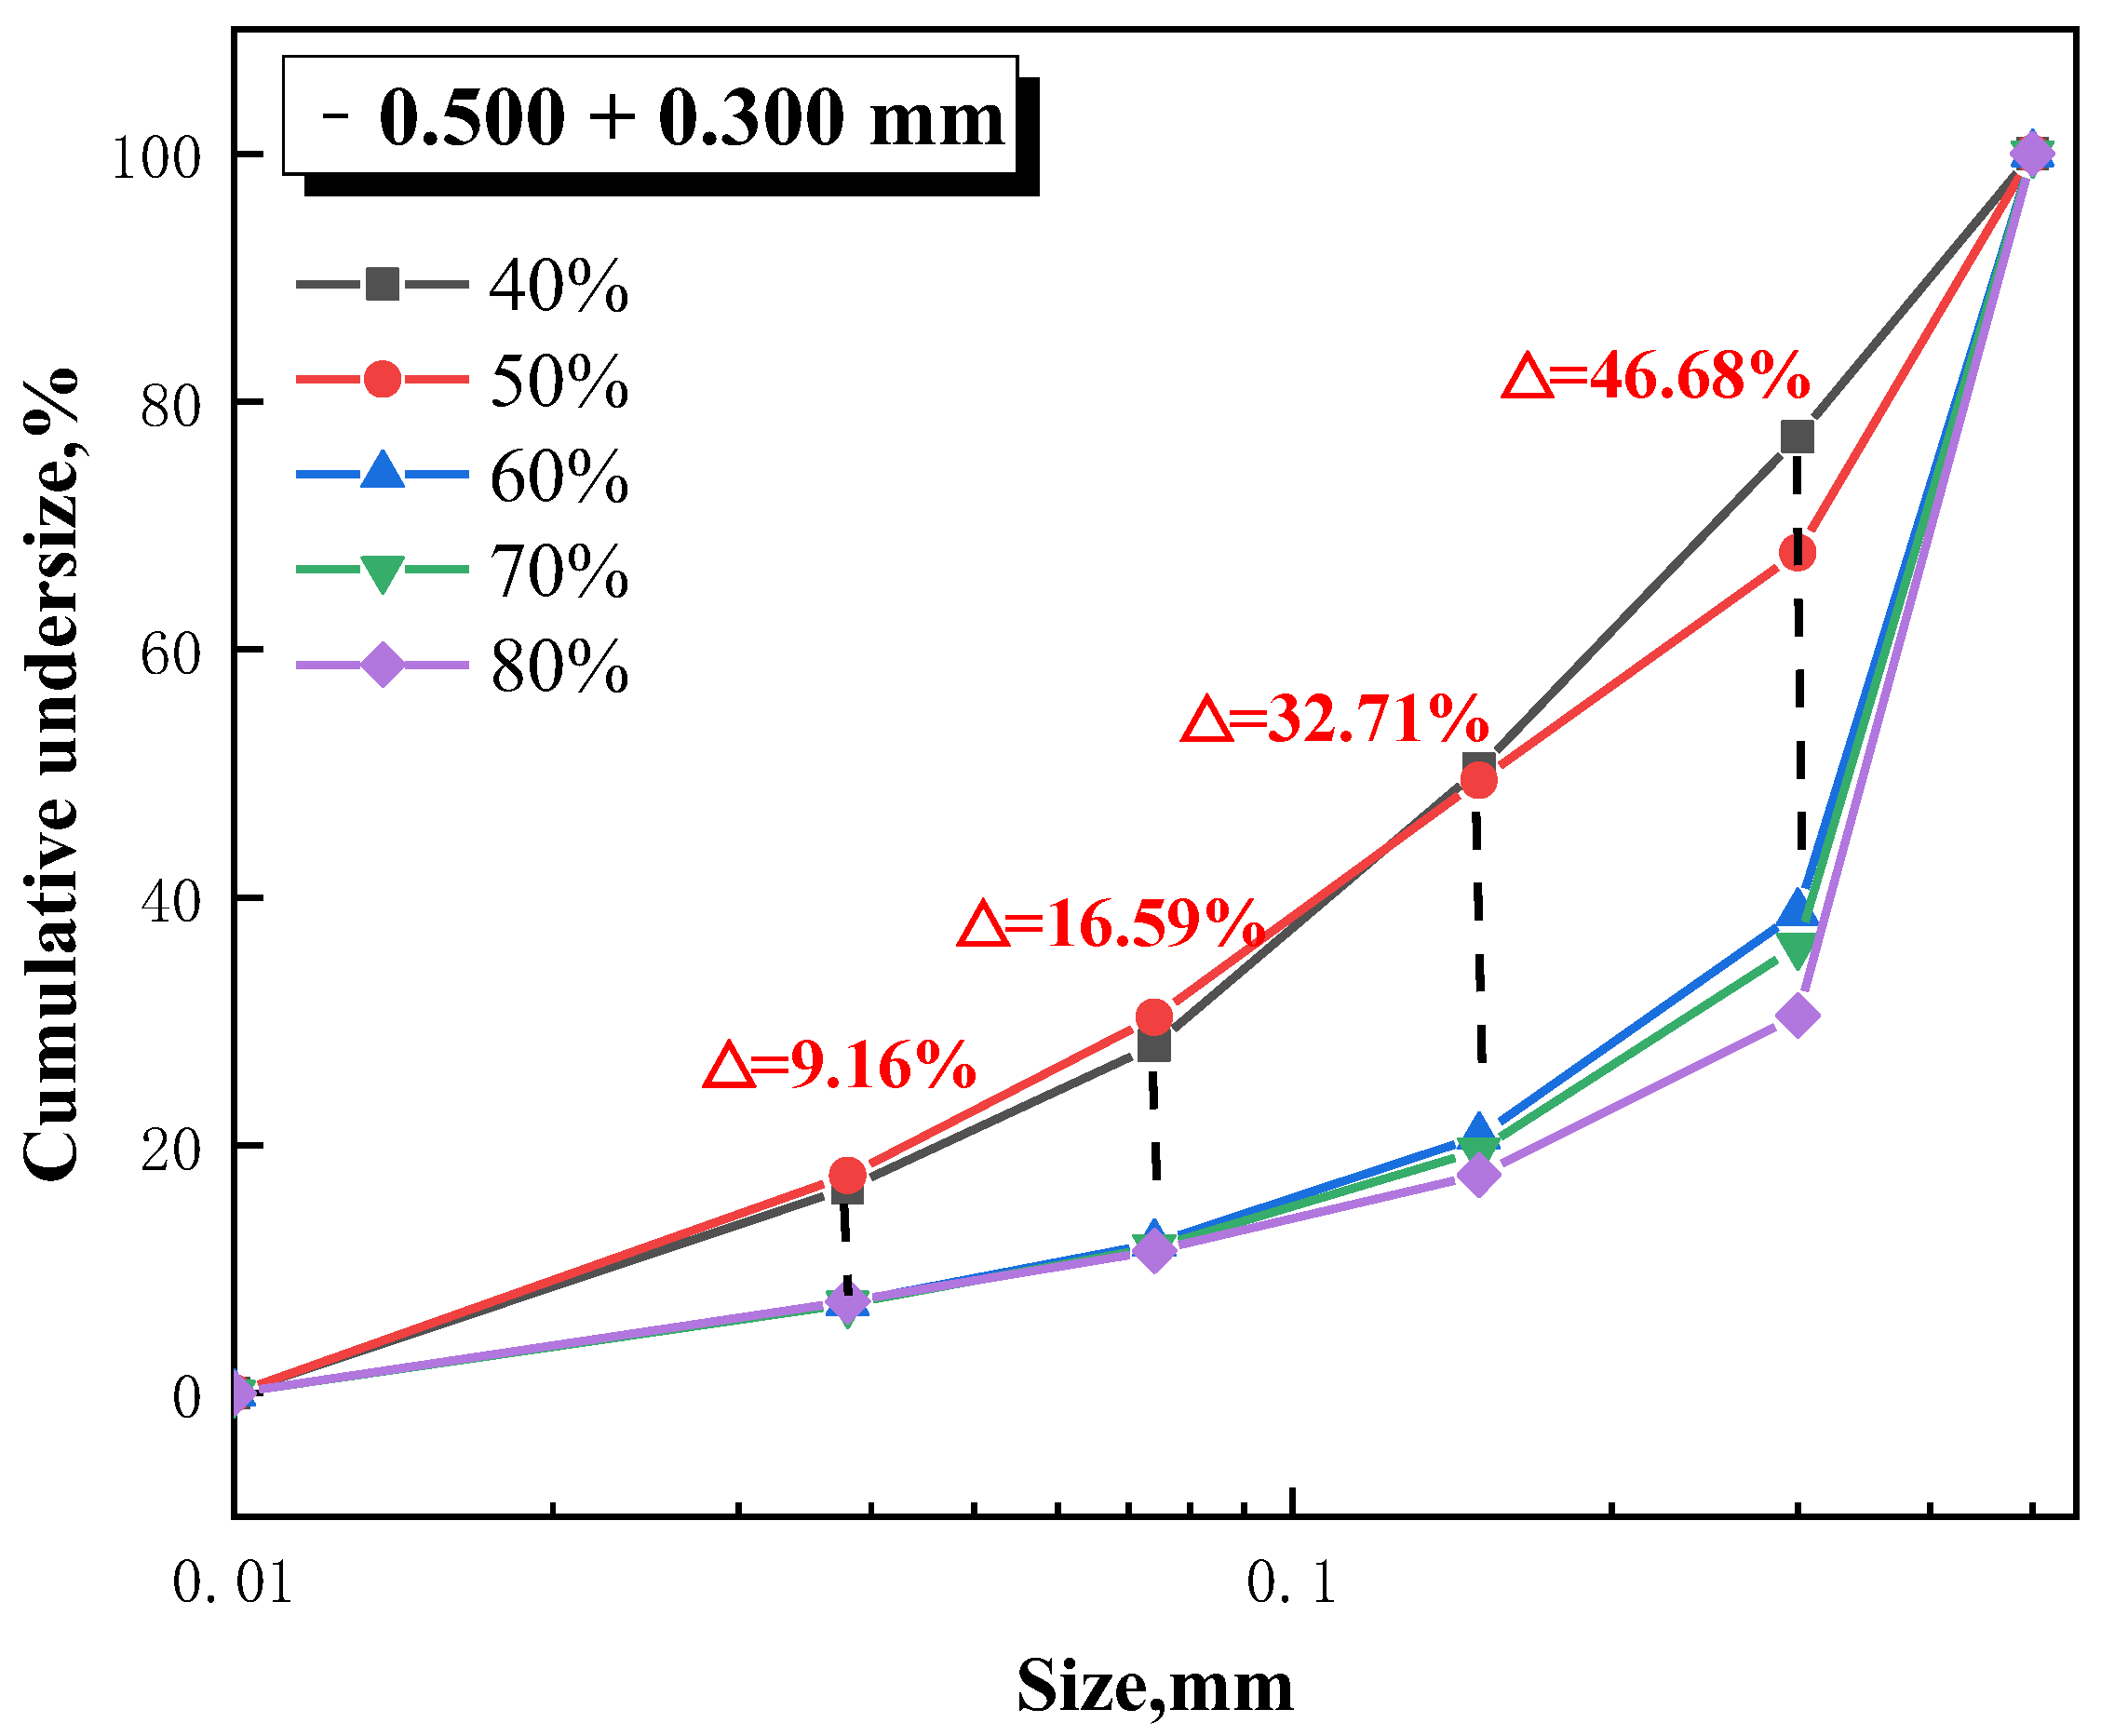
Figure 4.
Breakage rate of −0.500 + 0.300 mm at different mass concentrations.
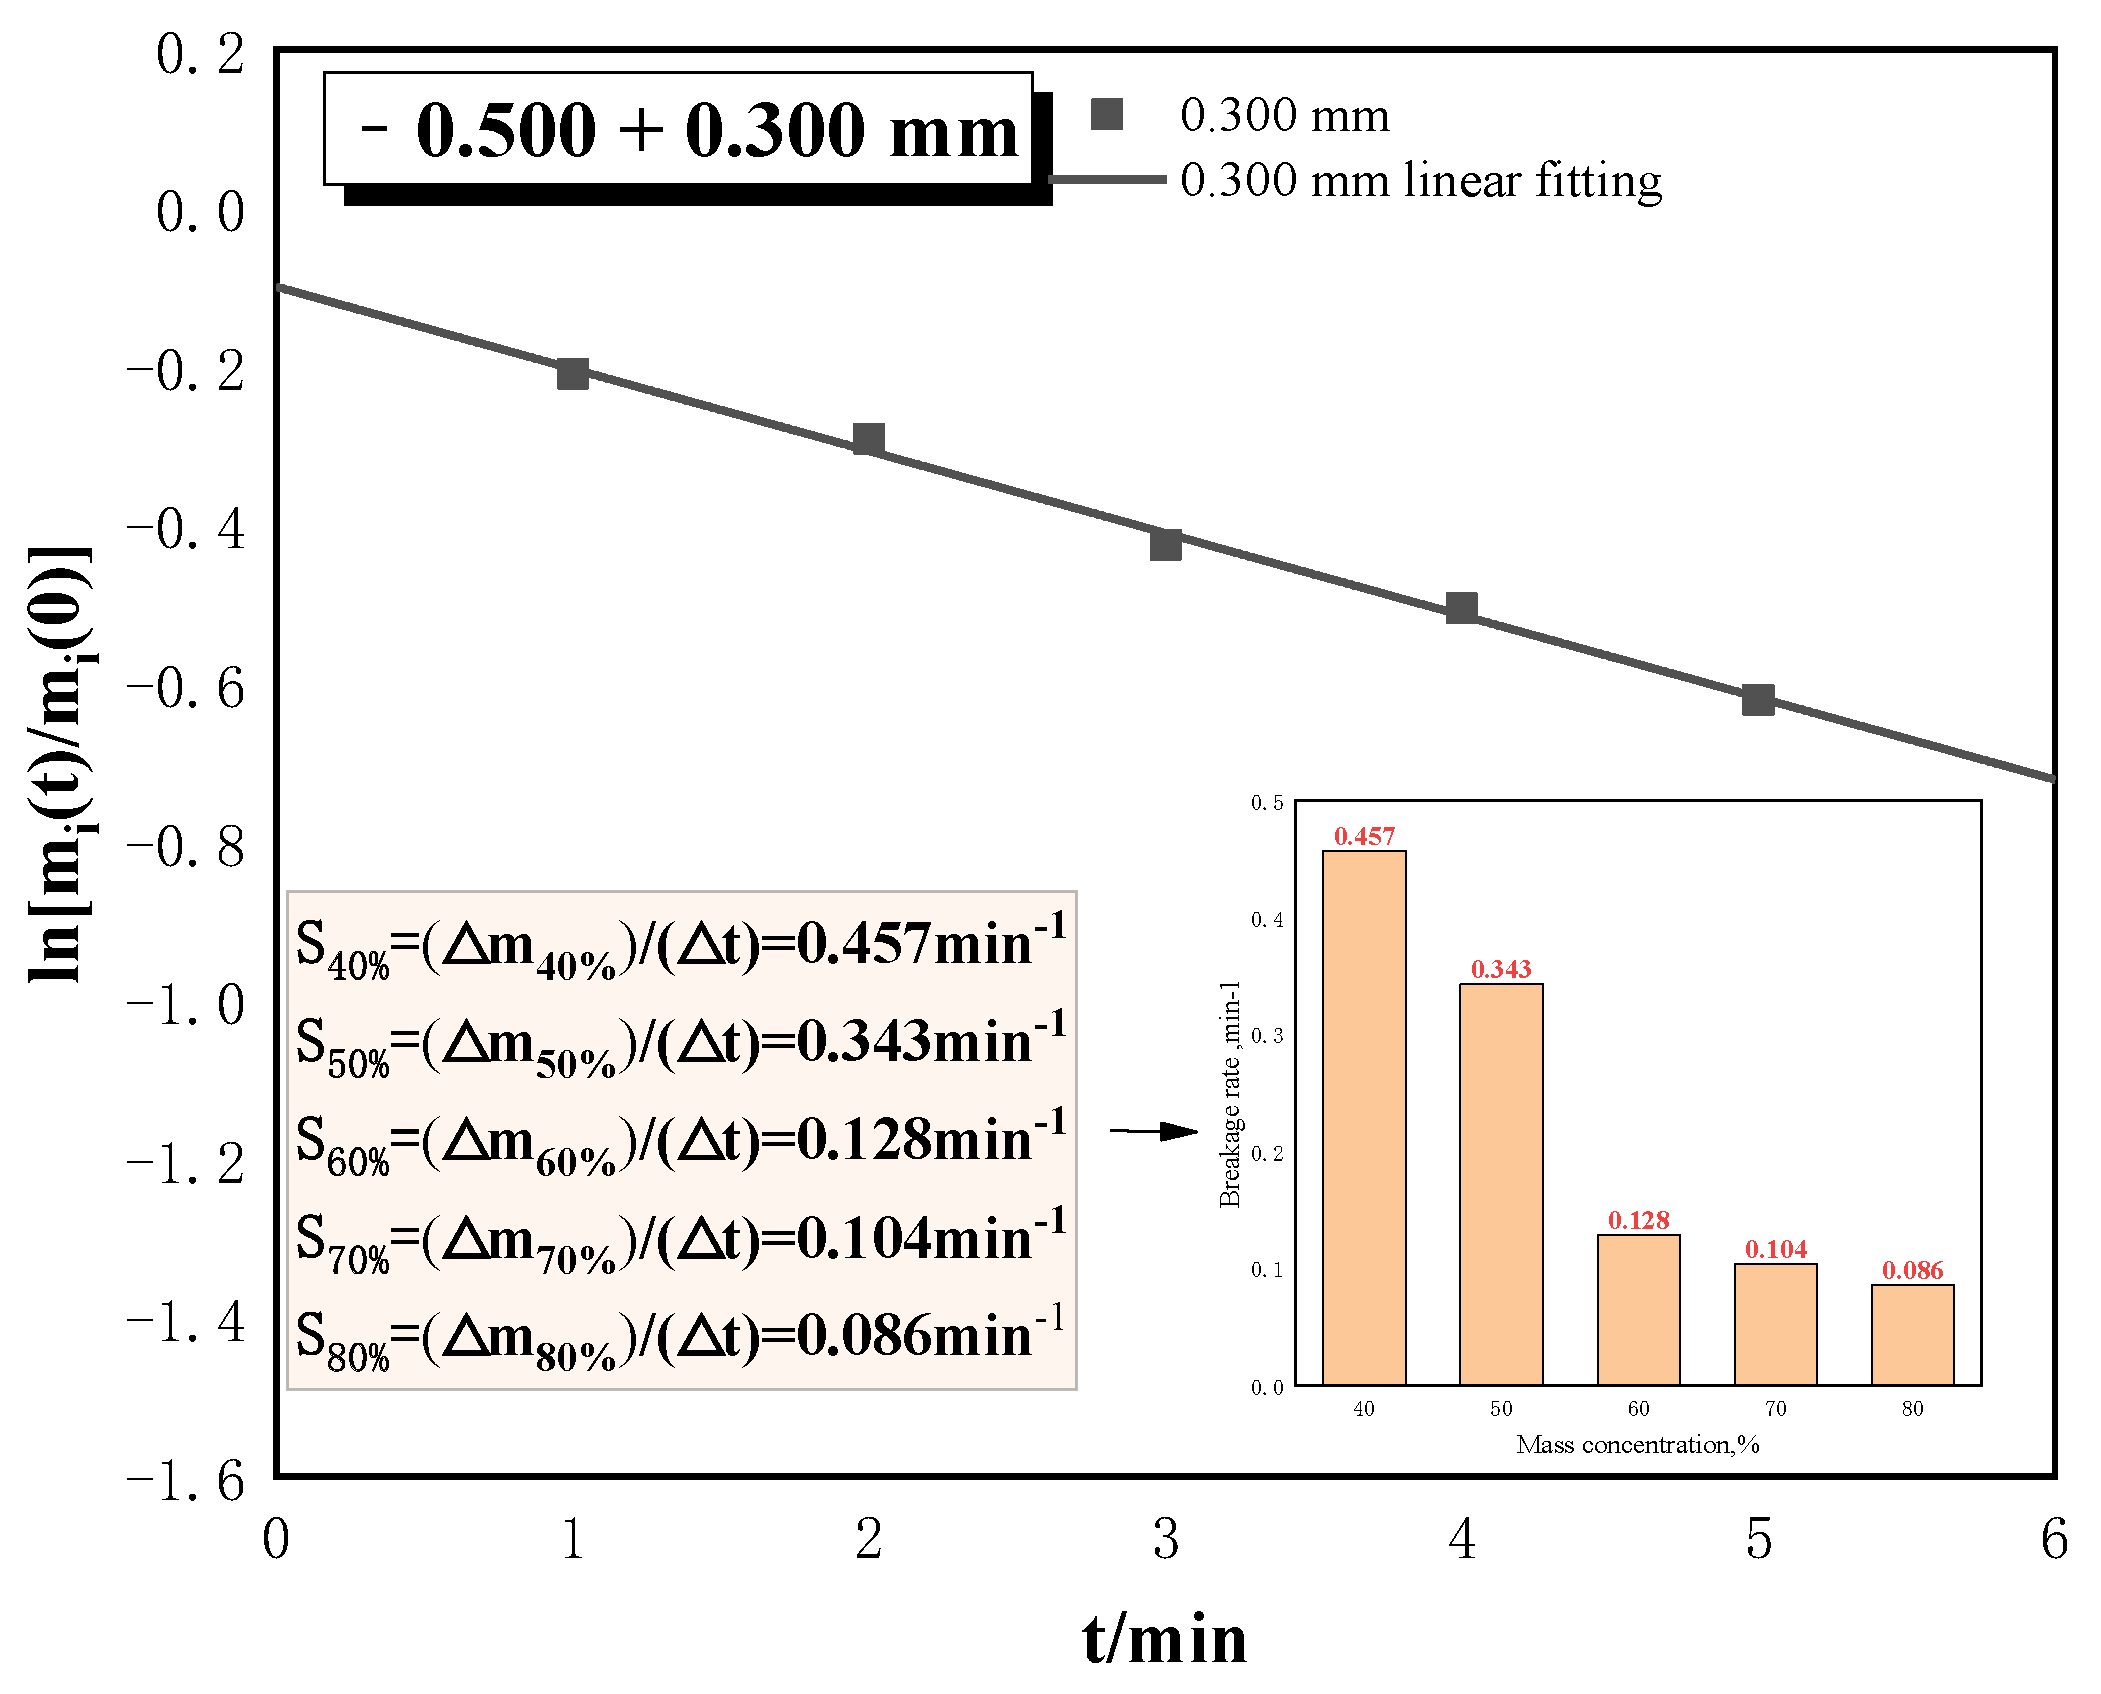
Figure 5.
Cumulative breakage distribution function of −0.500 + 0.300 mm at 70% mass concentration.
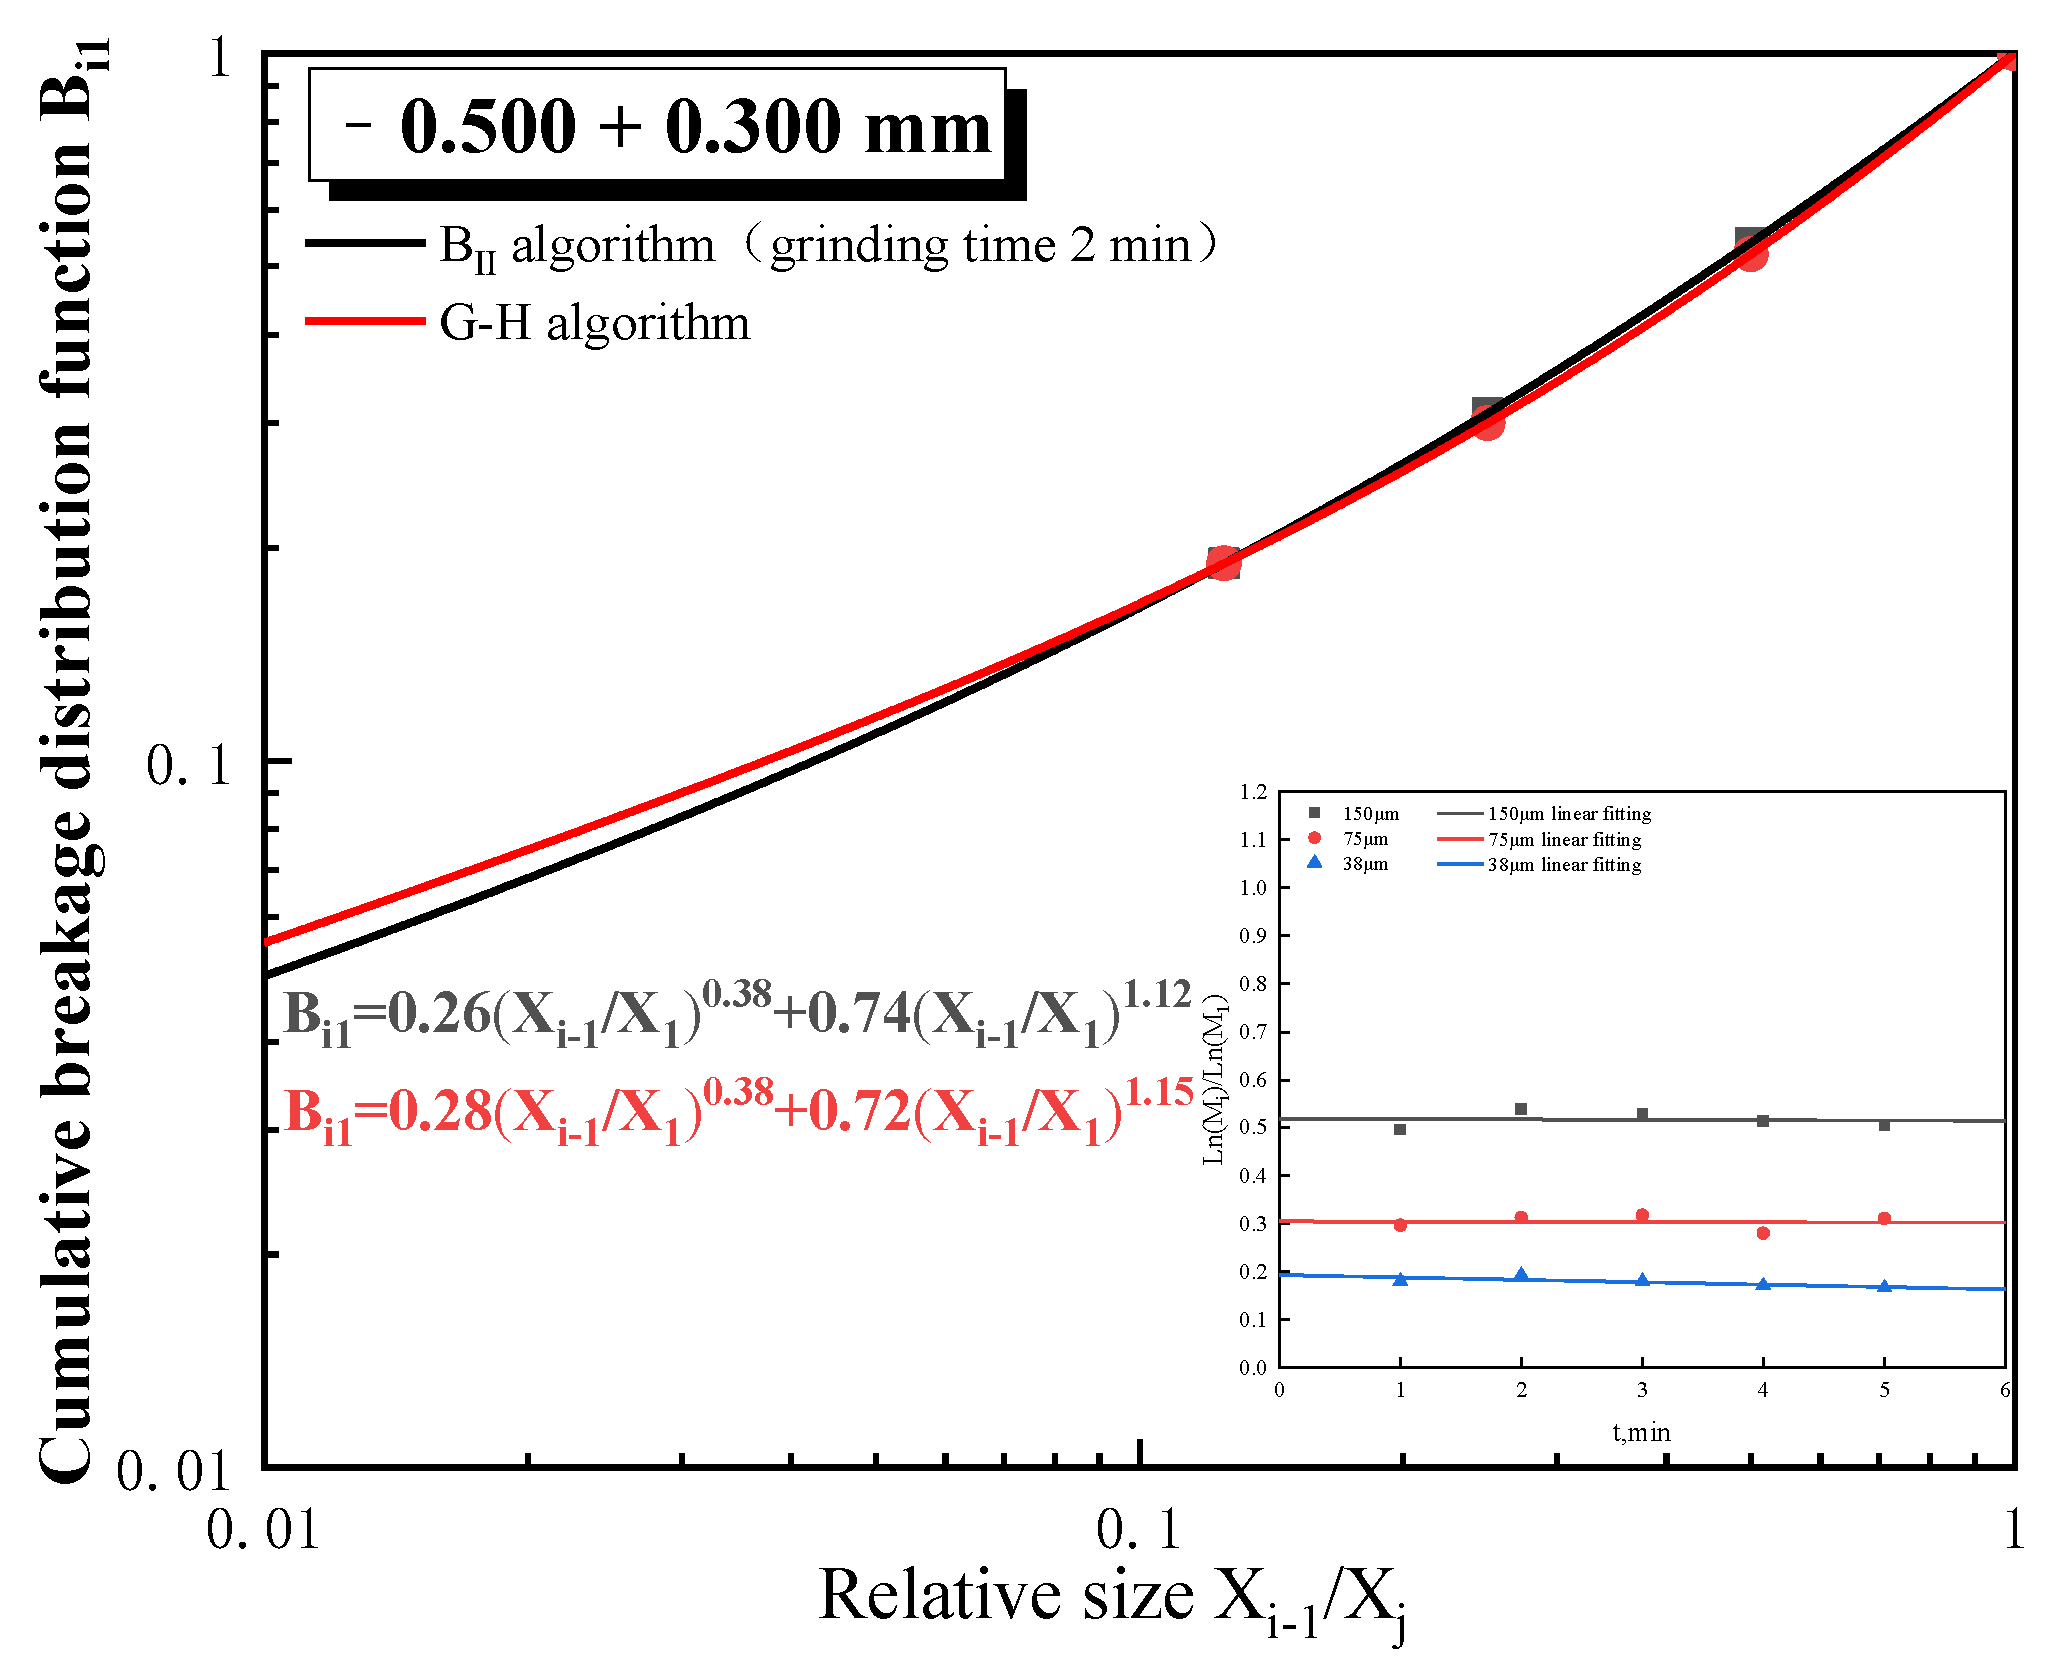
Figure 6.
Zero-order output characteristics of −0.500 + 0.300 mm at 70% mass concentration.
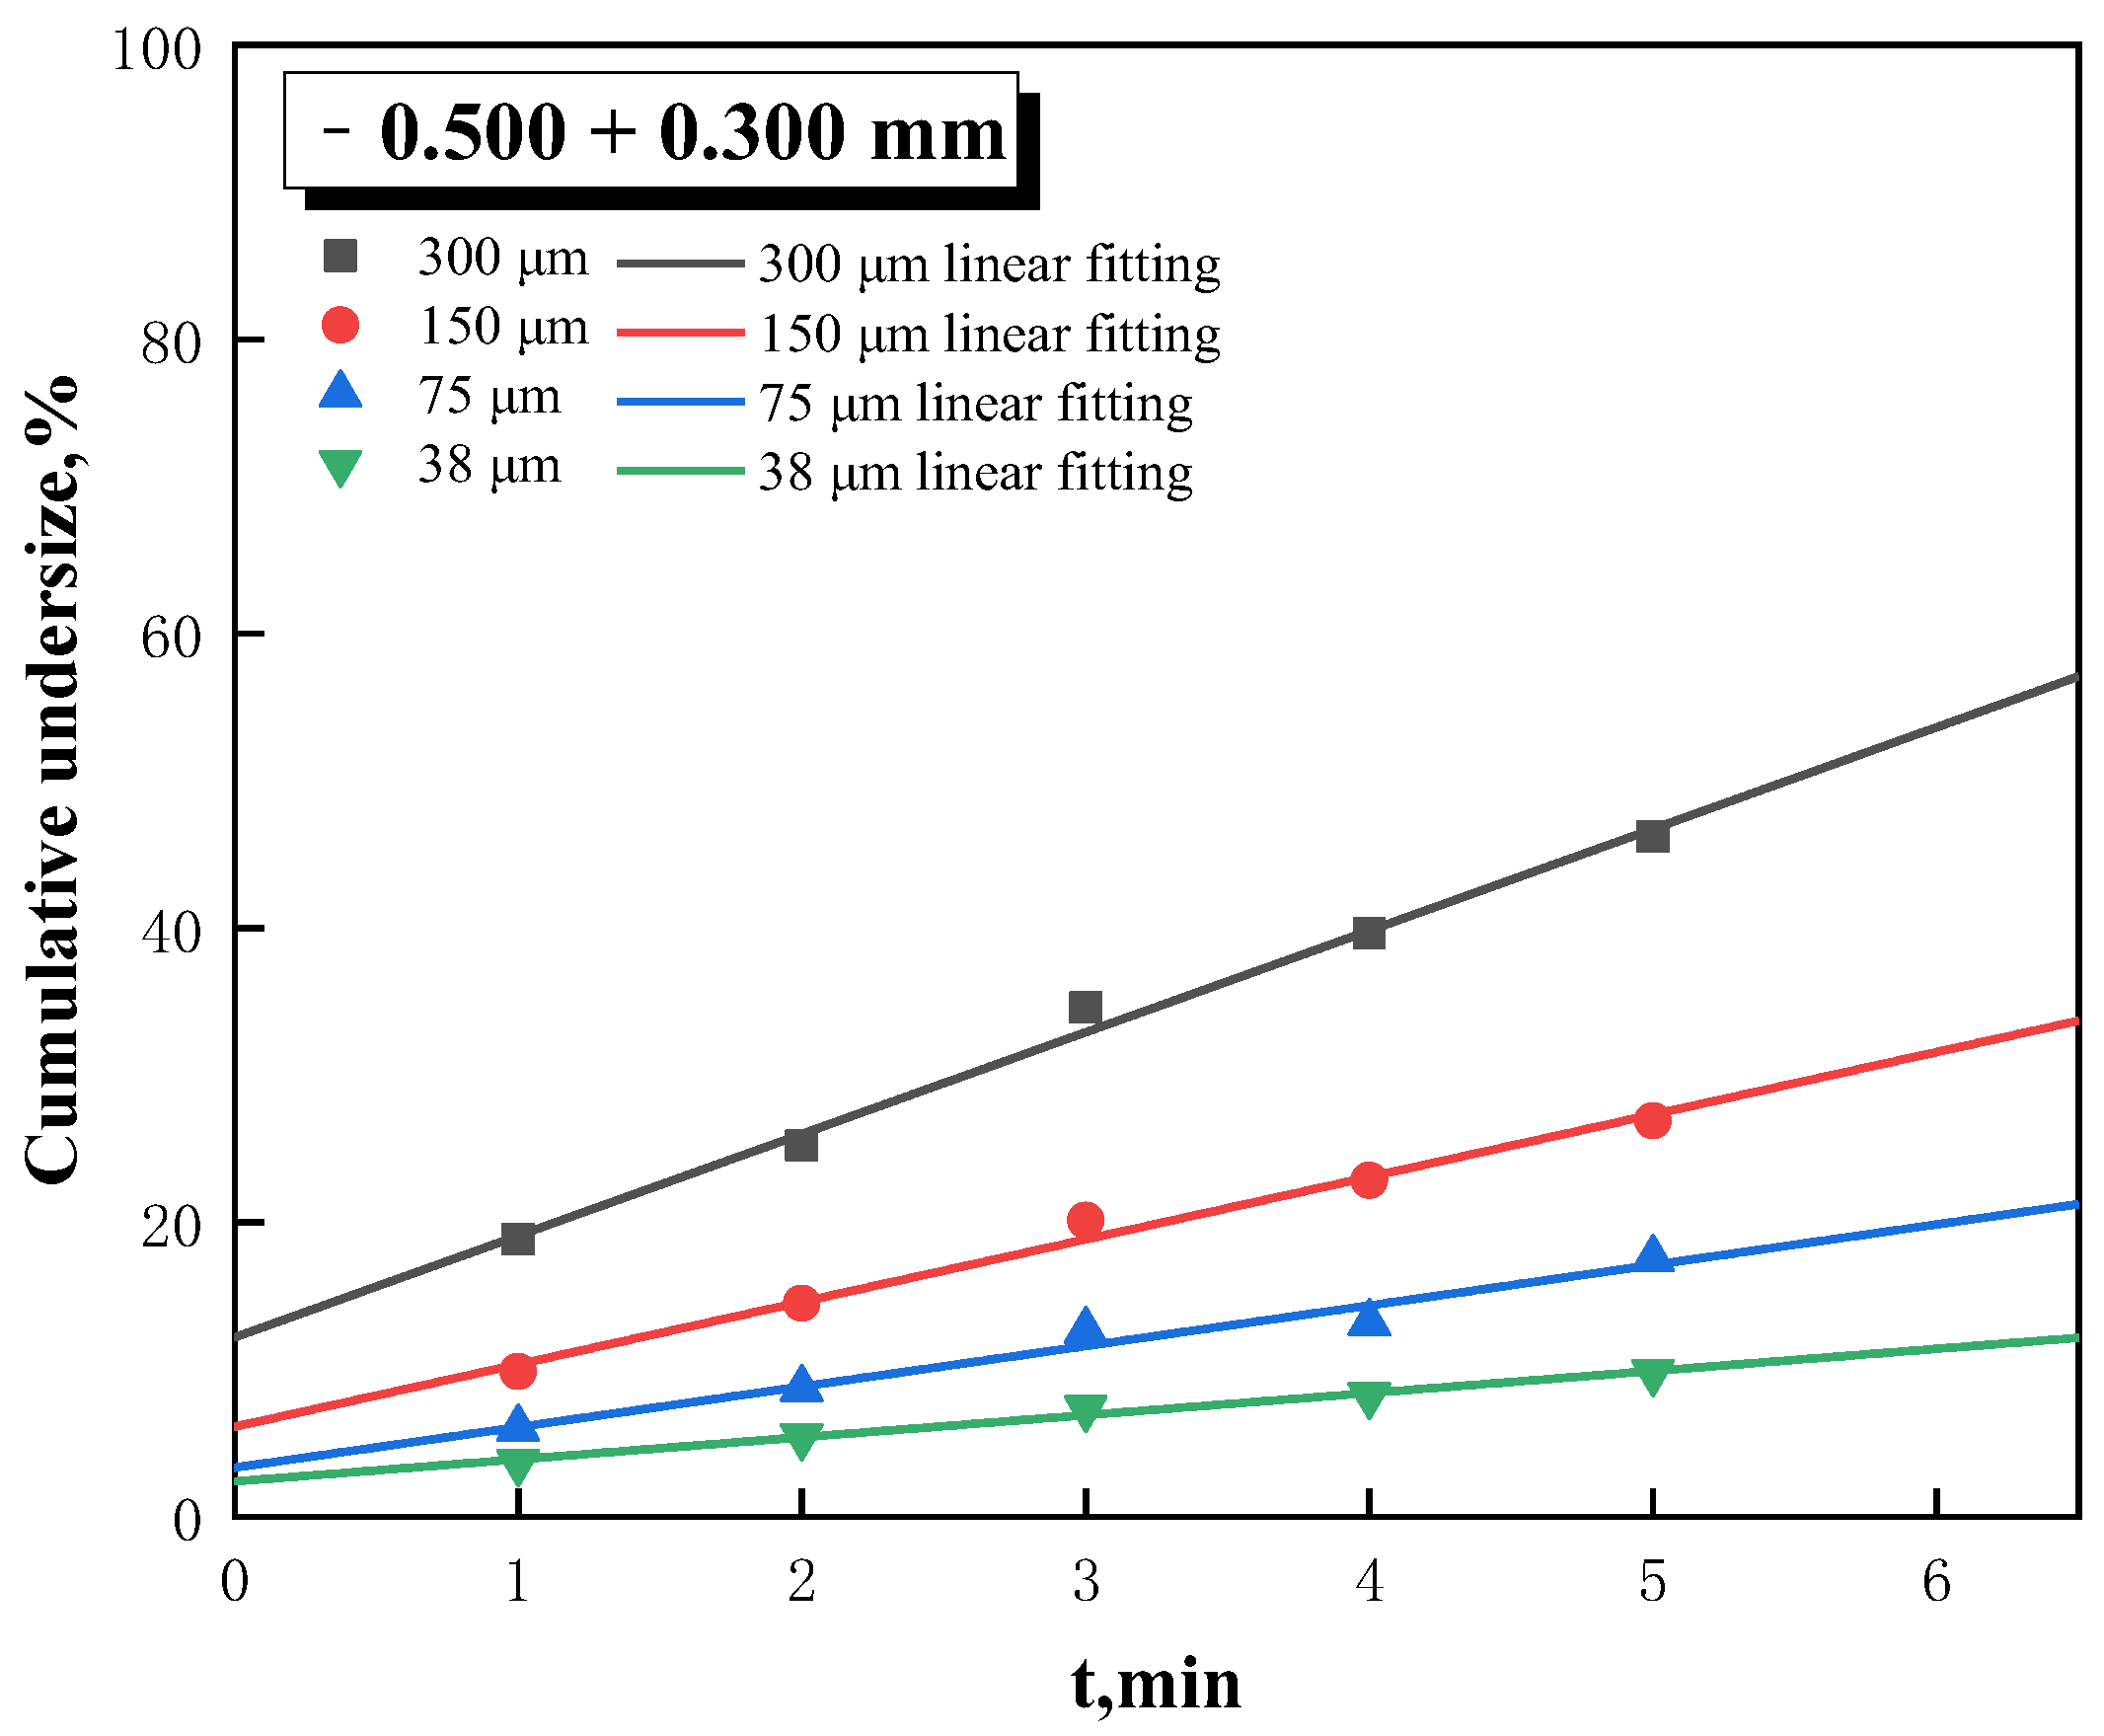
Figure 7.
Particle size characteristics of −0.300 + 0.150 mm after being ground for 3 min at different mass concentrations.
Figure 7.
Particle size characteristics of −0.300 + 0.150 mm after being ground for 3 min at different mass concentrations.

Figure 8.
Breakage rate of −0.300 + 0.150 mm at different mass concentrations.
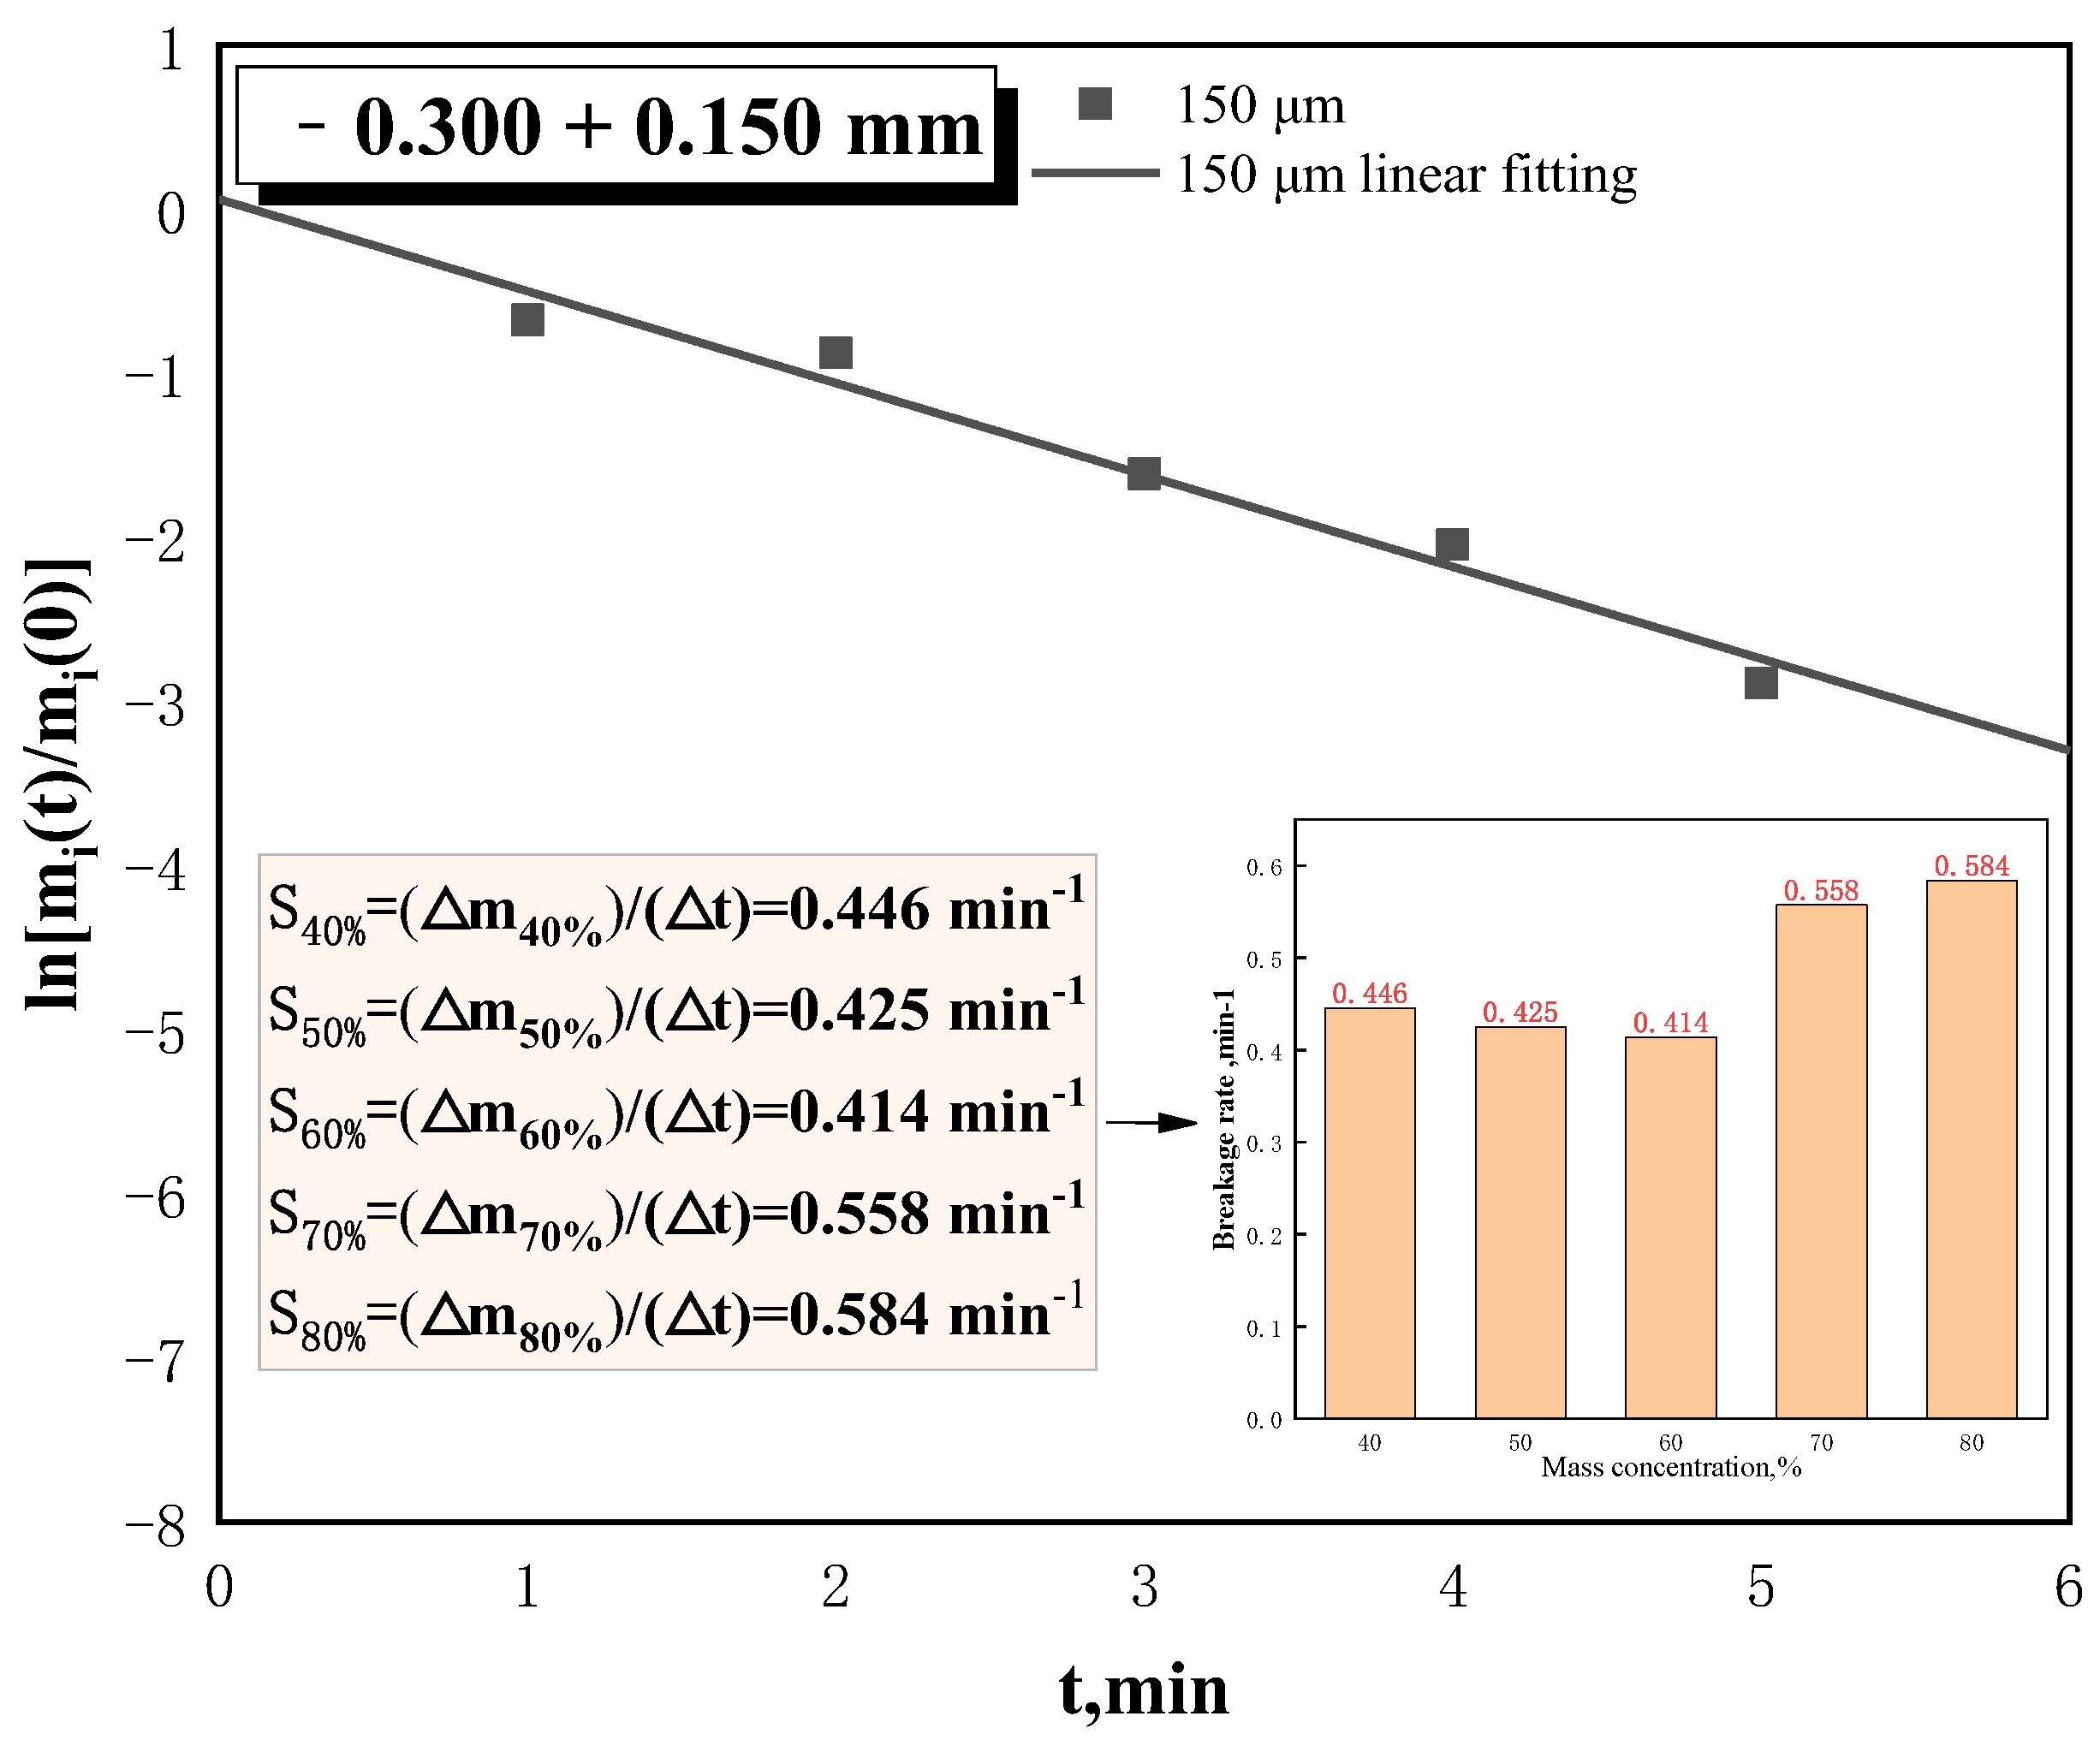
Figure 9.
Cumulative breakage distribution function of −0.300 + 0.150 mm at 70% mass concentration.
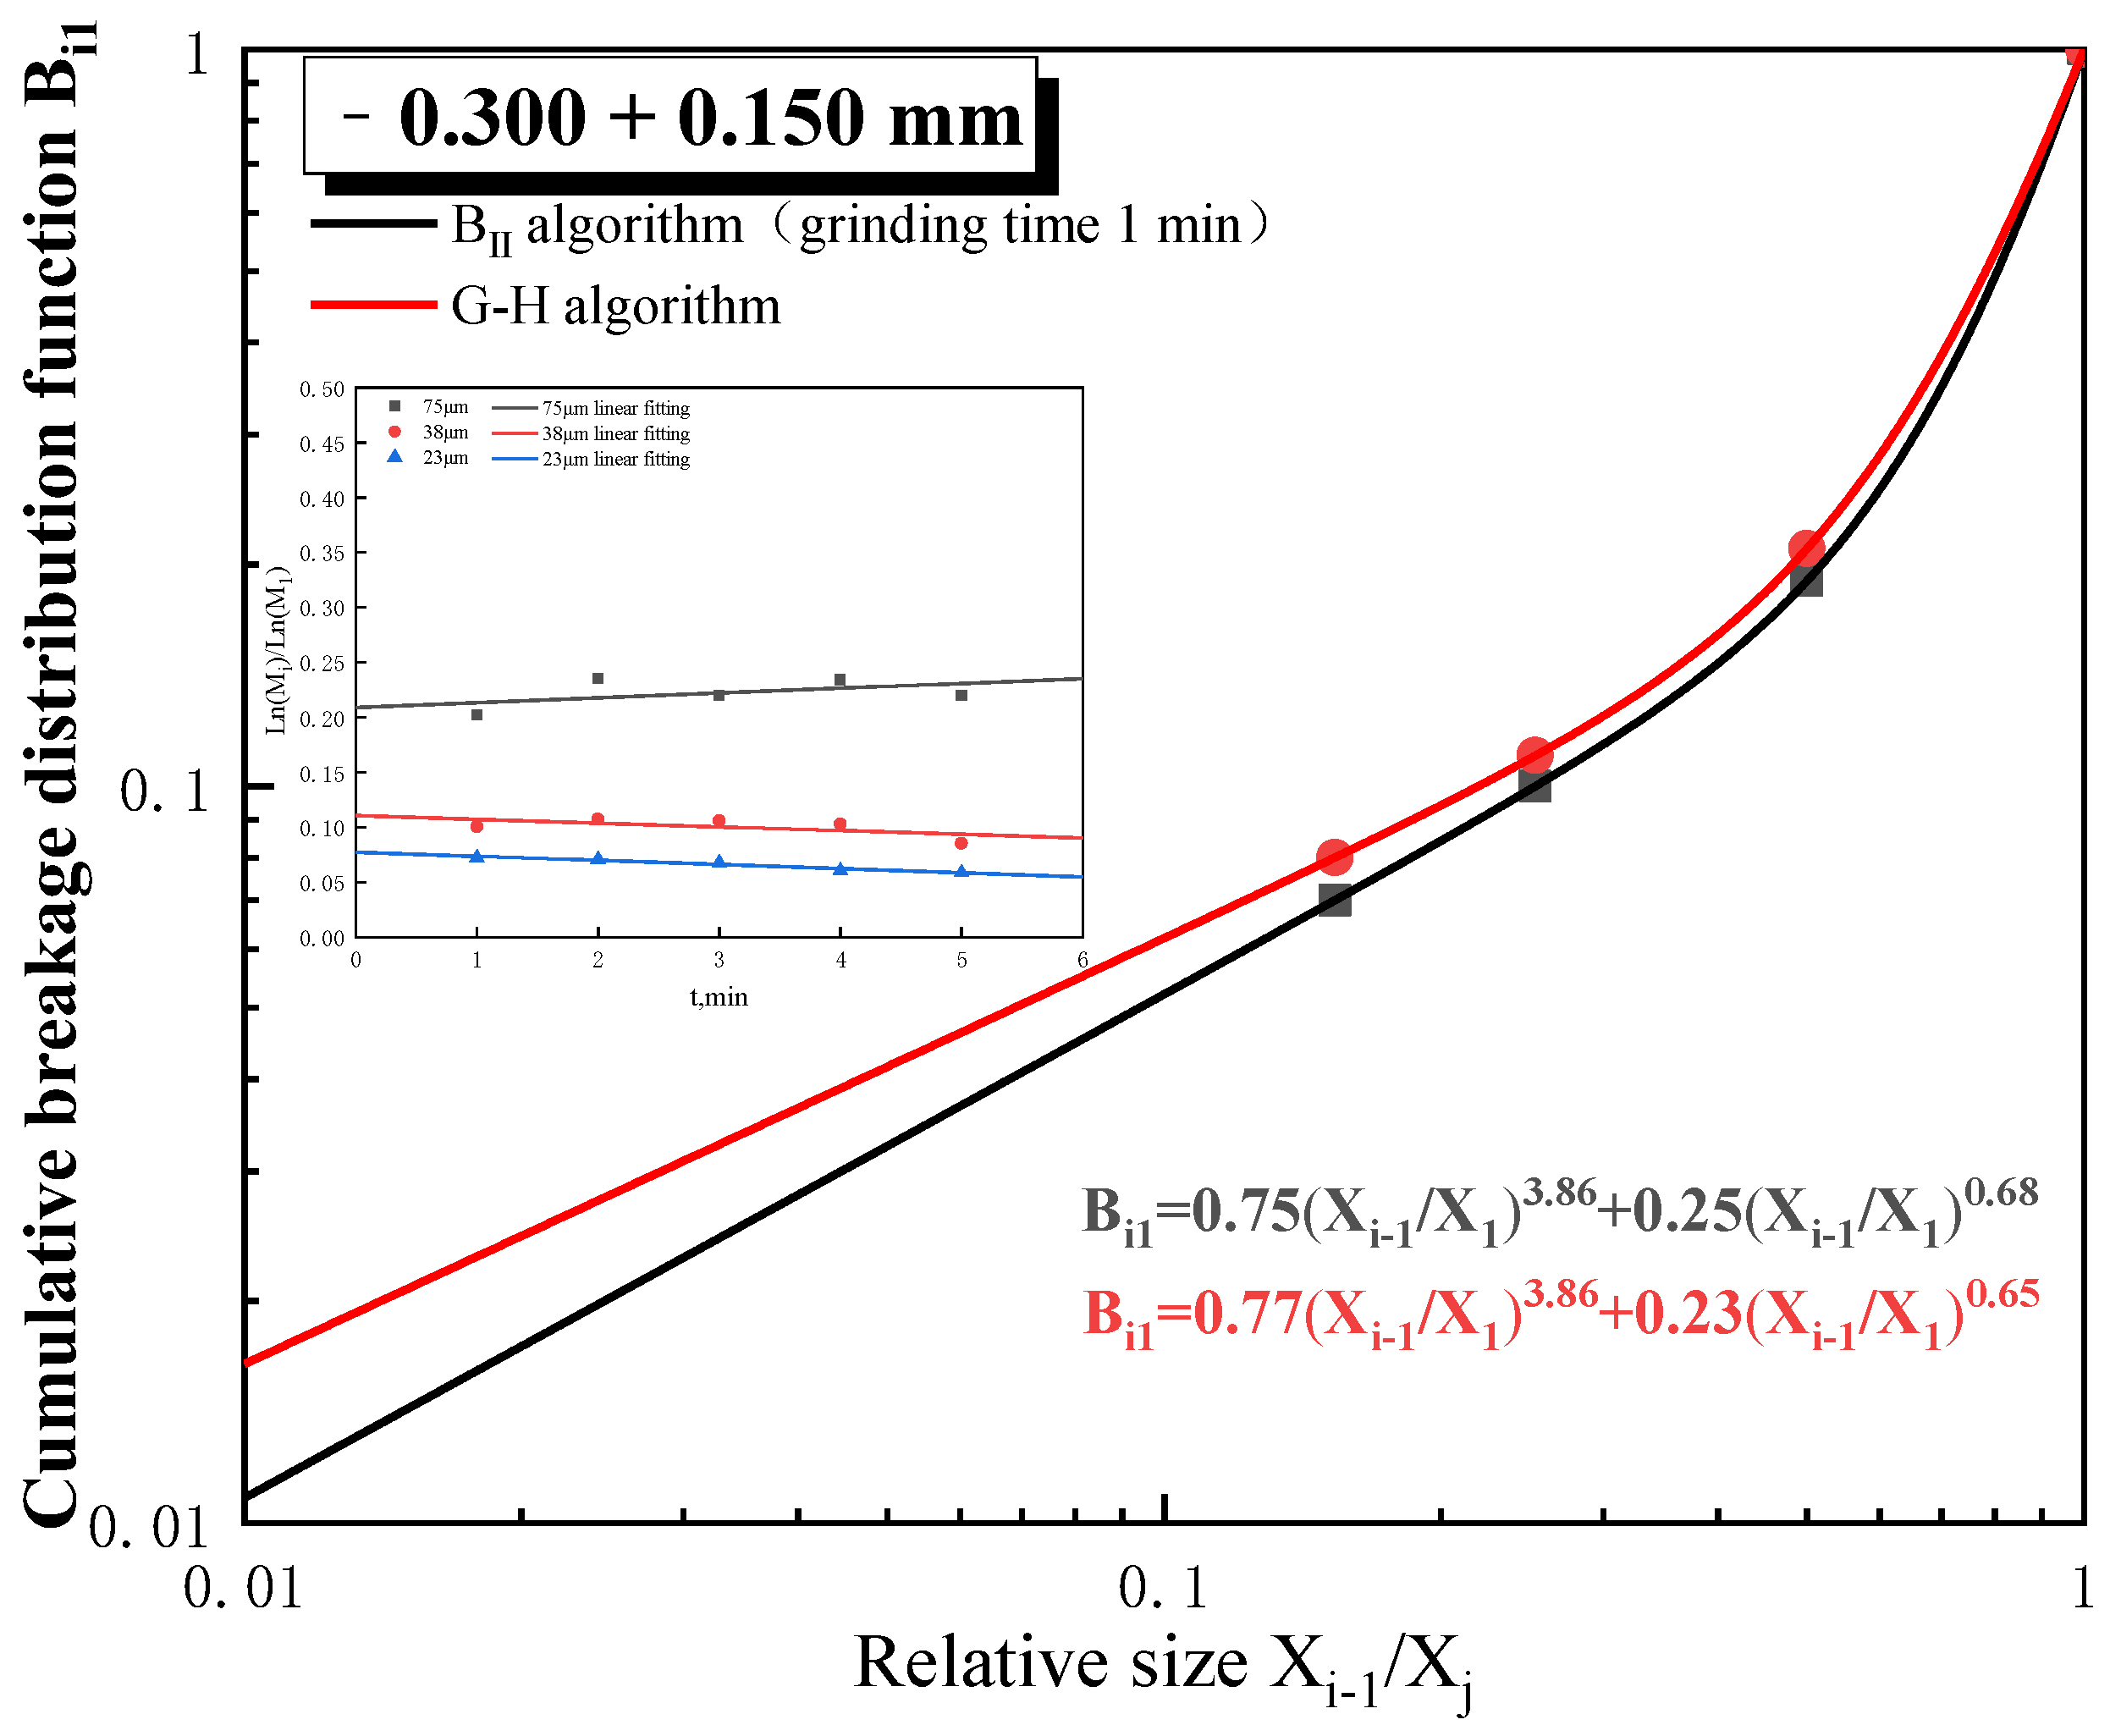
Figure 10.
Zero-order output characteristics of −0.300 + 0.150 mm at 70% mass concentration.
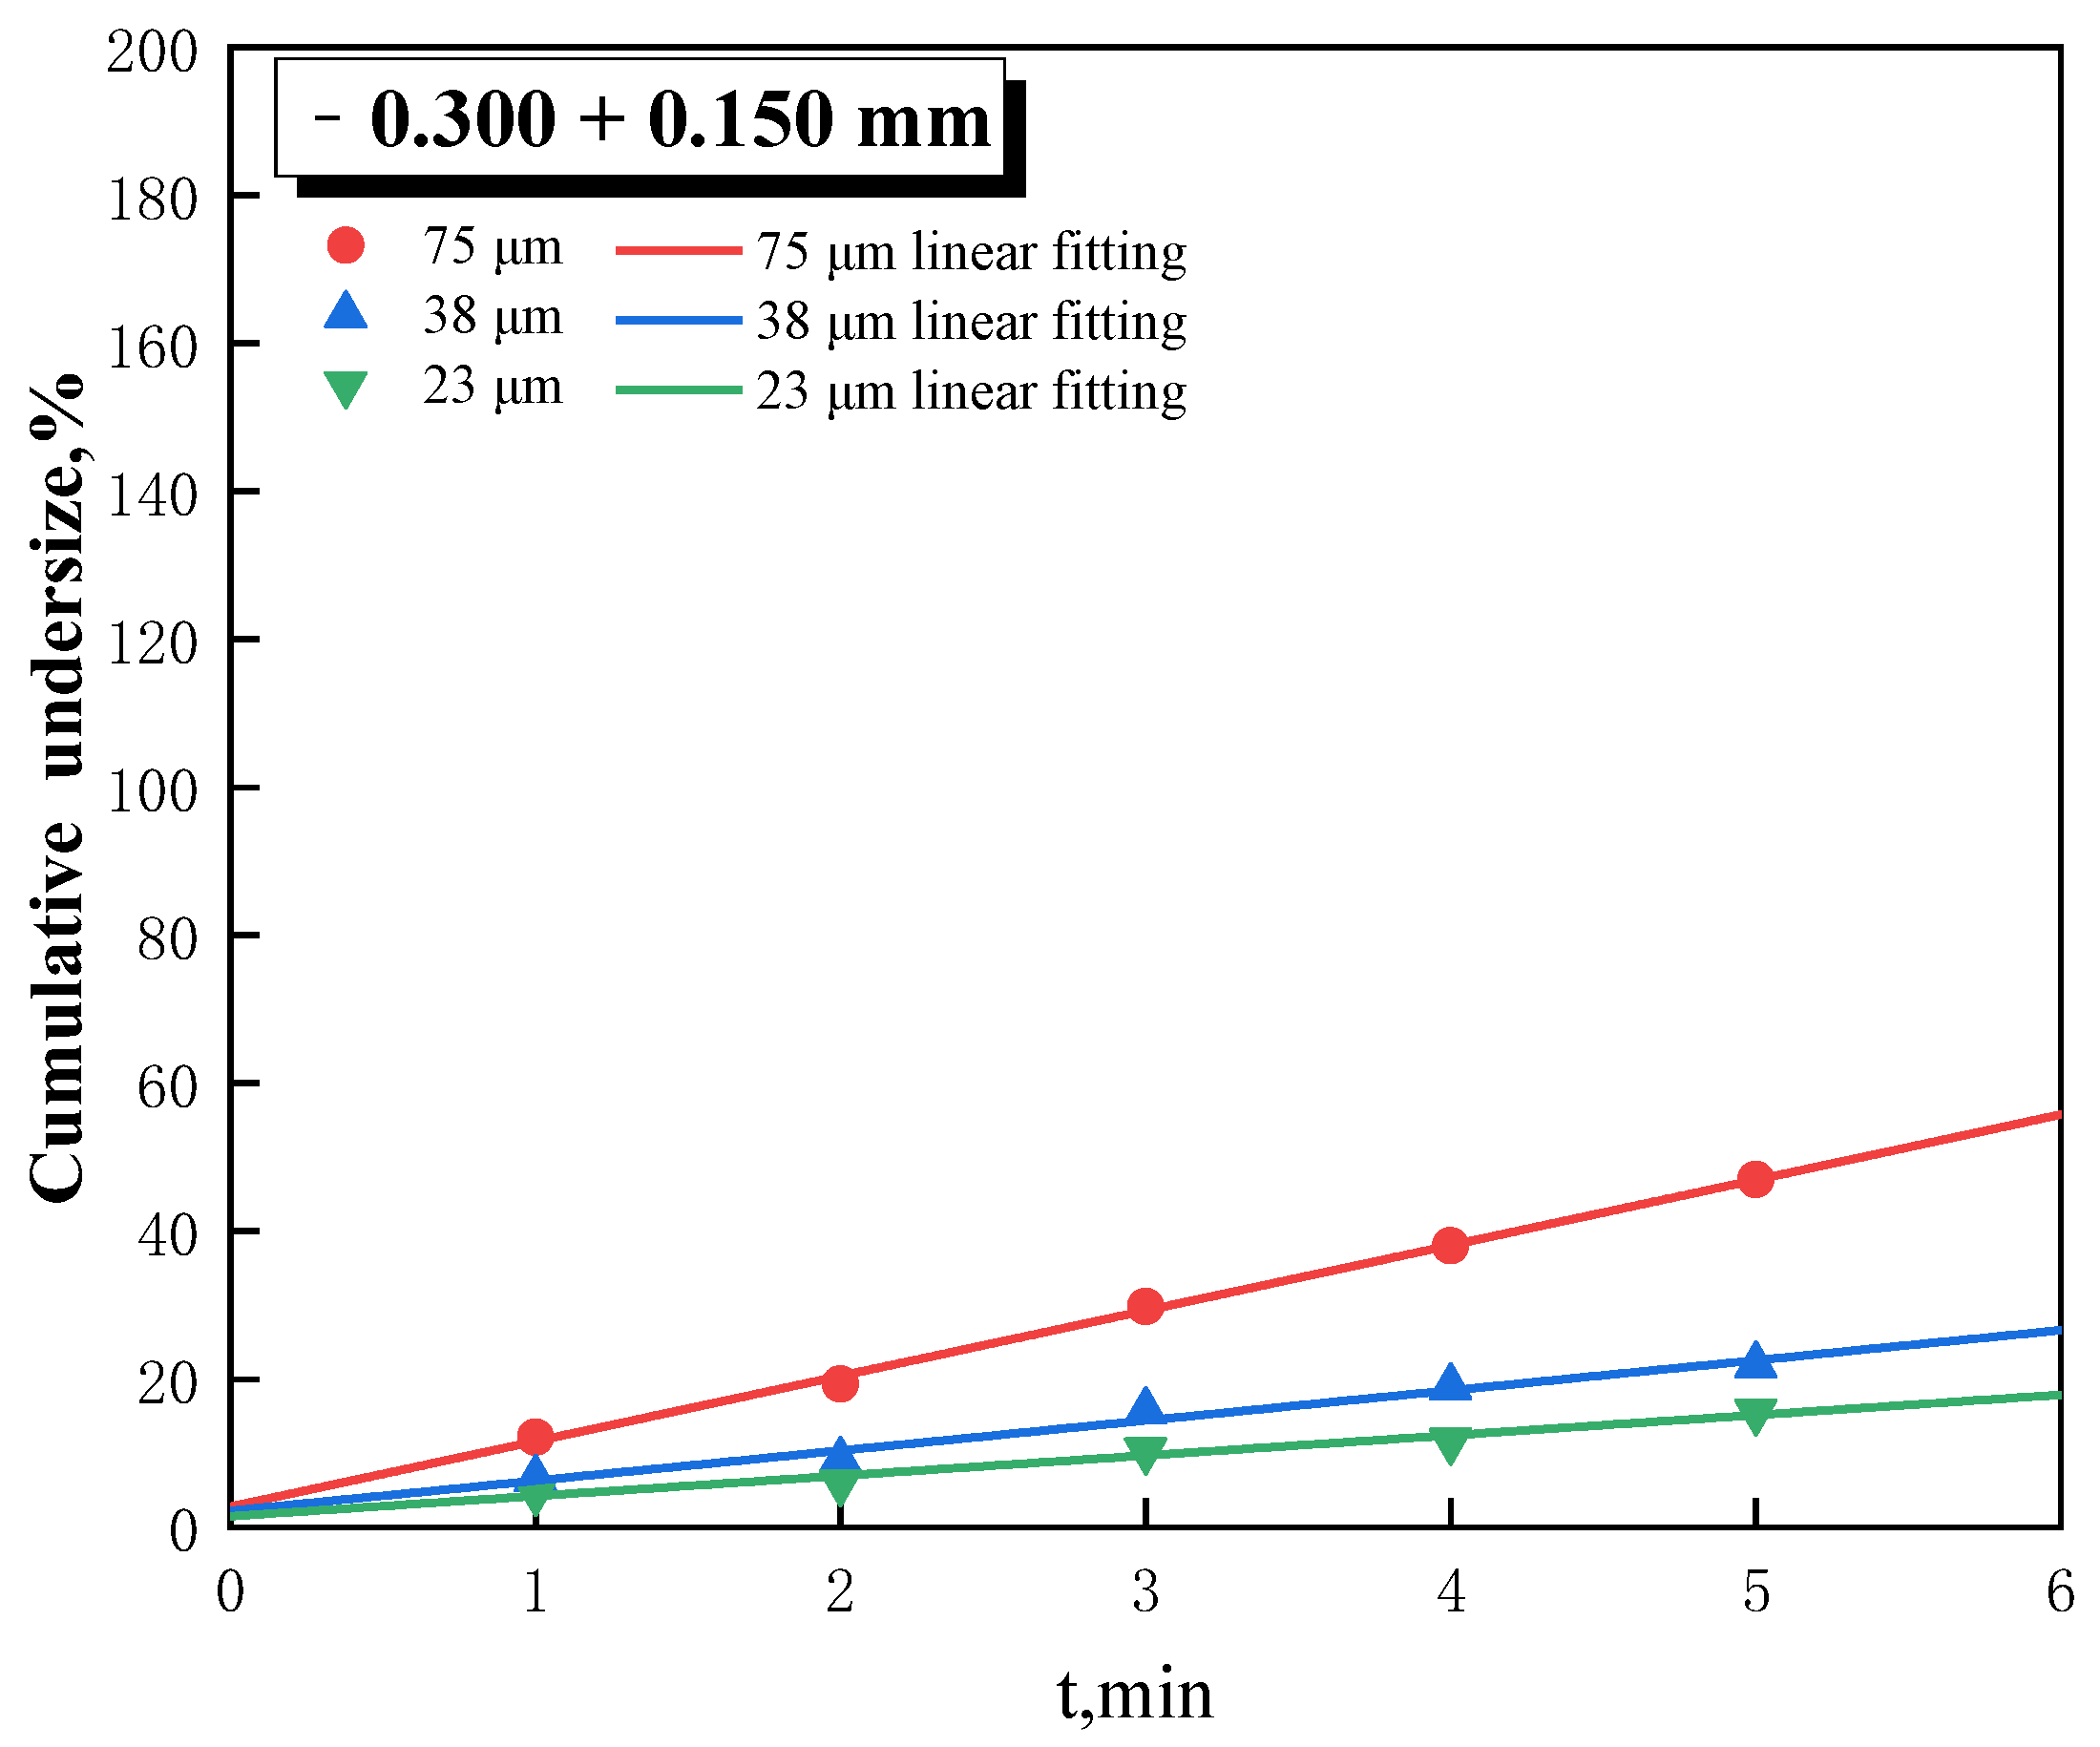
Figure 11.
Particle size characteristics of −0.150 + 0.075 mm after being ground for 3 min at different mass concentrations.
Figure 11.
Particle size characteristics of −0.150 + 0.075 mm after being ground for 3 min at different mass concentrations.
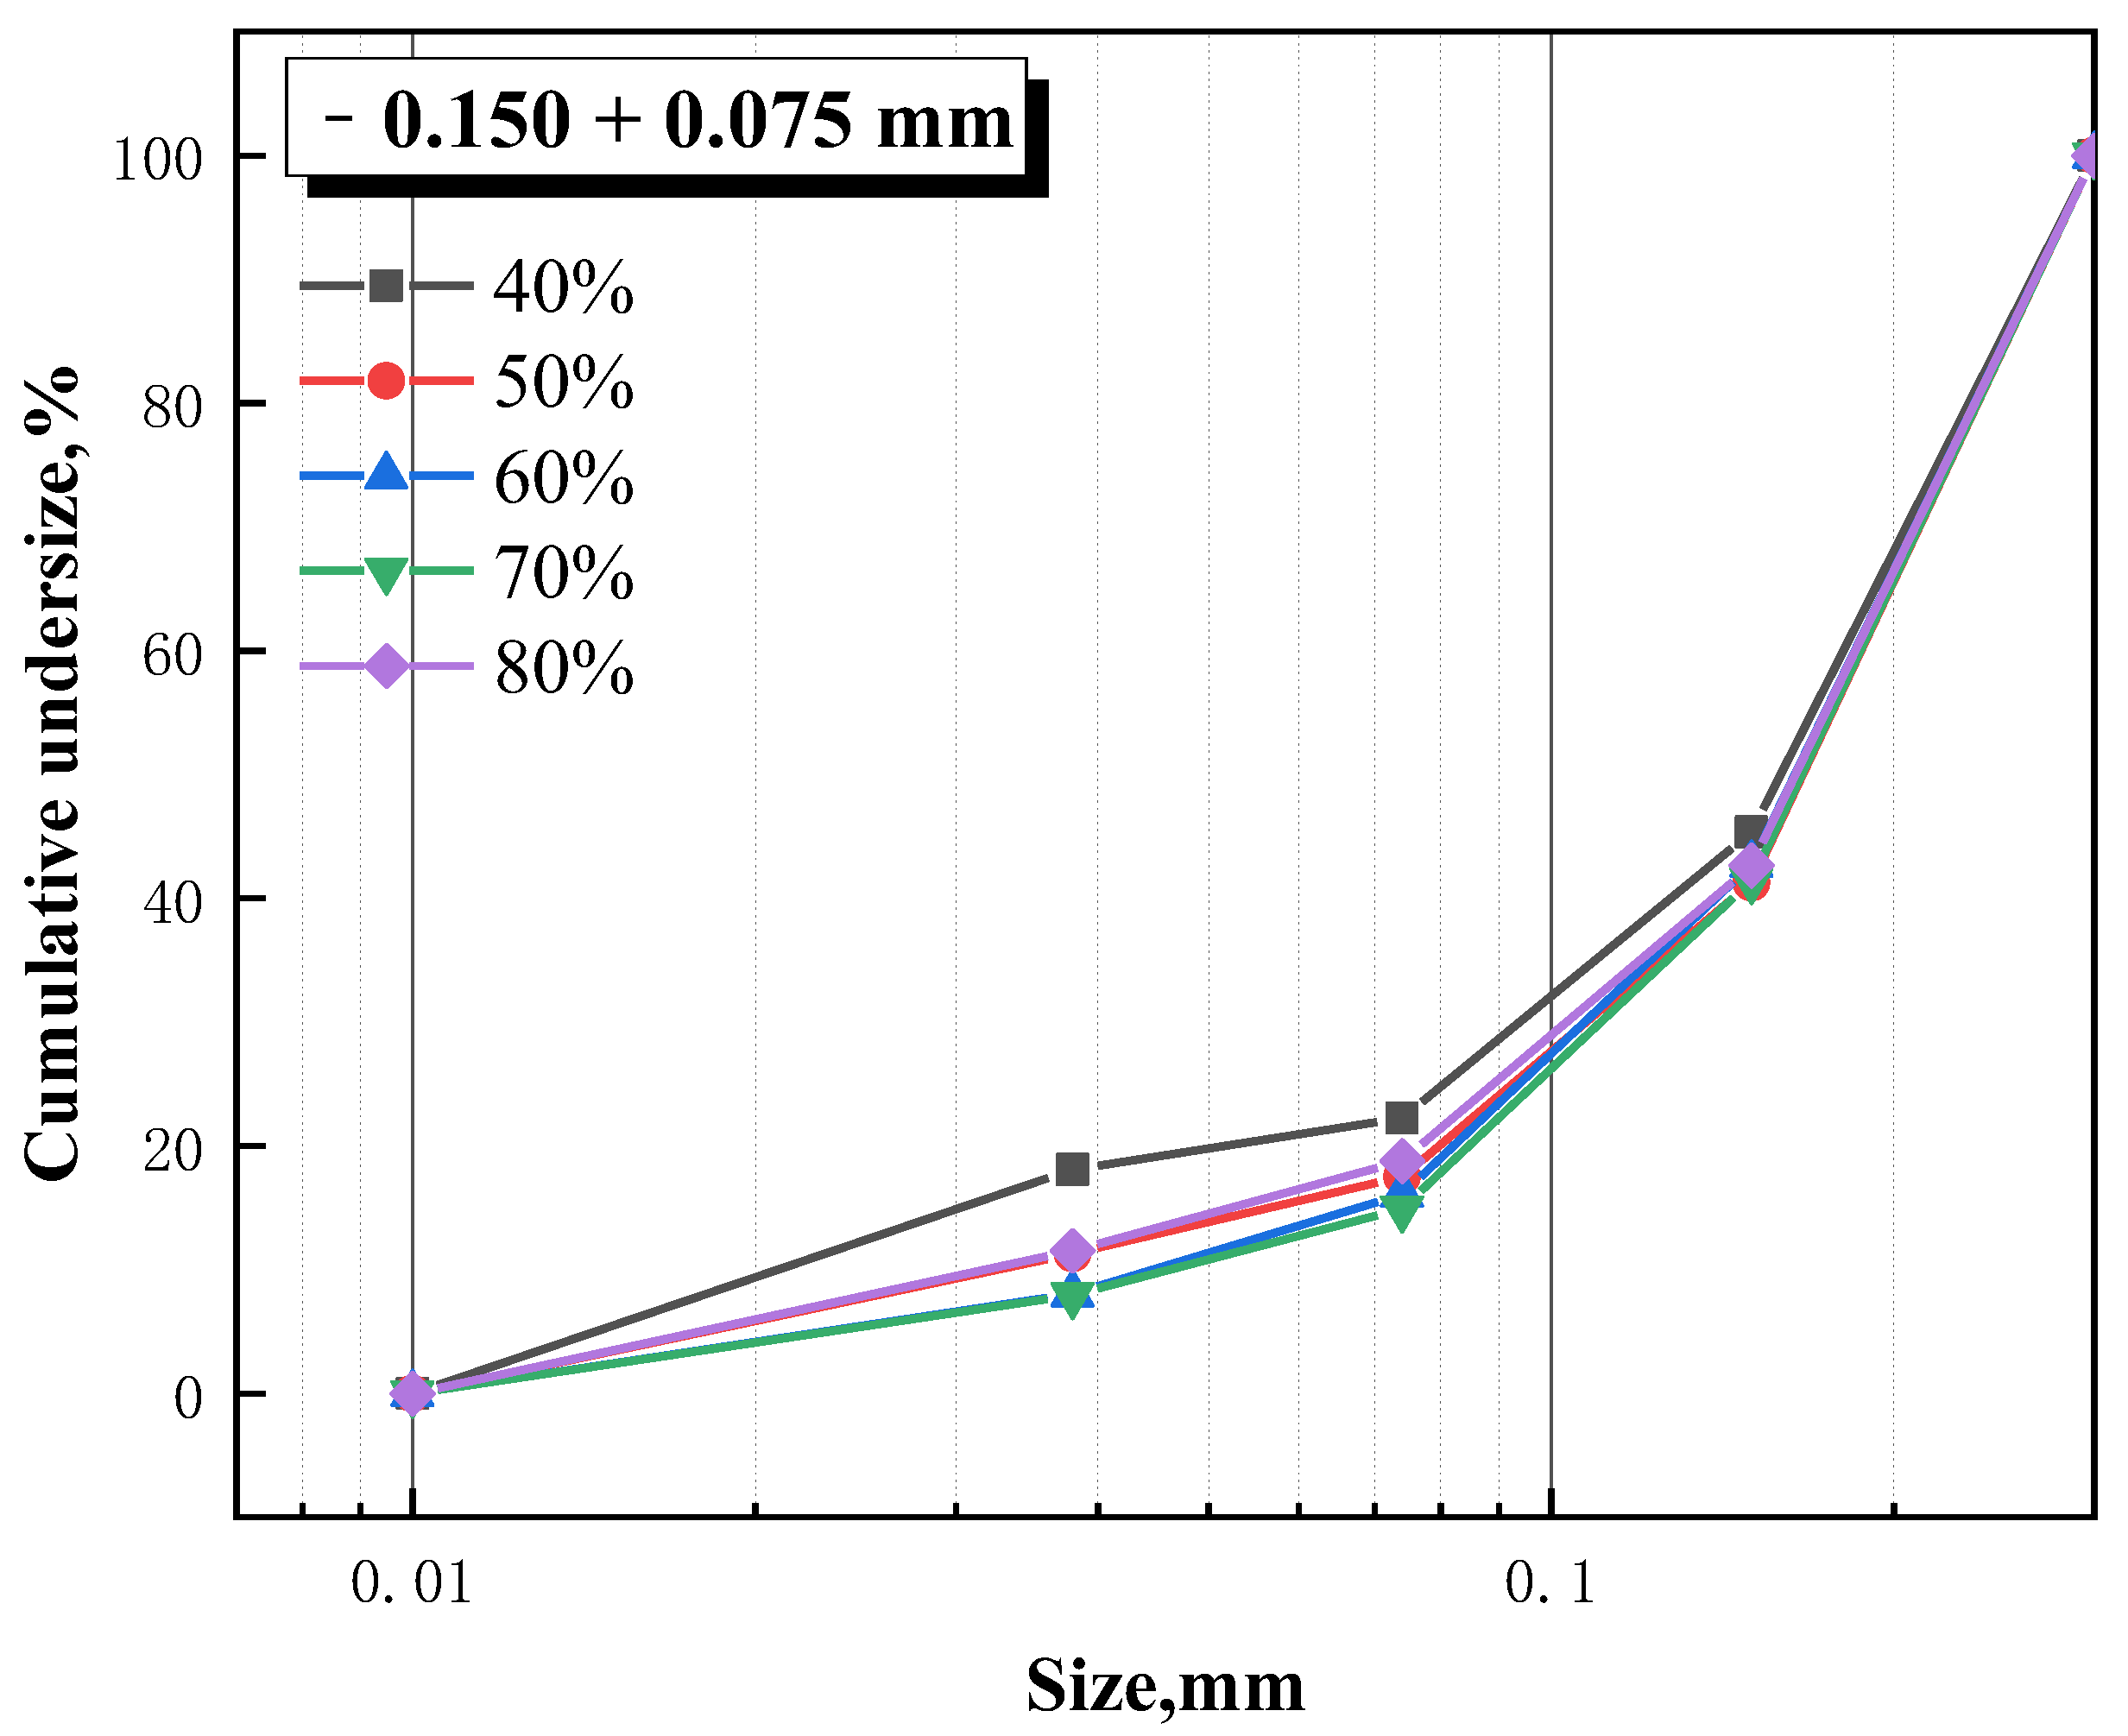
Figure 12.
Breakage rate of −0.1500 + 0.075 mm at different mass concentrations.
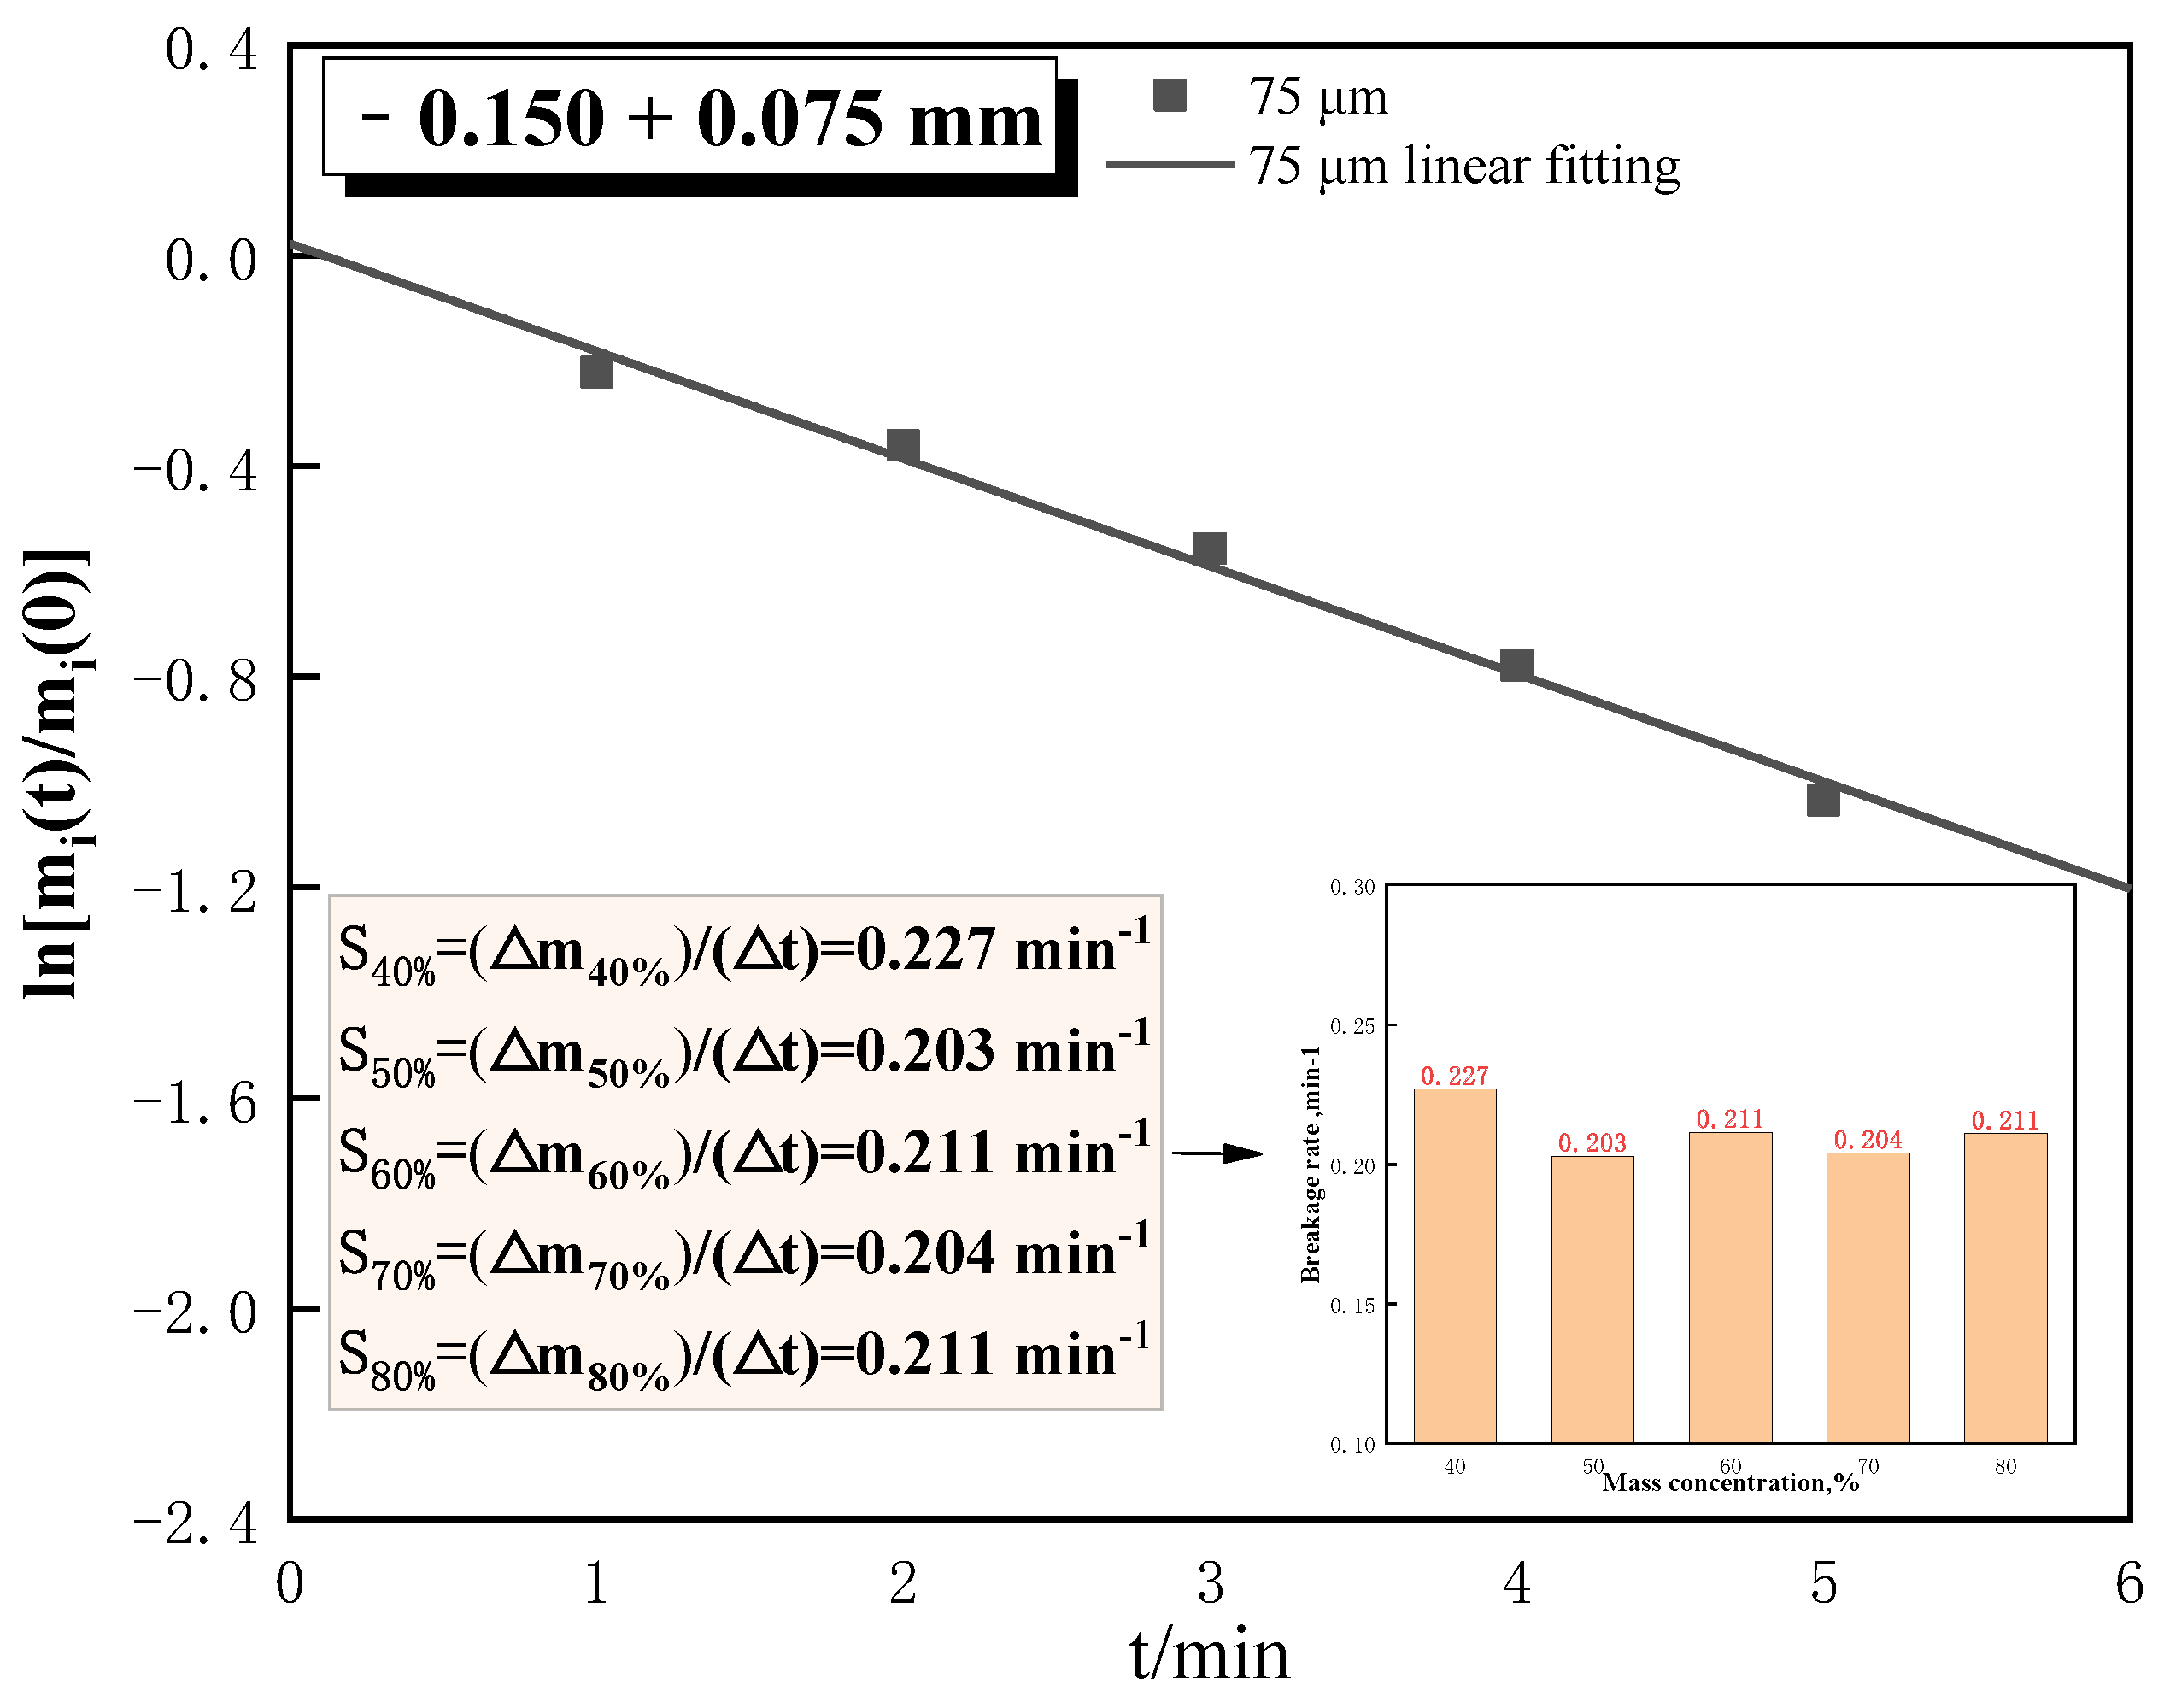
Figure 13.
Zero-order output characteristics of −0.1500 + 0.075 mm at 70% mass concentration.
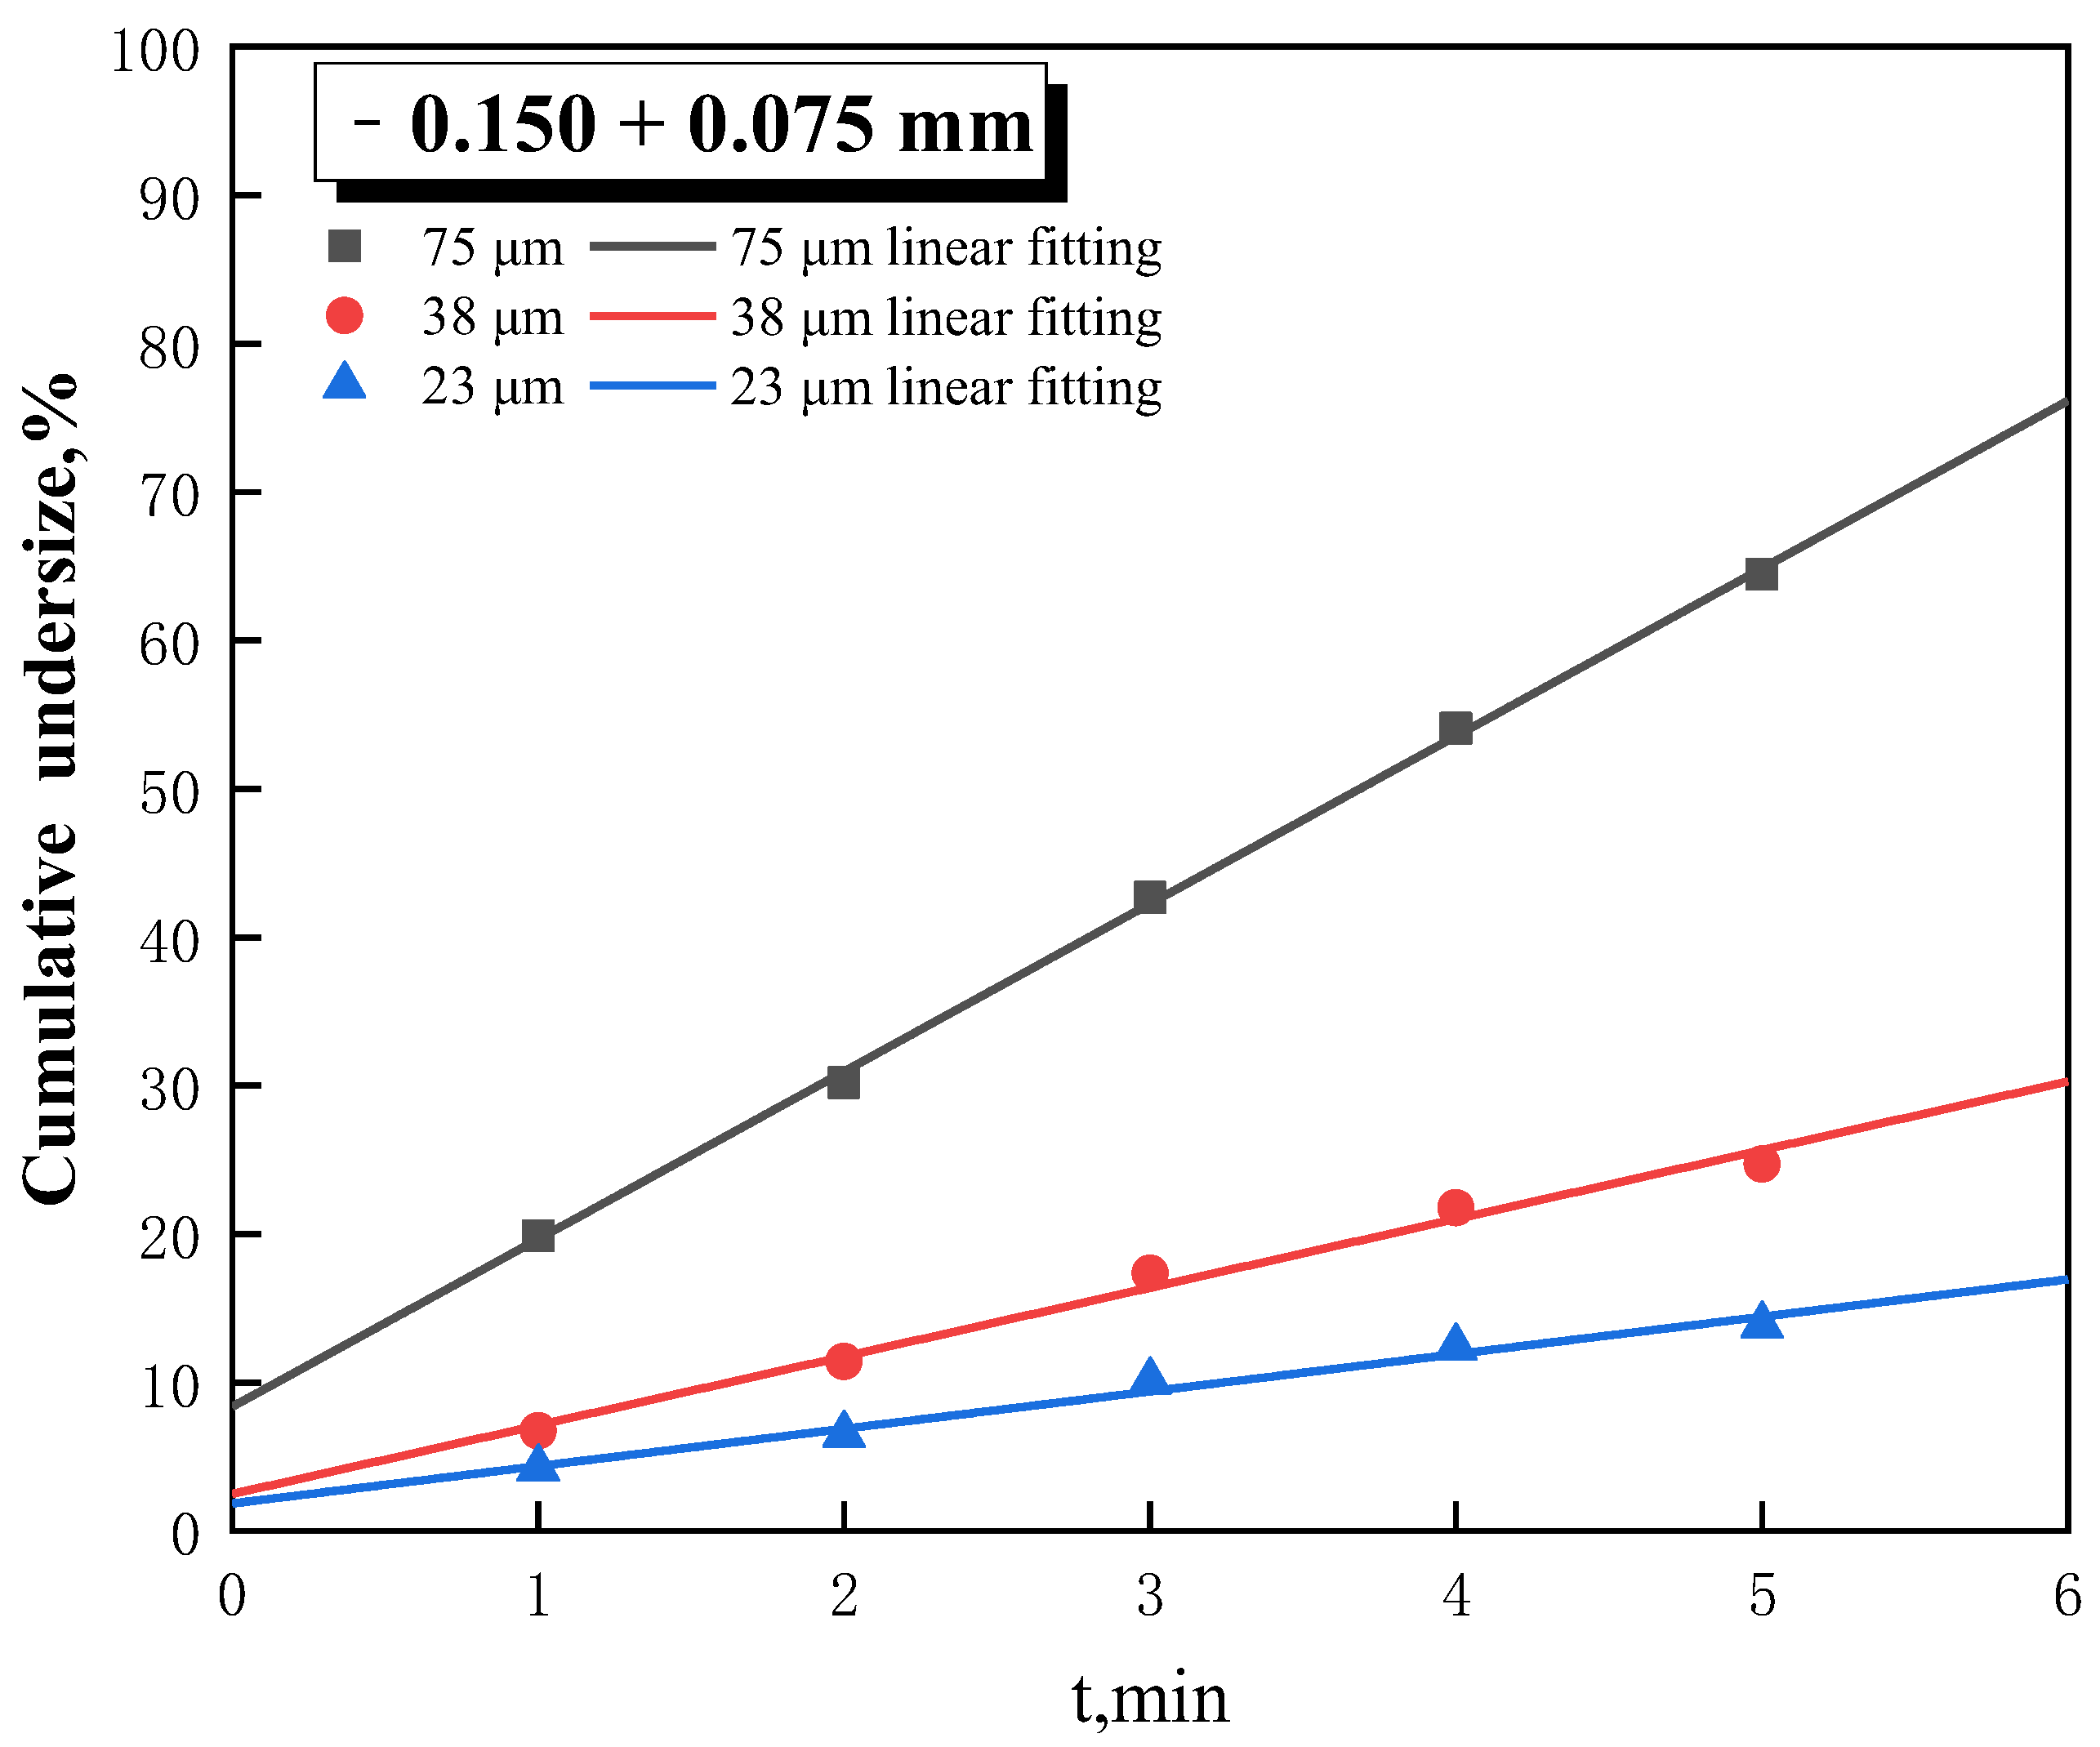
Figure 14.
Breakage rate function of different size classes.
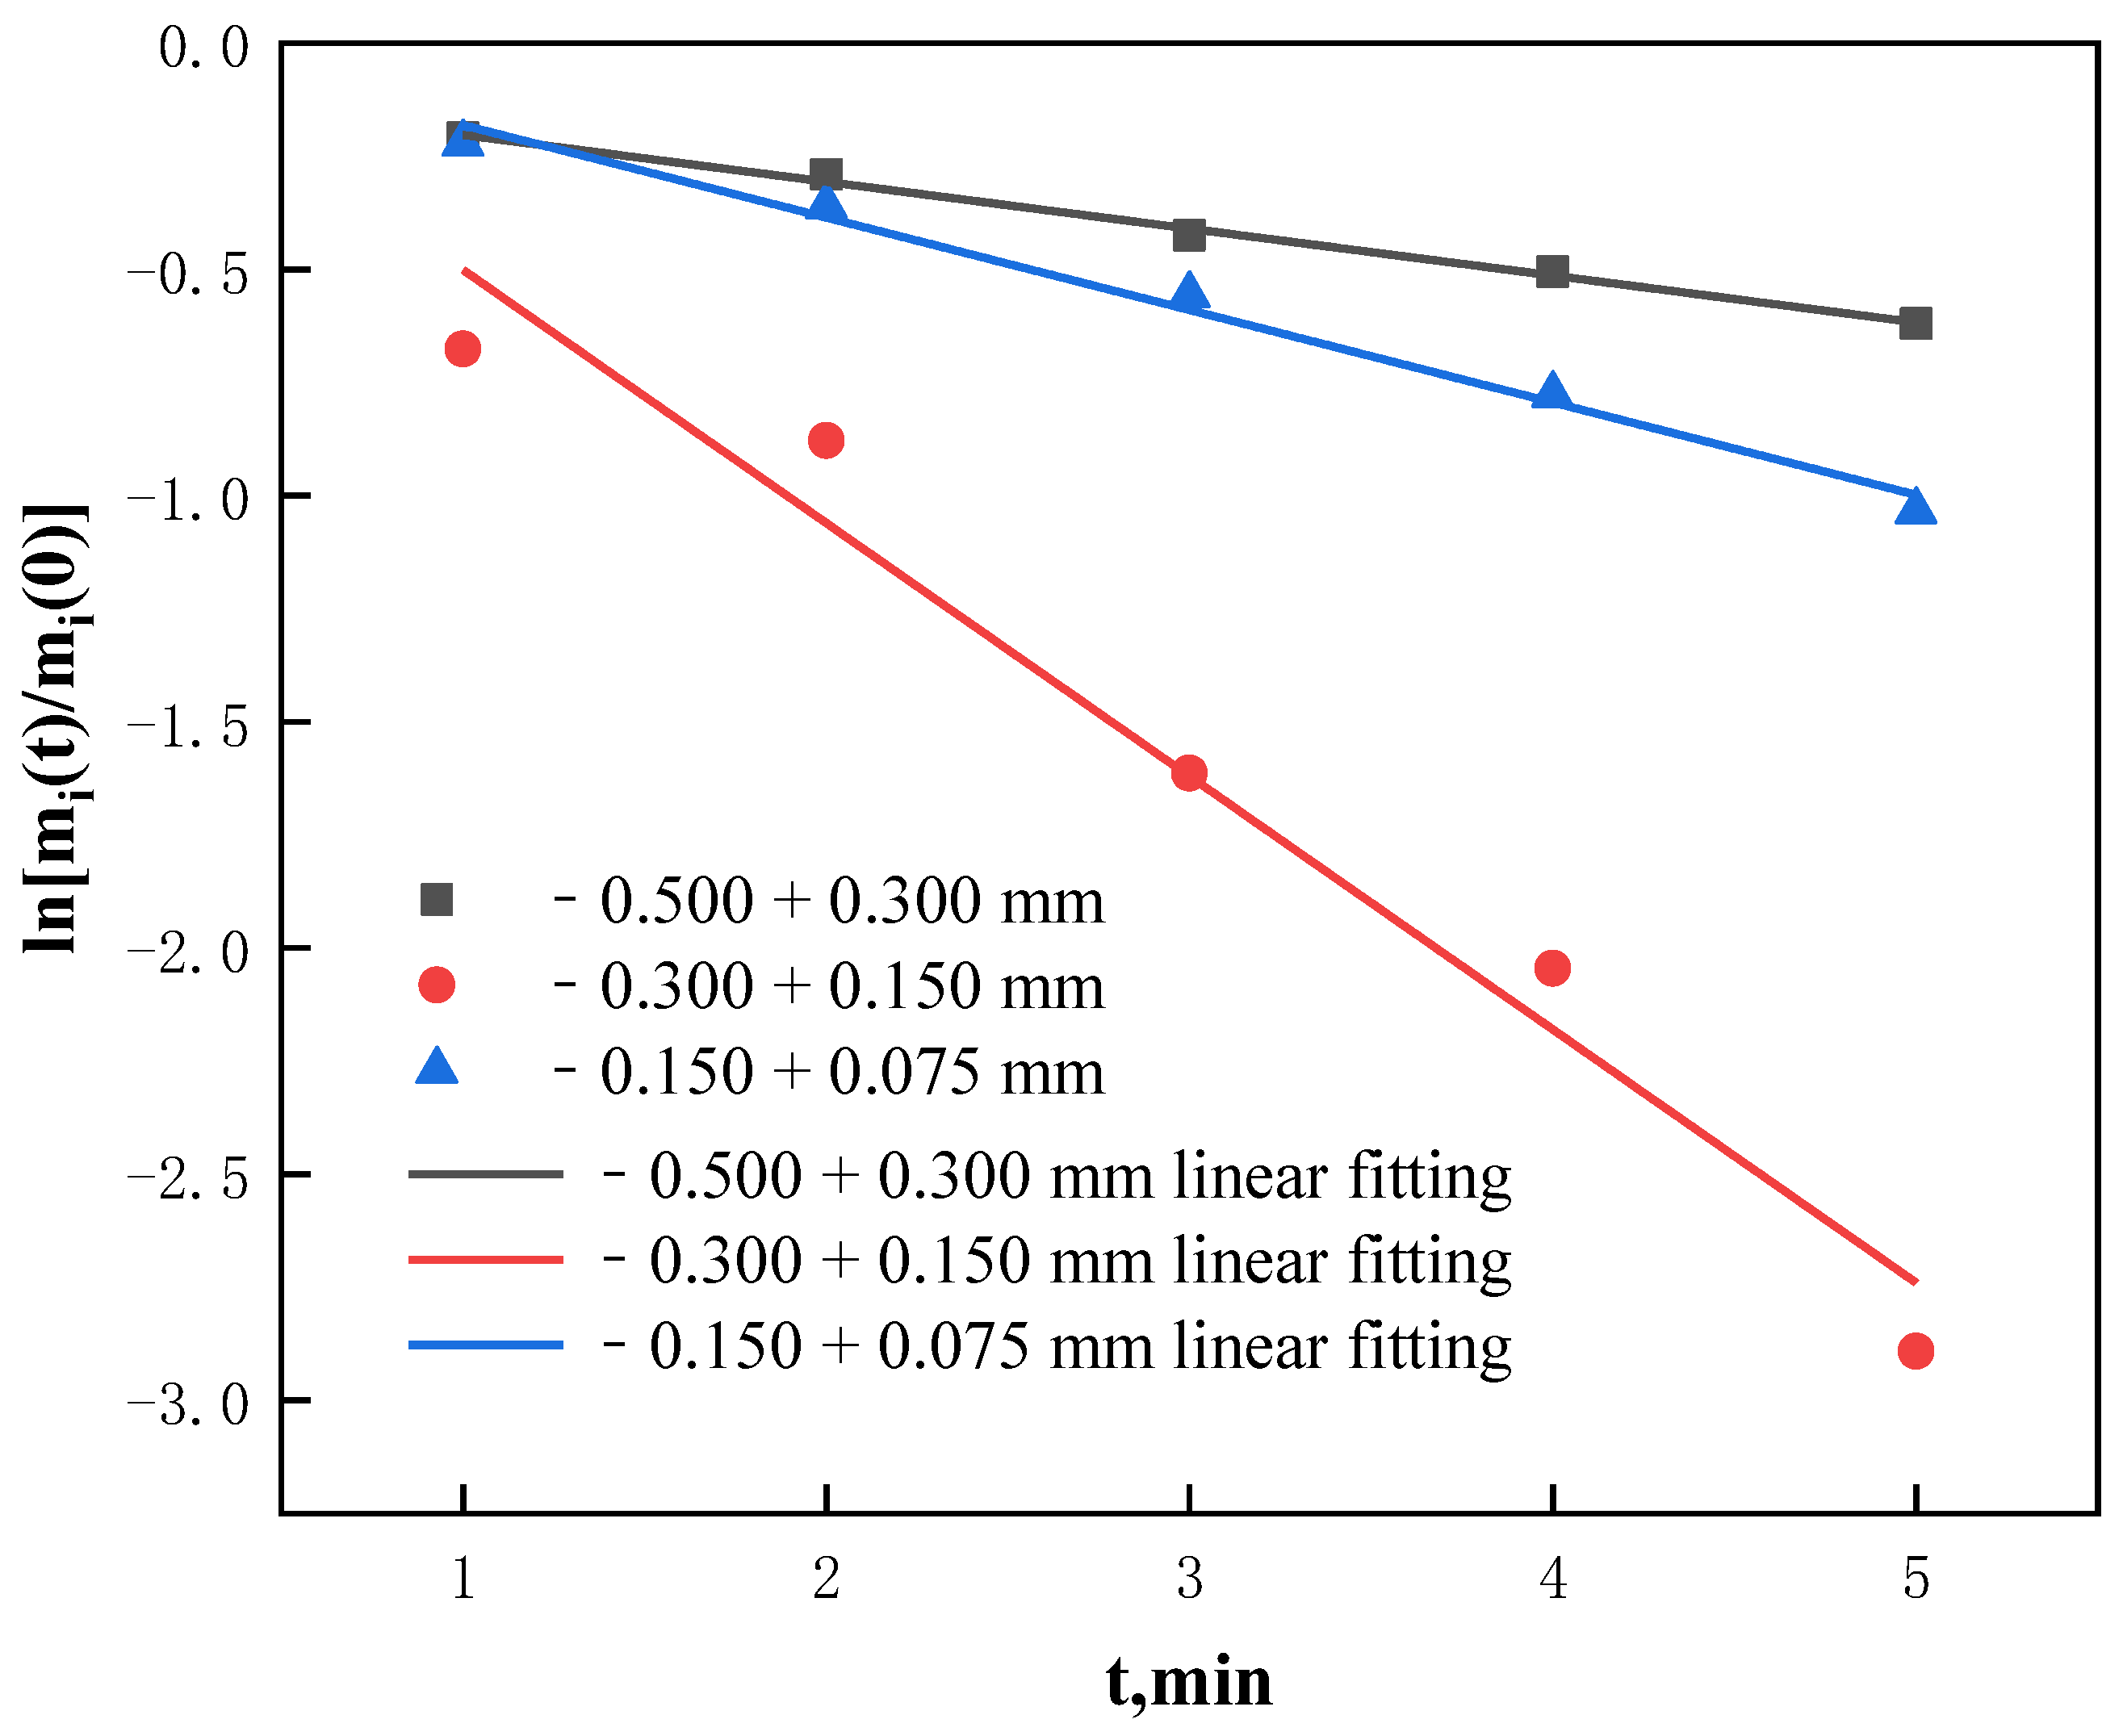
Figure 15.
Differences in breakage rates of different particle grades at different mass concentrations.
Figure 15.
Differences in breakage rates of different particle grades at different mass concentrations.
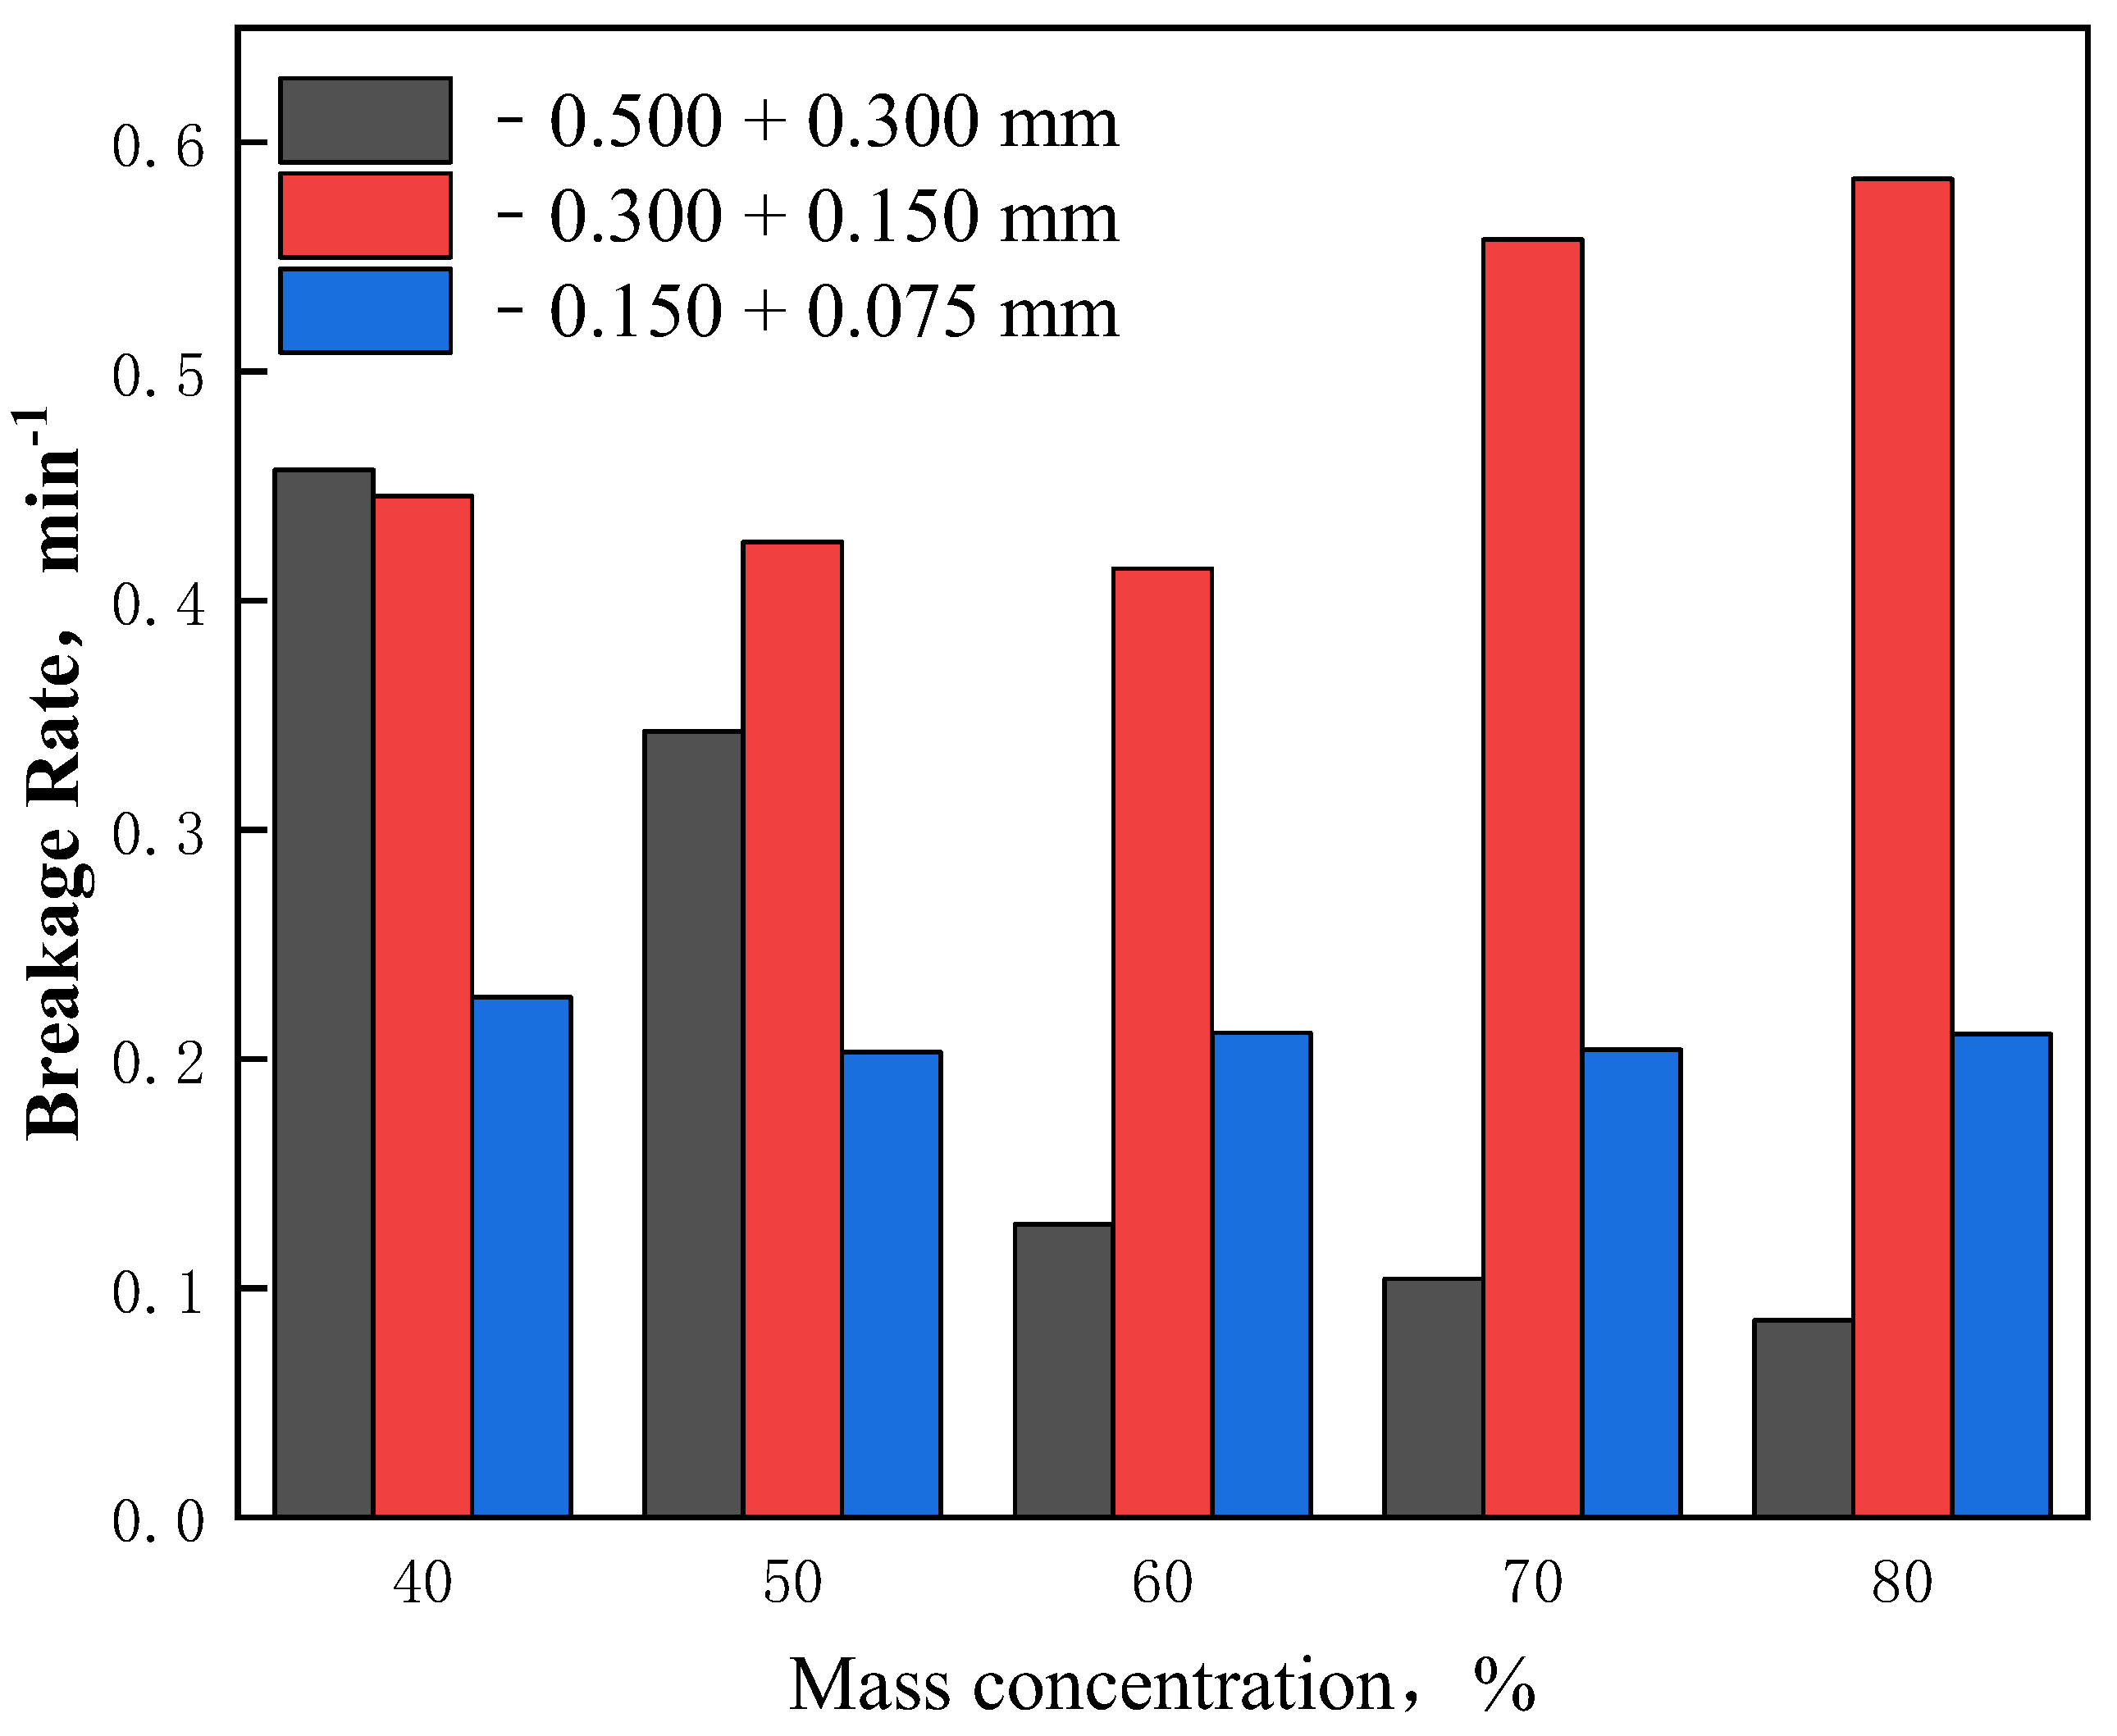
Figure 16.
Comparison of zero-order output characteristics of different size classes.

Table 1.
Particle size composition characteristics of the feed.
| Size Class/mm | Feed of the Secondary Ball Mill | |||
|---|---|---|---|---|
| Yield/% | Cumulative Undersize/% | Grade/% | Iron Content/% | |
| +0.500 | 6.19 | 100.00 | 31.31 | 3.47 |
| −0.500 + 0.300 | 6.59 | 93.81 | 40.65 | 4.80 |
| −0.300 + 0.150 | 23.23 | 87.22 | 50.65 | 21.09 |
| −0.150 + 0.075 | 29.46 | 63.99 | 60.44 | 31.92 |
| −0.075 + 0.038 | 17.85 | 34.53 | 60.99 | 19.51 |
| −0.038 + 0.023 | 7.44 | 16.68 | 64.75 | 8.64 |
| −0.023 + 0.019 | 7.49 | 9.24 | 63.82 | 8.57 |
| −0.019 + 0.010 | 0.42 | 1.75 | 63.42 | 0.48 |
| −0.010 | 1.33 | 1.33 | 63.28 | 1.51 |
| Sum/% | 100.00 | - | 55.78 | 100.00 |
Table 2.
The comparison of the media of grinding.
| Category | Steel Ball | Ceramic Ball |
|---|---|---|
| Elements | Fe, Cr, C | Al, Si |
| Trace elements | Si, Mn, P, Mo, Al | Ca, Mg |
| True density/ | 7.3~7.8 | 3.7 |
| Bulk density/ | 4.85 | 2.3 |
| Mohs hardness | 6.8 | 9.0 |
| Self-wear/ | 60 | 5 |
Table 3.
The parameters of the cumulative breakage distribution function for different size classes.
Table 3.
The parameters of the cumulative breakage distribution function for different size classes.
| Size Classes/mm | φ | γ | β |
|---|---|---|---|
| −0.500 + 0.300 | 0.26 | 0.38 | 1.12 |
| −0.300 + 0.150 | 0.23 | 0.65 | 3.86 |
| △ | +0.03 | −0.27 | −2.74 |
Publisher’s Note: MDPI stays neutral with regard to jurisdictional claims in published maps and institutional affiliations. |
© 2022 by the authors. Licensee MDPI, Basel, Switzerland. This article is an open access article distributed under the terms and conditions of the Creative Commons Attribution (CC BY) license (https://creativecommons.org/licenses/by/4.0/).
Share and Cite
MDPI and ACS Style
Yuan, C.; Wu, C.; Fang, X.; Liao, N.; Tong, J.; Yu, C. Effect of Slurry Concentration on the Ceramic Ball Grinding Characteristics of Magnetite. Minerals 2022, 12, 1569. https://doi.org/10.3390/min12121569
AMA Style
Yuan C, Wu C, Fang X, Liao N, Tong J, Yu C. Effect of Slurry Concentration on the Ceramic Ball Grinding Characteristics of Magnetite. Minerals. 2022; 12(12):1569. https://doi.org/10.3390/min12121569
Chicago/Turabian StyleYuan, Chengfang, Caibin Wu, Xin Fang, Ningning Liao, Jiaqi Tong, and Chao Yu. 2022. "Effect of Slurry Concentration on the Ceramic Ball Grinding Characteristics of Magnetite" Minerals 12, no. 12: 1569. https://doi.org/10.3390/min12121569
Note that from the first issue of 2016, this journal uses article numbers instead of page numbers. See further details here.